Introduction
Congenital heart defects (CHD) are abnormalities in heart structure and/or adjoining vessels that occur during fetal development and are present at birth. CHD comprise a heterogeneous group of anomalies that may affect various aspects of the normal cardiac anatomy or function; they can be “isolated” defects (i.e., involving only one or more cardiac structures and/or the adjoining vessels for instance the aorta or pulmonary veins), be associated with chromosomal (e.g., Down syndrome) anomalies or those of other systems (e.g., the digestive system) or comprise one of the elements of a known syndrome (e.g., the Di George syndrome).1,2
The signs and symptoms in infants and children vary depending in part on the type and severity of CHD. Common signs may include cyanosis (a blue tinge to the skin), rapid breathing, rapid heartbeat, swelling in the hands, legs, ankle, feet and around the eyes, shortness of breath in babies during feeding (making it difficult for them to gain weight) and in older children, extreme tiredness and fatigue and fainting during exercise. There are several diagnostic tests for CHD, including fetal and neonatal echocardiography, electrocardiogram, chest x-ray, pulse oximetry, and catheterization. Fetal echocardiography and in relatively small proportion of cases, Magnetic Resonance Imaging (MRI) are diagnostic methods for prenatal diagnosis of CHD. As early as 16 weeks of gestational age, most major structural congenital heart defects can be detected. Currently, approximately 30% of CHD cases are prenatally diagnosed, with substantially higher proportions when minor defects are excluded.1,3,4 The definitive diagnosis of CHD is based on a specialized neonatal echocardiography as there are cases of more or less mismatch between the fetal and neonatal echocardiography findings.
Treatment of CHD consists of a range of different strategies from medications to surgery depending on the severity and complexity of the malformation.4 Currently, with the progress in trans-catheter and surgical techniques, newborns with complex CHD have a substantially lower infant mortality and higher life expectancy than in the past. However, adverse neurodevelopmental outcomes remain in the newborns with the more severe forms CHD. As a result, children with CHD are more likely to miss school and to utilize healthcare, especially at younger ages.5,6
CHD are the most common group of congenital malformations with the total prevalence of about 8 per 1000 births.3,7,8. The vast majority (approximately 80%) of CHD, more so in the case of “isolated” (i.e., not associated with genetic or other abnormalities) CHD are live births, 16% Terminations of Pregnancy for Fetal Anomaly (TOPFA) and 2% stillbirths (> 20 weeks of gestation). After an increase in the 1990’s, the proportion of cases that are TOPFA has been fairly stable in the past twenty years.3 In addition to the severity of CHD, the proportion of TOPFA for CHD is substantially higher for cases associated with chromosomal anomalies as well as for cases diagnosed before 22 weeks of gestational age. Moreover, maternal characteristics, particularly socioeconomic factors can be associated with the probability of TOPFA.9
The total prevalence of CHD has increased over time, most likely due to improvements in diagnostic methods which help to detect milder cases that would previously go undetected. However, the live birth prevalence of complex CHD (e.g., left ventricular outflow tract obstruction) has decreased due to prenatal diagnosis followed by TOPFA for the most severe and incurable cases.5,7
The prevalence of CHD may vary across countries and regions. These differences may be related to differences in pre- and post-natal diagnosis, socioeconomic status of individuals living in a particular geographical region, as well as genetic and environmental factors. In low-income countries lack of access to high quality, specialized services may lead to under-estimation of the prevalence of CHD due to under diagnosis of CHD, both overall and among live births.7
CHD have multifactorial causes, including genetic and epigenetic abnormalities as well as environmental factors in the broad sense of the term. The latter include a heterogeneous set of risk factors including maternal folic acid deficiency, rubella infection, gestational diabetes, alcohol abuse, and medications, including thalidomide and lithium. Air pollution might also be a risk factor for CHD and the greater prevalence of septal defects in low-income Asian countries may be due to air particular matter. While estimates are at least somewhat imprecise, approximately 20% of CHD may be due to chromosomal anomalies and genetic, including Mendelian and non-syndromal single gene disorders.5,10,11
CHD represent a wide spectrum of heterogeneous anomalies that show considerable variability in their prevalence, anatomy, developmental origin, severity, modalities of clinical and surgical management, short- and longer-term mortality, morbidity and health, including neuro-developmental, outcomes. Given this heterogeneity, coding and classification of CHD becomes a major and challenging question. Moreover, any useful classification of CHD must not needs be a “one fits all” categorization of CHD and different questions and hypotheses can only be tested with appropriate classifications for the question at hand.12
Currently, the most widely used coding and classification for CHD is the 10th version of the International Classification of Disease (ICD10). Nevertheless, it is increasingly recognized, particularly by pediatric cardiologists and cardiac surgeons, that ICD10 has important shortcomings for characterizing congenital anomalies in general and CHD in particular.12
In order to address these shortcomings, a comprehensive coding system, the International Pediatric and Congenital Cardiac Code (IPCCC) was devised. The IPCCC has many advantages but has never been used in a population-based study, most likely due to its complexity requiring highly specialized coding. Moreover, given the number of codes in the IPCCC (the long list of IPCCC includes more than 10,000 individual codes), its use in clinical and epidemiological studies requires regrouping of individual anomalies.
12 In 2011 Houyel et al. proposed the Anatomic and Clinical Classification of CHD (ACC-CHD) by rearranging the long list of the existing IPCCC. The rearrangement is based on the cardiac anatomy, along with criteria used for therapeutic management and consists of 10 main categories and 23 subcategories (
Table 1). It is intended to facilitate both the coding process and the analysis of the data in the setting of clinical and epidemiological studies. Timing of diagnosis, TOPFA, risk and timing of infant mortality were highly variable across the categories of CHD in ACC-CHD, suggesting that it may be a useful measure of severity, and hence, predictor of outcomes of CHD.
12
The objective of our study was to develop and validate a predictive model based on the ACC-CHD and to assess the added-value of a set of a priori chosen variables for improving the predictive ability of a model including ACC-CHD alone.
Methods
Data Source
EPICARD (EPIdémologie des CARDiopathies congénitales) was a population-based, prospective, cohort study with long-term follow-up of children with a structural CHD born to women in the Greater Paris area (Paris and its surrounding suburbs). All cases (live births, terminations of pregnancy for fetal anomaly (TOPFA), fetal deaths ≥ 20 weeks) diagnosed in the prenatal period or up to 1 year of age in the birth cohorts between May 1, 2005 and April 30, 2008 were eligible for inclusion. Diagnoses were confirmed in specialized pediatric cardiology departments and for the majority of TOPFA and fetal deaths by a standardized pathology examination. When a pathology exam could not be done, the diagnoses were confirmed by a pediatric cardiologist and a specialist in echocardiography in the EPICARD study group, using the results of prenatal echocardiography examination. Multiple sources of data including all maternity units, pediatric cardiology and cardiac surgery centers, fetal and neonatal pathology departments, neonatal and pediatric intensive care units, infant units, and outpatient clinics in greater Paris and neighboring tertiary care center were regularly consulted to attain completeness of case registrations. Informed consent was obtained from study participants, and the study was approved by an ethics committee (French National Committee of information and Liberty). Follow-up of children in the EPICARD included assessment of children’s health and neuro-developmental outcomes at 8 years of age.3
Study Population
The total number of newborns included in the EPICARD study was 2867. After excluding TOPFA (N = 466) and fetal deaths (N = 53), our initial study population comprised 2348 live births (
Figure 1). We excluded cases of CHD associated with chromosomal (N = 149) or other anomalies (N = 318). The total study population was hence 1881 newborns with “isolated” congenital heart defects.
Outcome and Predictor Variables
Our outcome variable was the survival of the newborns with isolated CHD during the first 8 years of life. The main predictor variable was the ACC-CHD (
Table 3). Due to the small sample sizes in three categories 1, 5 and 10, these categories were combined and so were categories 3 and 7 which had very few events (low mortality rate). Therefore, instead of the main ACC-CHD categories, we used a simpler form of ACC-CHD, with seven categories instead of ten. The additional predictor variables comprised gender, gestational age (as a continuous variable using fractional polynomials) Small for gestational age (birth weight below the 10th percentile in our population, as well as the number of cardiac surgeries during the first year of life.
We estimated two models: one with the seven categories of ACC-CHD as the sole predictor variable (Model 1) and a second model including all predictor variables (Model 2).
Statistical Analysis
We used the Kaplan-Meier method for describing the survival rates. We constructed Kaplan-Meier plots for all newborns combined and for each category of the ACC-CHD. We used the Wilcoxon test to compare survival rates across the categories of ACC-CHD.
We used Royston-Parmar flexible parametric approach to develop predictive survival models. 14,15 These models have certain advantages over both the Cox proportional hazard and parametric survival models. In contrast to the Cox model, these models can give estimations of the baseline hazards and provide smooth survival functions thereby simplifying the interpretation of the plots without potential overemphasis on local features. They are also useful when the proportional-hazards assumption is violated. Moreover, the flexible parametric models also overcome a limitation of the standard
parametric models in that they can more satisfactorily represent real data.
The flexible parametric models use three scales: hazard, odds and probit. These are generalization of the standard parametric Weibull, loglogistic and lognormal models, respectively. In standard parametric models, we assume that the effect of covariates is proportional on the appropriate scale; hazard, odds of failure or probit of failure probability. Furthermore, we assume that there is a linear relation between a particular transformation of the survival function and the logarithm of the survival time. In the Royston and Parmar model, this assumption is relaxed using restricted cubic splines, which allow a more robust estimation of the baseline survivor function.
15 (
Table 1).
Table 1.
Flexible parametric survival different scales and their relative parametric models.
Table 1.
Flexible parametric survival different scales and their relative parametric models.
| Standard parametric models |
Flexible parametric scale |
| Weibull |
Hazard |
| ln{− ln S(t; xi)} = ln{− ln S0(t)} + xiβ |
ln{− ln S0(t; xi)} = s(ln t; γ) + xiβ |
| Loglogistic |
Odds |
| logit{1 − S(t; xi)} = logit{1 − S0(t)} + xiβ |
logit{1 − S(t; xi)} = s(ln t; γ) + xiβ |
| Lognormal |
Probit |
| −Φ−1{S(ln t)} = −Φ−1{S0(ln t)} + xiβ |
−Φ−1{S(ln t)} = s(ln t; γ) + xiβ |
The “df” is defined as the total number of knots (interior knots plus two boundary knots) minus one. The knots are chosen to be relatively close to the median uncensored log survival-time in order to allow the data to be most closely modeled in the region of greatest density (
Table 2).
15
The choice of scale and number of knots is made by comparing Akaike information criterion (AIC) or Bayes information criterion (BIC) statistics obtained from different scales with different degrees of freedom; smaller AIC and BIC indicate a better fit that suggests the best proportionality assumption about the covariate effects.15Royston and Parmar maintain that the optimal positioning of the knots is not critical for a good fit and may even be undesirable in that the fitted curve may follow small-scale features of the data too closely. They also suggest using df of two or three for small datasets and five or six for larger datasets.15 We found the probit scale and three degrees of freedom as the best parameters for our flexible parametric survival models.
Model Fit
The martingale-like residuals were used to assess the goodness of fit of models for continuous variables. The martingale-like residual, ri, for the ith observation is ri = δi − Ĥi(ti) where δi is the censoring indicator and Ĥi(ti) is the estimated cumulative hazard at the individual’s failure or censoring time, ti. If the model is correct, then E(ri|xi) = 0 for any x in the model and E(ri|xiβ̂) = 0.15 In addition,
the AIC and BIC were used to compare the models’ goodness of fit.
From the prediction perspective13, the accuracy of predictions is the most important criteria to assess competing models. Indeed, all else equal, a more accurate model that violates some assumptions may be preferred to a less accurate model that meets the relevant assumptions. However, in most cases, a model that meets the relevant assumptions tends to produce better predictions.
Assessment of the Predictive Ability of Models
We used calibration, discrimination and a measure of explained variance for assessing the predictive ability of the models. We used Royston and Sauerbrei’s D statistic and which are measures of discrimination for survival models; D is a measure of prognostic separation of the survival curves – an estimate of the variance of prognostic index of model (xβ) across individuals, and R2 is a measure of explained variation on the natural scale of the model. A simulation study showed that has better performance in comparison with the other measures of discrimination for survival models and have more intuitive interpretations. Moreover, is robust in relation to outliers.15,19
We used bootstrap for internal validation in order to obtain the corrected estimation of our performance index (
). Firstly, we developed the model using all subjects and the performance index “apparent
” was calculated (
). Then this measure was recalculated on a bootstrap sample with replacement (
) and the “optimism” in the fit from the bootstrap sample was calculated by
; optimism calculation was repeated 500 times. Finally, the bootstrap corrected D_boot original D performance was obtained by subtracting the average optimism from the apparent
:21
Comparison with the General Population
We also compared the survival curves for each category of ACC-CHD with that of the population- level survival curves as provided by the INSEE (Institut National de la Statistique et des Etudes Economiques) from 2012 to 2016. These mortality rates were available for both genders and by different age groups, separately.22Results
Overall, among the 1881 newborns with isolated CHD, 1808 (96%) survived until eight years of age . We found no significant difference between survival rates of girls and boys. The term newborns, the newborns who were not small for gestational age, and the newborns who had not a surgical intervention during 1
st year of life had higher survival rates (
Table 1).
Table 1.
Descriptive characteristics of study population.
Table 1.
Descriptive characteristics of study population.
| |
N (%) or mean ± SD |
8-year survival rate
(%) |
| Female |
1018 (54.1) |
96 |
| SGA† (< 10th percentile of Audipog’s curve) |
205 (10.9) |
93* |
| Surgery during 1st year of life |
382 (20.3) |
92* |
| Premature (< 37 weeks of gestation) |
240 (12.8) |
91* |
* p < .05 Logrank test or ttest, as appropriate.
† Small for Gestational Age |
|
|
More than 50% of the newborns with isolated CHD belonged to the group of “Anomalies of atria, interatrial communications and ventricular septal defects, who had the highest survival rate among the ten ACC-CHD categories. More than 90% of newborns in the “Ventriculo-arterial connections” and “Anomalies of the extrapericardial arterial trunks” groups survived for 8 years. The newborns with heterotaxy, complex anomalies of atrioventricular connections, coronary anomalies, anomalies of venous return and anomalies atrioventricular junctions and valves had survival rates between 50% and 90%. We found the highest mortality rate in newborns with functionally univentricular hearts with a survival rate of 44% at eight years of age. A Wilcoxon test showed a significant difference between the survival rates of ACC-CHD groups (
Table 2).
We estimated two predictive models using the flexible parametric survival models, one with the ten ACC-CHD categories as the only predictor variable and a second with the ACC-CHD categories and other predictor variables (see Methods). The predictive ability of the model that only included ACC- CHD categories alone was similar to the fuller model that included other variables. We report here the results of the full model with ACC-CHD categories as well as gender, We divided the predicted probabilities of survival into three categories (
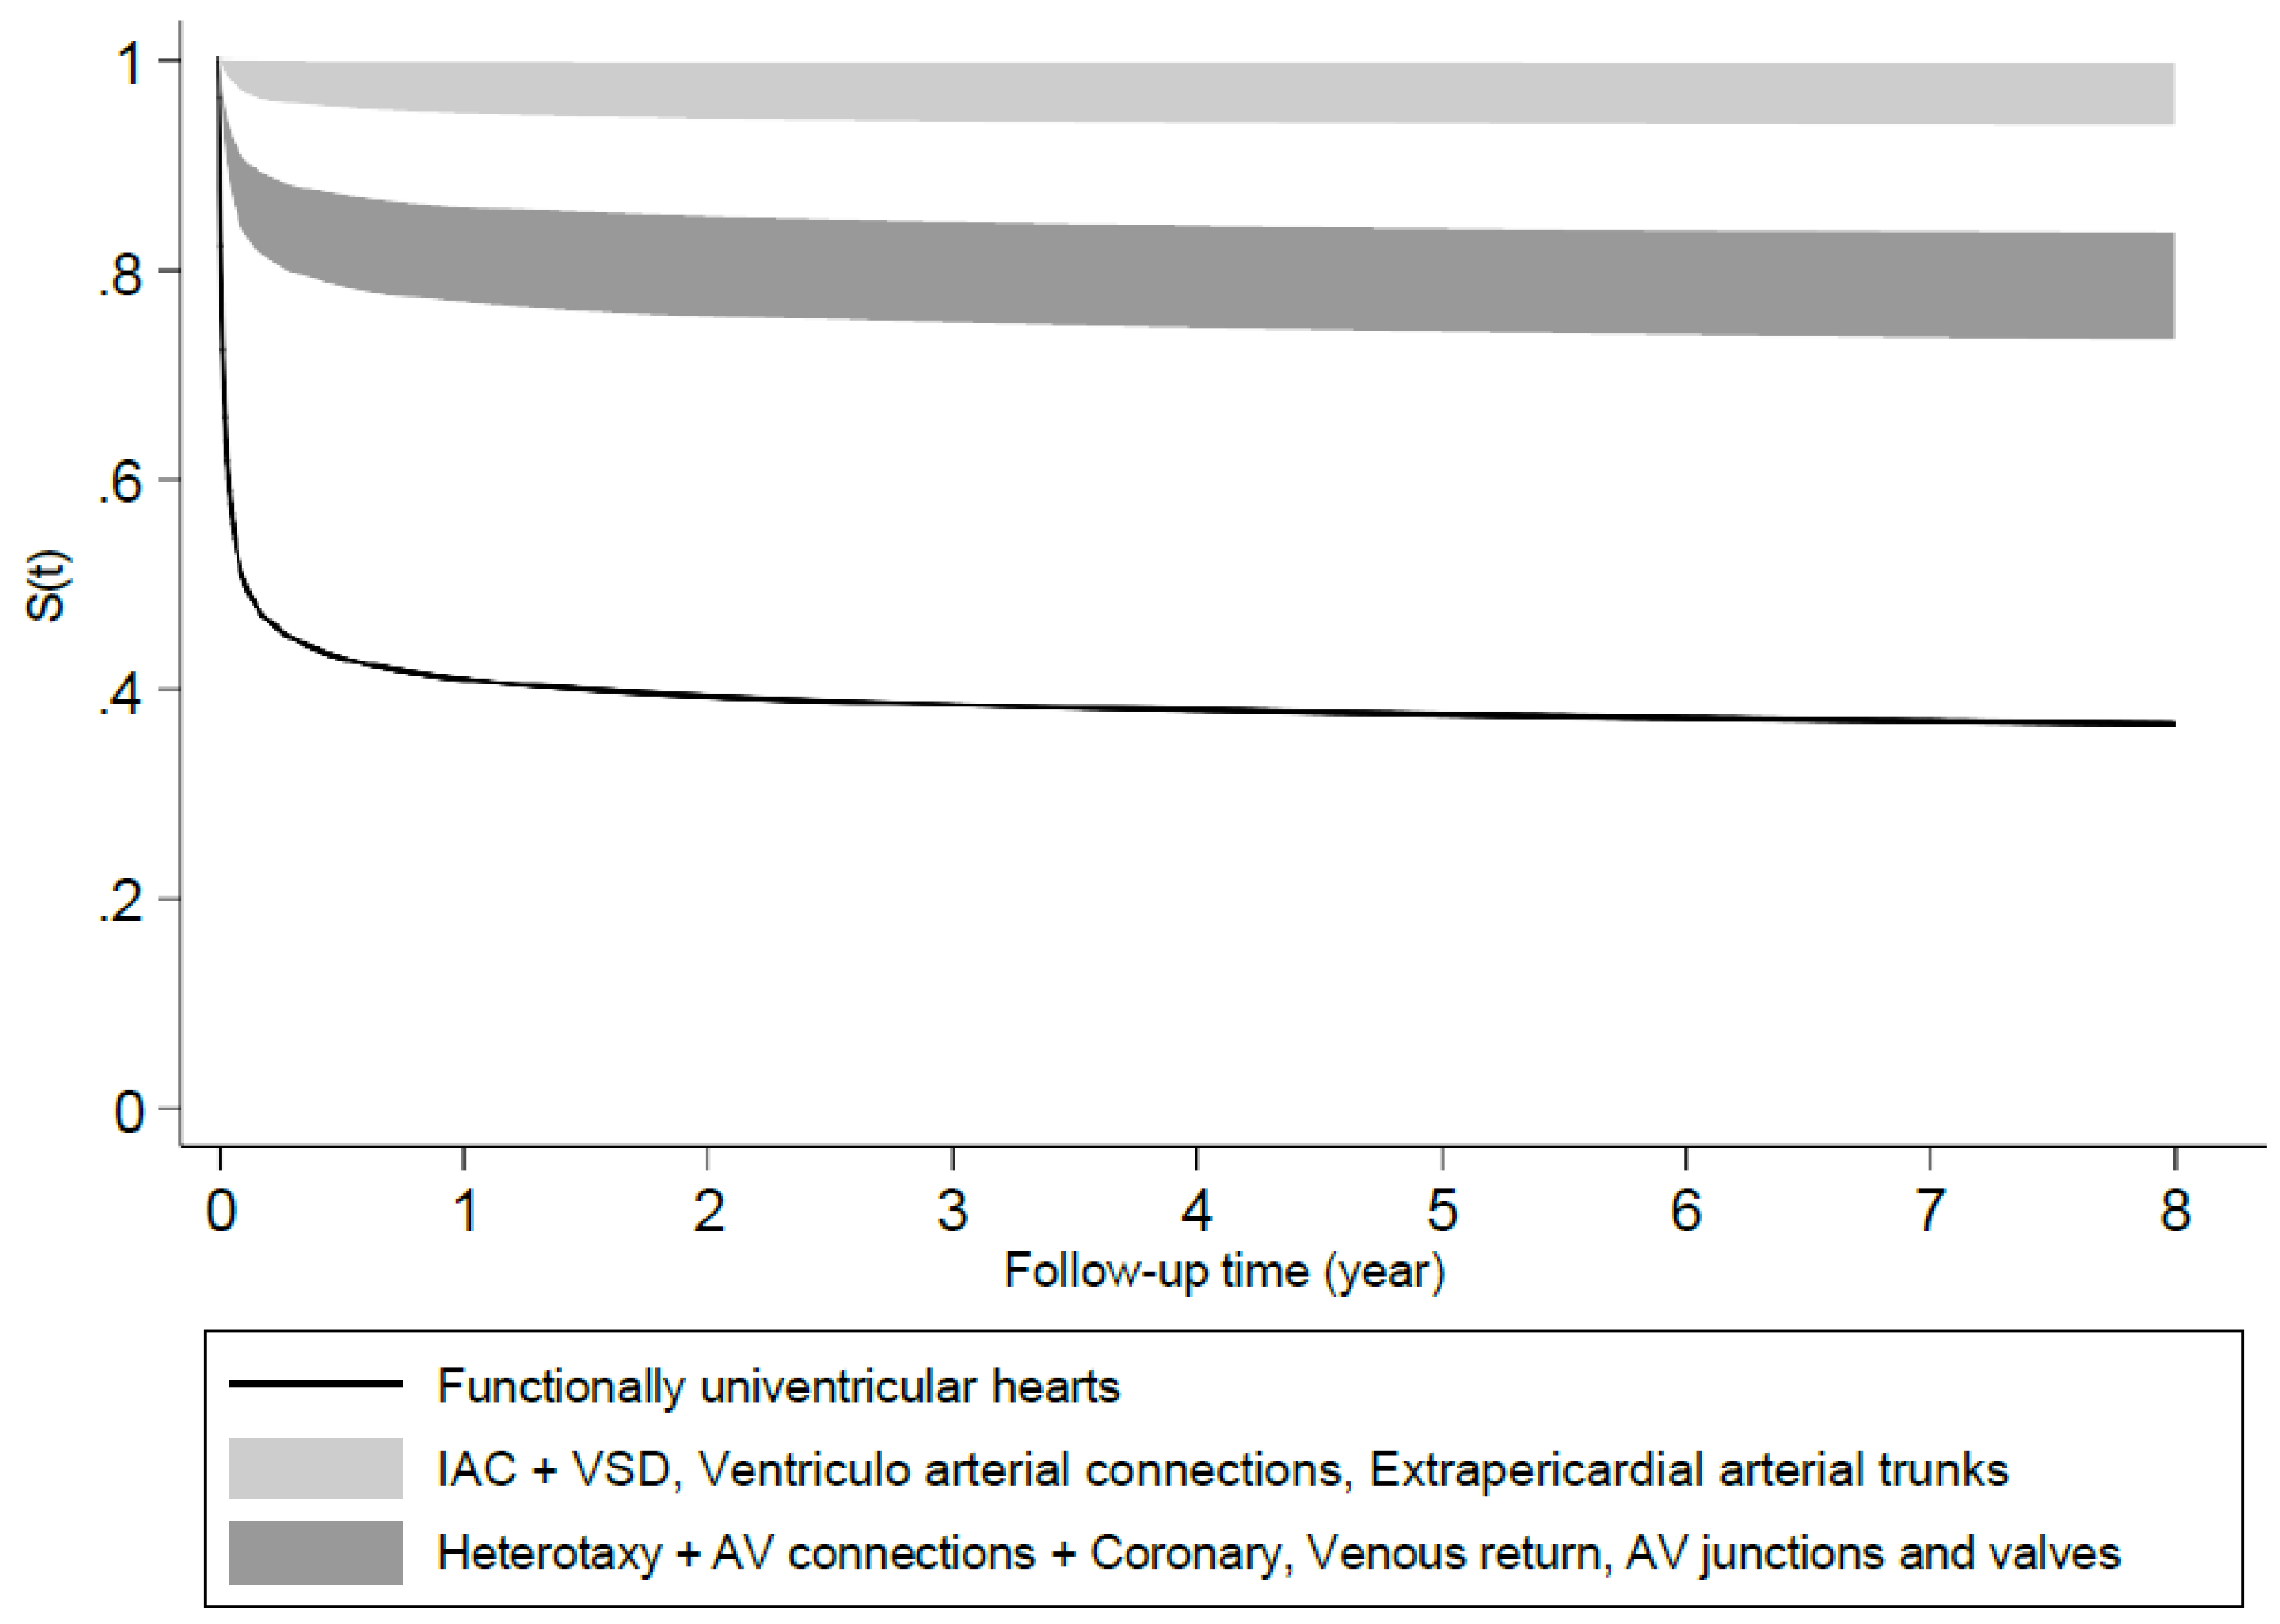
Figure 1). The category with the highest (> 90%) survival probability included Anomalies of the atria and interatrial communications and Ventricular septal defects, Ventriculo-arterial connections and Anomalies of the extrapericardial arterial trunks. The category with moderate (70% - 80%) survival probabilities included Heterotaxy, AV connections and Coronary anomalies, Anomalies of the venous return and Anomalies of the atrioventricular junctions and valves. The category with the lowest probability of survival (< 50%) corresponded to the Functionally univentricular hearts.
Table 2.
Distribution of ACC-CHD groups and their survival rates.
Table 2.
Distribution of ACC-CHD groups and their survival rates.
| ACC-CHD groups |
N (%) |
S(t)* |
| Heterotaxy, including isomerism and mirror-imagery + Complex anomalies of atrioventricular connections + Congenital anomalies of the coronary arteries (Heterotaxy + AV connections + Coronary anomalies) |
22 (1.2) |
.68 [.45 - .83] |
| Anomalies of the venous return |
20 (1.1) |
.80 [.55 - .92] |
| Anomalies of the atria and interatrial communications + Ventricular septal defects (IAC + VSD) |
1311 (69.7) |
.99 [.988 - .997] |
| Anomalies of the atrioventricular junctions and valves |
48 (2.5) |
.77 [.62 - .87] |
| Functionally univentricular hearts |
34 (1.8) |
.44 [.27 - .60] |
| Anomalies of the ventricular outflow tracts (ventriculo-arterialconnections) |
360 (19.1) |
.94 [.91 - .96] |
| Anomalies of the extrapericardial arterial trunks |
86 (4.6) |
.92 [.84 - .96] |
| * 8-year survival rate and its 95% confidence interval in brackets |
|
|
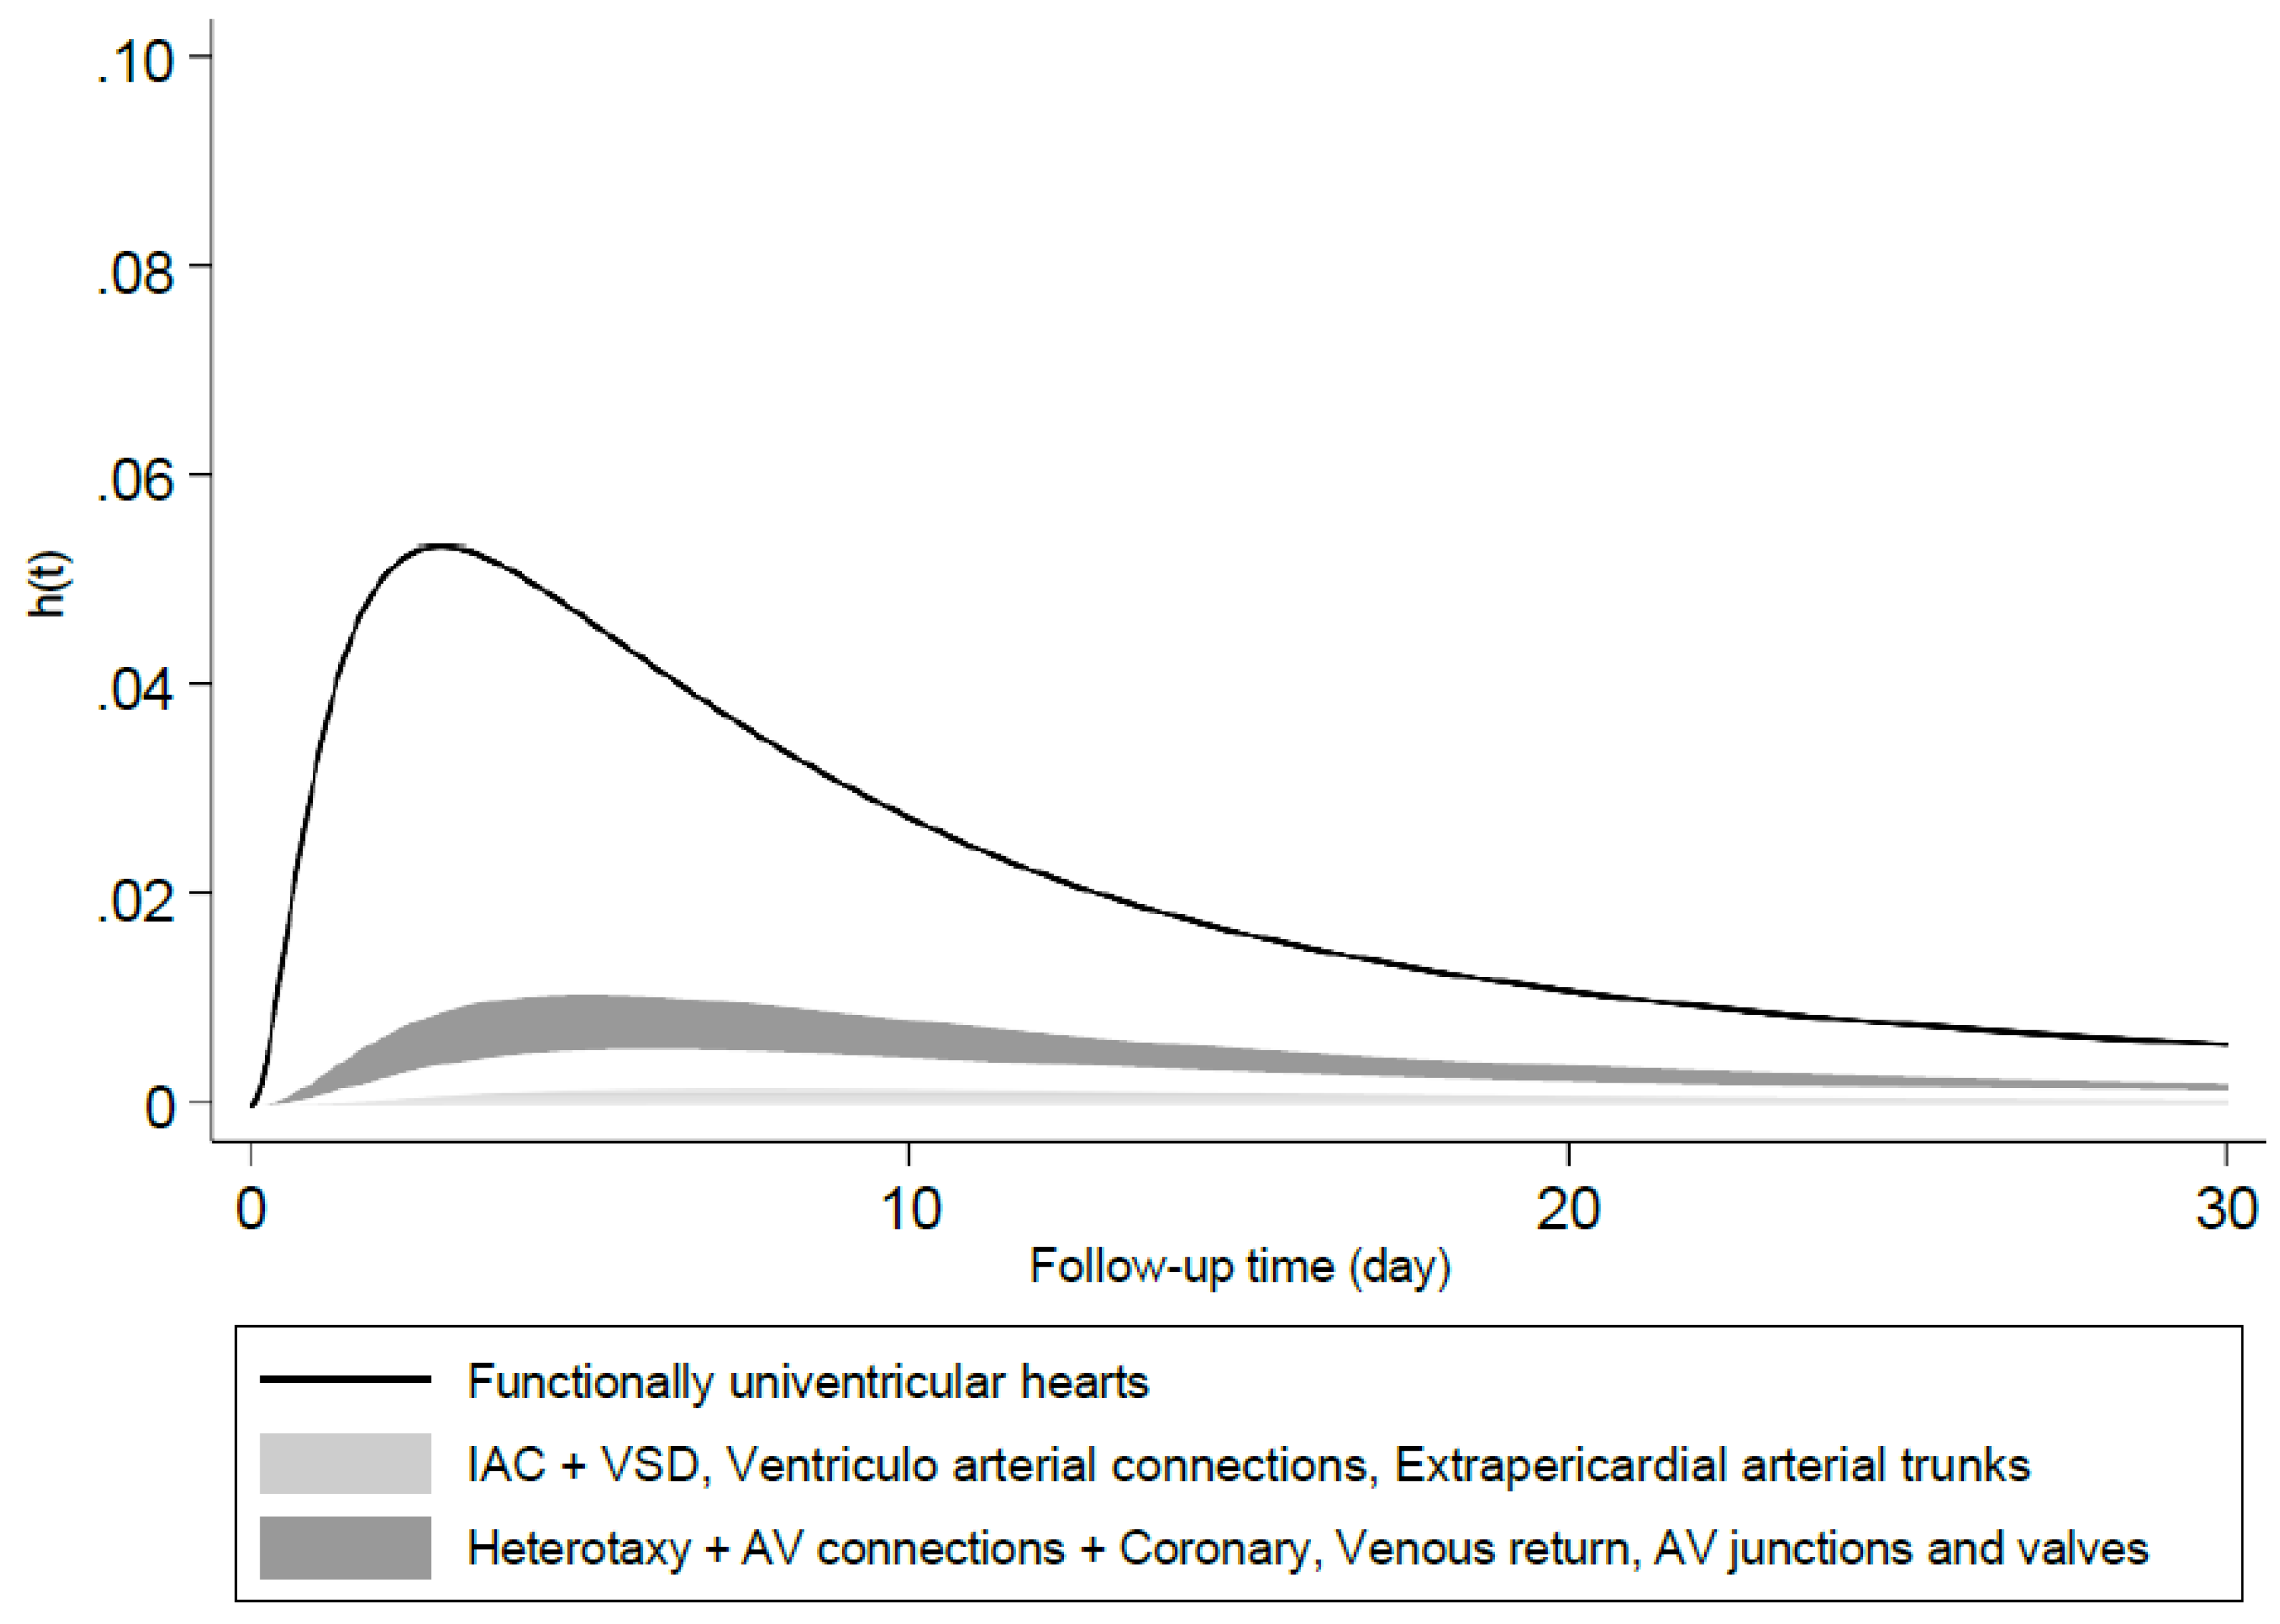
The instantaneous hazards peaked at the 3
rd day of life for the category with the lowest survival probability, i.e., Functionally univentricular hearts; this occurred at the 5
th day of life for the category with moderate probabilities of survival and 8-11
th day for the category with the highest probability of survival. The hazard rates at their peak were less than 1% and tended towards zero thereafter (
Figure 2).
Figure 1.
Predicted survival probabilities in different ACC-CHD groups estimated by model 2 with ACC-CHD and other predictors at their average.
Figure 1.
Predicted survival probabilities in different ACC-CHD groups estimated by model 2 with ACC-CHD and other predictors at their average.
Figure 2.
Predicted instantaneous hazard in different ACC-CHD groups estimated by model 2 with ACC-CHD and other predictors at their average.
Figure 2.
Predicted instantaneous hazard in different ACC-CHD groups estimated by model 2 with ACC-CHD and other predictors at their average.
Table 3 shows the predictive performance of two models in original dataset and bootstrapped samples. The D statistics is 1.43 and 1.60 for models 1 and 2 respectively; Higher D in Model 2 shows that the variance of prognostic index (xβ) of model across individuals is slightly greater in Model 2 in comparison with that of Model 1. The R
2 of Model 1 and 2 were 45% and 50% respectively in the original dataset which means that Model 1 can explain 45% of variation in survival among individuals in the original dataset. This explained variation is 50% for Model 2 in the original dataset. The corrected D statistics estimated by our models in bootstrapped samples were 1.40 and 1.49 with the R
2 0.44 and 0.47 for models 1 and 2 respectively. The predictive performance of models 1 and 2 obtained from original data and bootstrapping were hence quite similar. The corrected R
2 estimated after bootstrapping showed a difference of only 1% and 3% with that of the original data for Model 1 and 2, respectively.
Table 3. Predictive ability of Model 1 (ACC-CHD as the only predictor) and the full model
(Model 2) with ACC-CHD and other predictors.
| |
Model 1 |
Model 2 |
| Original dataset |
|
|
| Royston’s D |
1.43 |
1.60 |
| R2
|
0.45 [0.36 - 0.52] |
0.50 [0.41 - 0.58] |
| Bootstrap sampling |
|
|
| Royston’s D |
1.40 |
1.49 |
| R2
|
0.44 [0.35 - 0.51] |
0.47 [0.38 - 0.55] |
Discussion
In this population-based prospective cohort study of the 8-year survival of 1881 newborns with isolated CHD, we found that by far the majority of newborns survive even if survival varies widely across the different subgroups of CHD. The lowest survival rate was for newborns with functionally univentricular heart. Most deaths occurred in the first few days of life and hazard rates were quite low thereafter.
We also assessed the predictive ability of models based on an a priori and exhaustive classification of CHD (ACC-CHD) for predicting the risk of mortality for newborns with CHD. We assessed both a model with ACC-CHD as the only predictor and a fuller model with additional variables known to be associated with the risk of mortality in newborns, namely gestational age, gender, small for gestational age and cardiac surgery after the first year of life.
The predictive ability of the model with ACC-CHD alone as compared with the fuller model was pretty similar, indicating that in the case of CHD, after taking into account the type of CHD with the ACC-CHD classification, other variables including gestational age and gender add little to the model’s predictive ability. Both models had rather good predictive ability based on the statistics proposed by Royston and Sauerbrei for measuring the discrimination performance: D and R2 (which is calculated based on D). The R2 for the two models were 45% and 50%, for the model with ACC-CHD only and the fuller model, respectively. Hence, the model could account for about half of the differences in survival in newborns with CHD. This may be considered good to excellent discrimination as it corresponds to the higher end of the interval (O to 60%) noted to be the case in most real data by Royston.
The probit-scale models provided the best fit for our data. However, these models are less familiar in the biomedical literature (even if widely used in econometrics) and their results are more difficult to communicate. We find the best strategy is to provide predicted probabilities of the outcomes based on the models.
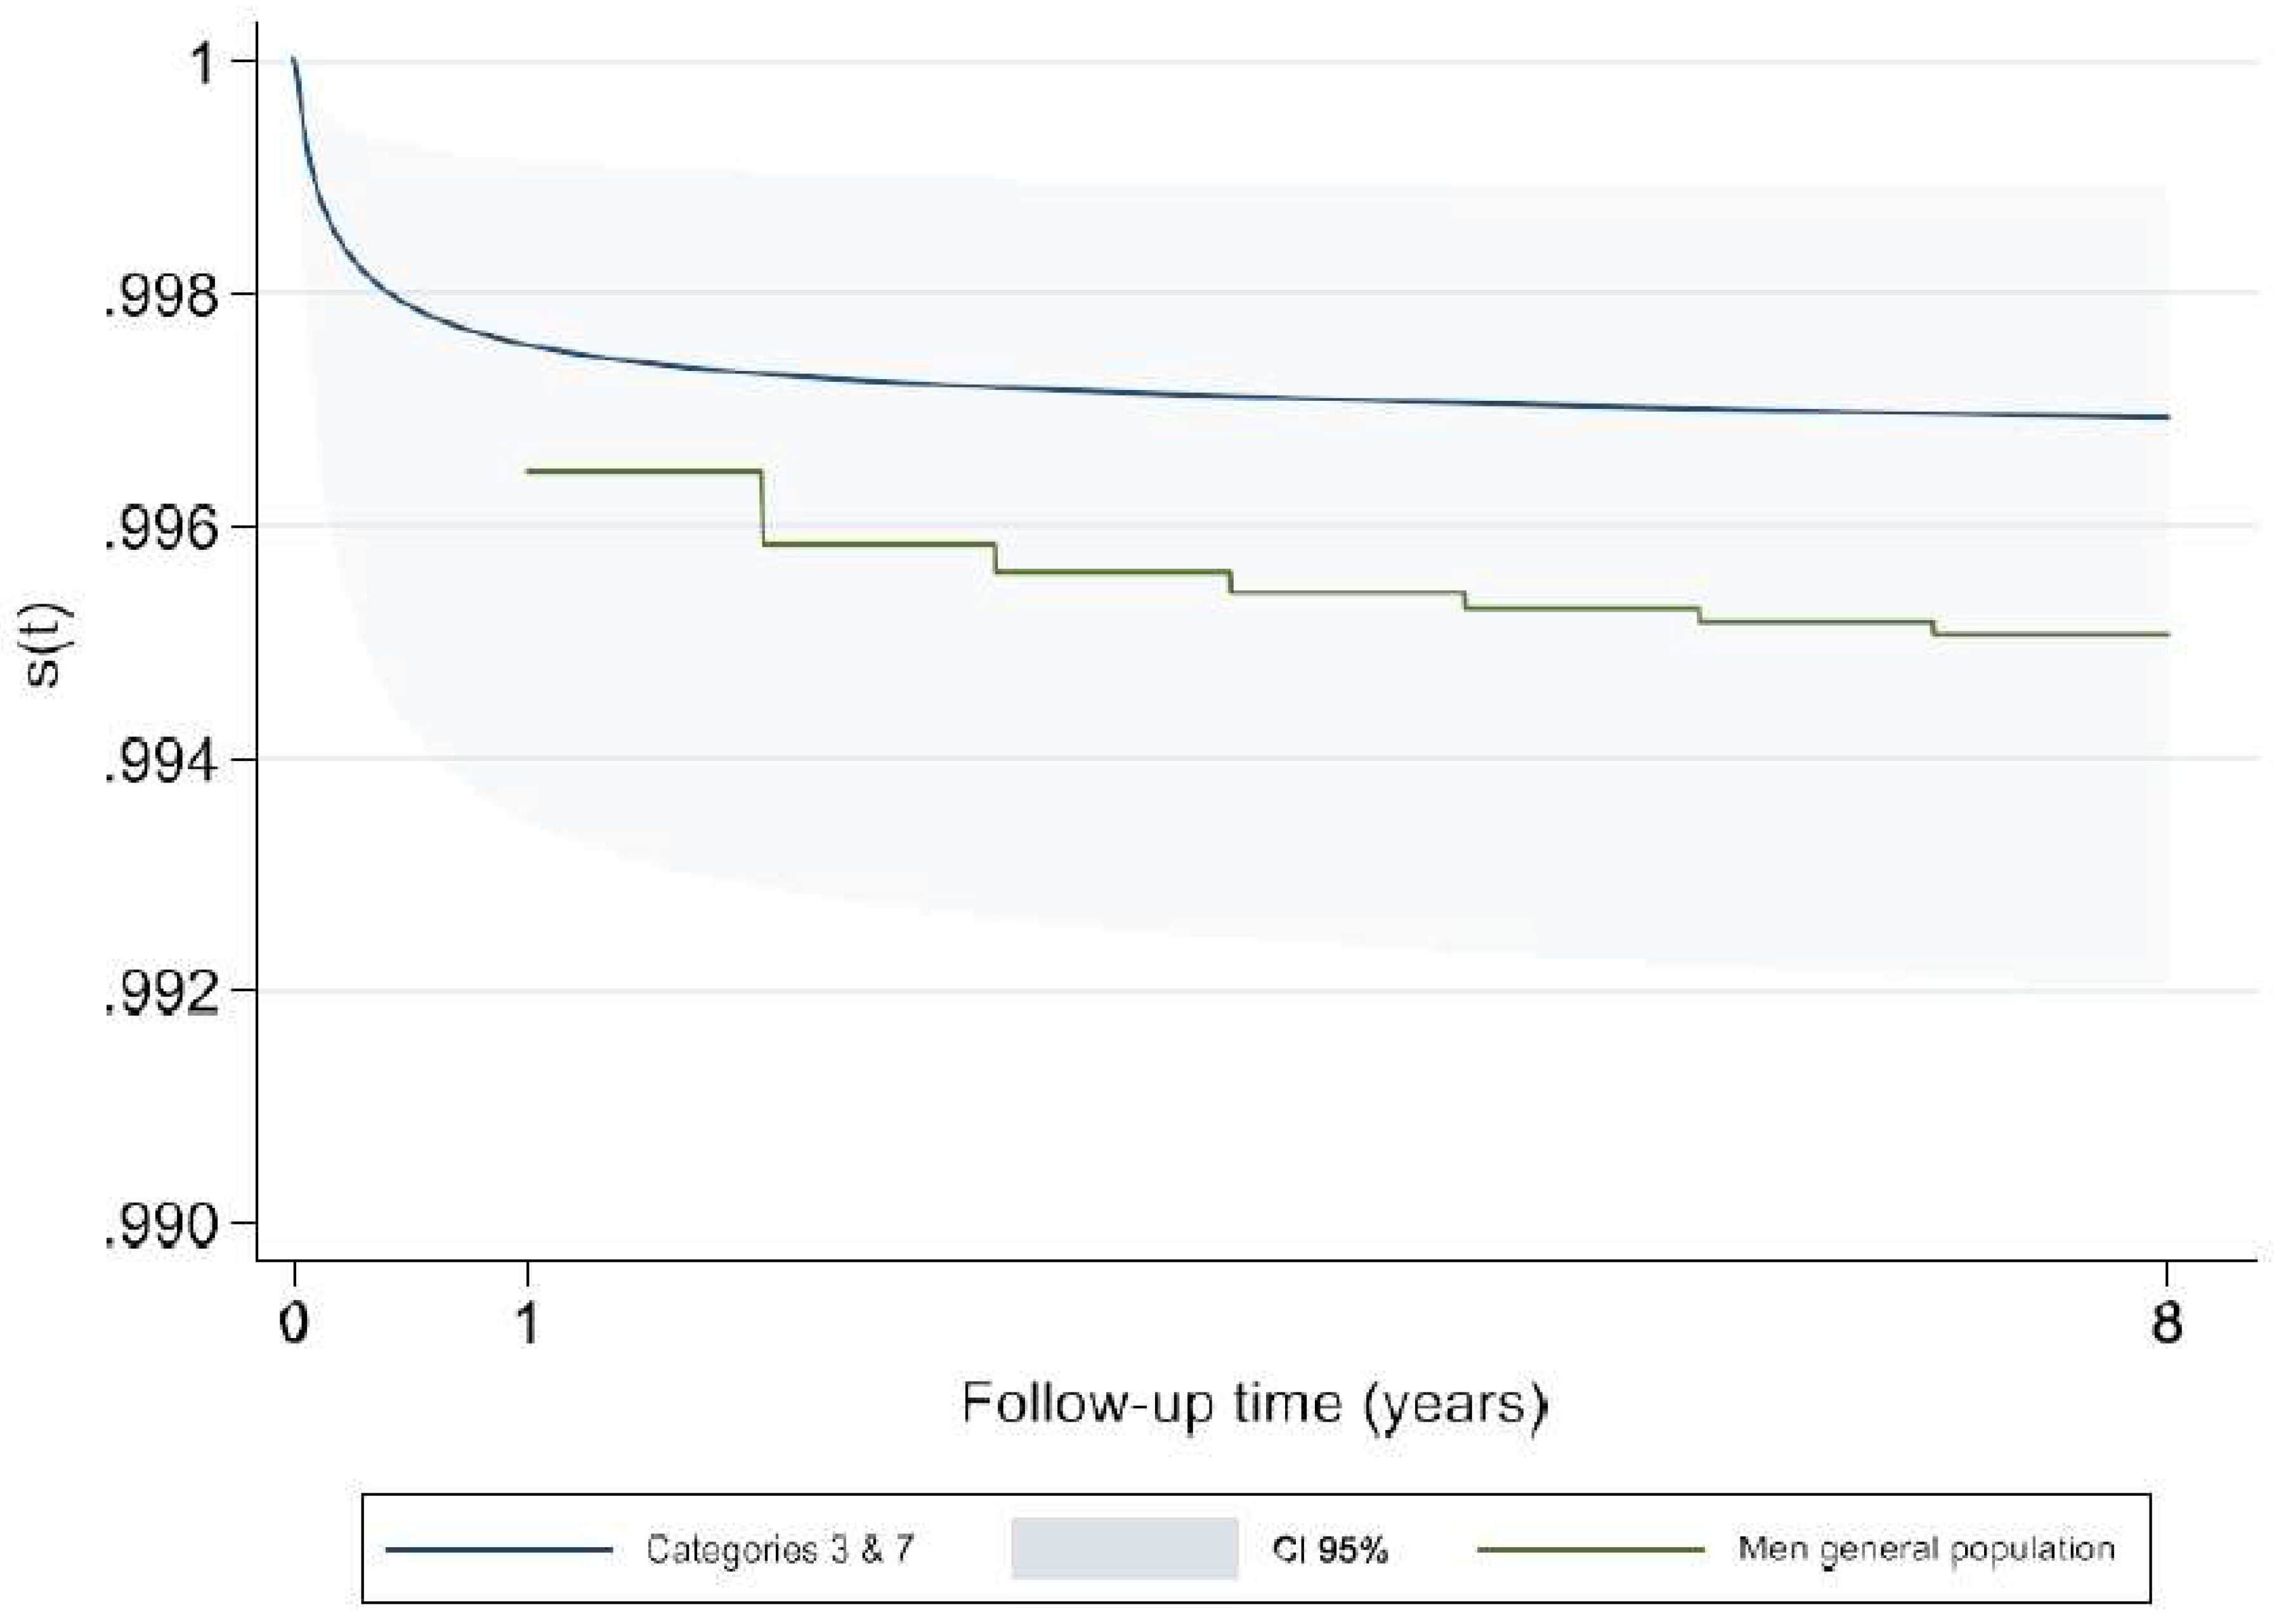
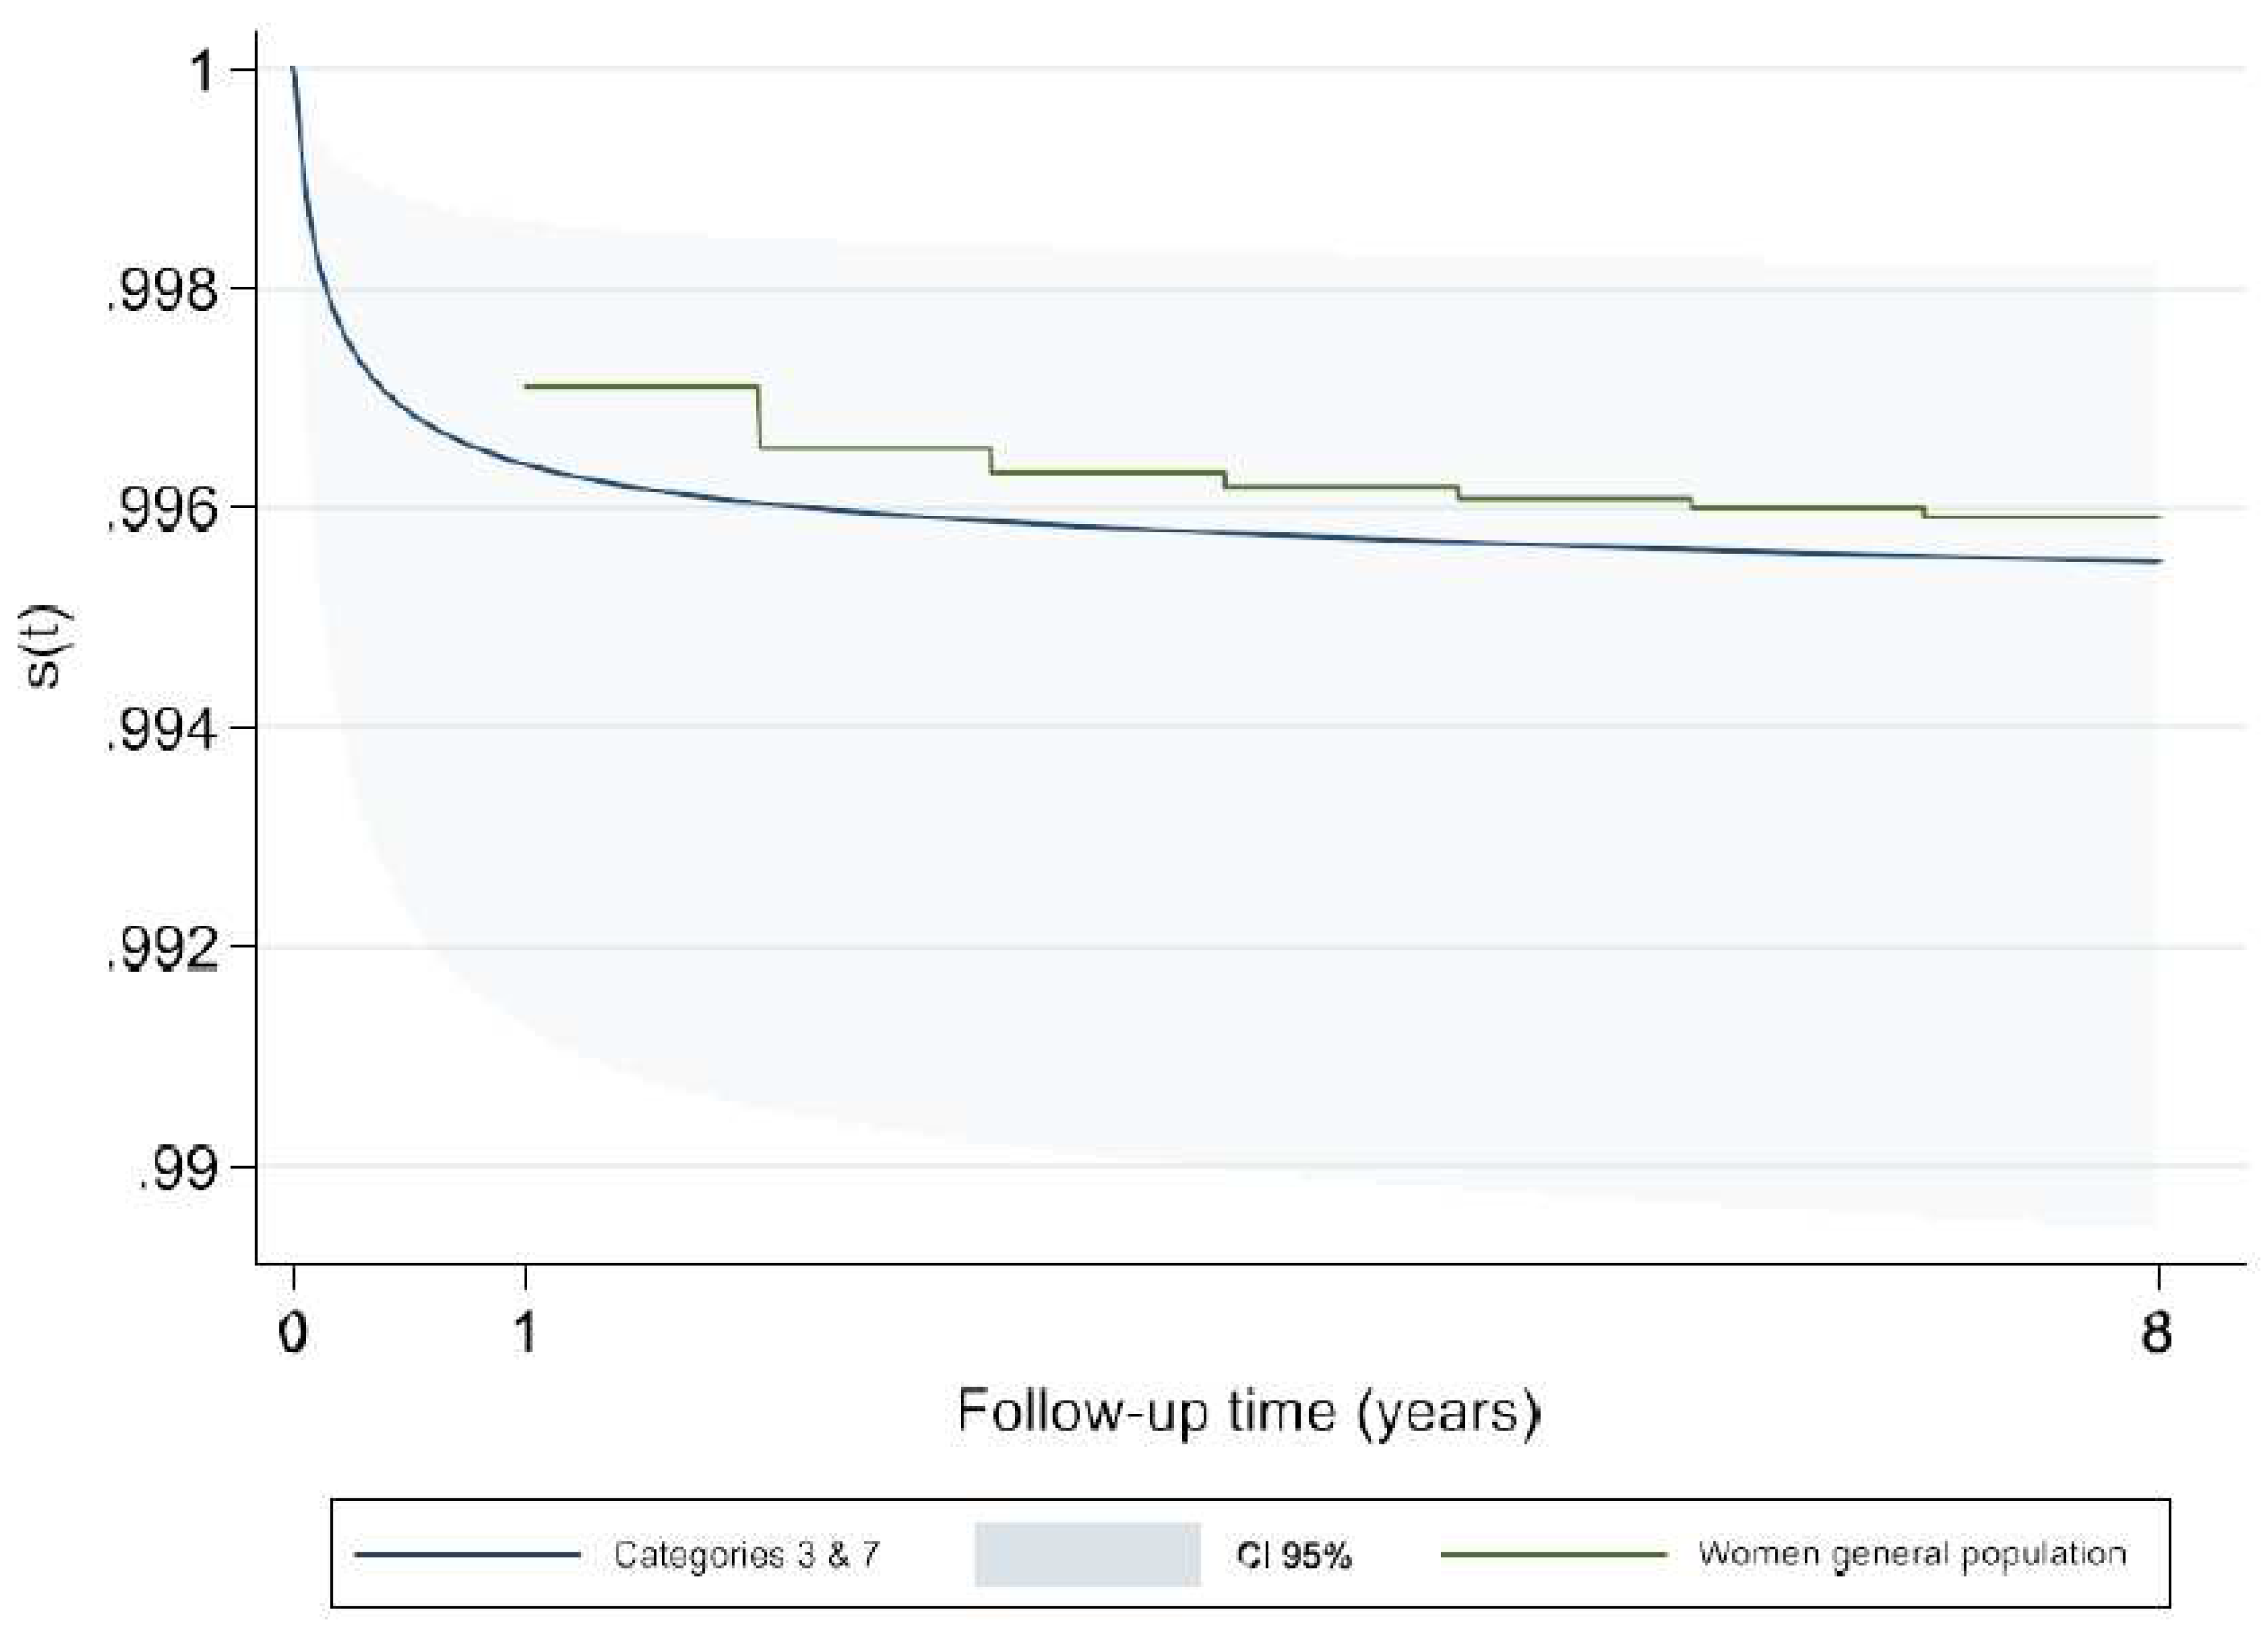
We compared the estimated survival rates in our study with those of general population. For this purpose, we used the tables of life expectancy and mortality rate (from 2012 to 2016) for male and female French general population provided separately by INSEE. Our findings showed that the survival rate for male and female children from the birth up to age of 8 in general population was not significantly different with the merged categories 3 and 7 which is the reference category in our models (
Appendix A-
Figure A5 and
Figure A6). Hence, our reference category may be representative of the general population and therefore the estimated (hazards) risks for different categories of ACC-CHD can be considered an excess risk of mortality due to CHD.
This is the first population-based study to assess the predictive ability of an exhaustive, a priori classification of structural CHD for the long-term childhood survival of newborns with isolated CHD. Previous literature on predictive models has been exclusively concerned with infants with CHD who
undergo surgical interventions. Three main scores exist (refs. R + A + STS). Studies that have assessed the predictive ability of these scores have been for the most part based on data from specialized referral centers and only one previous population-based study has compared the predictive ability of R and A . Furthermore, they have assessed short-term, post-surgical (typically 30-days post-op) survival rather than long-term survival of the newborns.
Our study has certain limits. Several of the ACC-CHD categories comprised a small number of newborns as they represented rare anomalies. Hence, the survival measures were estimated with relatively little precision (wide confidence intervals) for these categories. While the ten main categories of ACC-CHD clearly capture much of the heterogeneity in the CHD, and specifically in the risk of mortality associated with different types of CHD, there remains important heterogeneities in terms of anatomy, pathophysiology, clinical management and outcomes within these ten main categories. Moreover, because of limited sample sizes, we had to combine certain categories of ACC-CHD, which further contributed to an increase in heterogeneity within the categories.
In conclusion, the ACC-CHD classification provided the basis of a fairly good discriminating predictive model for the long-term childhood survival of newborns with isolated CHD. Further studies are necessary for external validation and to assess whether the use of a prognostic model in daily practice improves decision making (impact studies). In any case, prediction of outcomes for individual newborns remains an important challenge.
Supplementary Materials
The following supporting information can be downloaded at the website of this paper posted on Preprints.org.
Appendix A
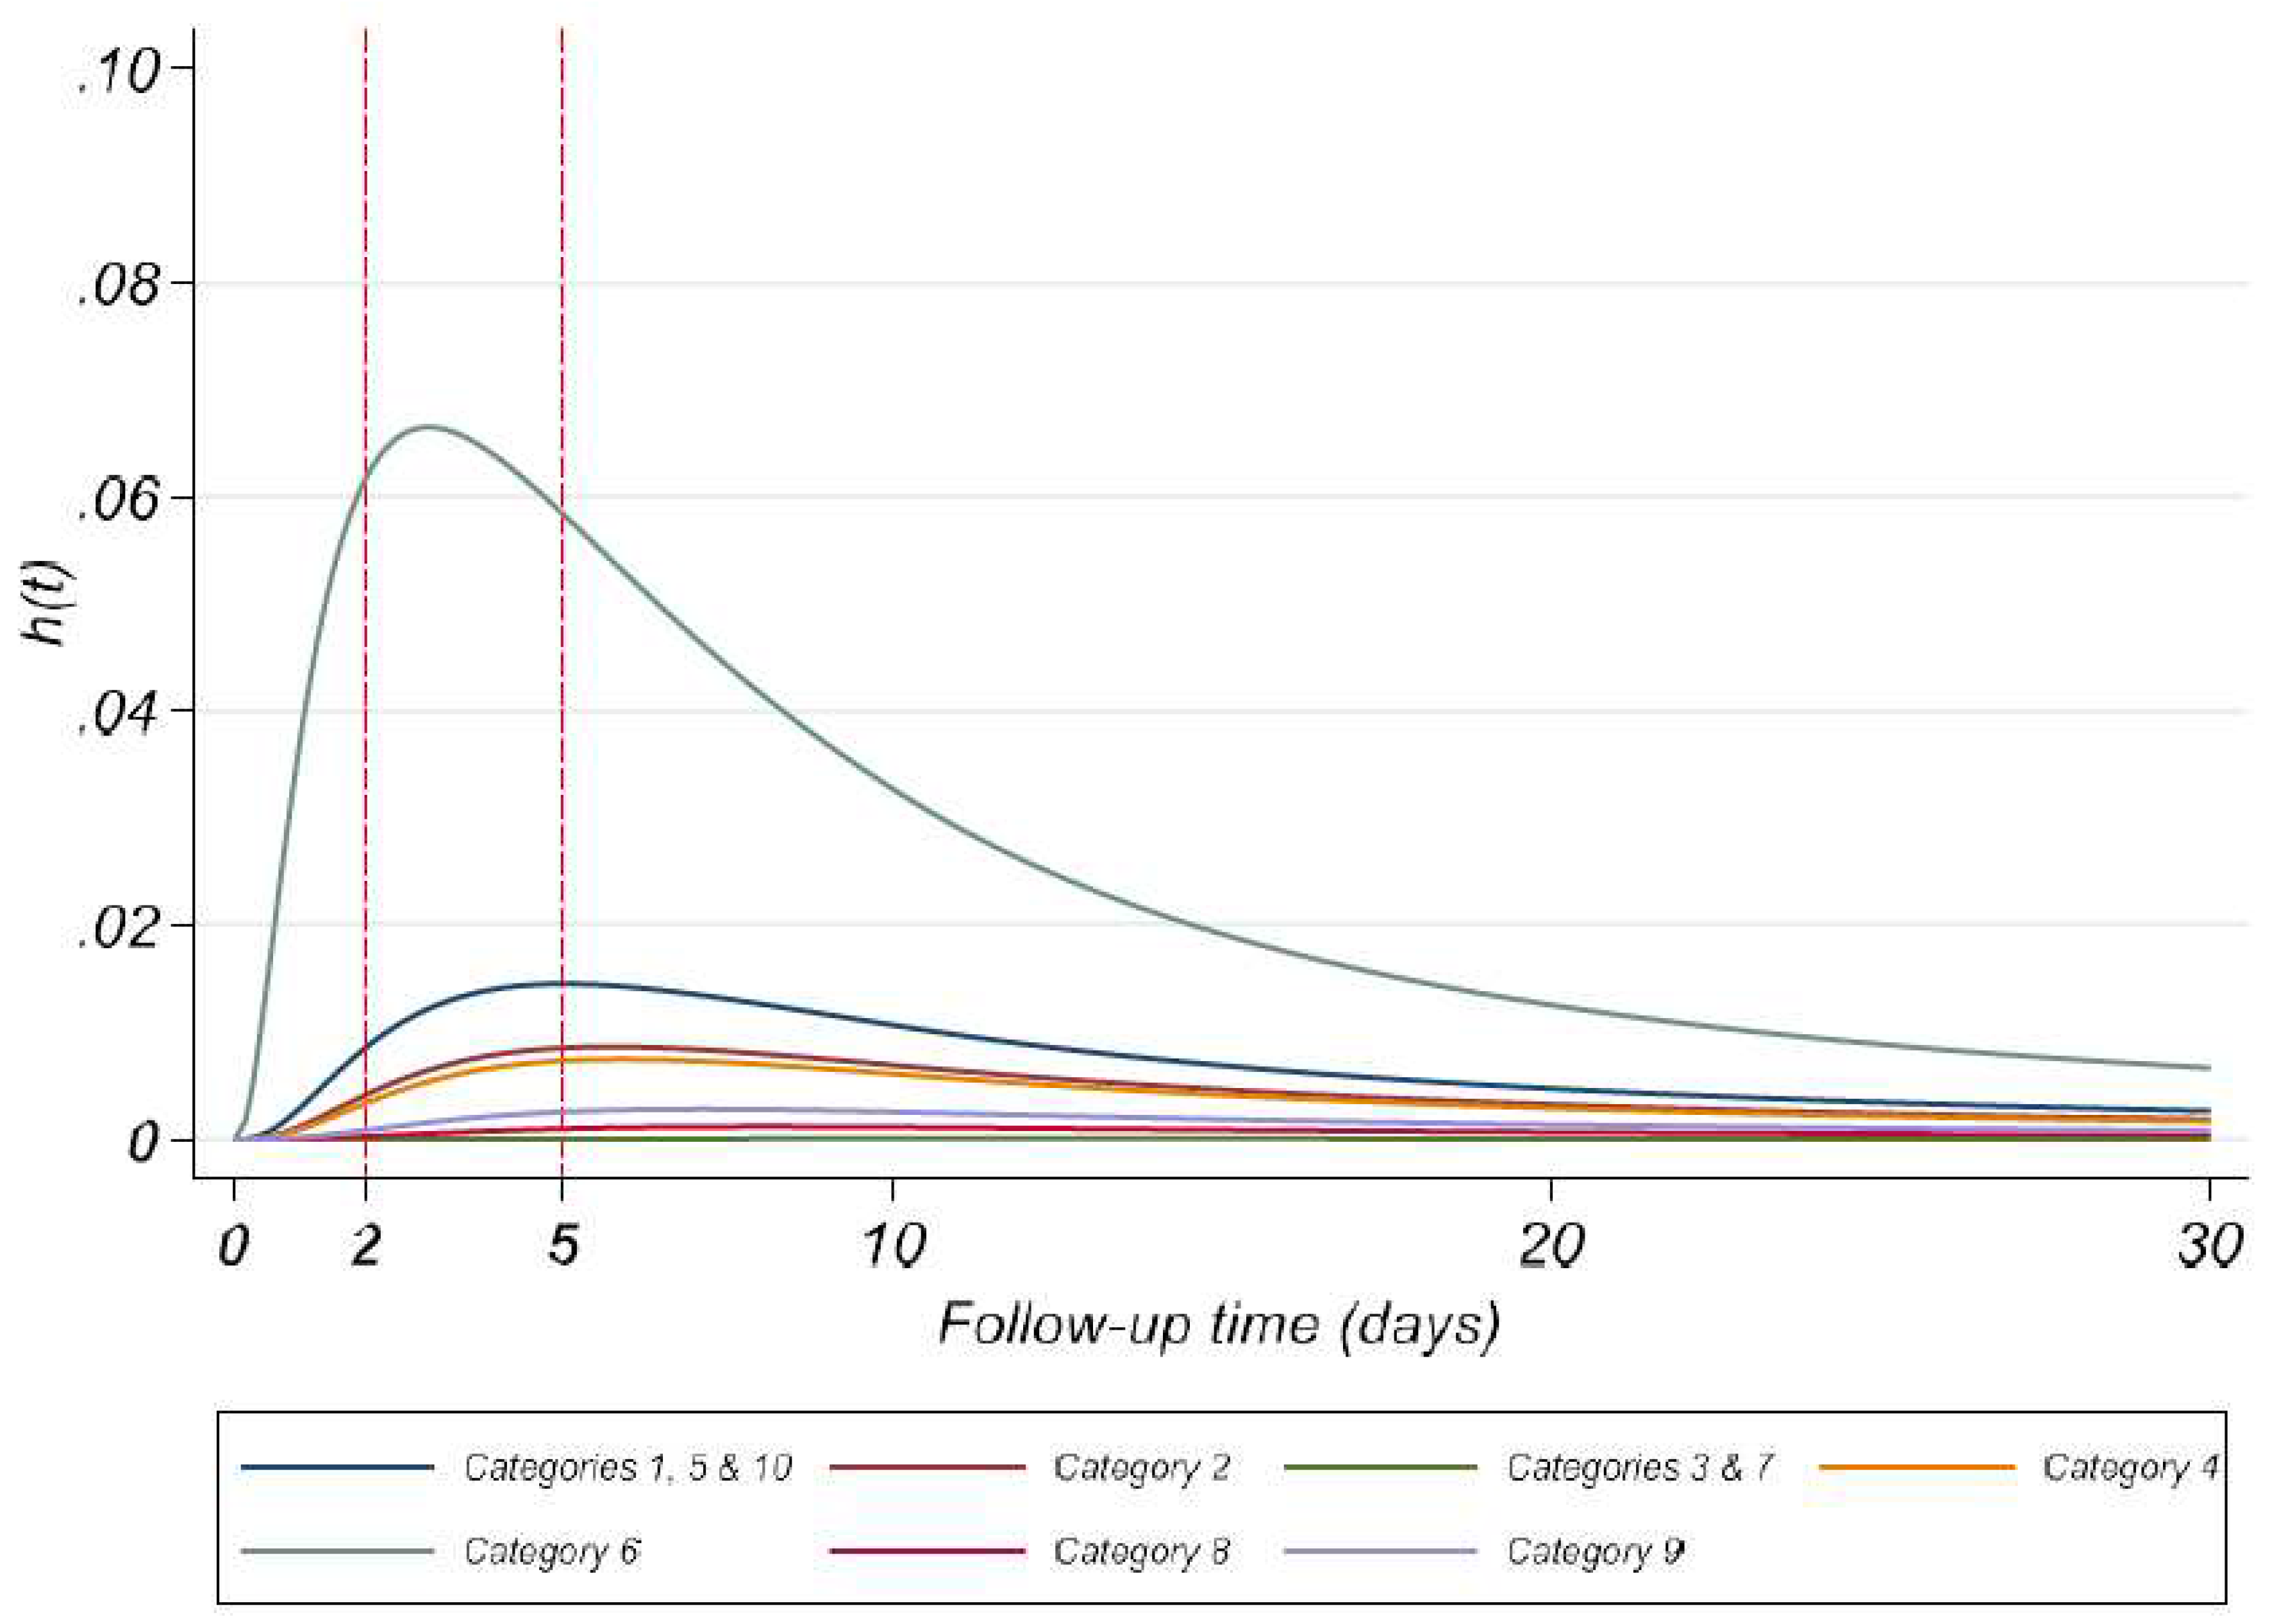
Figure A1.
Estimates of baseline hazard function for ACC-CHD categories – Model 2.
Figure A1.
Estimates of baseline hazard function for ACC-CHD categories – Model 2.
Figure A2.
8-year baseline hazard function in different ACC-CHD categories – Model 2.
Figure A2.
8-year baseline hazard function in different ACC-CHD categories – Model 2.
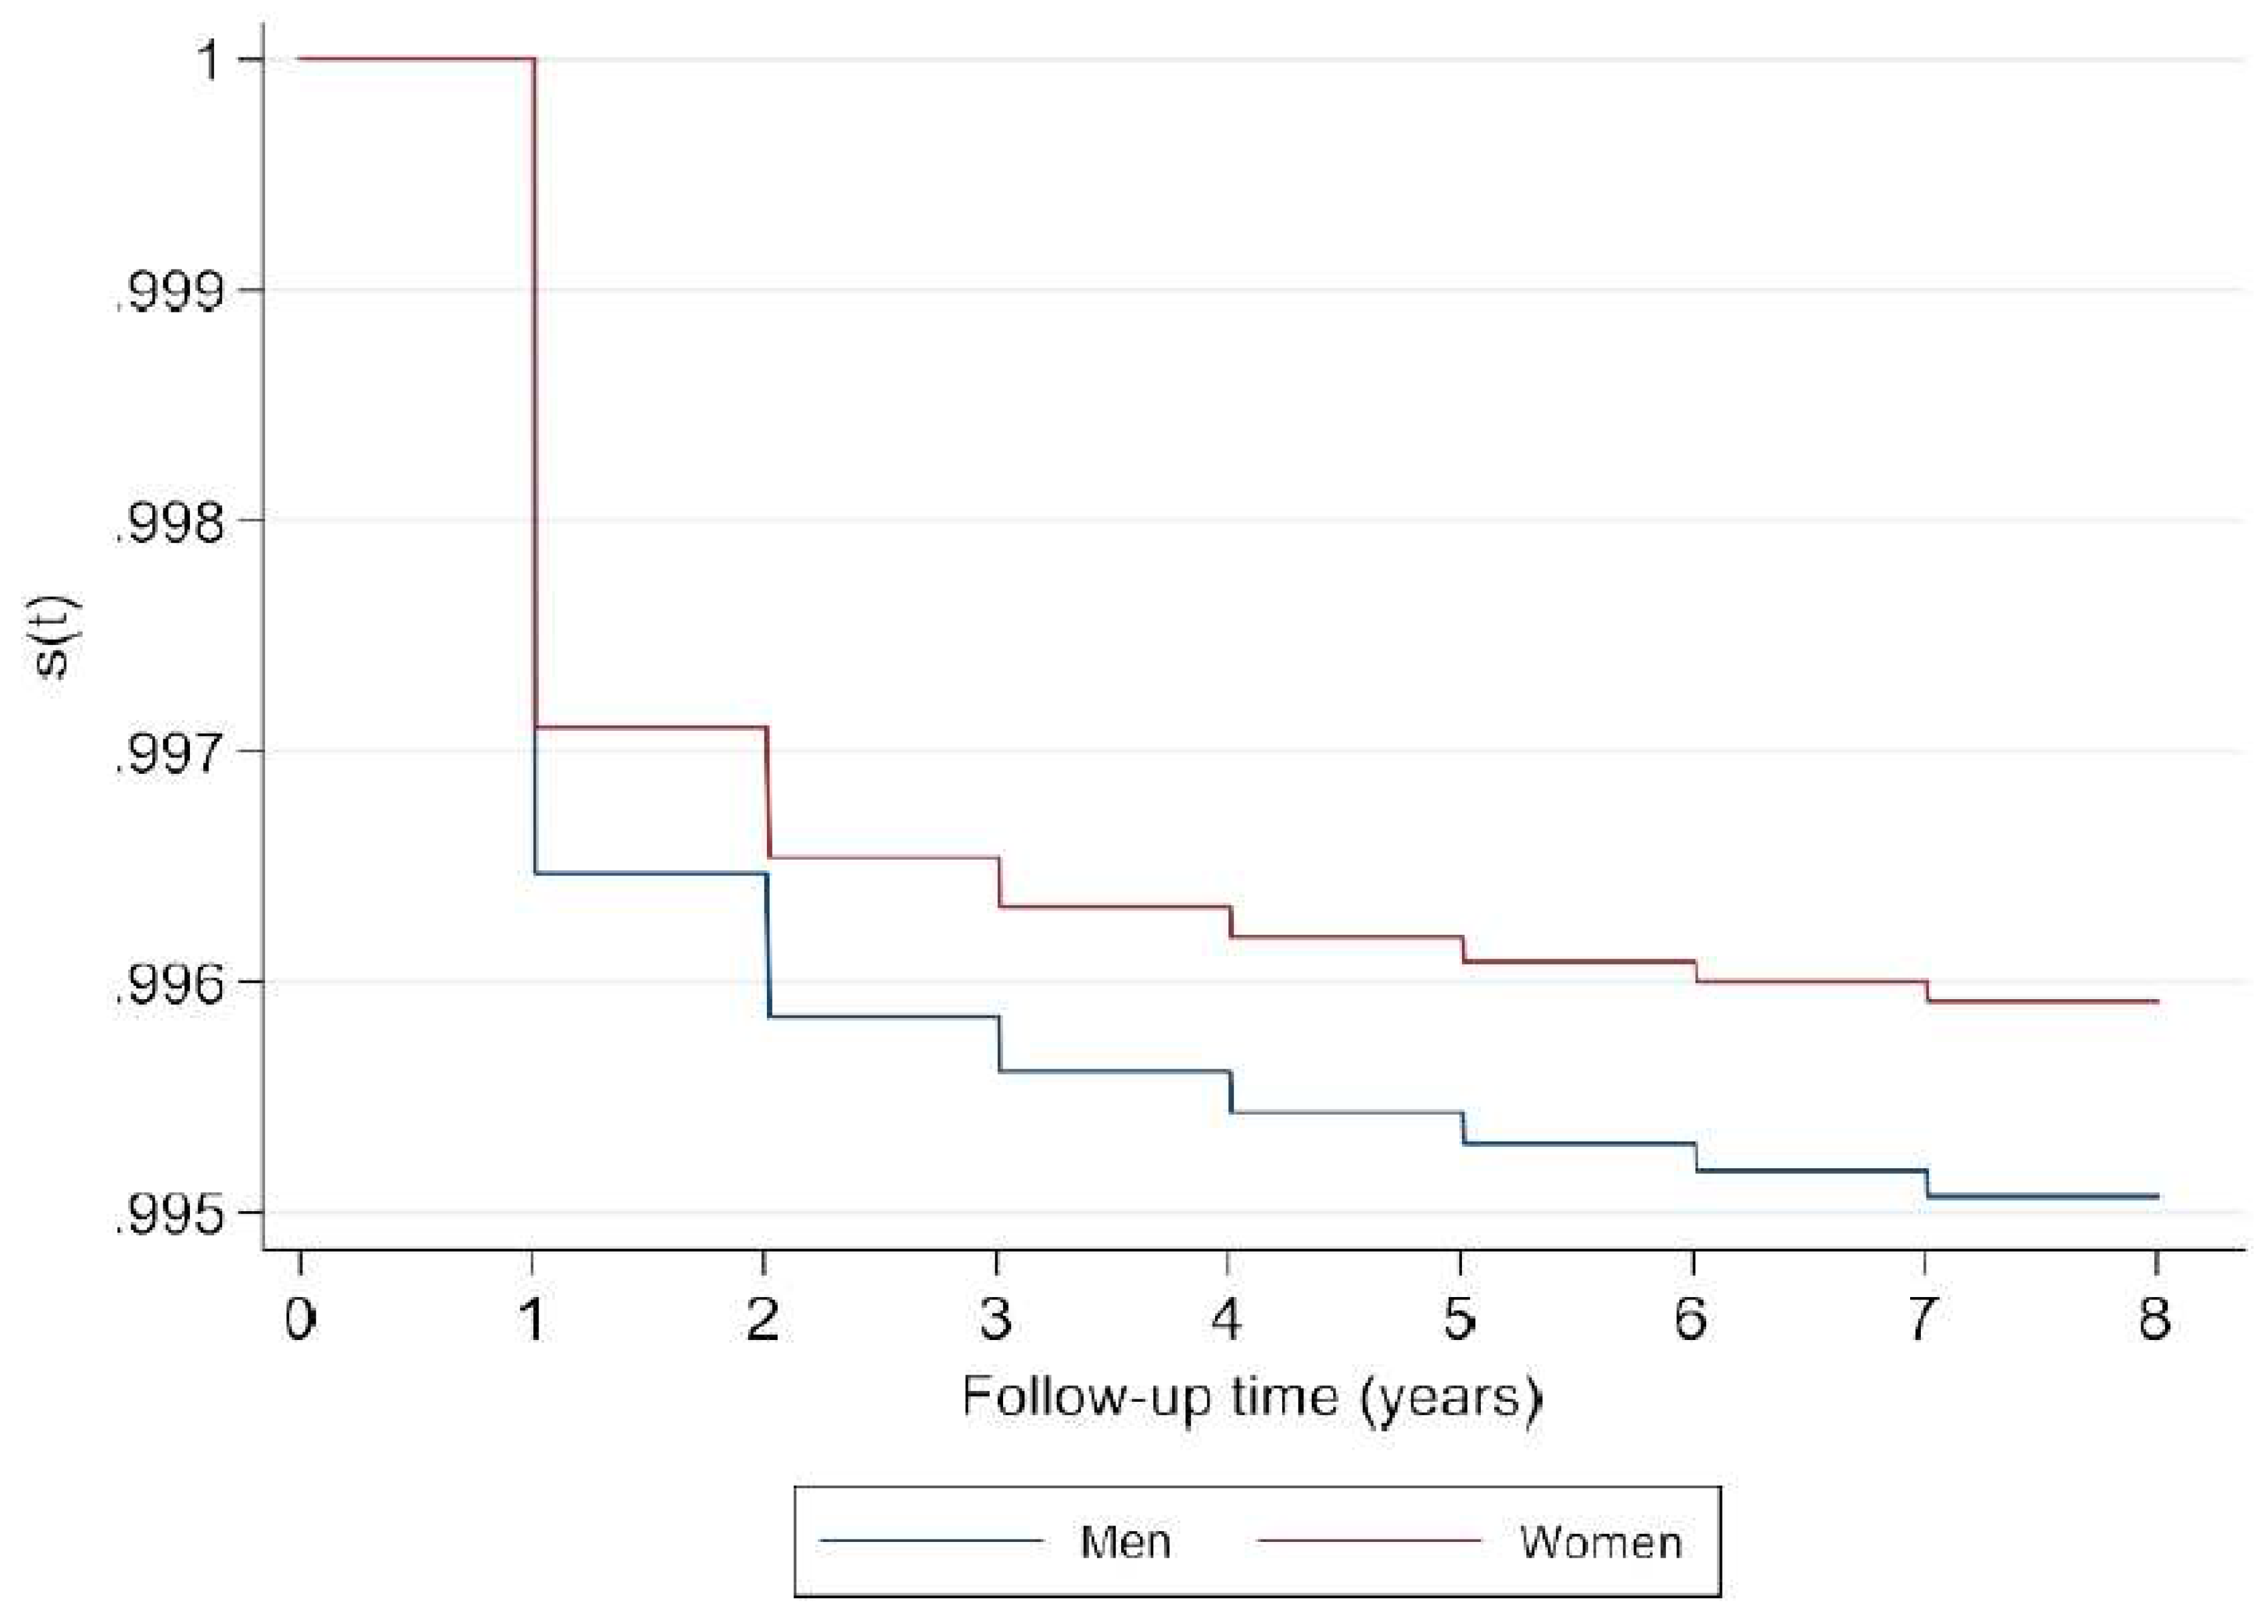
Figure A3.
Survival probability in men and women general popu.
Figure A3.
Survival probability in men and women general popu.
Figure A4.
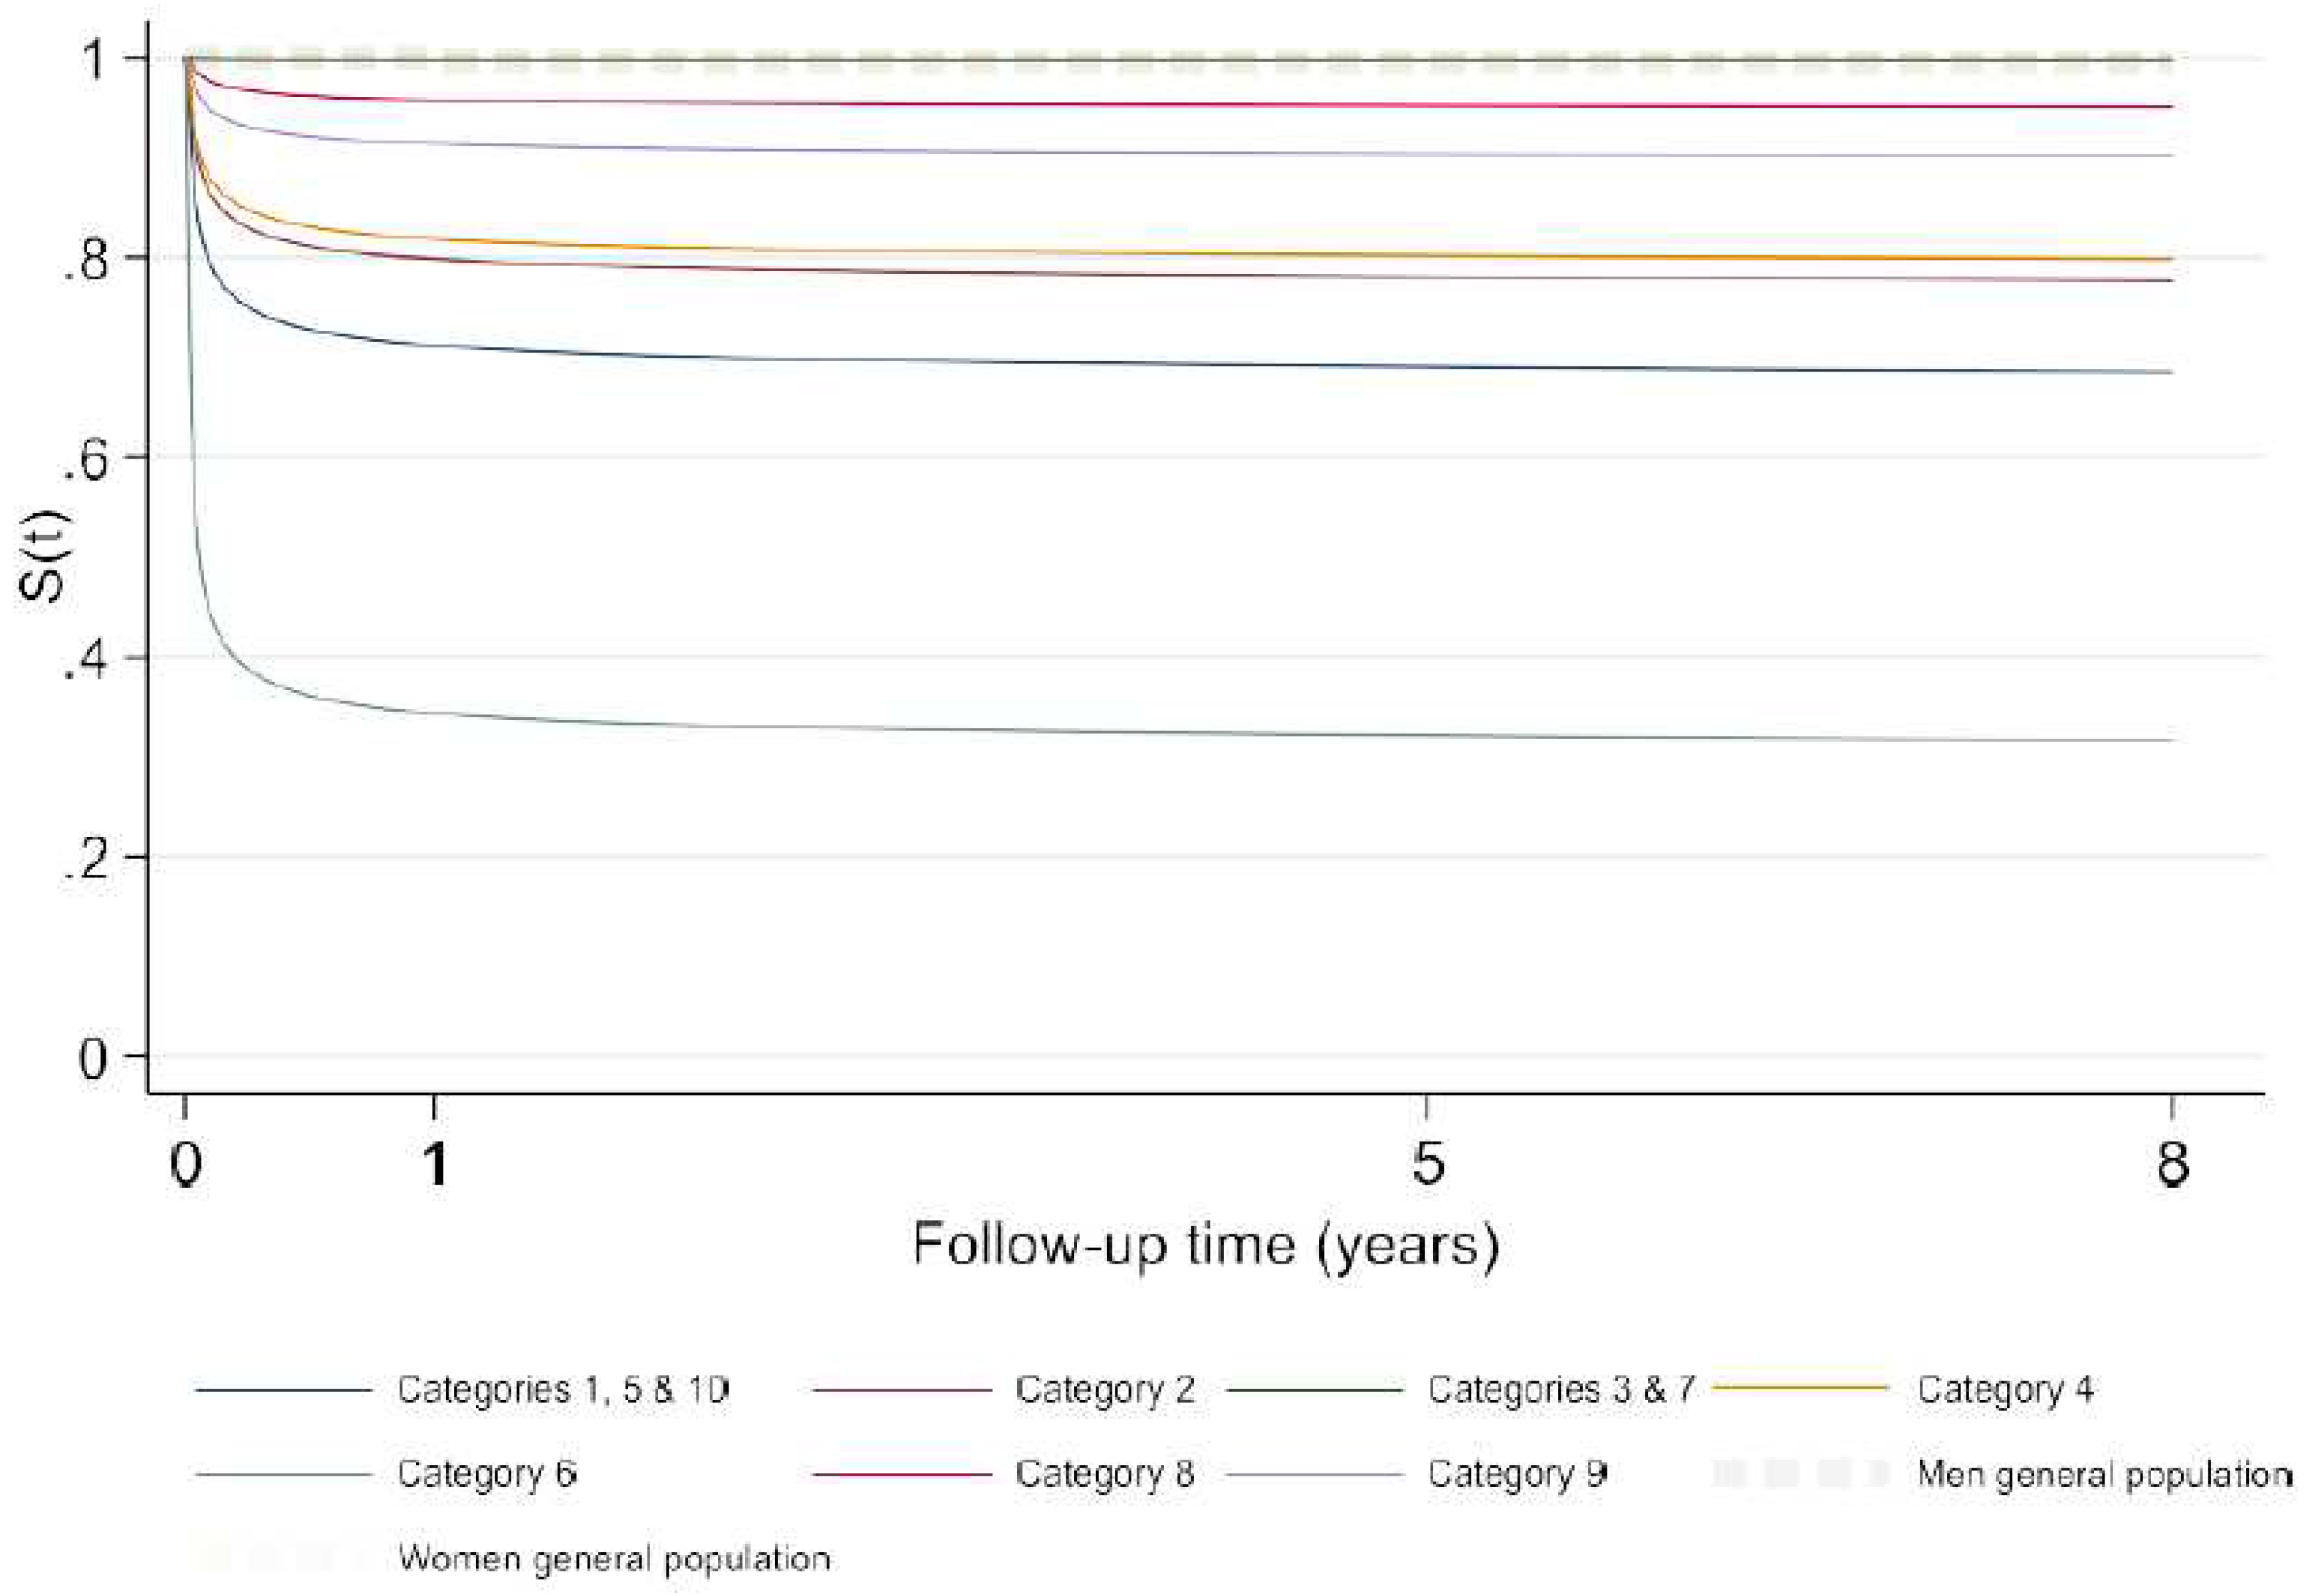
Comparison of survivor estimate of ACC-CHD categories with general population.
Figure A4.
Comparison of survivor estimate of ACC-CHD categories with general population.
Figure A5.
Comparison of survivor estimate of ACC-CHD merged categories 3 & 7 with men general population.
Figure A5.
Comparison of survivor estimate of ACC-CHD merged categories 3 & 7 with men general population.
Figure A6.
Comparison of survivor estimate of ACC-CHD merged categories 3 & 7 with women general population.
Figure A6.
Comparison of survivor estimate of ACC-CHD merged categories 3 & 7 with women general population.
References
- Zipes DP, Libby P, Bonow RO, Mann DL, Tomaselli GF, Braunwald E, editors. Braunwald’s heart disease: a textbook of cardiovascular medicine. Eleventh edition, international edition. Philadelphia, PA: Elsevier; 2019. 1944 p.
- Khoshnood B, Lelong N, Houyel L, Thieulin A-C, Jouannic J-M, Magnier S, et al. Prevalence, timing of diagnosis and mortality of newborns with congenital heart defects: a population-based study. Heart. 2012, 98, 1667–73. [Google Scholar] [CrossRef] [PubMed]
- Khoshnood B, Lelong N, Houyel L, Thieulin A-C, Jouannic J-M, Magnier S, et al. Prevalence, timing of diagnosis and mortality of newborns with congenital heart defects: a population-based study. Heart. 2012, 98, 1667–73. [Google Scholar] [CrossRef] [PubMed]
- Congenital heart defects [Internet]. nhlbi.nih.gov. Available from: https://www.nhlbi.nih.gov/health-topics/congenital-heart-defects.
- van der Bom T, Zomer AC, Zwinderman AH, Meijboom FJ, Bouma BJ, Mulder BJM. The changing epidemiology of congenital heart disease. Nat Rev Cardiol. 2011, 8, 50–60. [Google Scholar] [CrossRef] [PubMed]
- Razzaghi H, Oster M, Reefhuis J. Long-Term Outcomes in Children with Congenital Heart Disease: National Health Interview Survey. J Pediatr. 2015, 166, 119–124. [Google Scholar] [CrossRef] [PubMed]
- Liu Y, Chen S, Zühlke L, Black GC, Choy M, Li N, et al. Global birth prevalence of congenital heart defects 1970–2017: updated systematic review and meta-analysis of 260 studies. Int J Epidemiol. 2019, 48, 455–63. [Google Scholar] [CrossRef] [PubMed]
- van der Linde D, Konings EEM, Slager MA, Witsenburg M, Helbing WA, Takkenberg JJM, et al. Birth Prevalence of Congenital Heart Disease Worldwide. J Am Coll Cardiol. 2011, 58, 2241–7.
- Tararbit K, Bui TTT, Lelong N, Thieulin A-C, Goffinet F, Khoshnood B. Clinical and socioeconomic predictors of pregnancy termination for fetuses with congenital heart defects: a population-based evaluation: Pregnancy termination for fetuses with CHD. Prenat Diagn. 2013, 33, 179–86. [Google Scholar] [CrossRef] [PubMed]
- Blue GM, Kirk EP, Sholler GF, Harvey RP, Winlaw DS. Congenital heart disease: current knowledge about causes and inheritance. Med J Aust. 2012, 197, 155–9. [Google Scholar] [CrossRef] [PubMed]
- Jenkins KJ, Correa A, Feinstein JA, Botto L, Britt AE, Daniels SR, et al. Noninherited Risk Factors and Congenital Cardiovascular Defects: Current Knowledge: A Scientific Statement From the American Heart Association Council on Cardiovascular Disease in the Young: Endorsed by the American Academy of Pediatrics. Circulation. 2007, 115, 2995–3014. [Google Scholar] [CrossRef] [PubMed]
- Houyel L, Khoshnood B, Anderson RH, Lelong N, Thieulin A-C, Goffinet F, et al. Population-based evaluation of a suggested anatomic and clinical classification of congenital heart defects based on the International Paediatric and Congenital Cardiac Code. Orphanet J Rare Dis. 2011, 6, 64. [Google Scholar] [CrossRef] [PubMed]
- Kattan MW, Gönen M. The prediction philosophy in statistics. Urol Oncol Semin Orig Investig. 2008, 26, 316–9. [Google Scholar]
- Moons KGM, Royston P, Vergouwe Y, Grobbee DE, Altman DG. Prognosis and prognostic research: what, why, and how? BMJ. 2009, 338, b375–b375. [Google Scholar] [CrossRef] [PubMed]
- Royston P, Lambert PC. Flexible parametric survival analysis using Stata: beyond the Cox model. College Station, TX: Stata Press; 2011. 347 p.
- Peduzzi P, Concato J, Feinstein AR, Holford TR. Importance of events per independent variable in proportional hazards regression analysis. II. Accuracy and precision of regression estimates. J Clin Epidemiol. 1995, 48, 1503–10.
- Vittinghoff E, McCulloch CE. Relaxing the rule of ten events per variable in logistic and Cox regression. Am J Epidemiol. 2007, 165, 710–8. [Google Scholar] [CrossRef] [PubMed]
- Royston P, Moons KGM, Altman DG, Vergouwe Y. Prognosis and prognostic research: Developing a prognostic model. BMJ. 2009, 338, b604–b604. [Google Scholar] [CrossRef] [PubMed]
- Choodari-Oskooei B, Royston P, Parmar MKB. A simulation study of predictive ability measures in a survival model I: Explained variation measures. Stat Med. 2012, 31, 2627–43. [Google Scholar] [CrossRef] [PubMed]
- Altman DG, Vergouwe Y, Royston P, Moons KGM. Prognosis and prognostic research: validating a prognostic model. BMJ. 2009, 338, b605–b605. [Google Scholar] [CrossRef] [PubMed]
- Harrell FE, Lee K, Mark DB. Multivariable prognostic models: Issues in developing models, evaluating assumptions and adequacy, and measuring and reducing errors. Stat Med. 1996, 15, 361–87. [Google Scholar] [CrossRef]
- Tables de mortalité par niveau de vie [Internet]. INSEE. Available from: https://www.insee.fr/fr/statistiques/3311422?sommaire=3311425.
|
Disclaimer/Publisher’s Note: The statements, opinions and data contained in all publications are solely those of the individual author(s) and contributor(s) and not of MDPI and/or the editor(s). MDPI and/or the editor(s) disclaim responsibility for any injury to people or property resulting from any ideas, methods, instructions or products referred to in the content. |
© 2024 by the authors. Licensee MDPI, Basel, Switzerland. This article is an open access article distributed under the terms and conditions of the Creative Commons Attribution (CC BY) license (http://creativecommons.org/licenses/by/4.0/).
