Preprint
Article

Drought Resilience Indices of Norway Spruce Provenances Tested in Long-Term Common Garden Experiments in the Romanian Carpathians

Altmetrics

Downloads

141

Views

149

Comments

0

A peer-reviewed article of this preprint also exists.

Submitted:

12 January 2024

Posted:

12 January 2024

You are already at the latest version

Alerts
Abstract
Provenance trials provide a valuable opportunity to evaluate the impact of extreme events on growth and wood properties. In this study, we have evaluated 81 Norway spruce provenances, tested in three provenance trials established in the Romanian Carpathians in 1972. The response to drought of the Norway spruce provenances – resistance, recovery, resilience, and relative resilience, has been examined, as well as the relationship between climate and growth, and the correlations between wood traits, the coordinates of origin and drought resilience indices. In each provenance trial, there were significant differences between provenances and years regarding wood widths and latewood percentage (LWP). Regarding the drought extreme events, the years when it occurred in all three provenance trials were 2000 and 2003. Significant differences between provenances for at least one drought resilience index have been found in all provenance trials, for the year 2000. By using subperiods of 25 years, changes in the relationship between climate and growth have been observed. Several provenances with high radial growth and good resistance and/or recovery have been identified. Provenances that performed better in common garden experiments could be used in assisted migration even beyond the current natural range.
Keywords: 
Subject: Biology and Life Sciences  -   Forestry

1. Introduction

The 1.5˚C limit of global warming might be reached in the first half of 2030s [1]. As a result, severe and extreme weather events will become more frequent. Among them, drought and heat stress are considered to have the greatest adverse impact on forest ecosystems. Although it is considered that the forests have a large potential for climate change mitigation, droughts and other extreme weather events can threaten their growth, productivity, genetic diversity, and distribution [2,3,4,5,6]. Severe and long-lasting droughts are known to induce stress on crops and forest ecosystems and may lead to food insecurity [7].
In Europe, drought events caused significant impacts on forests, in the last decades, as the century passes [8]. Between 1987 and 2016, drought was the cause of excess forest mortality for almost half a million ha [9].
In Romania, from 1901, every decade had from one to four years with extreme droughts/rain events. The number of identified droughts has been increasing since 1981 [10]. Annual precipitations are expected to decrease, particularly in the southeastern part of the country [11]. Analysing the predictions made for Romania for the short term (2021-2050) and the long-term (2071-2100) versus 1971-2000, the eastern and north-eastern parts will have large changes in winter temperature, and the eastern and southern parts will have larger changes for the other seasons, more than 2 or 4 °C, for RCP4.5 and RCP8.5, respectively. Regarding precipitations, they are expected to increase, more in winter, in the central part of the country. At the same time, for the summer, a decline is seen in most cases, the most affected being the southeastern and southwestern areas [12].
With a distribution area of around 30 million ha, Norway spruce (Picea abies) is an economically important coniferous species in Europe. The vulnerability of Norway spruce to drought has been expressed in many studies [13,14]. It is highly sensitive to rising temperatures and water shortfall (Jansson et al., 2013), to declining water availability and has weak adaptive capacity at lower elevations [15,16]. Drought causes a decrease in its vitality [17], which leads to a lower resistance against bark beetles, especially Ips typographus [18]. Therefore the risk of mortality for Norway spruce and other native coniferous species might be greater with increased temperatures and decreased precipitation amounts, especially for populations that were established outside the natural range [19].
In Europe, according to RCP 8.5 projections, the frequency of droughts is projected to increase over the whole of Europe [8]. The Norway spruce might retreat in the Alps, the Carpathians and Scandinavia above 60° latitude, disappearing completely from Central European lowlands [20]. In Romania, the suitable area lost by Norway spruce until 2100 is estimated to be 8%, while the gained area is around 2% [21]. Mihai et al. [22] have revealed that the climate envelopes for the main forest species in Romania have already shifted to another ecosystem’s climate. Norway spruce will expand to higher altitudes but will significantly decrease in frequency and lose its habitat, particularly in the eastern Carpathians.
Forest species hold different adaptive capacity to mitigate the impacts of climate change. The resilience to drought is a trait with environmental and genetic components, and different populations of the same species might respond differently to the same climate [23]. Recent studies have shown that there is a genetic variation in sensitivity/tolerance of forest species against drought events, both within and among populations [24,25,26,27]. Using genome analyses significant associations were found between SNPs and traits related to drought adaptation for Norway spruce [28].
Therefore, an approach to ensure genetic adaptation of forest species to the negative impacts of drought is to select the most resilient provenances [24,29]. Maintaining and increasing resilience of the forest ecosystems is the most effective forest management in the face of environmental changes.
By testing different provenances in homogenous conditions, the most valuable and adapted provenances can be selected. The field tests, such as provenance trials, provide a valuable opportunity to evaluate the impact of extreme events on growth and wood properties.
This study aimed to assess growth response and adaptive capacity of Norway spruce provenances originated from thirteen European countries to extreme drought events which have occurred in this region, in the last 49 years. The objectives were to (i) determine the genetic variation of wood traits among the Norway spruce provenances, (ii) evaluate the response to drought of the Norway spruce provenances, (iii) determine the relationship between climate and growth, (iv) compute correlations between wood traits, the coordinates of origin and drought resilience indices, and (v) provide information for the implementation of the sustainable forest management and the forest genetic resources conservation.
This study will improve knowledge regarding the adaptive capacity of Norway spruce populations of different geographical origins to cumulative effects of drought and heat stress associated with climate change.

2. Materials and Methods

The three provenance trials, Dorna Candrenilor, Zarnesti and Turda, analysed in this study, are located in Eastern, Southern and Western Romanian Carpathians, respectively. The Zarnesti provenance trial is located in the mixed beech and coniferous species zone, while Dorna Candrenilor and Turda are in the Norway spruce vegetation zone. The climate conditions are continental with Scandinavian-Baltic influences in the north (Dorna Candrenilor), and temperate-continental with oceanic influence in the west (Turda) and central parts (Zarnesti) [30]. The three Norway spruce provenance trials were established in 1972 [31]. Eighty-one provenances were tested in these trials, ten from Romania and the rest from twelve other European countries (Figure 1). The geographic coordinates and details about the tested provenances were presented in Supplementary Table S1.
Provenances were planted in a randomized complete block design, each plot with 16 (4 × 4) individuals per provenance at 2 × 2 m spacing and three blocks. No thinning or artificial pruning was made in these provenance trials.
The wood cores were extracted in the fall of 2020. Four trees were randomly selected for each provenance in each repetition. With the Haglöf borer, one core/tree was extracted at breast height, on the slope line, to avoid compression and tension wood.
The cores were then dried and progressively sanded. For good quality of the image (1200 dpi), an Epson Expression 12000XL scanner was used. Ring width (RW), earlywood (EW) and latewood (LW) were measured with the CooRecorder software [32]. Latewood percentage (LWP) was calculated as the ratio between LW and RW. For each trial, the series were checked and cross-dated using the detrendeR [33] and dplR [34] packages in the R free software environment [35]. Dendrochronological series with intercorrelation values below 0.328 were excluded from the analysis. The final number of wood cores was 2709: 947 for Dorna Candrenilor, 906 for Zarnesti and 856 for the Turda trial.
By detrending, the tree’s natural biological growth trend is estimated and removed, to produce the dimensionless ring-width index (RWI). In this study, the spline method/approach has been used, where the frequency response is 0.50 at a wavelength of 0.67 × “series length in years”.
Climatic data for the period 1972-2020 were obtained using the Climate Downscaling Tool (ClimateDT) [36], at the resolution of 1 km. For the period 1961-1990, it uses a high-resolution grid as the baseline, while for the historical period, it uses monthly anomalies derived from Climatic Research Unit gridded Time Series (CRU-TS) [37]. For future scenarios, UKCP18 surfaces [38] are being used. Except for the minimum and maximum monthly temperatures, all other climatic variables were used to evaluate the relation between climate and growth.
To determine the years with meteorological droughts, the Standardised Precipitation Evaporation Index (SPEI) [39] was calculated based on precipitation and the potential evapotranspiration (PET) for the 1972-2020 period, using the SPEI R package [40]. The Thornthwaite equation [41] was used for calculating PET, and it can be computed only with temperature data. Using SPEI at a time scale of 3 months (SPEI-3), the drought years that recorded values below -1 were classified as follows: from -1 to -1.49: moderate drought; from -1.5 to -1.99: severe drought; less than -2: extreme drought.
The response to drought events was evaluated using the drought resilience indices: resistance (Res), recovery (Rec), resilience (Rsl) and relative resilience (relRsl) [42].
Resistance indicates the reversal of the decrease in radial growth during the drought. It is the ratio of RW during the drought (Dr) and before the drought (preDr). Values above 1 indicate high tolerance, while values below 1 low tolerance. Recovery indicates the capacity to revitalize after a drought. It is the ratio of the RW after the drought (postDR) and RW during drought. Resilience indicates the capability of reaching pre-drought RW after a drought event. It is the ratio of RW after drought and RW before the drought. Values below 1 indicate long-term growth reductions. Relative resilience was calculated using the formula: relRsl = (postDr – Dr)/preDr. It is the resilience accounting for the impact that the drought year had. Before and after RW were calculated as average values for a period of three years before or after a year with a drought event.

2.2. Statistical Analysis

The Pearson coefficients were used to assess the correlations between the geographical gradients of the provenances’ origin and the wood traits and mean drought resilience indices, to examine the degree of which trait variation is influenced by the local adaptation to climatic conditions from the origin location.
The response and correlation function analysis from treeclim R package [43] was used to assess the non-stationarity of climate-growth correlations in each provenance trial. The non-stationarity was defined as a modification in the relationship's magnitude or direction between variables over time [44]. The climatic variables used for this analysis were monthly values of temperature and precipitation from each year, from March to September (growing season), for the 1981-2020 interval. Subperiods of 25 years, each following one starting at a year later, were analysed, resulting in 16 subperiods.
The response functions were developed for RWI and LWP, respectively, using the climate data from each provenance trial location, to account for the climate impact of the trial sites on the provenances’ performance. By using the caret R package [45], an intercept-only model was first defined. Then a forward stepwise regression was performed with all predictors. After identifying the most significant predictors, several quadratic models were modelled and the best ones were selected based on the adjusted R2 coefficient, because the quadratic model approach was considered more befitting [46,47,48].
The analysis for the genetic variation of each trait, wood traits and drought resilience indices was performed for each trial site, considering that droughts and post-drought effects vary between ecoregions [49]. Using the lmerTest R package [50], a mixed linear model was applied and tested, where provenance and year x provenance were considered random effects and block as a fixed effect.
Xijk = μ + Pj + Bk +Yl + Pj × Yl + ejklm,
where μ is the general mean, Pj is the effect of the jth provenance, Bk is the effect of the kth block, Yl is the effect of the lth year, Pj × Yl is the provenance-by-year interaction and ejklm is the error term associated with jklm trees [51].

3. Results

3.1. Drought years identification

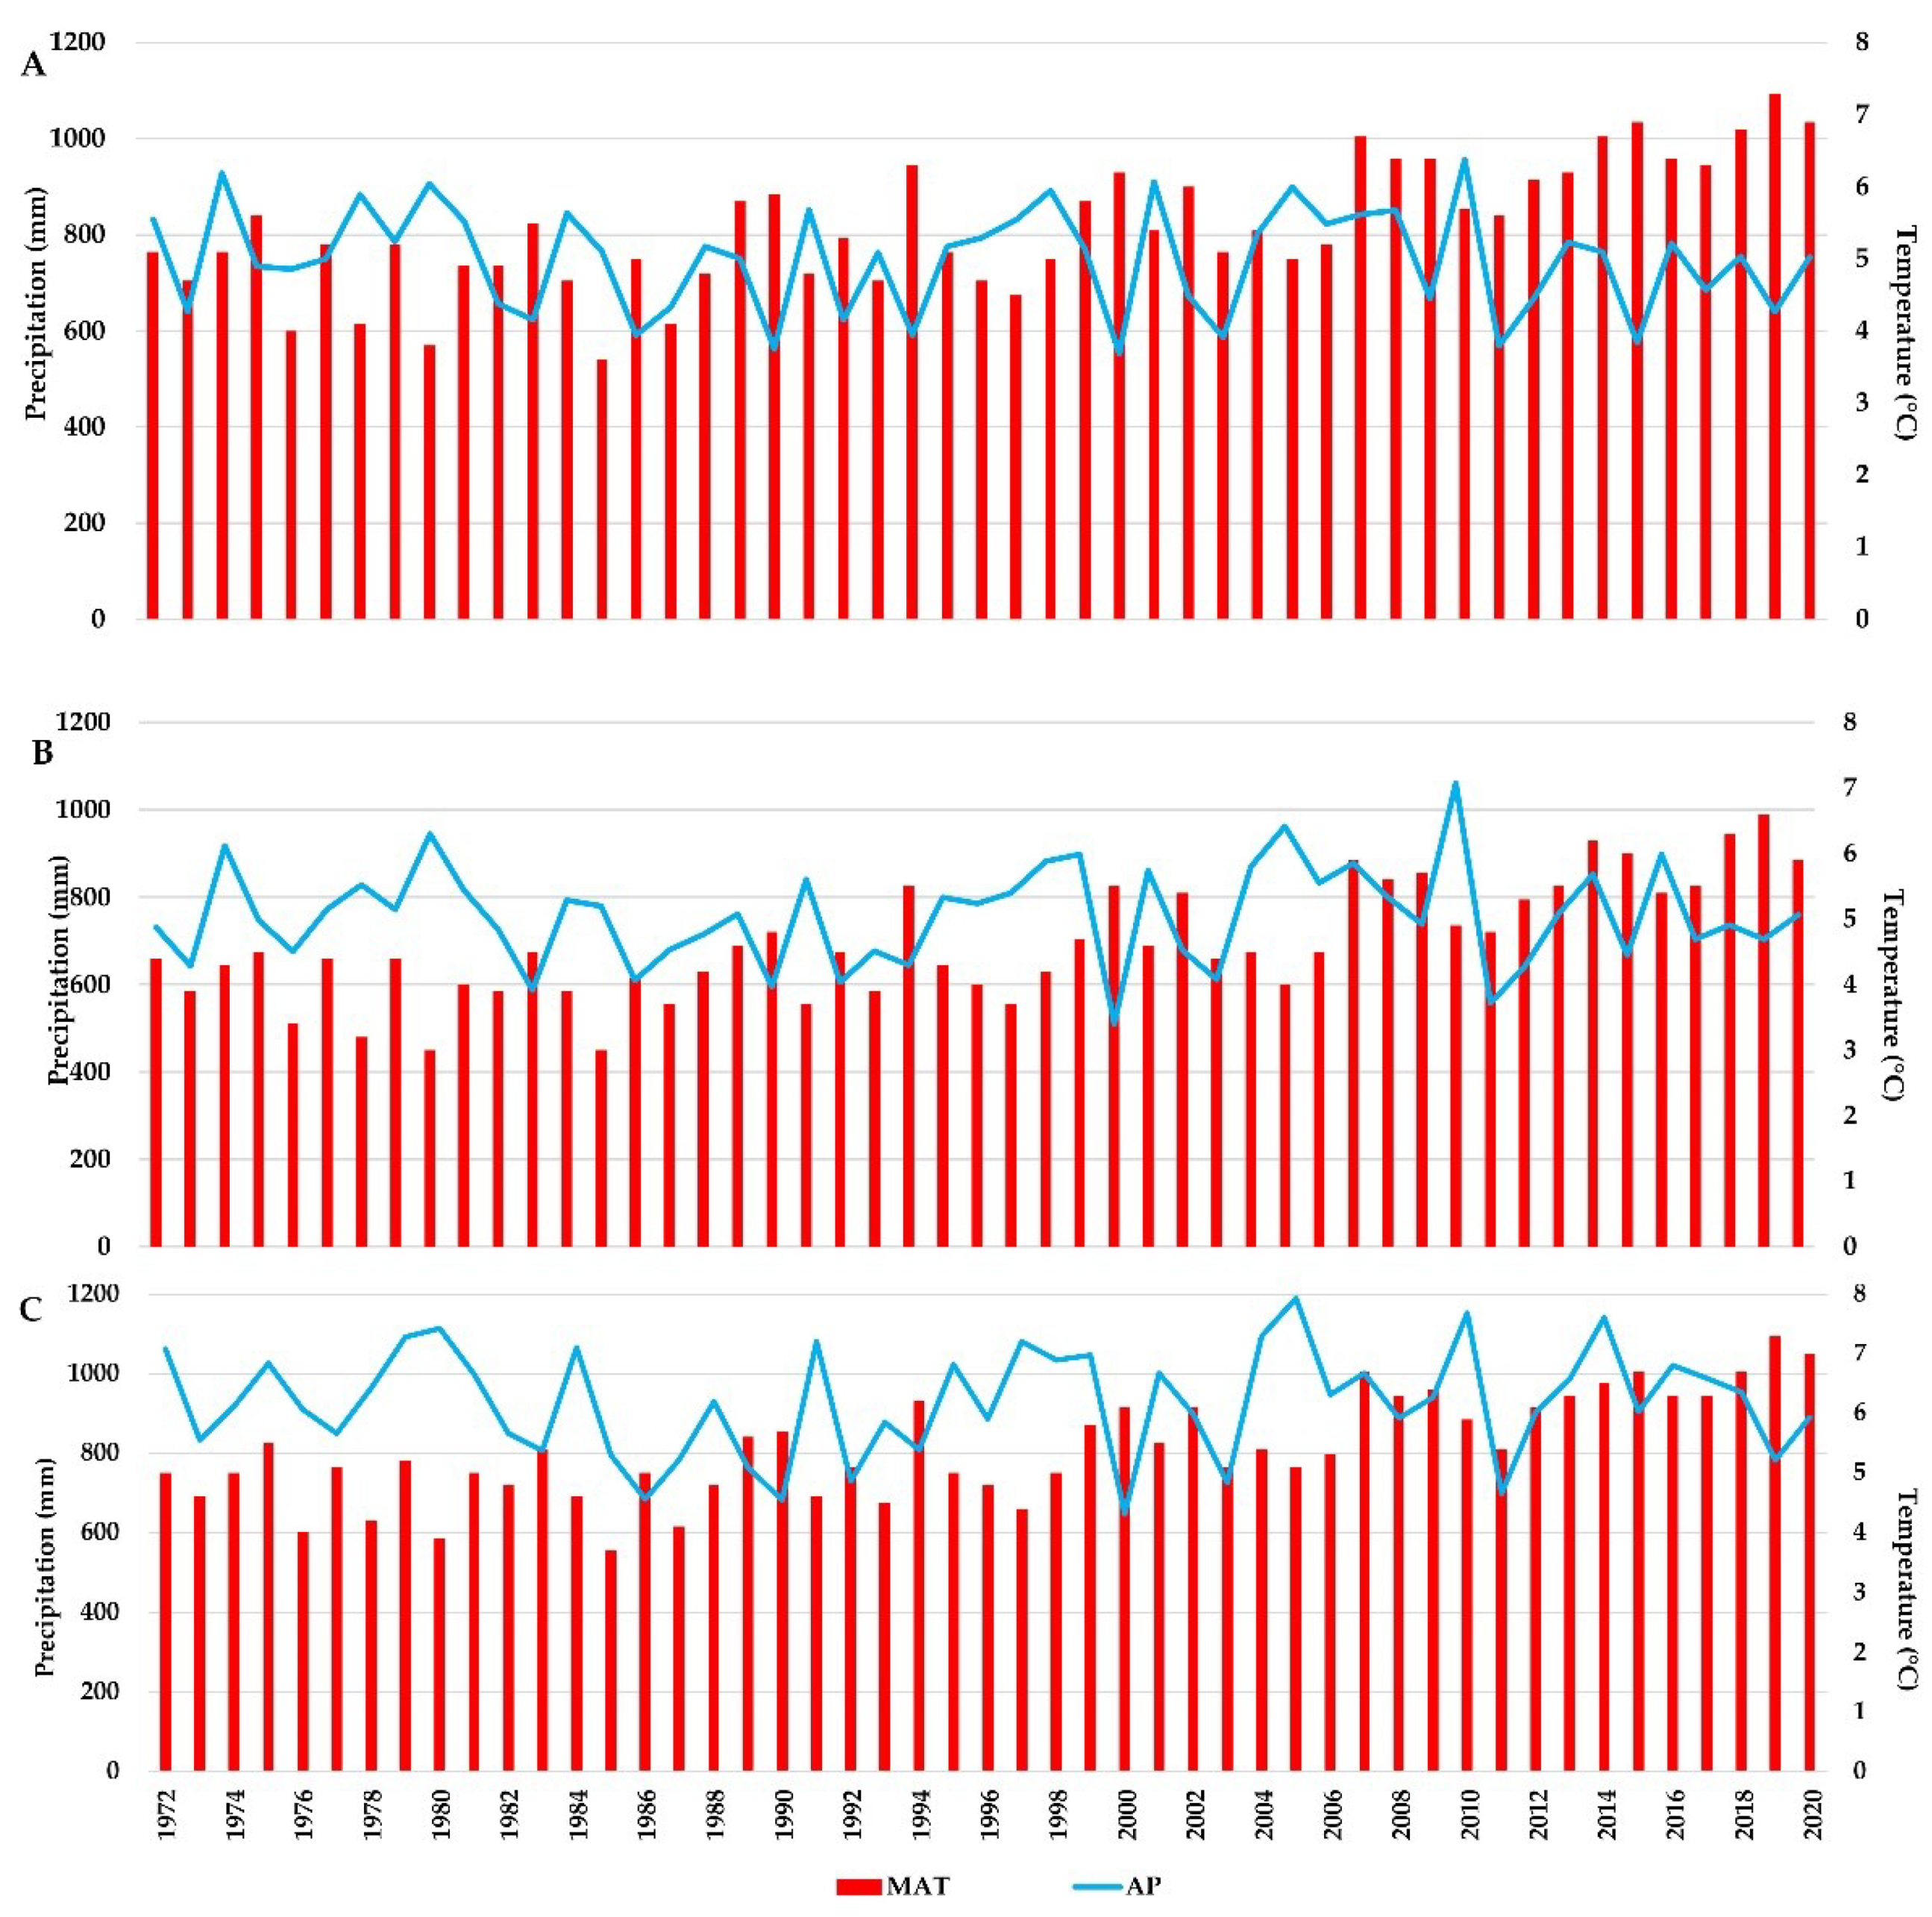
In each study site, large variations of annual mean temperature and annual precipitation amount were recorded (Figure 2). The year 2000 had the lowest amount of precipitation for the analysed period in all three sites, ranging from 511 mm at the Turda trial, to 646 mm at the Zarnesti trial. The highest MAT was recorded for the year 2019, in all three trials, with values ranging from 6.6 °C at the Turda trial, to 7.3 °C at Dorna Candrenilor and Zarnesti trials, respectively.
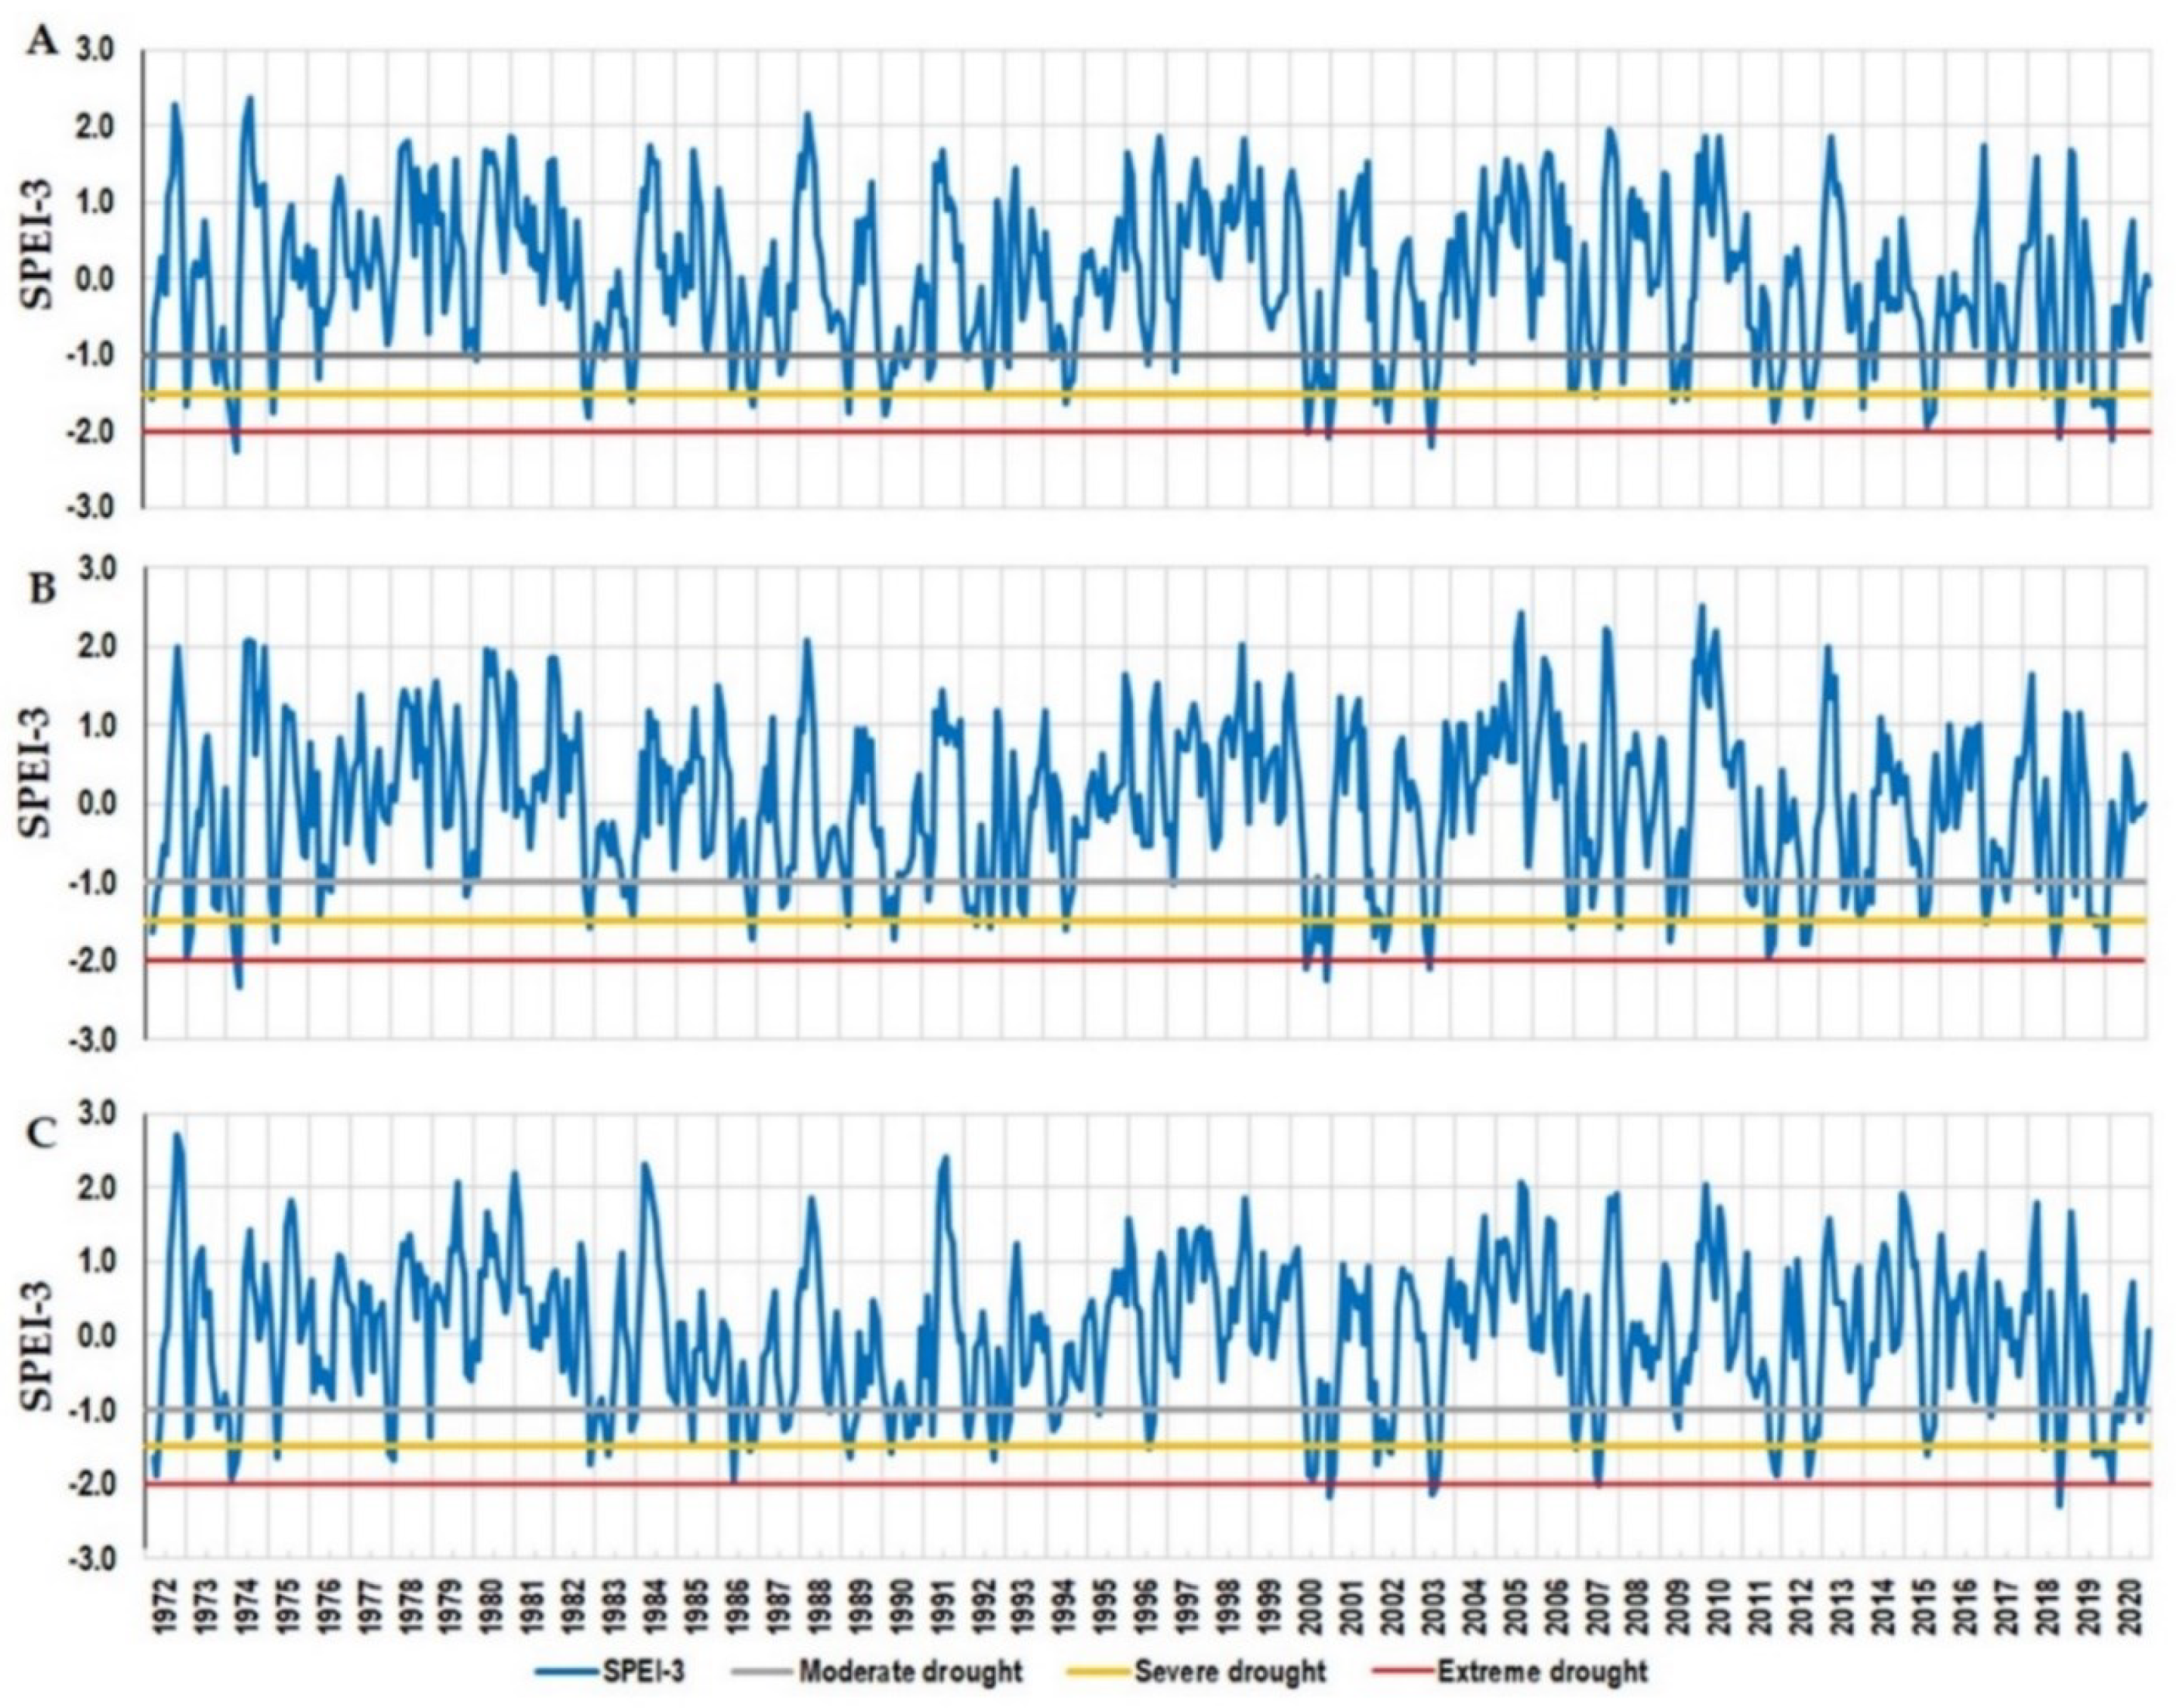
For the period 1972-2020, moderate, severe, and extreme drought years were identified based on the SPEI-3 values (Figure 3). 23 years with severe and extreme droughts have been identified for the analysed period in Dorna Candrenilor and Turda trials, while for Zarnesti, the number was 24.
The number of years with extreme drought has varied among sites and ranged between three at the Turda trial to five at the Dorna Candrenilor trial (Table 1). The years when extreme drought occurred in all three provenance trials were 2000 and 2003.

3.1. Norway spruce series

For the analysed period, the mean RW ranged from 2.54 mm, at the Zarnesti trial, to 2.77 mm, at the Turda trial.
The mean series intercorrelation (rbar) was calculated for each provenance trial. It is the mean correlation coefficient among tree-ring series, and it ranged between 0.876 to 0.908 (Table 2).

3.1. The effect of provenance and year on radial width and latewood percentage

In each provenance trial, there were significant differences between provenances and years regarding wood widths and LWP (Table 3). The block effect was significant for all traits, except RW at the Turda trial. Regarding year x provenance interaction, it was significant for RW and EW at the Zarnesti trial, and for RW, EW and LWP at the Dorna Candrenilor trial.
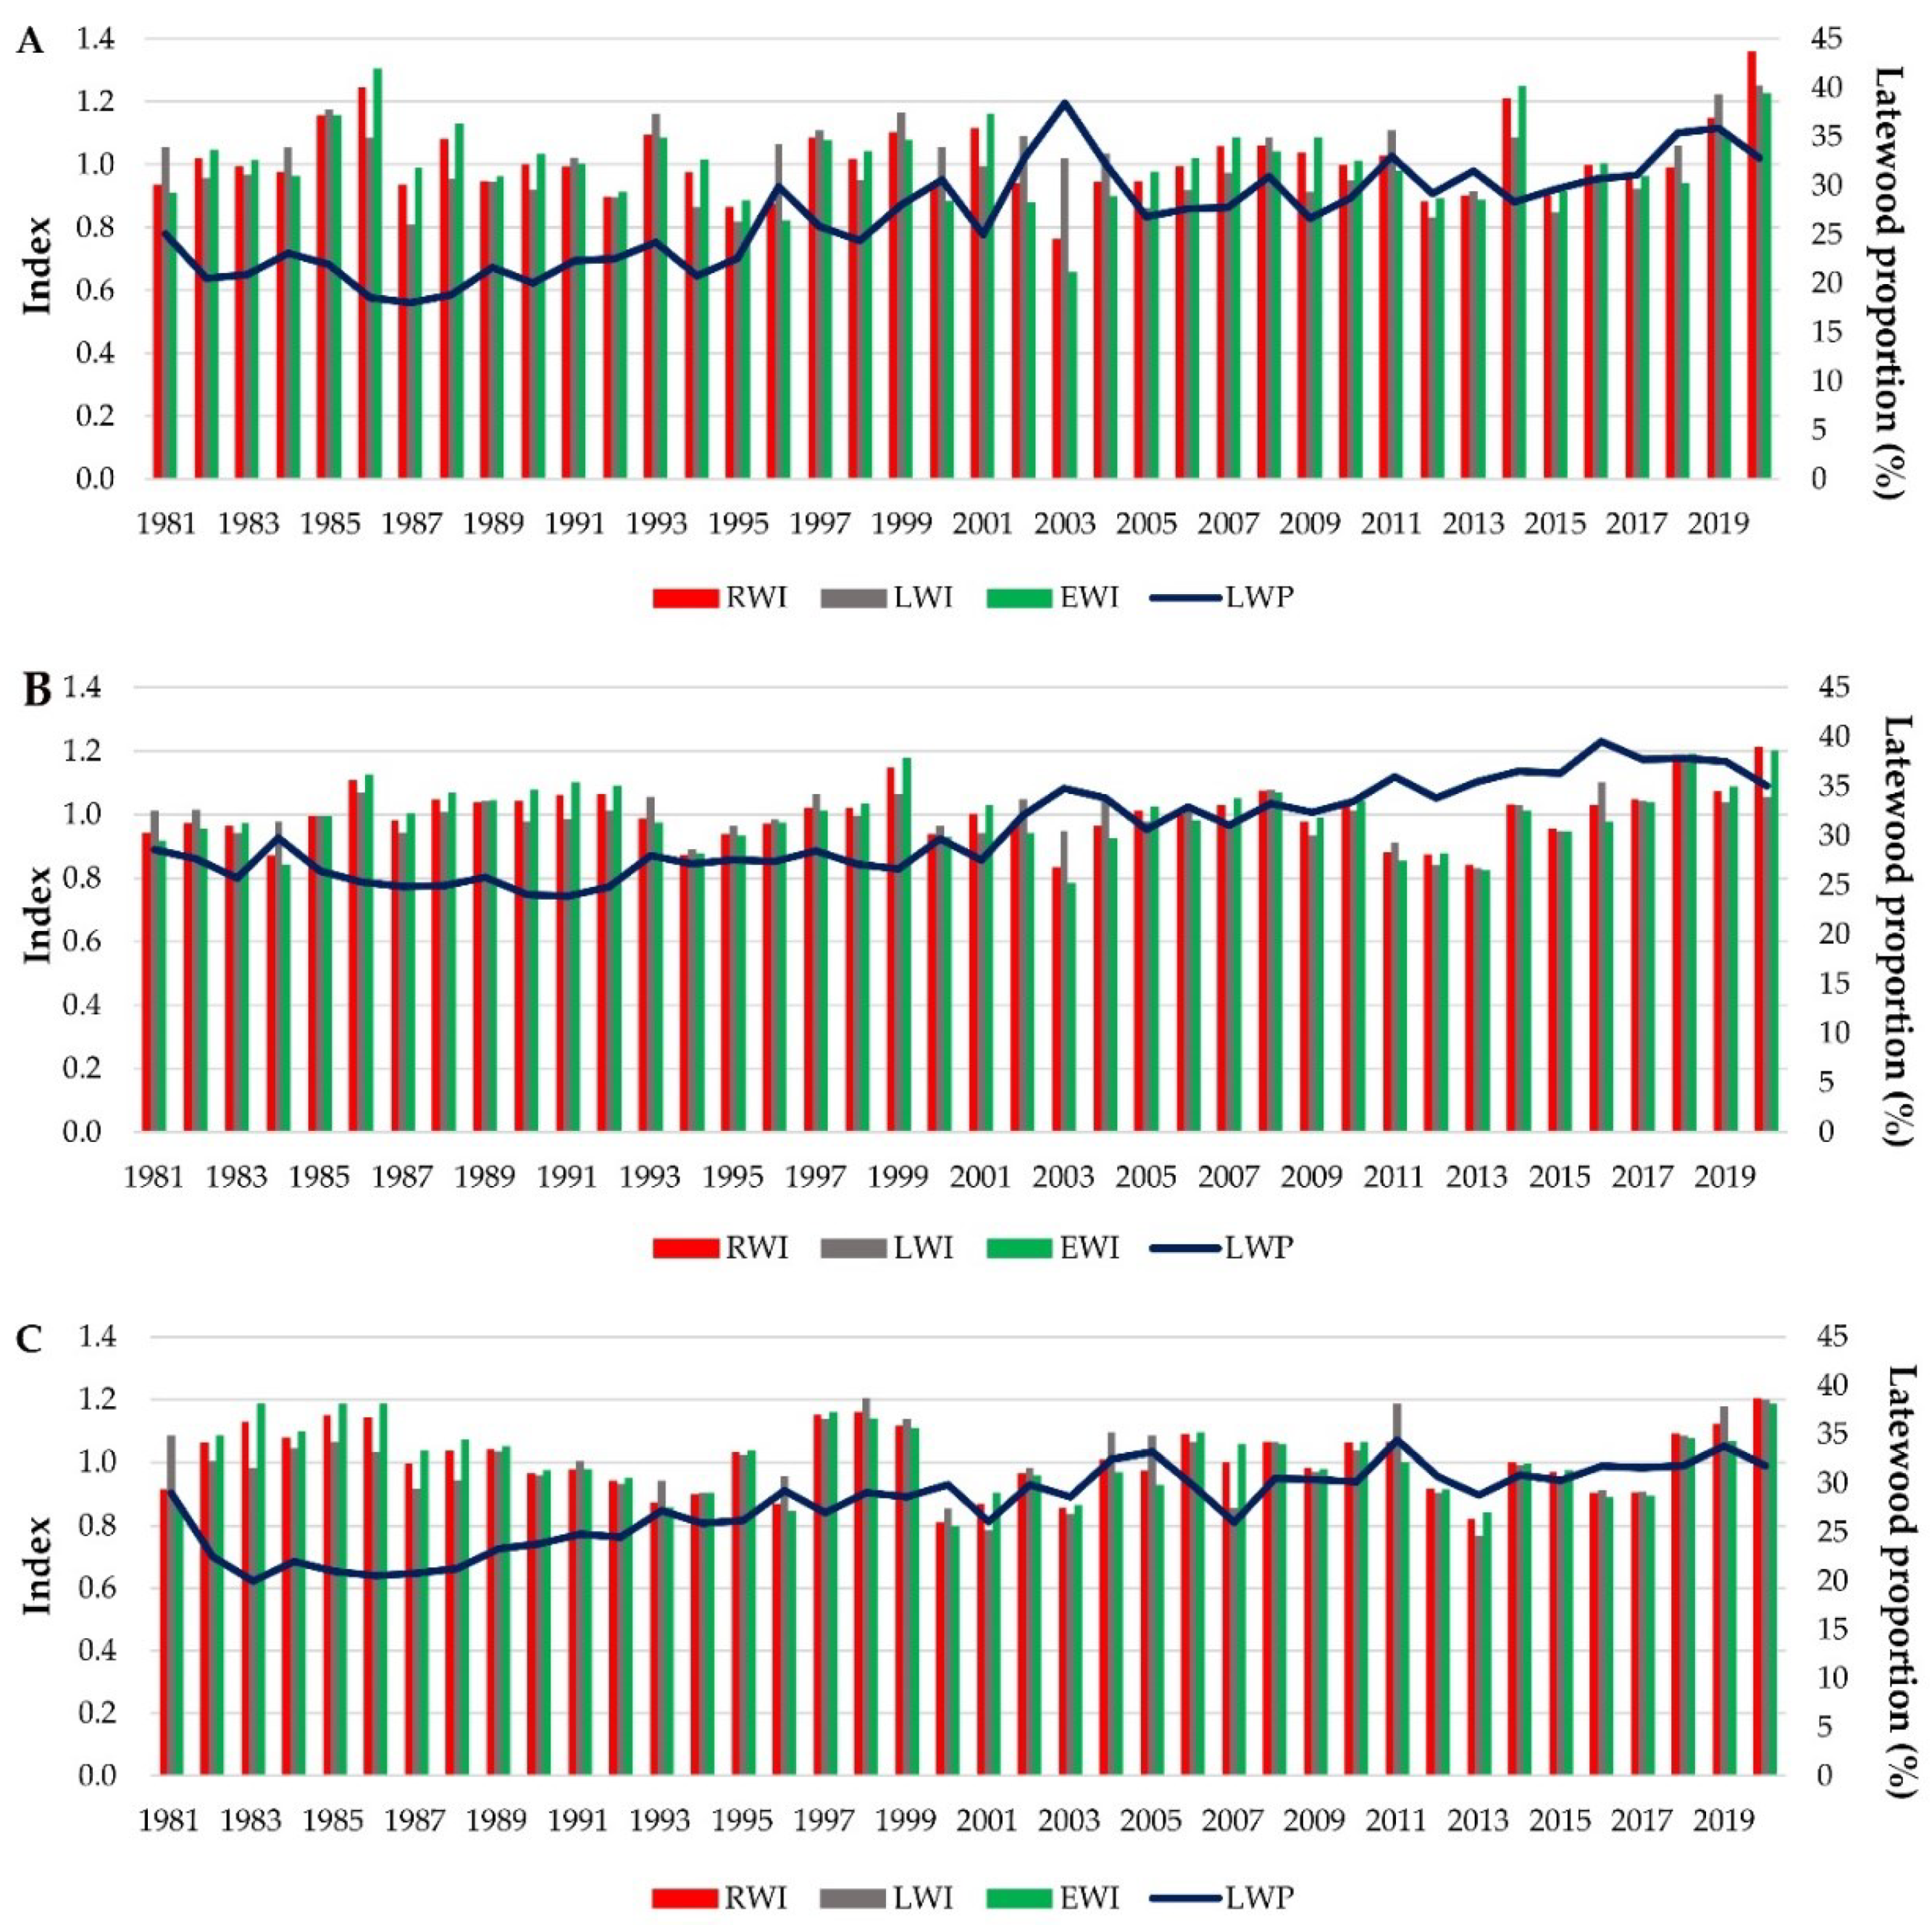
The wood traits variation for each provenance trial can be seen in Figure 4.

3.1. Genetic variation in drought response

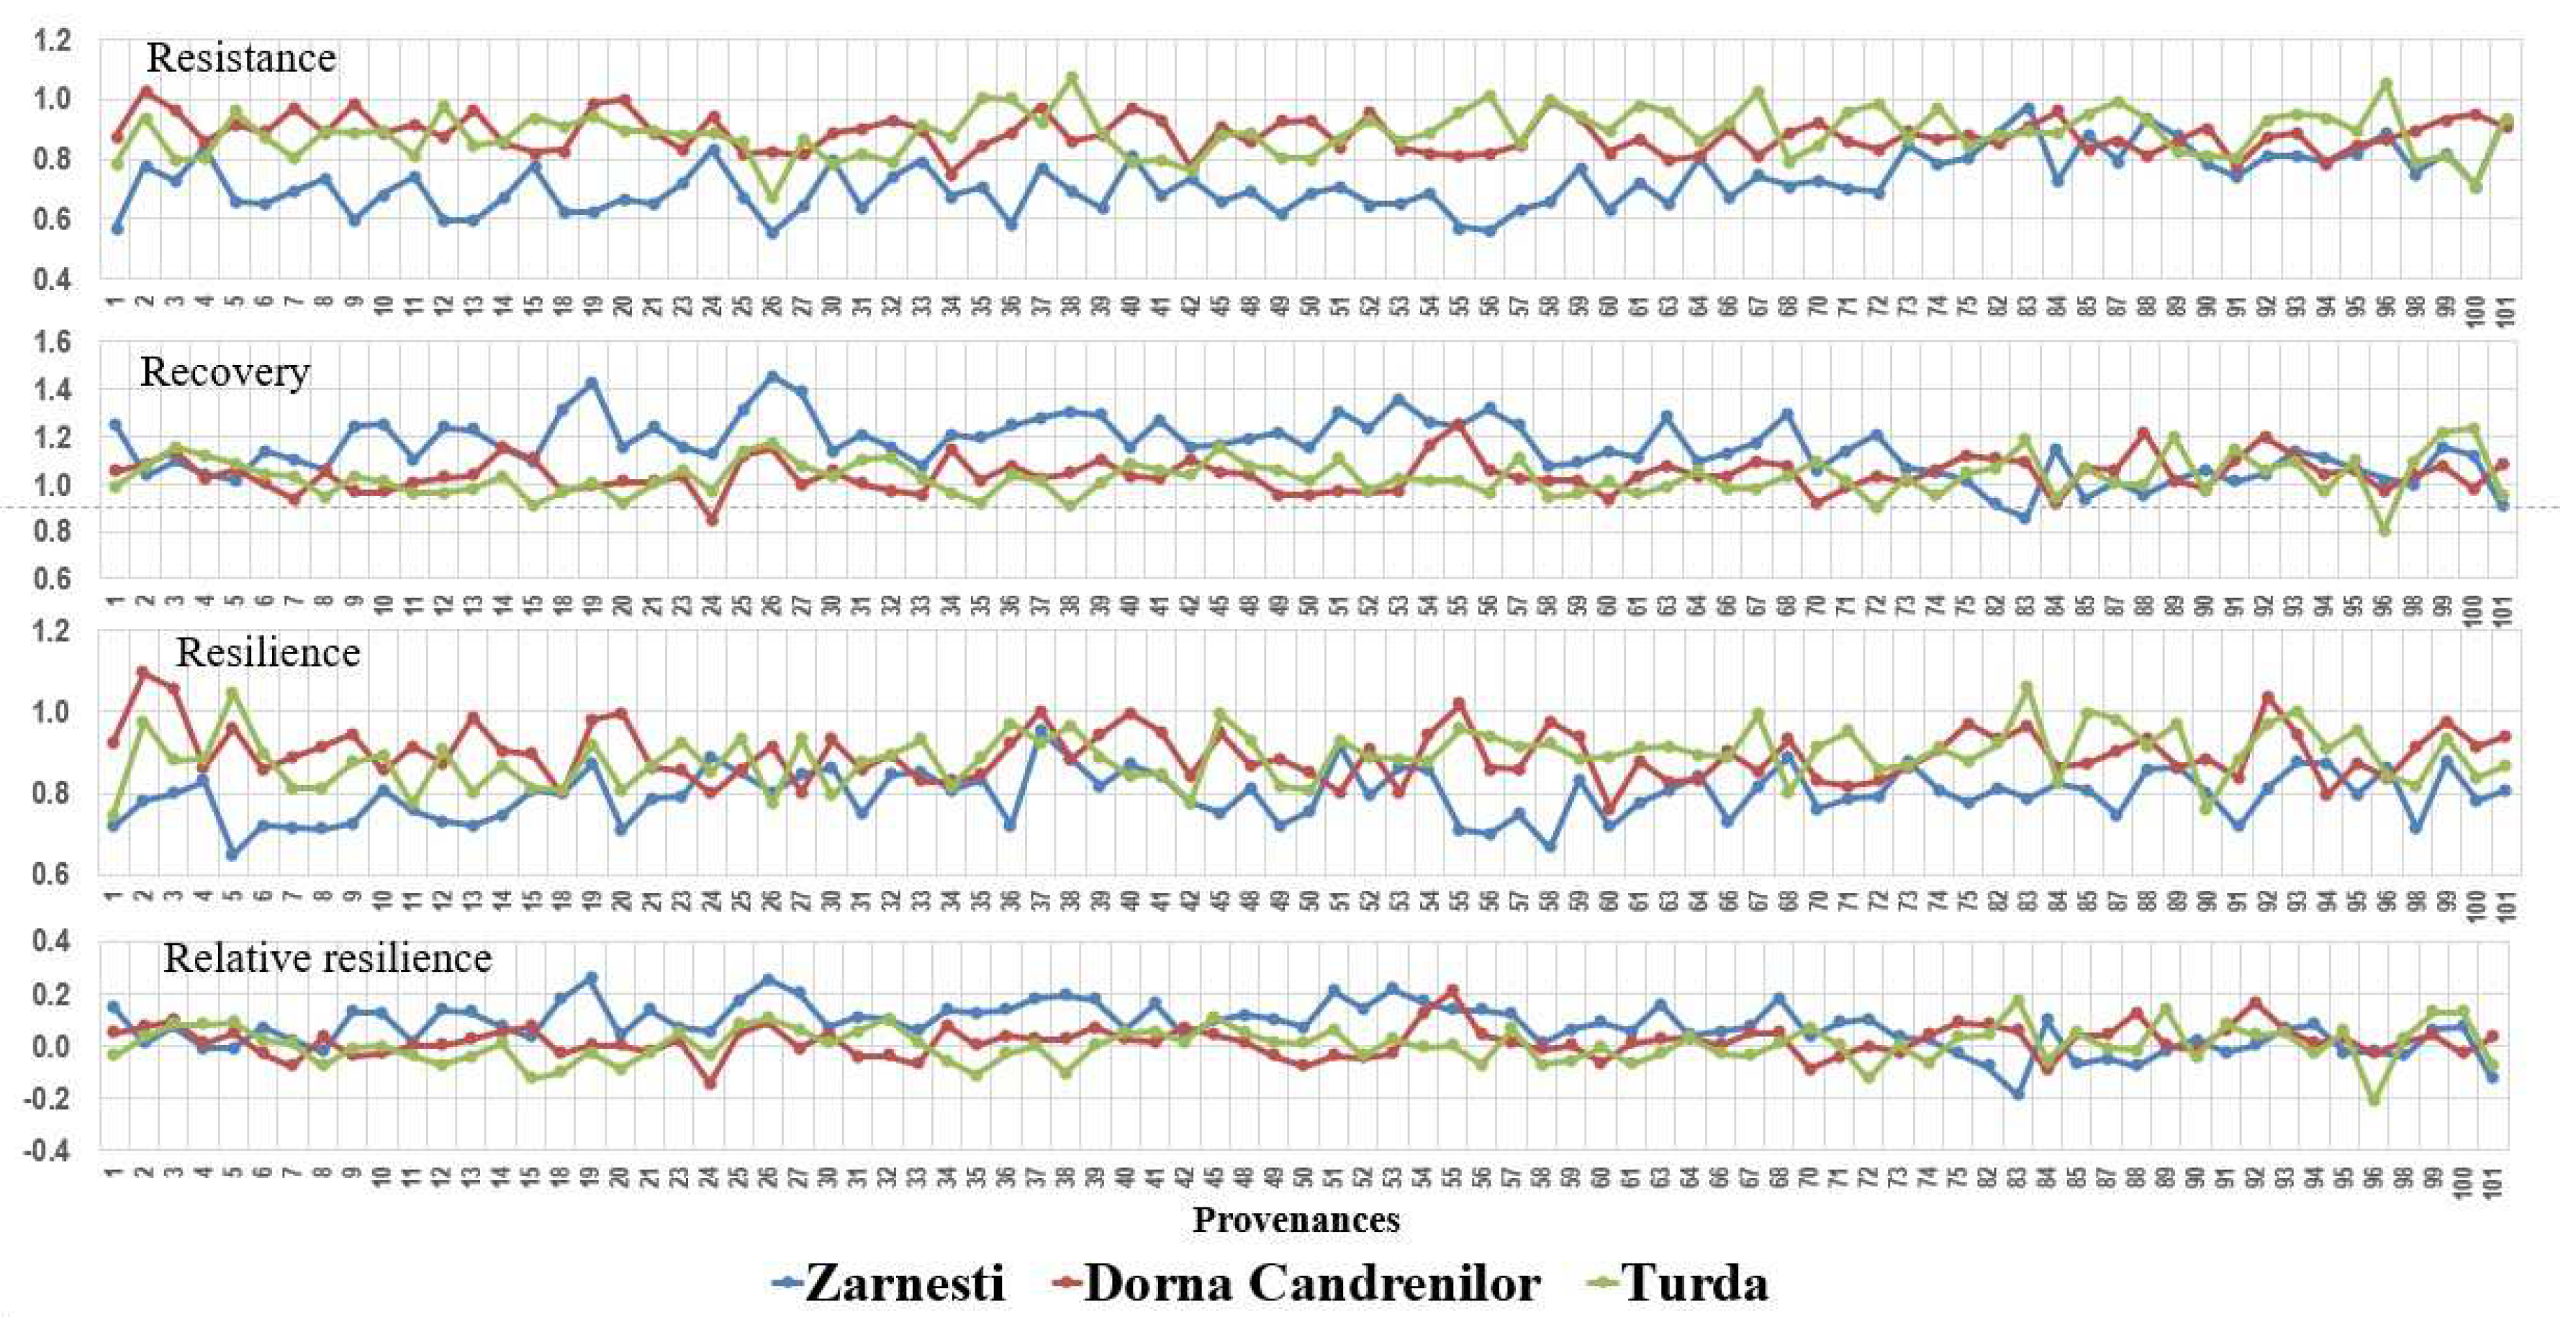
Analysing the provenances’ different response to the drought from the year 2000 (Figure 5), significant differences were found between provenances for all drought resilience indices in the Zarnesti trial. At the Turda trial, the differences were significant for all indices, except resilience, while at the Dorna Candrenilor, the resilience was the only factor with significant differences between provenances.
The best results regarding resistance were obtained at the Turda and Dorna Candrenilor provenance trials, with a mean resistance of 0.89 and 0.88, respectively, higher with 23.61 and 22.22%, respectively, than the mean resistance from the Zarnesti provenance trial (0.72).
The mean value for recovery was above one in all three provenance trials, the highest being achieved in the Zarnesti trial, 1.15 ± 0.12 (SD).
For the drought event from 2003, significant differences between provenances for all drought resilience indices were found only in the Zarnesti trial. No significant differences between provenances were found for any drought resilience indices in the other two sites.
The drought event from 2000 impacted differently the three provenance trials. The highest impact of it was at the Zarnesti trial, where no Norway spruce provenance had a mean resistance above 1; in other words, all provenances were affected.
The highest amplitude for the mean value of provenances’ resistance was at the Zarnesti trial, ranging from 0.55, provenance 26-Winterthur, to 0.97, provenance 83-Bramarv. For this trial, the site mean was 0.72, the lowest of the three trial sites. For Turda trial, it ranged from 0.67, provenance 26-Winterthur to 1.07, provenance 38-Val Di Fiemme. And for the Dorna Candrenilor trial, mean provenance resistance ranged from 0.75, provenance 34- Borki, to 1.02, provenance 2- Branstad.
Regarding recovery at the Zarnesti trial, only five provenances had values below 1: 88-Pualanka, 85-Heinola, 82-Sund, 101-Valke Karlovice and 83-Bramarv. At the Dorna Candrenilor, the number was 20 provenances, and at the Turda trial, 28.
No provenances had mean resilience above one at the Zarnesti trial, the values ranging from 0.65, provenance 5- Seljord, to 0.95, provenance 37- Latemar. Northern provenances 2- Branstad, 3- Sandar, 92- Padasjoki, and 55- Munkahus were the ones that had a resilience above 1 at the Dorna Candrenilor trial, for the year 2000; 37-Latemar, 40-Wietersdf and 20-Le Brassus had a mean resilience of 1; the rest had mean values ranging from 0.76, provenance 60-Keletbukki Allami, to 0.99, provenance 20-Le Brassus. At the Turda trial, values above 1 for resilience had provenances 83-Bramarv (1.06) and 5-Seljord (1.05). Provenances 93-Urjala and 85-Heinola had a resilience of 1, and the rest had values ranging from 0.75, provenance 1-Senum, to 0.99, provenance 45-Hollenburg and 67-Frasin.
Provenance 53-Neustift, from the Eastern Alps, had a great mean RW in all three trials. The resistance for the year 2000 had values between 0.65, at the Zarnesti trial, to 0.86, at the Turda trial. Regarding recovery, it ranged between 0.97 and 1.35, at the Dorna Candrenilor and Zarnesti trials, respectively. And the resilience was between 0.80 and 0.89, at the Dorna Candrenilor and Turda trial, respectively.
Another valuable provenance is 25-Wassen, from the Central Alps; with mean RW of 3.11 and 3.52 mm, at the Dorna Candrenilor and Turda trial, respectively it was the 1st and 3rd ranking in those provenance trials. In the Zarnesti trial, it occupied the rank 32, with a mean RW of 2.58 mm. It was not very resistant, the values for the resistance index ranging from 0.66, at the Zarnesti trial, to 0.85, at the Turda trial. The resilience had values between 0.86 and 0.93, at the Zarnesti and Turda trial respectively. This provenance’s recovery had great values: from 1.12 to 1.38, at the Dorna Candrenilor and Zarnesti trials, respectively
Provenance 19-Kerns, again from the Central Alps, presented good growth in all three trials and a good recovery (from 0.99 to 1,42 in Dorna Candrenilor and Zarnesti trial, respectively). It had a great resistance at the Dorna Candrenilor trial (0,98), but less so at the Turda and Zarnesti trials, 0.86 and 0.62, respectively.
Romanian provenance 75-Broşteni had a mean RW above average (2.92) at Dorna Candrenilor and Turda trials, and below average (2.46) at the Zarnesti trial. The resistance was between 0.81 and 0.88, at the Zarnesti and Dorna Candrenilor trials, respectively. Even though the resistance was low, it was above average at the Zarnesti trial, but below average in the other two trials. This provenance managed to obtain a recovery above one in all three trials, and a resilience close to one, 0.97 in the Dorna Candrenilor trial. In the other two trials, it was below average, but close to it, 0.88 compared with 0.89, and 0.77 compared with 0.80, in Turda and Zarnesti trial, respectively.
Provenance 70-Coşna, likewise from Romania, had a great RW in all three trials too. It had a high resistance in the Dorna Candrenilor trial, 0.92, but lower and below average in the Turda trial, 0.85, and lower but above average in the Zarnesti trial, 0,73. In contrast, the recovery of this provenance was high in the Turda and Zarnesti trial, but below one in the Dorna Candrenilor trial (0.92). The resilience was close to the mean value of the trials, but higher only at the Turda trial.

3.1. Phenotypic correlations

Significant and positive correlations between elevation and wood traits were found only at the Dorna Candrenilor trial, except LWP. Also, at this trial, the longitude was negatively and significantly correlated with LW and LWP. At the Turda trial, the longitude was negatively correlated with EW and positively correlated with LWP.
Regarding latitude, significant and negative correlations were found at the Dorna Candrenilor trial for all traits except LWP. At the Zarnesti trial, latitude was negatively correlated with LWP only. No significant correlations were found between wood traits and latitude at the Turda trial.
The correlation between EW and LW had values ranging from 0.309, Dorna, to 0.753, at Turda.
Table 4. Correlation coefficients between wood traits and geographic coordinates of Norway spruce provenances at 49 years after planting.
LW LWP RW Latitude Longitude Elevation
Dorna Candrenilor EW 0.309*** -0.445*** 0.922*** -0.185** -0.043 0.179***
LW 0.625*** 0.653*** -0.159* -0.162* 0.220**
LWP -0.099 -0.005 -0.135* 0.034
RW -0.212* -0.100 0.232*
Zarnesti EW 0.452*** -0.468*** 0.963*** 0.048 -0.010 -0.065
LW 0.502*** 0.676*** -0.048 -0.042 -0.016
LWP -0.235** -0.131* -0.020 0.057
RW 0.025 -0.021 -0.059
Turda EW 0.753*** -0.468*** 0.983*** -0.068 -0.130* 0.010
LW 0.134* 0.861*** -0.036 -0.058 0.065
LWP -0.324*** 0.070 0.155* 0.029
RW -0.062 -0.117 0.026
*, **, *** Significant at 5%, 1% and 0.1%, respectively; RW – ring width; EW – earlywood width; LW – latewood width; LWP – latewood percentage. .
Regarding drought indices (Table 5), at the Dorna Candrenilor trial, elevation was positively correlated with resistance (r=0.128) and negatively with recovery (r=-0.132). Latitude was positively correlated with recovery.
At the Zarnesti trial, however, no significant correlations were found between elevation and drought indices. The latitude was negatively correlated with all drought indices except resistance. The same for the longitude, except the correlation with resistance was not significant (r=0.120, p=0.061).
At the Turda trial, no significant correlations were found regarding elevation and latitude. The longitude was positively correlated with resistance (r=0.167), and negatively with recovery (-0.151) and relative resilience (r=-0.152).
Regarding the correlations between the mean of the 2000 and 2003 drought indices and mean wood traits (Table 6), the resistance is negatively and significantly correlated with EW and RW at the Dorna Candrenilor trial, and with EW, LW and RW at the Turda trial. In the same two trials, the correlations are positive with LWP.
There was a positive correlation between recovery and EW and a negative one with LWP at the Dorna Candrenilor trial. At the Zarnesti trial, there was a low correlation between Recovery and LW (r=137*). In contrast, the recovery was highly correlated with EW, LW and RW at the Turda trial.

3.1. Moving window correlations

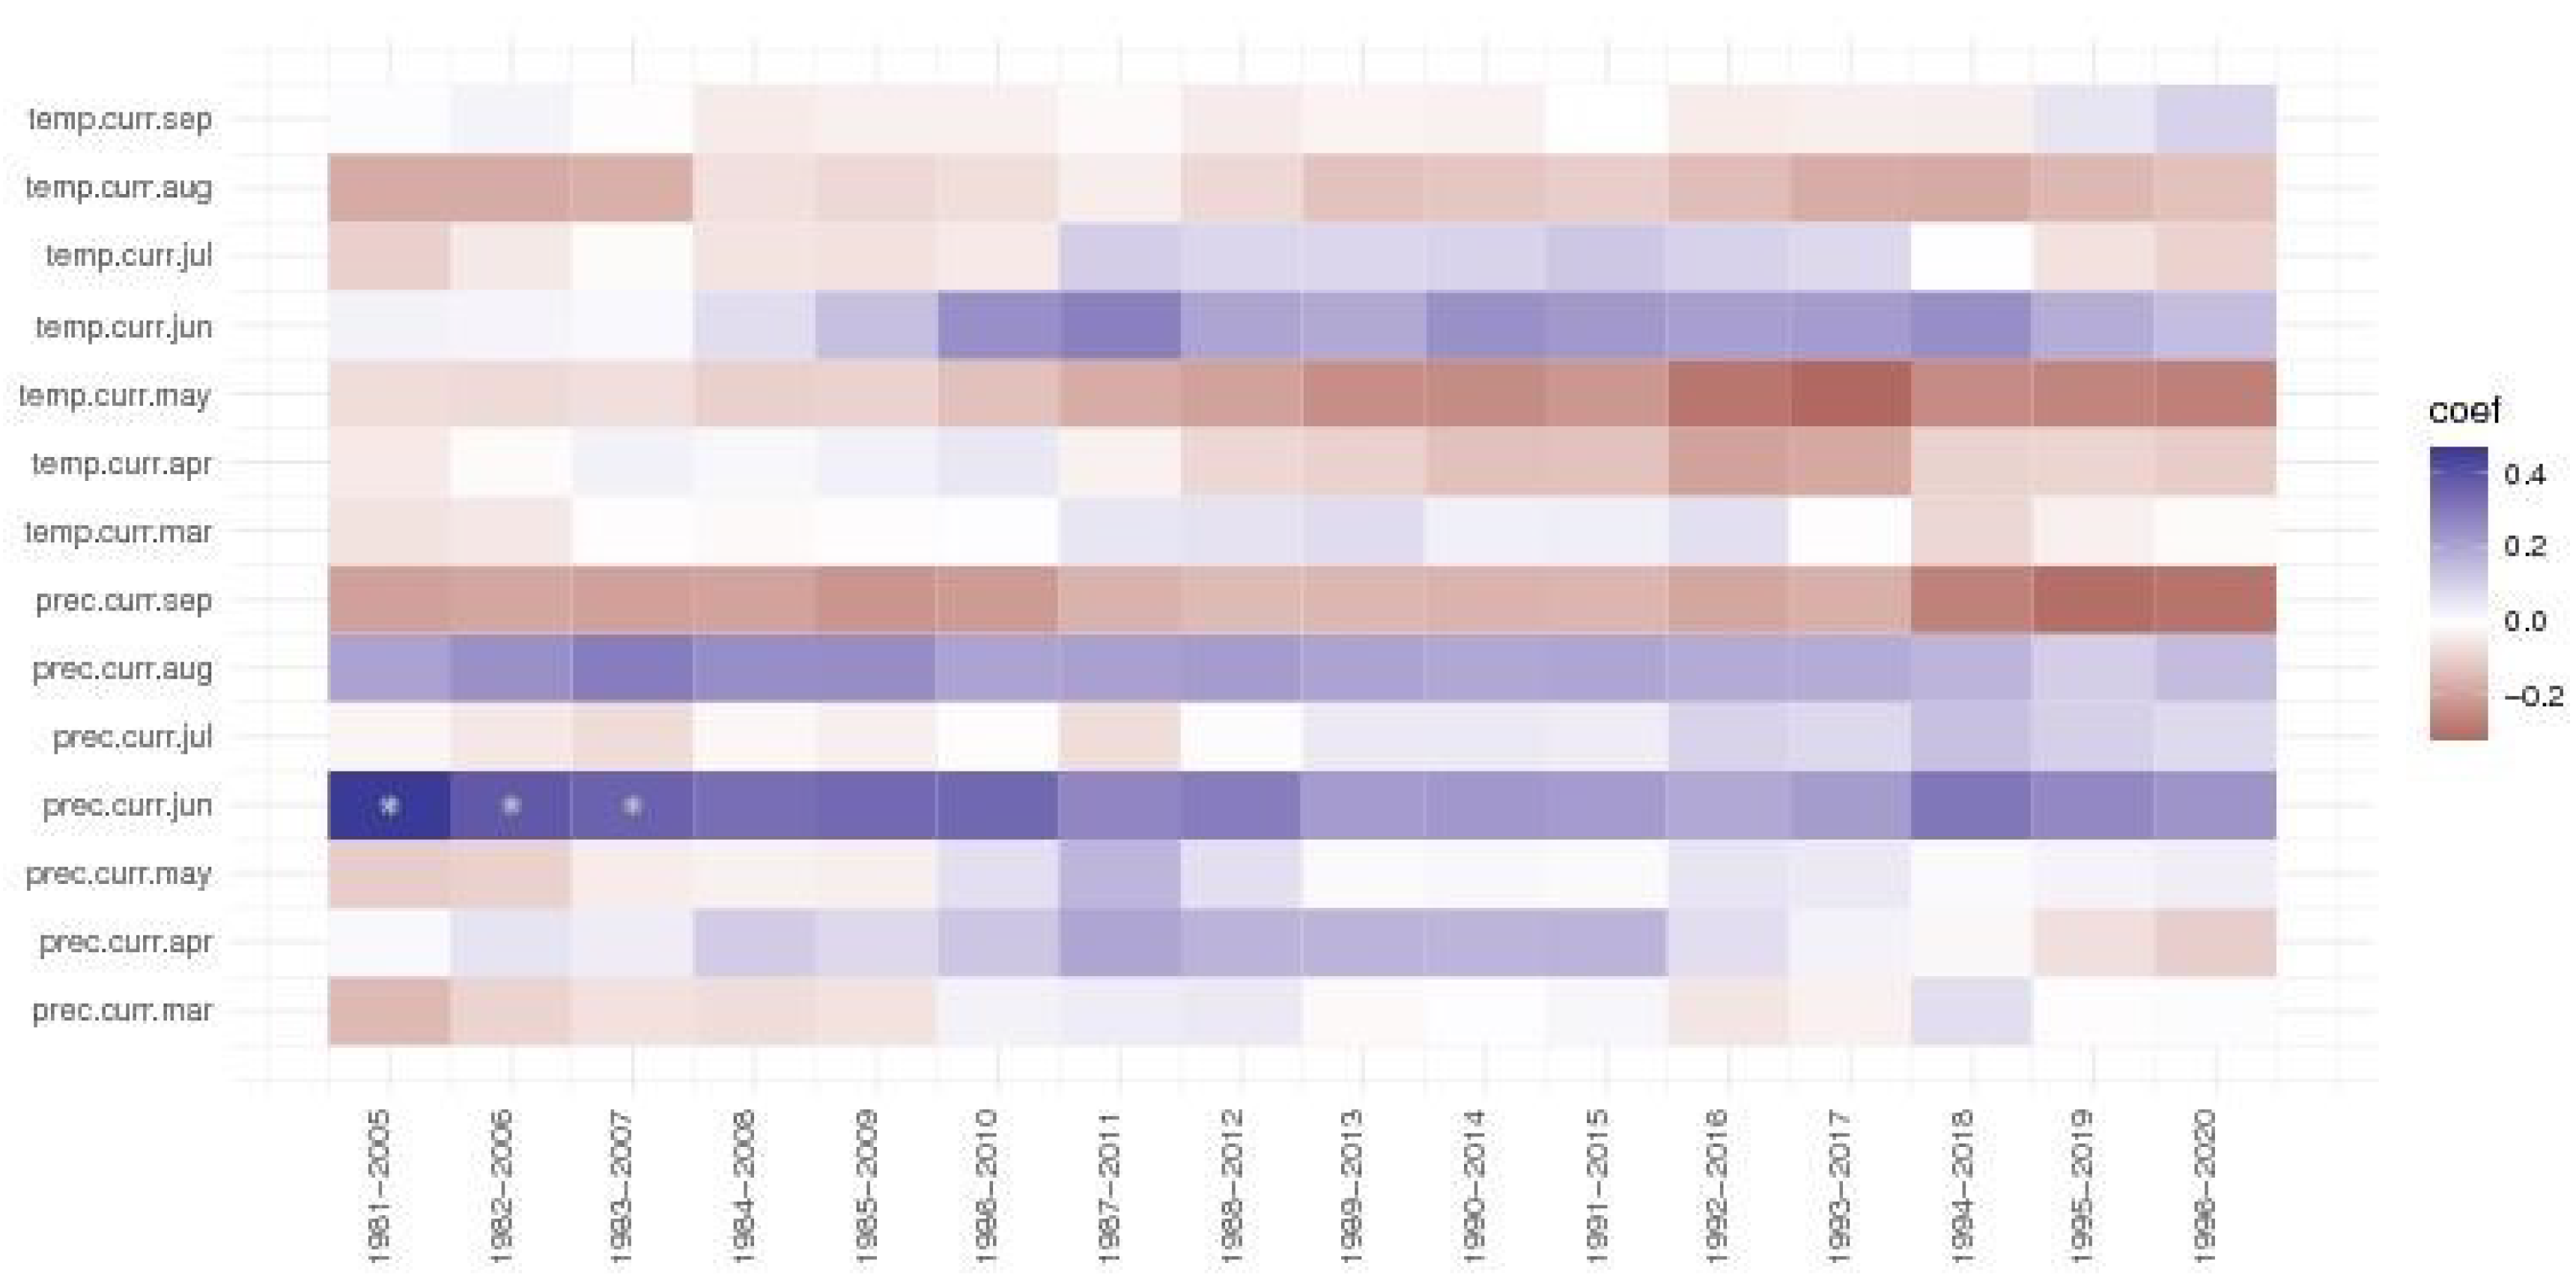
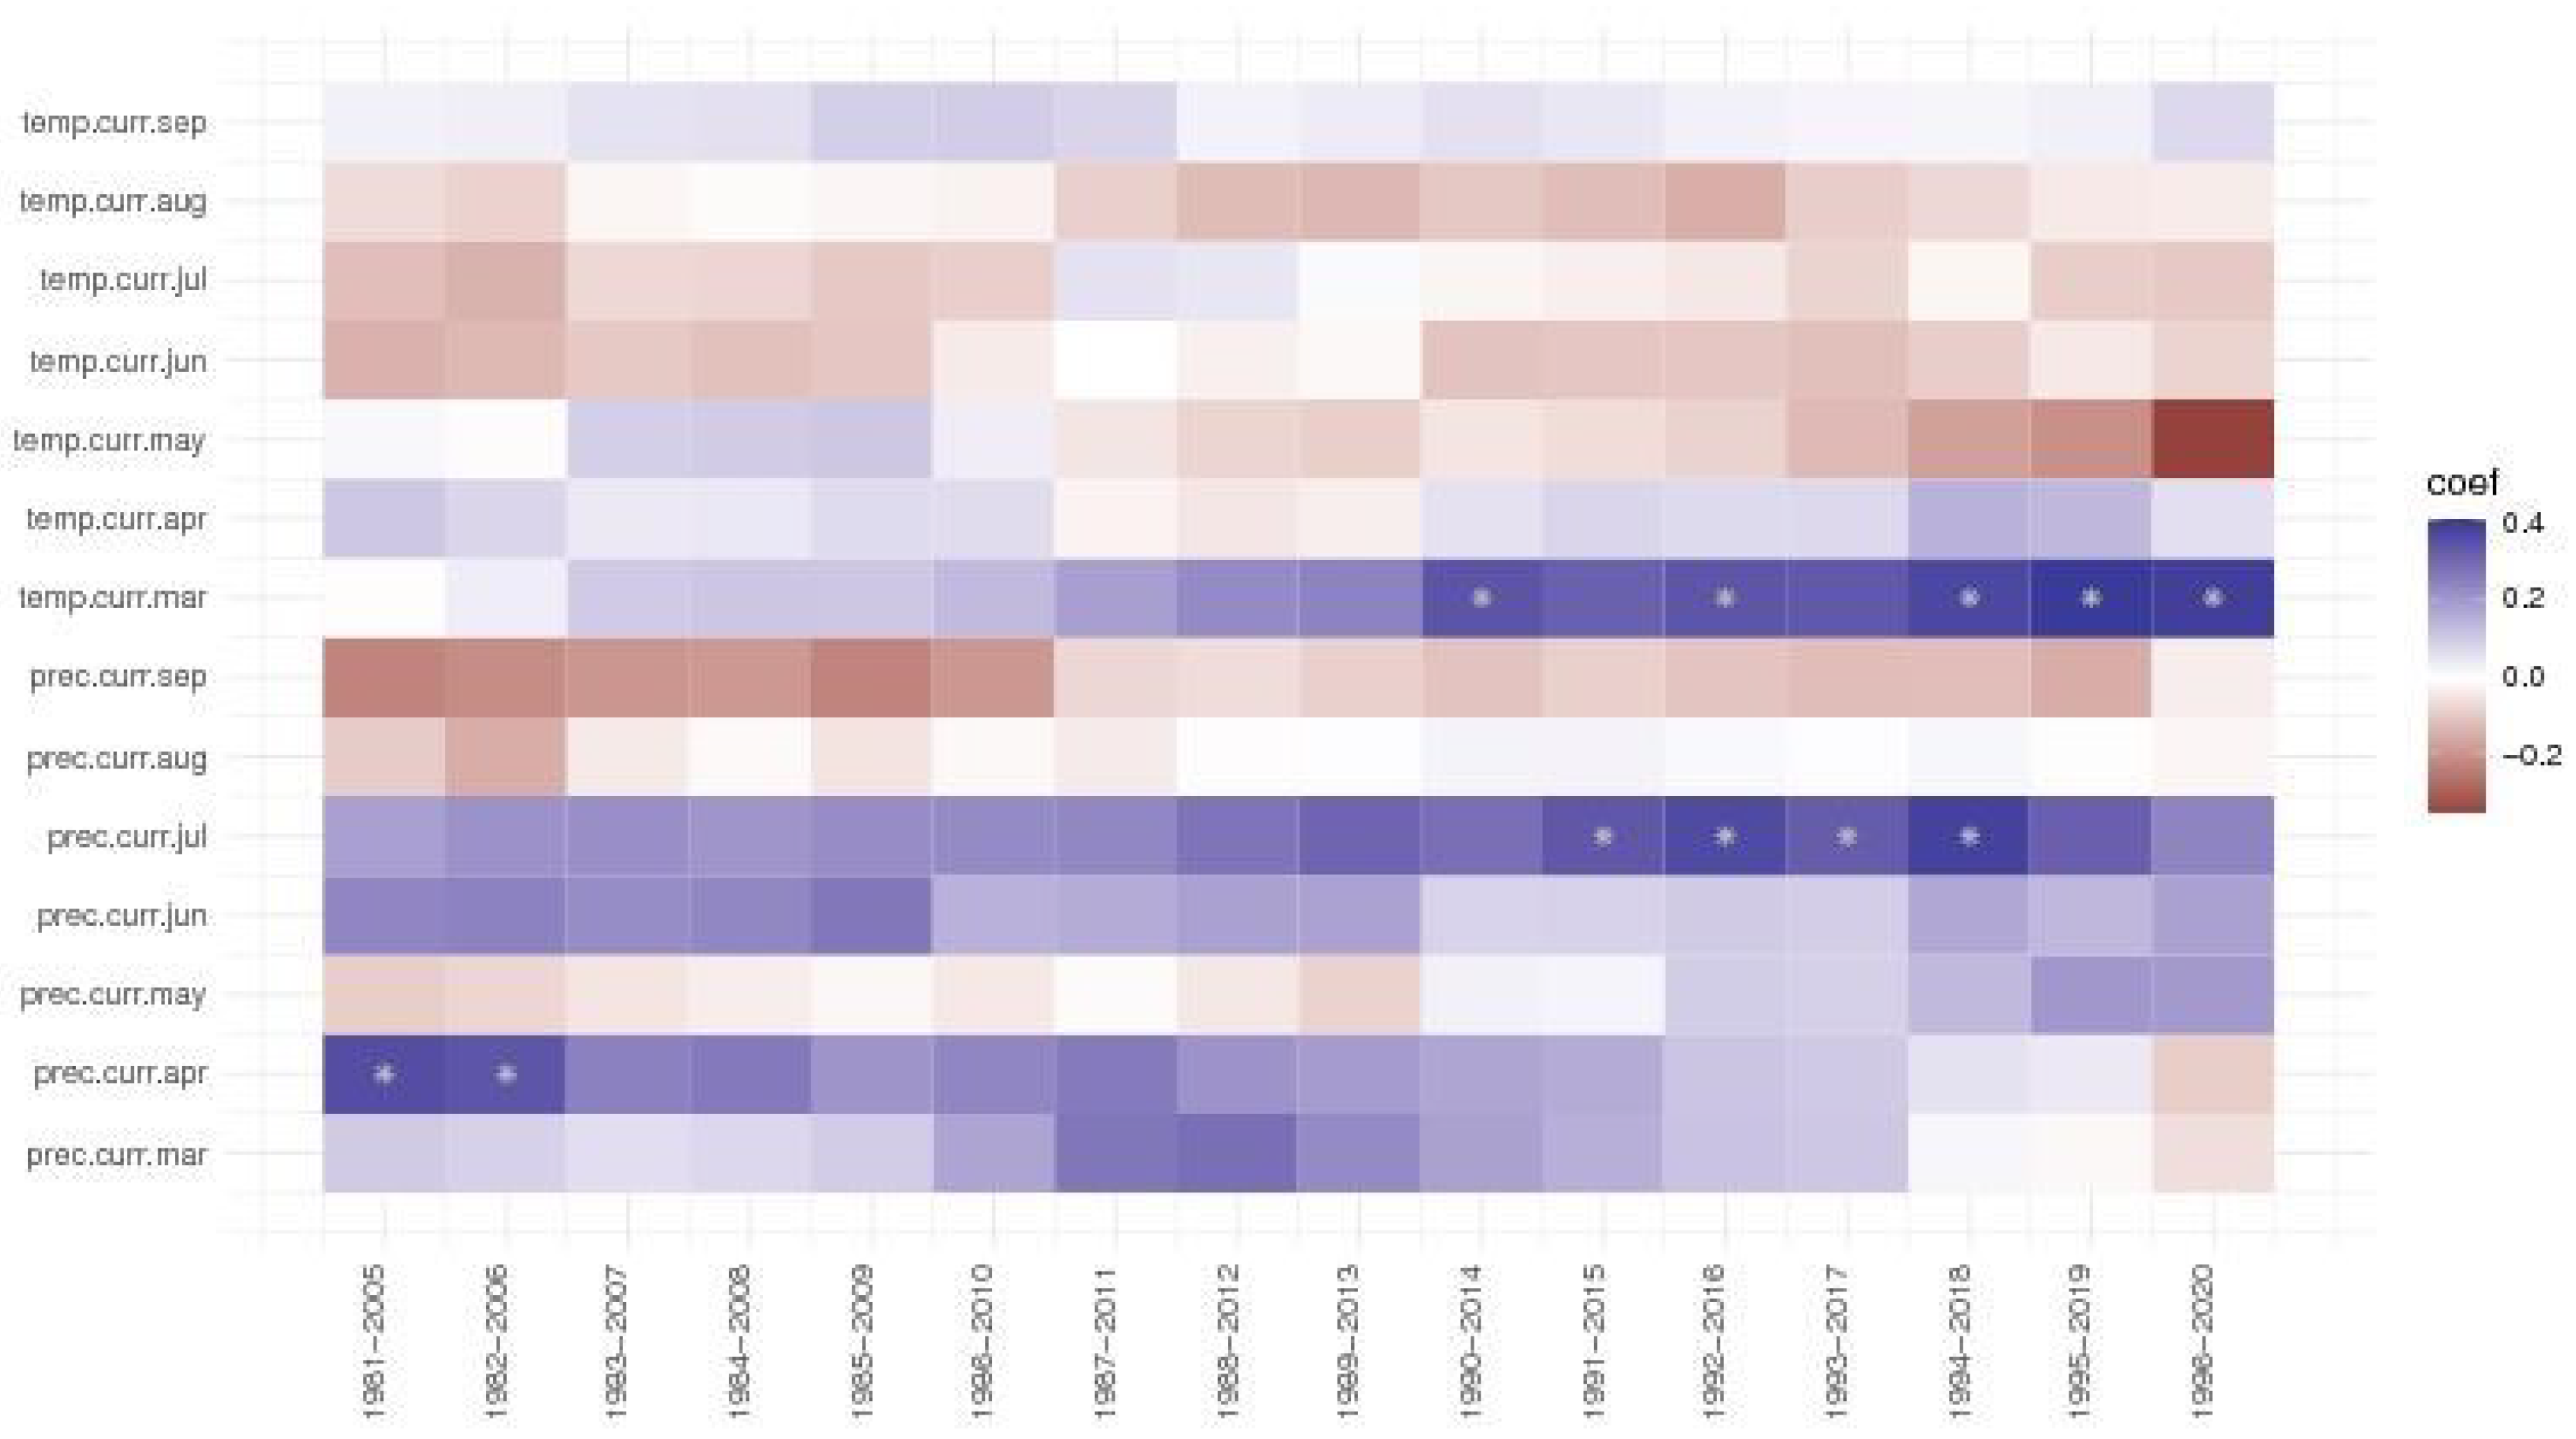
Analysing the moving window correlations, the precipitations of July always had a positive effect on ring width index the Dorna Candrenilor trial (Figure 6), but it became significant after 1991. Contrary, the effect of the precipitations from April slowly decreased, having even negative values for the last period, 1996-2020. The temperature of March also had a positive effect, more so after 1990. The temperature of May, although positive in the first periods, from 1987-2011, had only a negative impact, and it seems it is only getting stronger.
At the Zarnesti trial, the precipitations of June were significant for the first three periods of 1981-2007; the value of the correlation coefficient, while still positive, it was decreasing. Precipitations from September and the temperature of May, while not significant, had a negative impact but became stronger in the last periods (three and four, respectively).
Figure 7. The moving window correlations for the Zarnesti trial of Norway spruce provenances.
Preprints 96253 g007
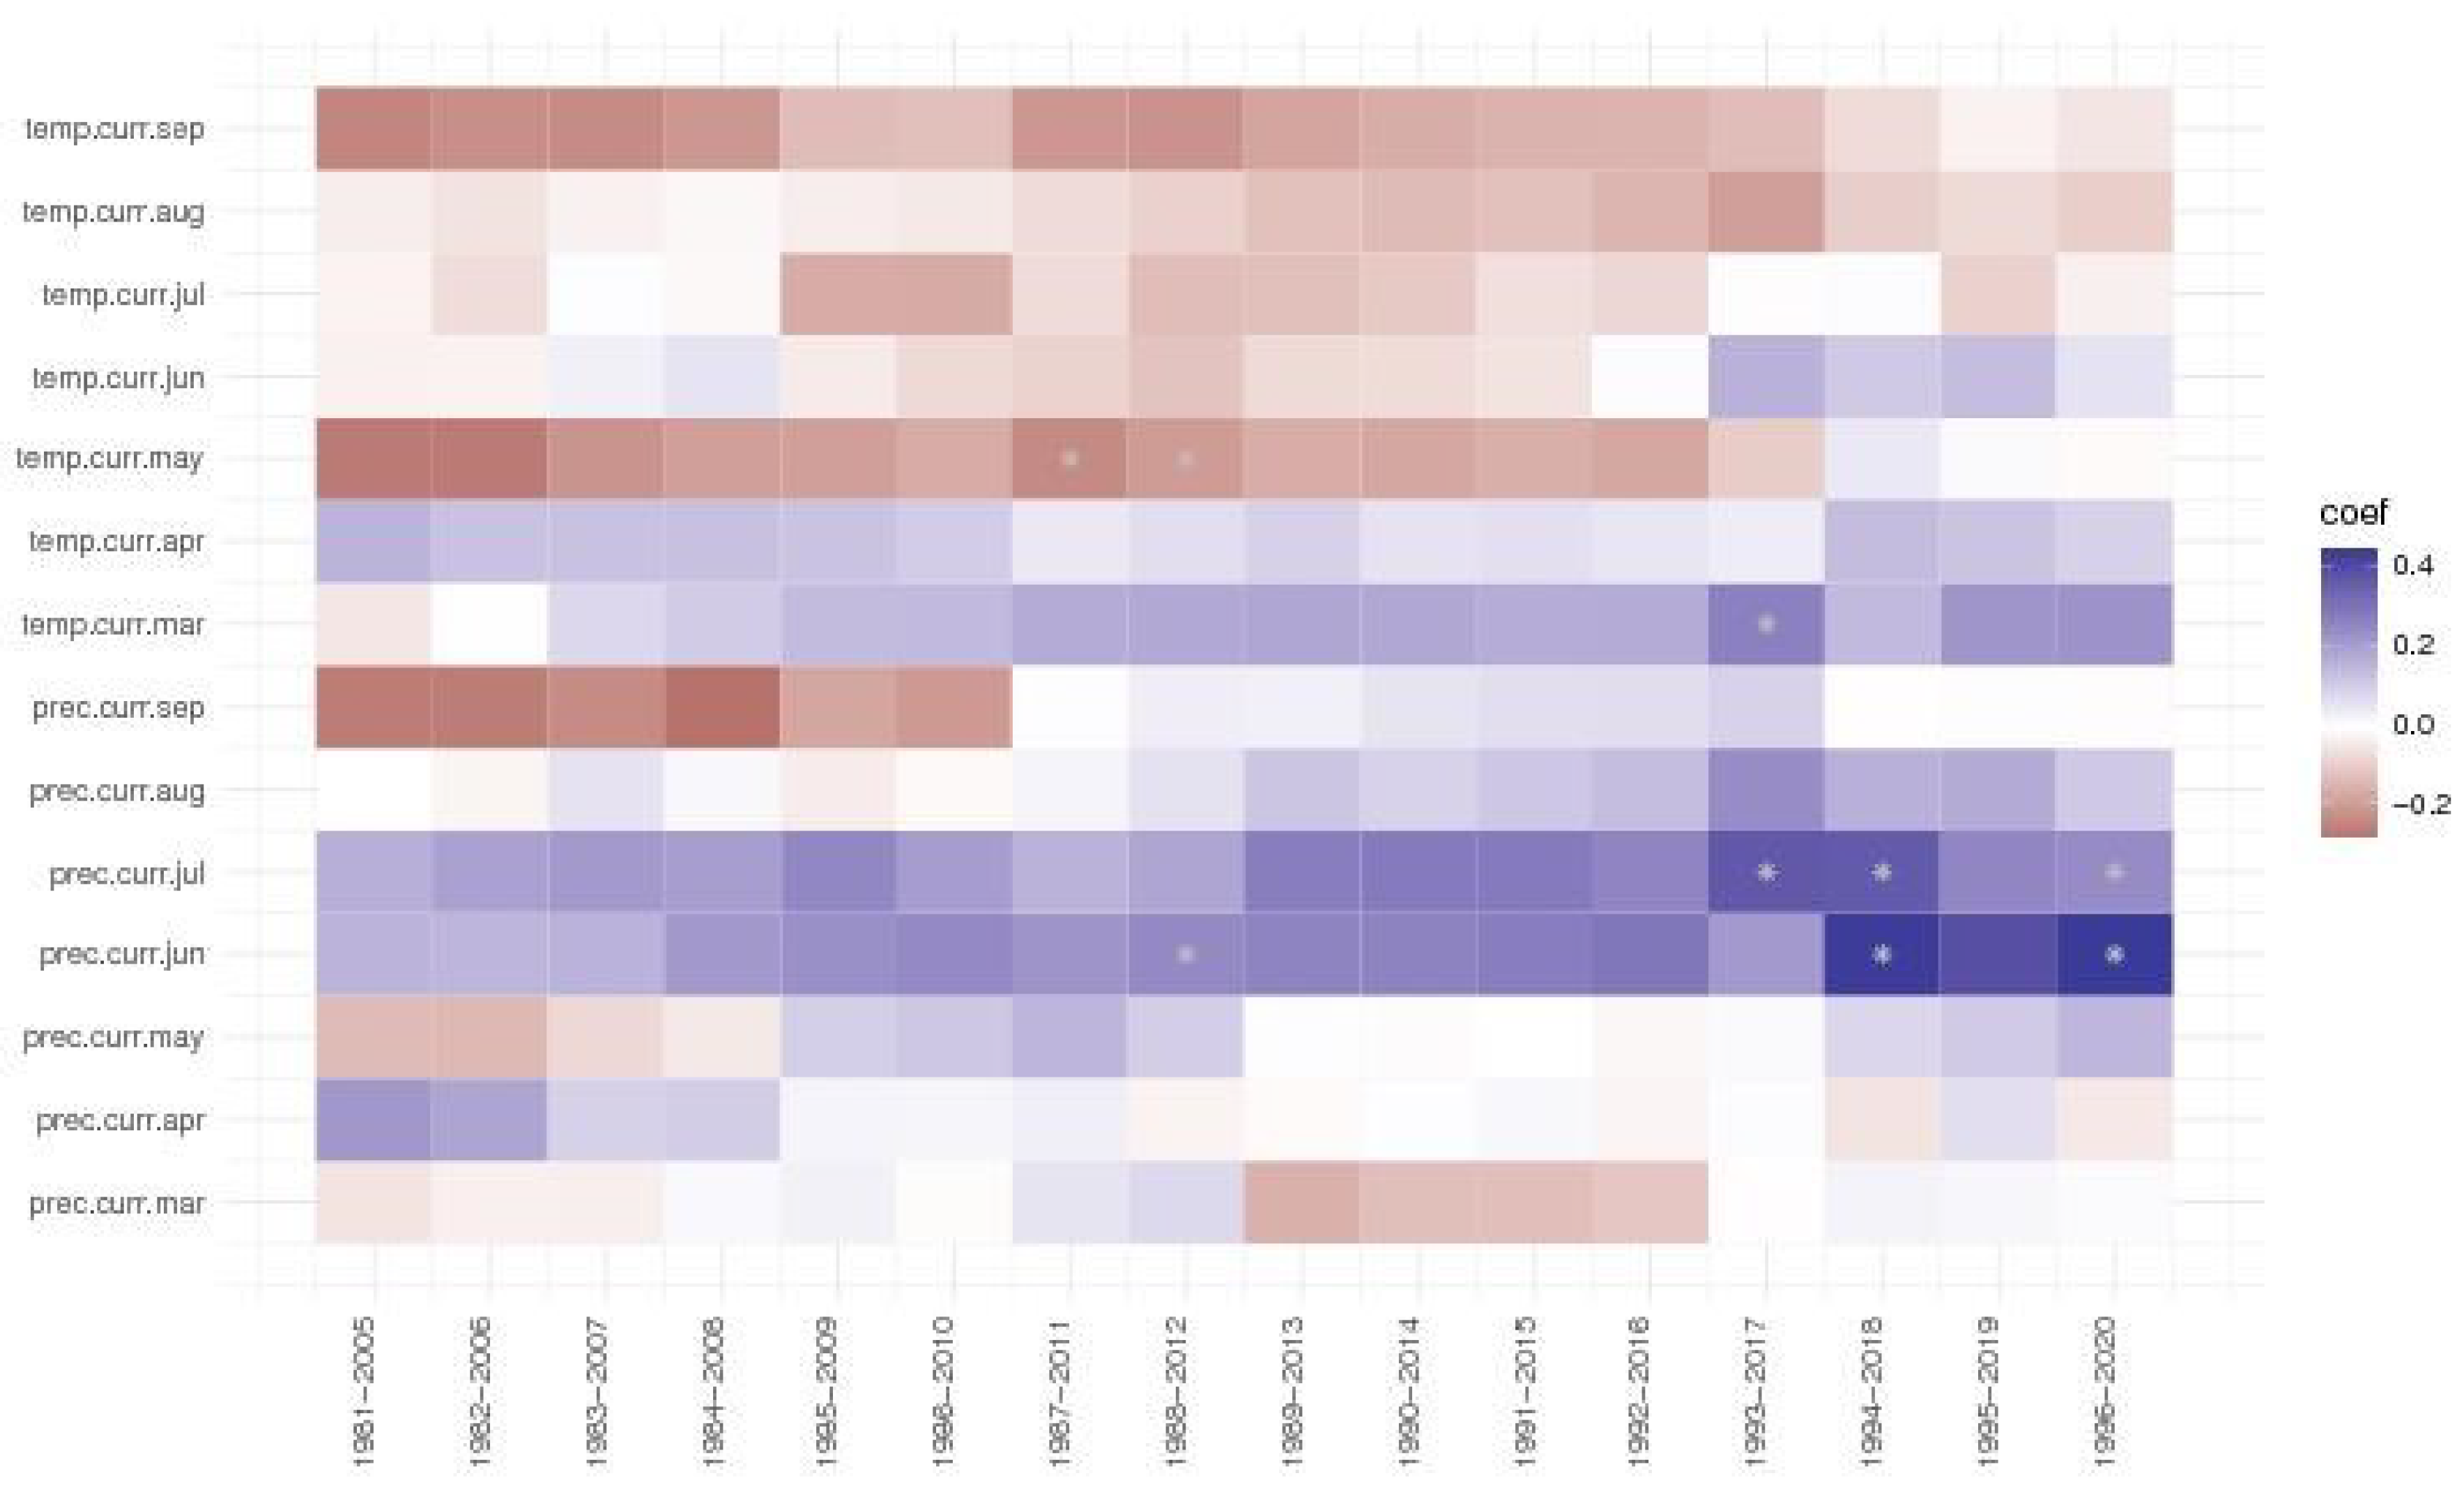
At the Turda trial, precipitations of June and July always had a positive effect on ring growth, but more so for the last three and four periods, respectively. The negative effect of March temperature for the first period analysed, 1981-2005, became positive starting with the 1983-2007 period, even being significant in the 1993-2017 period. The temperature of May, that was significant for the 1987-2011 and 1988-2012 periods, had a negative effect for ring growth for all analysed periods, except the last three (1994-2020), when the correlation coefficients had values close to 0.
Figure 8. The moving window correlations for the Turda trial of Norway spruce provenances.
Preprints 96253 g008

3.1. Growth response functions

Analysing the response models for ring width index (Table 7), the adjusted R2 had values between 0.485 and 0.591. The mean temperature of the warmest quarter (MTWaQ) had a negative impact on radial growth for Norway spruce in all three provenance trials, with partial R2 ranging from 0.471 to 0.576.
The influence of the precipitation factor (more specifically, of the period when they have fallen) has varied depending on the trial: for Zarnesti, it was the precipitations from a single month, March; for Turda, the precipitations of the wettest quarter (PWeQ), and for Dorna Candrenilor, the annual precipitations (AP). Partial R2 for this factor ranged from 6.5% to 15.7%.
For the Zarnesti trial, a quadratic model with the number of frost-free days resulted in a higher adjusted R2, partial R2 for this factor being 12.5 %.
The response models for LWP (Table 8) were also significant, the adjusted R2 ranging from 0.143 to 0.247, at the Zarnesti and Dorna Candrenilor trials, respectively. MTWaQ had also an influence on LWP, at the Zarnesti trial, either with precipitation from September, either with number of frost-free days.
At the Dorna Candrenilor trial, degree-days above 0 °C and precipitations of the wettest month were the factors with the greatest influence on LWP, 22.2% and 8.6%, respectively.
At the Turda trial, the factors with the most influence on LWP were degree-days above 5 °C, 22.2%, and the summer heat moisture index, 6.4%.

4. Discussion

The wood characteristics, radial width, and the response to drought of 81 Norway spruce provenances have been analysed, in three long-term provenance trials located in 3 different geographic regions of the Romanian Carpathian Mountains.
Large variations in temperature and precipitation can be seen for the analysed period (1972-2020). For temperature, both the annual mean and the one from the warmest quarter, there is a clear trend of increasing values. Regarding precipitation, although the annual amount has decreased in the last decade, the most remarkable fact is the difference between 2010 and the 2011 APs. The year 2010 was the one with the highest amount of annual precipitation for the Dorna Candrenilor and Turda trials and the second one for the Zarnesti one. In contrast, the year 2011, even though it was not classified as extreme according to SPEI-3 in our study, has one of the lowest AP from the analysed period: the 2nd, 3rd, and 4th one, for Turda, Dorna Candrenilor and Zarnesti trials, respectively.
The year 2000 had the lowest AP for the analysed period, the values dropping to 511, 553, and 646 mm in the Turda, Dorna Candrenilor and Zarnesti trials, respectively. The optimum climate for Norway spruce in Romania is represented by an MAT between +4 and +7 °C and AP between 800 and 1200 mm [52]. At the Dorna Candrenilor the AP dropped in seven years even below the limit value of 600 mm (1986, 1990, 1994, 2000, 2003, 2011, 2015) and only 16 out of the 49 years had optimum AP values (above 800 mm). At the Turda trial, regarding AP, four years had values below the limit value. At the Zarnesti trial, ten years showed AP below the optimum value, but none were below the limit.
The drought event from 2000 impacted differently the three trials. The highest impact has been at the Zarnesti trial, where all provenances were affected. For the drought event from 2003, significant differences between provenances for all drought resilience indices were found only in the Zarnesti trial.
From the analysed climatic variables, the mean temperature of the warmest quarter (MTWaQ) had a significant and negative impact on ring width index development in all provenance trials. Regarding precipitations, the variable was specific for each trial site, precipitation of the March, annual precipitations, or the precipitation of the wettest quarter, all had a negative impact on RW. Shifts in snow cover and melting, and frozen soil dynamics have an important impact on tree growth [53,54]. A reduced snow cover and an earlier snow melting affect the snowmelt water supply that sustains tree growth in areas with water stress [53]. In addition, spring phenology might be affected/promoted by earlier snow melting, thus increasing the length of the growing season [49] but also exposing the trees to late frost [55,56]. Weigel et al. [57,58] also stated the importance of the winter climate change, since marginal populations in cold area are becoming more sensitive to winter cold, temperature of February in its case, and less sensitive to June precipitations.
For LWP, the mean temperature of the warmest quarter, the degree-days above 0 and 5 °C, number of frost-free days, precipitation of the wettest month, and the summer heat moisture index are the climatic variables with a great influence. These climatic variables positively impacted LWP, except SHM at the Turda trial.
Analysing the moving window correlations for the last four decades, changes were visible in all three trials. The positive effect of March temperature and precipitations from July became significant in the last three decades, 1990-2020 at the Dorna Candrenilor trial. A similar trend is also observed in the Turda trial; the positive effect of March temperature was significant for the 1993-2017 period, and the positive effects of precipitations from June and July were significant in the last two out of three and three out of four subperiods, respectively (1994-2018 and 1996-2020, for June precipitations, and 1993-2017, 1994-2018 and 1996-2020 for the July precipitations). At the Zarnesti trial, the positive effect of the June precipitations became nonsignificant starting with the 1984-2008 subperiod. While not significant, the negative effects of the temperature of May and precipitations of September were increasing in the last five and three subperiods, respectively.
The negative effect of rising temperatures on conifer growth was also observed in the study of Gómez-Aparicio et al. [59], that can be connected with a higher atmospheric water demand, that causes greater drought stress. Positive correlations between Norway spruce RW and the climate of July and August of the current year, but also October of the previous year; and a negative effect of the temperature of September from the previous year have been reported in Czech Republic [60].
The precipitation amounts from June and July also became important for pine growth [61], a change from earlier studies [62]. In the study of Lévesque [13], soil water availability from December to July was also important. Roibu [63] found that the correlations with temperature and precipitations are also changing over time for ash and oak from the Republic of Moldova, for moving window correlations of 25 years.
The differences among provenances regarding wood traits and drought response were very significant in each trial. This can be explained by the broad geographic amplitude of the tested provenances, which comprised provenances of the Alpine range, the Bohemian Massive, the Carpathian Mountains, the Rila and Rhodope Mountains, the Vosges and Jura Mountains, provenances from Northern Europe (Sweden, Norway, and Finland) as well as provenances from NE Germany and NE Poland.
Provenances from lower latitudes showed better performances for EW, LW and RW at the Dorna Candrenilor trial, and for LWP at the Zarnesti trial. No significant correlations between latitude and wood traits were found at the Turda trial. Regarding longitude, Eastern provenances showed lower LW and LWP at the Dorna Candrenilor trial, but lower EW and higher LWP at the Turda trial. Significant and positive correlations between elevation and wood traits were found only at the Dorna Candrenilor trial for all except LWP. The correlation coefficient had values ranging from 0.18 to 0.23.
Provenances with higher values of RW are the most affected by the drought events, the RW and resistance being negatively correlated at the Dorna Candrenilor and Turda trials. But at the Turda trials, the provenances with high RW also showed a higher recovery (r=0.345***). Even though in the other two trials the correlation between recovery and RW was not significant, the negative correlation between resistance and recovery means that provenances that were the most affected, also had a great recovery.
The provenances with high radial growth, good resistance and/or recovery in all three trials are: 53-Neustift, 49- Redl-Zipf-Fuchsberg, 40-Wietersdf, from Eastern Alps; 19-Kerns and 25-Wassen, from Central Alps; 31-Bremenhagen, from NE Germany; 99-Zelesna Ruda, from the Bohemian Forest Mountains (Czech Republic); and 67- Frasin, 70-Coşna, 71- Moldovița, and 75-Broşteni, from Eastern Romanian Carpathians.
It should be noted that the extreme event from 2003 affected the value of the calculated recovery, resilience, and relative resilience for the extreme event from 2000. Further studies should investigate extreme events that are more distant, a fact that is becoming difficult, considering the recent events from the 2018-2022 period [64].

5. Conclusions

The number of years with extreme drought events has increased in the last two decades, in the Romanian Carpathian Mountains. We found high genetic variation in wood characteristics and drought response of Norway spruce provenances tested in this study. These results could be further exploited in breeding, seed selection and genetic conservation programs but also represent a stage in the development of the adaptation strategy of the species.
The drought year and the environmental conditions of the planting site influenced the provenances drought response. Norway spruce provenances with high growth rates are the most affected by extreme droughts, a fact highlighted by the negative correlations between RW and resistance in all three trials. Besides, a prolonged period for recovery was needed after the drought, indicating a lower fitness for drought tolerance of Norway spruce. However, several provenances with high radial growth and good resistance and/or recovery have been identified.
Provenances that performed better in common garden experiments could be used in assisted migration even in the proximity of the current natural range. By relying on assisted migration, especially at the edges of the species’ distribution, the adaptation process could be assisted and the genetic diversity would be easier to conserve and increase.

Supplementary Materials

The following supporting information can be downloaded at the website of this paper posted on Preprints.org, Table S1: Details about the tested Norway spruce provenances and the provenance trials.

Author Contributions

Conceptualisation, A.-M.A. and G.M.; methodology, A.-M.A.; maps, A.-M.A.; supervision, G.M. and A.L.C.; project administration, G.M.; funding acquisition, G.M.; writing—all authors. All authors have read and agreed to the published version of the manuscript.

Funding

This research was funded by the Romanian Ministry of Research, Innovation and Digitalization, in BIOSERV Nucleu Program, within the framework of the project PN 19070303 (Revision of the provenance regions for production and deployment of the forest reproductive materials in Romania to increase the adaptability of forest ecosystems to climate change) and “Programul 1—Dezvoltarea sistemului naţional de cercetare—dezvoltare, Subprogram 1.2—Performanţă instituţională—Proiecte de finanţare a excelenţei în CDI”—project “Creșterea capacității și performanței instituționale a INCDS “Marin Drăcea”) în activitatea de CDI—CresPerfInst” (Contract No. 34PFE./30.12.2021).

Data Availability Statement

Data presented in this study are available from the corresponding author upon request.

Conflicts of Interest

The authors declare no conflicts of interest.

References

  1. ‘AR6 Synthesis Report: Climate Change 2023’. Available online: https://www.ipcc.ch/report/ar6/syr/ (accessed on 4 January 2024).
  2. C. D. Allen et al., ‘A global overview of drought and heat-induced tree mortality reveals emerging climate change risks for forests’, Forest Ecology and Management, vol. 259, no. 4, pp. 660–684, Feb. 2010. [CrossRef]
  3. W. R. L. Anderegg et al., ‘Climate-driven risks to the climate mitigation potential of forests’, Science, vol. 368, no. 6497, p. eaaz7005, Jun. 2020. [CrossRef]
  4. Ph. Ciais et al., ‘Europe-wide reduction in primary productivity caused by the heat and drought in 2003’, Nature, vol. 437, no. 7058, pp. 529–533, Sep. 2005. [CrossRef]
  5. F. Lloret, A. Escudero, J. M. Iriondo, J. Martínez-Vilalta, and F. Valladares, ‘Extreme climatic events and vegetation: the role of stabilizing processes’, Global Change Biology, vol. 18, no. 3, pp. 797–805, 2012. [CrossRef]
  6. M. Reichstein et al., ‘Climate extremes and the carbon cycle’, Nature, vol. 500, no. 7462, Art. no. 7462, Aug. 2013. [CrossRef]
  7. M. Onderka and J. Pecho, ‘On how precipitation-temperature coupling affects drought severity in the western Carpathians and the adjacent northern part of the Pannonian Plain’, Theor Appl Climatol, Feb. 2023. [CrossRef]
  8. J. Spinoni, J. V. Vogt, G. Naumann, P. Barbosa, and A. Dosio, ‘Will drought events become more frequent and severe in Europe?’, International Journal of Climatology, vol. 38, no. 4, pp. 1718–1736, 2018. [CrossRef]
  9. C. Senf, A. Buras, C. S. Zang, A. Rammig, and R. Seidl, ‘Excess forest mortality is consistently linked to drought across Europe’, Nat Commun, vol. 11, no. 1, Art. no. 1, Dec. 2020. [CrossRef]
  10. E. Mateescu, M. Smarandache, N. Jeler, and V. Apostol, ‘Drought conditions and management strategies in Romania’, Initiative on “Capacity Development to Support. National Drought Management Policy”(WMO, UNCCD, FAO and UNW-DPC), vol. 600, 2013.
  11. A. Busuioc and H. von Storch, Changes in the Winter Precipitation in Romania and Its Relation to the Large Scale Circulation. Max-Planck-Institut für Meteorologie, 1995. [CrossRef]
  12. A. Dumitrescu, V.-A. Amihaesei, and S. Cheval, ‘RoCliB– bias-corrected CORDEX RCMdataset over Romania’, Geoscience Data Journal, vol. n/a, no. n/a, Apr. 2022. [CrossRef]
  13. M. Lévesque et al., ‘Drought response of five conifer species under contrasting water availability suggests high vulnerability of Norway spruce and European larch’, Global Change Biology, vol. 19, no. 10, pp. 3184–3199, 2013. [CrossRef]
  14. C. Zang, H. Pretzsch, and A. Rothe, ‘Size-dependent responses to summer drought in Scots pine, Norway spruce and common oak’, Trees, vol. 26, no. 2, pp. 557–569, Apr. 2012. [CrossRef]
  15. O. Bouriaud and I. Popa, ‘Comparative dendroclimatic study of Scots pine, Norway spruce, and silver fir in the Vrancea Range, Eastern Carpathian Mountains’, Trees, vol. 23, no. 1, pp. 95–106, Feb. 2009. [CrossRef]
  16. H. Cochard, ‘Vulnerability of several conifers to air embolism’, Tree Physiology, vol. 11, no. 1, pp. 73–83, Jul. 1992. [CrossRef]
  17. B. Schuldt et al., ‘A first assessment of the impact of the extreme 2018 summer drought on Central European forests’, Basic and Applied Ecology, vol. 45, pp. 86–103, Jun. 2020. [CrossRef]
  18. L. Marini et al., ‘Climate drivers of bark beetle outbreak dynamics in Norway spruce forests’, Ecography, vol. 40, no. 12, pp. 1426–1435, 2017. [CrossRef]
  19. K. J. Liepe, E. van der Maaten, M. van der Maaten-Theunissen, and M. Liesebach, ‘High Phenotypic Plasticity, but Low Signals of Local Adaptation to Climate in a Large-Scale Transplant Experiment of Picea abies (L.) Karst. in Europe’, Frontiers in Forests and Global Change, vol. 5, 2022. Available online: https://www.frontiersin.org/article/10.3389/ffgc.2022.804857 (accessed on 30 June 2022).
  20. A. Buras and A. Menzel, ‘Projecting Tree Species Composition Changes of European Forests for 2061–2090 Under RCP 4.5 and RCP 8.5 Scenarios’, Frontiers in Plant Science, vol. 9, 2019. Available online: https://www.frontiersin.org/articles/10.3389/fpls.2018.01986 (accessed on 20 February 2023).
  21. G. Mihai et al., ‘Impact of Climate Change and Adaptive Genetic Potential of Norway Spruce at the South–eastern Range of Species Distribution’, Agricultural and Forest Meteorology, vol. 291, p. 108040, Sep. 2020. [CrossRef]
  22. G. Mihai, A.-M. Alexandru, I.-A. Nita, and M.-V. Birsan, ‘Climate Change in the Provenance Regions of Romania over the Last 70 Years: Implications for Forest Management’, Forests, vol. 13, no. 8, Art. no. 8, Aug. 2022. [CrossRef]
  23. G. E. Rehfeldt et al., ‘Comparative genetic responses to climate in the varieties of Pinus ponderosa and Pseudotsuga menziesii: Clines in growth potential’, Forest Ecology and Management, vol. 324, pp. 138–146, Jul. 2014. [CrossRef]
  24. M. Arend, T. Kuster, M. S. Günthardt-Goerg, and M. Dobbertin, ‘Provenance-specific growth responses to drought and air warming in three European oak species (Quercus robur, Q. petraea and Q. pubescens)’, Tree Physiol, vol. 31, no. 3, pp. 287–297, Mar. 2011. [CrossRef]
  25. J. Burczyk and M. Giertych, ‘Response of Norway spruce (Picea abies [L.] Karst.) annual increments to drought for various provenances and locations’, Silvae Genetica, vol. 40, no. 3–4, pp. 146–152, 1991.
  26. J.-P. George et al., ‘Intra-specific variation in growth and wood density traits under water-limited conditions: Long-term-, short-term-, and sudden responses of four conifer tree species’, Sci Total Environ, vol. 660, pp. 631–643, Apr. 2019. [CrossRef]
  27. G. Mihai, A. M. Alexandru, E. Stoica, and M. V. Birsan, ‘Intraspecific Growth Response to Drought of Abies alba in the Southeastern Carpathians’, Forests, vol. 12, no. 4, Art. no. 4, Apr. 2021. [CrossRef]
  28. C. Trujillo-Moya et al., ‘Drought Sensitivity of Norway Spruce at the Species’ Warmest Fringe: Quantitative and Molecular Analysis Reveals High Genetic Variation Among and Within Provenances’, G3 (Bethesda), vol. 8, no. 4, pp. 1225–1245, Feb. 2018. [CrossRef]
  29. N. Atzmon, Y. Moshe, and G. Schiller, ‘Ecophysiological response to severe drought in Pinus halepensis Mill. trees of two provenances’, Plant Ecology, vol. 171, no. 1, pp. 15–22, Mar. 2004. [CrossRef]
  30. L. Badea, Geografia României. Editura Academiei Republicii Socialiste România, 1983.
  31. C. Nițu et al., ‘Aspecte privind variabilitatea genetică a unor proveniențe de molid.’, Anale Institutul de Cercetari si Amenajari Silvice, pp. 49–58, 1974.
  32. ‘Cybis.se: Technical writing, software development, dendrochronology’. Available online: https://www.cybis.se/ (accessed on 30 May 2023).
  33. F. Campelo, ‘detrendeR: A Graphical User Interface (GUI) to Visualize and Analyze Dendrochronological Data’. Apr. 16, 2022. Available online: https://CRAN.R-project.org/package=detrendeR (accessed on 23 June 2022).
  34. A. Bunn et al., ‘dplR: Dendrochronology Program Library in R’. Jun. 10, 2022. Available online: https://CRAN.R-project.org/package=dplR (accessed on 23 June 2022).
  35. R core team, ‘R: A language and environment for statistical computing’. R Foundation for Statistical Computing, Vienna, Austria, 2020. Available online: https://www.R-project.org/.
  36. G. Bucci, ‘ClimateDT - Climate Downscaling Tool’, ClimateDT - Climate Downscaling Tool. Available online: https://www.ibbr.cnr.it/climate-dt/.
  37. I. Harris, T. J. Osborn, P. Jones, and D. Lister, ‘Version 4 of the CRU TS monthly high-resolution gridded multivariate climate dataset’, Sci Data, vol. 7, no. 1, Art. no. 1, Apr. 2020. [CrossRef]
  38. J. Lowe et al., ‘UKCP 18 Science Overview Report November 2018 ( Updated March 2019 )’, 2019. Available online: https://www.semanticscholar.org/paper/UKCP-18-Science-Overview-Report-November-2018-(-)-Lowe-Bernie/54488c065cea5439195e2d901120670808fb6e9b#paper-header (accessed on 17 May 2023).
  39. S. M. Vicente-Serrano, S. Beguería, and J. I. López-Moreno, ‘A Multiscalar Drought Index Sensitive to Global Warming: The Standardized Precipitation Evapotranspiration Index’, Journal of Climate, vol. 23, no. 7, pp. 1696–1718, Apr. 2010. [CrossRef]
  40. S. Beguería and S. M. Vicente-Serrano, ‘SPEI: Calculation of the Standardised Precipitation-Evapotranspiration Index’. Jun. 07, 2017. Available online: https://CRAN.R-project.org/package=SPEI (accessed on 9 May 2022).
  41. C. W. Thornthwaite, ‘An Approach toward a Rational Classification of Climate’, Geographical Review, vol. 38, no. 1, pp. 55–94, 1948. [CrossRef]
  42. F. Lloret, E. G. Keeling, and A. Sala, ‘Components of tree resilience: effects of successive low-growth episodes in old ponderosa pine forests’, Oikos, vol. 120, no. 12, pp. 1909–1920, 2011. [CrossRef]
  43. C. Zang and F. Biondi, ‘treeclim: an R package for the numerical calibration of proxy-climate relationships’, Ecography, vol. 38, no. 4, pp. 431–436, 2015. [CrossRef]
  44. C. P. Bueno de Mesquita, C. T. White, E. C. Farrer, L. M. Hallett, and K. N. Suding, ‘Taking climate change into account: Non-stationarity in climate drivers of ecological response’, Journal of Ecology, vol. 109, no. 3, pp. 1491–1500, 2021. [CrossRef]
  45. M. Kuhn [aut et al., ‘caret: Classification and Regression Training’. Aug. 09, 2022. Available online: https://CRAN.R-project.org/package=caret (accessed on 17 May 2022).
  46. T. Wang, G. A. O’Neill, and S. N. Aitken, ‘Integrating environmental and genetic effects to predict responses of tree populations to climate’, Ecological Applications, vol. 20, no. 1, pp. 153–163, 2010. [CrossRef]
  47. C. Andalo, J. Beaulieu, and J. Bousquet, ‘The impact of climate change on growth of local white spruce populations in Québec, Canada’, Forest Ecology and Management, vol. 205, no. 1, pp. 169–182, Feb. 2005. [CrossRef]
  48. G. E. Rehfeldt, C. C. Ying, D. L. Spittlehouse, and D. A. Hamilton Jr., ‘Genetic responses to climate in Pinus contorta: Niche breadth, climate change, and reforestation’, Ecological Monographs, vol. 69, no. 3, pp. 375–407, 1999. [CrossRef]
  49. X. Wu et al., ‘Timing and Order of Extreme Drought and Wetness Determine Bioclimatic Sensitivity of Tree Growth’, Earth’s Future, vol. 10, no. 7, p. e2021EF002530, 2022. [CrossRef]
  50. A. Kuznetsova, P. B. Brockhoff, R. H. B. Christensen, and S. P. Jensen, ‘lmerTest: Tests in Linear Mixed Effects Models’. Oct. 23, 2020. Available online: https://CRAN.R-project.org/package=lmerTest (accessed on 8 December 2022).
  51. A. Nanson, Génétique et amélioration des arbres forestiers. Presses Agronomiques de Gembloux, 2004.
  52. V. Stănescu, N. Şofletea, and O. C. Popescu, Flora forestiera lemnoasa a Romaniei. Bucuresti: Ceres, 1997.
  53. X. Wu et al., ‘Uneven winter snow influence on tree growth across temperate China’, Global Change Biology, vol. 25, no. 1, pp. 144–154, 2019. [CrossRef]
  54. A. B. Reinmann, J. R. Susser, E. M. C. Demaria, and P. H. Templer, ‘Declines in northern forest tree growth following snowpack decline and soil freezing’, Global Change Biology, vol. 25, no. 2, pp. 420–430, 2019. [CrossRef]
  55. J. Kreyling, ‘Winter climate change: a critical factor for temperate vegetation performance’, Ecology, vol. 91, no. 7, pp. 1939–1948, 2010. [CrossRef]
  56. J. Hu, D. J. P. Moore, S. P. Burns, and R. K. Monson, ‘Longer growing seasons lead to less carbon sequestration by a subalpine forest’, Global Change Biology, vol. 16, no. 2, pp. 771–783, 2010. [CrossRef]
  57. R. Weigel et al., ‘Winter matters: Sensitivity to winter climate and cold events increases towards the cold distribution margin of European beech (Fagus sylvatica L.)’, Journal of Biogeography, vol. 45, no. 12, pp. 2779–2790, 2018. [CrossRef]
  58. R. Weigel et al., ‘Ecosystem processes show uniform sensitivity to winter soil temperature change across a gradient from central to cold marginal stands of a major temperate forest tree’, Ecosystems, vol. 24, no. 6, pp. 1545–1560, 2021. [CrossRef]
  59. L. Gómez-Aparicio, R. García-Valdés, P. Ruíz-Benito, and M. A. Zavala, ‘Disentangling the relative importance of climate, size and competition on tree growth in Iberian forests: implications for forest management under global change’, Global Change Biology, vol. 17, no. 7, pp. 2400–2414, Jul. 2011. Available online: https://onlinelibrary.wiley.com/doi/abs/10.1111/j.1365-2486.2011.02421.x (accessed on 11 December 2023).
  60. P. Čermák, T. Kolar, T. Žid, M. Trnka, and M. Rybníček, ‘Norway spruce responses to drought forcing in area affected by forest decline’, Forest Systems, vol. 28, p. e016 (13 pages), Oct. 2019. [CrossRef]
  61. A. Augustaitis et al., ‘Tree-ring formation as an indicator of forest capacity to adapt to the main threats of environmental changes in Lithuania’, Science of The Total Environment, vol. 615, pp. 1247–1261, Feb. 2018. [CrossRef]
  62. E. Linkevičius, A. Kliučius, G. Šidlauskas, and A. Augustaitis, ‘Variability in Growth Patterns and Tree-Ring Formation of East European Scots Pine (Pinus sylvestris L.) Provenances to Changing Climatic Conditions in Lithuania’, Forests, vol. 13, no. 5, Art. no. 5, May 2022. [CrossRef]
  63. C.-C. Roibu et al., ‘The Climatic Response of Tree Ring Width Components of Ash (Fraxinus excelsior L.) and Common Oak (Quercus robur L.) from Eastern Europe’, Forests, vol. 11, no. 5, Art. no. 5, May 2020. [CrossRef]
  64. F. Knutzen et al., ‘Impacts and damages of the European multi-year drought and heat event 2018–2022 on forests, a review’, EGUsphere, pp. 1–56, Jul. 2023. [CrossRef]
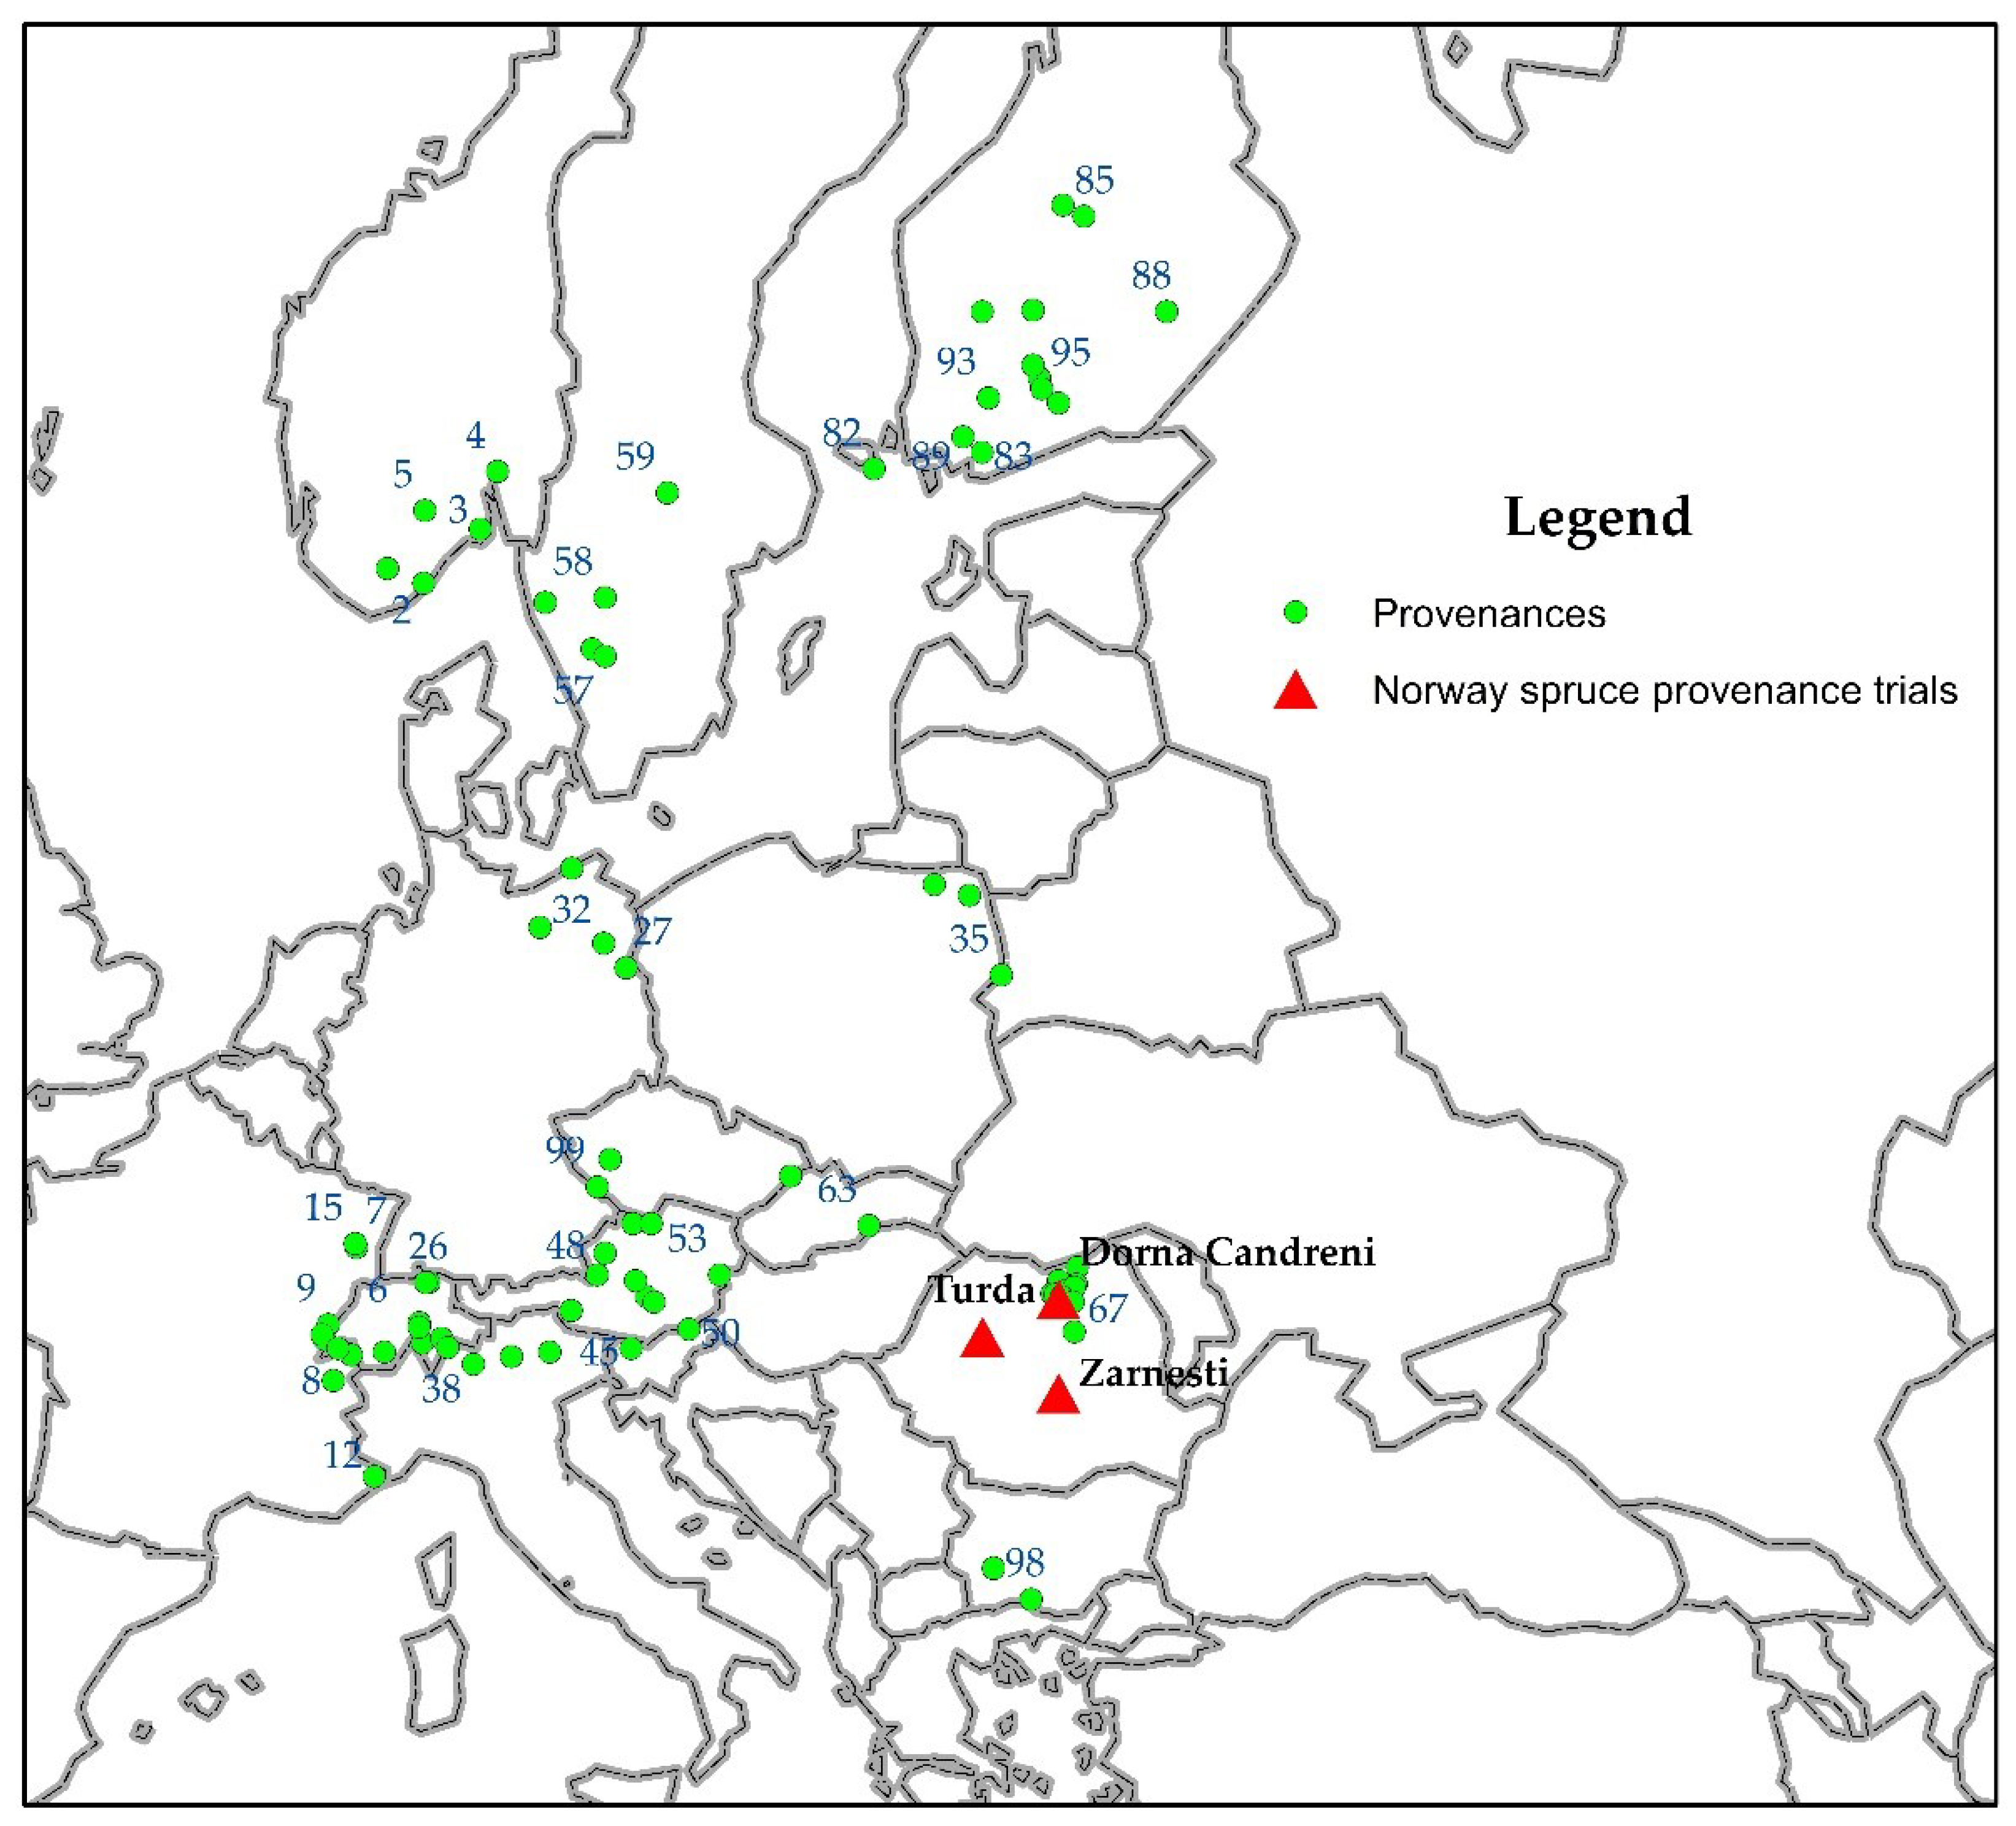
Figure 1. The locations of the Norway spruce provenances (dots and numbers) and of the provenance trials (red triangles).
Preprints 96253 g001
Figure 2. The variation of mean annual temperature (MAT) and annual precipitations (AP) for the Norway spruce provenance trials for the 1972-2020 period; A-Dorna Candrenilor, B-Turda, C- Zarnesti.
Preprints 96253 g002
Figure 3. Variation of SPEI-3 for the Norway spruce provenance trials, for the period 1972-2020; A - Dorna Candrenilor, B - Turda, C - Zarnesti.
Preprints 96253 g003
Figure 4. Variation of wood traits of Norway spruce for the period 1981-2020; A - Dorna Candrenilor, B - Turda, C - Zarnesti. RWI –ring width index; EWI –earlywood width index; LWI – latewood width index; LWP – latewood percentage. .
Preprints 96253 g004
Figure 5. Variation of drought resilience indices of Norway spruce provenances for the year 2000.
Preprints 96253 g005
Figure 6. The moving window correlations for the Dorna Candrenilor trial of Norway spruce provenances.
Preprints 96253 g006
Table 1. Years and months with extreme drought events for each Norway spruce trial.
Year Months with extreme drought event
Dorna Candrenilor Turda Zarnesti
1974 April April -
2000 June, December June, December December
2003 June June June, July
2007 - - July
2018 October - October
2020 January - -
Table 2. Descriptive statistics of the Norway spruce series at 49 years after planting.
rbar provenance rbar min provenance rbar max Mean RW (mm) Min RW
(mm)
Max RW
(mm)
Dorna Candrenilor 0.908 0.802, prov 90 0.961, prov 54 2.73 2.15, prov 83 3.11, prov 25
Turda 0.876 0.729, prov 67 0.941, prov 75 2.81 2.31, prov 83 3.92, prov 10
Zarnesti 0.876 0.705, prov 18 0.942, prov 42 2.55 2.13, prov 94 3.18, prov 55
rbar -the mean series intercorrelation; RW – ring width.
Table 3. The results for random- and fixed-effects of the wood widths and LWP in each Norway spruce provenance trials evaluated at age 49.
Trait LRTp LRT year x prov Vp V year x prov Vr MS B MS Year Mean ± SD
Zarnesti RW 711.55*** 66.98*** 0.027 0.0155 0.6887 91.56*** 1116.66*** 2.73 ± 0.18
EW 677.85*** 84.63*** 0.0208 0.014 0.5416 38.94*** 739.12*** 2.08 ± 0.14
LW 376.41*** 0.00 0.0019 0.00 0.1146 11.12*** 46.88*** 0.66 ± 0.07
LWP 510.66*** 0.00 2.462 0.00 110.742 4583.1*** 13944.9*** 27.06 ± 1.54
Dorna Candrenilor RW 712.85*** 12.42*** 0.027 0.0072 0.7982 47.88*** 1996.86*** 2.55 ± 0.19
EW 579.62*** 30.60*** 0.0182 0.0092 0.6241 12.07*** 1310.91*** 1.90 ± 0.17
LW 639.68*** 1.29ns 0.0027 0.0003 0.0933 16.981*** 65.855*** 0.65 ± 0.05
LWP 491.92*** 26.37*** 1.696 0.900 69.428 3207.5*** 20586.8*** 27.78 ± 1.65
Turda RW 1259.9*** 0.00 0.0644 0.00 1.0744 2.09 1315.16*** 2.81 ± 0.29
EW 1003.0*** 0.00 0.038 0.00 0.7551 2.28* 835.49*** 2.03 ± 0.22
LW 996.03*** 0.00 0.0053 0.00 0.1197 0.66** 56.16*** 0.78 ± 0.08
LWP 326.7*** 0.00 1.766 0.00 99.852 1389.3*** 15916*** 30.76 ± 1.62
*,**,*** Significant at 5%, 1% and 0.1%, respectively; LRTp—likelihood ratio test for provenance random effect; LRT year x prov – likelihood ratio test for provenance x year random effect; Vp—variance for provenance random effect; V year x prov – variance for provenance x year random effect; Vr—residual variance; MS B—mean squares for block effect; MS Year — mean squares for year effect; RW – ring width; EW – earlywood width; LW – latewood width; LWP – latewood percentage.
Table 5. Correlation coefficients between drought indices and geographic coordinates of Norway spruce provenances at 49 years after planting.
Recovery Resilience Rel. resilience Latitude Longi- tude Elevation
Dorna Candrenilor Resistance -0.610*** 0.605*** -0.506*** -0.037 -0.114 0.128*
Recovery 0.215*** 0.941*** 0.131* 0.038 -0.132*
Resilience 0.381*** 0.074 -0.099 0.043
Rel. resilience 0.123 0.025 -0.103
Zarnesti Resistance -0.689*** -0.008 -0.688*** 0.215*** 0.120 -0.121
Recovery 0.493*** 0.967*** -0.236*** -0.317*** 0.111
Resilience 0.520*** -0.223*** -0.277*** 0.124
Rel. resilience -0.239*** -0.312*** 0.117
Turda Resistance -0.689*** 0.336*** -0.749*** 0.103 0.167** 0.047
Recovery 0.303*** 0.892*** -0.099 -0.151* 0.048
Resilience 0.372*** 0.078 0.019 0.049
Rel. resilience -0.047 -0.152* -0.012
*, **, *** Significant at 5%, 1% and 0.1%, respectively.
Table 6. Correlation coefficients between mean drought indices and wood traits of Norway spruce provenances at 49 years after planting.
Resistance Recovery Resilience Rel. resilience
Dorna Candrenilor EW -0.255*** 0.153* -0.175** 0.106
LW 0.108 -0.097 0.018 -0.106
LWP 0.289*** -0.207** 0.150* -0.173**
RW -0.159* 0.082 -0.132* 0.042
Zarnesti EW -0.007 0.063 -0.043 0.077
LW -0.035 0.137* 0.084 0.141*
LWP -0.035 0.052 0.089 0.034
RW -0.016 0.094 -0.011 0.106
Turda EW -0.370*** 0.347*** -0.050 0.330***
LW -0.267*** 0.277*** -0.004 0.260***
LWP 0.192** -0.065 0.141* -0.090
RW -0.360*** 0.345*** -0.039 0.327***
*, **, *** Significant at 5%, 1% and 0.1%, respectively; RW – ring width; EW – earlywood width; LW – latewood width; LWP – latewood percentage. .
Table 7. The response models for ring width index for Norway spruce provenance trials at 49 years old.
Trial Response Model adj. R2 Partial R2
Factor 1 Factor 2
Zarnesti 11.0156 - 0.0315 MTWaQ2 - 0.0101 prc03 0.561*** 0.545 0.065
Zarnesti 18.5318 - 0.7295 MTWaQ - 0.0001 NFFD2 0.591*** 0.298 0.125
Dorna Candrenilor 15.9955 - 0.0421 MTWaQ2 - 0.0039 AP 0.577*** 0.576 0.125
Turda 13.2377 - 0.0382 MTWaQ2 - 0.0078 PWeQ 0.485*** 0.471 0.157
*** Significant at 0.1%; MTWaQ – mean temperature of the warmest quarter; prc03 – precipitations of March; NFFD – number of frost-free days; AP – sum of annual precipitations; PWeQ – sum of precipitations from the wettest quarter.
Table 8. The response models for latewood percentage for Norway spruce provenance trials at 49 years old.
Trial Response Model adj. R2 Partial R2
Factor 1 Factor 2
Zarnesti -20.0393 + 2.0099 MTWaQ + 0.0004 NFFD2 0.163*** 0.046 0.025
Zarnesti 3.3077 + 0.0906 MTWaQ 2 + 0.0163 prc09 0.143*** 0.131 0.005
Dorna Candrenilor -4.7941 + 0.346*10-5 GDD02 + 0.0580 PWem 0.247*** 0.222 0.086
Turda 2.0515 + 0.0270 GDD5 - 0.0027 SHM2 0.222*** 0.222 0.064
*** Significant at 0.1%; MTWaQ – mean temperature of the warmest quarter; NFFD – number of frost-free days; prc09 – precipitations of September; GDD0 – degree-days above 0 °C; GDD5 – degree-days above 5 °C; PWem – precipitations from the wettest month; SHM – summer heat moisture index.
Disclaimer/Publisher’s Note: The statements, opinions and data contained in all publications are solely those of the individual author(s) and contributor(s) and not of MDPI and/or the editor(s). MDPI and/or the editor(s) disclaim responsibility for any injury to people or property resulting from any ideas, methods, instructions or products referred to in the content.
Copyright: This open access article is published under a Creative Commons CC BY 4.0 license, which permit the free download, distribution, and reuse, provided that the author and preprint are cited in any reuse.
Prerpints.org logo

Preprints.org is a free preprint server supported by MDPI in Basel, Switzerland.

Subscribe

© 2024 MDPI (Basel, Switzerland) unless otherwise stated