Submitted:
13 January 2024
Posted:
15 January 2024
You are already at the latest version
Abstract
Keywords:
1. Introduction
2. Materials and Methods
2.1. Study area
2.2. Rock mechanics parameter setting
2.2.1. Specimen preparation
2.2.2. Brazilian splitting test
2.2.3. Uniaxial compression test
2.2.4. Triaxial compression test
2.2.5. Measured mechanical parameters
2.3. Similarity material
2.3.1. Similar parameter setting
2.3.2. Similar material proportioning
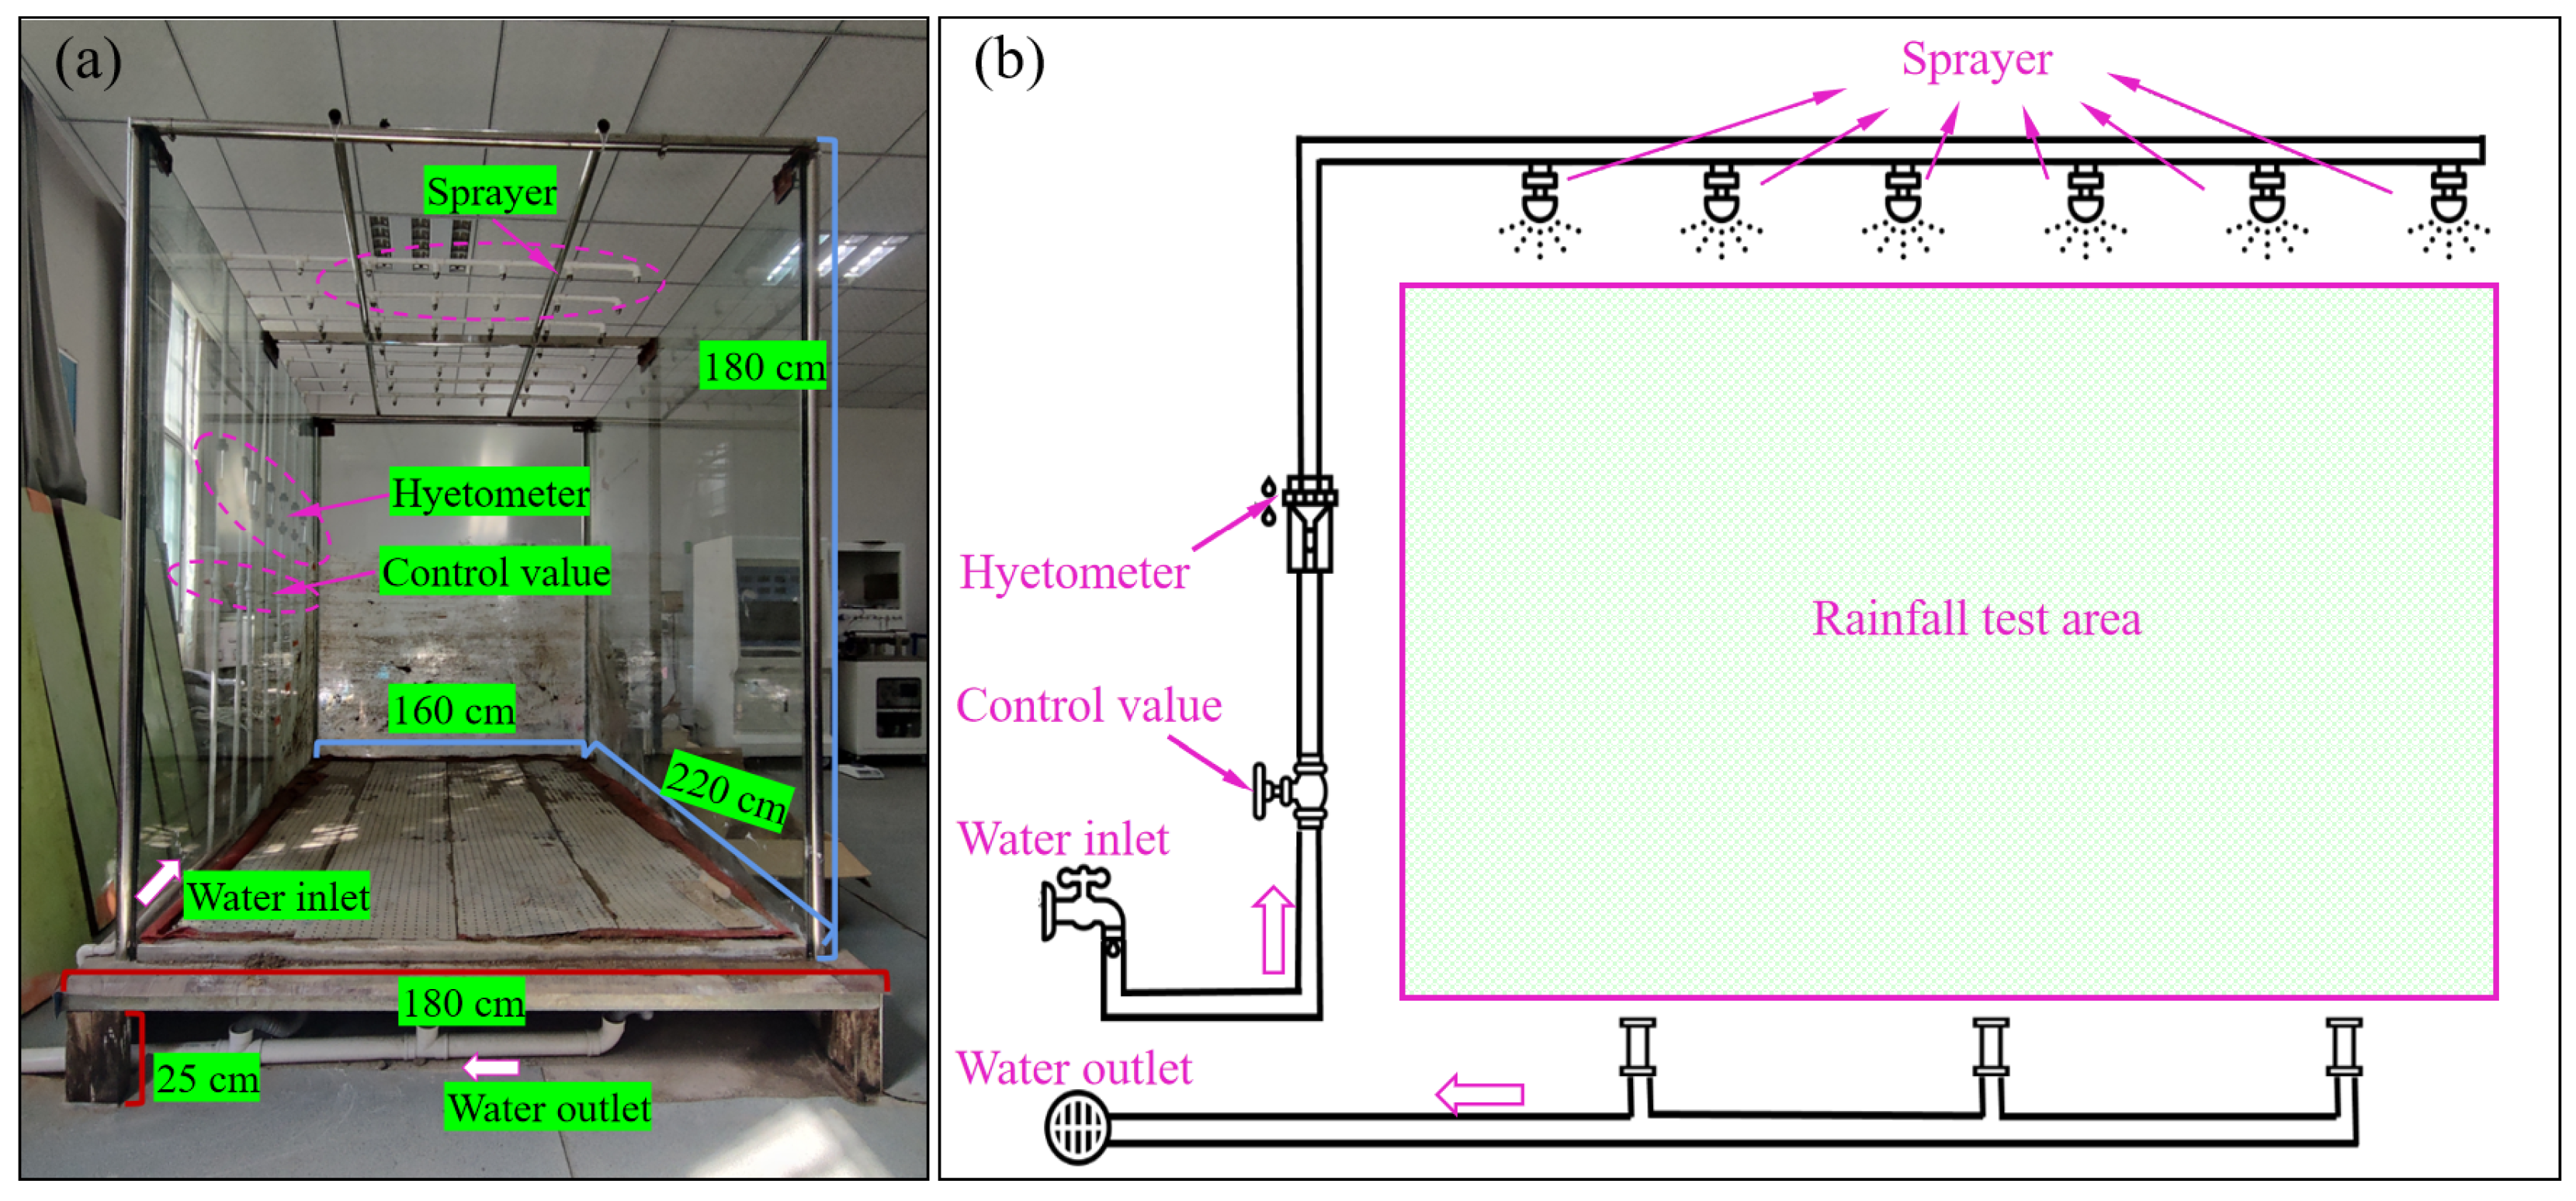
2.4. Artificial simulation rainfall test
2.4.1. Test bench design
2.4.2. Rainfall system design
2.4.3. Rainfall uniformity test
2.5. Similarity simulation experiment procedure
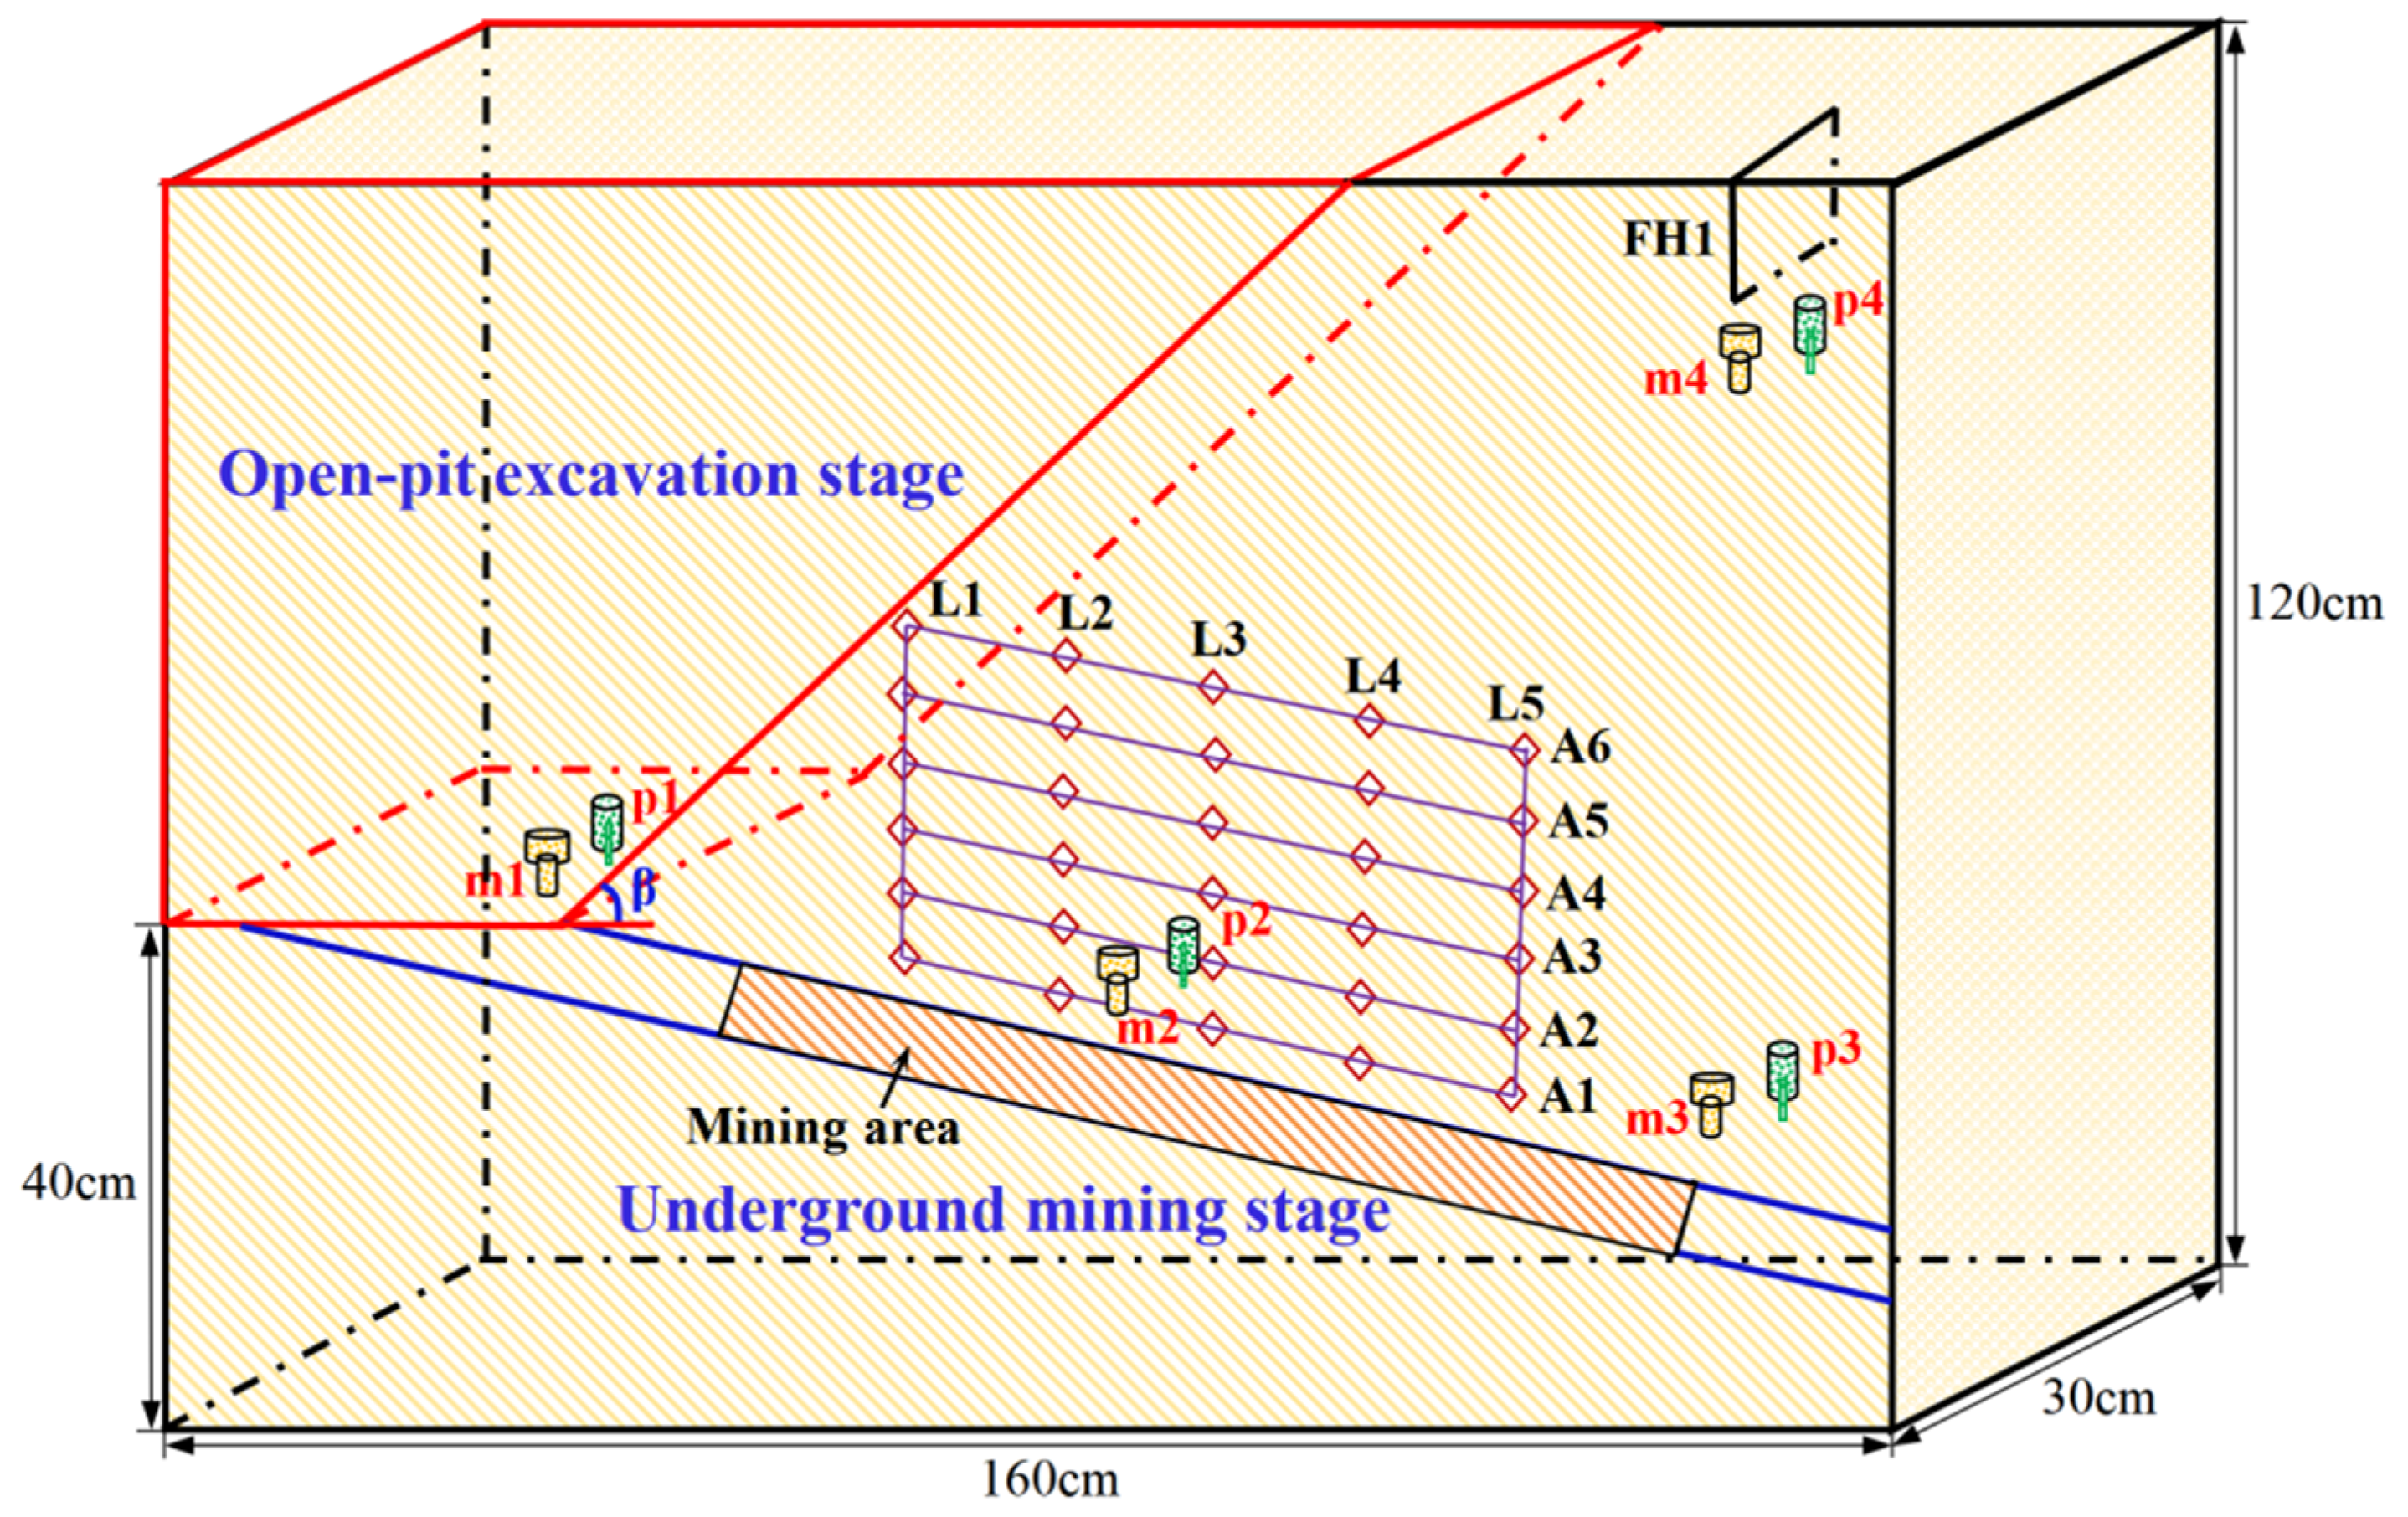
2.5.1. Slope model
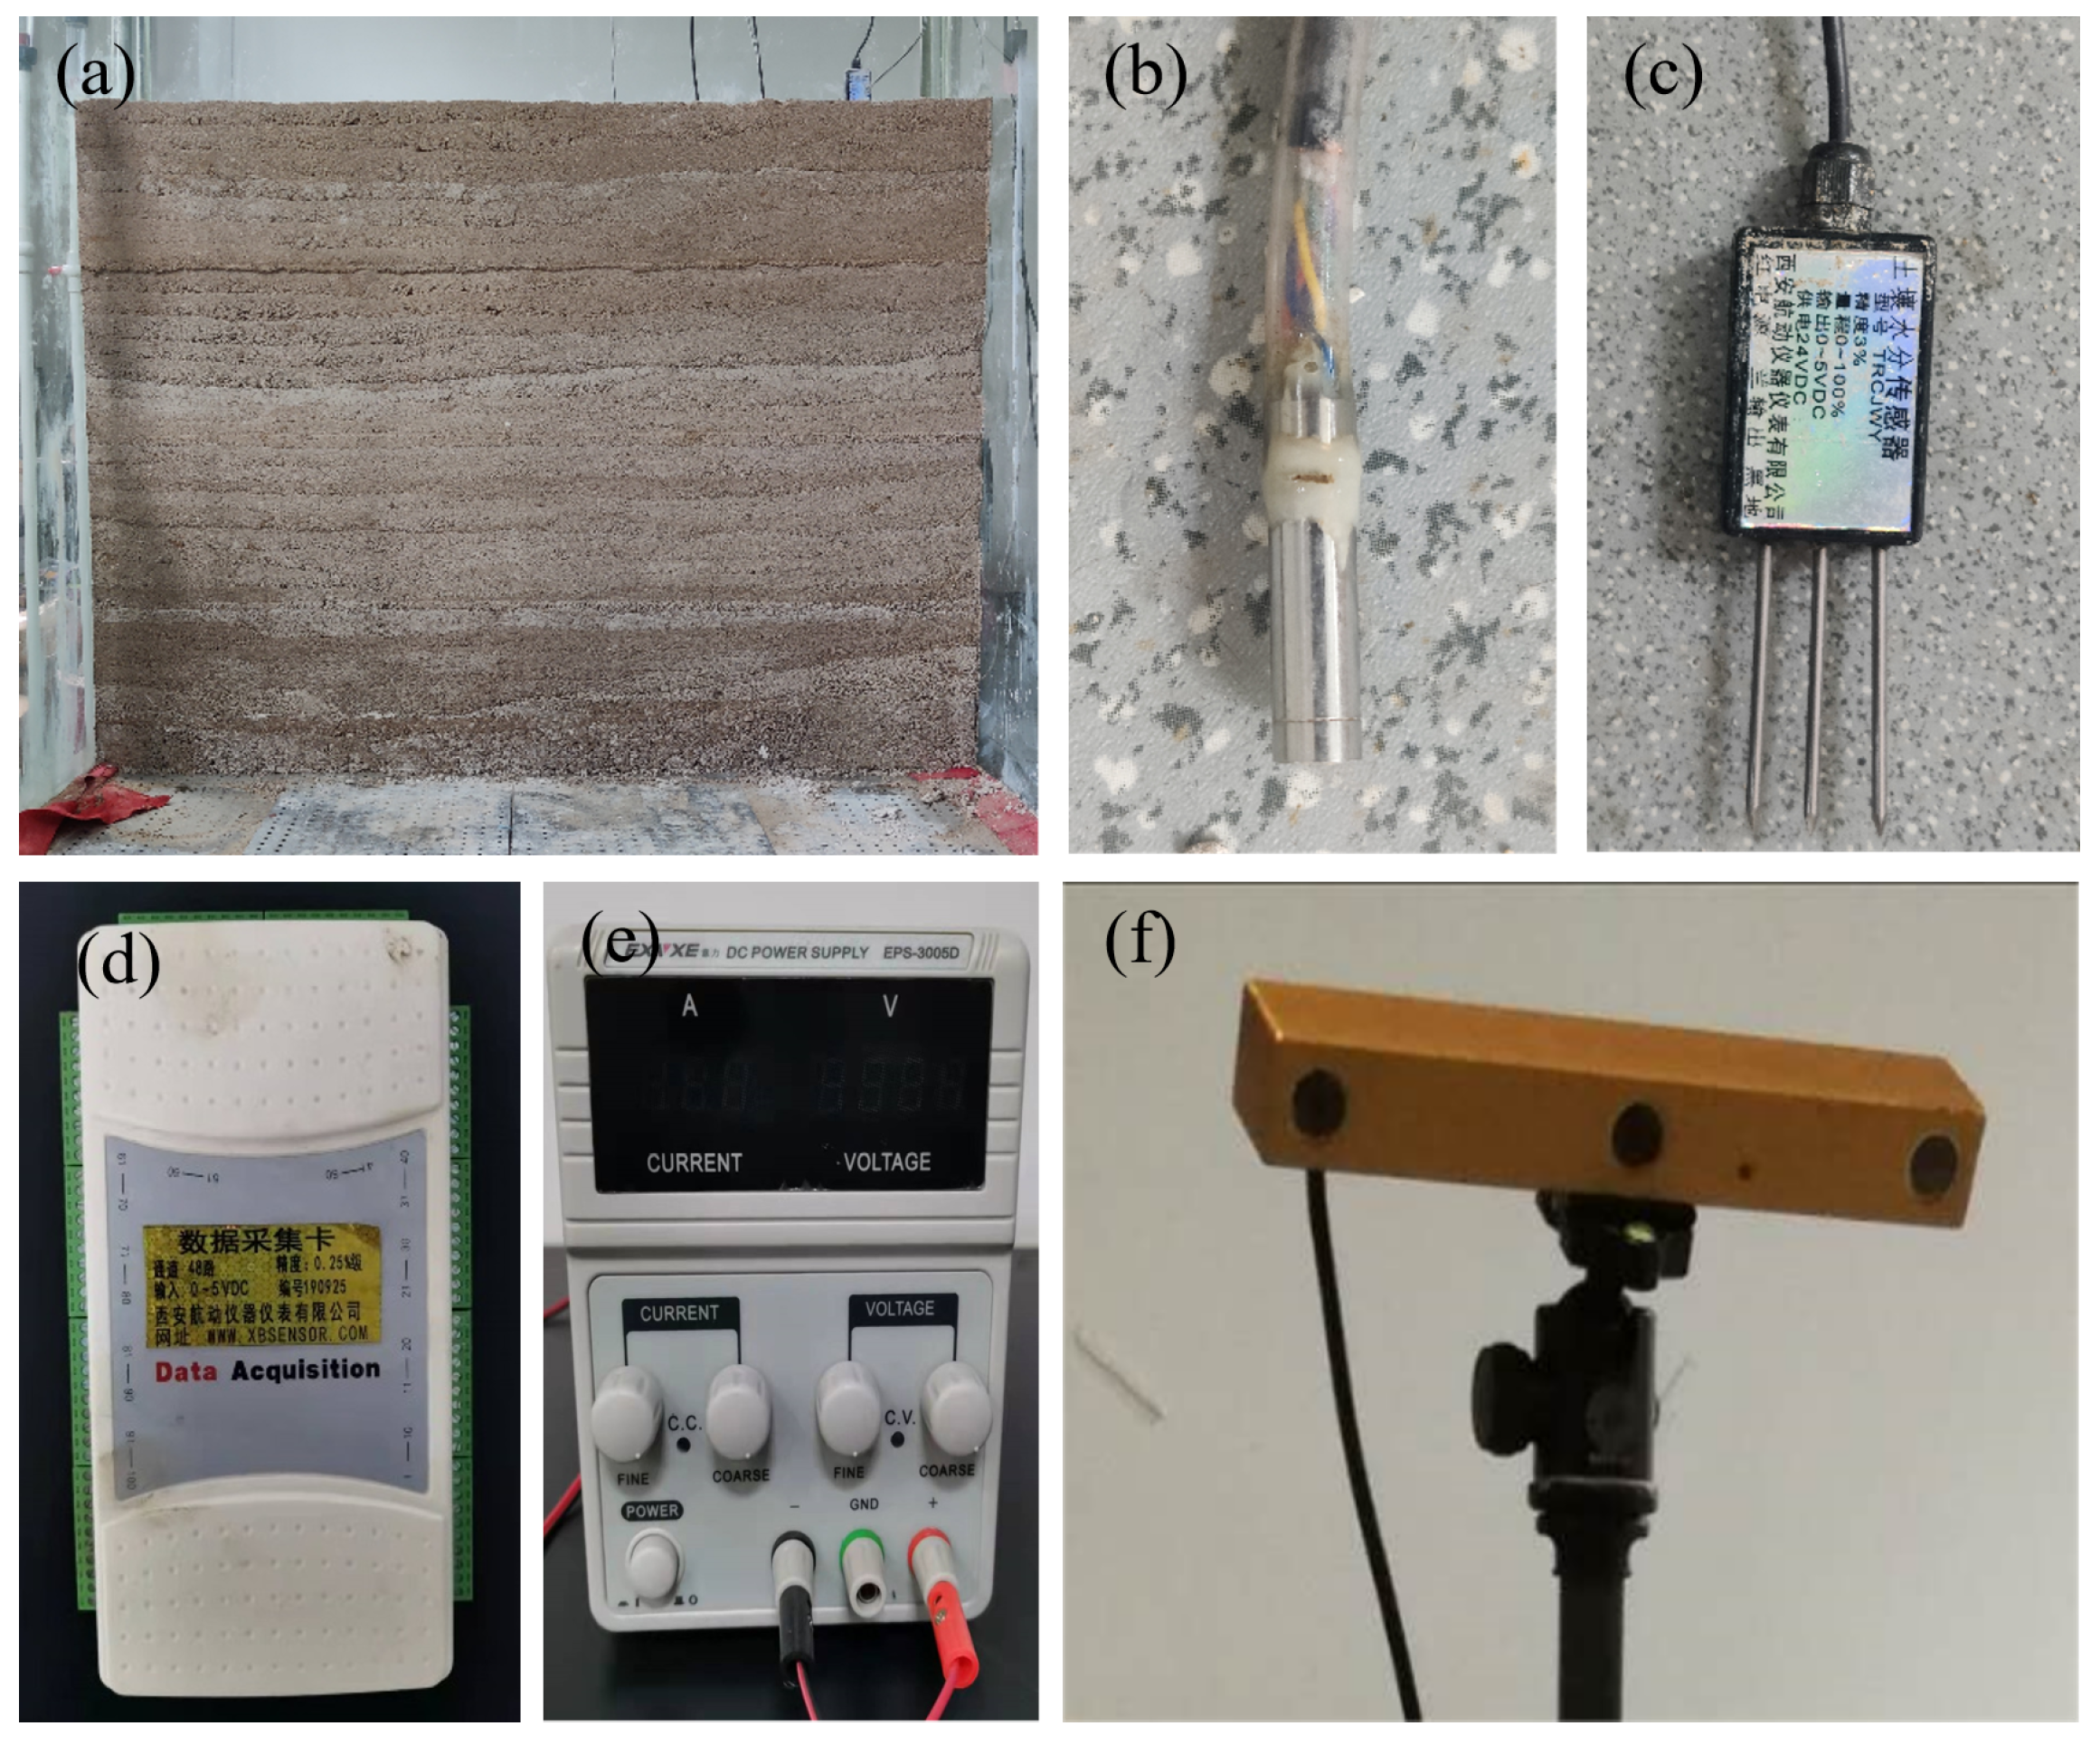
2.5.2. Data acquisition
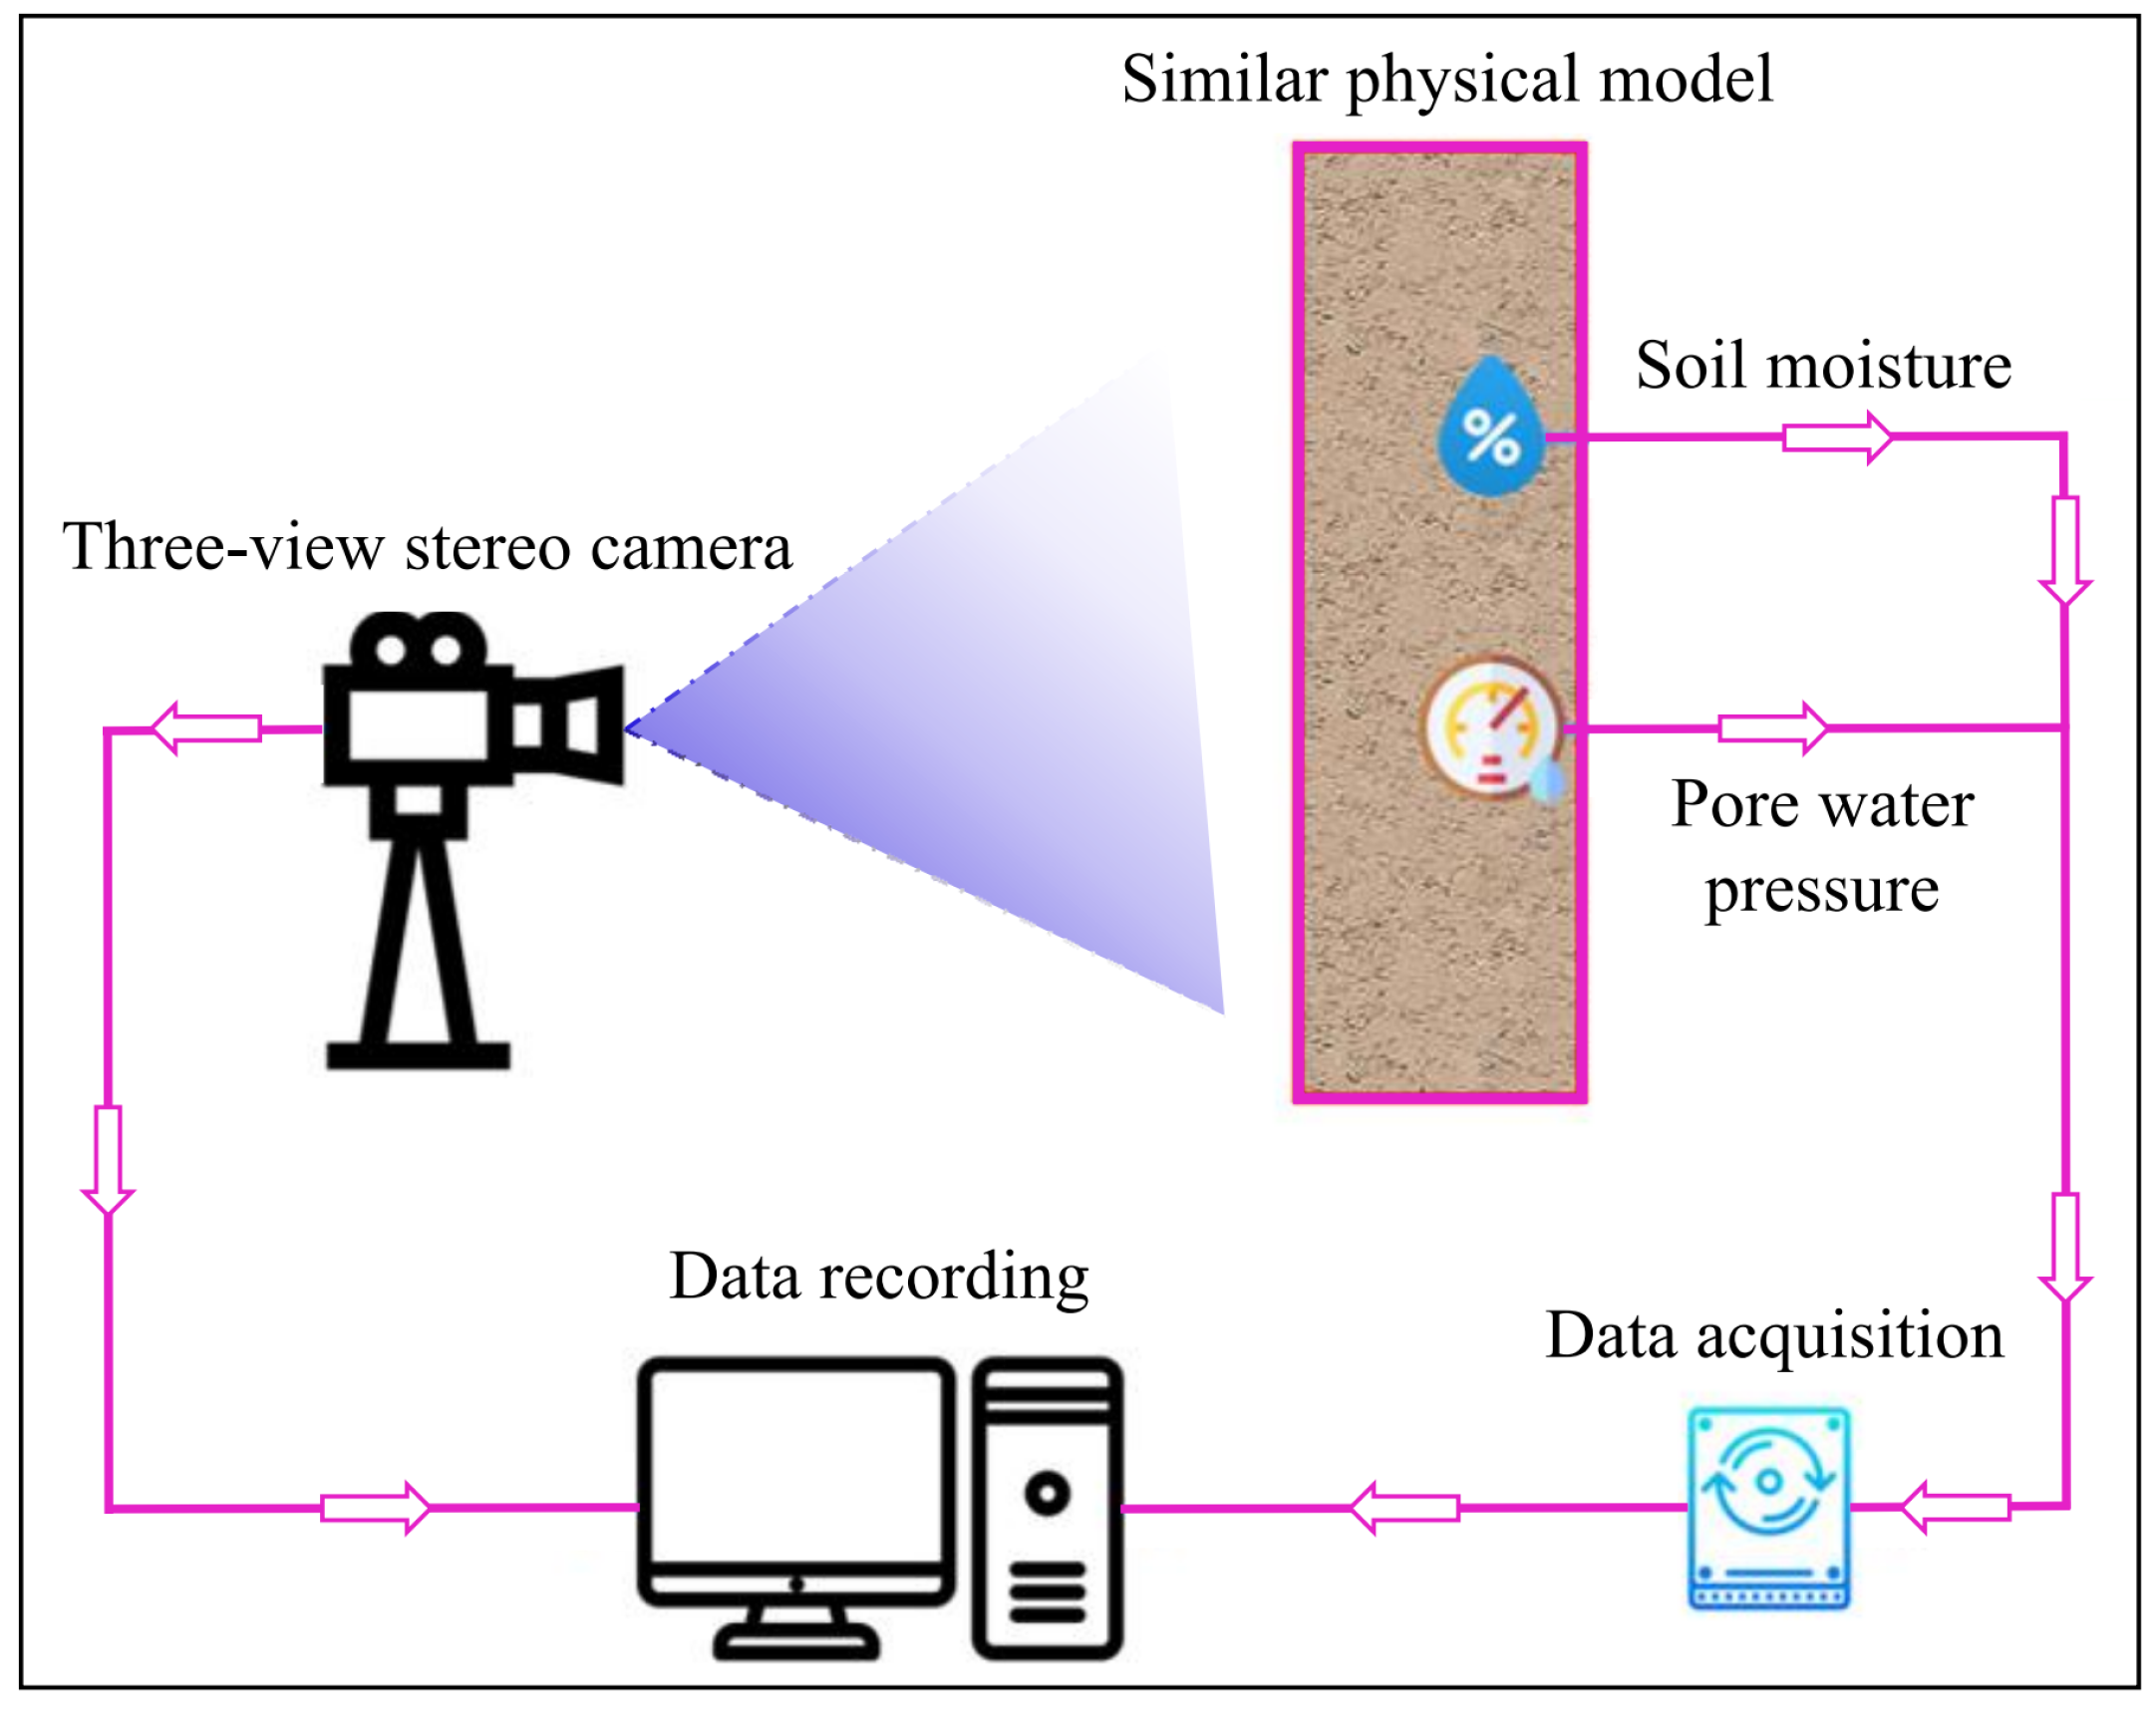
2.5.3. Monitoring system
2.5.4. Experimental scheme
3. Results and discussion
3.1. Variation characteristics of pore water pressure
3.2. Variation characteristics of moisture content
3.3. Variation characteristics of rock mass displacement
4. Conclusions
- (1)
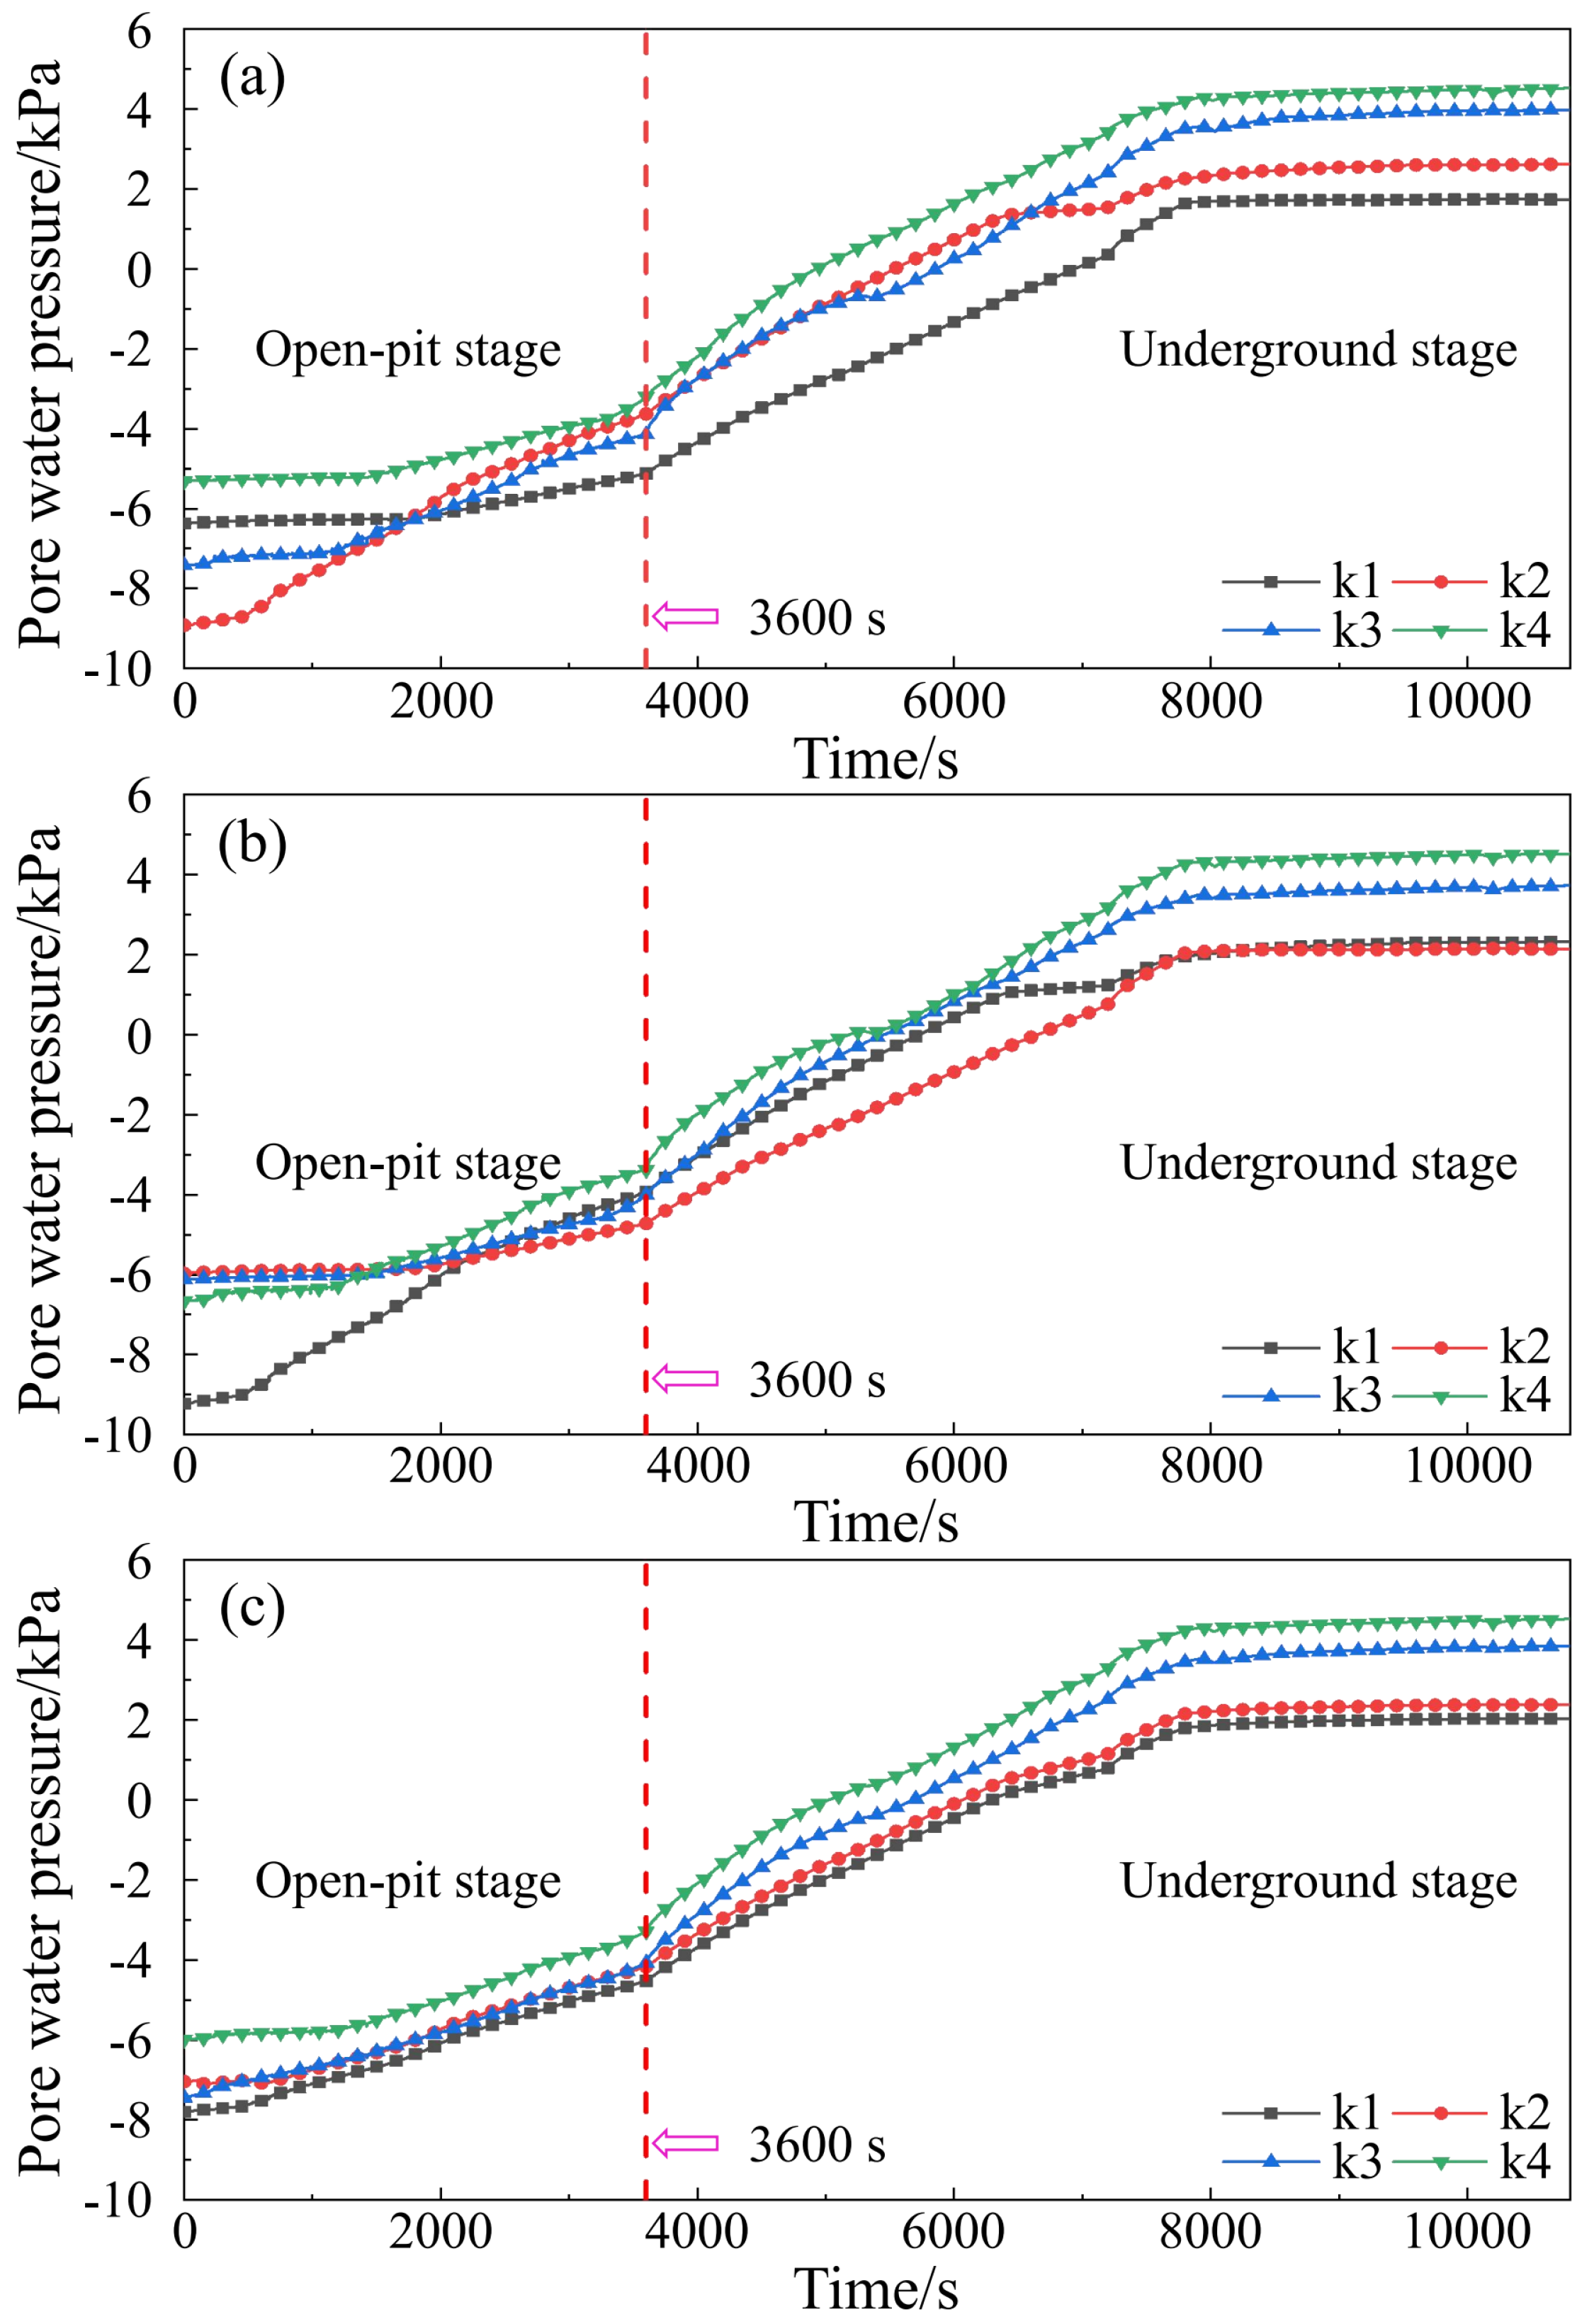
- The experiment shows how rainfall-mining coupling affects the pore water pressure during the transition from open-pit to underground mining. The pore water pressure is higher in the deep rock mass than on the upper surface and the open-pit platform. Rainfall and slope water increase the pore water pressure on the open-pit platform. In the underground mining stage, the pore water pressure rate rises by 0.48%. The pore water pressure is negative before the open-pit mining stage, indicating unsaturated soil. As the experiment continues, the pore water pressure turns positive, and the internal particles shift from inward penetration to free seepage. The pore water pressure changes from negative to positive in the late growth stage and stabilizes at about 30 minutes. The growth stage lasts about 100 minutes, or 60% of the experiment time. The pore water pressure at the top grows faster than the internal one.
- (2)
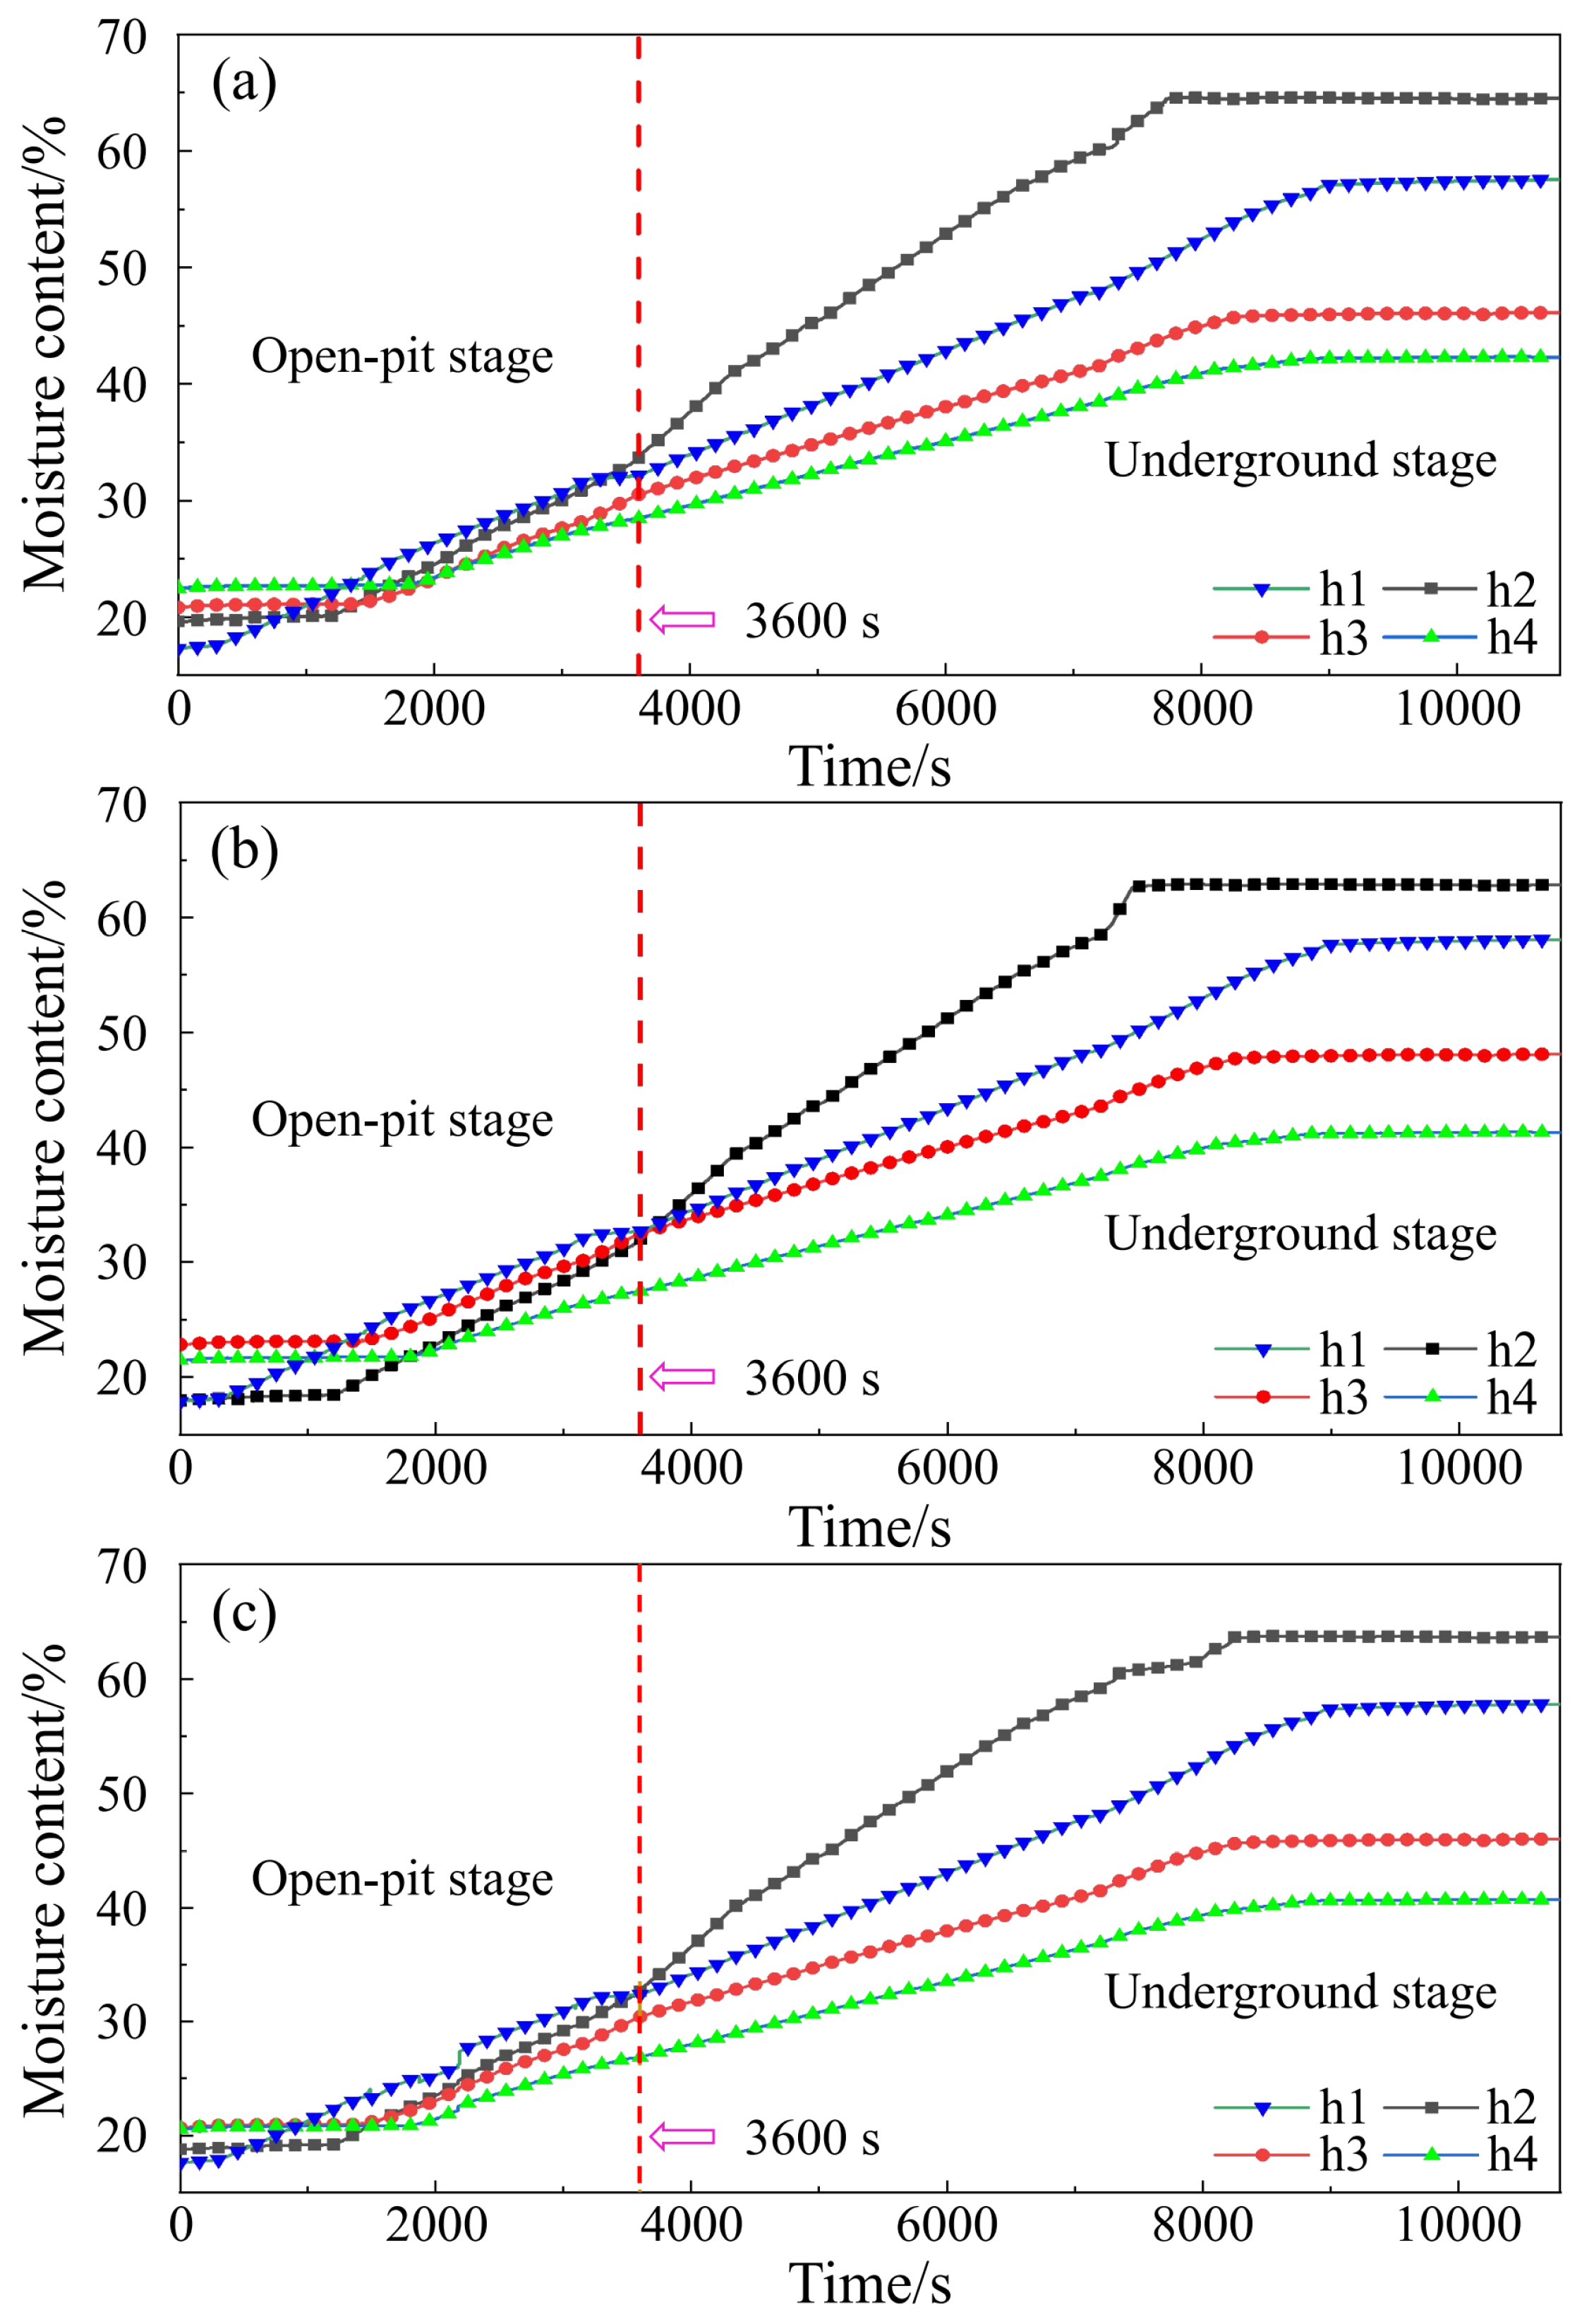
- The moisture content of the upper surface and the open-pit platform changes first and has a larger final value. The surface moisture content value is lower than the internal moisture content of the model. Rainfall and water accumulation from the upper surface make the moisture content of the open-pit platform change significantly after the open-pit mining stage. After the experiment, the moisture content on the upper surface and the platform is higher than that inside the model. The open-pit platform has the maximum moisture content, and the moisture content decreases with depth.
- (3)
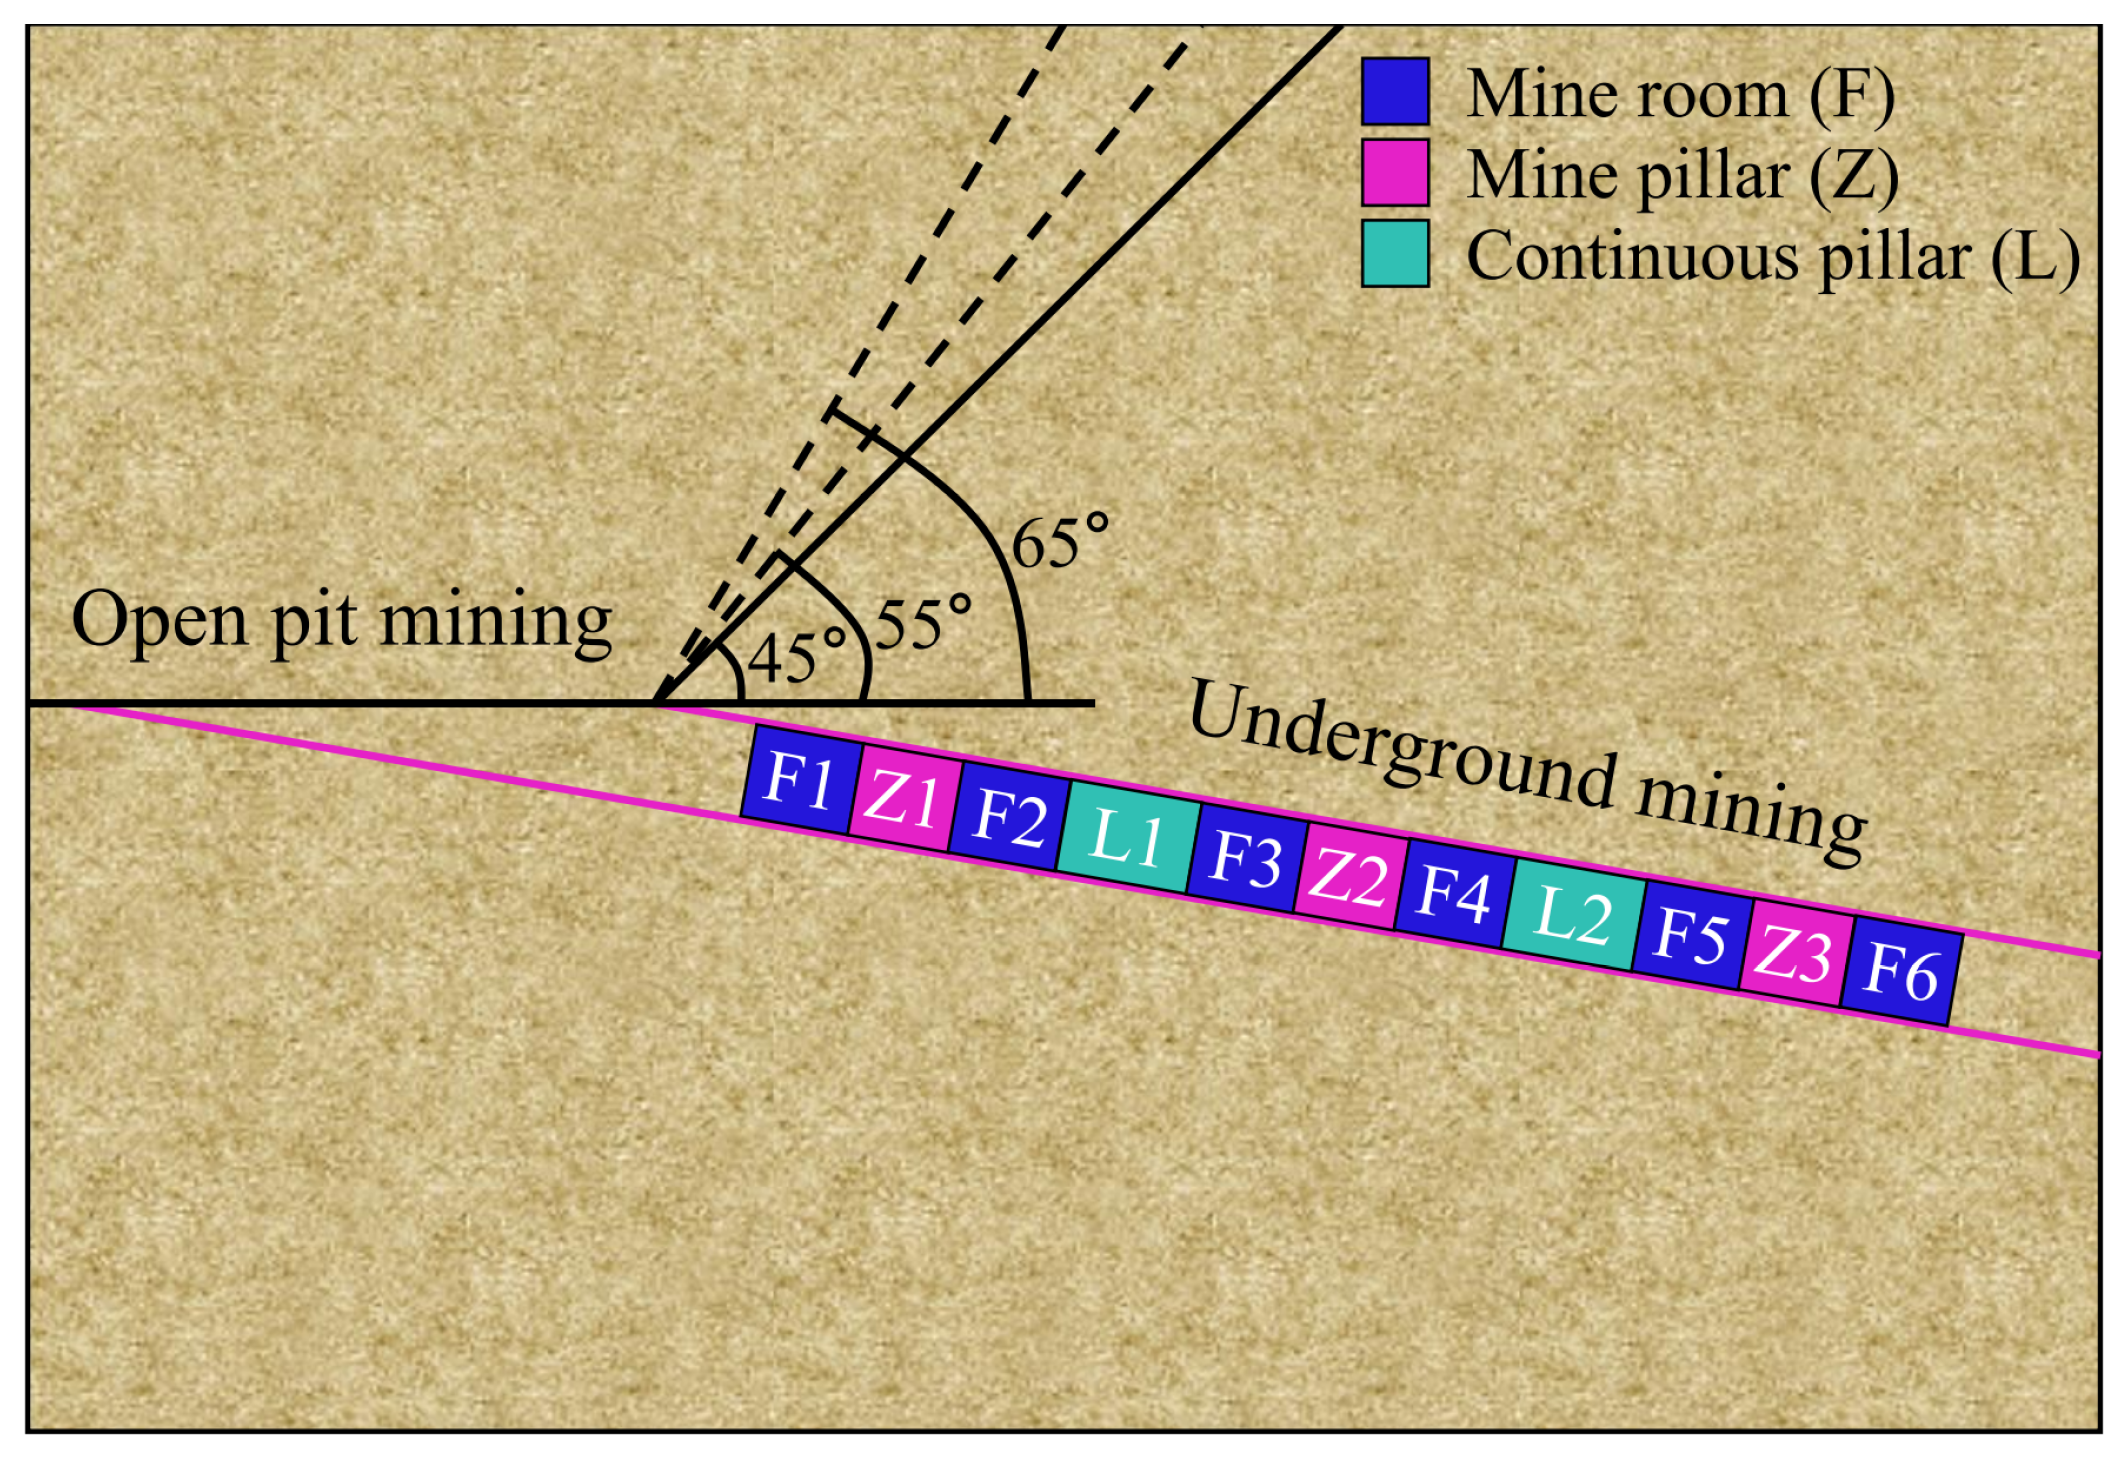
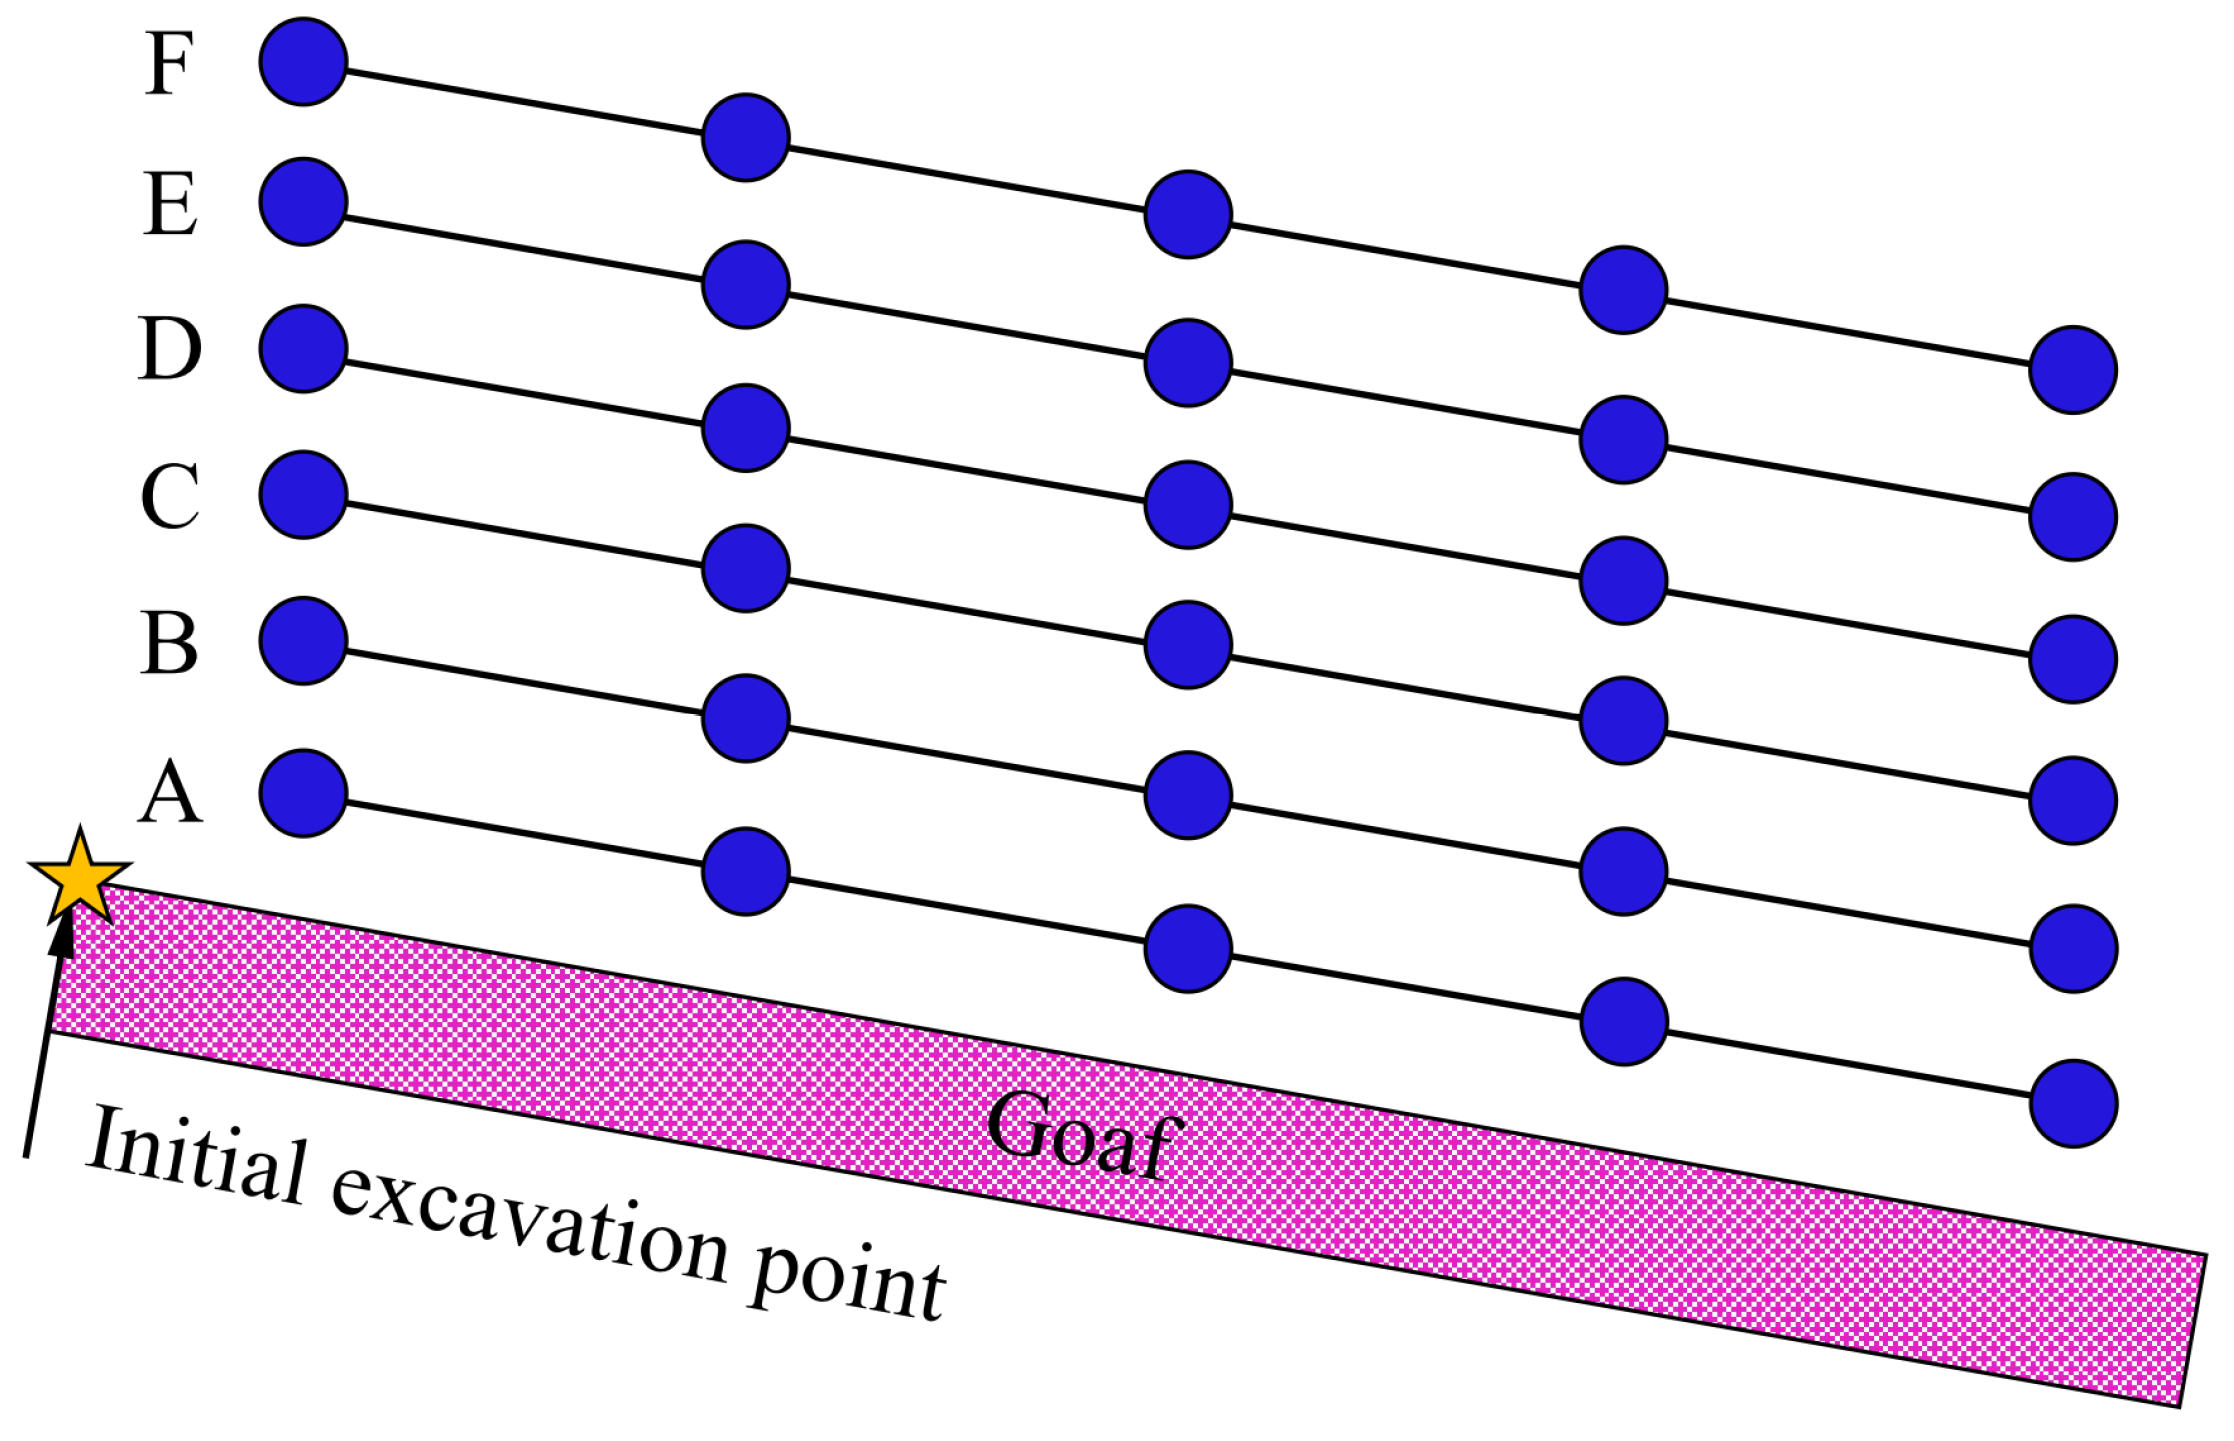
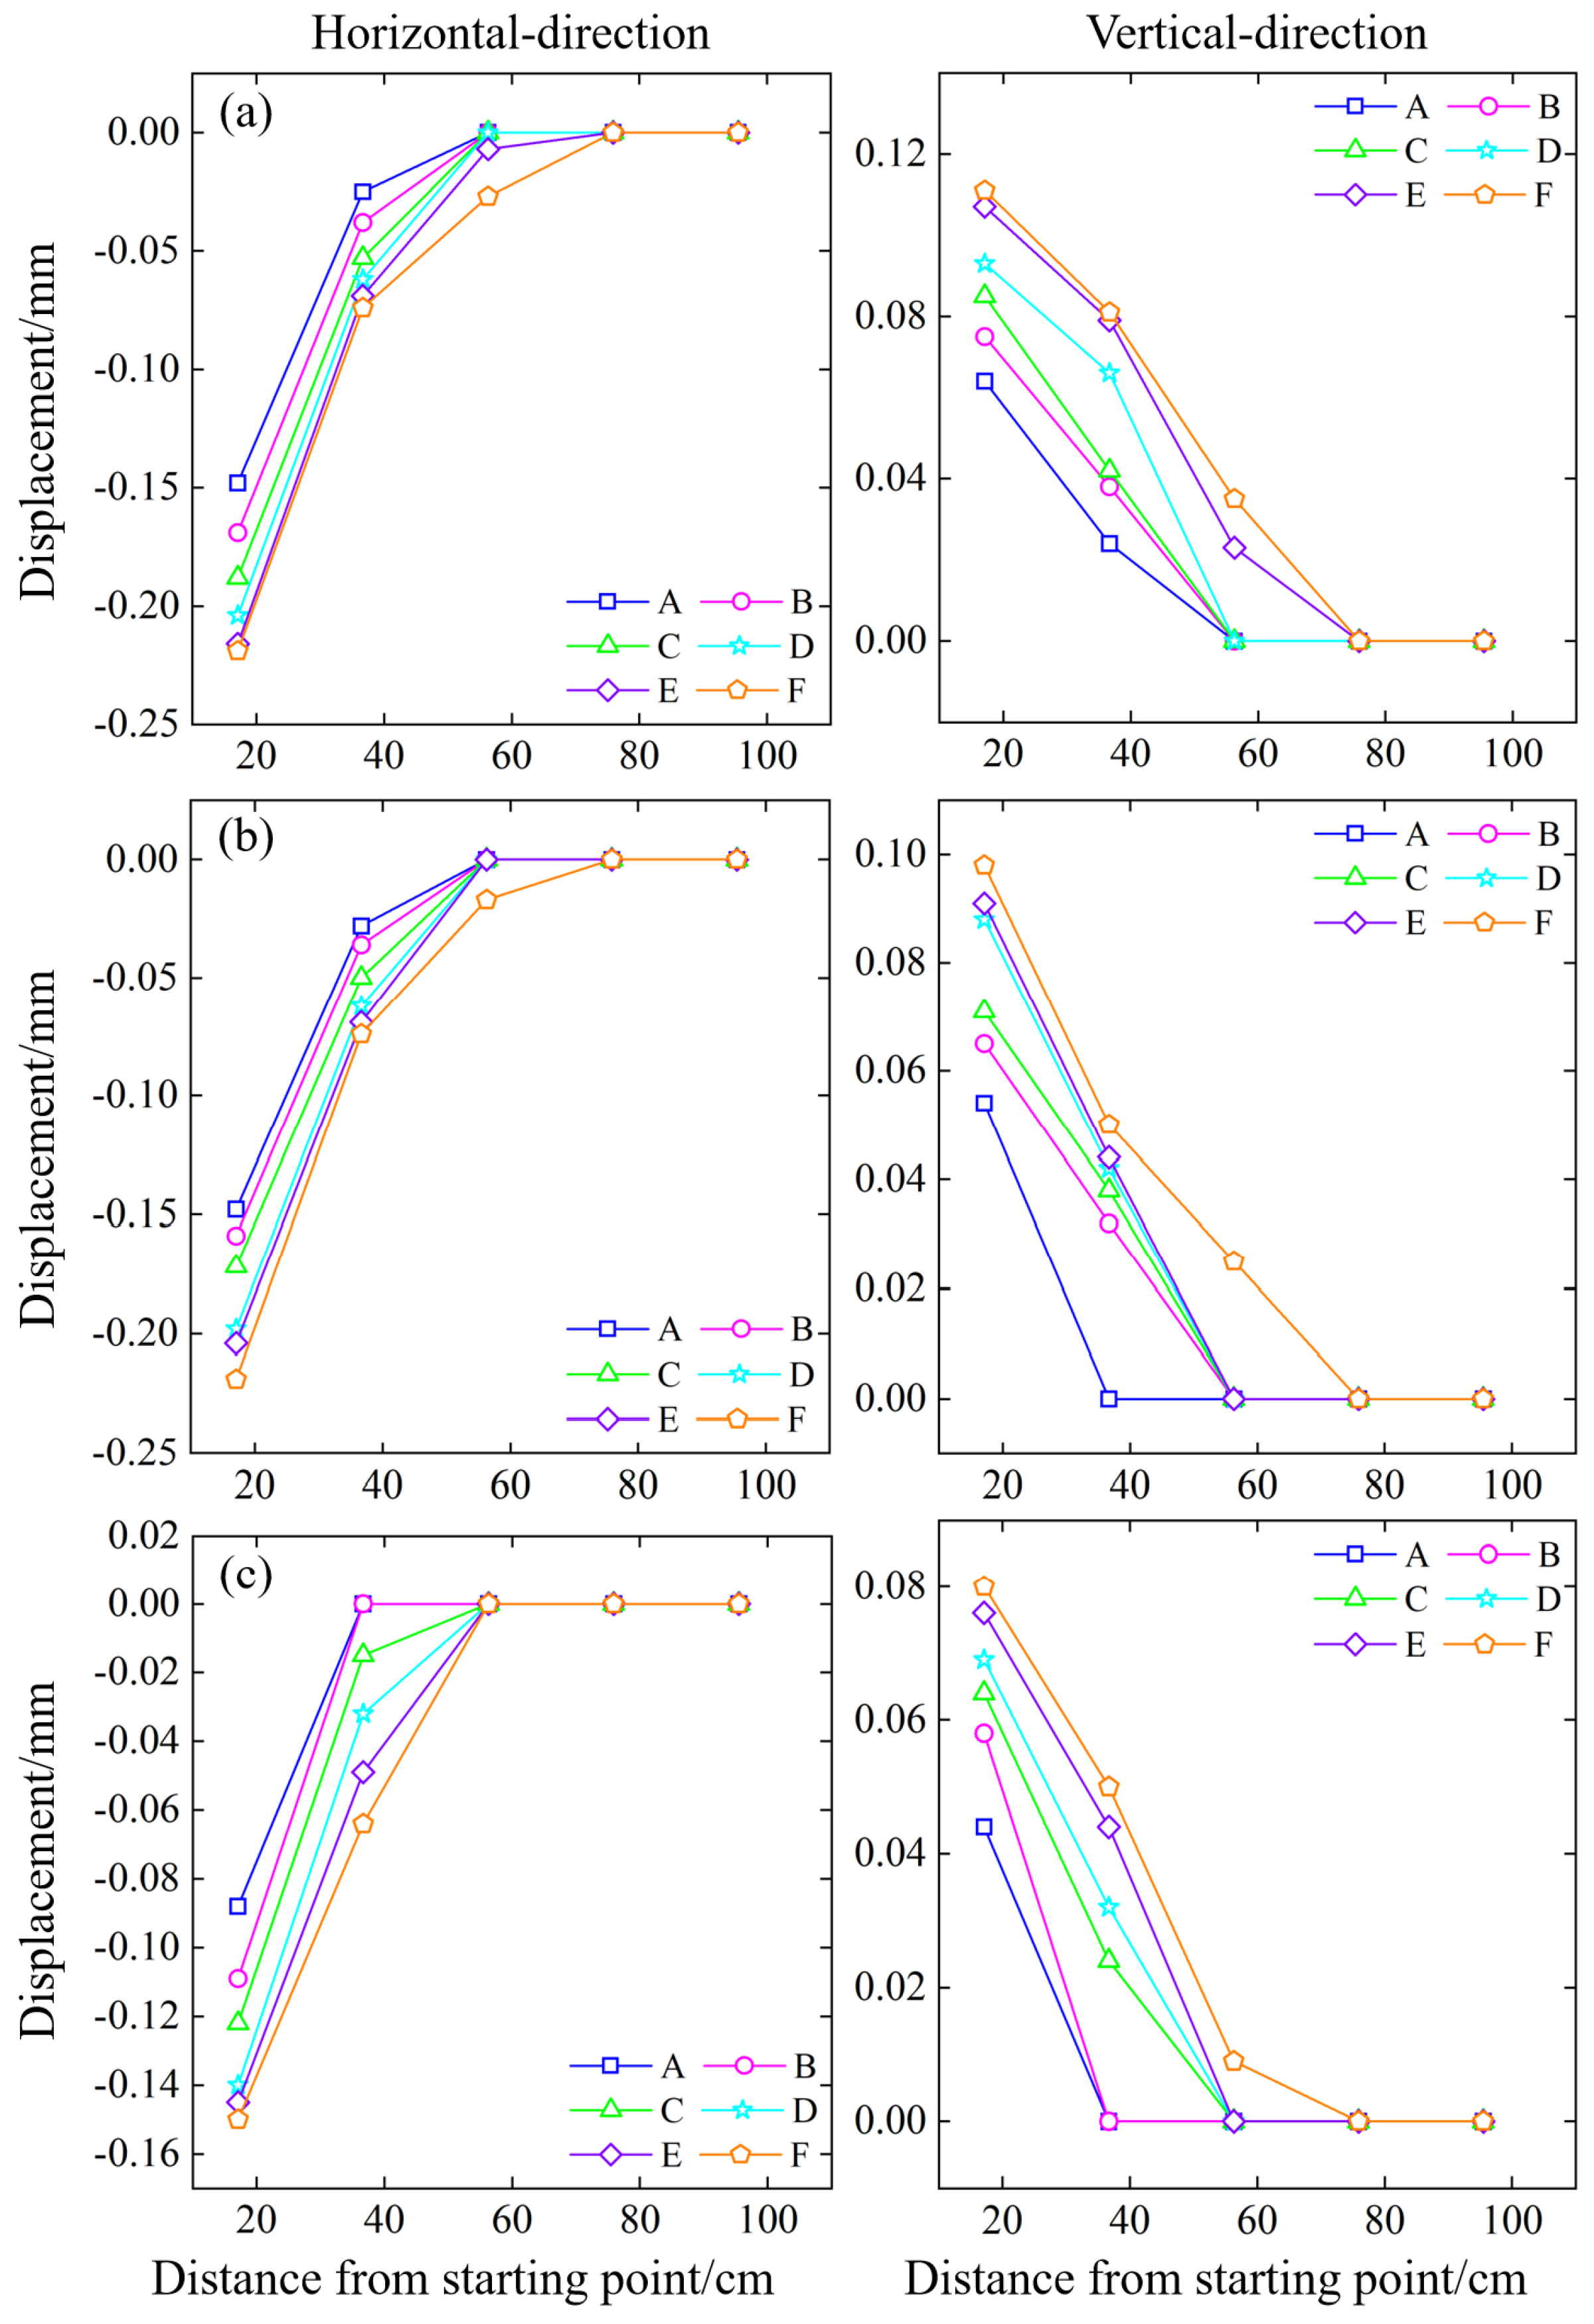
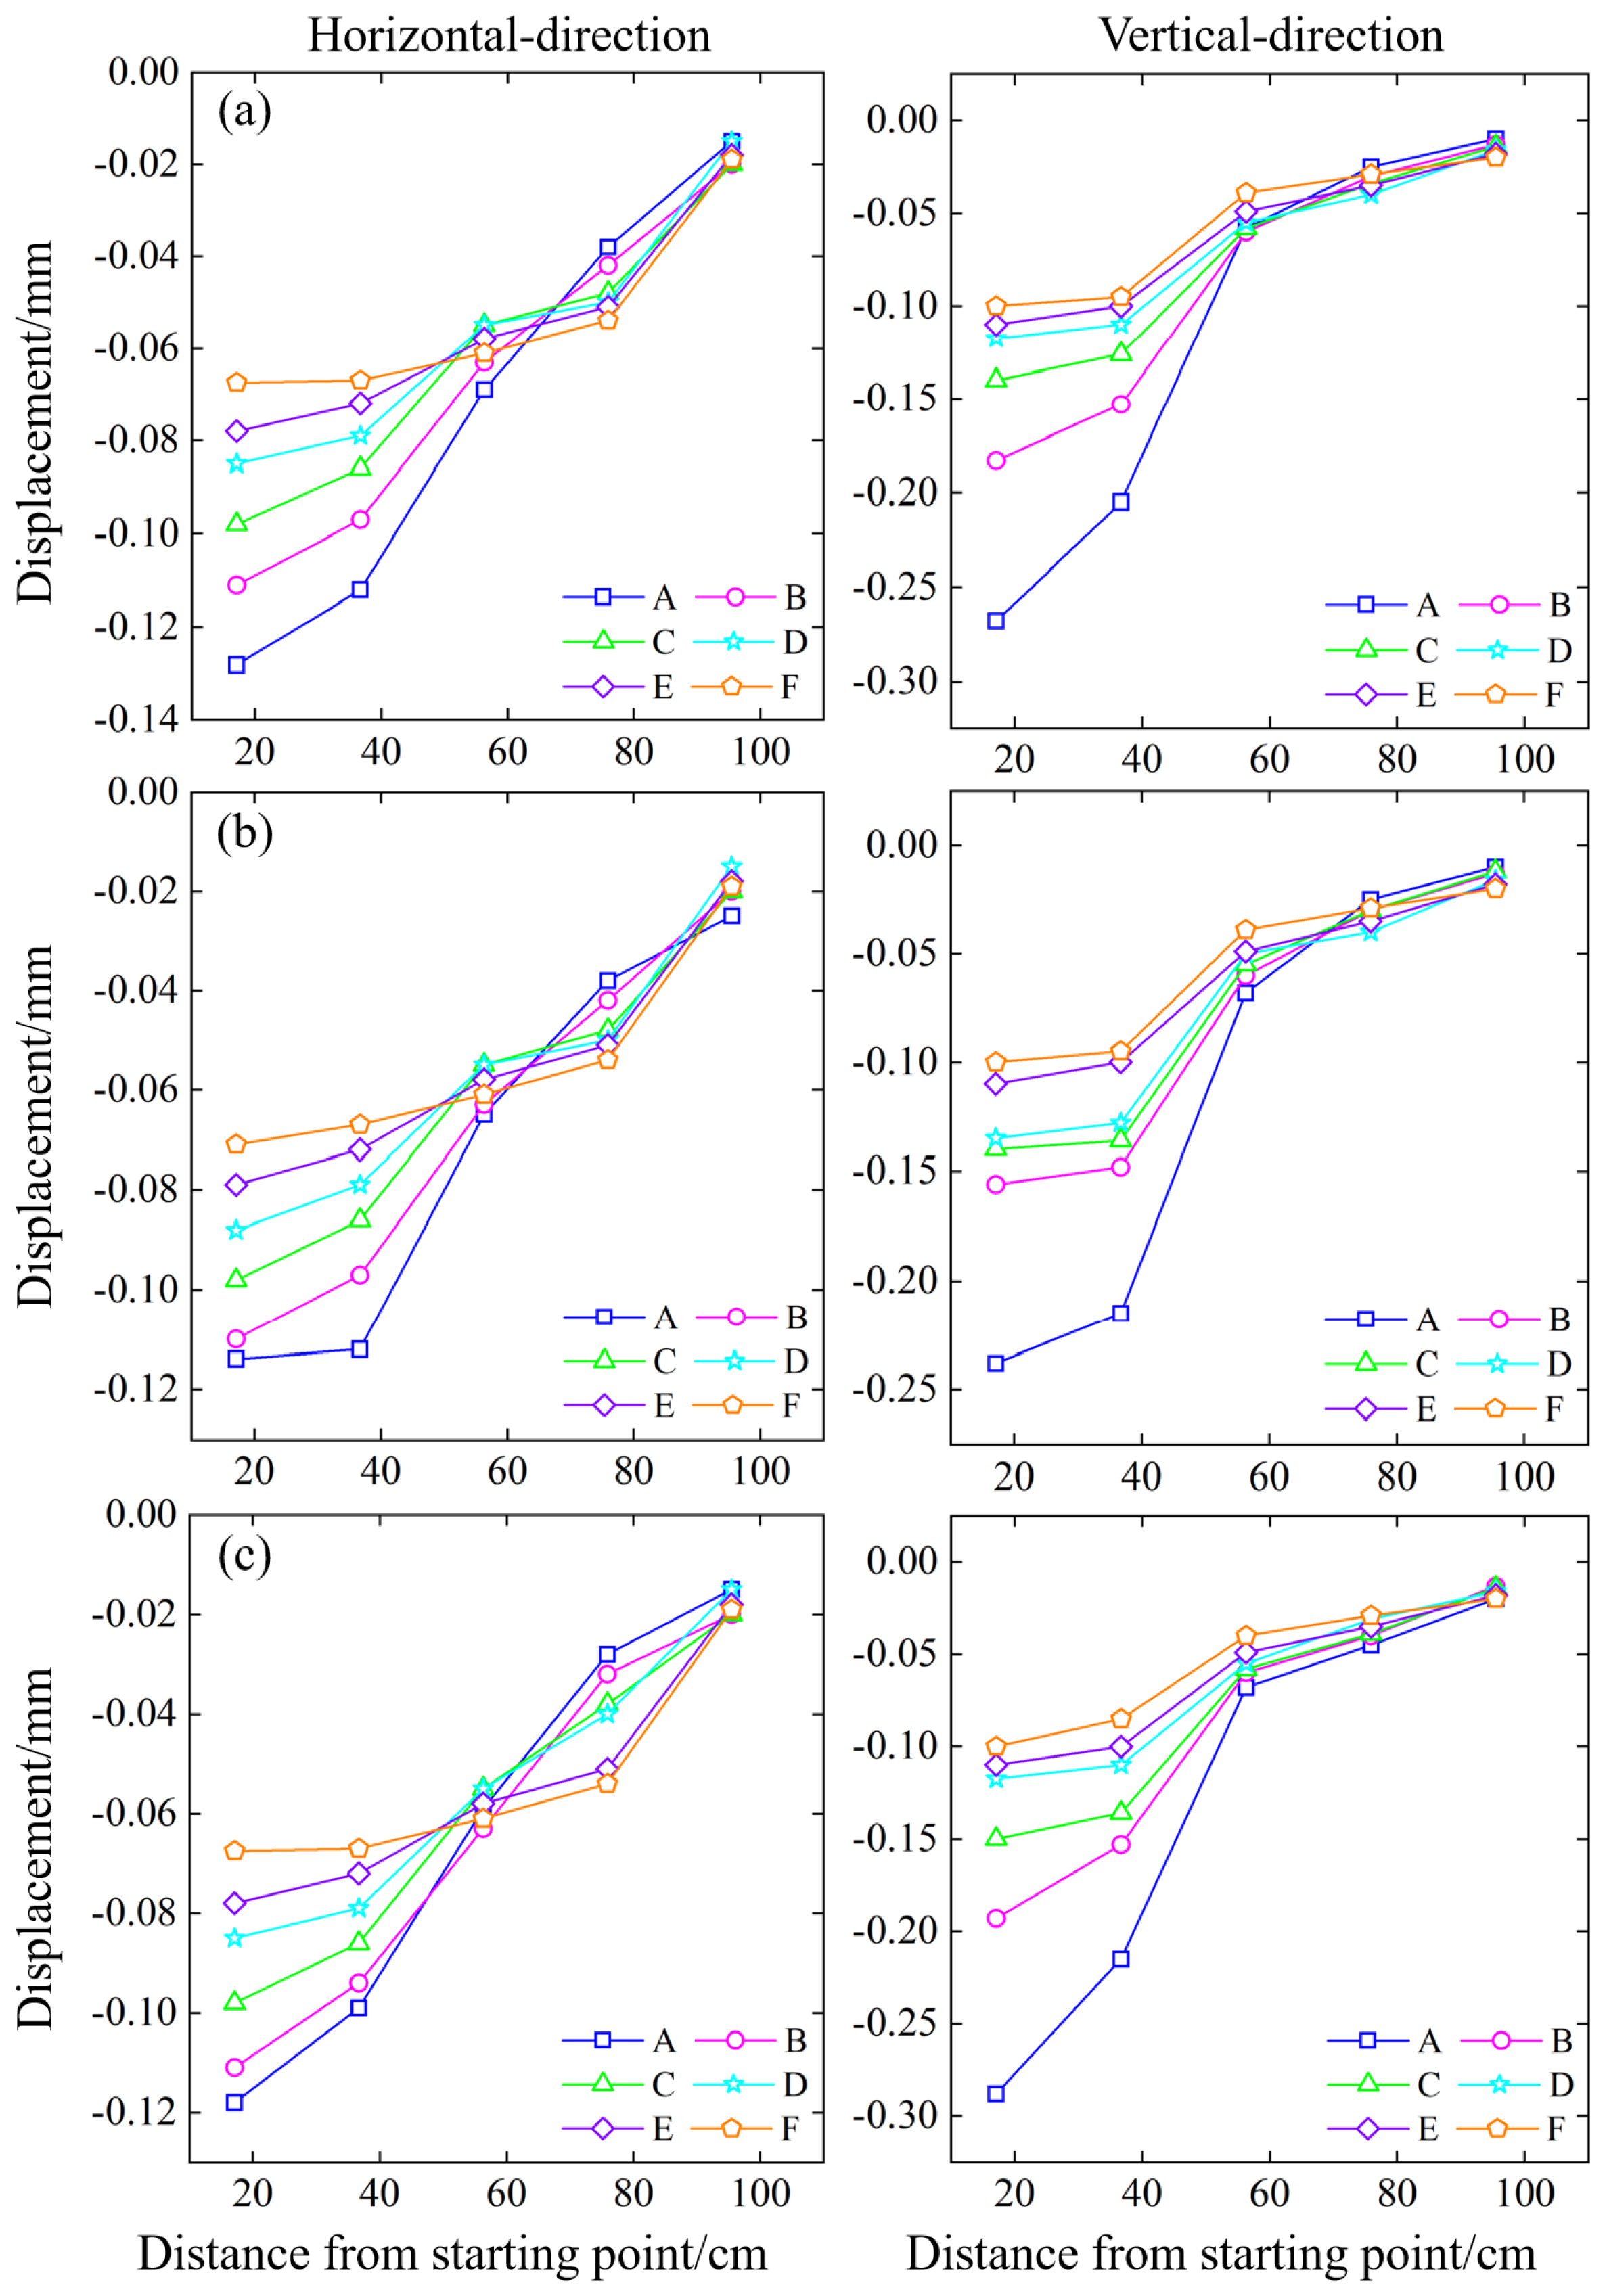
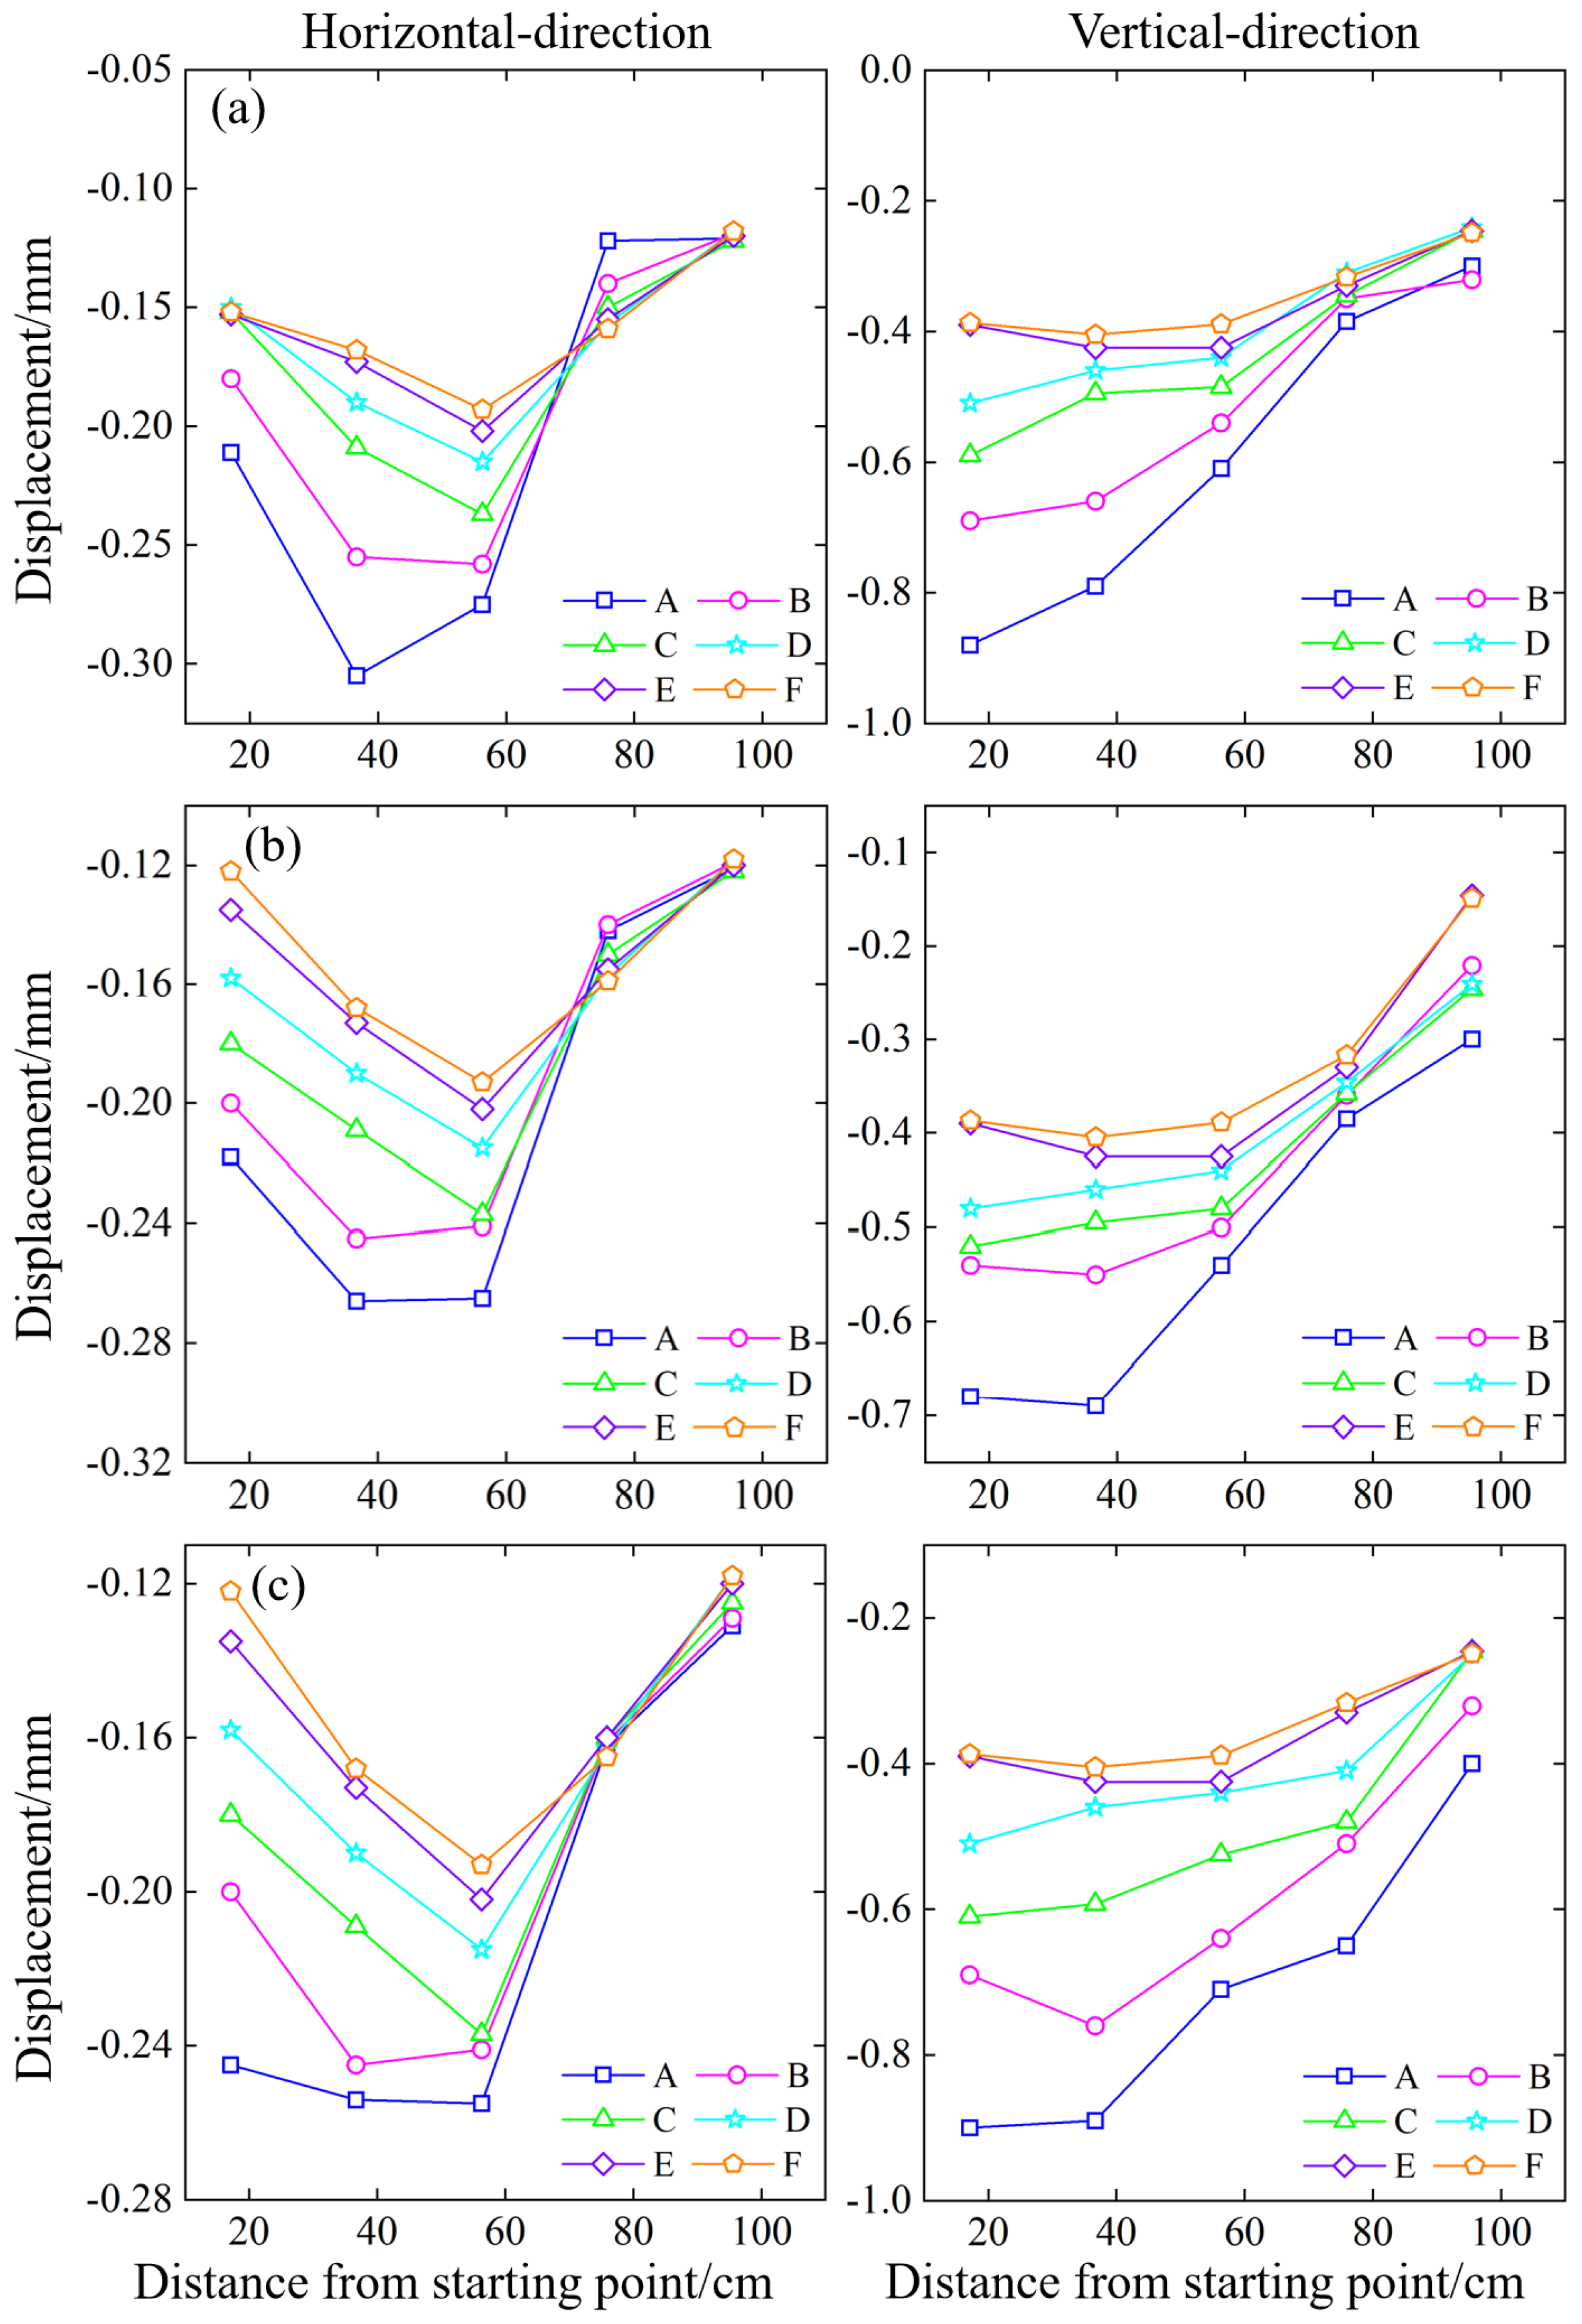
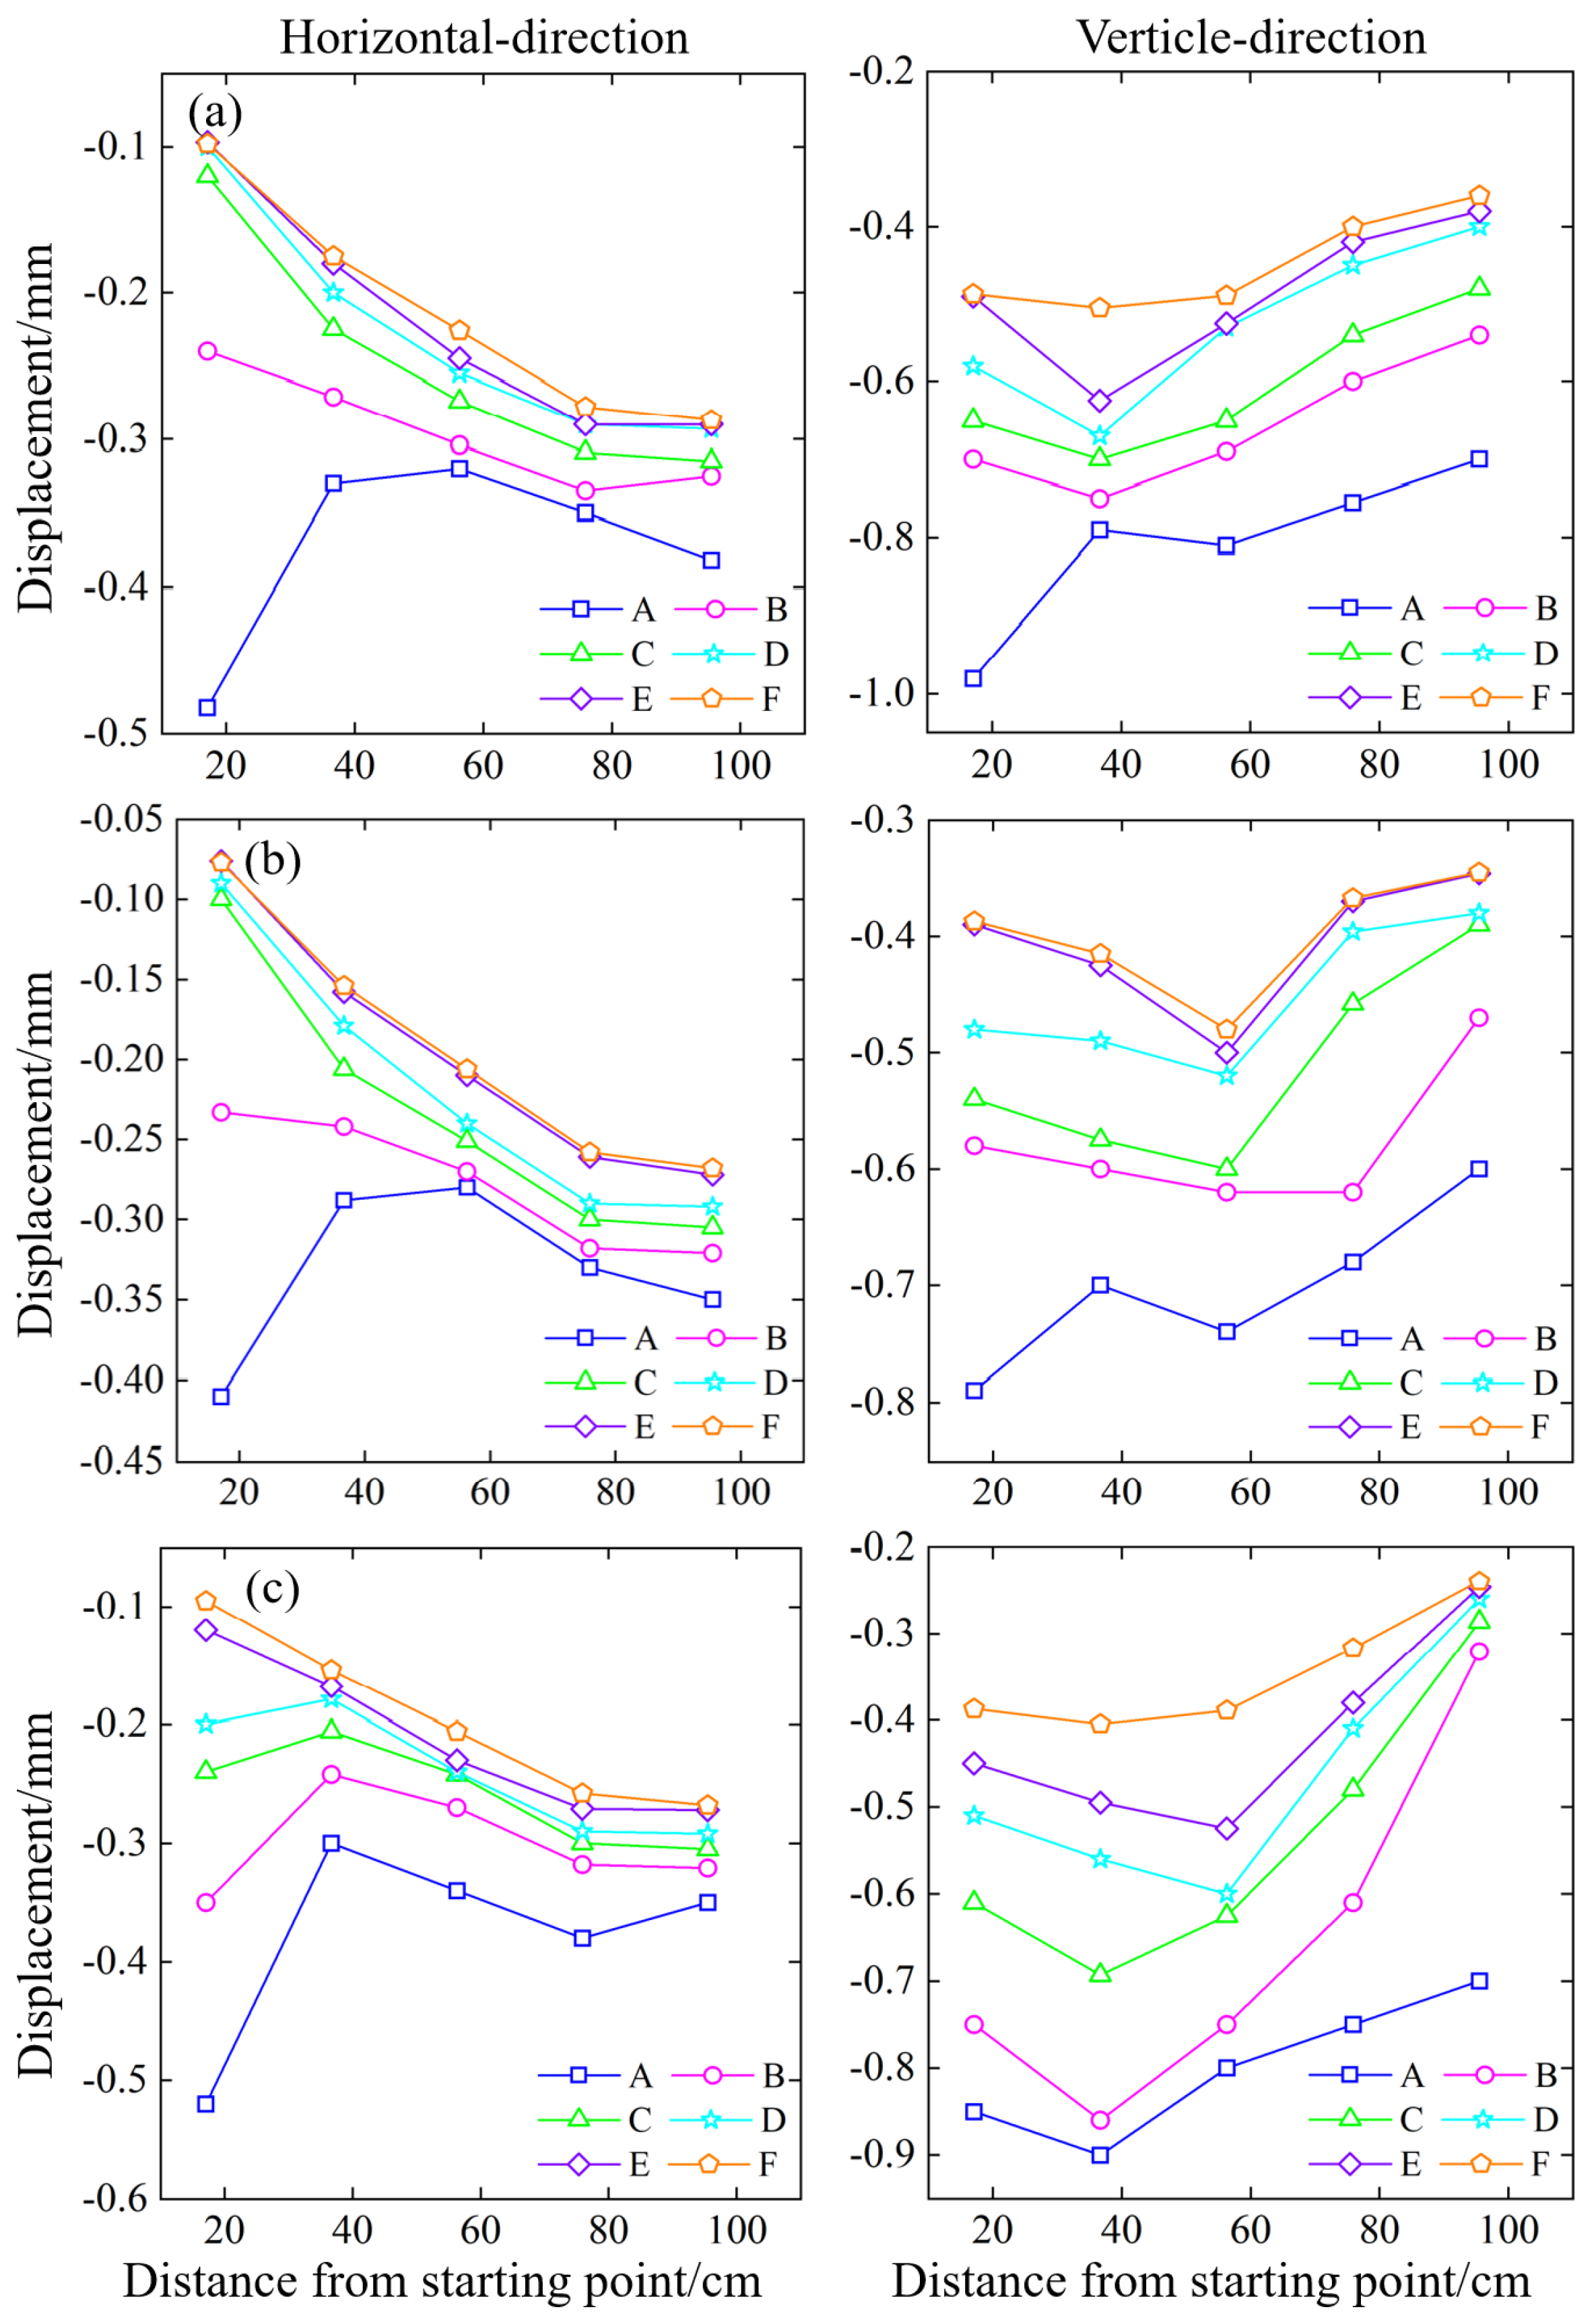
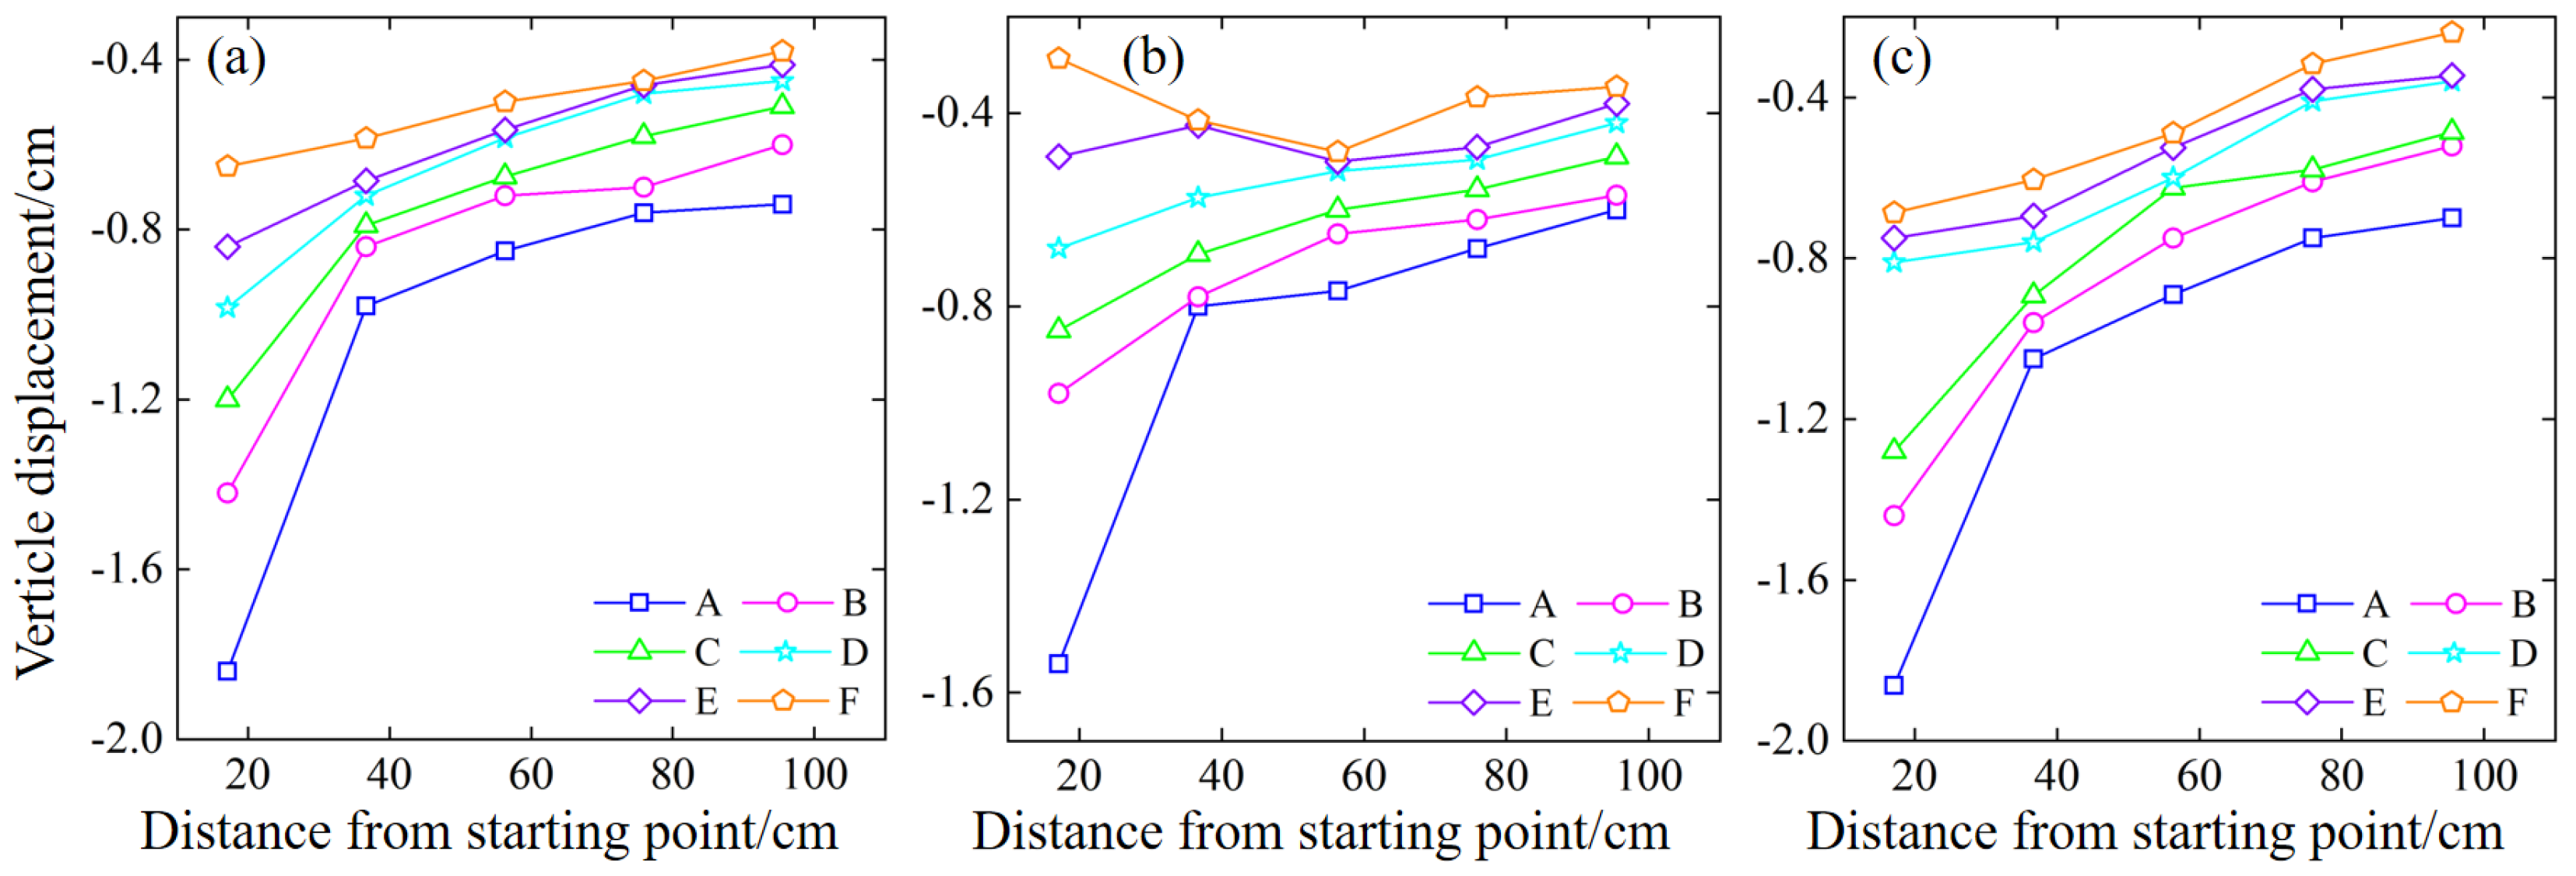
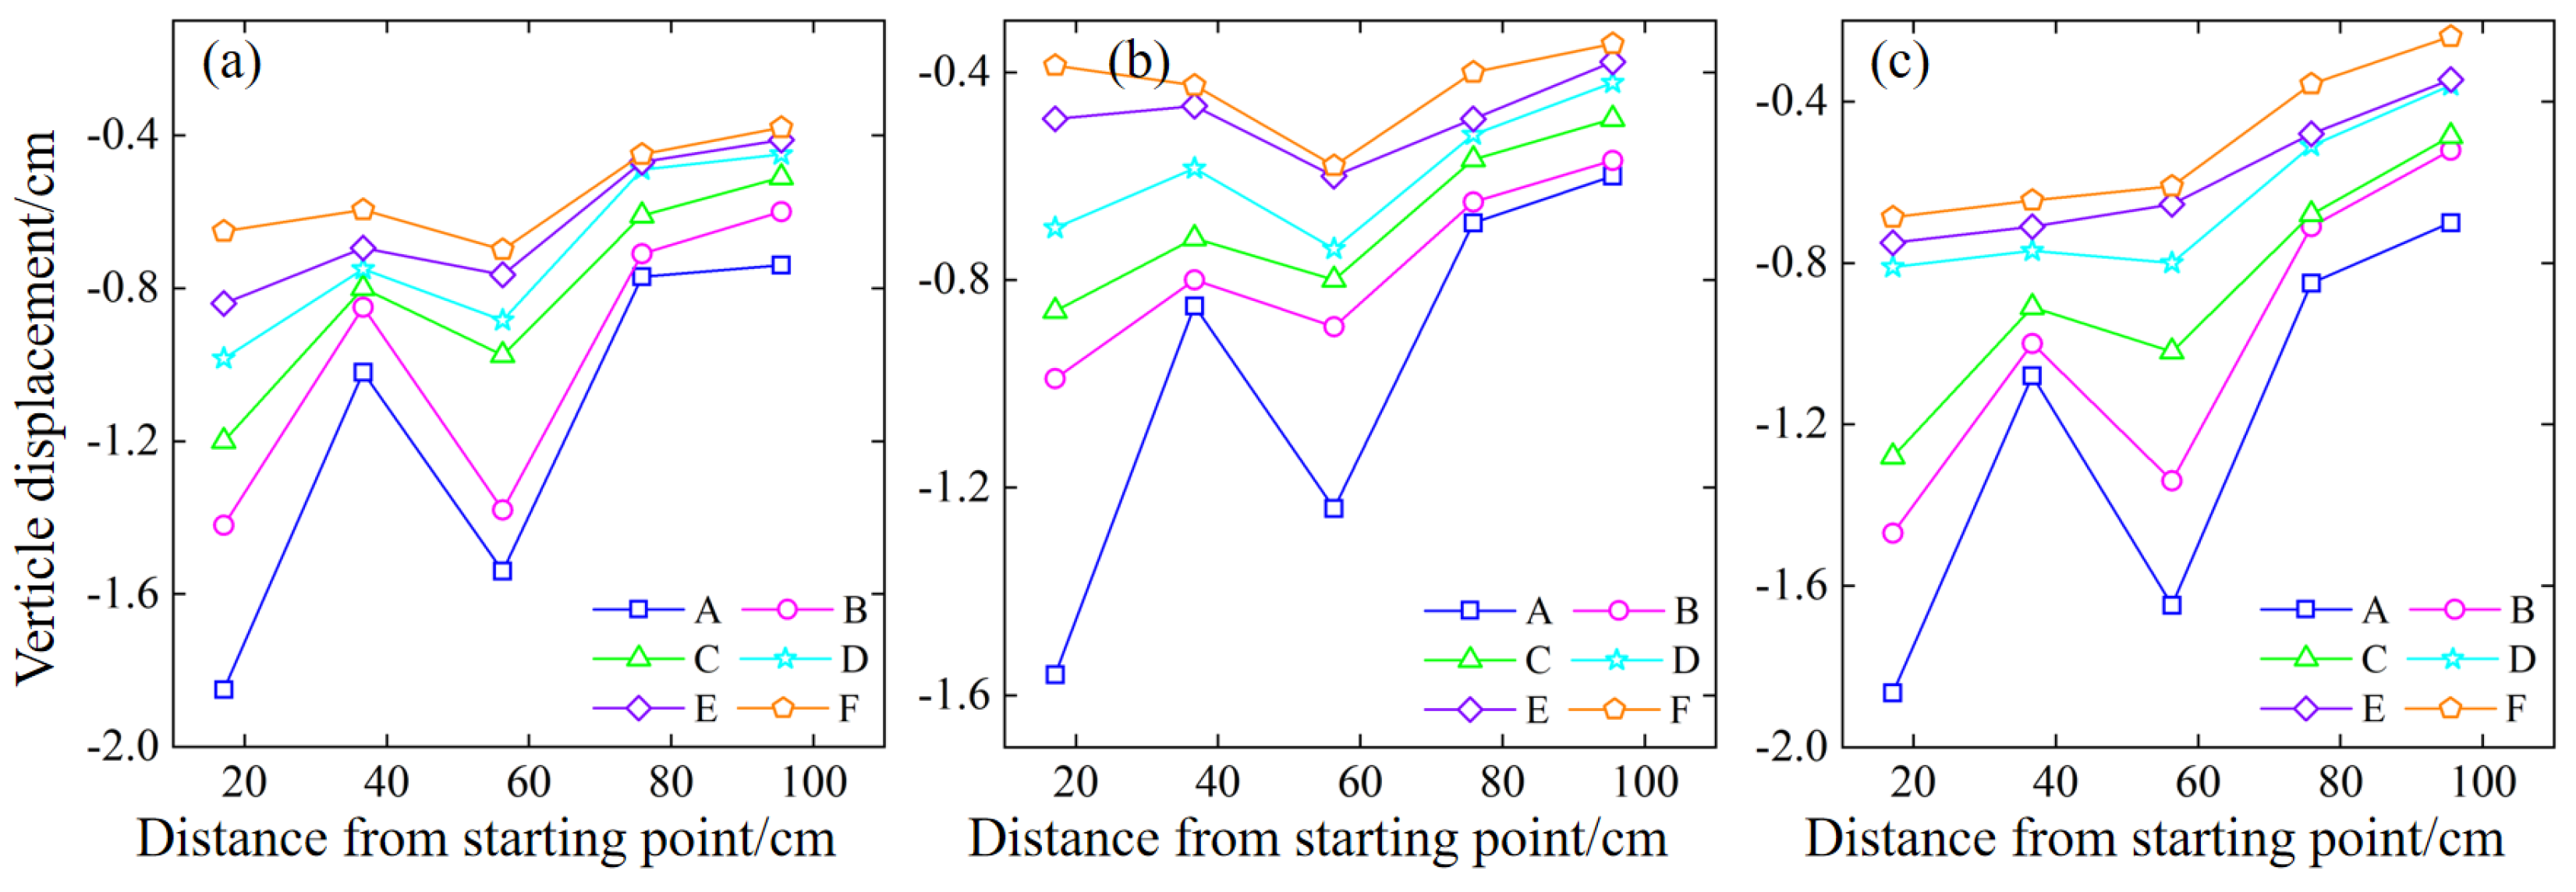
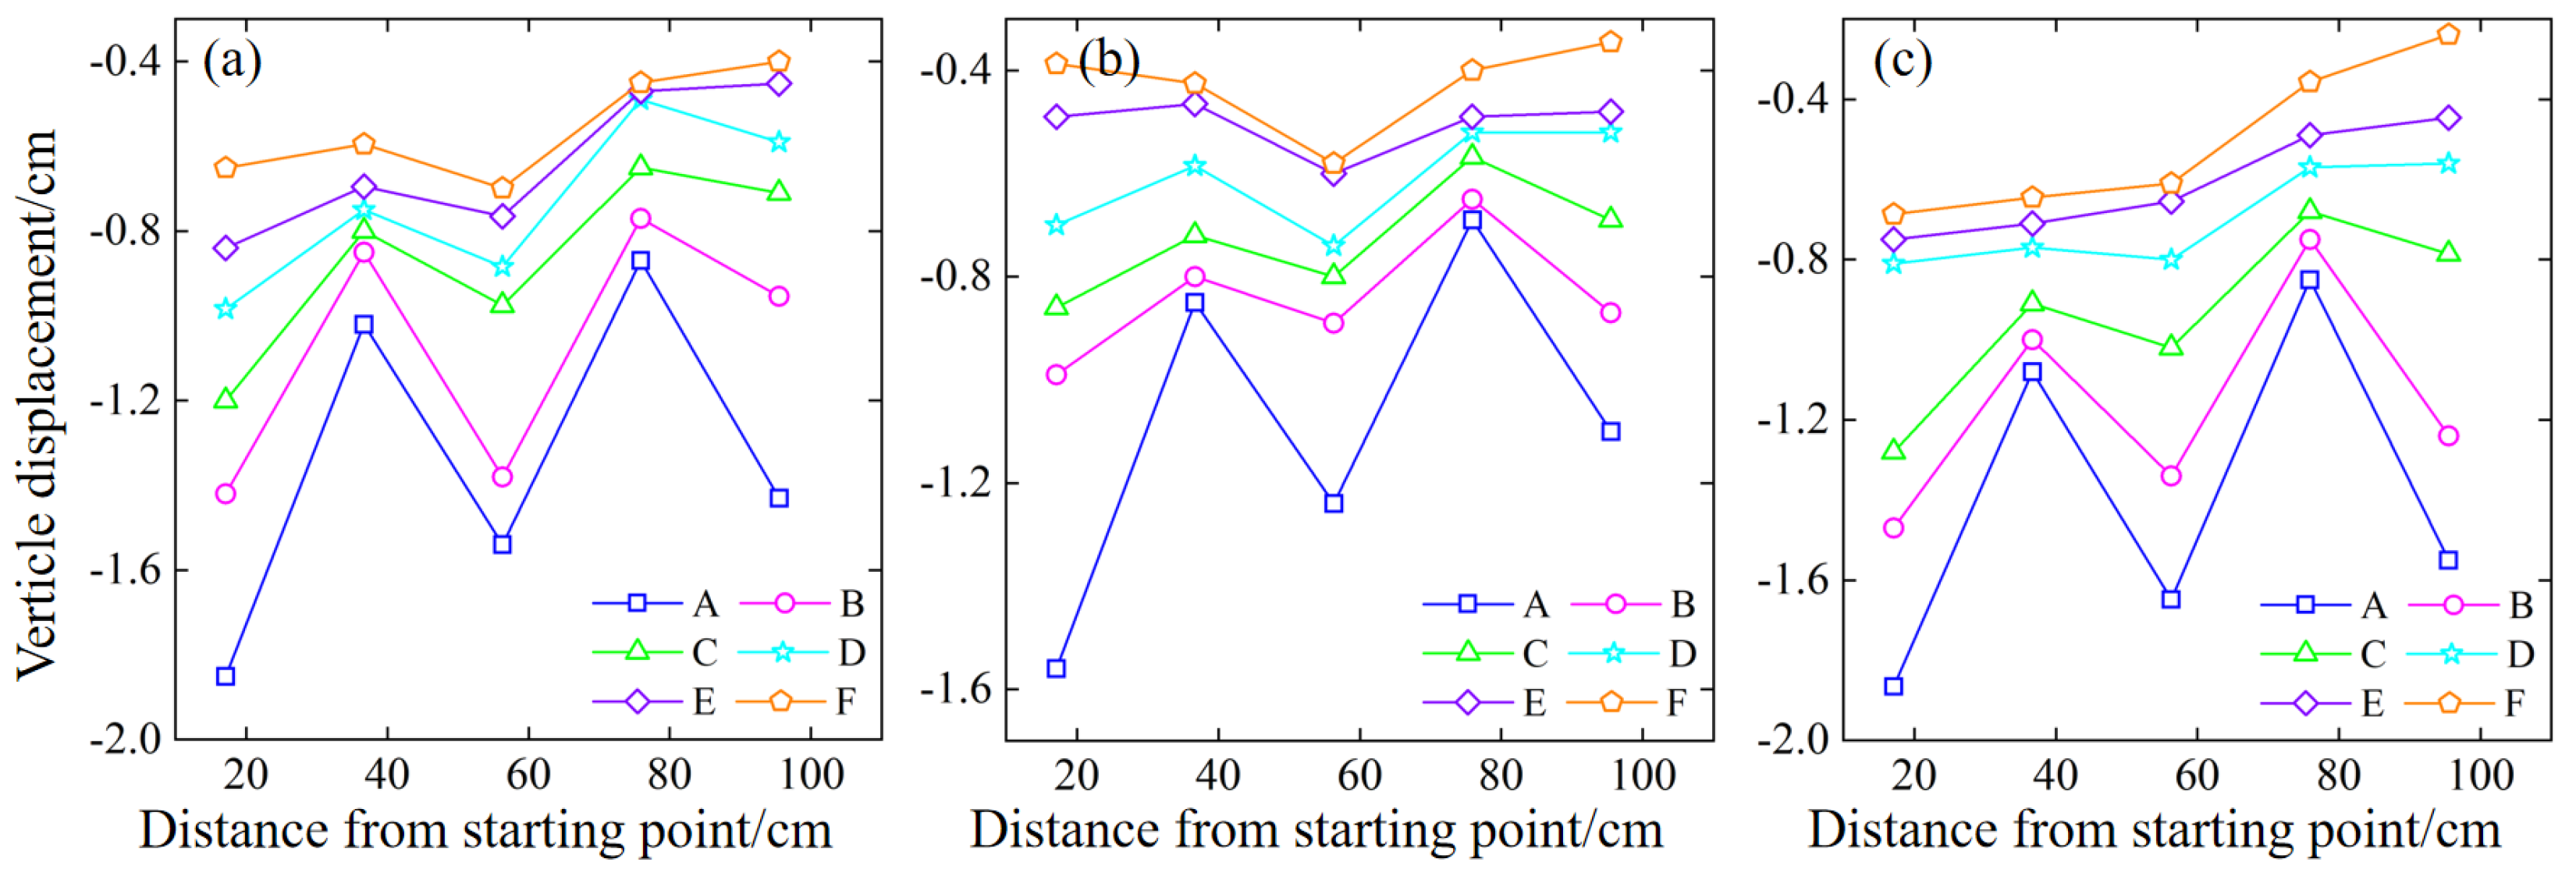
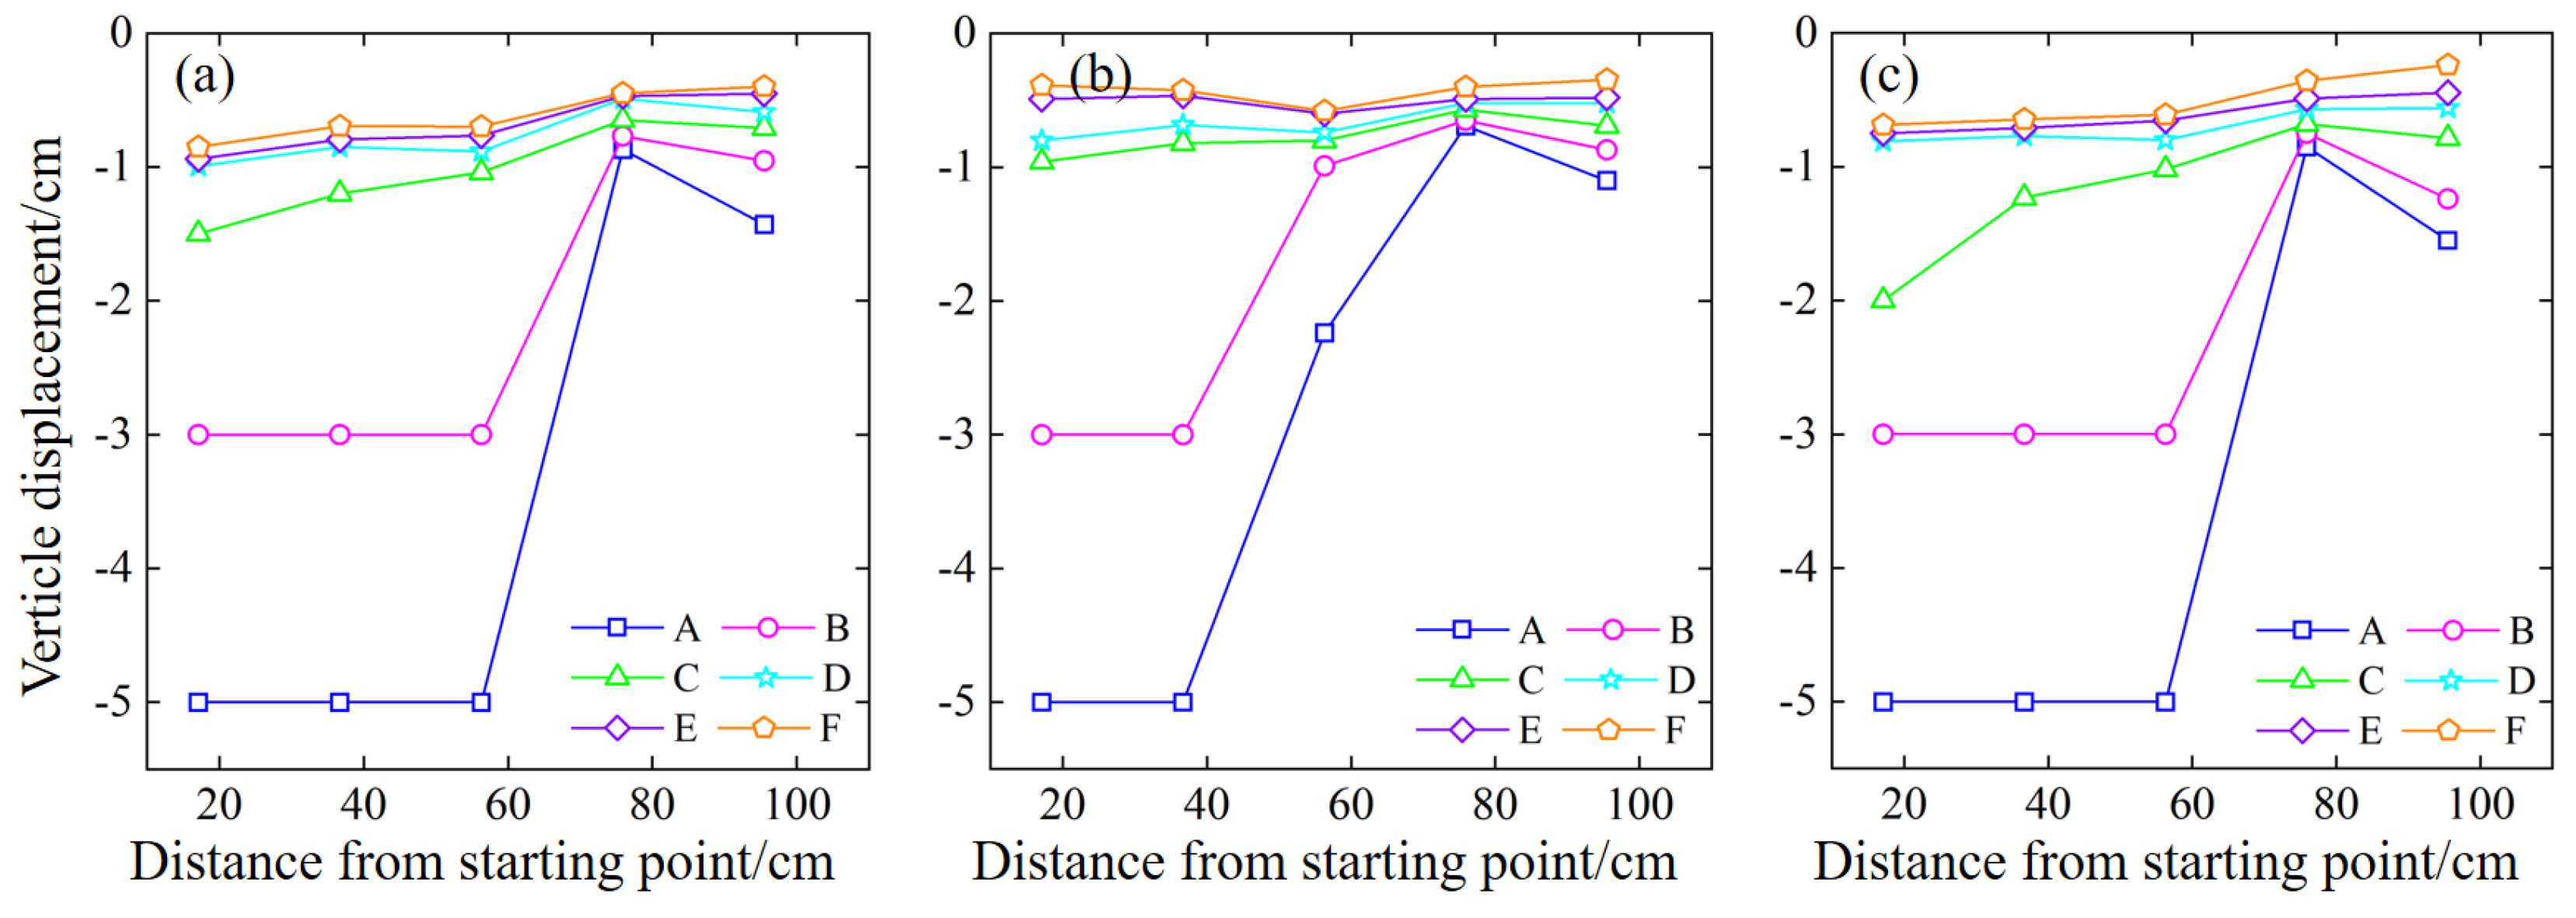
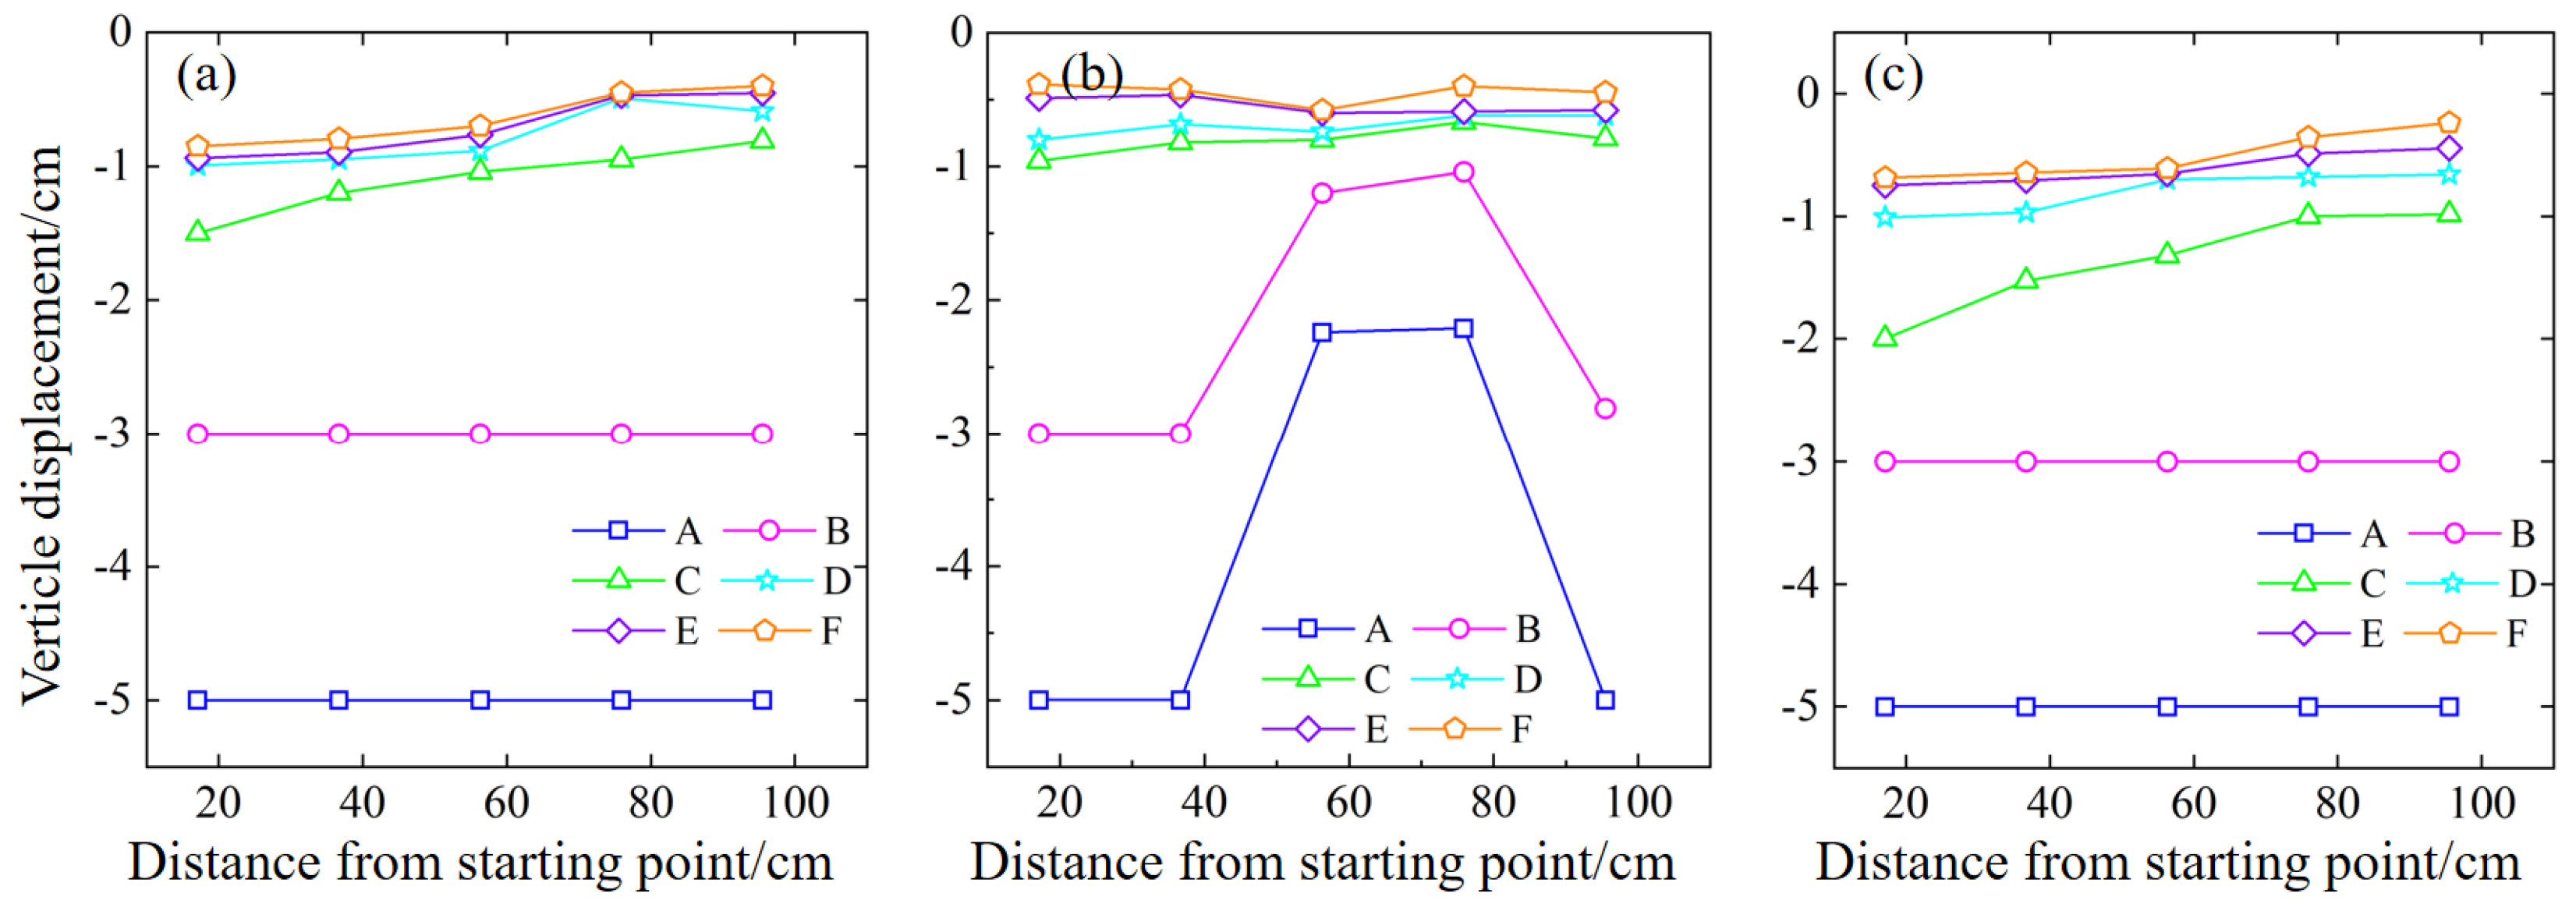
- During the open-pit mining stage, the rock mass displaces to the upper left, and the top area suffers the most damage. Herein, the maximum horizontal and vertical displacement points are both near the upper working face. During the underground mining stage, the model exhibits vertical fractures, and the overall displacement moves slightly to the left. Microfractures propagate at the corner above the mine. The mine room fractures grow and intersect, forming a semi-ellipse. During the pillar mining stage, the overlying rock area displaces significantly, and fractures persist. After continuous pillar mining, the overlying rock collapses extensively. The 45° model displacement changes mainly occur in the A and B measuring lines. The 55° model displacement value in the middle area is low, mainly in the front of the mined area. Furthermore, the 65° model displacement influence area is the largest. There is a large displacement in the A, B and C measuring lines.
Author Contributions
Funding
Data Availability Statement
Acknowledgments
Conflicts of Interest
References
- Christmann, P. Mineral Resource Governance in the 21st Century and a sustainable European Union. Miner. Econ. 2021, 34, 187–208. [Google Scholar] [CrossRef]
- Whittle, D.; Brazil, M.; Grossman, P.A.; Rubinstein, J.H.; Thomas, D.A. Combined optimisation of an open-pit mine outline and the transition depth to underground mining. Eur. J. Oper. Res. 2018, 268, 624–634. [Google Scholar] [CrossRef]
- Zhao, J.; Ma, Y.; Lin, B.; Lan, Z.; Shi, W. Geomechanical mode of mining landslides with gently counter-inclined bedding-a case study of Madaling landslide in Guizhou Province. Chinese Journal of Rock Mechanics and Engineering 2016, 35, 2217–2224. [Google Scholar]
- Tao, Z.G.; Zhu, C.; He, M.C.; Karakus, M. A physical modeling-based study on the control mechanisms of Negative Poisson's ratio anchor cable on the stratified toppling deformation of anti-inclined slopes. Int. J. Rock Mech. Min. 2021, 138, 104632. [Google Scholar] [CrossRef]
- Li, X.; Li, Q.; Wang, Y.; Liu, W.; Hou, D.; Zheng, W.; Zhang, X. Experimental study on instability mechanism and critical intensity of rainfall of high-steep rock slopes under unsaturated conditions. Int. J. Min. Sci. Techno. 2023, 33, 1243–1260. [Google Scholar] [CrossRef]
- Zhu, C.; He, M.C.; Karakus, M.; Zhang, X.H.; Tao, Z.G. Numerical simulations of the failure process of anaclinal slope physical model and control mechanism of negative Poisson's ratio cable. B. Eng. Geol. Environ. 2021, 80, 3365–3380. [Google Scholar] [CrossRef]
- Lu, W.B.; Yang, J.H.; Yan, P.; Chen, M.; Zhou, C.B.; Luo, Y.; Jin, L. Dynamic response of rock mass induced by the transient release of in-situ stress. Int. J. Rock Mech. Min. 2012, 53, 129–141. [Google Scholar] [CrossRef]
- Liu, Y.Q.; Chen, J.P.; Tan, C.; Zhan, J.W.; Song, S.Y.; Xu, W.L.; Yan, J.H.; Zhang, Y.S.; Zhao, M.Y.; Wang, Q. Intelligent scanning for optimal rock discontinuity sets considering multiple parameters based on manifold learning combined with UAV photogrammetry. Eng. Geol. 2022, 309, 106851. [Google Scholar] [CrossRef]
- Li, X.; Li, Q.; Hu, Y.; Chen, Q.; Peng, J.; Xie, Y.; Wang, J. Study on Three-Dimensional Dynamic Stability of Open-Pit High Slope under Blasting Vibration. Lithosphere 2022, 2021, 6426550. [Google Scholar] [CrossRef]
- Yan, J.H.; Xing, X.S.; Li, X.S.; Zhu, C.; Han, X.D.; Zhao, Y.; Chen, J.P. Forecasting the Landslide Blocking River Process and Cascading Dam Breach Flood Propagation by an Integrated Numerical Approach: A Reservoir Area Case Study. Remote Sens. 2023, 15, 4669. [Google Scholar] [CrossRef]
- Liu, W.; Li, Q.H.; Yang, C.H.; Shi, X.L.; Wan, J.F.; Jurado, M.J.; Li, Y.P.; Jiang, D.Y.; Chen, J.; Qiao, W.B.; Zhang, X.; Fan, J.Y.; Peng, T.J.; He, Y.X. The role of underground salt caverns for large-scale energy storage: A review and prospects. Energy Storage Mater. 2023, 63, 103045. [Google Scholar] [CrossRef]
- Soltani, K.A.; Osanloo, M. A Set of Classified Integer Programming (IP) Models for Optimum Transition from Open Pit to Underground Mining Methods. Nat. Resour. Res. 2020, 29, 1543–1559. [Google Scholar] [CrossRef]
- Zhang, Q.L.; Zhang, B.Y.; Chen, Q.S.; Wang, D.L.; Gao, X. Safety Analysis of Synergetic Operation of Backfilling the Open Pit Using Tailings and Excavating the Ore Deposit Underground. Minerals 2021, 11, 818. [Google Scholar] [CrossRef]
- Li, X.; Yang, S.; Wang, Y.M.; Nie, W.; Liu, Z.F. Macro-Micro Response Characteristics of Surrounding Rock and Overlying Strata towards the Transition from Open-Pit to Underground Mining. Geofluids 2021, 2021, 5582218. [Google Scholar] [CrossRef]
- Zhao, Y.; Yang, T.H.; Bohnhoff, M.; Zhang, P.H.; Yu, Q.L.; Zhou, J.R.; Liu, F.Y. Study of the Rock Mass Failure Process and Mechanisms During the Transformation from Open-Pit to Underground Mining Based on Microseismic Monitoring. Rock Mech. Rock Eng. 2018, 51, 1473–1493. [Google Scholar] [CrossRef]
- Zhu, C.; He, M.C.; Karakus, M.; Cui, X.B.; Tao, Z.G. Investigating Toppling Failure Mechanism of Anti -dip Layered Slope due to Excavation by Physical Modelling. Rock Mech. Rock Eng. 2020, 53, 5029–5050. [Google Scholar] [CrossRef]
- Cui, F.; Li, B.; Xiong, C.; Yang, Z.; Peng, J.; Li, J.; Li, H. Dynamic triggering mechanism of the Pusa mining-induced landslide in Nayong County, Guizhou Province, China. Geomat. Nat. Hazards Risk 2022, 13, 123–147. [Google Scholar] [CrossRef]
- Deliveris, A.V.; Theocharis, A.I.; Koukouzas, N.C.; Zevgolis, I.E. Numerical Slope Stability Analysis of Deep Excavations Under Rainfall Infiltration. Geotech. Geol. Eng. 2022, 40, 4023–4039. [Google Scholar] [CrossRef]
- Doumbouya, L.; Guan, C.S.; Bowa, V.M. Influence of Rainfall Patterns on the Slope Stability of the Lumwana (the Malundwe) Open Pit. Geotech. Geol. Eng. 2020, 38, 1337–1346. [Google Scholar] [CrossRef]
- Du, W.; Chai, J.; Zhang, D.; Ouyang, Y.; Liu, Y. Study on Quantitative Characterization of Coupling Effect between Mining-Induced Coal-Rock Mass and Optical Fiber Sensing. Sensors 2022, 22, 5009. [Google Scholar] [CrossRef]
- Jhanwar, J.C.; Thote, N.R. Slope Failures in the Opencast Coal Mines of Wardha Valley Coalfield in Central India: A Study. Rock Mech. Rock Eng. 2011, 44, 635–640. [Google Scholar] [CrossRef]
- Li, Q.; Song, D.; Yuan, C.; Nie, W. An image recognition method for the deformation area of open-pit rock slopes under variable rainfall. Measurement 2022, 188, 110544. [Google Scholar] [CrossRef]
- Liu, W.; Du, J.W.; Li, Q.H.; Shi, X.L.; Chen, J.; Yi, W.K.; He, T.; Li, D.P.; Dong, Y.K.; Jiang, D.Y.; Li, Y. Feasibility analysis on the utilization of TWH-caverns with sediment space for gas storage: A case study of Sanshui salt mine. J. Energy Storage 2024, 75, 109576. [Google Scholar] [CrossRef]
- Li, Z.Q.; Xue, Y.G.; Li, S.C.; Zhang, L.W.; Wang, D.; Li, B.; Zhang, W.; Ning, K.; Zhu, J.Y. Deformation features and failure mechanism of steep rock slope under the mining activities and rainfall. J. Mt. Sci. 2017, 14, 31–45. [Google Scholar] [CrossRef]
- Ma, G.; Hu, X.; Yin, Y.; Luo, G.; Pan, Y. Failure mechanisms and development of catastrophic rockslides triggered by precipitation and open-pit mining in Emei, Sichuan, China. Landslides 2018, 15, 1401–1414. [Google Scholar] [CrossRef]
- Nian, G.Q.; Chen, Z.H.; Zhu, T.Y.; Zhang, L.F.; Zhou, Z. Experimental study on the failure of fractured rock slopes with anti-dip and strong weathering characteristics under rainfall conditions. Landslides 2023, 36, 1–18. [Google Scholar] [CrossRef]
- Wang, C.; Min, H.; Zhu, T.; Wang, H.; Qin, W.; Zhang, G. Failure mechanism and stability analysis of the landslide: a case study for open pit iron mine in Xichang, Sichuan, China. Nat. Hazards 2023, 116, 663–691. [Google Scholar] [CrossRef]
- Xiang, P.; Ji, H.; Geng, J.; Zhao, Y. Characteristics and Mechanical Mechanism of In Situ Unloading Damage and Core Discing in Deep Rock Mass of Metal Mine. Shock Vib. 2022, 2022, 5147868. [Google Scholar] [CrossRef]
- Li, S.; Niu, Y.; Wang, B.; Gao, Y.; Zhu, Y. Influence of Rainfall Infiltration on Stability of Granite Residual Soil High Slope. Math. Probl. Eng. 2022, 2022, 1920403. [Google Scholar] [CrossRef]
- Rudy, A.C.A.; Lamoureux, S.F.; Treitz, P.; Collingwood, A. Identifying permafrost slope disturbance using multi-temporal optical satellite images and change detection techniques. Cold Reg. Sci. Technol. 2013, 88, 37–49. [Google Scholar] [CrossRef]
- Smith, J.V. Self-stabilization of toppling and hillside creep in layered rocks. Eng. Geol. 2015, 196, 139–149. [Google Scholar] [CrossRef]
- Khan, M.S.; Hossain, S.; Ahmed, A.; Faysal, M. Investigation of a shallow slope failure on expansive clay in Texas. Eng. Geol. 2017, 219, 118–129. [Google Scholar] [CrossRef]
- Spooner, I.; Batterson, M.; Catto, N.; Liverman, D.; Broster, B.E.; Kearns, K.; Isenor, F.; McAskill, G.W. Slope failure hazard in Canada's Atlantic Provinces: a review. Atl. Geol. 2013, 49, 1–14. [Google Scholar] [CrossRef]
- Shin, H. Static and quasi-static slope stability analyses using the limit equilibrium method for mountainous area. Geomech. Eng. 2023, 34, 187–195. [Google Scholar]
- Li, X.; Peng, J.; Xie, Y.; Li, Q.; Zhou, T.; Wang, J.; Zheng, W. Influence of High-Temperature Treatment on Strength and Failure Behaviors of a Quartz-Rich Sandstone under True Triaxial Condition. Lithosphere 2022, 2022, 3086647. [Google Scholar] [CrossRef]
- Xia, K.; Chen, C.; Liu, X.; Wang, Y.; Liu, X.; Yuan, J. Estimating shear strength of high-level pillars supported with cemented backfilling using the Hoek-Brown strength criterion. J. Rock Mech. Geotech. 2023, 52, 1–16. [Google Scholar] [CrossRef]
- Langford, J.C.; Diederichs, M.S. Quantifying uncertainty in Hoek-Brown intact strength envelopes. Int. J. Rock Mech. Min. 2015, 74, 91–102. [Google Scholar] [CrossRef]
- Masoumi, H.; Roshan, H.; Hagan, P.C. Size-Dependent Hoek-Brown Failure Criterion. Int. J. Geomech. 2017, 17, 04016048. [Google Scholar] [CrossRef]
- Li, X.; Li, Q.; Hou, G.; Zhang, F.; Lu, J. Investigation on the disaster mechanism and dynamic evolution of a dump slope using experimental and numerical methods: Case study, Kunyang phosphate mine, China. Geol. J. 2023, 2023, 1–16. [Google Scholar] [CrossRef]
- Hoek, E.; Brown, E. The Hoek-Brown failure criterion and GSI - 2018 edition. J. Rock Mech. Geotech. 2019, 11, 445–463. [Google Scholar] [CrossRef]
- Bois, T.; Bouissou, S.; Guglielmi, Y. Influence of major inherited faults zones on gravitational slope deformation: A two-dimensional physical modelling of the La Clapie're area (Southern French Alps). Earth Planet. Sc. Lett. 2008, 272, 709–719. [Google Scholar] [CrossRef]
- McFall, B.C.; Mohammed, F.; Fritz, H.M.; Liu, Y.B. Laboratory experiments on three-dimensional deformable granular landslides on planar and conical slopes. Landslides 2018, 15, 1713–1730. [Google Scholar] [CrossRef]
- Zhang, B.; Fang, K.; Tang, H.; Sumi, S.; Ding, B. Block-flexure toppling in an anaclinal rock slope based on multi-field monitoring. Eng. Geol. 2023, 327, 107340. [Google Scholar] [CrossRef]
- Moo-Young, H.; Myers, T.; Tardy, B.; Ledbetter, R.; Vanadit-Ellis, W.; Kim, T. Centrifuge simulation of the consolidation characteristics of capped marine sediment beds. Eng. Geol. 2003, 70, 249–258. [Google Scholar] [CrossRef]
- Wang, H.; Jiang, Z.; Xu, W.; Wang, R.; Xie, W. Physical model test on deformation and failure mechanism of deposit landslide under gradient rainfall. Bull. Eng. Geol. Environ. 2022, 81, 66. [Google Scholar] [CrossRef]
- Adhikary, D.P.; Dyskin, A.V.; Jewell, R.J.; Stewart, D.P. A study of the mechanism of flexural toppling failure of rock slopes. Rock Mech. Rock Eng. 1997, 30, 75–93. [Google Scholar] [CrossRef]
- Ding, B.; Han, Z.; Zhang, G.; Beng, X.; Yang, Y. Flexural Toppling Mechanism and Stability Analysis of an Anti-dip Rock Slope. Rock Mech. Rock Eng. 2021, 54, 3721–3735. [Google Scholar] [CrossRef]
- Aksoy, H.; Unal, N.; Cokgor, S.; Gedikli, A.; Yoon, J.; Koca, K.; Inci, S.; Eris, E. A rainfall simulator for laboratory-scale assessment of rainfall-runoff-sediment transport processes over a two-dimensional flume. Catena 2012, 98, 63–72. [Google Scholar] [CrossRef]
- Green, D.; Pattison, I. Christiansen uniformity revisited: Re-thinking uniformity assessment in rainfall simulator studies. Catena 2022, 217, 106424. [Google Scholar] [CrossRef]
- Lora, M.; Camporese, M.; Salandin, P. Design and performance of a nozzle-type rainfall simulator for landslide triggering experiments. Catena 2016, 140, 77–89. [Google Scholar] [CrossRef]
- Han, Y.; Wang, Q.; Xia, W.; Liu, J.; Wang, J.; Chen, Y.; Shen, J. Experimental study on the hydraulic conductivity of unsaturated dispersive soil with different salinities subjected to freeze-thaw. J. Hydrol. 2020, 583, 124297. [Google Scholar] [CrossRef]
- Shen, J.; Wang, Q.; Chen, Y.; Han, Y.; Zhang, X.; Liu, Y. Evolution process of the microstructure of saline soil with different compaction degrees during freeze-thaw cycles. Eng. Geol. 2020, 304, 106699. [Google Scholar] [CrossRef]
- Liu, W.; Duan, X.; Li, Q.; Wan, J.; Zhang, X.; Fang, J.; Jiang, D.; Chen, J. Analysis of pressure interval/injection and production frequently on stability of large-scale supercritical CO2 storage in salt caverns. J. Clean. Prod. 2023, 433, 139731. [Google Scholar] [CrossRef]

| σd /MPa | σt /MPa | E/GPa | μ | C/MPa | Φ/° | C of joint surface/MPa | Φ of joint surface/° |
|---|---|---|---|---|---|---|---|
| 52.11 | 4.10 | 24.20 | 0.15 | 7.78 | 38.38 | 0.16 | 28.96 |
| σd /MPa | σt /MPa | E/GPa | μ | C/MPa | Φ/° | C of joint surface/MPa | Φ of joint surface/° |
|---|---|---|---|---|---|---|---|
| 26.10 | 1.03 | 8.10 | 0.15 | 5.20 | 27.80 | 0.10 | 20.99 |
| Lithology | Proportion | |||
|---|---|---|---|---|
| Phyllite | Coarse sand | Fine sand | Lime | Gypsum |
| 15 | 10 | 2 | 5 | |
| Material | Coarse sand/kg | Fine sand/kg | Lime/kg | Gypsum/kg | Water/kg | Borax/g | Mica powder/g |
|---|---|---|---|---|---|---|---|
| Q | 237 | 158 | 31.60 | 79 | 72.22 | 0.80 | 0.80 |
Disclaimer/Publisher’s Note: The statements, opinions and data contained in all publications are solely those of the individual author(s) and contributor(s) and not of MDPI and/or the editor(s). MDPI and/or the editor(s) disclaim responsibility for any injury to people or property resulting from any ideas, methods, instructions or products referred to in the content. |
© 2024 by the authors. Licensee MDPI, Basel, Switzerland. This article is an open access article distributed under the terms and conditions of the Creative Commons Attribution (CC BY) license (http://creativecommons.org/licenses/by/4.0/).


