1. Introduction
Around the world many advances have been made in the field of modeling and manufacturing of dental devices using new technology such as 3D scanning and 3D-printing for construction of dental devices, brackets, and surgical guides [
1,
2,
3]. Moreover, currently imaging technologies have even advanced in 3D internal analysis using X-ray tomography [
4]. This paper is centered in 3D simulation technology using finite element method (FEM) in orthodontic treatment with thermoformed aligners.
Currently, it is estimated that between 20 to 30% of the world’s population has alterations in occlusion that require orthodontic treatment [
5]. This scenario has motivated the interest of studies aimed to improve the treatment procedures of these clinical conditions [
6,
7]. For example, according to [
8,
9], an orthodontic procedure commonly applied to patients with insufficient transverse development of the upper jaw, called a posterior cross bite, is the expansion of the maxillary arch by mechanical devices, such as brackets and thermoformed aligners. Brackets are manufactured in different rigid materials that adhere to the tooth with dental resins; these devices are interconnected by a wire with different degrees of flexibility, which is molded to induce a load to the tooth through the bracket, according to the required tooth movement [
10].
On the other hand, aligners are removable orthodontic devices that are used to gradually move teeth into the desired position [
11], these aligners are formed from sheets of thermoformable polymer covering the surfaces of dental crowns [
12]. Moreover, these devices are customized through digital technologies to induce forces to generate the required tooth movement [
12]. Nowadays clear aligners are used as a treatment to improve masticatory function and to maintain an aesthetic smile. In [
11], was evaluated the effectiveness of treatment with clear aligners in controlling orthodontic tooth movement by reviewing 146 related studies. Some authors suggest the use of aligners in conjunction with complementary biomechanical attachments (CBA), also known as “couplers”, to generate more accurate tooth movements, both in the rotation of the canine and the expansion of the maxillary arch, by orientating the induced forces [
13,
14]. In contrast, other authors disagree and suggest that these couplers do not affect tooth retention [
15]. This divergence of results suggests that deeper research is required in this area. In this sense, considering the size and variety of injuries at the maxillofacial level, it is of scientific interest to have tools that analyze the different configurations of the devices used in treatments and their effect on the expansion of the maxillary arch.
However, the evaluation of these technologies usually requires in vivo studies and laboratory tests, which may incur operational, practical and ethical problems that hinder the development of a clinical investigation [
16]. Additionally, in vivo tests often present inaccuracies when quantifying the behavior of tooth movement and its effects on soft tissue, such as bone or periodontal ligaments (LDP). That is, it is extremely difficult to faithfully reproduce these behaviors in controlled laboratory tests. In this context, computational modeling emerges as an option in this area, since the finite element method (FEM) can discretely model tooth movement, thereby generating an analytical tool for obtaining approximate solutions to a wide variety of problems at the maxillary level [
17]. En example of the use of computational modeling and simulation by FEM is [
18], here the authors developed a test model for the rotational shear strength of dental implants and the constraint force of total knee replacements based on FEM technology and proposes ideal parameters to ensure reliability, in summary the simulation results and mechanical tests, showed a boundary conditions error rate of less than 1.5%.
Dental movement has been widely studied and recognized for its complexity, due to the factors and effects related to the application of a force to the tooth, in conjunction with the interaction models of the bone or periodontal ligaments (PDL) [
13]. Some authors have used FEM to estimate the mechanical responses of biomaterials and tissues. For example, in [
16] FEM was used for the analysis of tooth movement considering tissues as homogeneous, isotropic, and non-viscous. Two studies, [
19] and [
20], presented the responses of PDL to a load in conjunction with the movement generated by a dental bracket.
In [
21], a clinical investigation focused on the evaluation of predictability in tooth movement (a parameter that compares the actual displacement achieved by plaques, with values estimated prior to treatment, using specialized software) when using thermoformed aligners in 64 adult patients. These results showed that the approximations made with FEM models are comparable to reported clinical studies.
In [
22] the FEM was used to determine the relationship between the stresses in the PDL with the loads present in the alveolar bone. In [
23] the influence of several parameters was evaluated, such as morphology, material properties and boundary conditions, on the behavior of the PDL and the alveolar bone. In [
20] a FEM model was generated to estimate the interaction between the right upper canine, the alveolar bone and PDL using a thermoformed plastic aligner and two thermoformed CBAs to generate a 0.15 mm distal movement in the aligner.
In [
24] numerical research was carried out to estimate the distribution of stresses in PDL by thermoformed aligners of different caliber. In [
25] an evaluation was done on the effect of different CBAs on the rotation of the canine; in this case, computed tomography of a patient was used to define the upper denture. Although previous studies have used FEM for the analysis of dental movements, according to [
26] and [
27], the use of a single mathematical model for the presentation of results can be biased or generate inaccurate results, which suggests further studies need to be performed using FEM in the analyses of dental applications. Additionally, the increased use of thermoformed aligners with CBAs for orthodontic treatments, such as: anterior and posterior cross bite, maxillary expansion and dental crowding has also been considered [
11,
19,
22,
23]. This area shows a potential for contribution to analysis of the effect of CBAs in PDL during the process of transverse expansion of the maxillary arch with thermoformed aligners, which is central to this research work.
2. Materials and Methods
Initially, through a literature review and expert consultation, the physical properties were defined (geometry: thermoformed aligners and complementary attachments), setting the expansion of the maxillary arch, mechanical properties (Young’s modulus, coefficient of friction between the tooth plate and crown), periodontal ligament model and load state for the required maxillary arch configuration. Subsequently, a CAD model of teeth 3, 4, 5 and 6 was generated showing their respective periodontal ligaments and the configuration of the three different thermoformed plates (without CBA, with CBA in vestibular (VCBA) and by palatine (PCBA)) based on a full-scale cloud of points for all permanent dentition of the patient. Then, the FEM model was generated, which characterized the movement of the expansion of the maxillary arch by specifying the stresses and deformation states in the teeth and periodontal ligament. The model without CBA was compared with a predictability study [
21] and the load states [
28]. Finally, the results of the models with and without the CBA’s were compared, to evaluate the effect on the PDL when performing the expansion in the maxillary arch, from the canine to the molar.
In [
21] the predictability of arch expansion using thermoformed aligners was investigated. In a sample of sixty-four white adult patients, the mean accuracy of expansion was estimated as 72.8% for the maxilla and 87.7% for the lower arch, a detailed description of the approach performed is described in [
29]. According to [
30], the sample size was selected by assuming that 70% of the expansion could be achieved with a margin of error of 10%; the calculation was based on a statistical power of 0.8 and a 95% confidence interval. The sample consisted of 41 women and 23 men, with an average age of 31 years. Data was digitized using the Align Technology iTero Element 2
® scanner and restoration STL files were generated, both pre- and post-treatment. For 3D inspection and to measure displacement the software Geomagic Qualify 12.1
® form 3D Systems was used. To map out the rehabilitation protocol from the first to the last aligners Clincheck 6.0
® software from Invisalign was used, taking as a reference the peaks of the teeth, such as the canine, first premolar, second premolar, and first molar. An indicator was established, called the percentage of predictability, which contrasts the displacements achieved by the plaques in patients, compared to what was estimated prior to treatment using the Clincheck
® software [
29]. This software only considers the displacements or movements of the teeth involved. The predictability percentage is calculated by Equation (1), where
lp is the predicted length, and
lg is the length achieved, this equation ensures that the calculation does not exceed 100%.
2.1. Modeling
In this study, four-tooth expansion movement, from canine to molar, was evaluated by applying a 0.15 mm (Δu) vestibular shift in the tooth.
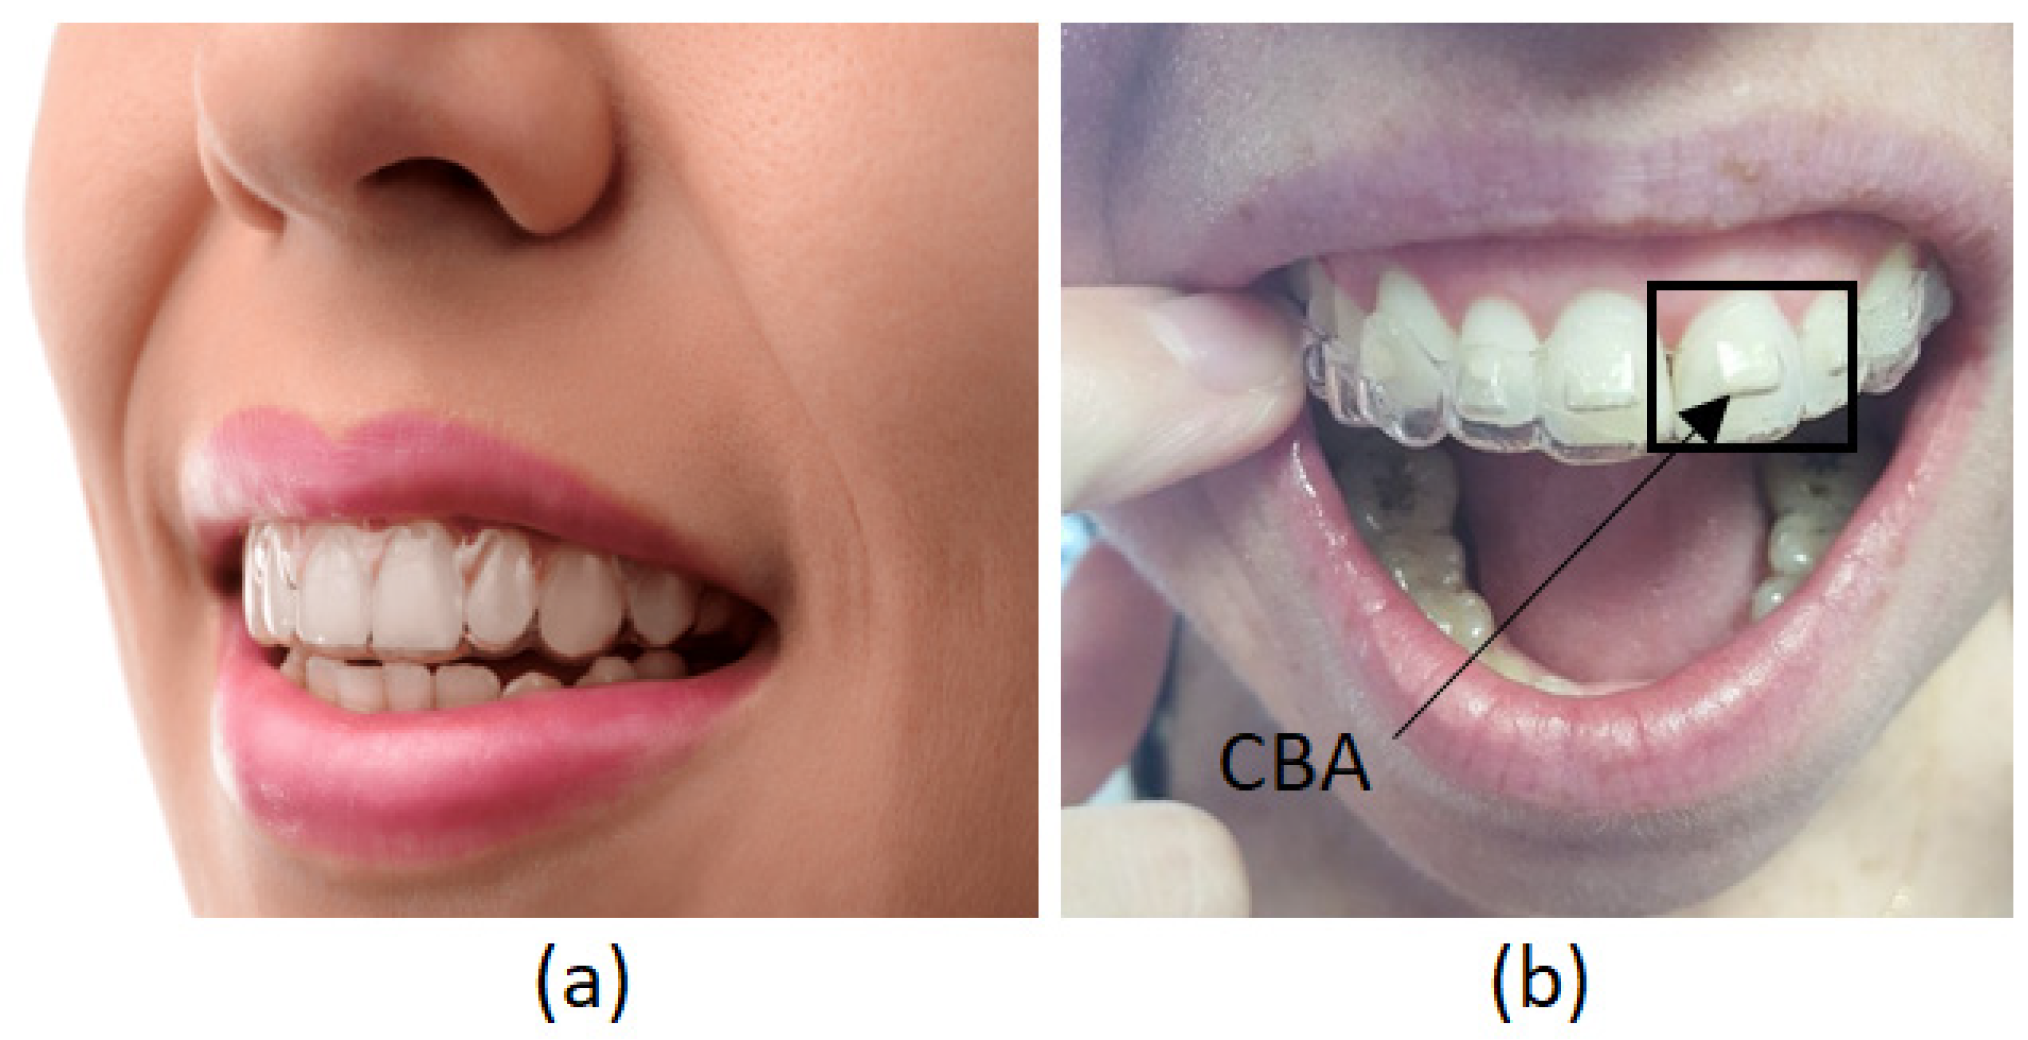
For this study one configuration was defined with two conditions, the conditions of the aligner with and without CBA (see
Figure 1 (a) and 1 (b), respectively). Considering [
15], the mechanical properties of the thermoplastic plate were Young’s module of 528 MPa and a Poisson’s ratio of 0.36.
Following the method proposed by [
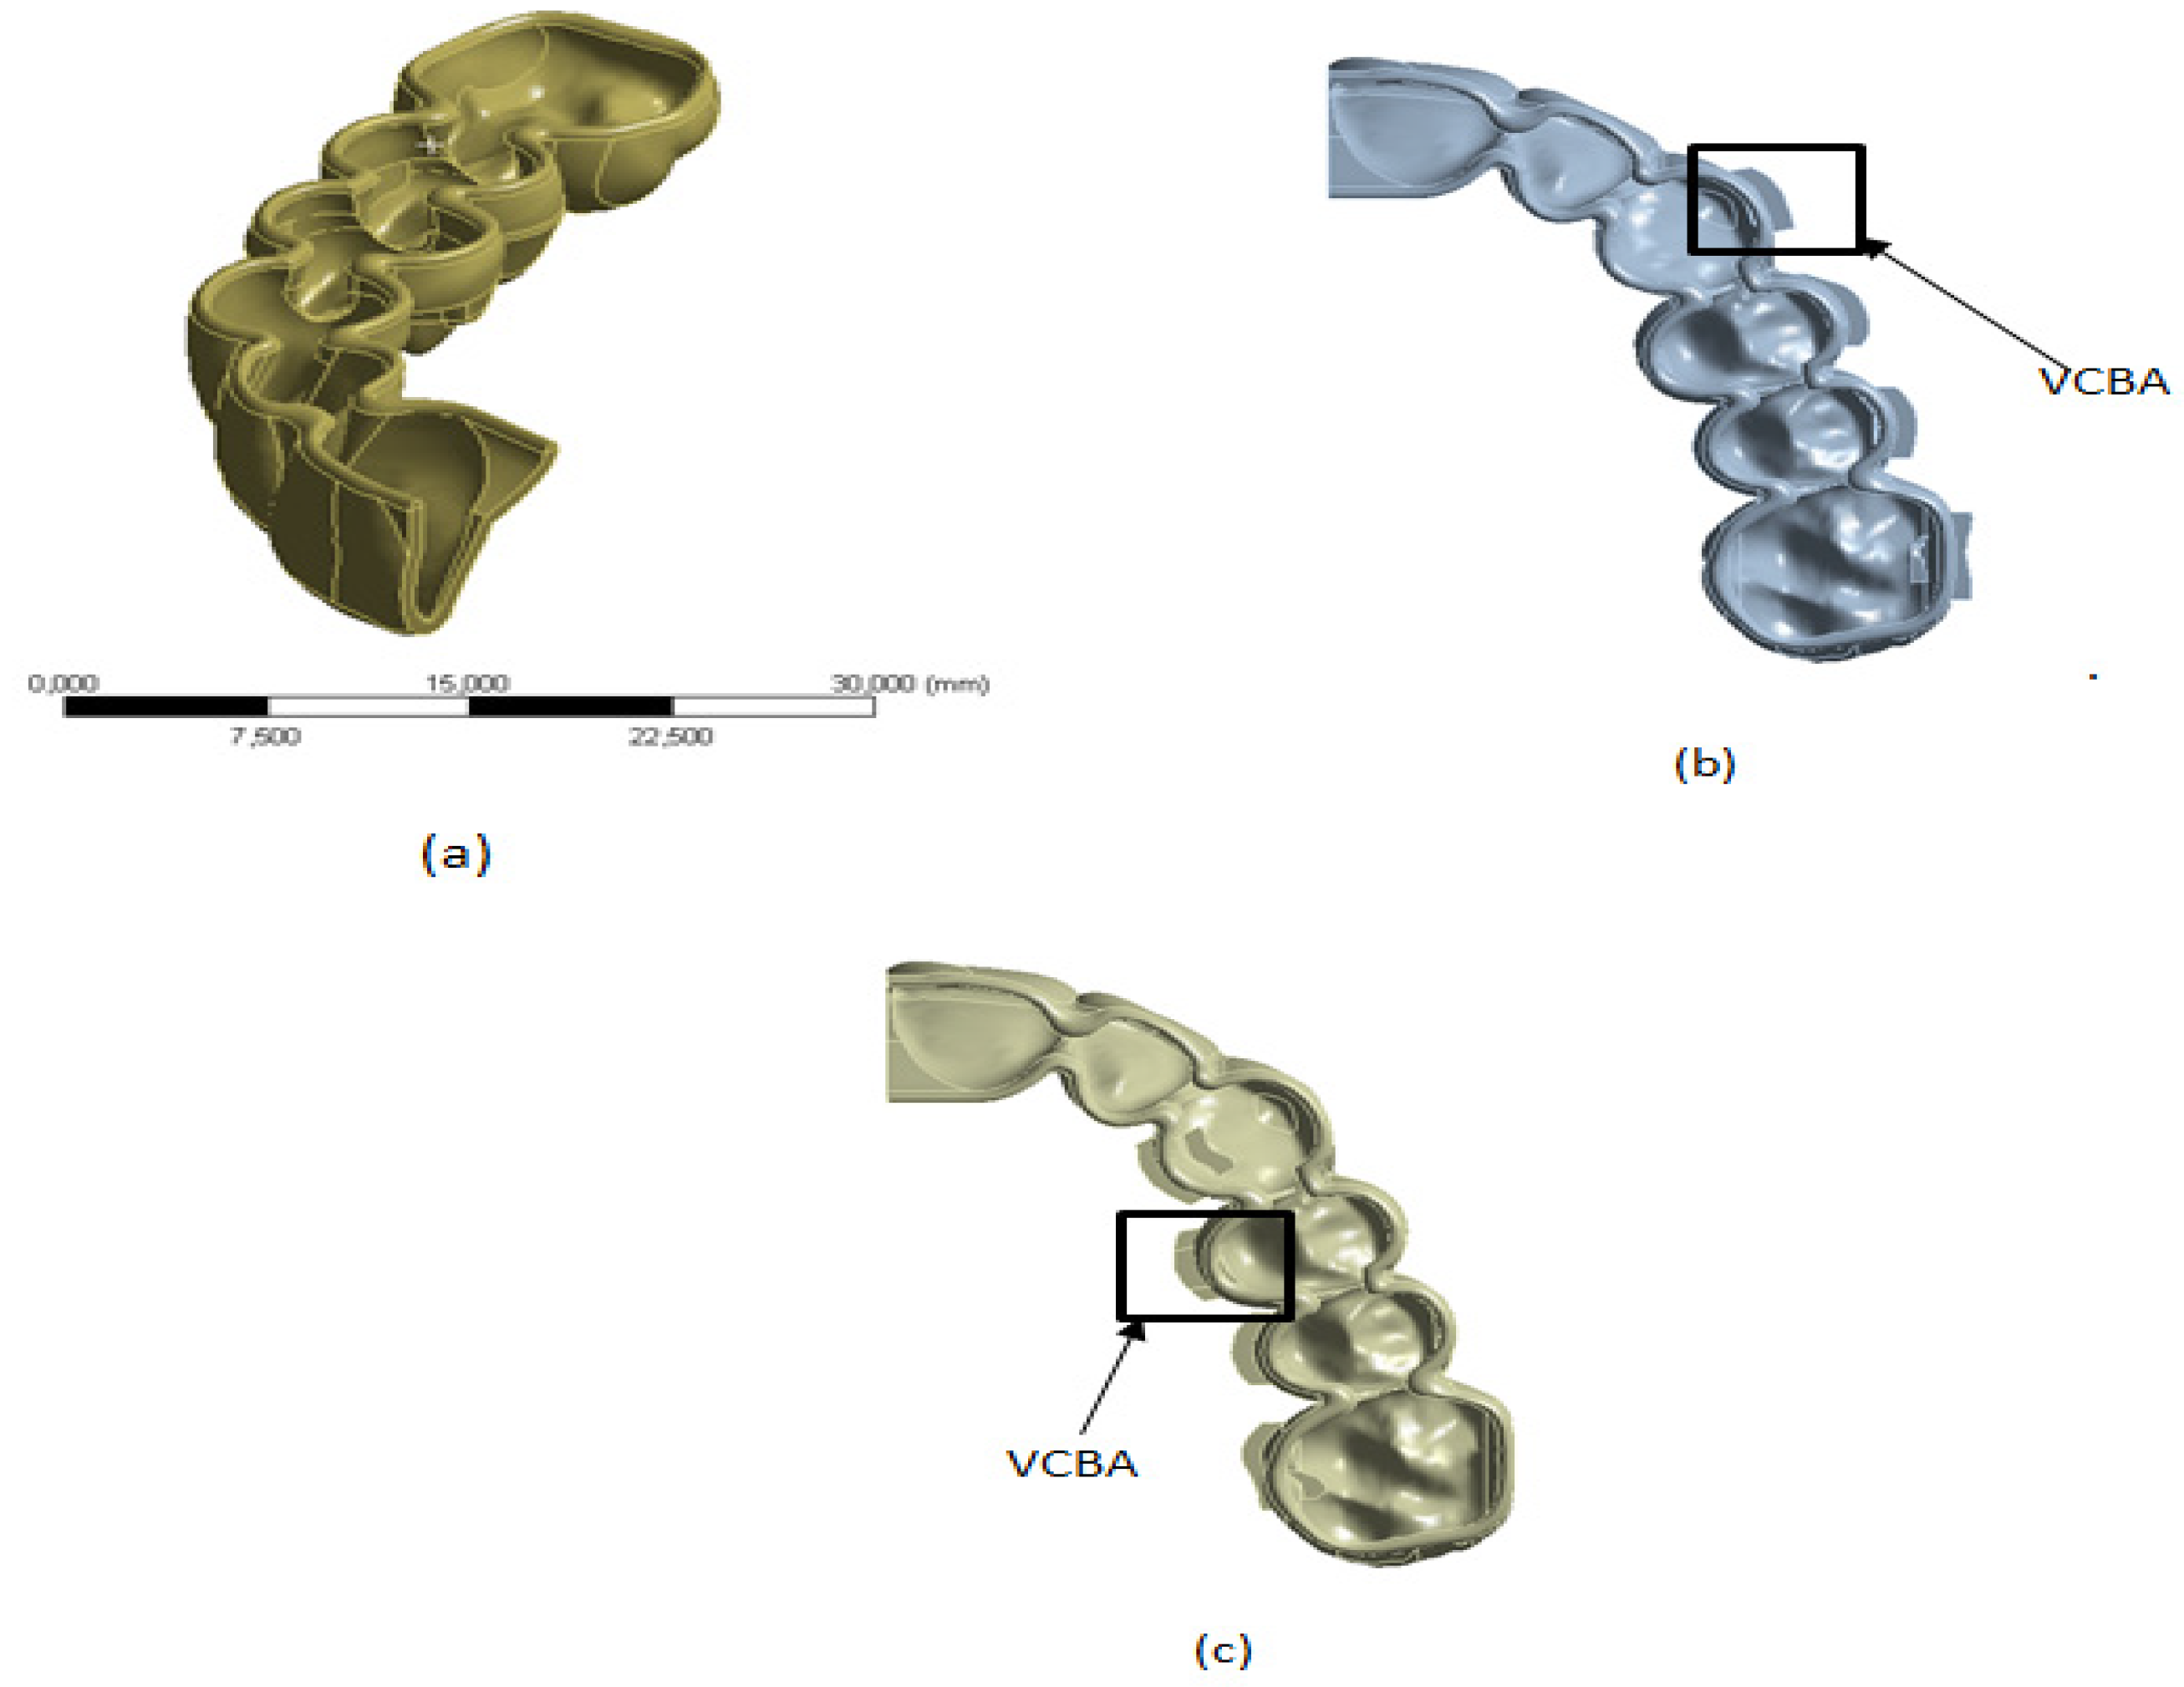
23], the thermoformed aligners were generated using Boolean operations in a 3D parametric CAD program (Dassault Systèmes SolidWorks 2015) with a uniform thickness around the crowns of the teeth of 0.7 mm, for the following configurations: no CBA, with CBA in the vestibular region, and CBA in the palatal region (
Figure 2). Although the size and shape of these attachments can affect the tooth, this impact will be studied in another work. In this investigation, these parameters are determined by dental specialists.
-
B.
Periodontal Ligament (PDL)
The PDL model considered the nonlinear mechanical properties of the PDL that were inferred from the experimental data of strength and displacement of the cross sections of the tooth, PDL and bone. This information was obtained from a 24-year-old male corpse reported in [
31].
Shear stress,
τ, is considered in Equation (2) while shear displacement γ, is expressed in Equation (3)
where,
As is the cross-sectional area of the tooth root, and PDL;
Δl is the elongation obtained in a sample of the PDL after being subjected to at least 3 cycles with a 0.05 MPa load in a material testing machine (MTS 858 Mini Bionix);
WL is the thickness of the PDL.
Data were modeled by an exponential function, see Equation (4)
where the parameters
A and
B were calculated by iterative processes using commercial software reported in [
27], obtaining r
2>0.9. Young and Poisson modules were calculated using the same iterative process.
Based on [
25] and [
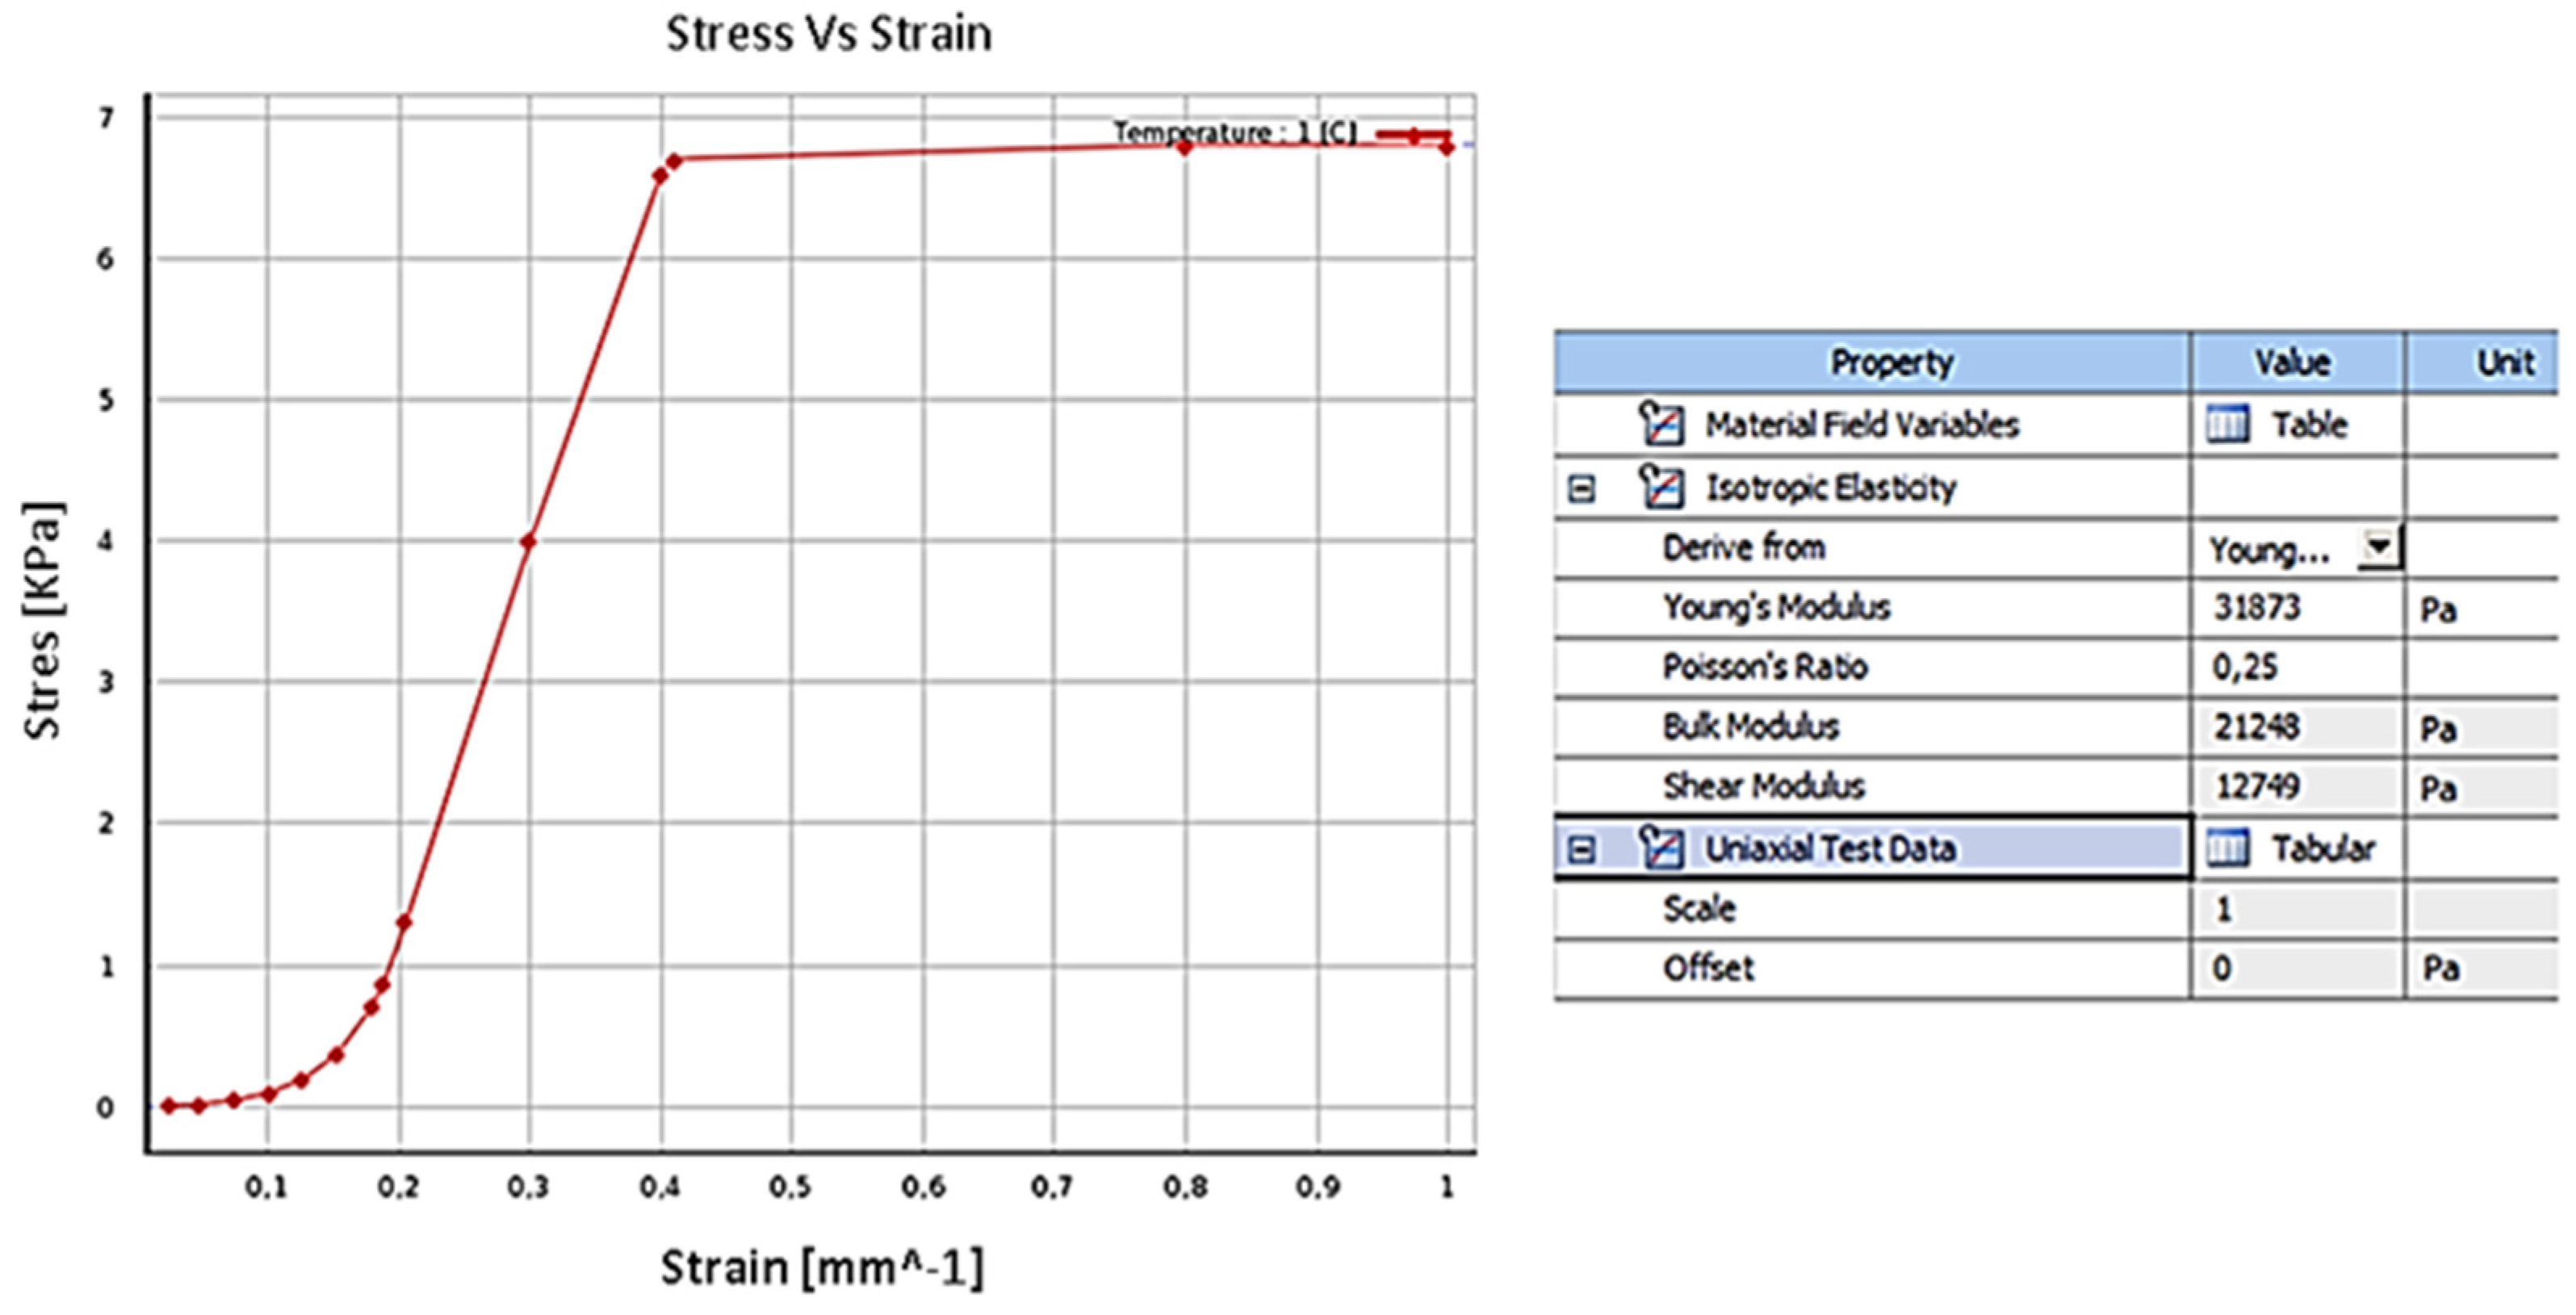
32], a nonlinear elastic model for PDL was adopted, characterized by the points in
Figure 3 which were introduced in Ansys
® software with the following parameters: Young’s module: 31,873 Pa, Poisson module: 0.25, Bulks module: 21,248 Pa and shear module 12,749 Pa.
According to [
7,
19] and [
33], this work simulated the PDL as a uniform thin film of 0.3 mm in thickness around the tooth root.
To define the material characteristics of the tooth, data from [
20,
32] and [
34] was used. Young’s modulus: 1.96E4 MPa, coefficient of Poisson: 0.3 and linear elastic model were considered. The CAD model of the tooth was generated based on a real scale cloud of points which considered the tri-radicular molar (6), mono-radicular premolar (5), bi-radicular premolar (4), and canine (3), respectively.
-
D.
Complementary biomechanical attachments (CBA)
Based on [
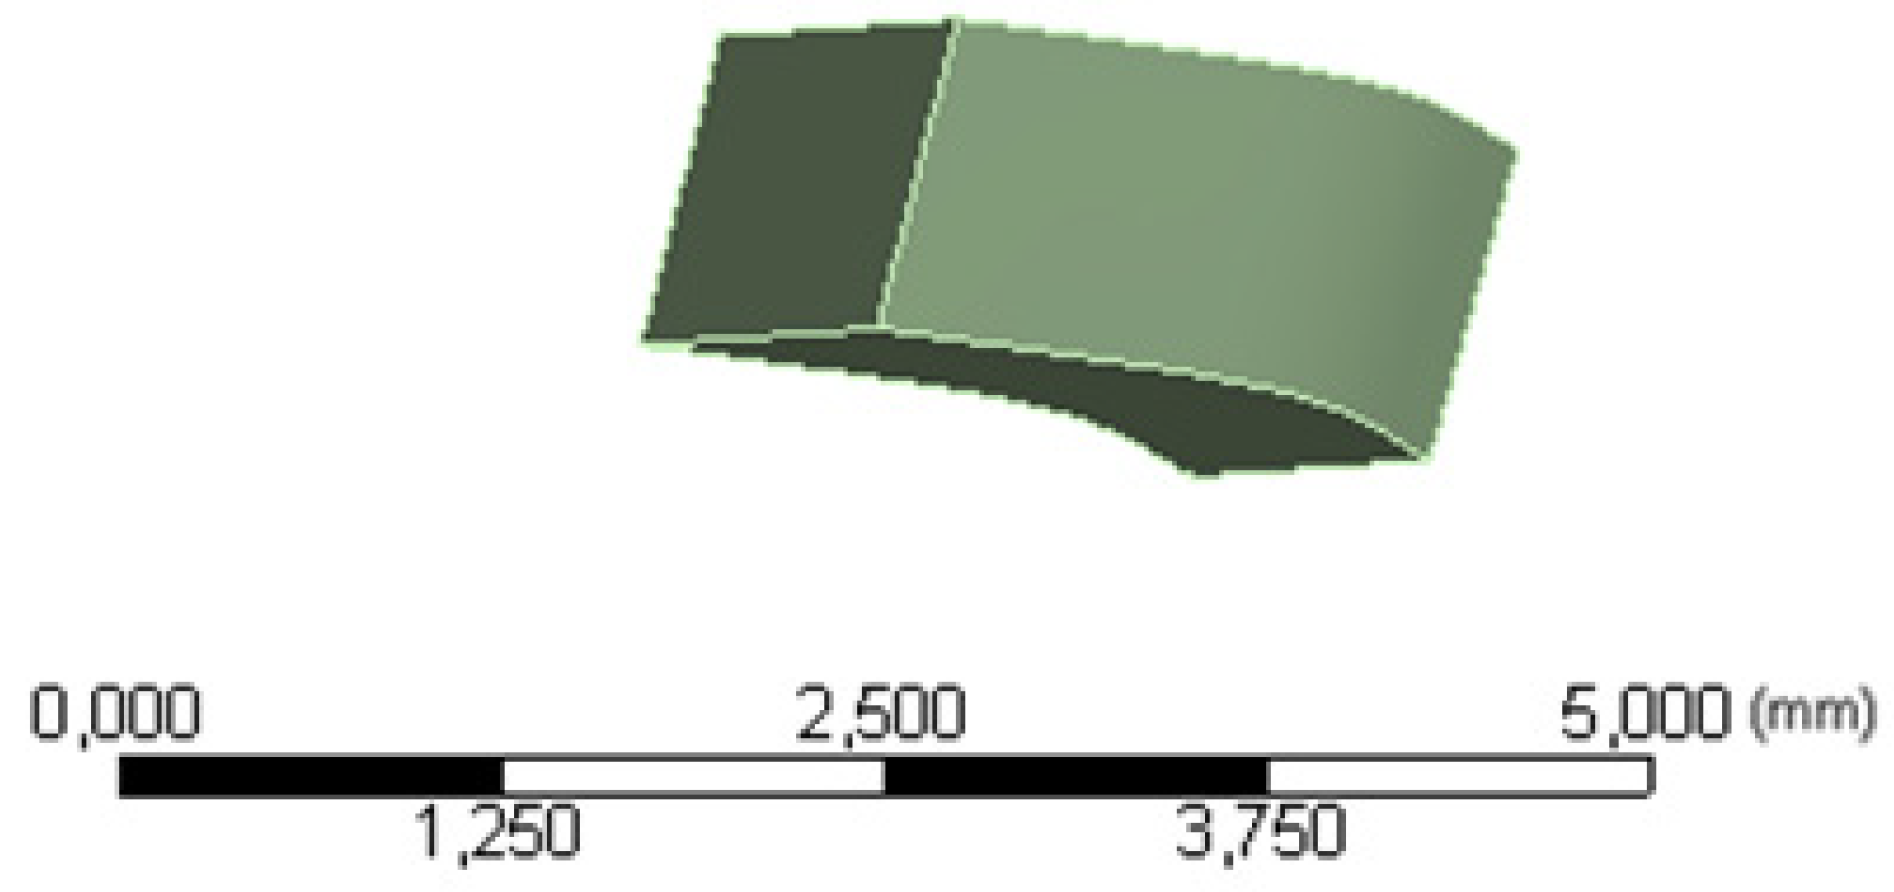
35], the resin selected was Filtek P60 with: Young’s Module of 1.25E+03 MPa and a Poisson Coefficient of 0.36. The CBA were considered to adhere to half of the crown surface of each tooth.
Figure 4 presents the prescribed geometry.
-
E.
Loading and Boundary condition for FEM analysis
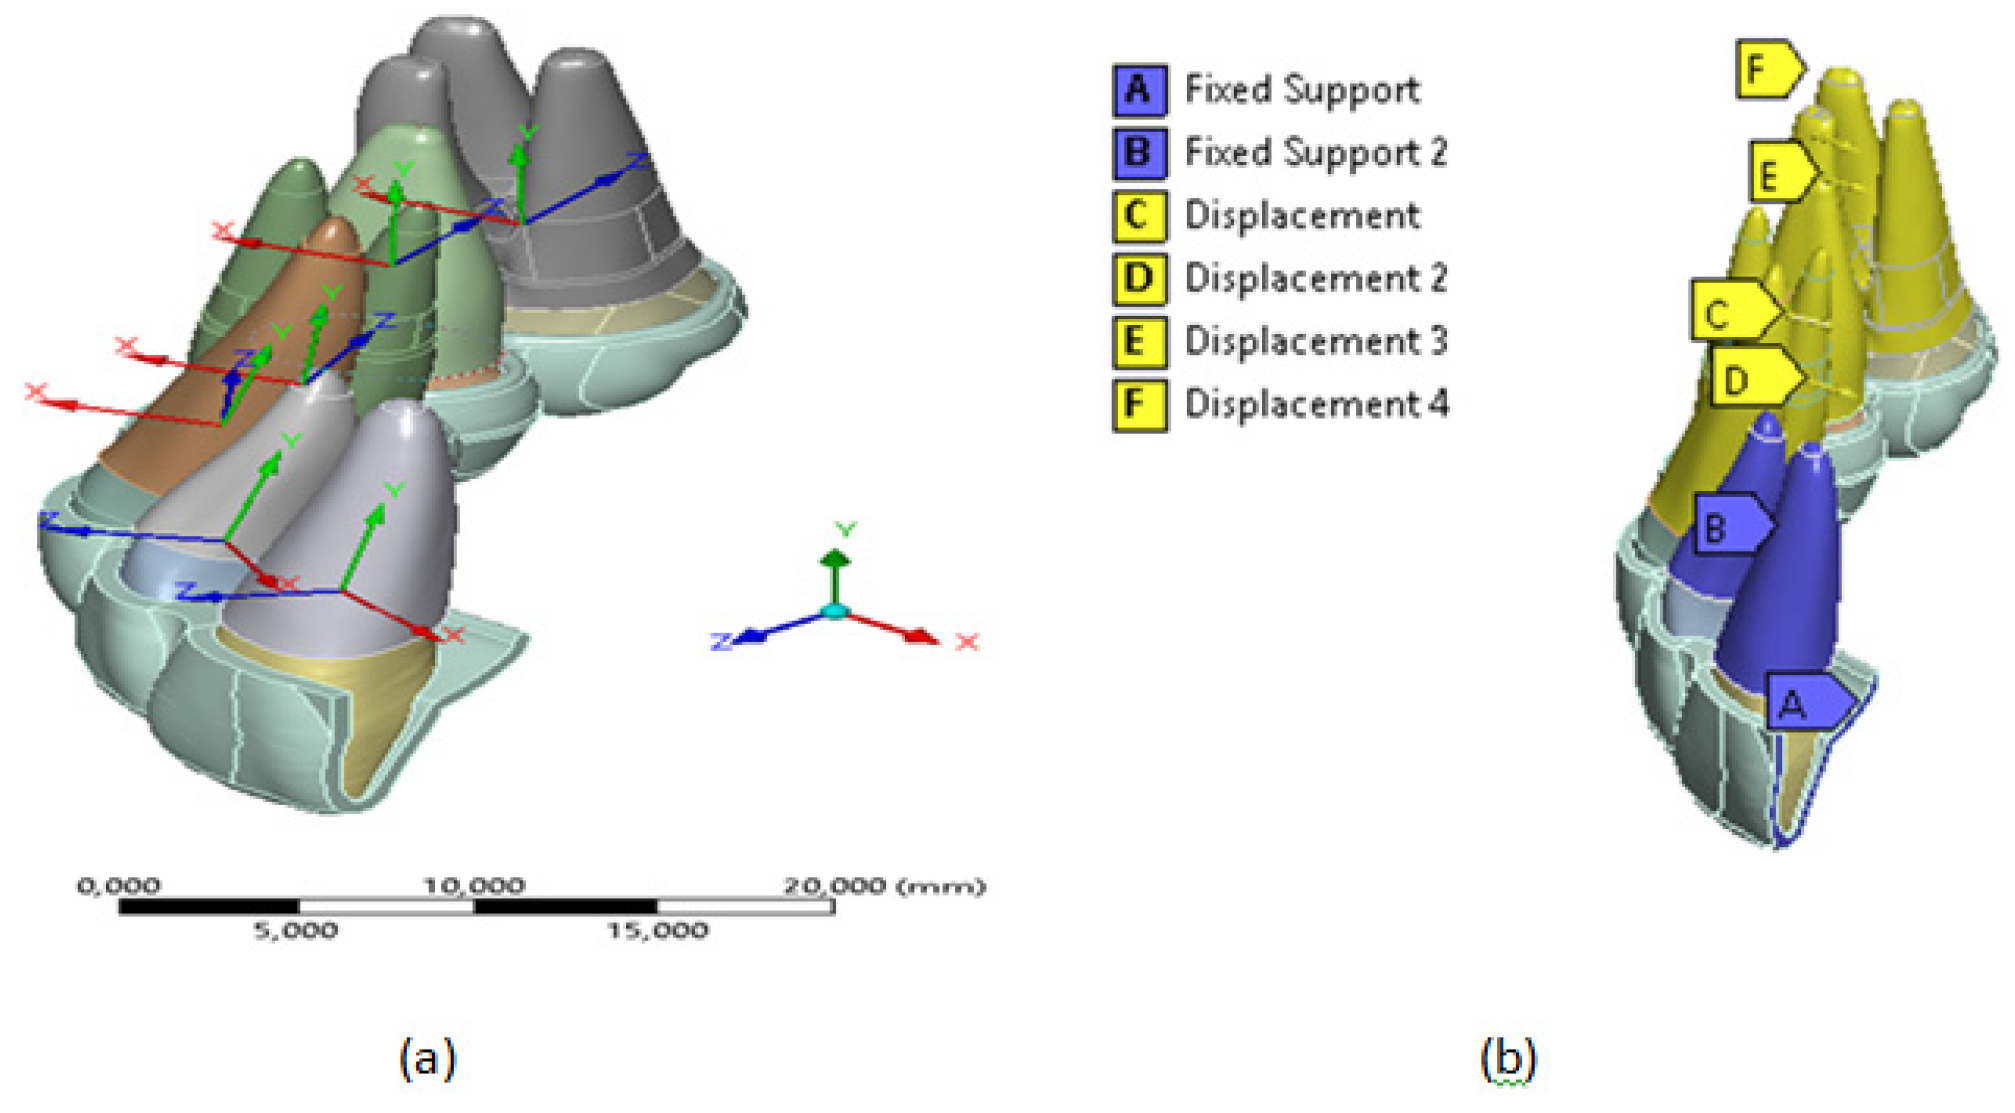
To ensure symmetry in the sagittal plane of oral morphology at point (A), see
Figure 5, a condition of Fixed Support was assumed at the edge of the thermoformed plate [
36]. Furthermore, considering that the external surfaces of the PDL are attached to the bone, which has greater structural rigidity, a solidarity movement was assumed through a Fixed Support boundary condition in the region described with the letter B, see
Figure 5 (b), in the teeth (1, central) and (2, incisive).
The expansion movement was represented approximately by imposing 0.15 mm shifts towards the vestibular direction (local directions X) in
Figure 5(a) on the external surfaces, bone-tooth contact of the teeth PDL (3, canine), (4, premolar), (5, molar) and (6, molar). These displacements are represented by the letters C, D, E and F, respectively in
Figure 5(b). Additionally, they considered the free movement and local addresses and local addresses fixed Z, to ensure displacement in the vestibular direction.
According to [
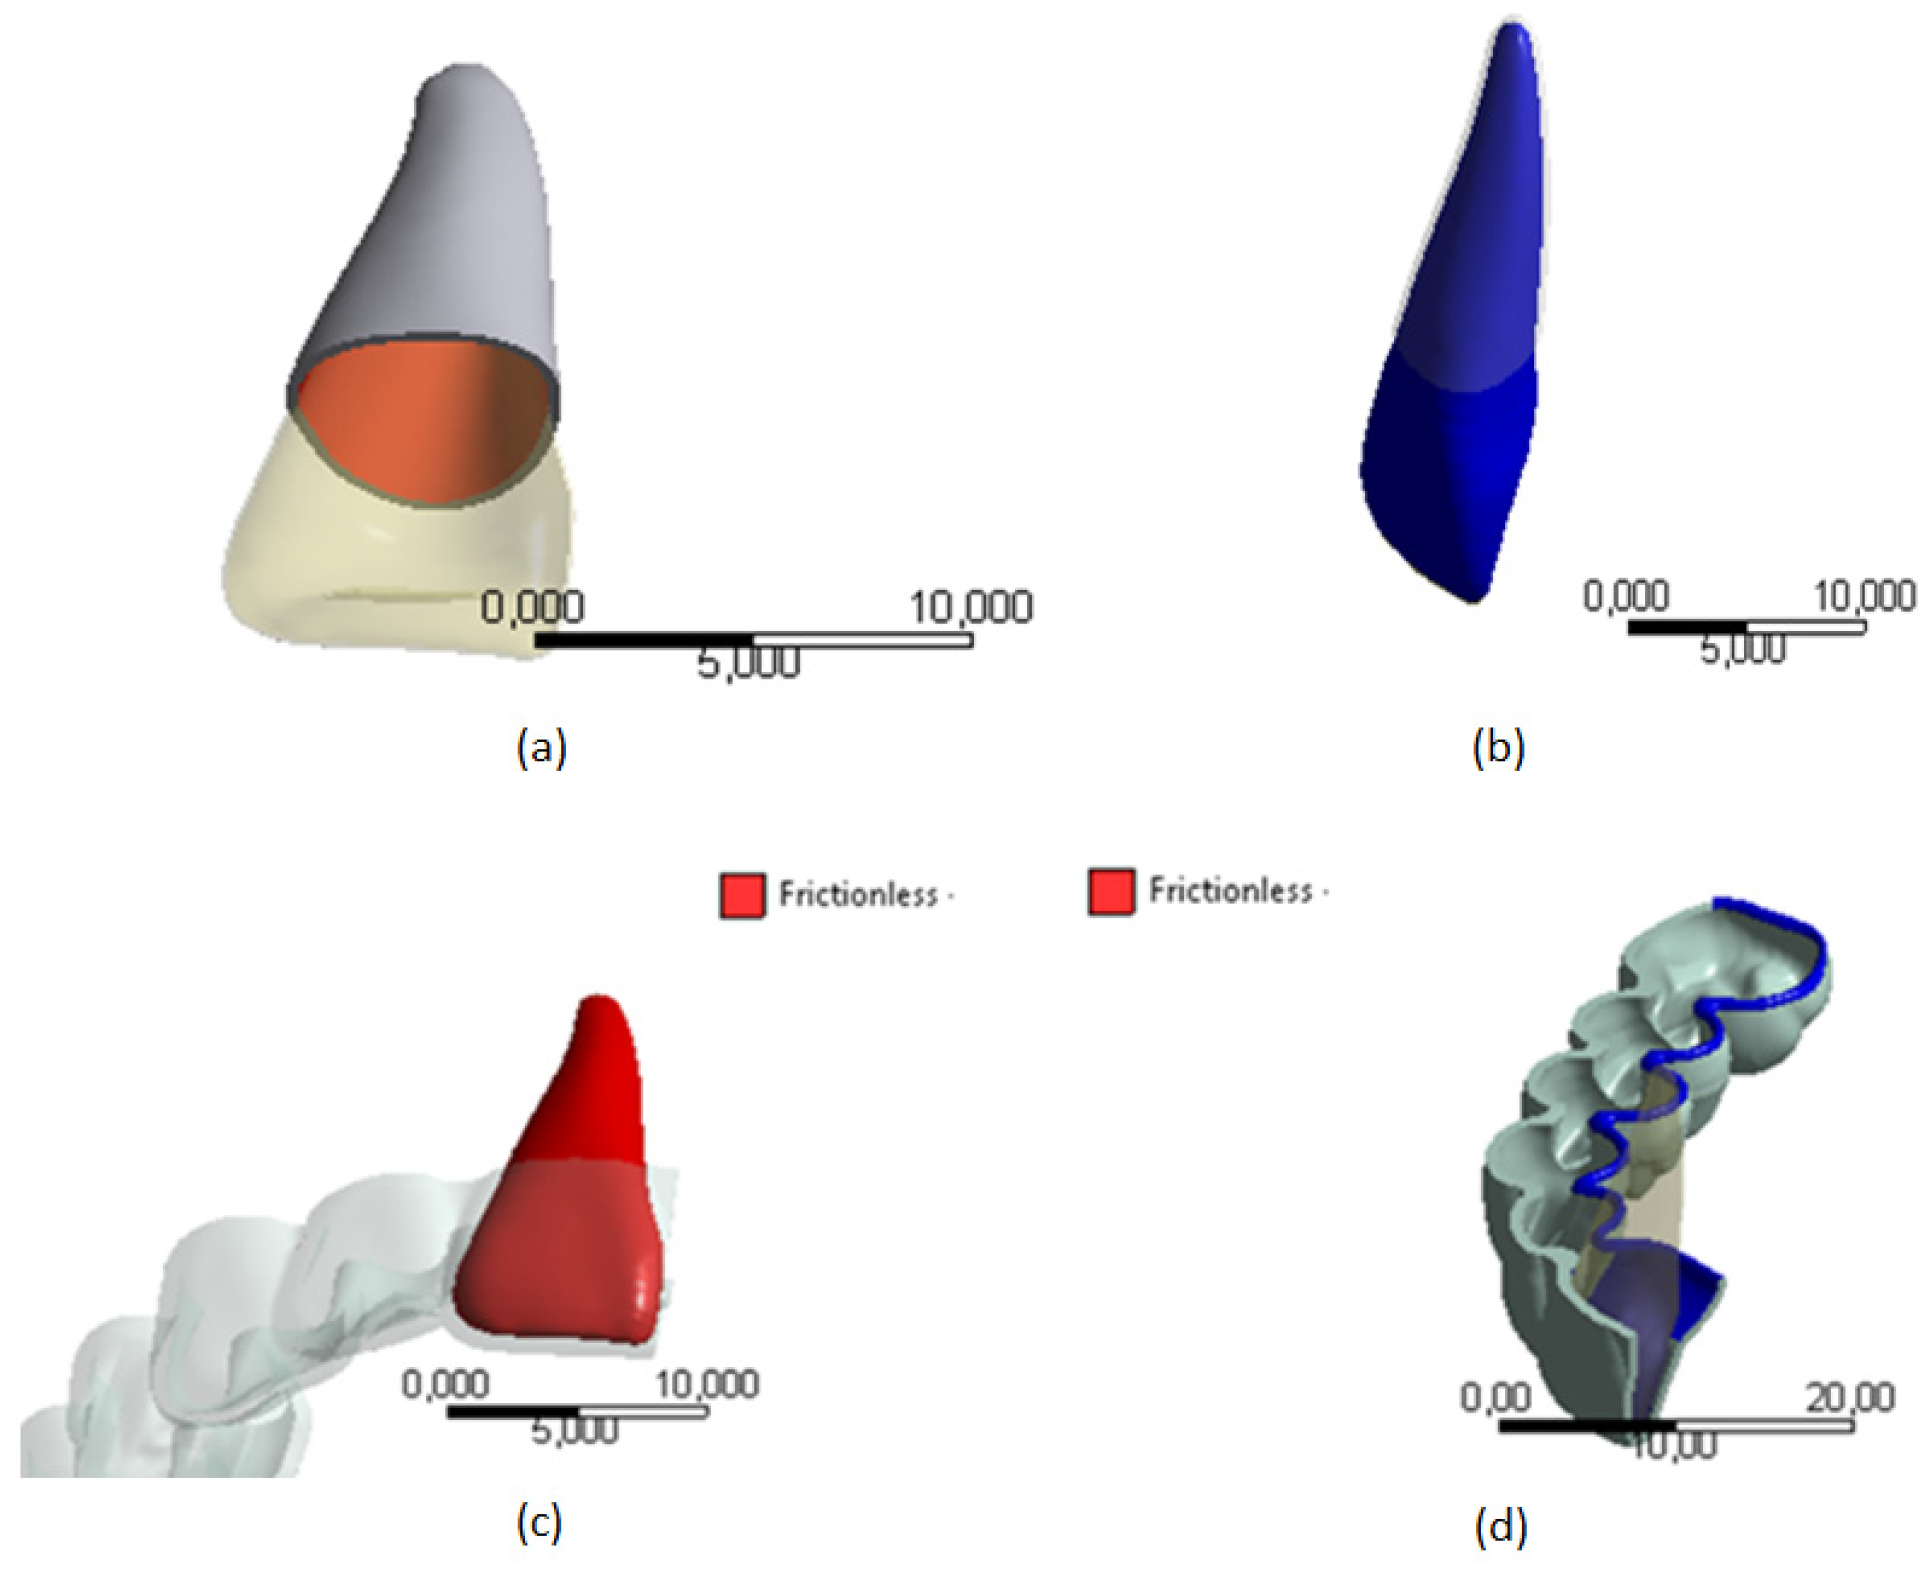
27], it was assumed that the interaction between the contact surfaces of the teeth and their PDL present perfect adhesion, therefore, it was represented by a bonded condition, see
Figure 6(a) and (b). Taking into account that between the polymeric material of the aligner and the biological tissue of the teeth there is presence of saliva, the interaction between the contact surfaces between the crowns of the teeth and the thermoformed plate was assumed to be a frictionless condition, see
Figure 6 (c) and (d).
To generate FEM analysis, each outer surface of the PDL was moved 0.15 mm to perform the expansion, without considering the effects of bone remodeling. This displacement was assumed in thirty steps, with initial steps of five. The contact stiffness was updated automatically for each iteration. Using the Newton-Raphson method’s iterations, the mismatch criteria were compared to the maximum value of allowed penetration.
Given that this study does not consider bone regeneration, the simulation was carried out in the Ansys’s ® Structural static module, using an iterative solver. The Newton-Raphson method was used to model the interaction between the mechanical behavior of the PDL and the frictionless contact between the tooth crown and the thermoformed plate.
3. Results
The predictability of the model and the length lg were estimated using Equation (4) by comparing the activation distance lp (0.15 mm) prescribed on the contact surfaces between the bone and periodontal ligament.
According to the results of the simulations, the forces exerted on the canine teeth to be molar are less than 0.35 N (35.7 g), according to what is referenced in [
37]. The results of the load required for movement of canine (3) in a mandibular expansion of 0.15 mm in the palatal vestibular direction presented a percentage difference of 17% with those reported in [
21]. The difference can be explained since the reference did not consider the effect of the movement of the set of teeth, from canine to molar.
In
Figure 7,
Figure 8,
Figure 9 and
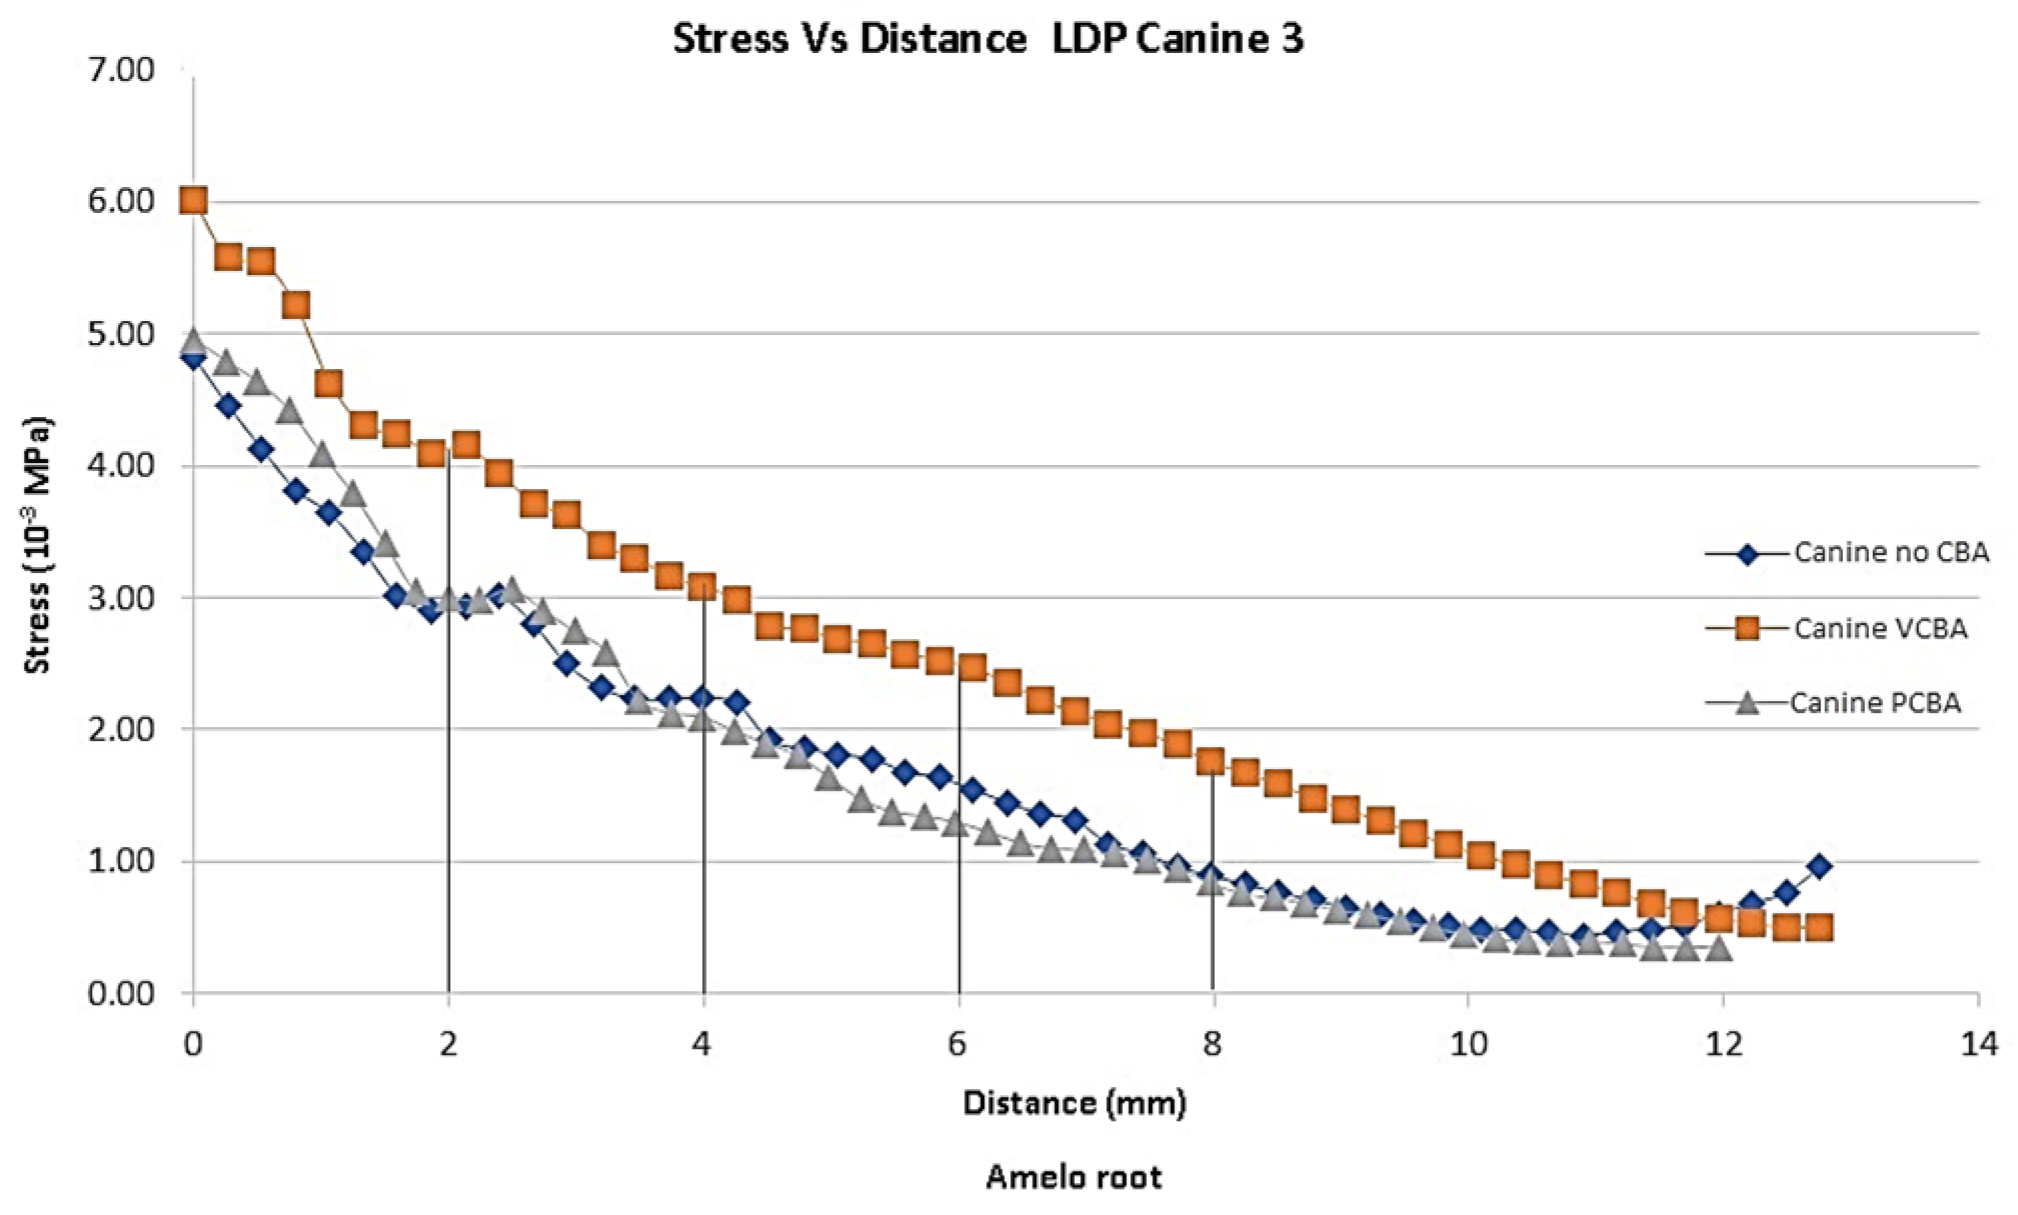
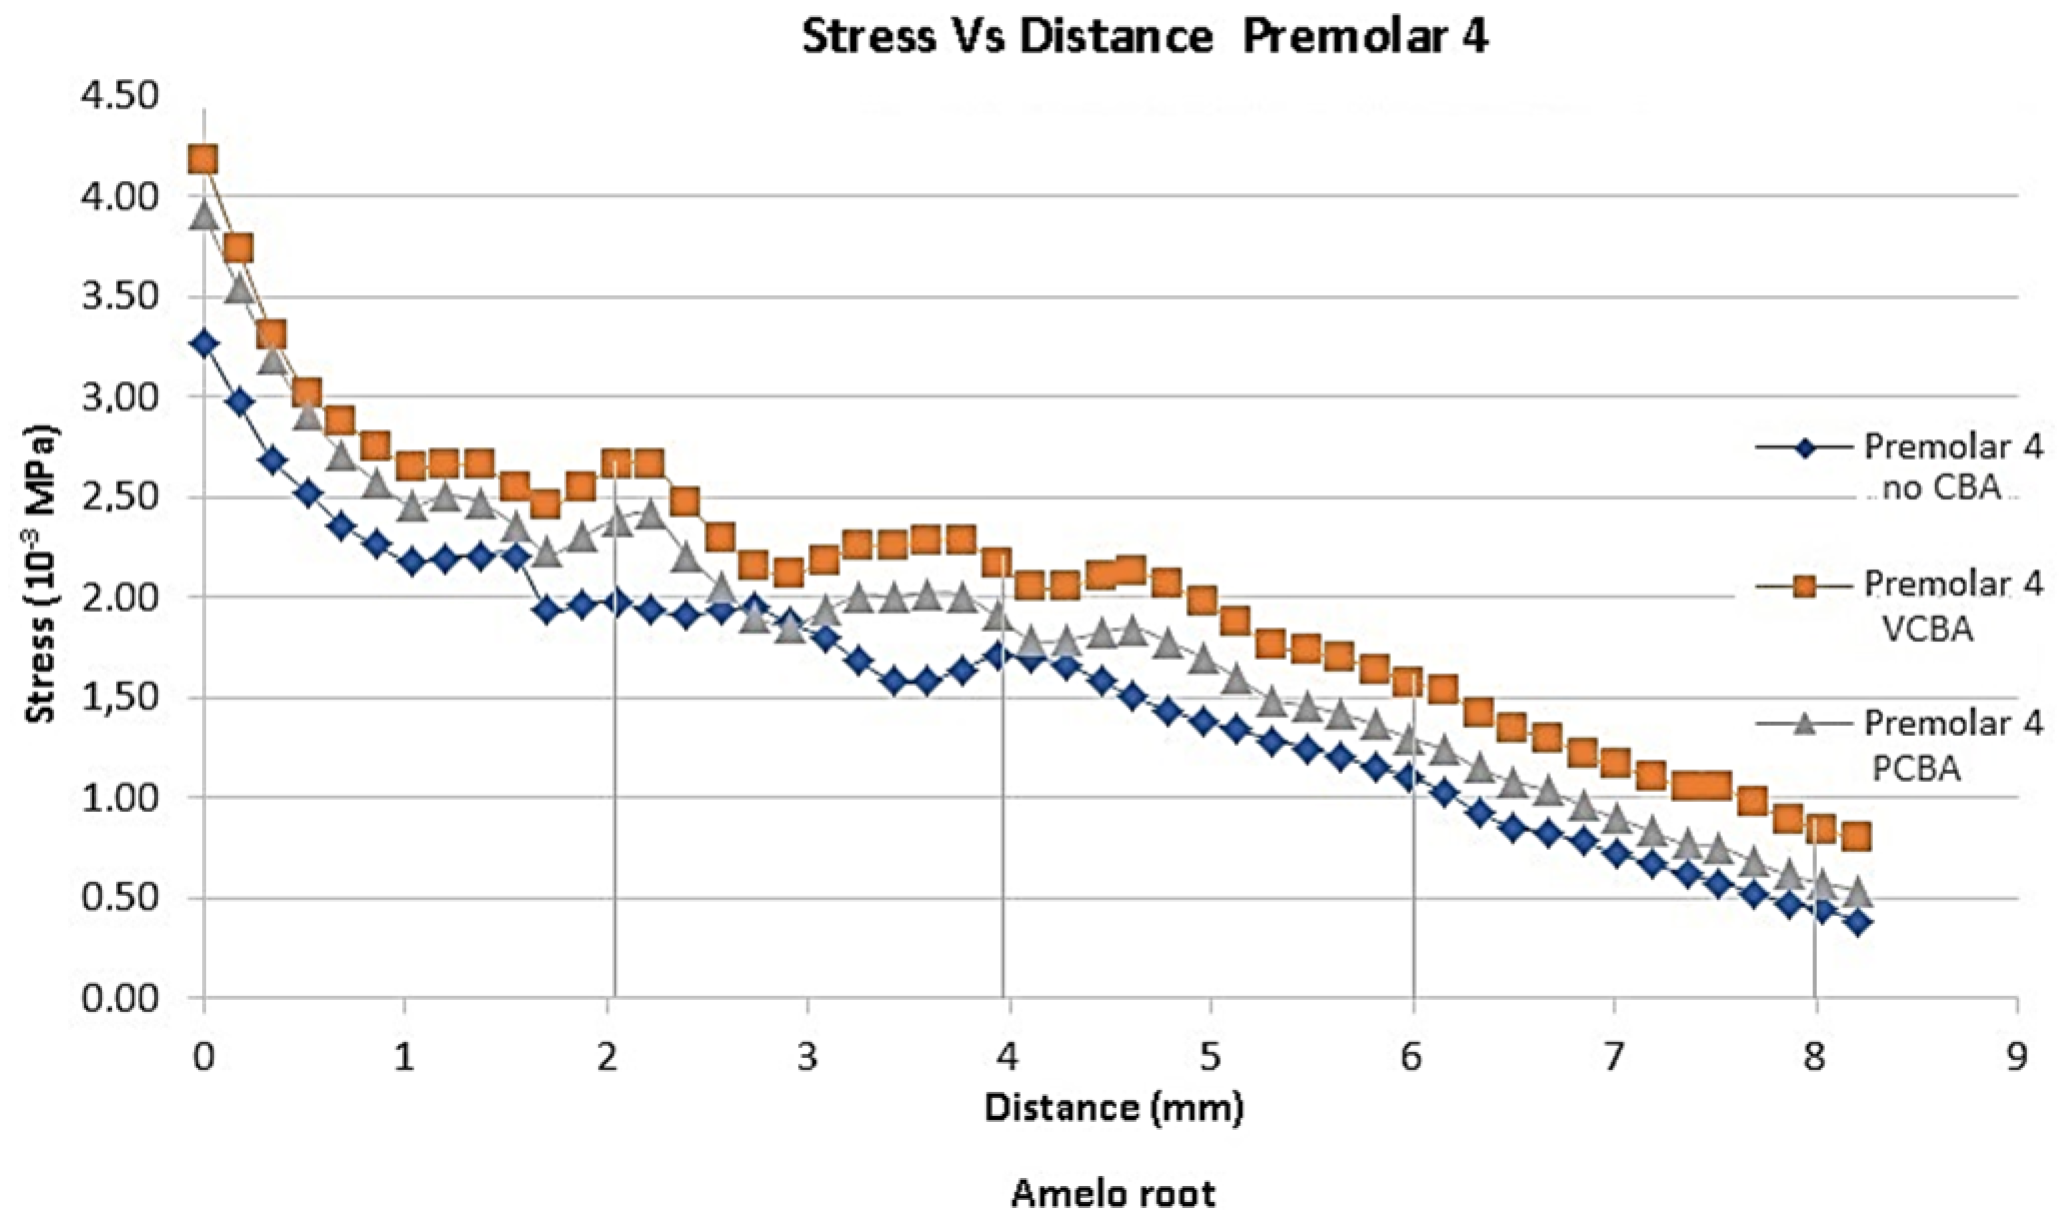
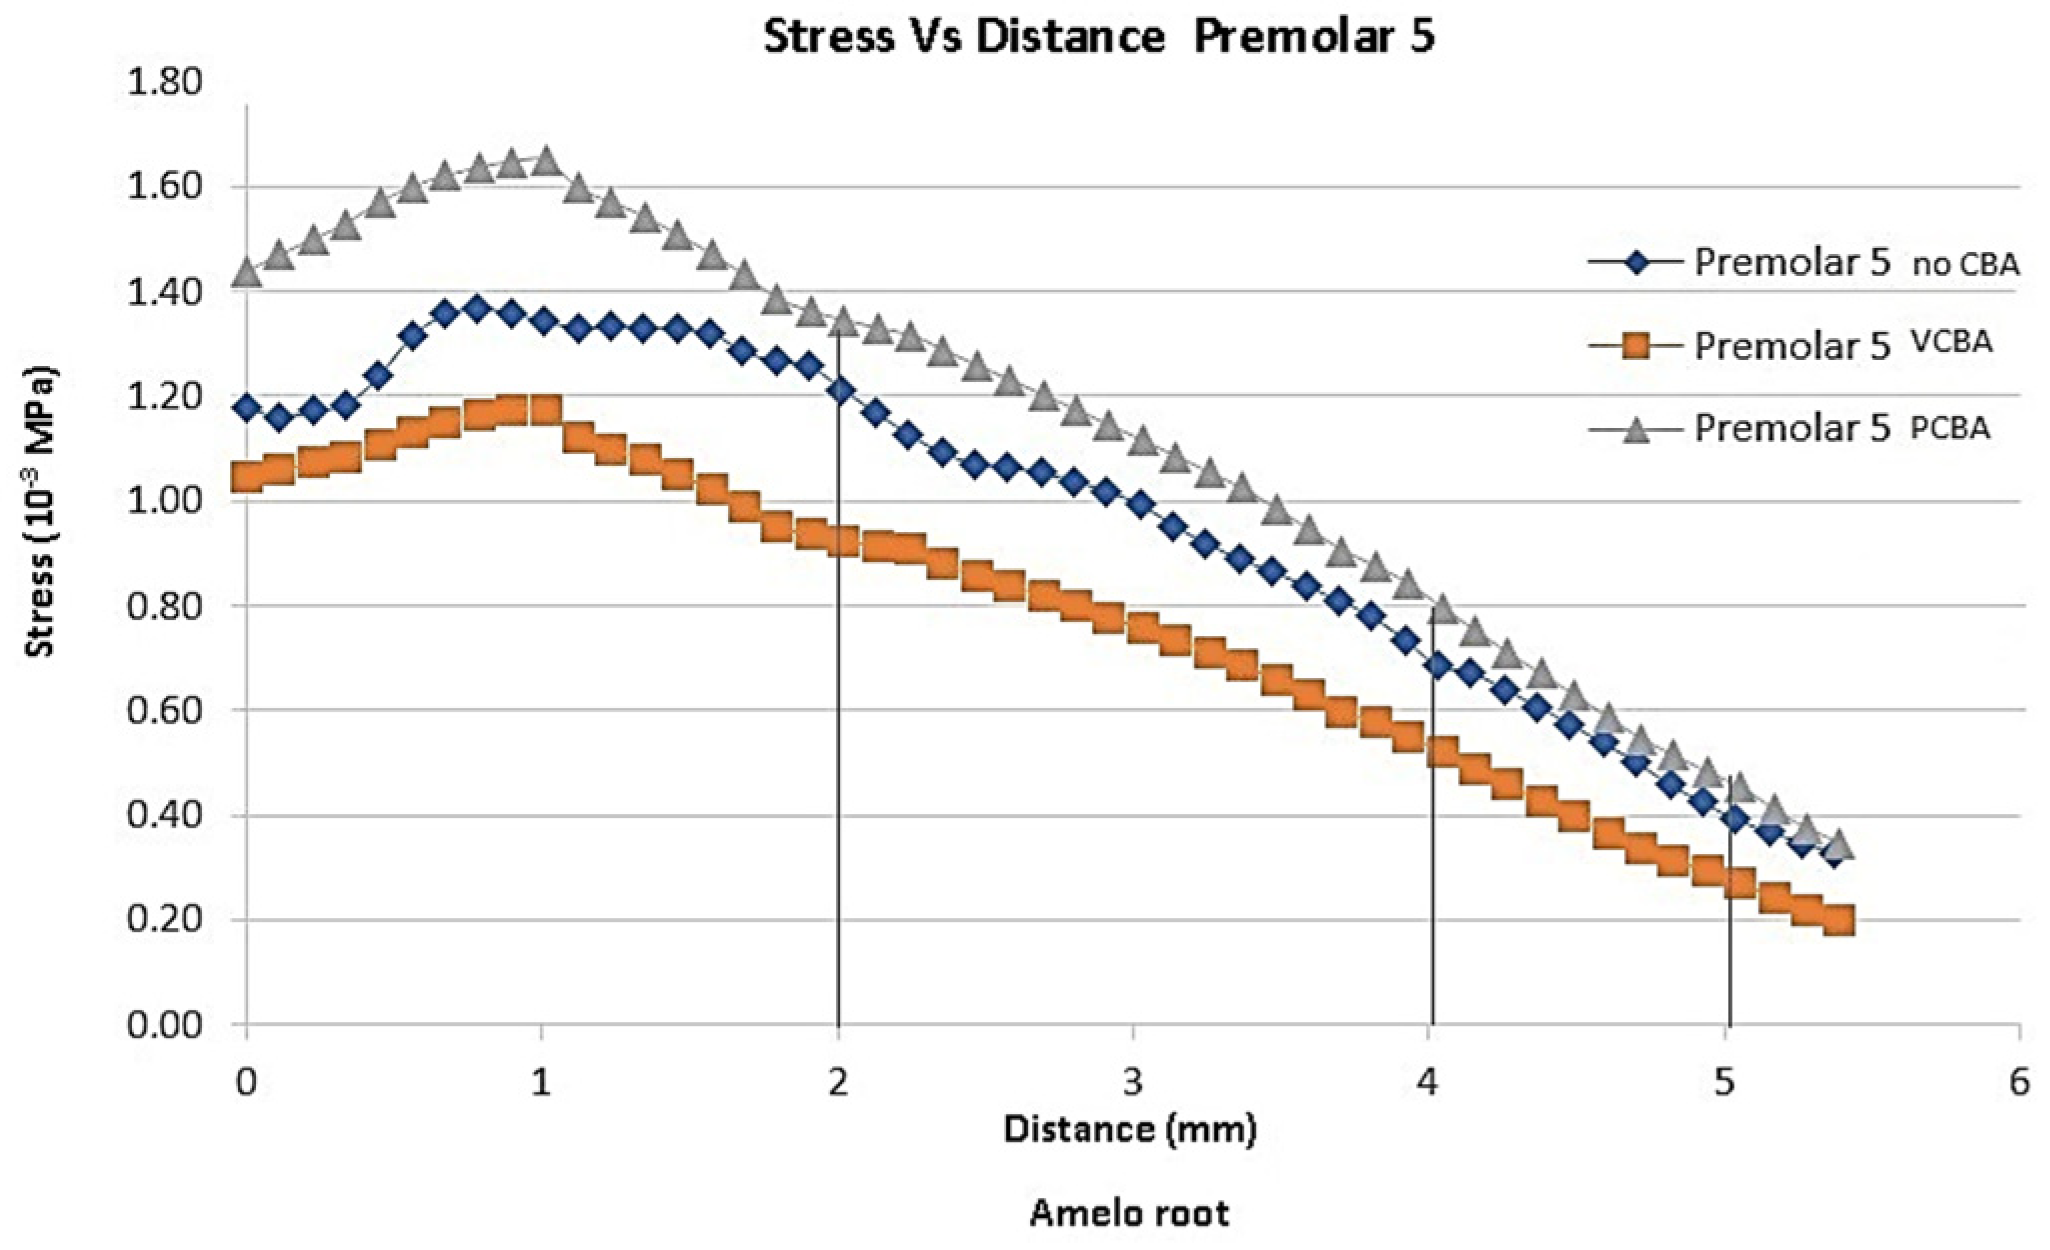
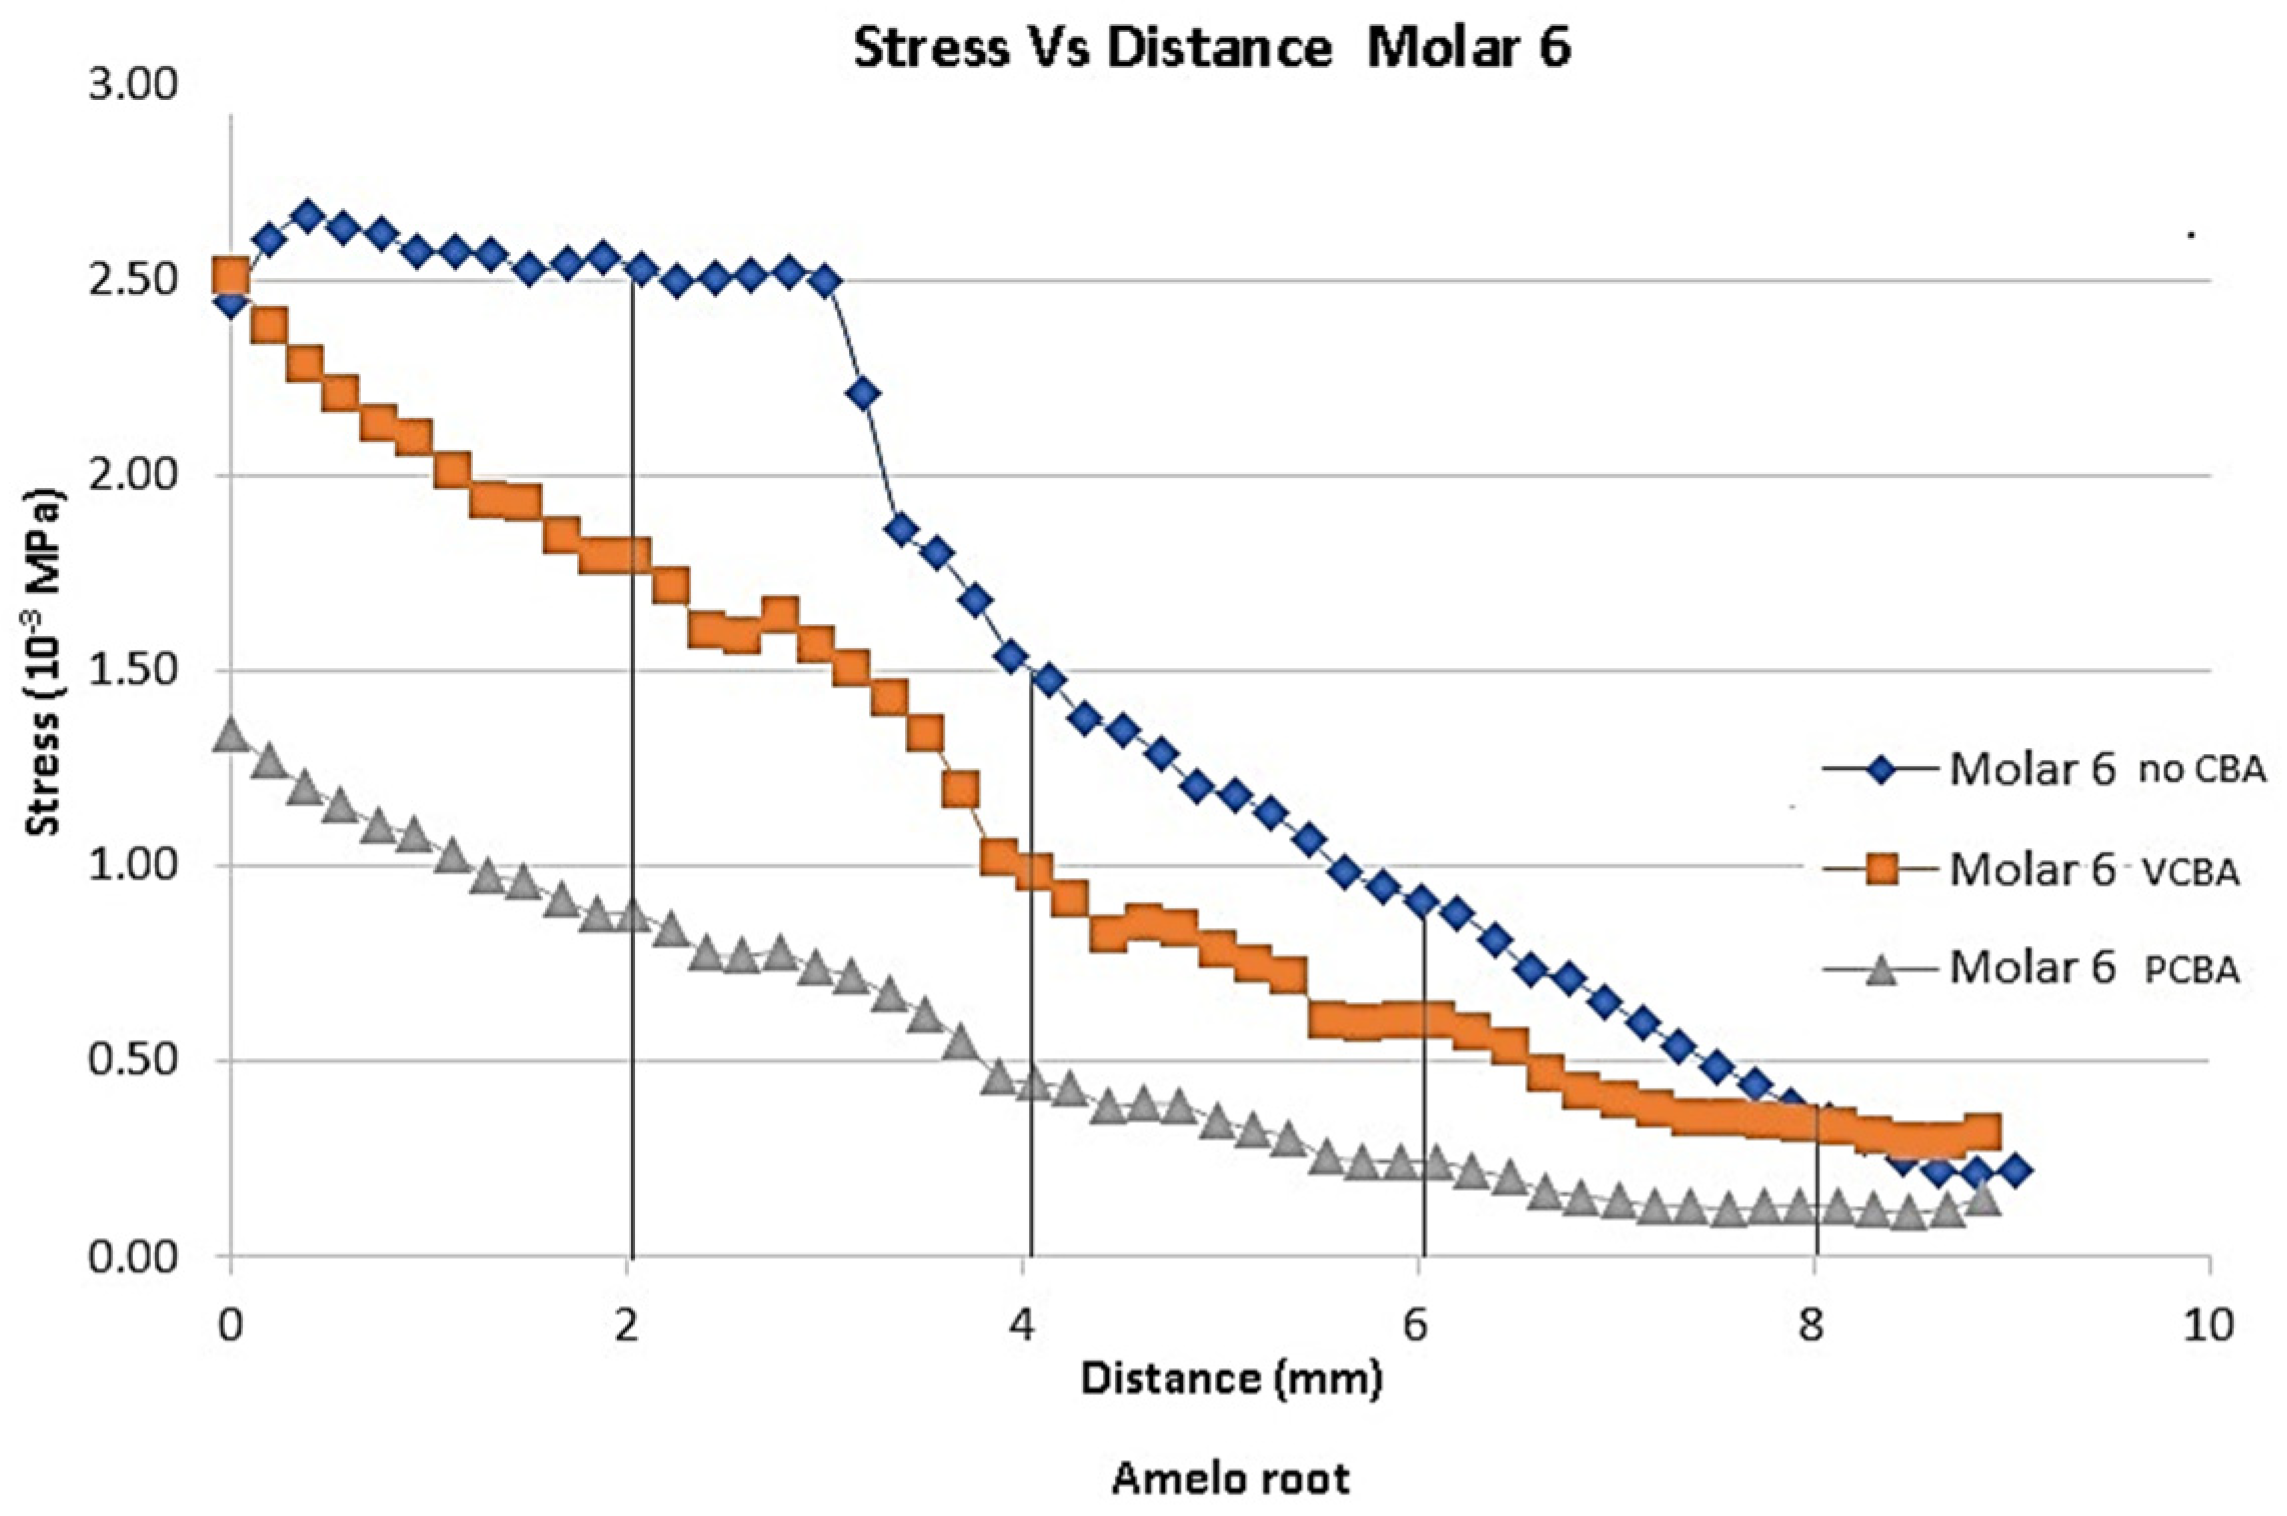
Figure 10 the variation of the Von Mises equivalent stress is observed along the PDL through the set of teeth in canine 3, Premolar 4 and 5 and molar 6, considered from the cement-enamel junction (where the LDP begins) to the root.
References points were set for canine 3, premolar 4 and premolar 6 at 2, 4, 6 and 8 mm from amelocemental junction. For premolar 5, references points were set at 2, 4 and 5 mm from amelocemental junction.
Considering stress distribution, it can be hypothesized that the effects of using CBA exhibit greater relevance based on the separation plane of symmetry. In this sense, the teeth premolar 5 and molar 6 were the ones that presented greater stress values.
In
Figure 7 results for canine 3 shows Von Mises stress of 0.004822 MPa using no CBA aligners, a stress of 0.004958 MPa using PCBA aligners and finally 0.006007 MPa using VCBA aligners.
In
Figure 8 results for premolar 4 show a stress of 0.003273 MPa using no CBA aligners, a stress of 0.003907 MPa using PCBA aligners and finally 0.004179 MPa using VCBA aligners. In Figure 12 Results show a load of 1.14 E-01N and a moment of 8.05E-1 N*mm with no CBA. On the other hand, using the PCBA aligner, the load and moment were 1.54E-01 N and 9.42E-1 N*mm respectively. While the VCBA results show a maximum load and moment of 2.21E-01N and 9.47E-1 N*mm.
In
Figure 9 results for premolar 5 shows a stress of 0.001358 MPa at 1 mm from amelocemental junction with no need of a CBA aligner. Stress of the VCBA aligner was 0.001173 MPa, while stress for the PCBA aligner was maximum of 0.001649 MPA. In this case, the stresses of VCAB are lower than PCBA without the need for a CBA aligner in a middle zone.
In
Figure 10 results for molar 6 shows a stress of 0.000.002520 MPa at 2 mm from the amelocemental junction with no need of a CBA aligner. The stress of the VCBA aligner was 0.00179 MPa, while stress of the PCBA aligner was a maximum of 0.0087 MPA. In this case, stresses of the no CBA aligner are higher than for VCB and PCBA.
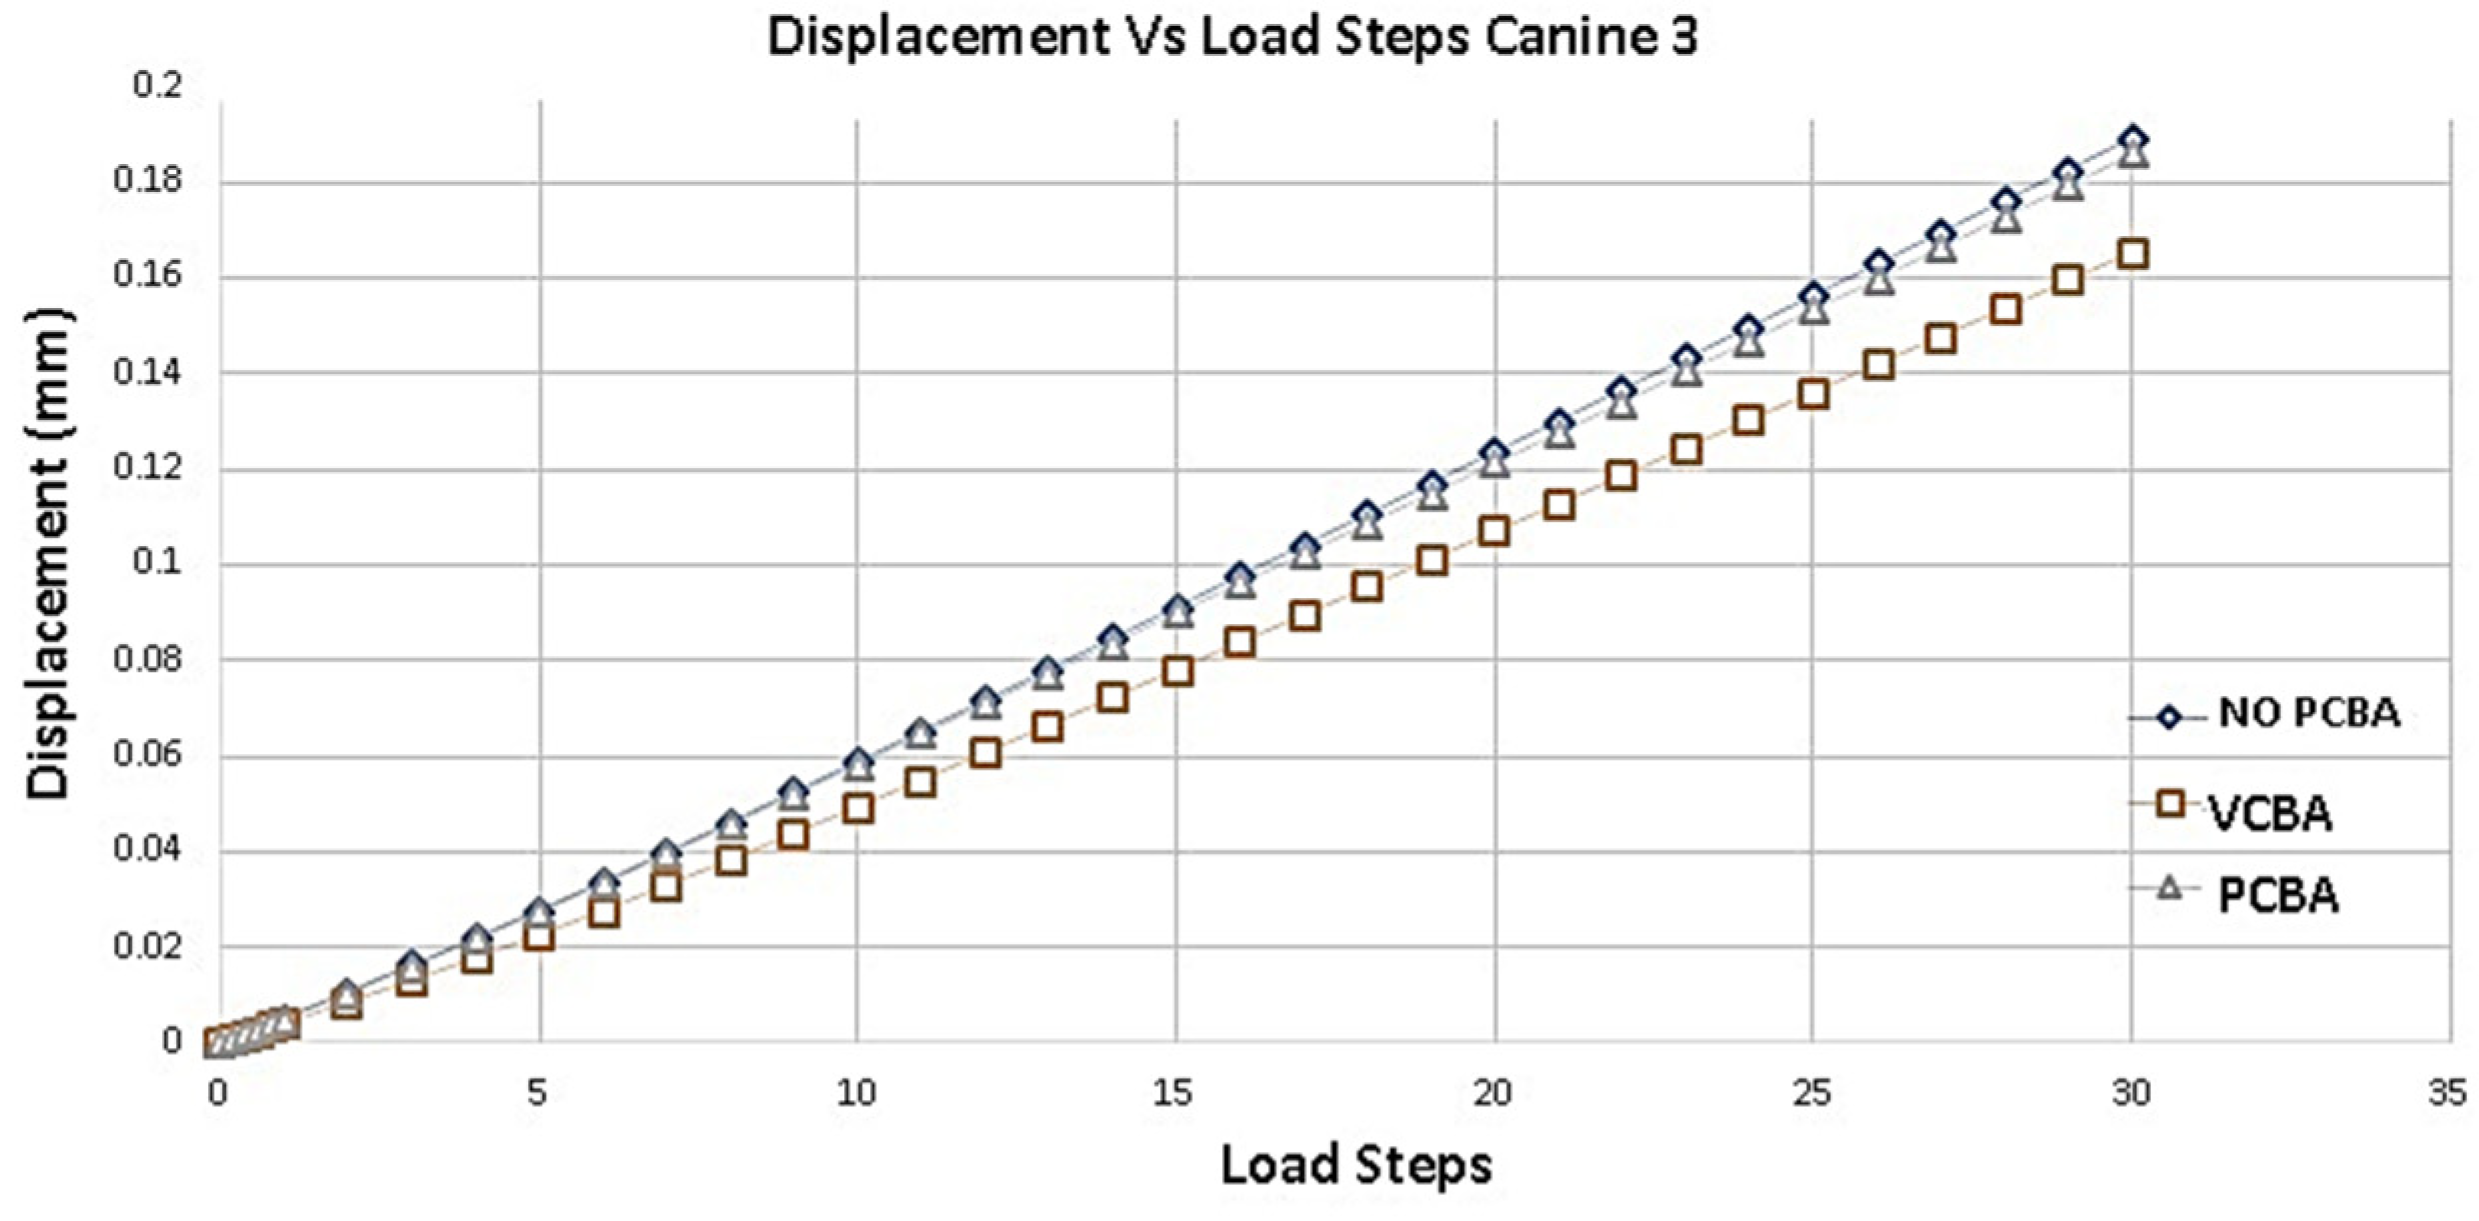
Figure 11 shows the deformation of the PDL of canine 3 with a progressive application of the load. Taking as reference the results of the deformation of the no CBA model, a percentage difference of -12.698% with respect to the model with buccal abutments is presented. And, with respect to the model with palatal abutments, the percentage difference is of -1.587%. The largest displacements are presented in the no CBA model.
According to
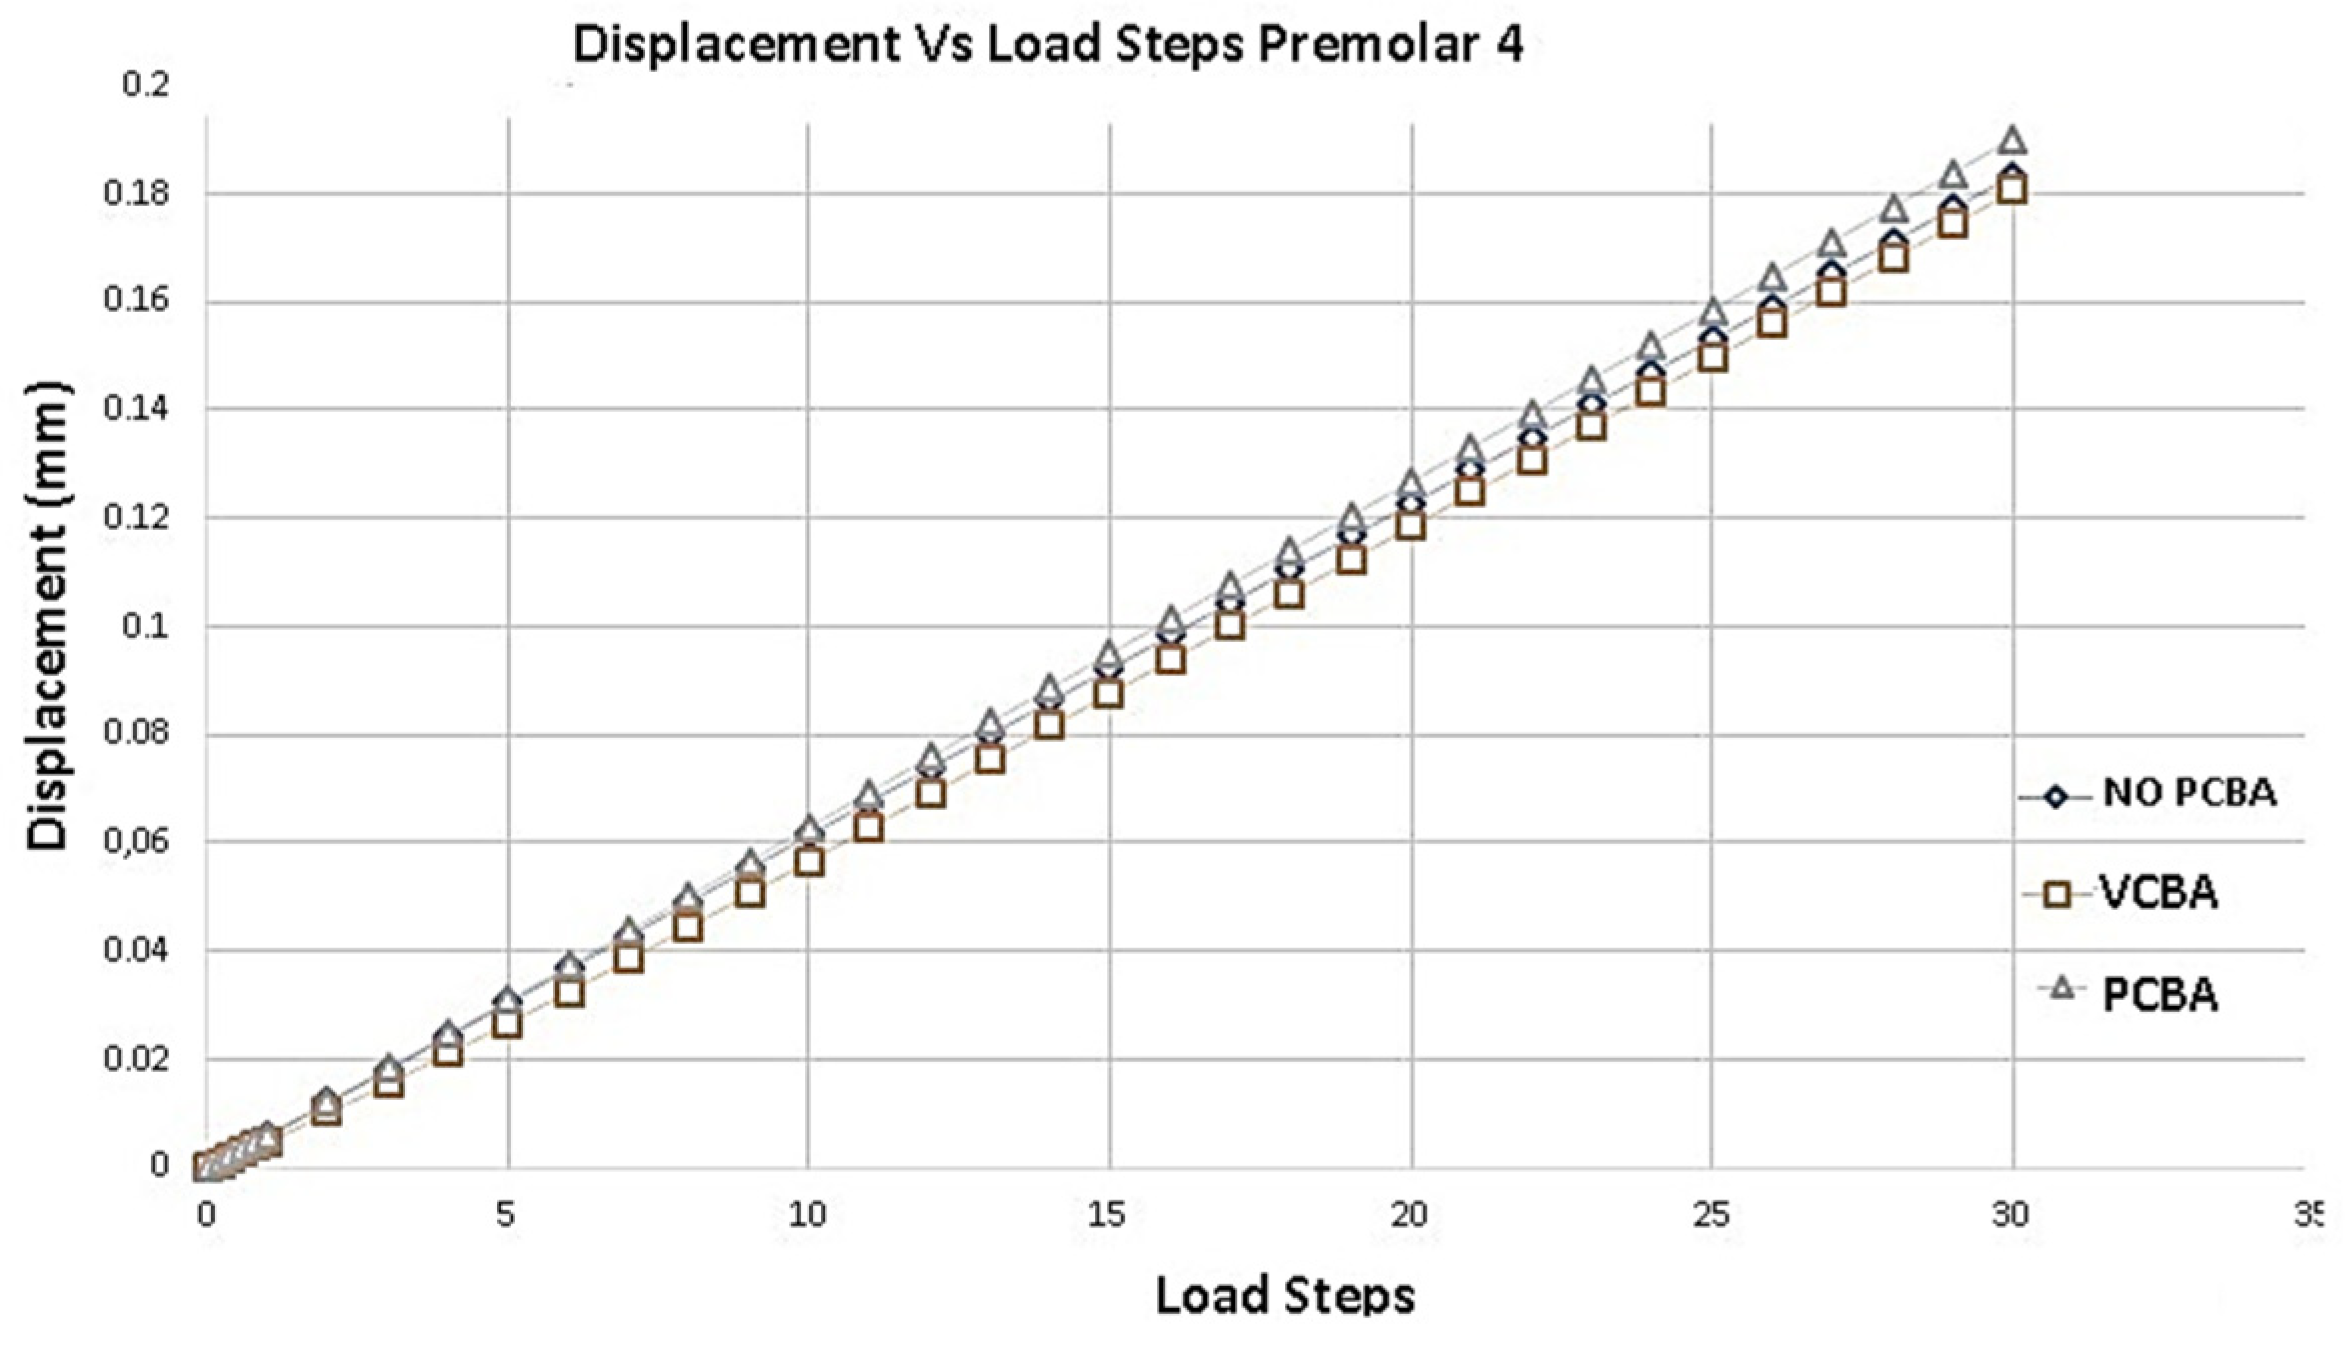
Figure 12, compared to the model with buccal abutments, the deformation of premolar 4 presents a percentage increase of 1,639%. And, compared to the model with palatal abutments, a percentage increase of 4,918% is presented. The largest displacements are presented in the no CBA model.
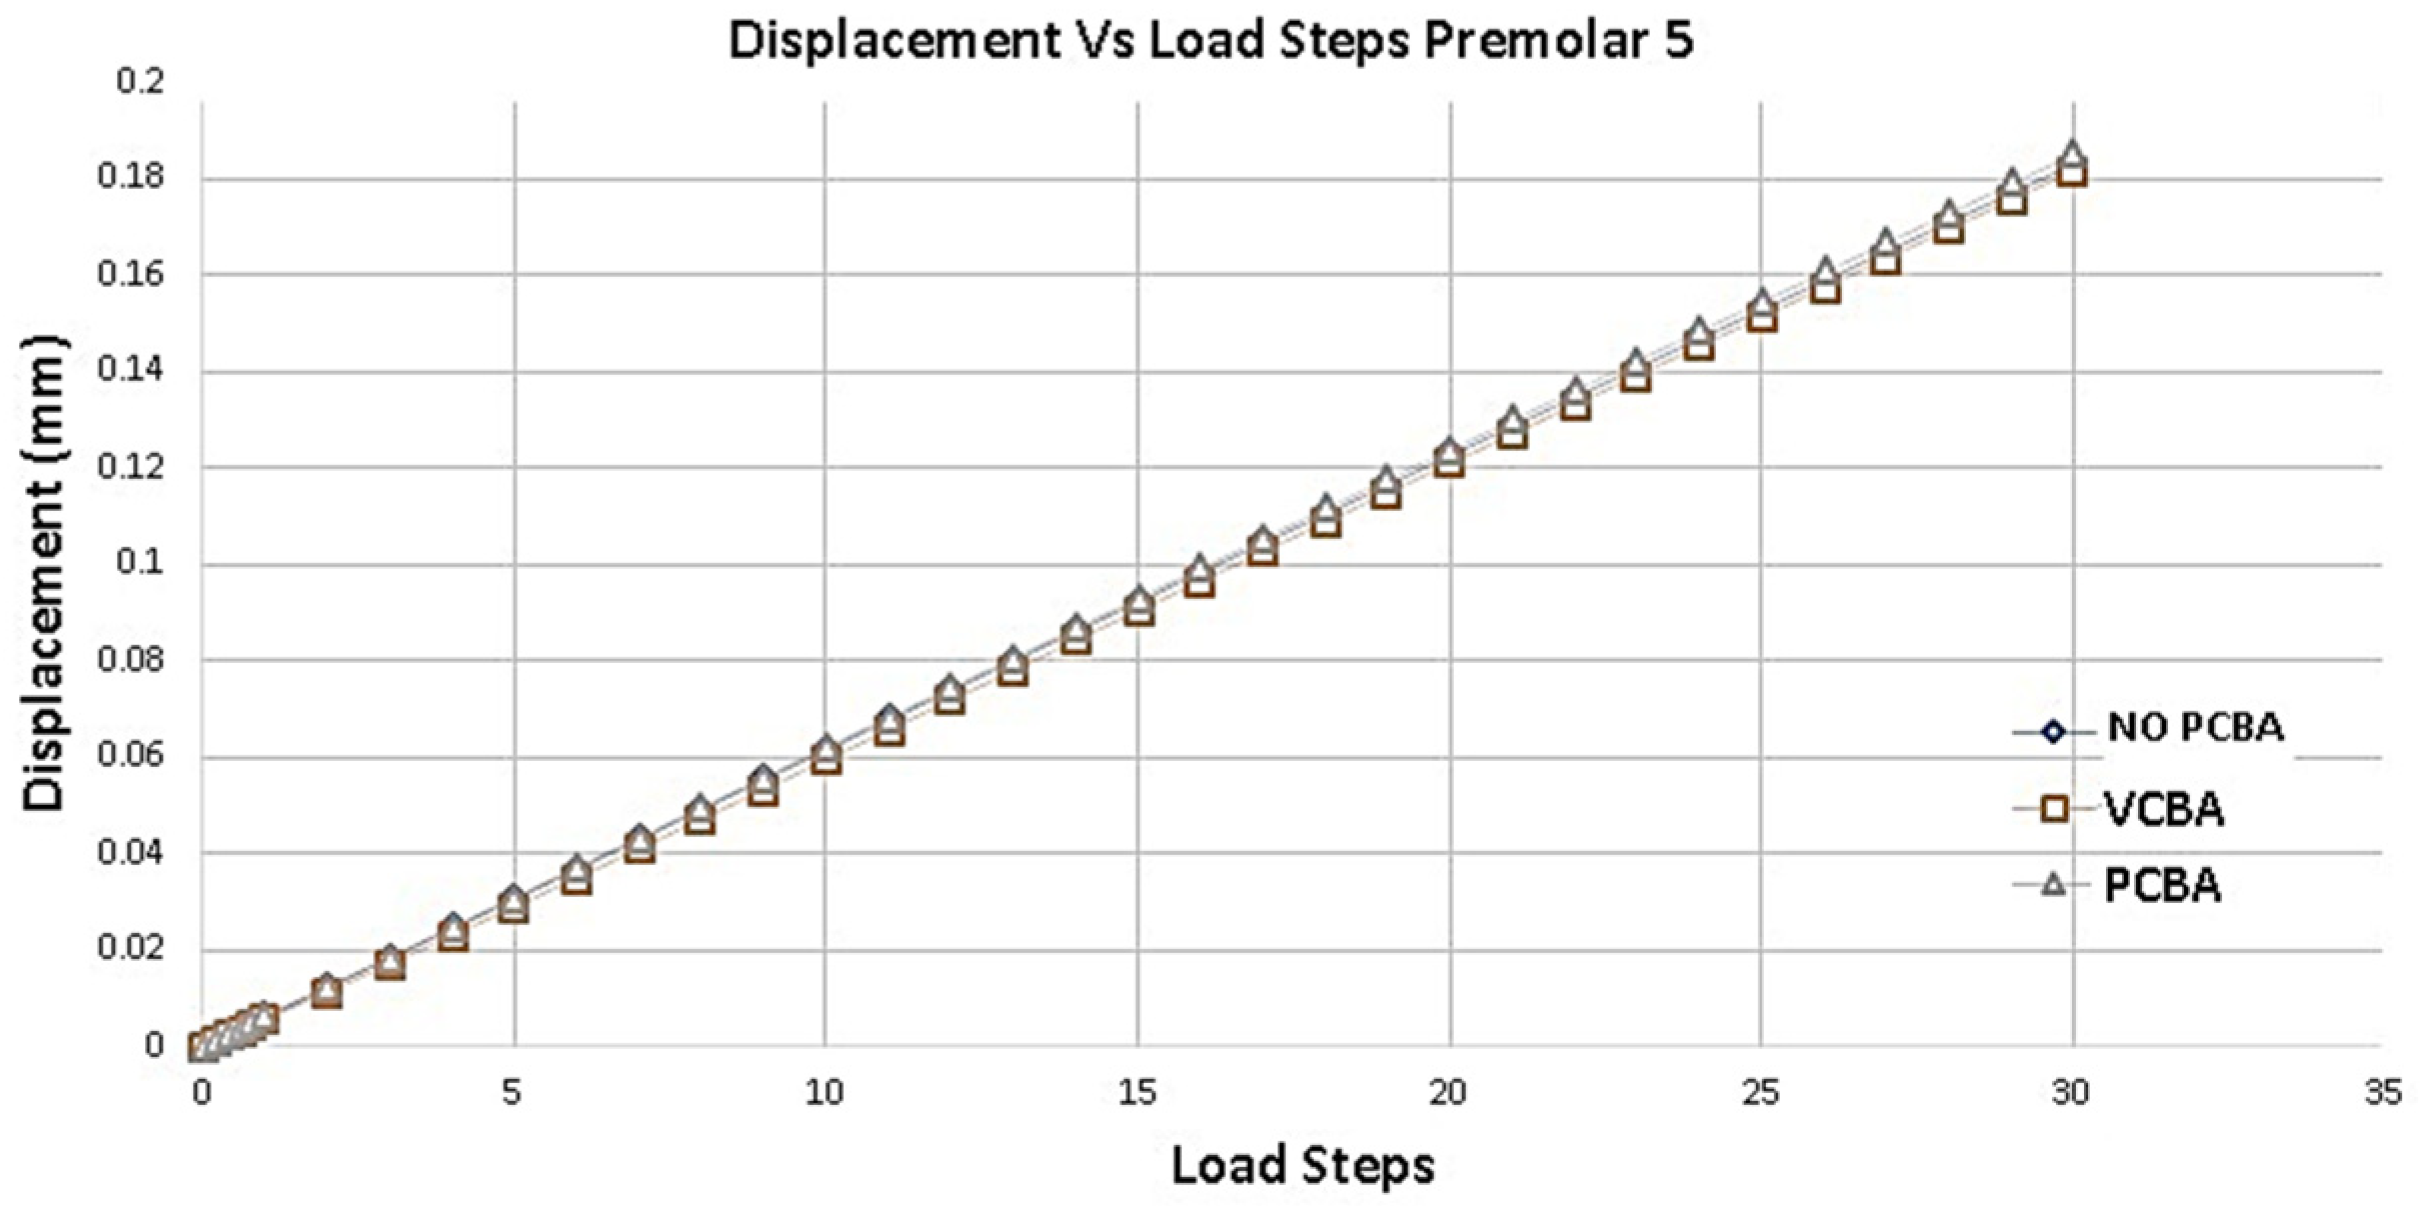
Figure 13 shows the variation of the total deformation of the PDL of premolar 5. Taking the no CBA model as a reference and compared to the model with buccal attachments, a percentage increase of 1.639% is presented.
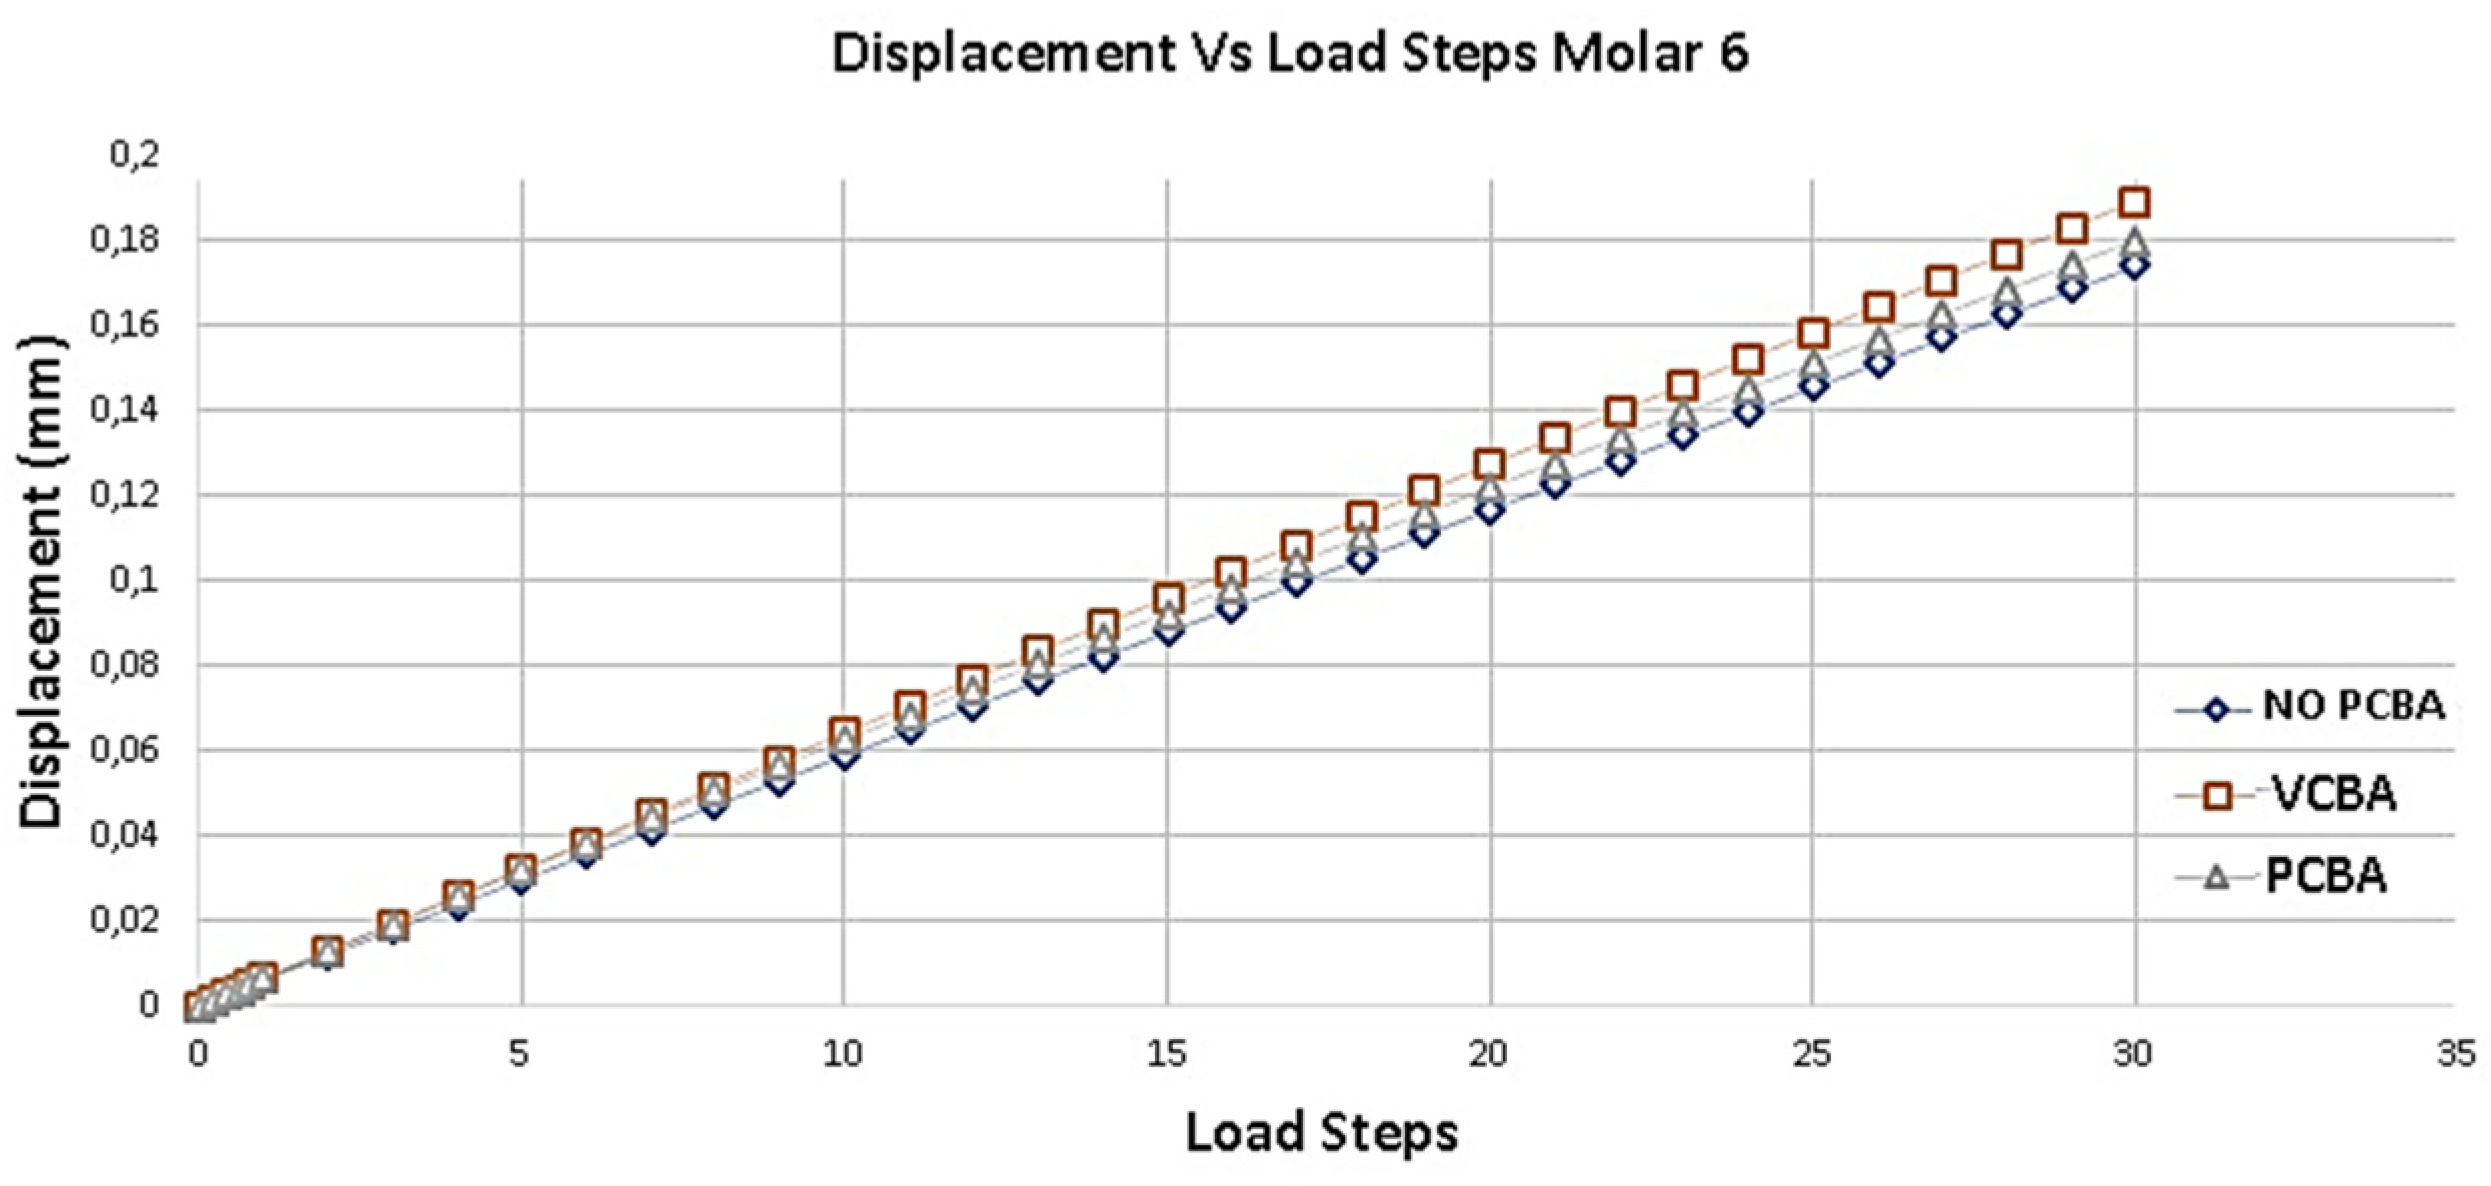
Figure 14 presents the deformation results of Molar 6. Taking as reference the deformation results of the model without ABC, a percentage increase of 7.936% is presented compared to the model with buccal abutments. On the other hand, it presents a percentage increase of 3.1746% compared to the model with palatal attachments.
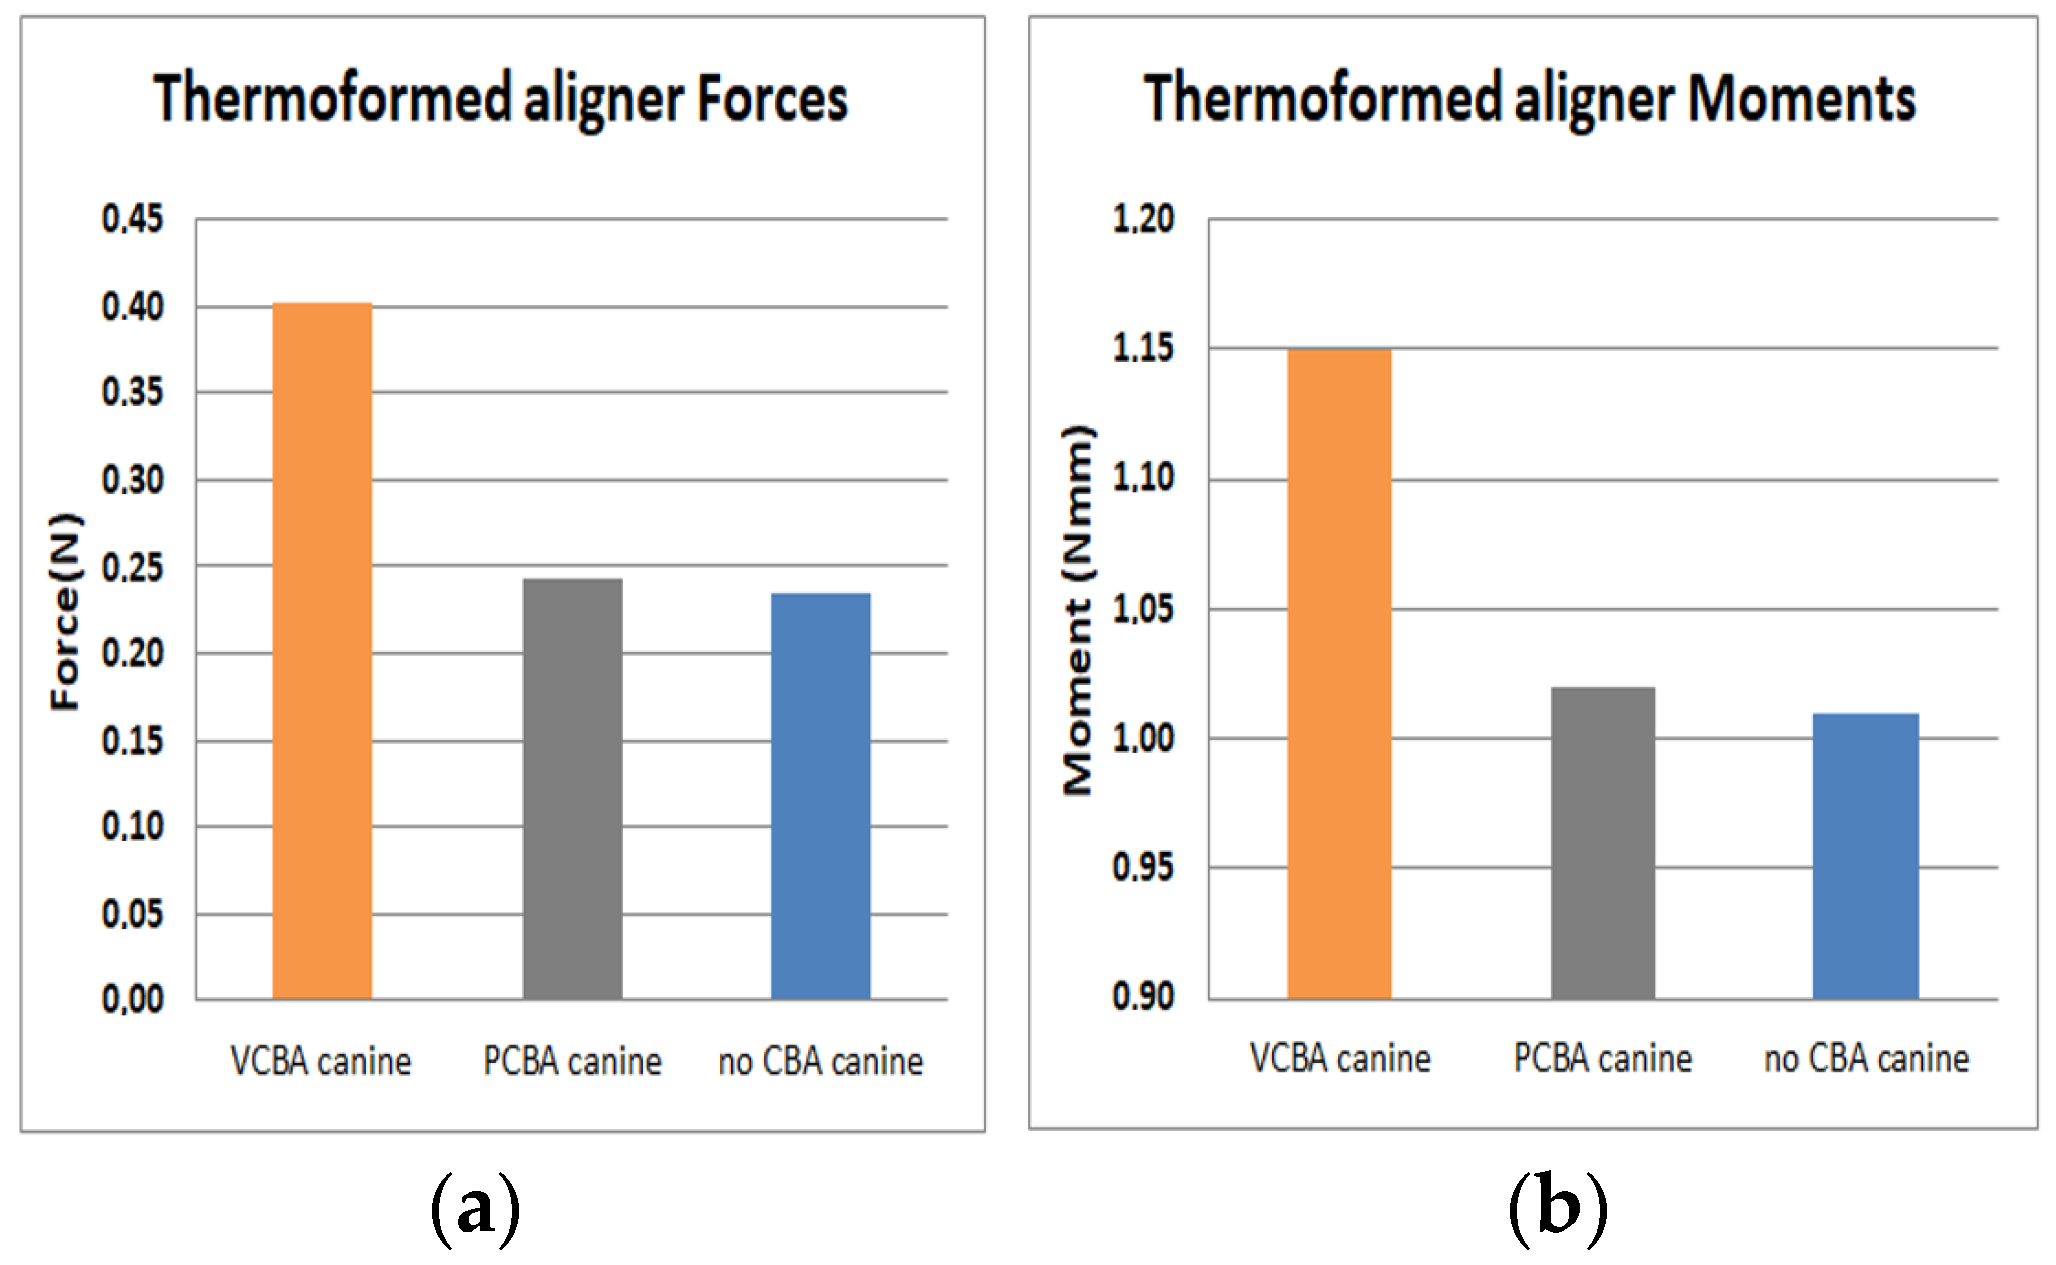
In Figure 15 results for canine 3 shows a load of 2.35 E-01 N and a moment of 1.10 N*mm with no CBA. On the other hand, with PCBA aligner the load and moment were 2.43E-01 N and 1.02 N*mm respectively. While VCBA aligner results show a maximum load and moment of 4.02E-01 N and 1.15 N*mm.
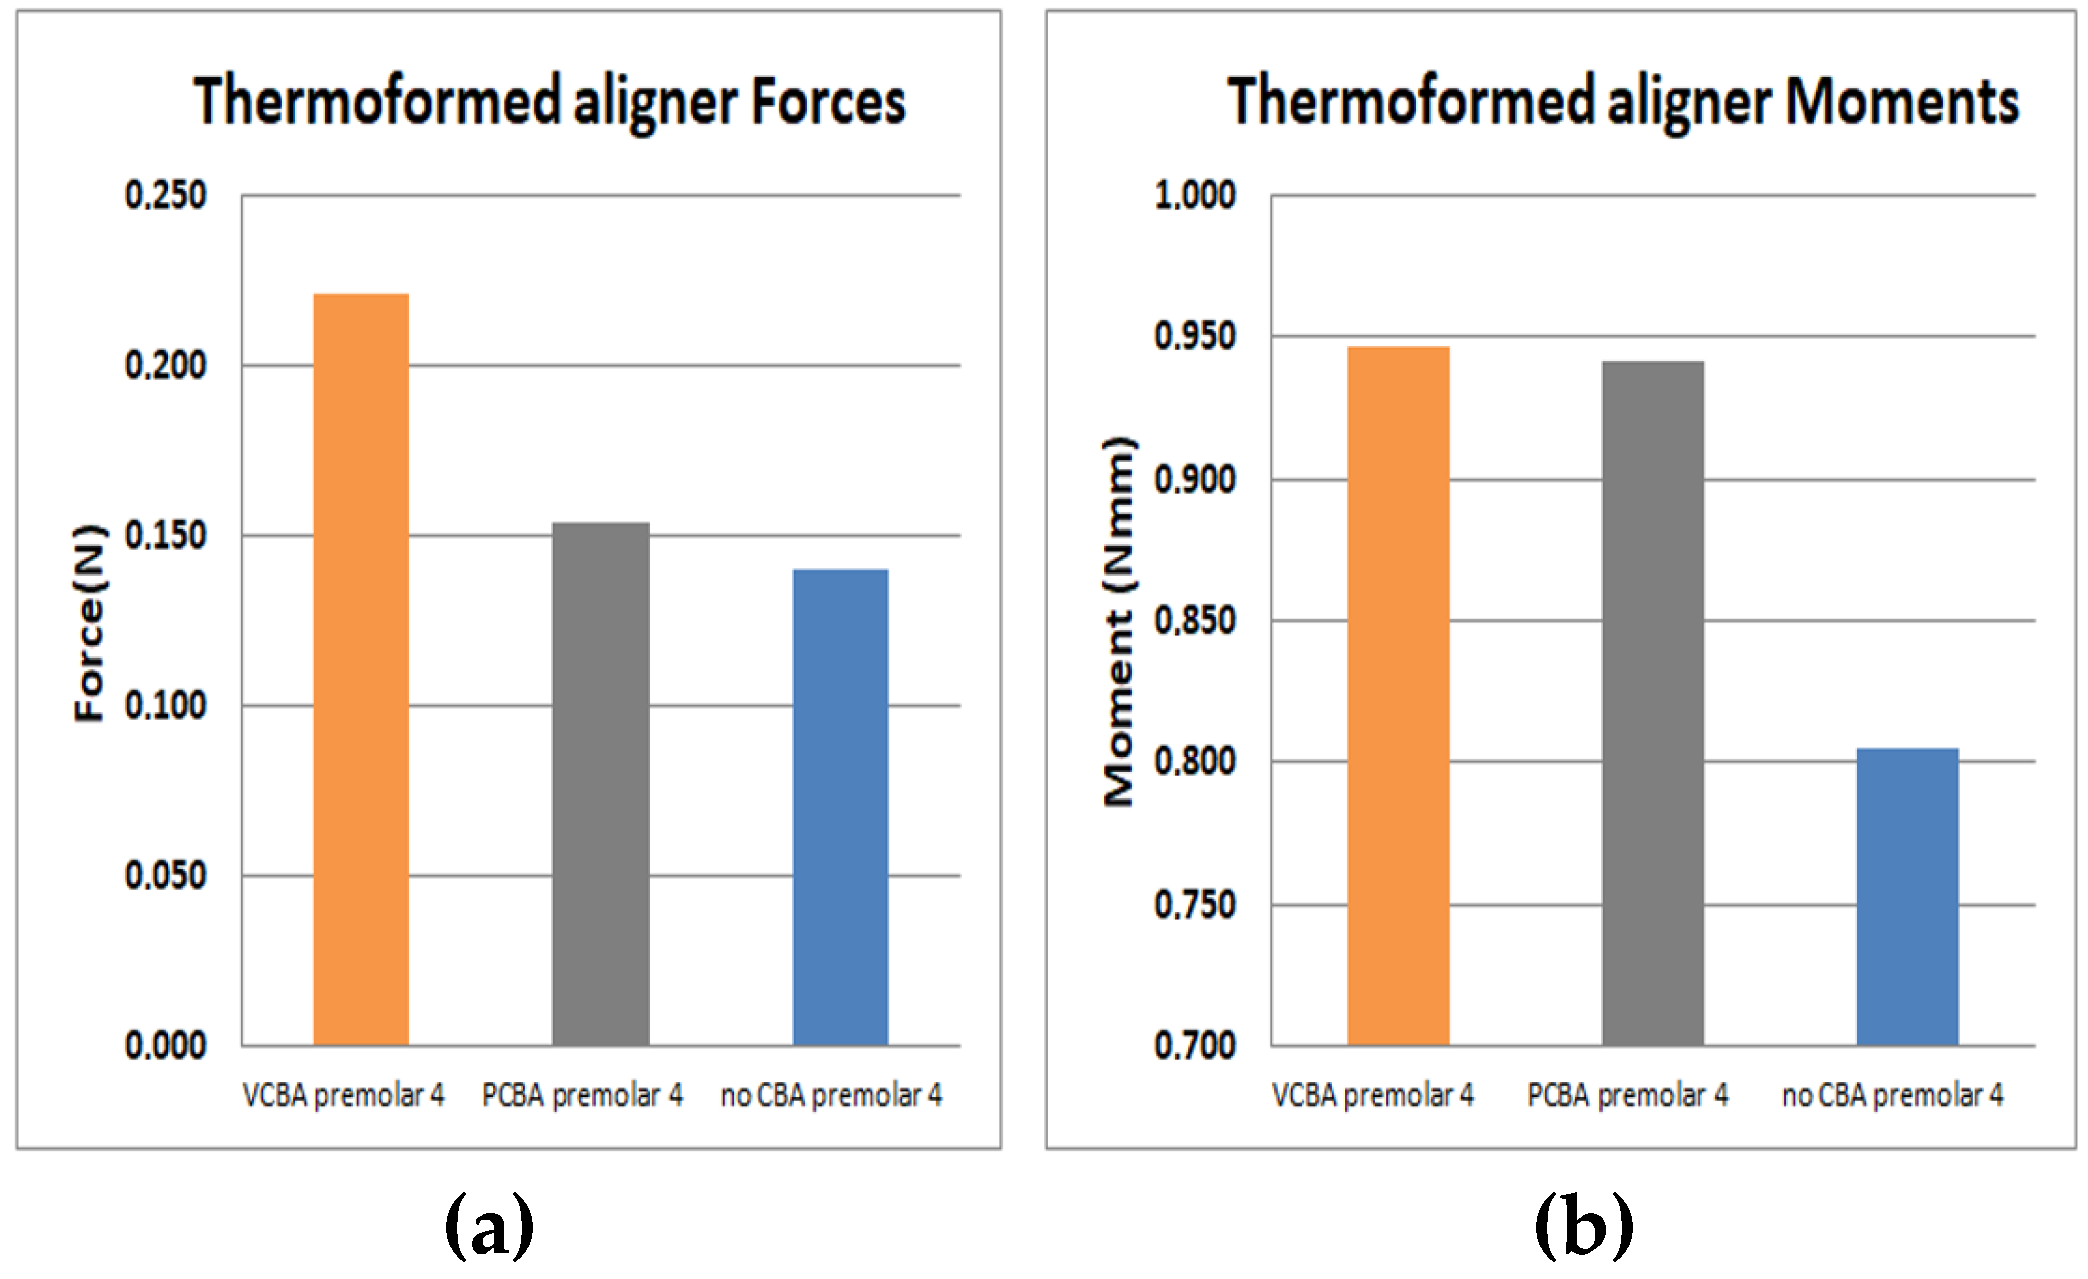
In Figure 16 results for premolar 4 shows a load of 1.14 E-01N and a moment of 8.05E-1 N*mm with no CBA. In other hand, using PCBA aligner load and moment were 1.54E-01N and 9.42E-1 N*mm respectively. While using VCBA results show a maximum load and moment of 2.21E-01N and 9.47E-1 N*mm.
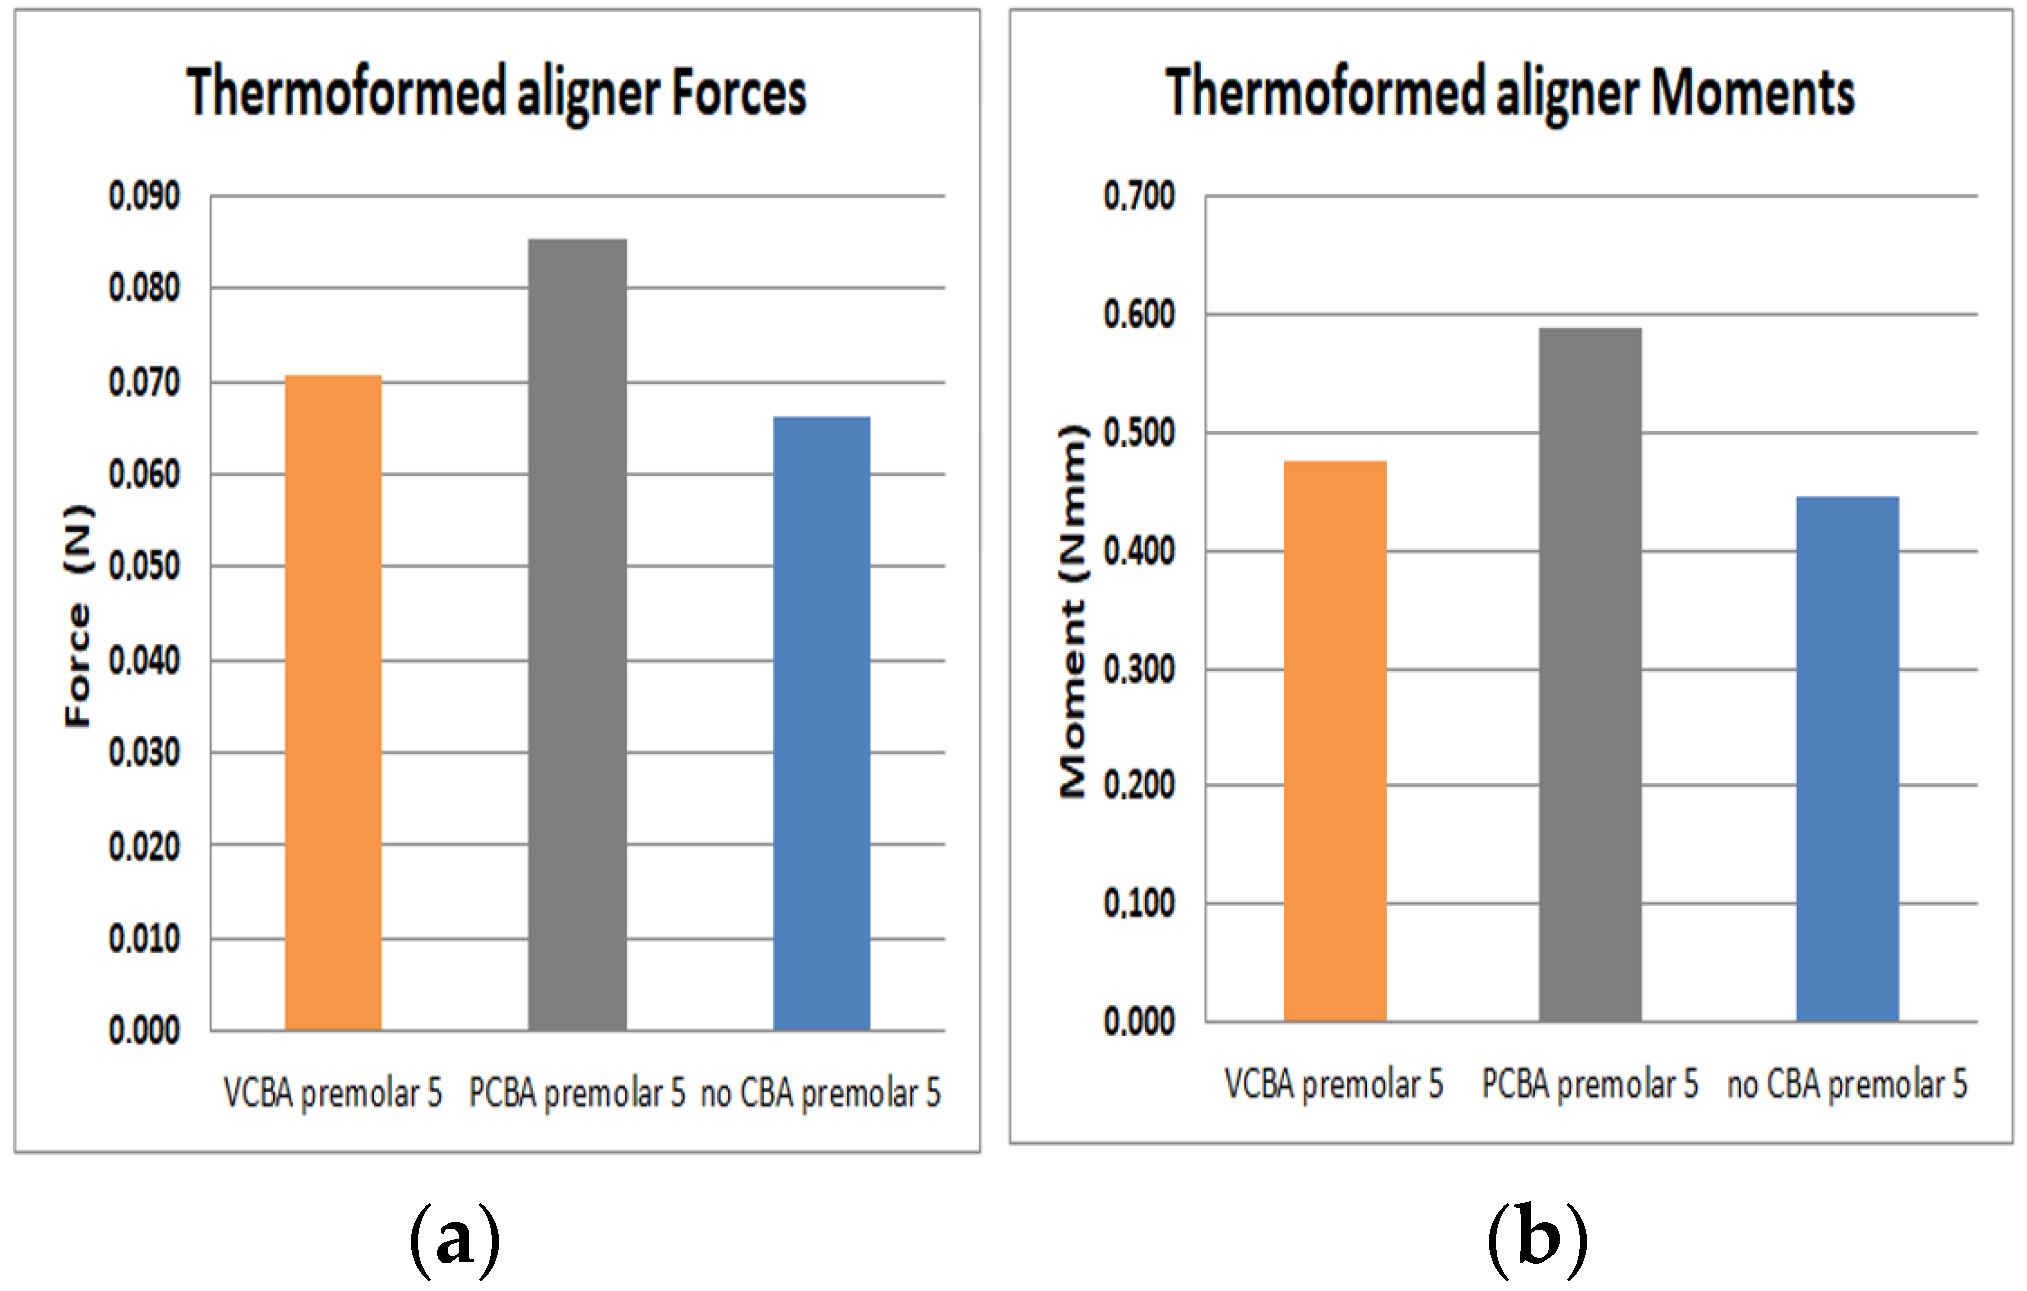
In Figure 17 results for premolar 5 shows a load of 6.61 E-02 N and a moment of 4.46E-1 N*mm with no need of CBA. In addition, using a VCBA the aligner load and moment were 7.7E-02 N and 4.76E-1 N*mm respectively. While using the PCBA aligner results shows a maximum load and moment of 8.54E-02 N and 5.89E-1 N*mm, whilst for premolar 5 forces are lower than canine 3 and premolar 4.
In
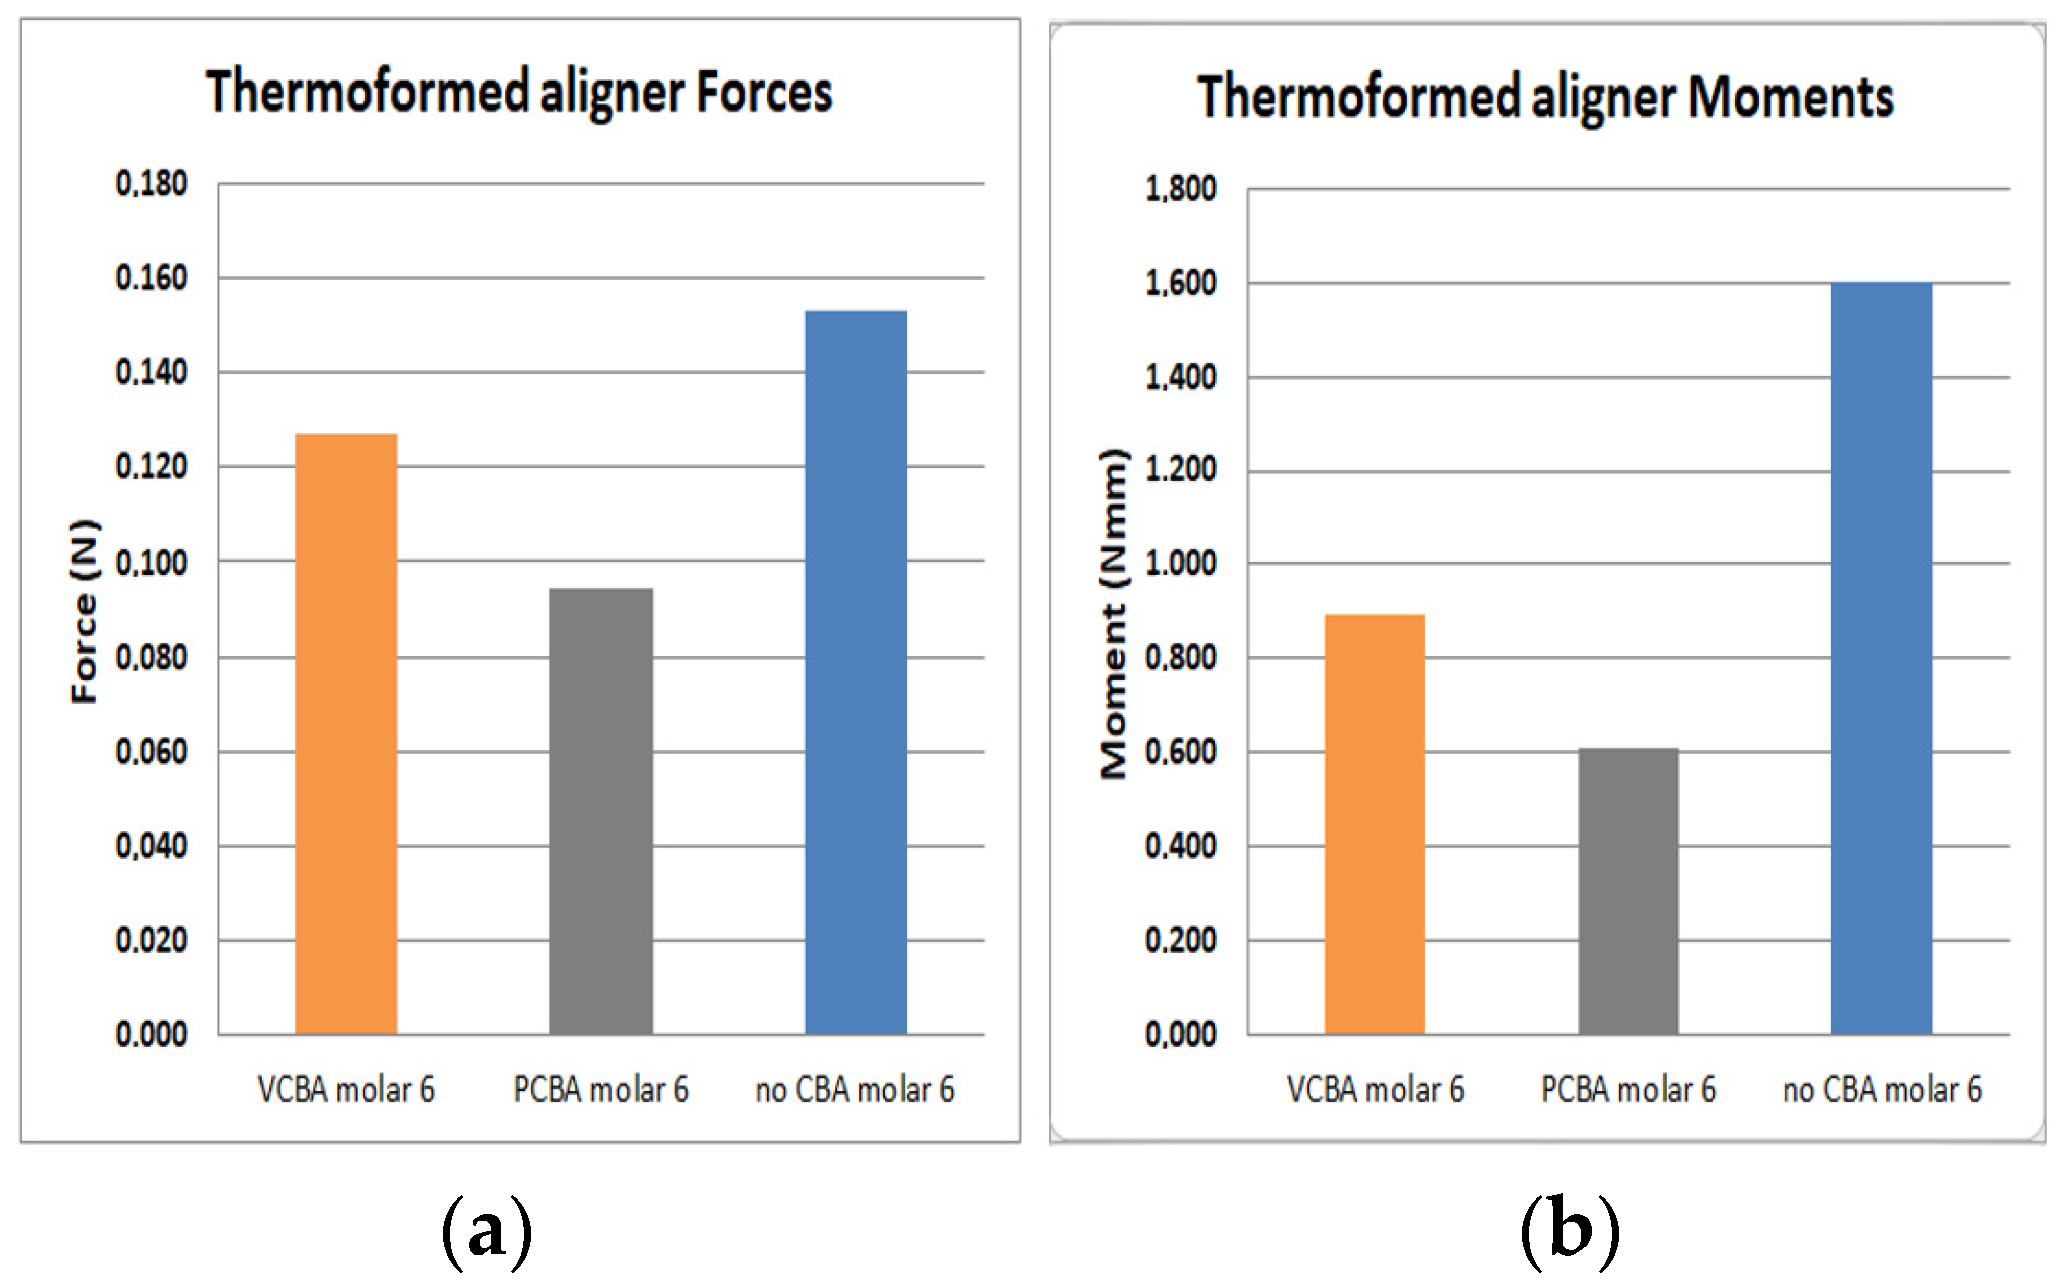
Figure 18 results for molar 6 shows a load of 1.53 E-01 N and a moment of 1.6E-1 N*mm with no need of CBA. In addition, using the VCBA aligner the load and moment were 1.27E-01 N and 8.96E-1 N*mm respectively. While using the PCBA aligner results shows a maximum load and moment of 9.46E-02 N and 6.07E-1 N*mm. In this case, the forces and moments are higher using a no CBA aligner.
n FEM simulation it was evidenced that the tipping effect (combined translation and rotation of the tooth) was lower with CBAs, so whilst there were higher forces and moments, tipping was reduced.
4. Discussion
Comparisons between the predictability percentage from a clinical case and FEM simulations produced values of 1.13% for canine 3; 2.01% for premolar 4; 2.45% for premolar 5 and 3.0% for molar 6.
The largest displacements were presented in the non-CBA model, with little difference with respect to the PCBA model. Additionally, the movement of the maxillofacial expansion influences the results of the VCBA model.
For canine 3, variation percentages between VCBA and no CBA stress were 42%, 35%, 60% and 102% from the reference points. Variation percentages between PCBA and no CBA were obtained 2%, -10%, -21% and -8% respectively. These variations highlight that the VCBA aligner generates higher stress.
Variation percentages of stress with VCBA and no CBA for premolar 4 were: 35%, 21%, 43% and 95% respectively from the reference points. PCBA variations were: 21%, 5%, 12% and 33%. This concludes that VCBA generates higher stress than PCBA aligners.
Stress VBCA variations were: -24%, -25% and -36%, and for PCBA variations they were: 11%, 16% and 15%. Variation values underline that VCBA generates less stress than no CBA aligners.
For molar 6 using VCBA and PCBA aligner’s, the stresses were lower than for no CBA, variation percentages for VCBA were: 229%, -33%, -34% and -3%. Variation percentages for PCBA were: -65%, -70%, -74% and -65%.
It was found that the forces and moments in canine 3 were maximum with VCBA aligners, producing values of 4.02E-1 N and 1.15 N*mm. For premolar 4, a maximum force and moment of 2.21E-1 N and 9.47E1 N*mm was generated with the VCBA aligner. Additionally, for premolar 5 the maximum force and moment were obtained using the PCBA aligner with values of 8.54E-1 N and 5.89E-1 N*mm respectively. Finally, in molar 6 the maximum forces and moments produced were 1.53E-01 N and 1.6 N*mm, with no CBA.
5. Conclusions
Simulations showed that the use of CBA reduces tipping in teeth, and the model with VCBA presented the best results for dental movement.
Considering the practical and ethical problems of clinically judging the differences between CBA and No-CBA expansion with aligners, the computational model is an approach that can be used to estimate tooth movement. In addition, the resulting forces and moments acting on the dental system imposing distal displacement on aligners could be calculated. In fact, the simulations showed that a greater reaction, represented as an increase in force and moment, presents lower tipping. In this case, the use of CBA reduces tipping in teeth and the model with VCBA presented the best results for dental movement.
Author Contributions
Conceptualization, supervision, and project administration José I. García. Methodology, formal analysis, and writing—review and editing Gustavo A. Rojas. 3D modeling, material characterization and simulation, Juan S. Aristizabal.
Data Availability Statement
Data sharing not applicable. No new data were created or analyzed in this study. Data sharing is not applicable to this article.
Acknowledgments
Acknowledge to Universidad del Valle and EMAVI by had supported this research.
Conflicts of Interest
The authors declare no conflict of interest.
References
- Gallo F, Zingari F, Bolzoni A, Barone S, Giudice A. Accuracy of Zygomatic Implant Placement Using a Full Digital Planning and Custom-Made Bone-Supported Guide: A Retrospective Observational Cohort Study. Dentistry Journal. 2023; 11(5):123. [CrossRef]
- Vasoglou G, Lyros I, Patatou A, Vasoglou M. Orthodontic Treatment of Palatally Impacted Maxillary Canines with the Use of a Digitally Designed and 3D-Printed Metal Device. Dentistry Journal. 2023; 11(4):102. [CrossRef]
- Spagopoulos D, Kaisarlis G, Spagopoulou F, Halazonetis DJ, Güth J-F, Papazoglou E. In Vitro Trueness and Precision of Intraoral Scanners in a Four-Implant Complete-Arch Model. Dentistry Journal. 2023; 11(1):27. [CrossRef]
- Besnard C, Marie A, Sasidharan S, Harper RA, Marathe S, Moffat J, Shelton RM, Landini G, Korsunsky AM. Time-Lapse In Situ 3D Imaging Analysis of Human Enamel Demineralisation Using X-ray Synchrotron Tomography. Dentistry Journal. 2023; 11(5):130. [CrossRef]
- M. Rodríguez Navarro, T. Parrón Carreño, and J. Nieto Hernández, “Epidemiología de maloclusiones en niños de 12 y 15 años aplicando el índice estético dental,” Radiología, vol. 45, no. 3, pp. 94–101, 2003.
- A. M. Bonnick, M. Nalbandian, and M. Siewe, “Technological advances in nontraditional orthodontics,” Dent. Clin. North Am, vol. 55, no. 3, pp. 571–584, 2011.
- L. Keilig et al., “In vivo measurements and numerical analysis of the biomechanical characteristics of the human periodontal ligament,” Ann. Anat.-Anat. Anzeiger, vol. 206, pp. 80–88, 2016.
- Z. Tang, L. P. Jiang, and J. Y. Wu, “Effect of maxillary expansion on orthodontics,” Asian Pac J. Trop. Med vol. 8, no. 11, pp. 944–951, 2015.
- S. C. Lee, J. H. Park, M. Bayome, K. B. Kim, E. A. Araujo, and K. Y. A., “Effect of bone-borne rapid maxillary expanders with and without surgical assistance on the craniofacial structures using finite element analysis,” Am. J. Orthod. Dentofac. Orthop., vol. 145, no. 1, pp. 638–648, 2014.
- M. L. Jones, J. Hickman, J. Middleton, J. Knox, and C. Volp, “A Validated Finite Element Method Study of Orthodontic Tooth Movement in the Human Subject,” J. Orthod., vol. 28, no. 1, pp. 29–38, 2001.
- A. M. Inchingolo, A. D. Inchingolo, V. Carpentiere, G. Del Vecchio, et al., “Predictability of Dental Distalization with Clear Aligners: A Systematic Review”. Bioengineering, 10, 1390, 2023. [CrossRef]
- M. Nadine Flynn, “What Are the Different Types of Braces, and Which Is Right for Me?,” 2018. [Online]. Available online: http://www.colgate.com/en/us/oc/oral-health/cosmetic-%0Adentistry/adult-orthodontics/article/what-are-the-different-types-of-braces-and-which-is-%0Aright-for-me-0414 (accessed on 29 January 2018).
- R. P. Kusy, “Influence of force systems on archwire-bracket combinations” Am J. Orthod Dentofac Orthop, vol. 127, no. 3, pp. 333–342, 2005.
- Y. Qian, Y. Fan, Z. Liu, and M. Zhang, “Numerical simulation of tooth movement in a therapy period,” Clin. Biotech. (Bristol, Avon), vol. 23, no. SUPLL.1, pp. S48–S52, 2007. [CrossRef]
- A. Zargham, A. Geramy, and G. Rouhi, “Evaluation of long-term orthodontic tooth movement considering bone remodeling process and in the presence of alveolar bone loss using finite element method,” orthod waves, vol. 1, no. 1, pp. 1–12, 2016.
- A. M. H. da Silva, J. M. Alves, O. L. da Silva, and N. F. J. da Silva, “Two and three-dimensional morphometric analysis of trabecular bone using X-ray microtomography (µCT)”, Rev. Bras. Eng. Bioméd, vol. 30, no. 2, pp. 93–101, 2014.
- A. Cardona and V. Fachinotti, “‘Introducción al Método de los Elementos Finitos”, cimec-Intec, Argentina, 2014.
- K. S. Kang, K. M. Park, J. W. Ahn, M. Y. Jo, et al., “Validation of the Finite Element Model versus Biomechanical Assessments of Dental Implants and Total Knee Replacements” Bioengineering, 10, no. 12, 1365, 2023. [CrossRef]
- C. Bourauel, D. Freudenreich, D. Vollmer, D. Kobe, D. Drescher, and A. Jäger, “Simulation of orthodontic tooth movements. A comparison of numerical models.,” J Orofac. Orthop./Fortschr Kieferorthop., vol. 60, no. 2, pp. 136–151, 1999.
- J. P. Gomez, F. M. Peña, V. Martínez, D. C. Giraldo, and C. I. Cardona, “Initial force systems during bodily tooth movement with plastic aligners and composite attachments: A three-dimensional finite element analysis,” Angle Orthod, vol. 85, no. 3, pp. 454–460, 2015.
- J. P. Houle, L. Piedade, R. Todescan, and F. H. S. L. Pinheiro, “The predictability of transverse changes with Invisalign,” Angle Orthod, vol. 87, no. 1, pp. 19–24, 2017.
- A. Ziegler, L. Keilig, A. Kawarizadeh, A. Jäger, and C. Bourauel, “Numerical simulation of the biomechanical behaviour of multi-rooted teeth,” Eur. J. Orthod, vol. 27, no. 4, pp. 333–339, 2005.
- P. M. Cattaneo, M. Dalstra, and B. Melsen, “The finite element method: a tool to study orthodontic tooth movement,” J. Dent. Res., vol. 84, no. 5, pp. 428–433, 2005.
- D. Liu and Y. Te Chen, “Effect of thermoplastic appliance thickness on initial stress distribution in periodontal ligament,” Adv. Mech. Eng., vol. 7, no. 4, pp. 1–7, 2015.
- S. Barone, A. Paoli, A. V. Razionale, and R. Savignano, “Computational design and engineering of polymeric orthodontic aligners,” Int. j. numer. method. biomed. eng., vol. 33, no. 8, pp. 1–15, 2017.
- T. S. Fill, J. P. Carey, R. W. Toogood, and P. W. Major, “Experimentally Determined Mechanical Properties of, and Models for, the Periodontal Ligament: Critical Review of Current Literature,” J. Dent. Biomech, vol. 2, no. 1, pp. 312–319, 2011.
- A. Hohmann. et Al, “Influence of different modeling strategies for the periodontal ligament on finite element simulation results,” Am. J. Orthod. Dentofac. Orthop, vol. 139, no. 6, pp. 775–783, 2011.
- M. Upadhyay and R. Nanda, “Biomechanics in Orthodontics,” Cap 4. Esthetics and Biomechanics in Orthodontics, Saunders, 2nd Edition, pp. 74–89, 2014. ISBN: 9781455750900.
- J. Houle, “Arch expansion predictability using Invisalign ®,” University of Manitoba, master of scienceThesis, 2015.
- J. A. García-García, A. Reding-Bernal, and J. C. López-Alvarenga, “Cálculo del tamaño de la muestra en investigación en educación médica,” Investigación en Educación Médica, vol. 2, no. 8, pp. 217–224, 2013. Available online: https://www.elsevier.es/es-revista-investigacion-educacion-medica-343-articulo-calculo-del-tamano-muestra-investigacion-S2007505713727157.
- S. R. Toms and A. W. Eberhardt, “A nonlinear finite element analysis of the periodontal ligament under orthodontic tooth loading,” Am. J. Orthod. Dentofac. Orthop., vol. 123, no. 6, pp. 657–665, 2003.
- W. Liang, Q. Rong, J. Lin, and B. Xu, “Torque control of the maxillary incisors in lingual and labial orthodontics: A 3-dimensional finite element analysis,” Am. J. Orthod. Dentofac. Orthop., vol. 135, no. 3, pp. 316–322, 2009.
- Y. Cai, X. Yang, B. He, and J. Yao, “Finite element method analysis of the periodontal ligament in mandibular canine movement with transparent tooth correction treatment,” BMC Oral Health, vol. 15, no. 1, pp. 1–11, 2015.
- A. Nikolaus, J. D. Currey, T. Lindtner, C. Fleck, and P. Zaslansky, “Importance of the variable periodontal ligament geometry for whole tooth mechanical function: A validated numerical study,” J. Mech. Behav. Biomed. Mater., vol. 67, no. March 2016, pp. 61–73, 2017.
- “3M. Dental Products Laboratory. FiltekTM P60 Posterior Restorative Dental Composite. Technical Product Profile” Dental Products Laboratory. Available online: https://multimedia.3m.com/mws/media/44490O/3m-filtek-p60-posterior-restorative-technical-product-profile.pdf.
- N. Duque Penedo, C. N. Elias, M. C. Thomé, and J. Pereira De Gouvêa, “3D simulation of orthodontic tooth movement,” Dent. Press J Orthod, vol. 15, no. 5, pp. 98–108, 2010.
- S. R. de A. Taddei et al., “Experimental model of tooth movement in mice: A standardized protocol for studying bone remodeling under compression and tensile strains,” J. Biomech., vol. 45, no. 16, pp. 2729–2735, 2012.
Figure 1.
(a) thermoformed plate configuration without CBA. (b) thermoformed plate configuration with CBA.
Figure 1.
(a) thermoformed plate configuration without CBA. (b) thermoformed plate configuration with CBA.
Figure 2.
(a) Thermoformed plate configuration without CBA. (b) Thermoformed plate configuration with vestibular CBA. (c) Thermoformed plate configuration with palatine CBA.
Figure 2.
(a) Thermoformed plate configuration without CBA. (b) Thermoformed plate configuration with vestibular CBA. (c) Thermoformed plate configuration with palatine CBA.
Figure 3.
Parameters Stress vs strain curve of PDL in Ansys
®. Source: [
15,
27].
Figure 3.
Parameters Stress vs strain curve of PDL in Ansys
®. Source: [
15,
27].
Figure 4.
Geometry configuration for CBA Source: Author.
Figure 4.
Geometry configuration for CBA Source: Author.
Figure 5.
CAD model (a) Own coordinates axes on each tooth, (b) Displacement conditions generated on the outer surfaces of the LDP. Source: Author.
Figure 5.
CAD model (a) Own coordinates axes on each tooth, (b) Displacement conditions generated on the outer surfaces of the LDP. Source: Author.
Figure 6.
Contact conditions (a) Inner surfaces of the LDP, (b) Tooth surfaces, (c) External surfaces of the tooth with plate, (d) Surfaces of the plate which are in contact with the tooth Source: Author.
Figure 6.
Contact conditions (a) Inner surfaces of the LDP, (b) Tooth surfaces, (c) External surfaces of the tooth with plate, (d) Surfaces of the plate which are in contact with the tooth Source: Author.
Figure 7.
Equivalent stress versus Distance canine 3 PDL distance. Source: Author.
Figure 7.
Equivalent stress versus Distance canine 3 PDL distance. Source: Author.
Figure 8.
Equivalent stress versus Distance premolar 4 PDL distance. Source: Author.
Figure 8.
Equivalent stress versus Distance premolar 4 PDL distance. Source: Author.
Figure 9.
Equivalent stress versus Distance premolar 5 PDL. Source: Author.
Figure 9.
Equivalent stress versus Distance premolar 5 PDL. Source: Author.
Figure 10.
Equivalent stress versus Distance molar 6 PDL. Source: Author.
Figure 10.
Equivalent stress versus Distance molar 6 PDL. Source: Author.
Figure 11.
Displacement versus Load Steps Canine 3 PDL. Source: Author.
Figure 11.
Displacement versus Load Steps Canine 3 PDL. Source: Author.
Figure 12.
Displacement versus Load Steps Premolar 4 PDL. Source: Author.
Figure 12.
Displacement versus Load Steps Premolar 4 PDL. Source: Author.
Figure 13.
Displacement versus Load Steps Premolar 5 PDL. Source: Author.
Figure 13.
Displacement versus Load Steps Premolar 5 PDL. Source: Author.
Figure 14.
Displacement versus Load Steps Molar 6 PDL. Source: Author.
Figure 14.
Displacement versus Load Steps Molar 6 PDL. Source: Author.
Figure 15.
(a) Force applied to PDL to move canine 3. (b) Moment applied to PDL to turn canine 3. Source: Author.
Figure 15.
(a) Force applied to PDL to move canine 3. (b) Moment applied to PDL to turn canine 3. Source: Author.
Figure 16.
(a) Force applied to PDL to move premolar 4. (b) Moment applied to PDL to turn premolar 4. Source: Author.
Figure 16.
(a) Force applied to PDL to move premolar 4. (b) Moment applied to PDL to turn premolar 4. Source: Author.
Figure 17.
(a) Force applied to PDL to move premolar 5. (b) Moment applied to PDL to turn premolar 5. Source: Author.
Figure 17.
(a) Force applied to PDL to move premolar 5. (b) Moment applied to PDL to turn premolar 5. Source: Author.
Figure 18.
(a) Force applied to PDL to move molar 6. (b) Moment applied to PDL to turn molar 6. Source: Author.
Figure 18.
(a) Force applied to PDL to move molar 6. (b) Moment applied to PDL to turn molar 6. Source: Author.
|
Disclaimer/Publisher’s Note: The statements, opinions and data contained in all publications are solely those of the individual author(s) and contributor(s) and not of MDPI and/or the editor(s). MDPI and/or the editor(s) disclaim responsibility for any injury to people or property resulting from any ideas, methods, instructions or products referred to in the content. |
© 2024 by the authors. Licensee MDPI, Basel, Switzerland. This article is an open access article distributed under the terms and conditions of the Creative Commons Attribution (CC BY) license (https://creativecommons.org/licenses/by/4.0/).
