1. Introduction
Research related to thin-walled structures is developing rapidly. The characteristics of these structures, such as light weight, strength and efficiency, are making them increasingly popular in many engineering fields, such as automotive, civil engineering, aerospace. The efficiency of thin-walled structures is related to the use of a minimum material while achieving its required strength. However, in designing such structures, special attention must be paid to their difficult-to-estimate loss of stability. This paper will present a study of short, thin-walled channel columns with a modified cross-sectional shape. The columns were loaded with an axial compressive force applied at the center of gravity of their cross sections. The purpose of this study is to determine the effect of modifying the shape of the cross-section on its behavior in pure compression. Numerical analyses (ANSYS software) were carried out and validated with experimental results. The subjects of the study are columns with external cross-sectional dimensions of 40x80mm and three different lengths: 200, 300 and 400mm. The columns were made of 0.5mm thick sheet metal.
A thin-walled member is a shell whose three authoritative dimensions are of different orders. The length should be an order greater than the width (height) of the profiles, in turn, the width should be an order greater than the wall thickness.
The literature mainly describes classical cross-sectional shapes of thin-walled channel sections [
1]. A lipped channel columns are described in the paper [
2]. Modified cross-section shapes are described in works [
3,
4,
5]. Sections with a strongly modified cross-sectional shape, subjected to bending, are presented in the work [
6]. Modified cross-section shapes can increase the strength of the section. However, their weight, compared to classical shapes, is generally greater. Magnucki and Monczak [
7] addressed the optimization of such a cross-section in their paper. The analyses presented in this work made it possible to reduce the weight of the beam while maintaining the required stiffness.
Thin-walled structures are particularly vulnerable to loss of stability due to the dimensions of the cross-section in relation to the column length. The buckling behaviour of cold-formed steel C-section columns with buckling mode interactions was investigated in the work of Anbarasu and Sukumar [
8]. Paper [
9] describes the behaviour and ultimate strength of cold-formed steel channel columns with stiffened web. The sections were subjected to local and distortional buckling modes. The article [
10] discusses the elastic post-buckling behaviour of simply supported cold-formed channel columns, which is influenced by mode interaction phenomena involving distortional buckling, namely local/distortional, distortional/global and local/distortional/global mode interaction. The paper [
11] presents a lateral buckling analysis of cold-formed thin-walled beams subjected to pure bending. When analyzing thin-walled structures, the effect of imperfection is important. The effect of geometric imperfections on the stability of three-layer beams is described in the paper [
12].
Medium or long thin-walled columns are most commonly described in the literature. However, short columns are also increasingly being considered. The paper by Hui [
13] describes a topic on the design of beneficial geometric imperfections in short thin-walled columns. The aim of the study was to maximize energy absorption. The paper [
14] identifies the applicability of the European standard Eurocode 3 for predicting the compressive resistance of short columns.
Thin-walled sections can be subjected to different types of loading. The compressive force can be applied at the center of gravity of the cross-section, but also eccentrically. Ungureanu et al. in their paper [
15] described the possibility of using local plastic mechanisms to characterise the ultimate strength of short thin-walled cold-formed steel members subjected to eccentric compression about the minor axis. Similar themes related to the machism of plastic destruction of short columns are described in the paper [
16]. This paper presents thin-walled channel columns with a modified cross-sectional shape that are subjected to compressive loading. The force was applied at the centre of gravity of the column cross-section. Teter et al. in their paper [
17] discussed the buckling of short thin-walled columns that were subjected to a uniformly distributed compressive load. The aim was to investigate the performance of the structure in the far state after buckling and after failure.
During the analysis of thin-walled structures with a modified cross-sectional shape, it is crucial to consider the optimization of this shape. In the work by Saka [
18], optimal design of single-layer geodesic domes was described. A procedure and algorithm were developed to address the requirements related to usability and structural strength of such constructions. On the other hand, in the work [
19], an algorithm based on topological design was presented. In the publication by Kaveh and others [
20], the concept of cascade optimization was described, which allows for solving the optimization problem using a series of advanced analytical solutions. Bysiec [
21] described the efficient shaping of geodesic spherical domes, presenting two distinct methods for shaping these structures.
Thin-walled profiles due to their high strength at low weight are increasingly being studied by many researchers. However, few works describe sections with modified cross-sectional shape. As previously mentioned, such modifications make the sections more stiff. However, due to the non-standard cross-sectional shape, assessing their resistance to loss of stability becomes even more difficult. This paper presents research and analysis to determine the effect of the cross-sectional shape of compressed columns on their strength and resistance to loss of stability. The forms of buckling of columns and the values of their critical forces were determined. The use of the experimental method made it possible to verify the results obtained from the numerical method.
2. Object of study
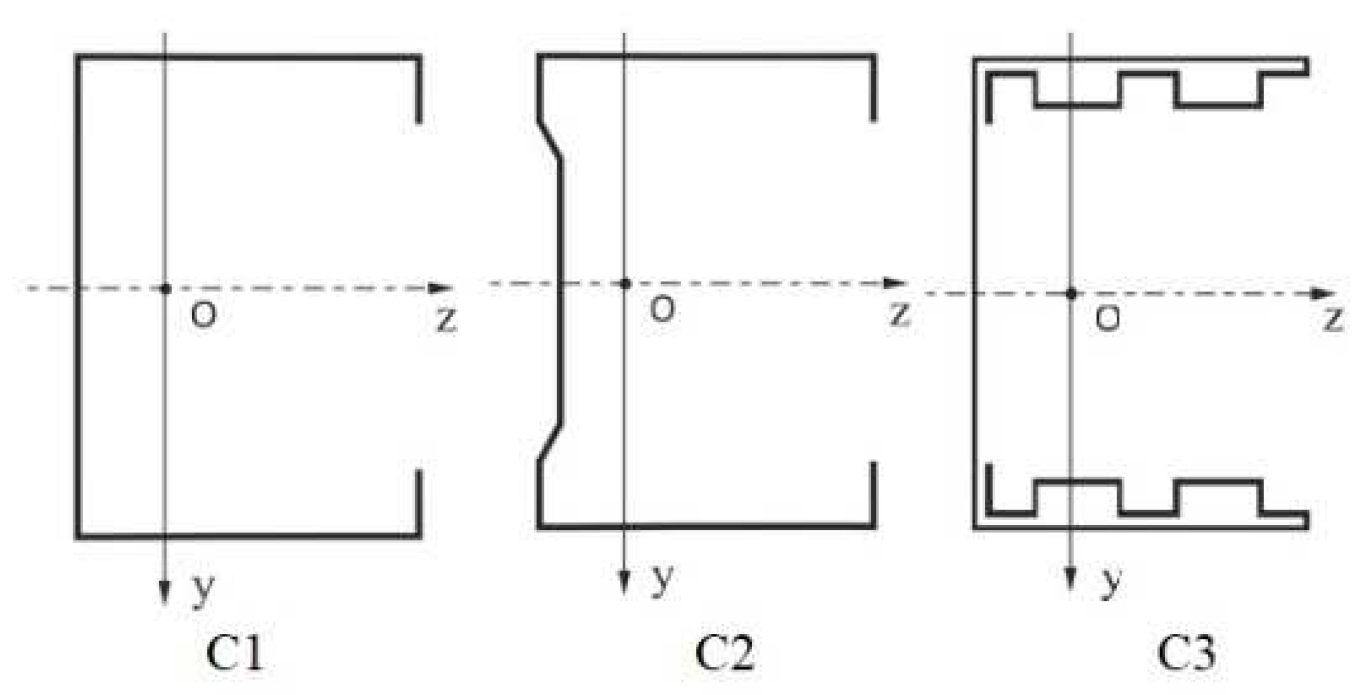
The subject of the study are thin-walled channel columns made using cold-forming technology with a modified cross-sectional shape (
Figure 1). The columns were made by the Polish companies Hanbud and Zaprom. The modification of the shape of the cross-sections of the columns, aims to assess the influence of this modification on the strength, load-bearing capacity and resistance to loss of stability of the tested columns.
The studied members had double or single steel sheet on the flange. The shape of the flange and the web were modified. The columns were made without the use of disconnected and non-disconnected joints. Overall dimensions of all tested cross-sections are: height 80 mm and width 40 mm. Columns with lengths of 200, 300 and 400 mm were analysed. Members were made of steel sheet DX51 with wall-thickness 0.5mm, hot-dip galvanised, zinc coating Z200-220.
Geometrical characteristics of the cross-sections of the studied columns were determined. The calculated values are shown in
Table 1. The cross-sectional area A,
and
- coordinates of the position of the centre of gravity of the cross-section,
- axial moment about the x-axis,
- axial moment about the y-axis and
- deviation moment were determined.
The geometrical characteristics were determined to identify the position of the centre of gravity, as the compressive force will be applied at this point. This will result in pure compression conditions.
3. Experimental investigation
3.1. Test stand
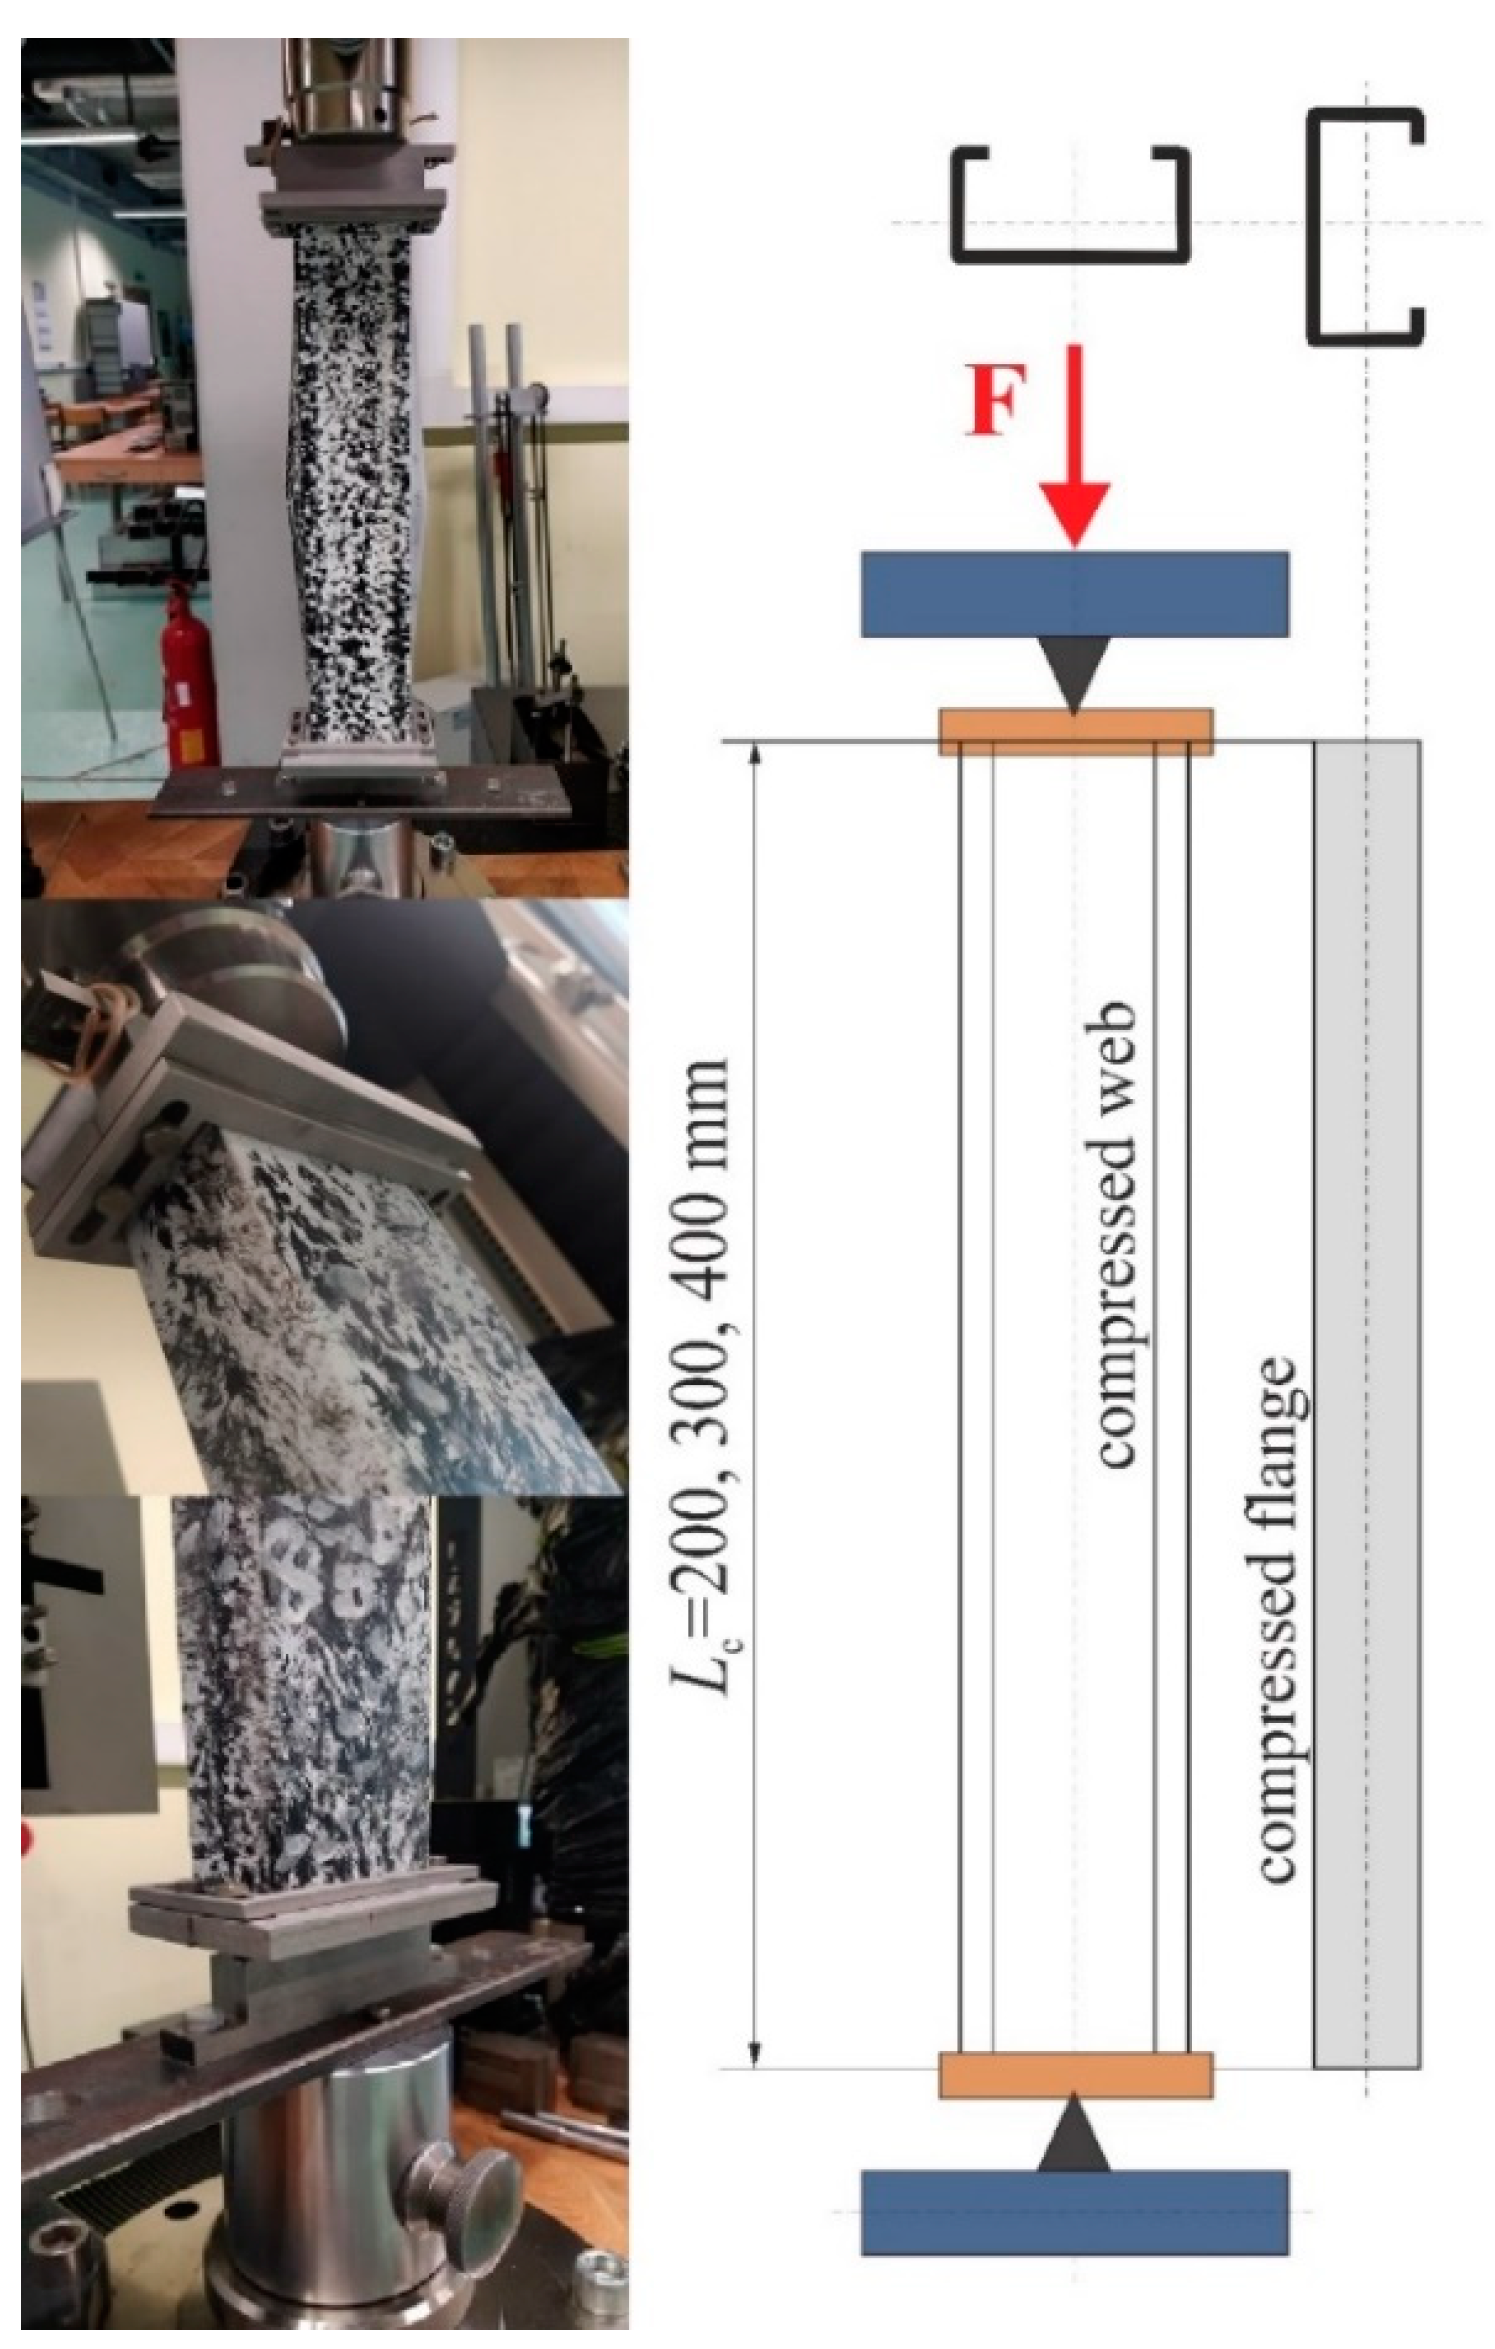
The tests were carried out on a ZWICK Z100/Roell testing machine. It is a universal machine with a measuring range of 0.2 - 100kN. The specimens were loaded with a progressively increasing axial compressive force applied at the geometric centre of gravity of the individual column cross-section. Special spacers were used to protect the specimens from uncontrolled movement of the ends of the columns when the force was applied. The upper spacer, to which the compression force was applied, blocked two translations: with respect to the y-axis and with respect to the z-axis. Translation relative to the x-axis was allowed. Three rotations with respect to all axes were also blocked. In contrast, the bottom spacer blocked three translations and three rotations. The test stand is shown in
Figure 2. In addition, the top and bottom spacers are shown.
The tests were carried out until the columns collapsed, i.e. until their load-bearing capacity was completely exhausted. The tests were carried out in accordance with the guidelines of Eurocode 3. The displacement of the crosshead and the compressive force were recorded during the tests.
3.2. Results of the experimental studies
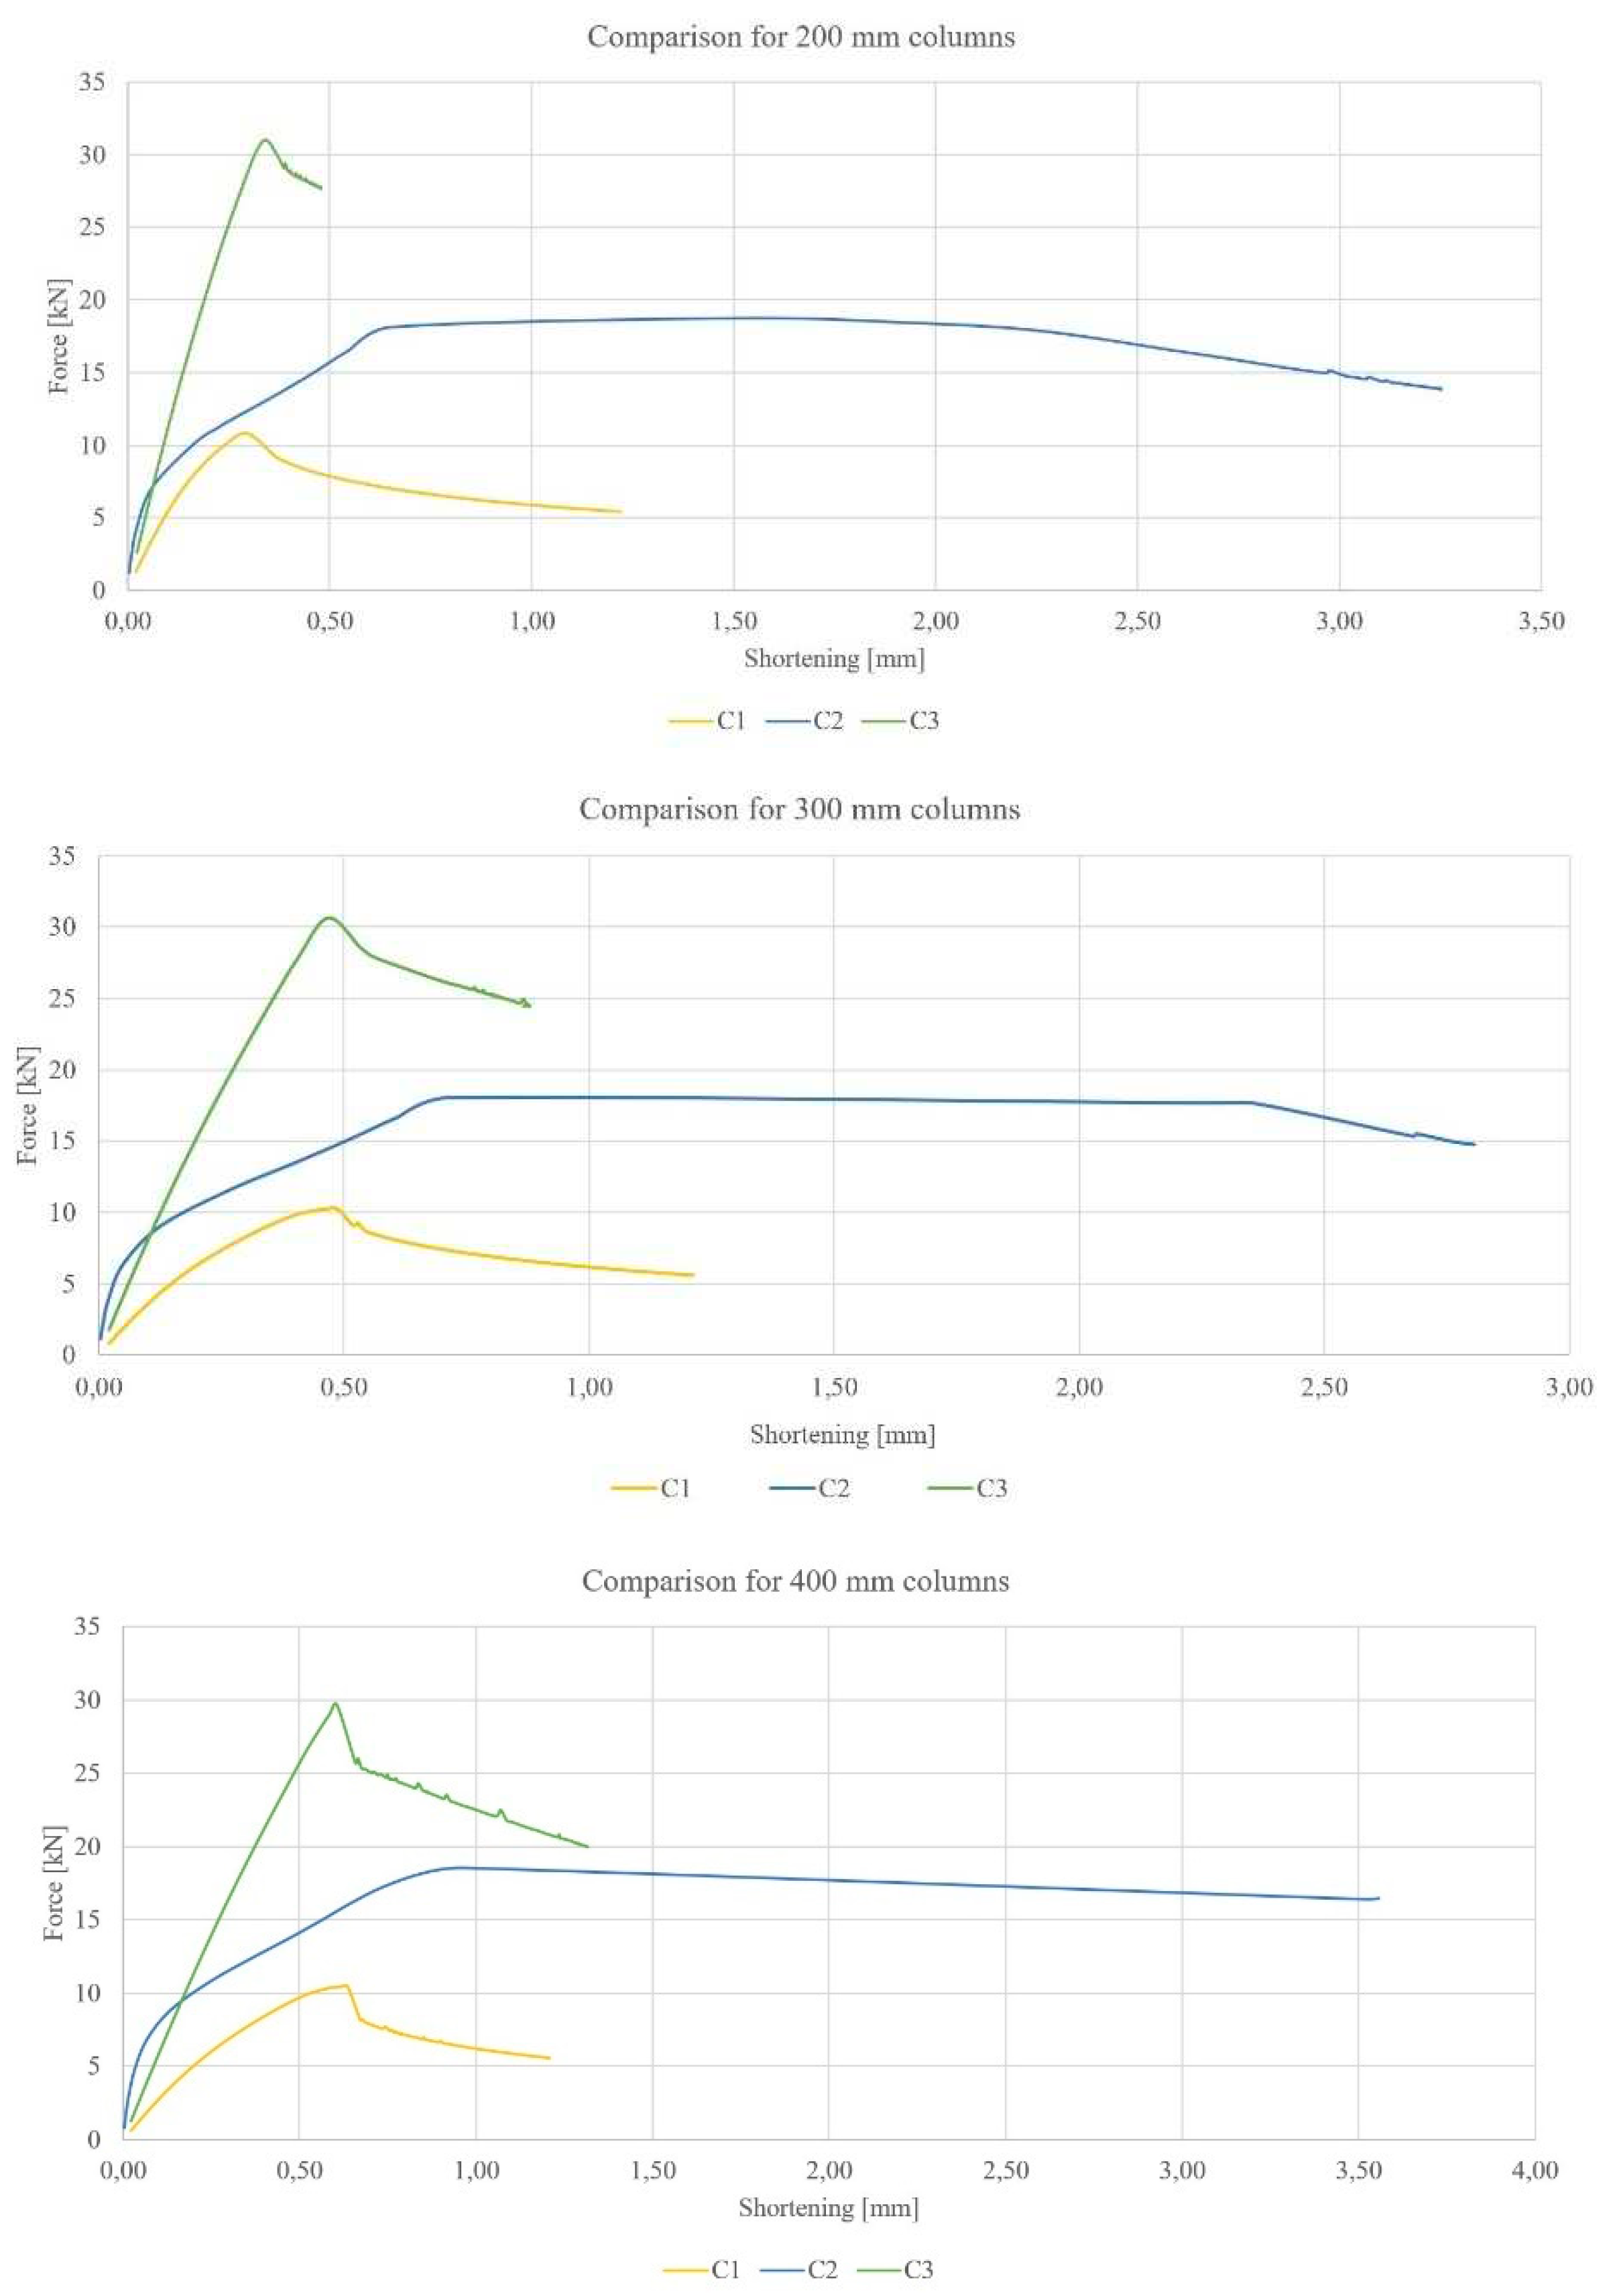
Experimental tests were carried out on the test stand described in Chapter 2, from which compression force diagrams were obtained as a function of crosshead displacement.
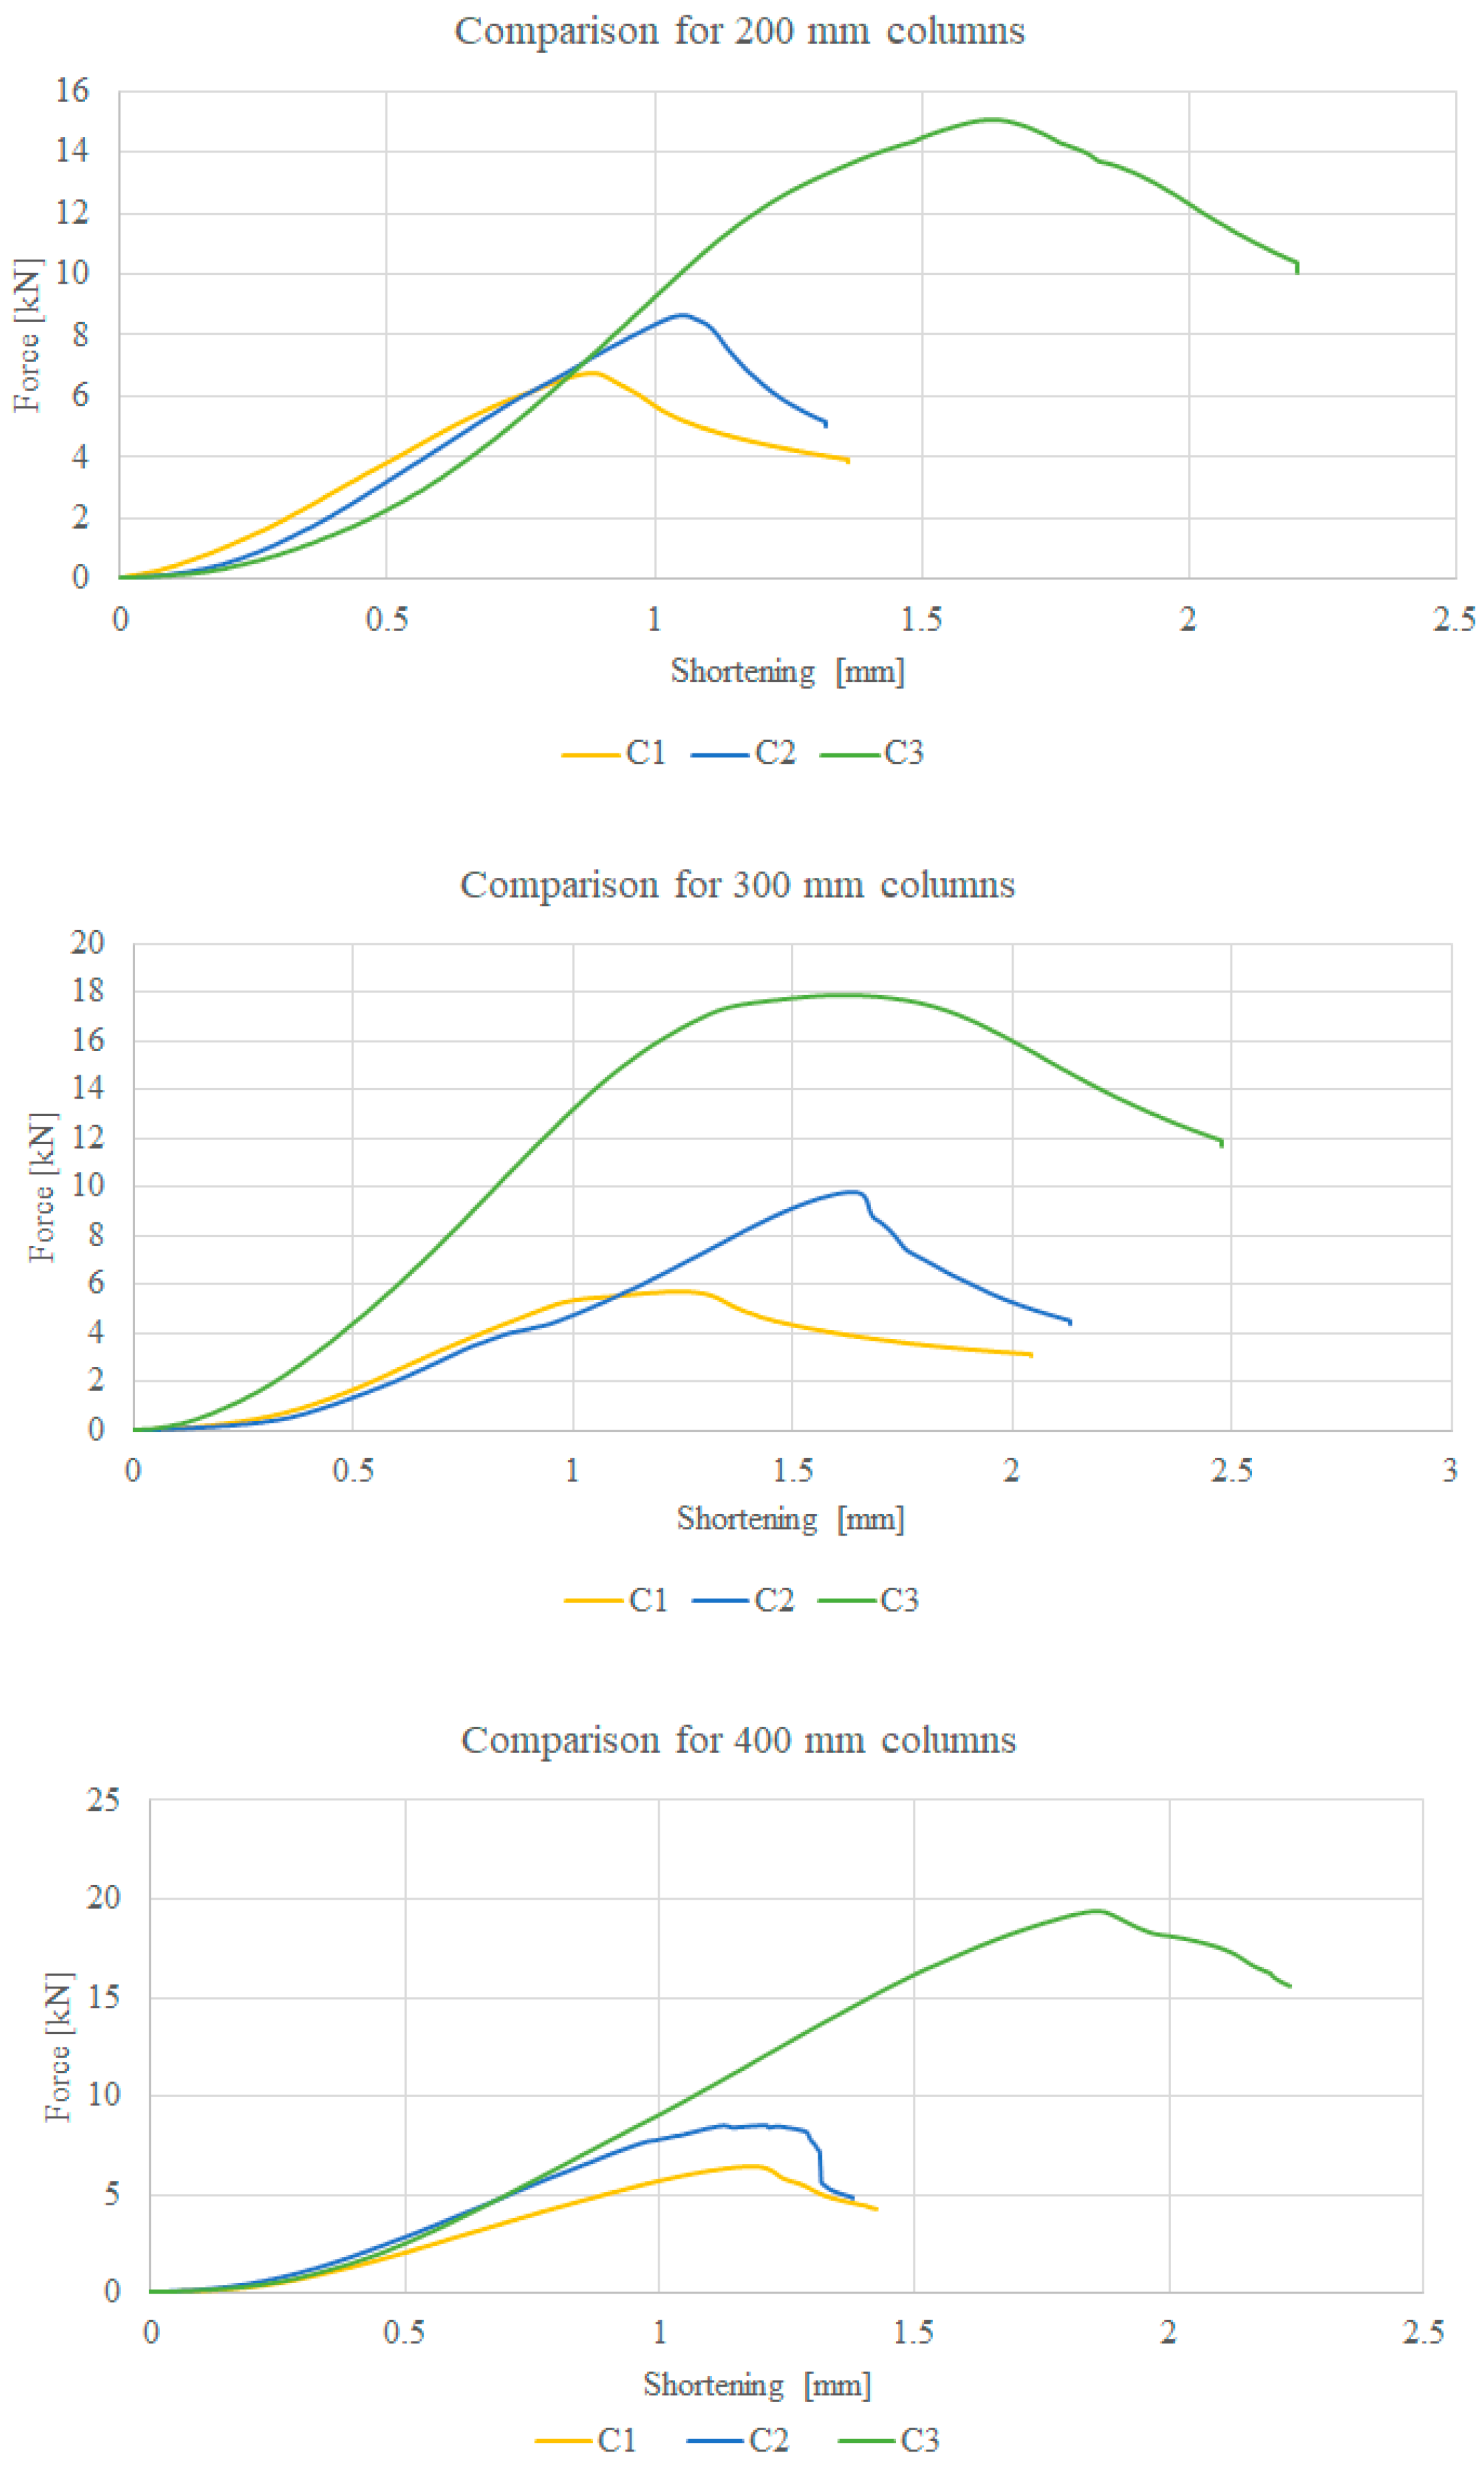
From the resulting diagrams, the value of the maximum forces at which the total loss of load bearing capacity of the columns occurred can be read directly. The graphs are shown in
Figure 3. The values of the determined maximum forces are shown in
Table 2.
The maximum force value for column C1 is the smallest, while that for column C3 is the largest. The modification of the cross-sectional shape of column C3 is much stronger, compared to column C1. As the column length increases, the value of the maximum force increases.
The tests carried out were designed to determine the maximum strength of the short columns. However, during the tests, it was noticed that half-waves, characteristic of local buckling, appeared on some of the columns, so it was decided to determine the critical forces for the columns tested.
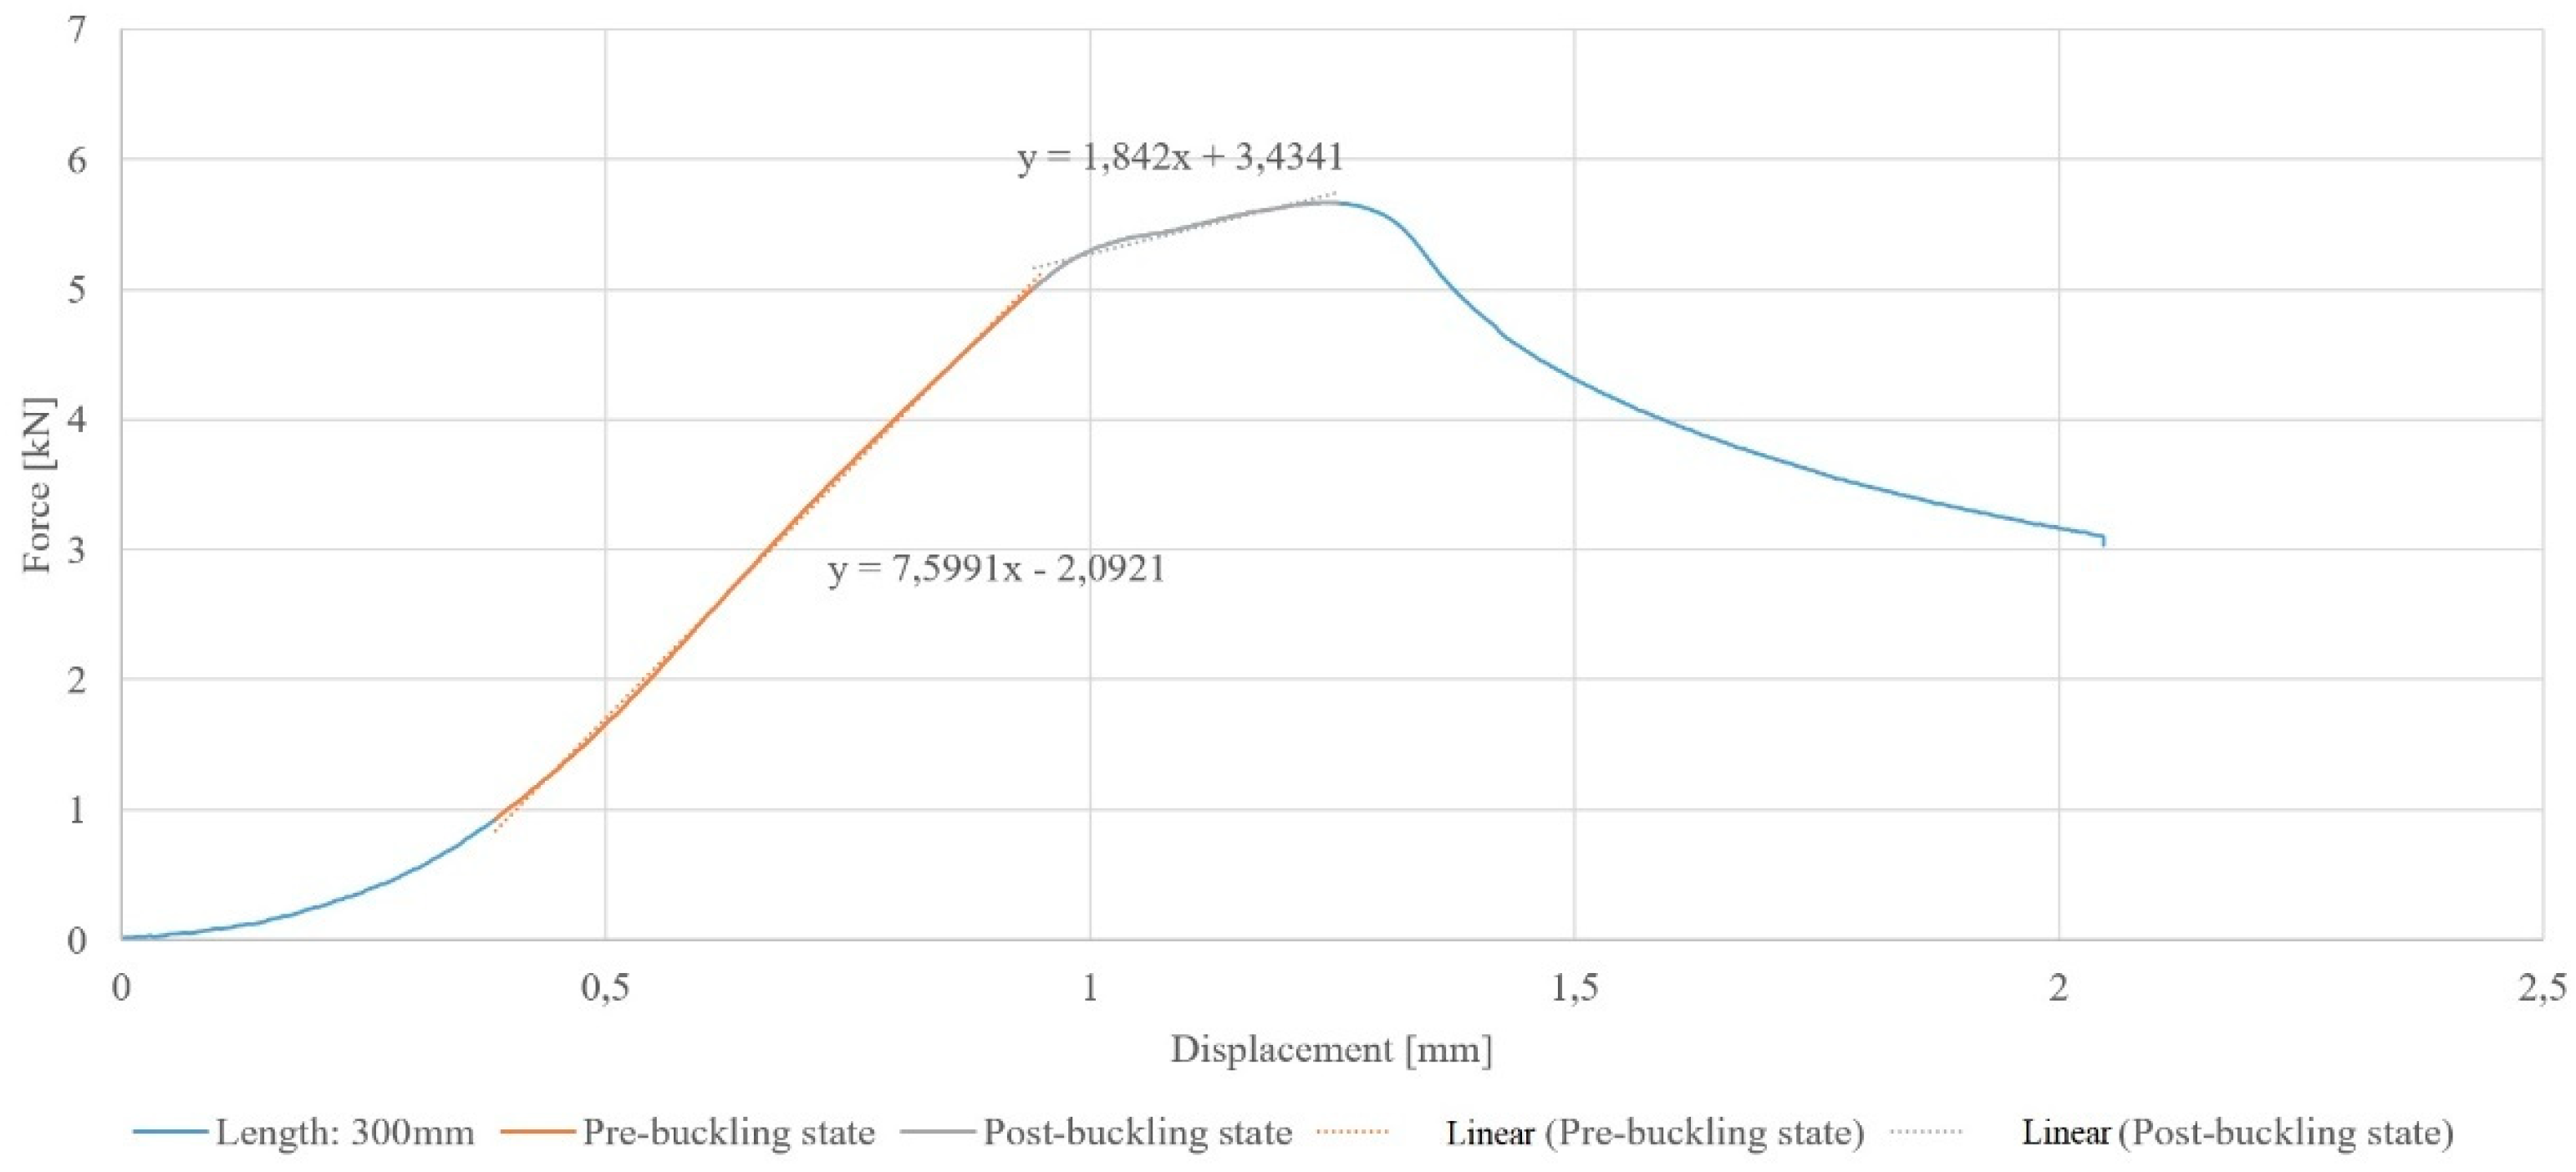
The values of the critical forces were determined using the averaged strain/ displacement method. This method involves a linear approximation of the pre-buckling state and the post-buckling state. So that the linear approximations intersect at the bifurcation point, which will indicate the value of the critical force. The application of this method is shown in
Figure 4.
The critical force values obtained for C1, C2 and C3 columns of different lengths are shown in the
Table 3.
The critical force values for column C1 and C2 are not length-dependent. However, for column C3, the value of the critical force increases with the length of the column.
4. Numerical analysis
Numerical studies were performed using the finite element method, and ANSYS software was used. Numerical models of the columns were made in such a way that it was possible to verify the results of the analyses by comparing them to the results obtained from experimental methods. Therefore, the dimensions and shapes of the analyzed cross sections were the same as those of the columns that were tested.
Linear and nonlinear analysis was performed. On the basis of the linear analysis, the buckling forms of the columns were determined, while the equilibrium paths and critical force values were determined on the basis of the nonlinear analysis. In the analysis, large deformation and plastic deformation of the column material were allowed. In addition, a static tensile test of the steel from which the sections were made was performed, and based on this test, the material properties of the columns were implemented into ANSYS. A multi-linear material model was used. The numerical model was covered with shell281 second-order finite elements with eight nodes and six degrees of freedom at each node. The use of shell elements is recommended for the analysis of thin-walled structures. The size of the finite element was 4mm, which was determined after a convergence analysis of the numerical calculations. To obtain pure compression conditions, the compressive force was applied at the center of gravity of the column cross section. In addition, the given boundary conditions corresponded to those realized during experimental testing. The boundary conditions were given by appropriately offset (from the ends of the column) coordinate systems. The imperfection of the initial imperfection was given.
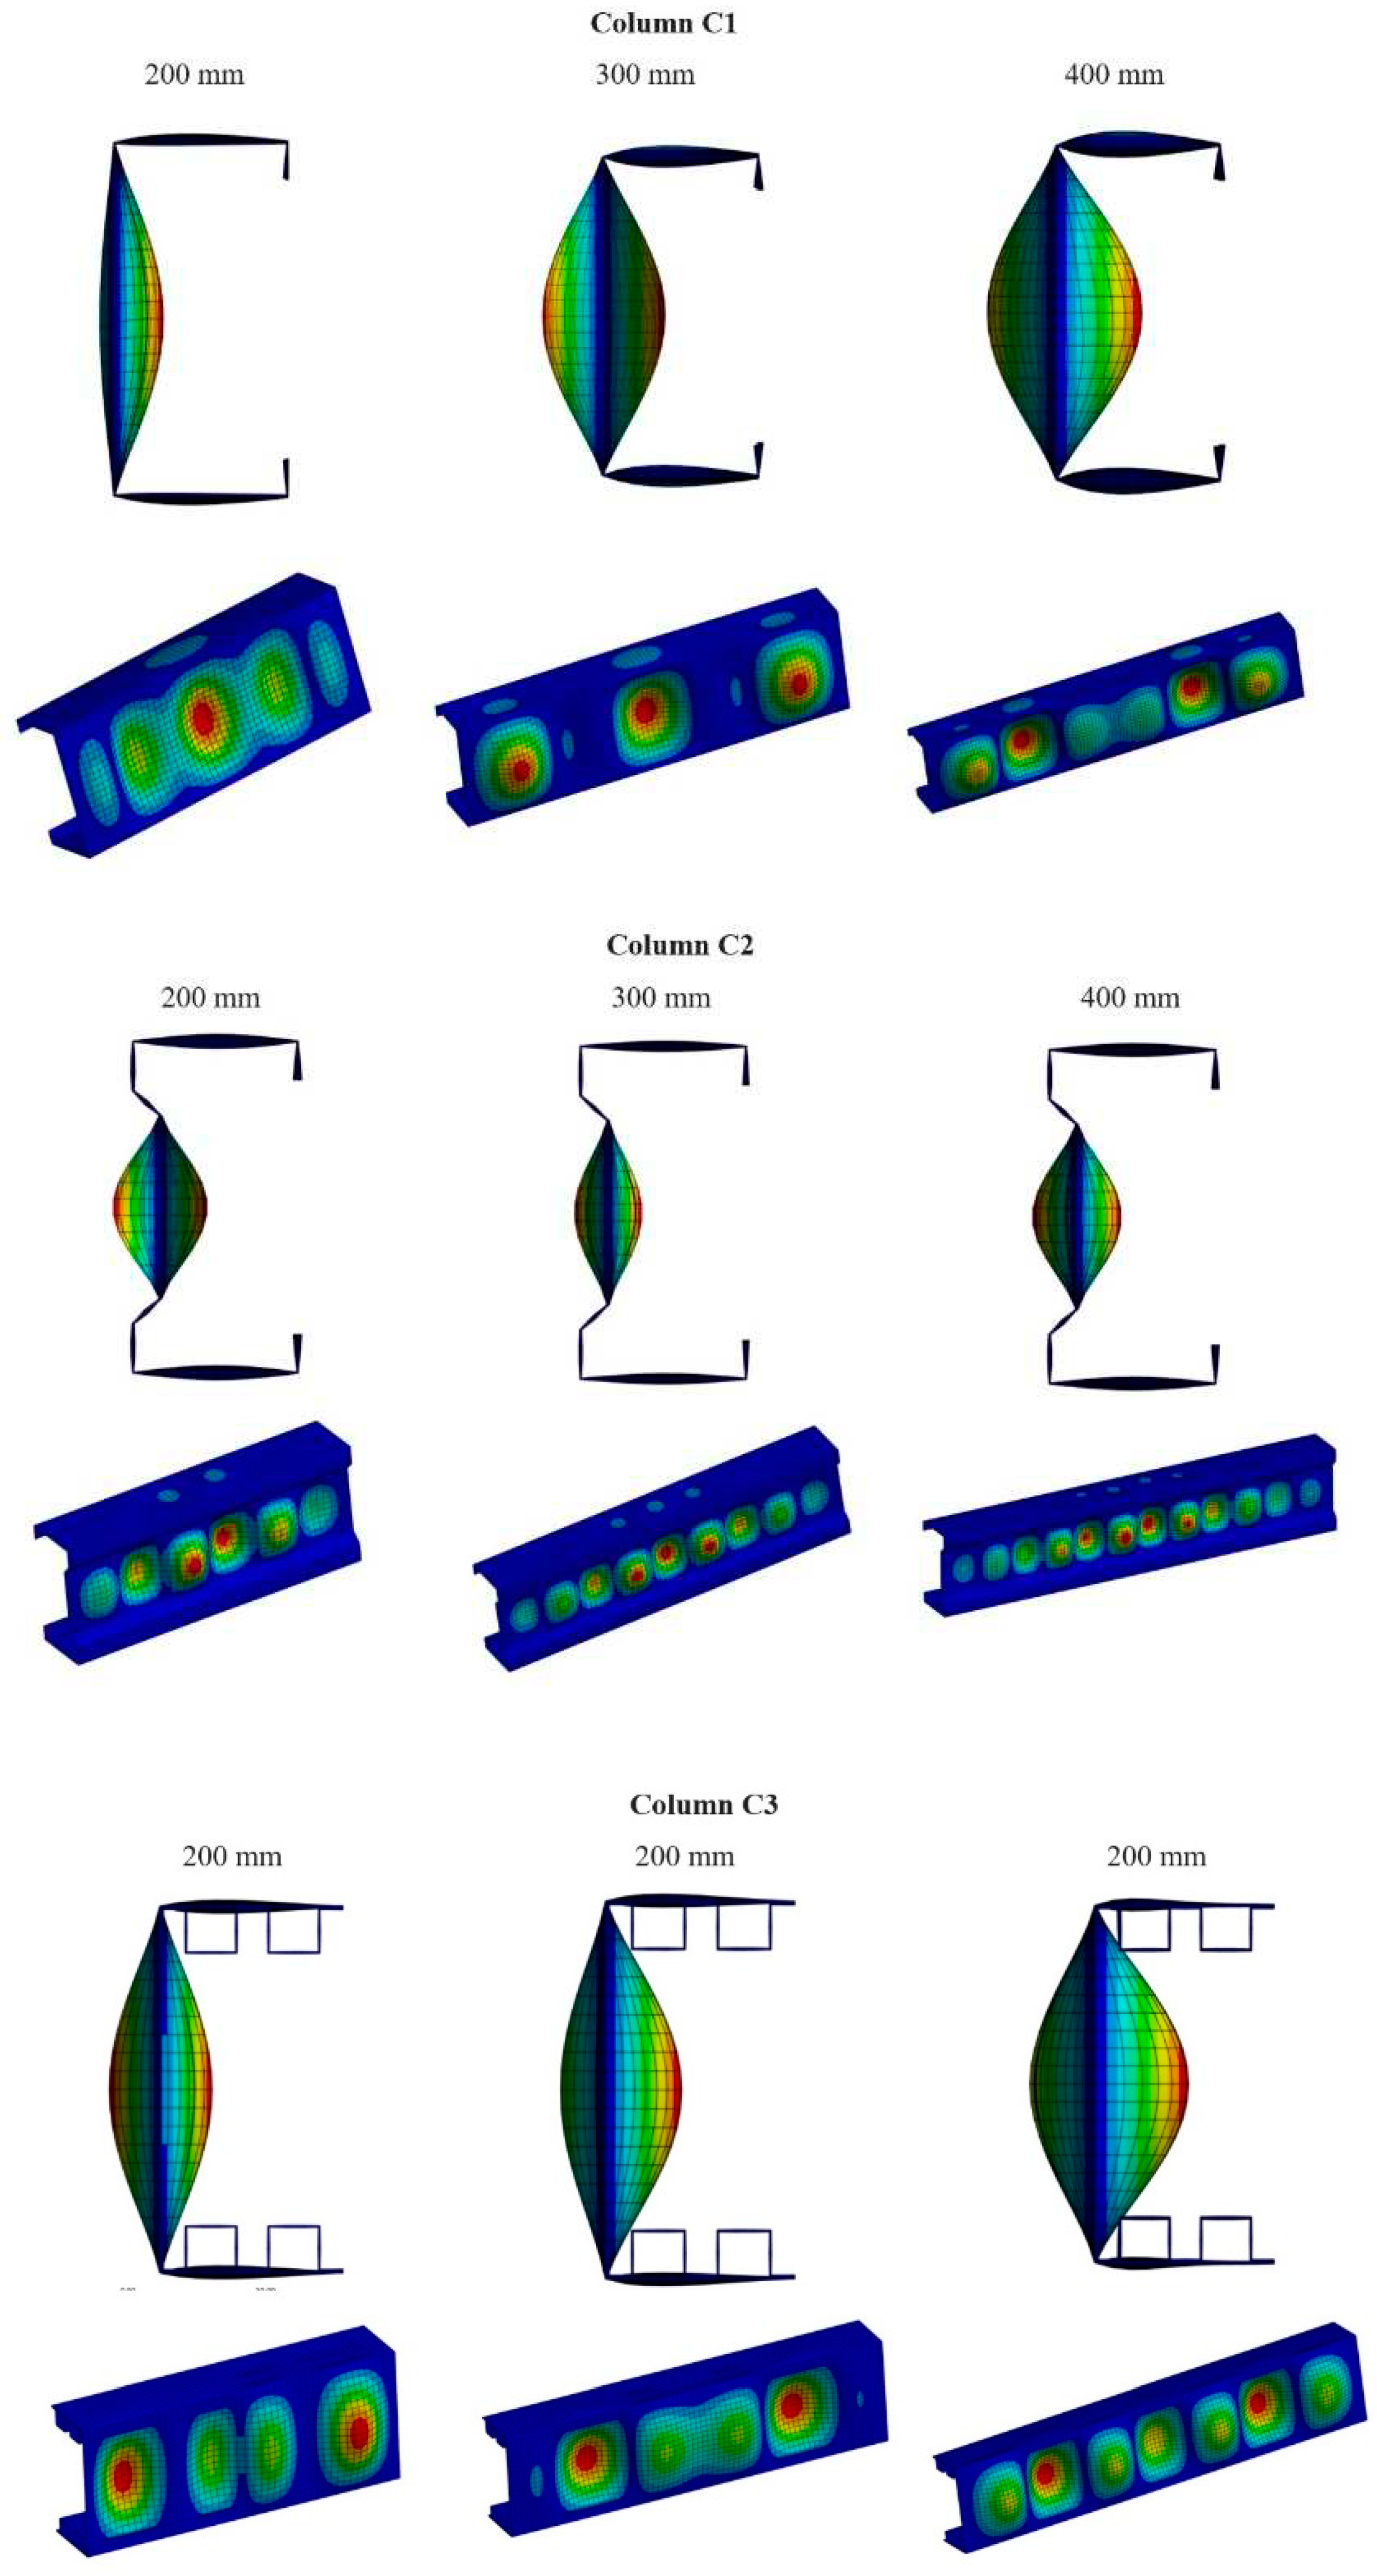
Based on linear analysis, the buckling forms of the columns were determined, as can be observed in
Figure 5.
All of the analyzed columns suffered a local loss of stability, as can be seen from the half-waves that appeared on the flanges and webs of the sections. It is notable that in the case of column C3, the deformations on the flange are much smaller in magnitude compared to columns C1 and C2.
The next step in the FEA analysis was a nonlinear buckling analysis of the columns. On the basis of these analyses, it was possible to determine the values of critical forces, as a plot of force in function of strain, i.e. the equilibrium path for the compressed columns, was obtained (
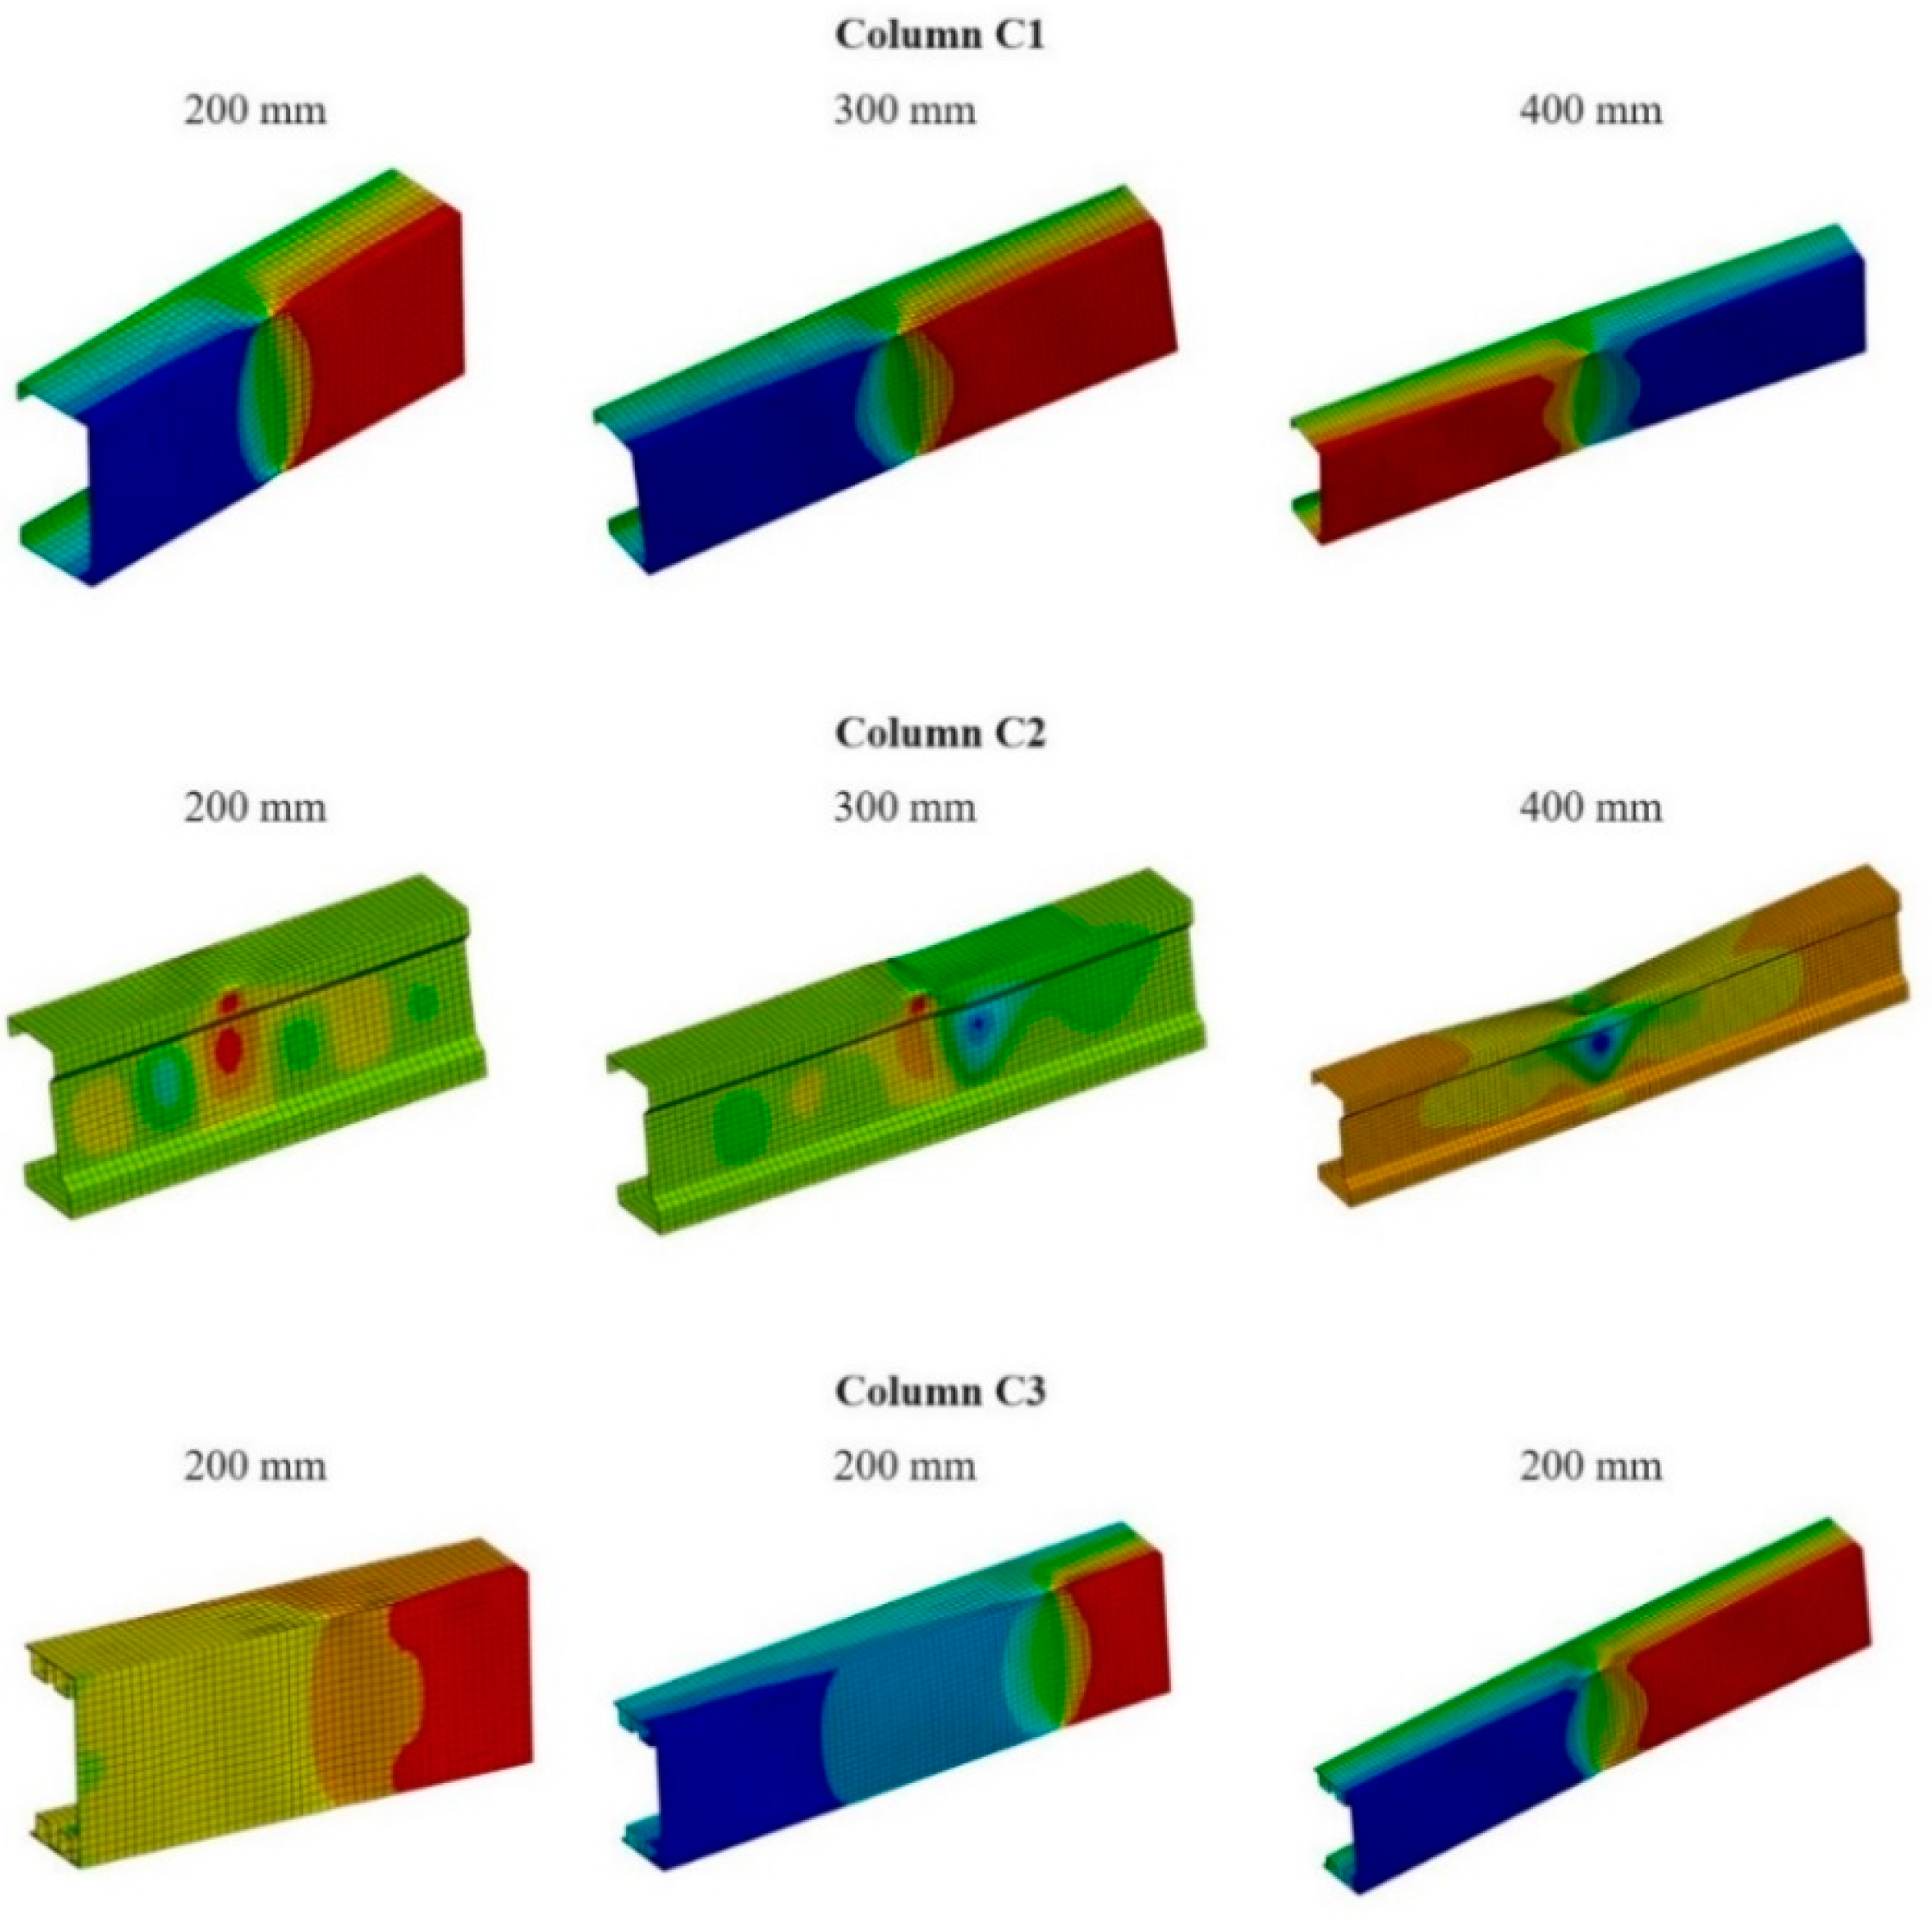
Figure 6). The nonlinear analysis makes it possible to evaluate the covered work of the structure, so the forms of failure of the columns were also determined. The initial strain for the nonlinear analysis was implemented from the linear analysis.
In addition, nonlinear analysis made it possible to determine the values of critical forces, as shown in
Table 4. The values of critical forces were determined using the strain-averaged method based on the equilibrium paths obtained.
For C1 and C2 columns, the values of critical forces depend insignificantly on the length of the column. Critical forces for all lengths take on similar values. However, in the case of column C3, it is apparent that the highest value of the critical force is obtained at a length of 300 mm, and the lowest at a length of 200 mm.
Figure 7 shows the forms of column failure. It can be seen that the columns fail in the middle of their length. The shapes and forms of destruction vary depending on the shape of the cross-section of the analyzed columns.
5. Compression strength condition
Tests were conducted to determine the compressive strength of the short columns. The goal was to compare the values of maximum forces obtained from the experiment with those obtained from the classical strength condition. Accordingly, the values of maximum forces were determined on the basis of the compressive strength condition. The compressive strength condition is described by the formula (1).
Where: F – force,
– stress, A – cross-sectional area,
– compressive limit stress. The obtained values are shown in
Table 5.
The value of the maximum force, determined by the strength condition, is constant for all columns regardless of their length, which is directly derived from the strength condition. For column C3, which of all the analyzed columns, is the stiffest, the value of the maximum force was the highest. This is due to the cross-sectional area of the column, which is the largest relative to the areas of columns C1 and C2. The cross-sectional areas of the columns are shown in
Table 1.
6. Discussion of the results
Based on the tests, the values of maximum forces and critical forces were determined. The maximum forces were obtained from the experimental method and from the compressive strength condition. The critical force was determined from the experiment and numerical analysis.
Table 6.
Comparison of obtained results - maximum forces and critical forces.
Table 6.
Comparison of obtained results - maximum forces and critical forces.
| Methods |
Maximum force - experiment [kN] |
Maximum force - strength condition [kN] |
Critical force - experiment [kN] |
Critical force – numerical [kN] |
| Column |
| C1 |
5.67 - 6.76 |
10.59 |
5.24 - 6.81 |
6.42 - 6.75 |
| C2 |
8.55 - 9.78 |
8.10 |
4.05 - 8.88 |
8.21 - 9.3 |
| C3 |
15.09 - 19.36 |
17.57 |
12.7 - 19.83 |
15.01 - 19.58 |
The values of maximum forces and critical forces obtained from the experiment, as to their value, are similar to each other. In contrast, the values of maximum forces obtained on the basis of the experimental method and on the basis of the strength condition differ significantly from each other. The value of the maximum force obtained from the experimental method increases as the stiffness of the columns increases. For column C3, the force is a maximum of 19.36 kN, while for column C1 it is a maximum of 6.76 kN. The strength condition takes into account only the size of the cross-sectional area. Modifications to the cross-sectional area are not taken into account. Column C2, in terms of cross-sectional shape, has more modifications than cross-section C1. Despite this, the strength condition shows that column C2 has a lower maximum force value than column C1. This is not confirmed by experimental tests.
The results of the FEA analysis were verified with results from the experimental method. It was found that high agreement of the results was obtained for columns C1 and C3. A noticeable error is found for column C2. However, it is worth noting that the columns modeled in the system for FEM analysis had a certain value of initial imperfection. In the case of experimental studies, we are dealing with actual imperfections, which are difficult to estimate and represent another direction of the authors’ research.
The value of the critical force is lowest for column C1, while it is highest for column C3. The critical force of column C3 is more than three times higher than the critical force determined for column C1. This means that modifying the shape of the cross-section of the column increases the resistance to loss of stability of the columns.
The authoritative way to determine the desirability of modifying the cross-sectional shapes of thin-walled channel columns is by dimensionless reference to the results obtained. When the goal is to obtain the lightest possible structure, reference should be made to the weight of the columns. However, when the stiffness of the cross-section of the column is important, it seems most appropriate to refer to the moment of inertia of the column or to the cross-sectional area, as shown in
Table 7. Column C1 was taken as the base column.
Based on the analysis, it was found that the maximum force value for column C3 compared to column C1 increases by more than 60%. In contrast, for C2 and C1 columns, the value of the maximum force decreased by almost 30%. In the case of critical forces, it was noted that for column C3 the value of the critical force is almost three times higher than for column C1.
7. Conclusion
Experimental tests and calculation based on the compressive strength condition were conducted. The tests were performed to determine the maximum strength of the columns. In the course of performing the tests, the characteristic half-waves of local buckling were noted. Accordingly, it was decided to determine the values of critical forces.
Based on experimental studies, it was found that the value of the maximum force increases with the increase in column stiffness. This means that modifying the shape of the cross-section affects the value of the maximum force. It is worth paying attention to
Table 7, which presents a dimensionless version of the obtained results. The force values increase significantly when the mass of the entire structure is small. The aim of modifying the shape of the cross-section is to bring the critical force value closer to the maximum force value.
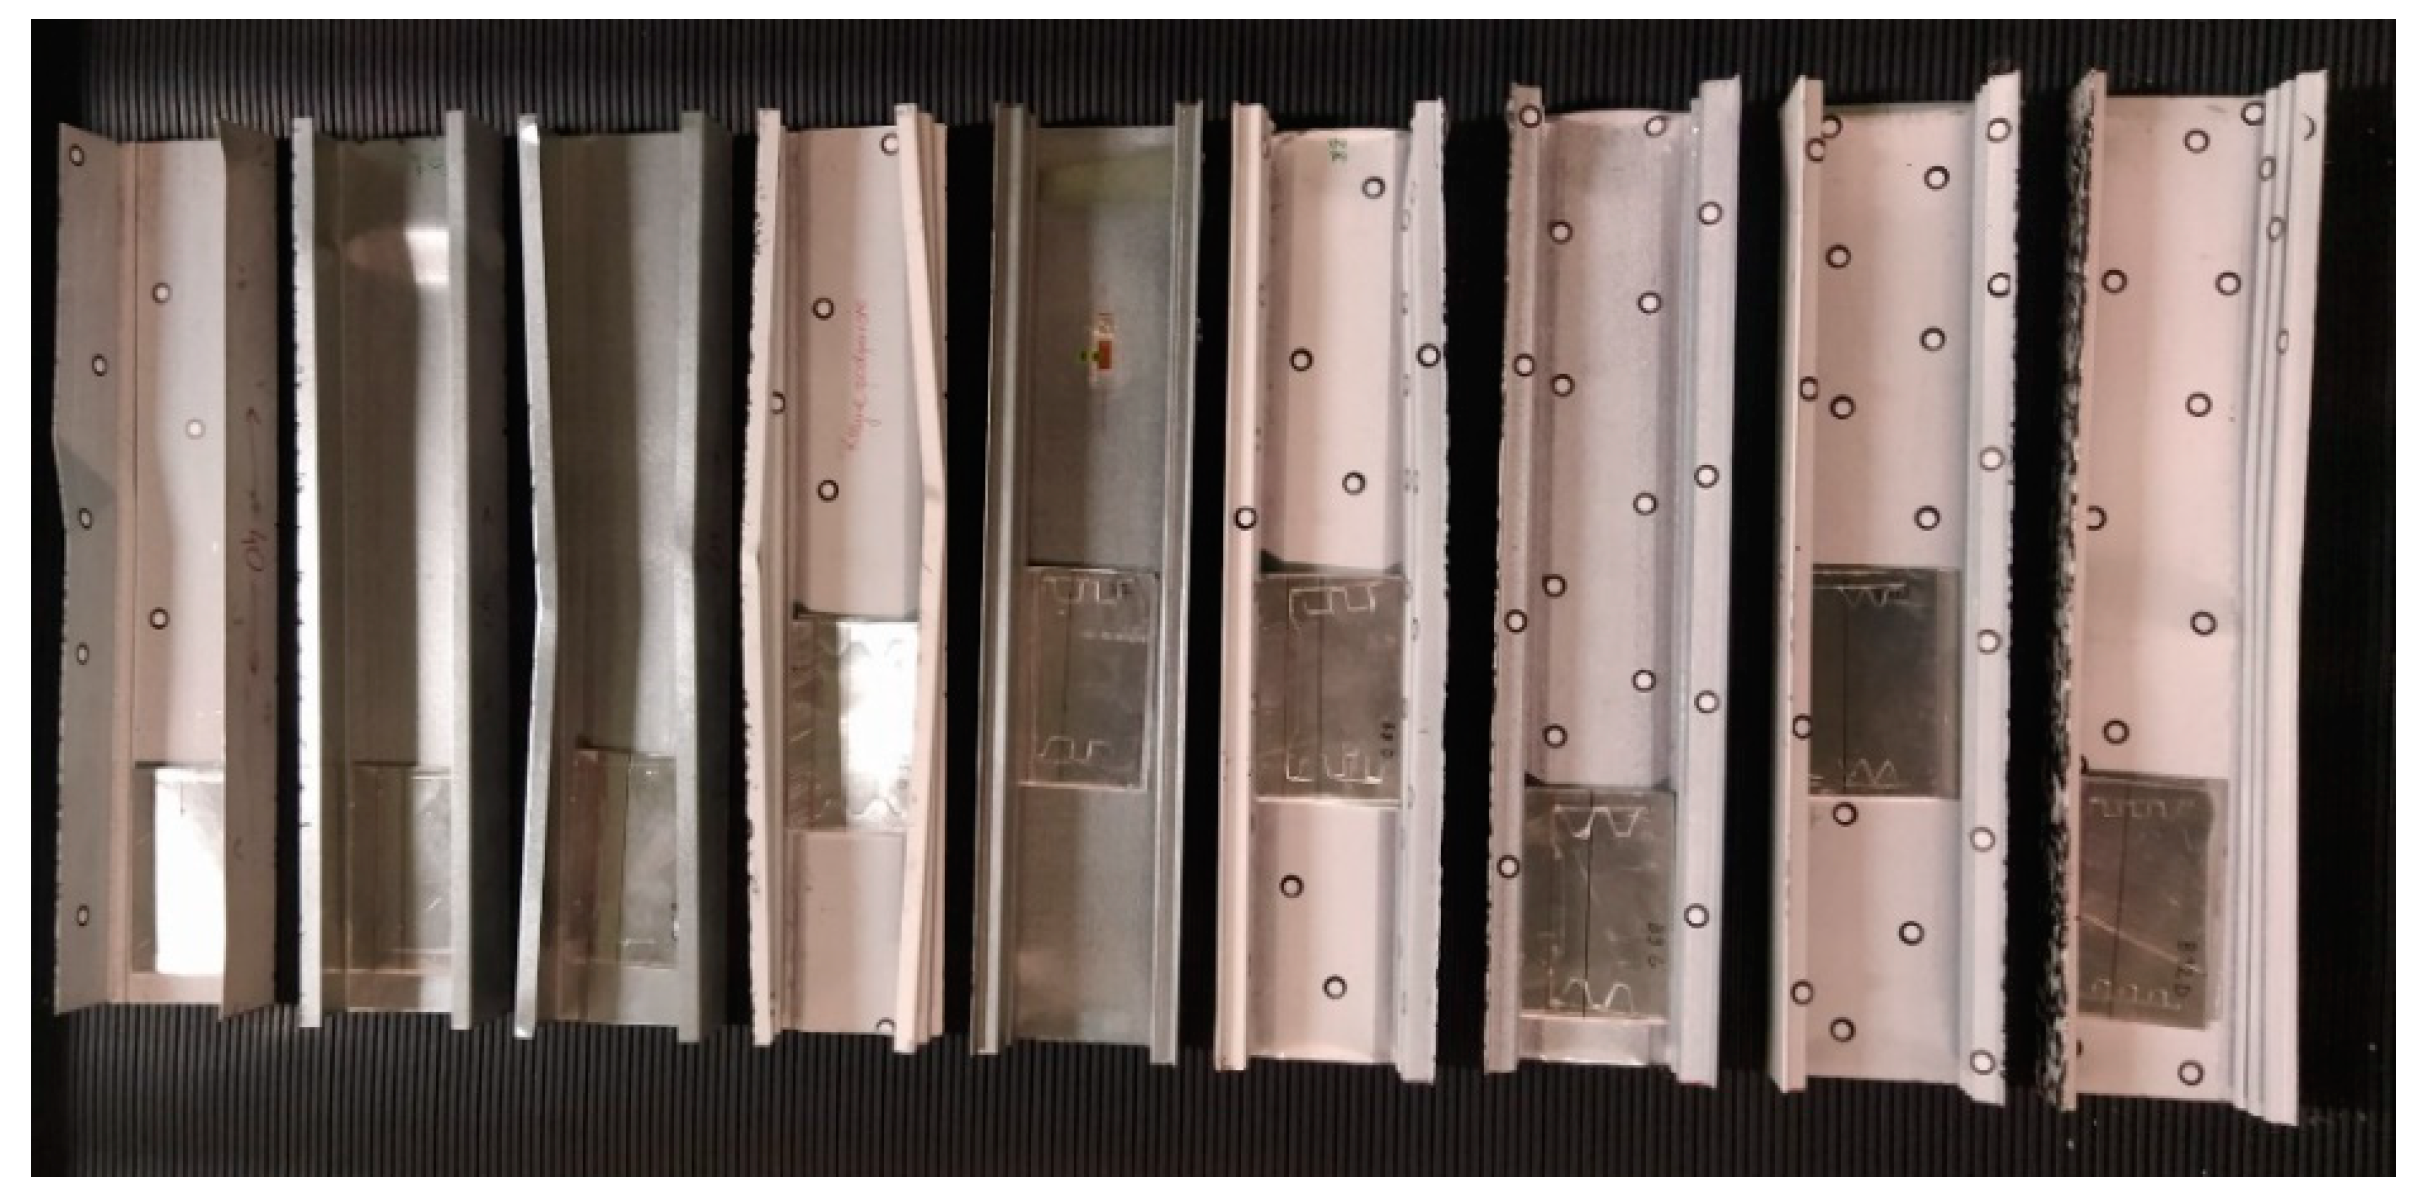
However, in the case of the compressive strength condition, as previously mentioned the value of the maximum force does not depend on the length of the column, because the strength condition only takes into account the shape of the cross-section, or more precisely, the cross-sectional area of the column. The strength condition is not suitable for estimating the maximum strength of thin-walled cold-formed columns with modified cross-section shapes. Tests was conducted until the columns were completely collapsed. The columns were collapsing in the middle of their length. In addition, large deformations appeared in the area of the spacers, as shown in the Figure 8.
Critical forces were determined using the averaged displacement method. The highest critical force value was obtained for column C3 with a length of 400mm, while the lowest value was obtained for column C2 with a length of 300mm. For column C3, the value of the critical force increases as the length of the column increases.
Figure 9 shows the columns after the tests were performed.
As previously mentioned in the study and analysis of thin-walled structures, it is extremely important to take into account the imperfections that occur in these structures. In the case of experimental studies, it is very difficult to relate the actual geometric imperfection to the results of the tests obtained. This is much easier in the case of numerical FEA analysis, where it is possible to set the initial imperfection at the required level. It is possible to inflict different initial imperfections, up to the expected result. However, according to the authors, it will be much more meaningful to make appropriate models, such as by 3D scanning of columns, and then implementing these models into FEA software. The authors are in the process of performing this type of research and analysis.
The conditions of the maximum forces obtained from the strength condition are similar to the critical forces obtained from the experimental tests. This means that short thin-walled columns are subject to loss of stability, but in estimating their strength it is equally important to determine the maximum force at which the columns collapse.
Acknowledgments
The project was funded by the National Science Centre. Poland allocated on the basis of the decision No. DEC-2021/43/B/ST8/00845 of 2022-05-23 – Contract No. UMO-2021/43/B/ST8/00845. This research was funded in whole ora in part by National Science Centre, Poland, Contract No. UMO-2021/43/B/ST8/00845. For the purpose of Open Access, the author has applied a CC-BY public copyright licence to any Author Accepted Manuscript (AAM) version arising from this submission.
References
- H. Debski, A. Teter, T. Kubiak, S. Samborski. „Local buckling, post-buckling and collapse of thin-walled channel section composite columns subjected to quasi-static compression” Composite Structures, vol. 136, pp. 593-601, 2016. [CrossRef]
- A. Dias Martins, D. Camotim, R. Gonçalves, P.B. Dinis. “On the mechanics of local-distortional interaction in thin-walled lipped channel columns” Thin-Walled Structures, vol. 125, pp. 187-202, 2018. [CrossRef]
- P. Jasion, A.M. Pawlak, P. Paczos. “Buckling and post-buckling behaviour of selected cold-formed C-beams with atypical flanges” Engineering Structures, vol. 244, pp. 112693, 2021. [CrossRef]
- A.M. Pawlak, P. Paczos. „Experimental Optical Testing and Numerical Verification by CuFSM of Compression Columns with Modified Channel Sections” Materials, vol. 14, pp. 1271, 2021. [CrossRef]
- M. Obst, M. Rodak, P. Paczos. „Limit load of cold formed thin-walled nonstandard channel beams” Journal of Theoretical and Applied Mechanics, vol. 54, no. 4, pp. 1369-1377, 2016. [CrossRef]
- E. Magnucka-Blandzi. “Effective shaping of cold-formed thin-walled channel beams with double-box flanges in pure bending” Thin-Walled Structures, vol. 49, no. 1, pp. 121-128, 2011. [CrossRef]
- K. Magnucki, T. Monczak. “Optimum shape of the open cross-section of a thin-walled beam” Engineering Optimization, vol. 32, no. 3, pp. 335-351, 2000. [CrossRef]
- M. Anbarasu, S. Sukumar. “Local/Distortional/Global buckling mode interaction on thin walled lipped channel columns” Latin American Journal of Solids and Structures, vol. 11, no. 8, pp. 1363-1375, 2014. [CrossRef]
- M-T. Chen, B. Young, A. Dias Martins, D. Camotim, P.B. Dinis. “Experimental investigation on cold-formed steel stiffened lipped channel columns undergoing local-distortional interaction” Thin-Walled Structures, vol. 150, pp. 106682, 2020. [CrossRef]
- D. Camotim, P.B. Dinis. “Coupled instabilities with distortional buckling in cold-formed steel lipped channel columns” Thin-Walled Structures, vol. 49, no. 5, pp. 562-575, 2011. [CrossRef]
- Y.B. SudhirSastry, Y. Krishna, P.R. Budarapu. “Parametric studies on buckling of thin walled channel beams” Computational Materials Science, vol. 96, no. B, pp. 416-424, 2015. [CrossRef]
- I. Wstawska. “The influence of geometric imperfections on the stability of three-layer beams with foam core” Archives of Mechanical Technology and Materials, vol. 37, pp. 65-69, 2017. [CrossRef]
- D. Hui. “Effects of Mode Interaction on Collapse of Short, Imperfect, Thin-Walled Columns” Journal of Applied Mechanics, vol. 51(3), pp. 566-573, 1984. [CrossRef]
- J. Kesti, J.M. Davies. “Local and distortional buckling of thin-walled short columns” Thin-Walled Structures, vol. 34, no. 2, pp. 115-134, 1999. [CrossRef]
- V. Ungureanu, M. Kotełko, A. Karmazyn, D. Dubina. „Plastic mechanisms of thin-walled cold-formed steel members in eccentric compression” Thin-Walled Structures, vol. 128, pp. 184-192, 2018. [CrossRef]
- V. Ungureanu, M. Kotełko, J. Grudziecki. „Plastic mechanisms for thin-walled cold-formed steel members in eccentric compression” Acta Mechanica et Automatica, vol. 10, no. 1, pp. 33-37, 2016. [CrossRef]
- A. Teter, H. Debski, S. Samborski. “On buckling collapse and failure analysis of thin-walled composite lipped-channel columns subjected to uniaxial compression” Thin-Walled Structures, vol. 85, pp. 324-331, 2014. [CrossRef]
- M.P. Saka. “Optimum Geometry Design of Geodesic Domes Using Harmony Search Algorithm” Advances in Structural Engineering, vol. 10(6), pp. 595-606, 2007. [CrossRef]
- S. Carbas, M.P. Saka. “Optimum topology design of various geometrically nonlinear latticed domes using improved harmony search method” Structural and Multidisciplinary Optimization, vol. 45, pp. 377–399, 2012. [CrossRef]
- A. Kaveh, M. Rezaei, M.R. Shiravand. “Optimal design of nonlinear large-scale suspendome using cascade optimization” International Journal of Space Structures, vol. 33(1), pp. 3-18, 2018. [CrossRef]
- D. Bysiec. “Sustainable Shaping of Lightweight Structures Created According to Different Methods” Sustainability, vol. 15(4), pp. 3236, 2023. [CrossRef]
|
Disclaimer/Publisher’s Note: The statements, opinions and data contained in all publications are solely those of the individual author(s) and contributor(s) and not of MDPI and/or the editor(s). MDPI and/or the editor(s) disclaim responsibility for any injury to people or property resulting from any ideas, methods, instructions or products referred to in the content. |
© 2024 by the authors. Licensee MDPI, Basel, Switzerland. This article is an open access article distributed under the terms and conditions of the Creative Commons Attribution (CC BY) license (http://creativecommons.org/licenses/by/4.0/).
