Preprint
Article
Rutin/Sulfobutylether-β-Cyclodextrin as a Promising Therapeutic Formulation for Ocular Infection
Altmetrics
Downloads
79
Views
45
Comments
0
A peer-reviewed article of this preprint also exists.
This version is not peer-reviewed
Submitted:
15 January 2024
Posted:
16 January 2024
You are already at the latest version
Alerts
Abstract
Ocular pathologies present significant challenges in achieving effective therapeutic re-sults due to various anatomical and physiological barriers. Natural products, such as flavonoids, alone or in association with allopathic drugs, present many therapeutical actions, including anti-cancer, anti-inflammatory, and antibacterial action. However, their clinical employment is chal-lenging for scientists due to their low water solubility. In this study, we designed a liquid formu-lation based on rutin/sulfobutylether-β-cyclodextrin (RTN/SBE-β-CD) inclusion complex for treating ocular infections. The correct stoichiometry and the accurate binding constant were de-termined by employing the SupraFit software on the Uv-vis titration experiment. A deep physical-chemical characterization of the RTN/SBE-β-CD inclusion complex was also performed; it con-firmed the predominant formation of a stable complex (Kc, 9660 M−1) in a 1:1 molar ratio, with high water solubility of 20 times (2.5 mg/mL) higher than the free molecule (0.125 mg/mL), per-mitting the dissolution of the solid complex within 30 min. NMR studies revealed the involve-ment of the bicyclic flavonoid moiety in the complexation, which was also confirmed by molecu-lar modeling studies. In vitro, the antibacterial and antibiofilm activity of the formulation was assayed against Staphylococcus aureus and Pseudomonas aeruginosa strains demonstrating a sig-nificant activity of the formulation to the free components.
Keywords:
Subject: Chemistry and Materials Science - Nanotechnology
1. Introduction
Ocular infections are a worldwide health problem. If untreated properly, they can get worse, damaging the anatomic structure of the eye and leading to permanent vision loss or blindness [1]. Antibiotic treatment often does not eradicate the infection due to bacterial resistance, representing a significant healthcare threat worldwide. In recent years, there has been a noticeable increase in bacterial resistance to almost all classes of antibiotics developed to treat ocular infections, such as β-lactam, aminoglycosides, fluoroquinolones, sulphonamides and tetracyclines [2,3,4]. Epidemiological studies have shown that the overuse of antibiotics or their incorrect choice and duration of therapy are responsible for the evolution of resistance [5]. Furthermore, antibiotics are also widely used in animals as supplements to promote livestock growth and prevent infection. Their use kills susceptible bacteria, allowing for the proliferation of antibiotic-resistant bacteria, which are transmitted to humans in the food supply [6,7]. In addition, the development of new antibiotics by the pharmaceutical industry and antibiotic research conducted in academia have decreased dramatically due to economic and regulatory obstacles [8]. Another factor responsible for the persistence and resistance of bacteria to antibiotics is the ability of microorganisms to form biofilm. This may develop in the human body and on medical devices. It is a structured consortium of bacteria embedded in a self-produced polymer matrix of polysaccharides, proteins, and DNA [9]. The ability to form biofilms in various environments is a common trait of bacteria and may represent one of the earliest defenses against predation, interfering with antibiotic bioavailability [10]. Antibiotic therapy alone is often not sufficient for the eradication of bacterial biofilms. High concentrations and/or repeated administrations of the drug are needed, increasing adverse effects and resistance selection. There is an urgent need for new strategies to fight antibiotic resistance and preserve or potentiate the efficacy of existing antibiotics towards ocular infections because bacterial resistance causes treatment failure, exposing patients to high risks [11,12].
Flavonoids, largely contained in natural products derived from plants or fruits, receive high interest in the scientific community today for their large plethora of health benefits and their antibacterial activity [13,14,15,16]. They determine the color of plants and regulate cell growth, protecting them against biotic and abiotic stresses [17]. In humans, flavonoids show antioxidants, anticancer, anti-aging, neuroprotective, anti-inflammatory, and antibacterial effects. They are safe and produce low adverse effects [18,19,20]. We are witnessing a progressive replacement of allopathic drugs with natural active ingredients, representing in some parts of the world the first therapeutic choice for healthcare [21].
Rutin (RTN) is a flavonoid (Figure 1) with anti-inflammatory, anticancer, and antioxidant activity [22,23]. It is also studied for its antimicrobial activity towards different bacteria strains. It inhibits the growth of Escherichia coli [24] and shows activity towards Proteus vulgaris, Shigella sonnei, Klebsiella sp. [25], Pseudomonas aeruginosa and Bacillus subtilis [26]. Ivanov et al. [27] also proved that RTN strongly affects bacterial biofilm formation in vitro, showing higher activity than other flavonoids. It reduces the production of P. aeruginosa virulence factors and downregulates the expression of quorum sensing-related genes of this microorganism. Probably, RTN interferes with the membrane permeability of microorganisms, producing the leakage of intracellular material [28]. RTN can also potentiate the antibacterial activity of other flavonoids, such as morin and quercetin, towards Bacillus cereus and Salmonella enteritidis [29]. Furthermore, the association of RTN, quercetin, and morin potentiates the antibacterial activity of different antibiotics against methicillin-resistant Staphylococcus aureus [28].
Despite these exciting properties, RTN shows a very low water solubility [30], responsible for poor and erratic bioavailability, preventing its employment in therapy. Cyclodextrins (CDs) could be used to overcome this drawback. They are cyclic oligosaccharides able to complex apolar drugs and effectively improve their physicochemical properties, including water solubility [31,32,33,34]. Furthermore, CDs demonstrated the ability to enhance the antibacterial activity of different natural compounds and antibiotics [35,36].
On these observations, in this work, we developed a liquid formulation based on RTN/sulfobutylether-β-cyclodextrin (RTN/SBE-β-CD) inclusion complex, intending to develop an ophthalmic formulation with antibacterial activity. The inclusion complex was prepared by freeze-drying and characterized by phase-solubility studies, UV–vis, and NMR spectroscopy. Thermogravimetric analysis and X-ray diffraction were performed on the inclusion complex in a solid state. Molecular modeling studies on the RTN/SBE-β-CD inclusion complex were conducted to evaluate the energetic and structural rationalization of the recognition process. Finally, the antibacterial properties of RTN/SBE-β-CD inclusion complex were assayed in comparison with those of free components and complexed with SBE-β-CD by in vitro studies against Staphylococcus aureus and Pseudomonas aeruginosa that are the most common pathogens leading to ocular infections often associated to biofilm formation [37].
2. Materials and Methods
2.1. Materials
Rutin (RTN, C27H30O16, molecular weight, 610.5 g/mol), levofloxacin hydrochloride (LVF, C18H20FN3O4, molecular weight (MW) 361.37 g/mol), and trehalose were purchased from Sigma-Aldrich (St. Louis, MO, USA). Sulfobutyl-ether-β-cyclodextrin (SBE-β-CD, CAPTISOL®, average degree of substitution seven, average molecular weight, 2162 g/mol) was supplied by CyDex Pharmaceutical (Lenexa, KS, USA). Culture media were purchased from ThermoFisher (Oxoid, Milan, Italy). The other reagents were purchased from Sigma-Aldrich (Milan, Italy) unless otherwise specified in the text.
2.2. Preparation of the RTN/SBE-β-CD Inclusion Complex
RTN/SBE-β-CD inclusion complex was prepared by lyophilization. Initially, 10 mg of RTN (1.64 M−3) was weighed and solubilized in 2 mL of MeOH. Subsequently, 71 mg of SBE-β-CD (3.3 M−3) was solubilized in 8 mL of H2O and added to the methanol solution of RTN. The mixture was magnetically stirred at room temperature for 30 min. The obtained solution was freeze-dried for 72 hours (VirtTis Benchtop K Instrument, SP Scientific, USA).
2.3. Dissolution studies of RTN/SBE-β-CD Inclusion Complex
Following the 44th United States Pharmacopoeia (USP), paddle method dissolution studies were conducted in the dark at 37.0 ±0.5 °C, keeping the dissolution medium in a constant, smooth motion (100 rpm). Free RTN (250 mg) or a corresponding amount in the complex was suspended in 900 mL of water. At fixed times (15, 30, 45, 60, and 120 min), 1 mL aliquot was collected, filtered, and analyzed by UV-Vis, by using a diode array spectrophotometer, StellarNet BLACK-Comet, Model C (Florida, FL, USA), to determine the concentration of RTN in the solution. The volume was kept constant by adding fresh preheated water, and the data were corrected according to the dilutions. Experiments were conducted in triplicate, and sink conditions were maintained for all the experiments.
2.4. UV-Vis Titration
Free RTN (0.09 mg, 0.03 M−3) and increasing concentrations of SBE-β-CD (0.03, 0.09, 0.15, 0.3, 0.9, 1.5, 2.1, 3 × 10⁻³ M) were solubilized in a water/methanol mixture (80:20, v/v) and stirred in the dark at 500 rpm for 24 h, before the analysis. The solutions were analyzed by UV–Vis spectroscopy in the spectral range 200–600 nm using a diode array spectrophotometer, StellarNet BLACK-Comet, Model C (Florida, FL, USA).
2.5. Phase-Solubility Studies
Phase-solubility studies of the RTN/SBE-β-CD system were performed by the Higuchi and Connors method [38]. RTN was added to aqueous solutions containing increasing concentrations of SBE-β-CD (0–12 mM) at concentrations exceeding its intrinsic solubility. The obtained suspensions were left to stir in the dark in a thermostatic bath at 25.0 ±0.5 °C (Telesystem 15.40, Thermo Scientific, USA), equipped with a temperature control unit (Telemodul 40C, Thermo Scientific, USA). After that, the suspensions were filtered through Sartorius Minisart-SRP 15-PTFE filters (0.22 µm, Bedford, USA), and the solutions were diluted with methanol (all final solutions were water/methanol, 80/20, v/v) and analyzed spectrophotometrically to quantify RTN in solution. A calibration curve prepared in water/methanol solution (20/80, v/v) at a λmax of 256 nm, with concentrations ranging from 0.00090 to 0.036 mg/mL, was used, and an R2 value of 0.9953 was obtained.
The experiments were carried out in triplicate to obtain reliable results, and the phase solubility diagrams were constructed. The concentration of SBE-β-CD is represented on the abscissas of these diagrams, while the concentration of RTN in solution is represented on the ordinates. Using the following Higuchi and Connors equation (Eq.1) [38], the apparent 1:1 association constant (Kc) of the complex was calculated, where S0 is the intrinsic water solubility of RTN:
2.6. Wide-Angle X-ray Diffraction (WAXD)
An automatic Bruker D8 Advance diffractometer, with nickel-filtered Cu–Kα radiation, was used to record WAXD patterns of RTN/SBE-β-CD compared to free components and the physical mixture. WAXD patterns were obtained in reflection, in 4°–90° as the 2θ range, being 2θ the peak diffraction angle.
2.7. Thermogravimetric Analysis (TGA)
Thermal properties of the inclusion complex in comparison with the free components and RTN/SBE-β-CD physical mixture were studied using a Perkin Elmer STA 6000 instrument. Analyses were performed according to the standard method ISO9924-1. Samples (5–10 mg) were heated under nitrogen (30 mL min−1) from 30 °C to 300 °C, at a heating rate of 10 °C min−1, kept at 300 °C for 10 min, and then heated up to 550 °C at 20 °C min−1. After being maintained at 550 °C for 15 min, they were further heated up to 900 °C with a heating rate of 10 °C/min and kept at 900 °C for 3 min, then kept at 900 °C for 30 min under flowing air (60 mL/min).
2.8. Fourier-Transform Infrared (FT-IR) Spectroscopy
The FT-IR Nicolet iS5 spectrometer (Nicolet Instrument Corporation, USA) was used to collect FT-IR spectra with a wavenumber ranging from 4000 cm−1 to 400 cm−1. To record the spectra at different temperatures, the samples were analyzed using the same spectrometer equipped with an attenuated total reflection accessory (Pike) on a heatable germanium crystal (up to 120 °C) in transmission mode (64 scan and 4 cm-1 resolution). The chosen temperature range was 25–100 °C, with a heating and cooling rate of 10 °C/min.
2.9. Scanning Electron Microscopy (SEM)
The surface morphologies of free RTN, SBE-β-CD, and the physical mixture and their inclusion complex were investigated through Scanning Electron Microscopy. SEM images were acquired using a Zeiss Evo 50 EP with an operating voltage of 15 kV. All samples were gold-coated using a sputtering system before imaging; a coating of roughly 10 nm was deposited.
2.10. Nuclear Magnetic Resonance Experiments
Samples of equivalent concentrations (9 mM) of RTN, SBE-β-CD, and RTN/SBE-β-CD inclusion complex were prepared in a D2O/CD3OD (7/3, v/v) solution and transferred to 5 mm NMR tubes for spectrum acquisition. All spectra were recorded at 300 K with a Varian Unity Inova 500 MHz (11.75 T) instrument. The residual water peak (4.79 ppm) was used as the internal reference to avoid the addition of external ones that could interact with SBE-β-CD.
2.11. Molecular Modeling Studies
2.11.1. Structures Preparation
3D structure for the SBE-β-CD was not available; then, the structure was built according to our precedent study [39]. 3D coordinates of the RTN molecule were downloaded from Pubchem (https://pubchem.ncbi.nlm.nih.gov/compound/Rutin, accessed on 01/10/2024).
2.11.2. Molecular Dynamics
The molecular dynamics (MD) simulation was made in explicit water using the YASARA Structure package (23.9.29) [40], according to previously reported procedures [41,42]. The RTN and SBE-β-CD force field parameters were generated using the GAFF2 [43] and AM1BCC [44] force fields and TIP3P for water. The cutoff was 10 Å for Van der Waals forces (the default used by AMBER [45], and no cutoff was applied to electrostatic forces (using the Particle Mesh Ewald algorithm [46]z. The equations of motions were integrated with multiple time steps of 2.5 fs for bonded interactions and 5.0 fs for nonbonded interactions at a temperature of 298 K and a pressure of 1 atm (NPT ensemble) using algorithms described in detail previously [47]. The final system dimensions were approximately 30 × 36 × 32 Å3. A short MD simulation was run on the solvent only to remove clashes. The entire system was then energy minimized using the steepest descent minimization to re-move conformational stress, followed by a simulated annealing minimization until convergence (<0.01 kcal/mol Å). Finally, 500 ns of MD simulations without any restrictions were conducted, and the conformations of each system were recorded every 250 ps. After inspection of the solute RMSD as a function of simulation time, the last 3 ns averaged structures were considered for further analysis.
2.11.3. Binding Free Energy Calculation
2.12. In Vitro Antibacterial and Antibiofilm Activity
2.12.1. Strains
The following strains Staphylococcus aureus ATCC 6538, biofilm-producing reference strain [50], S. aureus ATCC 43300 (Methicillin resistant S. aureus-MRSA), Pseudomonas aeruginosa ATCC 9027, P. aeruginosa DSM 102273 (multidrug resistant) were used in this study. The strains were stored in the private collection of the Department of Chemical, Biological, Pharmaceutical and Environmental Sciences, University of Messina (Italy). They were stored at −70 °C in Microbanks™ (Pro-lab Diagnostics, Neston, UK).
2.12.2. Susceptibility Tests
The antibacterial activity of the RTN/SBE-β-CD inclusion complex was evaluated compared with free RTN and SBE-β-CD by determining the minimum inhibitory concentration (MIC) and the minimum bactericidal concentration (MBC) against the strains mentioned above. The MIC was assessed using the broth microdilution method, following the Clinical and Laboratory Standards Institute, with some modifications [51]. An overnight culture in Müeller–Hinton broth for each strain was adjusted to the required inoculum of 1 × 10⁶ enumerate colony-forming units (CFU)/mL. Aliquots of 100 μL of each suspension were inoculated in a 96-well microtiter plate containing a serial 2-fold dilution of free RTN, free SBE-β-CD, RTN/SBE-β-CD inclusion complex or 100 μL medium (growth control). Negative controls (medium + samples) were included. Levofloxacin hydrochloride (LVF) was used as the positive drug control. The bacterial growth was indicated visually and by a developer of enzymatic activity (Triphenyl tetrazolium chloride 0.05%, TTC), revealing bacterial growth by a purple color after 15 min heating at 37 °C. The maximum RTN concentration tested was 1250 μg/mL as soluble RTN/SBE-β-CD inclusion complex, 150 μg/mL for free RTN (maximum solubility) and 8875 μg/mL for free SBE-β-CD, corresponding to the amount present in the assayed inclusion complex. MIC-values, corresponding to the lowest concentration exhibiting no visible bacterial growth, were read after 24 h of incubation at 37 ±1°C. The MBC was determined by plating 10 μL from each well, showing no turbidity onto Müeller–Hinton agar plates. After incubation at proper conditions, MBC was read as the lowest concentration to kill 99.9% of the initial inoculum. All experiments were repeated in triplicate.
2.12.3. Effect on Biofilm Biomass and Viability
The anti-biofilm effect was assessed as described by Cramton et al. [52] with some modifications. Overnight cultures in Tryptic Soy Broth (TSB) with 1% glucose (TSBG) or without were diluted to standardize S. aureus or P. aeruginosa suspensions (1 × 10⁶ CFU/ mL), respectively. Aliquots of 100 μL were dispensed into each well of sterile flat-bottom 96-well polystyrene microtiter plates (Corning Inc., Corning, NY) in the presence of samples at sub-MIC concentrations (0.5 MIC) or 100 μL medium (positive control). Negative controls (medium + samples) were included. The microtiter plates were incubated for 24 h at 37 °C. The medium was then aspirated, and the wells were rinsed twice with phosphate-buffered saline (PBS) and fixed by drying for 1 h. Once the wells were fully dry, 200 μL of 0.1% safranin was added for 5 min. The contents of the wells were then aspirated, and after rinsing with water, 200 μL of 30% acetic acid (v/v) was added to the wells for spectrophotometric analysis. The OD 492 nm value obtained for each strain without a sample was used as the control. The reduction percentage of biofilm biomass formation in the presence of different samples was calculated using the ratio between the values of OD 492 nm with and without samples, adopting the following formula: [(OD control − OD sample)/OD control) × 100]. All experiments were repeated in triplicate.
At the same time, the percent viable biomass was determined by the CFU counting method. Biofilm bacteria were scraped thoroughly from the wells with a pipet tip, particularly concerning the edges. The bacterial suspensions obtained were serially 10-fold diluted, plated on Tryptic Soy Agar plates, and grown for 24 h at 37 °C to enumerate CFU. Viability measures are derived from three separate experiments.
2.13. Statistical Analysis
All values are expressed as mean ± standard deviation (SD), and each analysis was performed three times. The results were analyzed via one-way and two-way analysis of variance (ANOVA) followed by a Bonferroni post hoc test for multiple comparisons. A value of p < 0.05 was considered to be significant.
3. Results and Discussion
3.1. Studies of RTN/SBE-β-CD Characteristics
3.1.1. Dissolution Profiles
The interaction between SBE-β-CD and RTN has been extensively studied in solution and solid state. RTN/SBE-β-CD inclusion complex was prepared by freeze-drying a hydroalcoholic solution containing RTN and SBE-β-CD in a 1:2 molar ratio. Twenty percent (v/v) of MeOH was added to allow complete solubilization of RTN, favoring the complexation. The excess of SBE-β-CD to 1:1 molar ratio was used to maintain the complex in solution.
3.1.2. UV-Vis Spectroscopy Studies
The host-guest interaction between RTN and SBE-β-CD was studied by UV-Vis spectroscopy. In Figure 3, we showed the spectra of free RTN and in the presence of increasing concentrations of SBE-β-CD. RTN shows two very intense bands, the first at 256 nm (Band II) and the second one at 351 nm (Band I) [54], both attributed to the π→π* transitions. Mainly, Mabri et al. [55] attributed the band at 256 nm to the π→π* electronic rearrangement of the phenyl group, while the band at 351 nm to the benzene ring of the pyrocatecholic moiety, which can be regarded as an acyl-disubstituted benzene chromophore. Increasing amounts of SBE-β-CD resulted in a significant variation of the UV-Vis spectrum of RTN. Both absorption bands shifted progressively towards the blue (hypsochromic effect) and increased in intensity (Figure 3). The significant variation of the RTN spectrum observed in the presence of SBE-β-CD and the high value of the apparent association constant highlight a variation of the local polarity of the RTN chromophores which pass from the hydrophilic environment into the apolar cavity of the macrocycle, with a corresponding perturbation of the electronic transition. Furthermore, we cannot exclude that complexation produces the breakdown of the intramolecular hydrogen bonds present in the RTN molecule between the C3-OH oxygen atom with the C4-OH proton of the A ring and between the C3-OH proton of the A ring with the rhamnosidic C2-OH oxygen atom [56], followed by an establishment of other hydrogen bonds between pyrocatecholic moiety of RTN and the sulfobutyl moiety of the CD.
The analysis of the binding stoichiometries was performed by SupraFit software [57]. The results of the Uv-vis titration were analyzed using a 1:1, 2:1/1:1, 1:1/1:2, and a 2:1/1:1/1:2 model as implemented in SupraFit. Each best-fit model was inspected using Monte Carlo simulation to identify the 1:1/1:2 (RTN/SBE-β-CD) as the best-fitted model with a K1:1 of 32267 M−1 and a K1:2 of 12 M−1 with an associated ΔGbinding of −6.6 and −1.5 kcal/mol. Effectively, the almost exclusive complex, in solution, is the 1:1 one, whereas the 1:2 is present in a small amount at a high concentration of SBE-β-CD.
3.1.3. Phase Solubility Studies
Figure 4 shows the phase solubility diagram obtained for RTN in the presence of increasing concentrations of SBE-β-CD. The graph obtained representing RTN concentration vs SBE-β-CD concentration is of AL type, showing that RTN/SBE-β-CD interaction leads to a soluble complex in the range of macrocycle concentrations considered. The slope of the graph is less than one, demonstrating the formation of a complex with 1:1 stoichiometry, and the association constant (Kc) determined following Higuchi and Connors was 9660 M−1. This result is in line with UV-vis titration, which employs a more accurate method.
3.1.4. WAXD, TGA, and FT-IR Analyses
The inclusion complex was characterized at solid state by X-ray diffractometry (WAXD), thermogravimetric analysis (TGA), and Fourier transform infrared spectroscopy (FT-IR).
WAXD patterns obtained for RTN/SBE-β-CD inclusion complex, free components, and RTN/SBE-β-CD physical mixture are shown in Figure 5. RTN shows an intense and sharp peak that evidences its crystalline nature. They were still present in the physical mixture but disappeared in the inclusion complex’s spectrum. This latter showed a broad and diffuse signal without sharp crystalline peaks, indicating the amorphous nature of the complex due to the drug’s inclusion within the SBE-β-CD cavity.
The thermal properties of the RTN/SBE-β-CD inclusion complex, free RTN, SBE-β-CD, and the physical mixture were evaluated by TGA (Figure 6). For SBE-β-CD, the mass loss below 150 °C can be attributed to surface water evaporation associated with the macrocycle. For the RTN/SBE-β-CD inclusion complex, the mass loss in the 150–550 °C range may be related to internal water evaporation and SBE-β-CD or drug degradation. Furthermore, a slight modification of the degradation temperature of the macrocycle in the inclusion complex is highlighted, which would indeed suggest the formation of the inclusion complex in the solid phase. As can be seen, the thermal stability of RTN increases when complexed with SBE-β-CD.
Finally, FT-IR spectroscopy was used to identify the formation of the inclusion complex. The functional groups of the molecules show typical FT-IR absorption bands, and their variations in terms of peak intensity, changes in wavenumbers, disappearance and/or magnification suggest the formation of an inclusion complex [58]. The FT-IR spectra recorded at 25 °C of RTN/SBE-β-CD inclusion complex, free RTN and SBE-β-CD, and of the physical mixture are shown in Figure 7. The RTN spectrum is characterized by stretching vibrations of the hydroxyl groups, and intense bands are observable for the vibrations of the C=O, C=C, C-O, and C-O-C groups. Instead, the spectrum of SBE-β-CD has absorption bands for the hydroxyl groups, -CH and -CH2, and for the C-O-C stretching vibration. In the inclusion complex, some IR drug bands are absent or reduced in intensity, suggesting that RTN is trapped in the macrocycle cavity.
Scanning electron microscopy (SEM) is used in the solid-state characterization of the raw materials and their corresponding physical mixtures and inclusion complexes [58]. This technique is inadequate to identify the formation mechanism of the complex, but it evidences morphological changes related to the interactions between the components [59]. The surface morphologies of free RTN, SBE-β-CD, the physical mixture, and the inclusion complex are shown in Figure 8a–d. Free RTN appeared with crystals of different sizes in rectangular blocks (Figure 8a), while the SBE-β-CD had an almost circular form with a perfectly smooth surface (Figure 8b). Both RTN and SBE-β-CD particles were still evident in the SEM image of the physical mixture. As shown in Figure 8c, the circular particles do not appear perfectly smooth, but a rough, irregular, and opaque surface characterizes this substrate. This different morphology suggests that the drug appears to adhere to the surface of SBE-β-CD in the physical mixture, slightly modifying its structure without interacting with it. On the other hand, the inclusion complex showed drastic changes in particle size and shape of particles. The original morphology of the two pure compounds was lost, while a single solid structure is formed (Figure 8d). Thus, the very different shape and morphology, can be considered as proof that a new structure was present.
3.1.5. NMR Investigation
Nuclear magnetic resonance (NMR) is a fundamental spectroscopic technique to investigate the formation and geometry of the inclusion complexes. During the complexation, the chemical and electronic environments of the protons are modified by the interactions between the host and the guest molecules; therefore, a chemically induced shift of the corresponding protons has been observed. As with most of the substituted CDs, the SBE-β-CD, unfortunately, is a statistical mixture of the different stereoisomers with unresolved broad peaks, making it almost impossible to follow the chemical shifts of its protons, mainly H-3 and H-5 protons facing the inside of the cavity, although these were identified through 2D COSY spectra [60]. All the RTN protons displayed chemical shifts between 6.30 and 7.67 ppm, which are free and more evident compared to the broad and unsolved peaks of SBE-β-CD proton (mainly at δ 3–4 ppm). Therefore, the RTN/SBE-β-CD inclusion complex formation was deduced from the chemical shift changes observed in 1H NMR of the RTN aromatic protons previously measured in the free state. The enumeration of the RTN structure is shown in Figure 9, together with the stacked portions of the 1H NMR spectra of RTN and RTN/SBE-β-CD inclusion complex. In Table 1, we reported the chemical shift of free and complexed RTN in a 1:1 molar ratio with SBE-β-CD.
The chemical shift changes of the RTN aromatic protons are diagnostics. The H-6 and H-8 protons of the RTN A ring resonate at 6.30 and 6.49 ppm, while H-2ʹ, H-5ʹ, and H-6ʹ B ring protons have chemical shifts at 7.67, 6.98, and 7.61 ppm, respectively. The inclusion of RTN in the SBE-β-CD hydrophobic cavity was confirmed by changes in the chemical shifts of the guest and host protons, observed in the RTN/SBE-β-CD inclusion complex spectrum, in comparison with the chemical shift observed for the same protons in the free RTN.
In the RTN/SBE-β-CD spectrum of the complex (performed in a 7:3 D2O/CD3OD solution), significant changes were observed in the chemical shifts of H-8 RTN proton (∆δ 1.07) due to the proximity to the oxygen atom of the 1,4-glycosidic bonds between the seven glucopyranose units which constitute the SBE-β-CD molecule. Other interesting changes were observed for RTN protons H-6, H-2ʹ, and H–5ʹ in the RTN/SBE-β-CD complex spectrum (Table 2). From these results, it can be assumed that the RTN benzopyranone skeleton (Figure 10) was incorporated in the SBE-β-CD hydrophobic cavity.
The changes observed for H-2ʹ, H-5ʹ, and H–6ʹ protons of the RTN ring B indicate that this latter is probably in close contact with the sulfobutylether groups [31].
3.1.6. Molecular Modeling Studies
In order to investigate the RTN/SBE-β-CD host-guest interactions, we started the molecular modeling study docking the RTN into the SBE-β-CD hydrophobic cavity, as described in the SI. From the 10 most stable docked poses, the two that corresponded to the orientation of ring A or B within the hydrophobic cavity from the secondary edge were selected. These two complexes were subjected to a 500 ns molecular dynamics simulation. The analysis of the two simulations showed that after about 100 ns, the molecule of RTN is stabilized into the SBE-β-CD cavity. Once inside the host molecule, the RTN establishes interactions that stabilize the complex and for the entire simulation time (500 ns) stays inside the CD, maintaining the same orientation. On all the trajectories of the MD simulation, we performed an MM/PBSA calculation to obtain the binding energy and, consequently, to select the most stable complex structures for both A and B ring orientations. Of these two optimized structures, ring A inside the RTN/SBE-β-CD hydrophobic cavity resulted in the most stability. This last structure, reported in Figure 10, is consistent with the complex geometry deduced by the NMR experiments. The A ring is fully inserted into the cavity and justifies the high shift registered for the H-8; even the C ring is partially inserted into the cavity, in line with the H2’ and H6’ shifts. Finally, the methyl group in one of the sugar rings is located between two of the seven sulfonic groups to deshield it; this also agrees with the magnitude of the low-field shift observed in NMR analysis. This structure is stabilized by two hydrogen bonds between two hydroxyl moieties of the sugar rings that interact with one of the alcoholic oxygens of the secondary rim and with one of the sulphonic oxygens, respectively.
3.2. Antibacterial and Biofilm Activity
3.2.1. Bacterial Susceptibility
The antibacterial activity of the RTN/SBE-β-CD inclusion complex compared to free RTN and SBE-β-CD was assayed against S. aureus and P. aeruginosa, including resistant strains. The activity of the samples was assayed by minimum inhibitory concentration (MIC) and minimum bactericidal concentration (MBC) methods. Due to its minimal solubility, free RTN was assayed at 150 μg/mL; higher concentrations rapidly precipitated in the culture medium. Several authors demonstrated the antibacterial activity of free RTN, although different MIC values were reported on the same strains [61,62]. Among the possible reasons, the different MIC values obtained can be due to solubility issues leading to poorly defined concentrations. When complexed with the macrocycle, RTN significantly increases its water solubility; thus, a higher concentration of complexed RTN (1250 μg/mL) can be assayed to the free drug. As reported in Table 2, free RTN showed bacteriostatic activity against S. aureus ATCC 6538 and P. aeruginosa ATCC 9027 with MIC values of 75 and 150 μg/mL, respectively. No activity was observed against resistant strains. As demonstrated by other authors, the RTN activity could be due to several mechanisms, such as damage to the bacterial cell membrane [28], inhibition of nucleic acid synthesis [63], of the action of efflux pumps [64], of toxin formation and biofilm production [65]. As expected, free SBE-β-CD showed no activity against all the tested strains. Interesting results were obtained for the RTN/SBE-β-CD inclusion complex. The presence of macrocycle increased RTN effectiveness against all tested strains. Complexed RTN showed bactericidal activity against S. aureus ATCC 6538 and ATCC 43300 (MRSA) at a concentration of 4.88 μg/mL and against P. aeruginosa ATCC 9027 at 39.06 μg/mL. Furthermore, it showed bacteriostatic activity against P. aeruginosa DSM 102273 resistant strain with a MIC value of 1250 μg/mL. These results could depend not only on the increased solubility of RTN by the complexation but also on the permeabilization of the bacterial wall produced by the macrocycle [35].
3.2.2. Antibiofilm Effect
Biofilms are communities of microorganisms in nature that are attached to a biological or abiotic surface and are surrounded by a self-generated extracellular matrix mainly composed of polysaccharides, secreted proteins, and extracellular DNA. It is considered an important virulence factor of chronic infections [66]. The most common bacterial pathogens associated with different types of eye surface infections, including keratitis, dacryocystitis, blepharokeratoconjunctivitis, and conjunctivitis, are S. aureus and P. aeruginosa [37]. Chronic S. aureus and P. aeruginosa ocular infections associated with biofilms have become increasingly difficult to treat with current antimicrobials [37,67,68].
The activity of the RTN/SBE-β-CD inclusion complex compared to free RTN and SBE-β-CD against biofilm formation was measured by the crystal violet method and CFU assay. Free RTN and free SBE-β-CD showed no antibiofilm effect against all strains at 0.5 MIC concentration (Figure 11a and Figure 12a). The inclusion complex significantly decreased biofilm biomass production at 0.5 MIC against S. aureus ATCC 6538 (Biofilm reduction 57%) and S. aureus MRSA (Biofilm reduction 41%). The percentage of inhibition was found to be statistically significant compared with the negative control at p< 0.05 for S. aureus ATCC 6538 and at p< 0.01 for S. aureus MRSA (Figure 11a and Figure 12a). RTN/SBE-β-CD inclusion complex showed no inhibitory effect on biofilm production against P. aeruginosa strains at 0.5 MIC concentration, equivalent to 0.25 μg/mL and 62.5 μg/mL for P. aeruginosa ATCC 9027 and P. aeruginosa DSM 102273, respectively.
The sub-inhibitory concentrations of inclusion complex against S. aureus strains showed a significant reduction of biofilm cell viability. As shown in Figure 11b and Figure 12b, the inclusion complex reduced the viability of S. aureus ATCC 6538 of 2 log10 units (p< 0.0001), while that of S. aureus MRSA of 3.6 log10 units (p< 0.0001). The results demonstrated that the inclusion complex had significant antibiofilm activity against S. aureus strains with reduced viability cells.
5. Conclusions
In this study, we demonstrated the ability of SBE-β-CD to complex the natural drug RTN, improving its water solubility and dissolution and potentiating its antibacterial effect. As in-solution and solid-state investigation demonstrated, a stable inclusion complex in a 1:1 molar ratio was formed. The complexation potentiates the antibacterial activity of RTN against Gram-positive and Gram-negative strains. Remarkably, the MIC and MBC of complexed RTN are 60 times and 30 times higher than the free drug against S. aureus ATCC 6538. The complexed RTN shows similar high activity against S. aureus ATCC 43300 (MRSA), while free RTN shows no activity. The macrocycle increases the antibacterial activity of RTN, even if less intense, towards the Gram-negative P. aeruginosa ATCC 9027. Furthermore, the inclusion complex had significant antibiofilm activity against S. aureus strains, reducing viability cells, while no antibiofilm activity was detected for free RTN.
Our results suggest that SBE-β-CD could be a suitable carrier for RTN, permitting the realization of liquid formulation for ophthalmic administration with antibacterial properties and representing a good starting point for our successive in vitro and in vivo investigations.
Author Contributions
Conceptualization, A.M. and C.A.V.; methodology, A.M. and C.A.V.; software, A.R.; validation, A.R.; investigation, F.D.G., F.M., V.B. V.P., A.R. and M.P.; visualization, V.P. A.R.; data curation, F.D.G., V.B., M.P., V.P. and A.R.; writing—original draft preparation, A.M., F.D.G., V.P. and A.R.; writing—review and editing, A.M., A.R., V.P. and C.A.V.; supervision, A.M. and C.A.V. All authors have read and agreed to the published version of the manuscript.
Funding
this research received no external funding.
Institutional Review Board Statement
Not applicable
Informed Consent Statement
Not applicable
Data Availability Statement
Data are contained within the article.
Conflicts of Interest
The authors declare no conflict of interest.
References
- Snyder, R.W.; Glasser, D.B. Antibiotic Therapy for Ocular Infection. West J Med 1994, 161, 579–584. [Google Scholar] [PubMed]
- Grandi, G.; Bianco, G.; Boattini, M.; Scalabrin, S.; Iannaccone, M.; Fea, A.; Cavallo, R.; Costa, C. Bacterial Etiology and Antimicrobial Resistance Trends in Ocular Infections: A 30-Year Study, Turin Area, Italy. Eur J Ophthalmol 2021, 31, 405–414. [Google Scholar] [CrossRef] [PubMed]
- Manente, R.; Santella, B.; Pagliano, P.; Santoro, E.; Casolaro, V.; Borrelli, A.; Capunzo, M.; Galdiero, M.; Franci, G.; Boccia, G. Prevalence and Antimicrobial Resistance of Causative Agents to Ocular Infections. Antibiotics (Basel) 2022, 11, 463. [Google Scholar] [CrossRef] [PubMed]
- Bale, B.I.; Elebesunu, E.E.; Manikavasagar, P.; Agwuna, F.O.; Ogunkola, I.O.; Sow, A.U.; Lucero-Prisno, D.E. Antibiotic Resistance in Ocular Bacterial Infections: An Integrative Review of Ophthalmic Chloramphenicol. Tropical Medicine and Health 2023, 51, 15. [Google Scholar] [CrossRef] [PubMed]
- Ventola, C.L. The Antibiotic Resistance Crisis. P T 2015, 40, 277–283. [Google Scholar] [PubMed]
- The Antibiotic Alarm. Nature 2013, 495, 141–141. [CrossRef] [PubMed]
- Bartlett, J.G.; Gilbert, D.N.; Spellberg, B. Seven Ways to Preserve the Miracle of Antibiotics. Clin Infect Dis 2013, 56, 1445–1450. [Google Scholar] [CrossRef] [PubMed]
- Piddock, L.J.V. The Crisis of No New Antibiotics--What Is the Way Forward? Lancet Infect Dis 2012, 12, 249–253. [Google Scholar] [CrossRef]
- Høiby, N.; Bjarnsholt, T.; Givskov, M.; Molin, S.; Ciofu, O. Antibiotic Resistance of Bacterial Biofilms. International Journal of Antimicrobial Agents 2010, 35, 322–332. [Google Scholar] [CrossRef]
- Uruén, C.; Chopo-Escuin, G.; Tommassen, J.; Mainar-Jaime, R.C.; Arenas, J. Biofilms as Promoters of Bacterial Antibiotic Resistance and Tolerance. Antibiotics 2020, 10, 3. [Google Scholar] [CrossRef]
- Asbell, P.A.; Sanfilippo, C.M.; Sahm, D.F.; DeCory, H.H. Trends in Antibiotic Resistance Among Ocular Microorganisms in the United States From 2009 to 2018. JAMA Ophthalmology 2020, 138, 439–450. [Google Scholar] [CrossRef] [PubMed]
- Sharma, S. Antibiotic Resistance in Ocular Bacterial Pathogens. Indian J Med Microbiol 2011, 29, 218–222. [Google Scholar] [CrossRef]
- Di Marzio, L.; Ventura, C.A.; Cosco, D.; Paolino, D.; Di Stefano, A.; Stancanelli, R.; Tommasini, S.; Cannavà, C.; Celia, C.; Fresta, M. Nanotherapeutics for Anti-Inflammatory Delivery. Journal of Drug Delivery Science and Technology 2016, 32, 174–191. [Google Scholar] [CrossRef]
- Fraga, C.G.; Croft, K.D.; Kennedy, D.O.; Tomás-Barberán, F.A. The Effects of Polyphenols and Other Bioactives on Human Health. Food Funct. 2019, 10, 514–528. [Google Scholar] [CrossRef] [PubMed]
- Kumar, S.; Pandey, A.K. Chemistry and Biological Activities of Flavonoids: An Overview. The Scientific World Journal 2013, 2013, 1–16. [Google Scholar] [CrossRef]
- Bonincontro, G.; Scuderi, S.A.; Marino, A.; Simonetti, G. Synergistic Effect of Plant Compounds in Combination with Conventional Antimicrobials against Biofilm of Staphylococcus Aureus, Pseudomonas Aeruginosa, and Candida Spp. Pharmaceuticals (Basel) 2023, 16, 1531. [Google Scholar] [CrossRef] [PubMed]
- Rodríguez De Luna, S.L.; Ramírez-Garza, R.E.; Serna Saldívar, S.O. Environmentally Friendly Methods for Flavonoid Extraction from Plant Material: Impact of Their Operating Conditions on Yield and Antioxidant Properties. The Scientific World Journal 2020, 2020, 1–38. [Google Scholar] [CrossRef]
- Jucá, M.M.; Cysne Filho, F.M.S.; De Almeida, J.C.; Mesquita, D.D.S.; Barriga, J.R.D.M.; Dias, K.C.F.; Barbosa, T.M.; Vasconcelos, L.C.; Leal, L.K.A.M.; Ribeiro, J.E.; Vasconcelos, S.M.M. Flavonoids: Biological Activities and Therapeutic Potential. Natural Product Research 2020, 34, 692–705. [Google Scholar] [CrossRef] [PubMed]
- D’Amelia, V.; Aversano, R.; Chiaiese, P.; Carputo, D. The Antioxidant Properties of Plant Flavonoids: Their Exploitation by Molecular Plant Breeding. Phytochem Rev 2018, 17, 611–625. [Google Scholar] [CrossRef]
- Dias, M.C.; Pinto, D.C.G.A.; Silva, A.M.S. Plant Flavonoids: Chemical Characteristics and Biological Activity. Molecules 2021, 26, 5377. [Google Scholar] [CrossRef]
- Silva, P.; Bonifácio, B.; Ramos, M.; Negri, K.; Maria Bauab, T.; Chorilli, M. Nanotechnology-Based Drug Delivery Systems and Herbal Medicines: A Review. IJN 2013, 1. [Google Scholar] [CrossRef] [PubMed]
- Ganeshpurkar, A.; Saluja, A.K. The Pharmacological Potential of Rutin. Saudi Pharmaceutical Journal 2017, 25, 149–164. [Google Scholar] [CrossRef] [PubMed]
- Gullón, B.; Lú-Chau, T.A.; Moreira, M.T.; Lema, J.M.; Eibes, G. Rutin: A Review on Extraction, Identification and Purification Methods, Biological Activities and Approaches to Enhance Its Bioavailability. Trends in Food Science & Technology 2017, 67, 220–235. [Google Scholar] [CrossRef]
- Mariana K.A., Araruna; Samara A., Brito; Maria, F.B. Morais-Braga; Karla K.A. Santos; Teogenes M. Souza; Tiago R. Leite; Jose G.M. Costa; Henrique D.M. Coutinho Evaluation of Antibiotic & Antibiotic Modifying Activity of Pilocarpine & Rutin. Indian J Med Res. 2012, 135, 252–254. [Google Scholar]
- Pimentel, R.B.D.Q.; Da Costa, C.A.; Albuquerque, P.M.; Junior, S.D. Antimicrobial Activity and Rutin Identification of Honey Produced by the Stingless Bee Melipona Compressipes Manaosensis and Commercial Honey. BMC Complement Altern Med 2013, 13, 151. [Google Scholar] [CrossRef] [PubMed]
- Ganeshpurkar, A.; Bansal, D.; Dubey, S.; Dubey, N. Experimental Studies on Bioactive Potential of Rutin. Chron Young Sci 2013, 4, 153. [Google Scholar] [CrossRef]
- Ivanov, M.; Novović, K.; Malešević, M.; Dinić, M.; Stojković, D.; Jovčić, B.; Soković, M. Polyphenols as Inhibitors of Antibiotic Resistant Bacteria—Mechanisms Underlying Rutin Interference with Bacterial Virulence. Pharmaceuticals 2022, 15, 385. [Google Scholar] [CrossRef] [PubMed]
- Amin, M.U.; Khurram, M.; Khattak, B.; Khan, J. Antibiotic Additive and Synergistic Action of Rutin, Morin and Quercetin against Methicillin Resistant Staphylococcus Aureus. BMC Complement Altern Med 2015, 15, 59. [Google Scholar] [CrossRef] [PubMed]
- Arima, H.; Ashida, H.; Danno, G. Rutin-Enhanced Antibacterial Activities of Flavonoids against Bacillus Cereus and Salmonella Enteritidis. Bioscience, Biotechnology, and Biochemistry 2002, 66, 1009–1014. [Google Scholar] [CrossRef] [PubMed]
- Kang, J.; Lu, X.; Zeng, H.; Liu, H.; Lu, B. Investigation on the Electrochemistry of Rutin and Its Analytical Application. Analytical Letters 2002, 35, 677–686. [Google Scholar] [CrossRef]
- De Gaetano, F.; Margani, F.; Barbera, V.; D’Angelo, V.; Germanò, M.P.; Pistarà, V.; Ventura, C.A. Characterization and In Vivo Antiangiogenic Activity Evaluation of Morin-Based Cyclodextrin Inclusion Complexes. Pharmaceutics 2023, 15, 2209. [Google Scholar] [CrossRef]
- De Gaetano, F.; Cristiano, M.C.; Paolino, D.; Celesti, C.; Iannazzo, D.; Pistarà, V.; Iraci, N.; Ventura, C.A. Bicalutamide Anticancer Activity Enhancement by Formulation of Soluble Inclusion Complexes with Cyclodextrins. Biomolecules 2022, 12, 1716. [Google Scholar] [CrossRef] [PubMed]
- De Gaetano, F.; Scala, A.; Celesti, C.; Lambertsen Larsen, K.; Genovese, F.; Bongiorno, C.; Leggio, L.; Iraci, N.; Iraci, N.; Mazzaglia, A.; Ventura, C.A. Amphiphilic Cyclodextrin Nanoparticles as Delivery System for Idebenone: A Preformulation Study. Molecules 2023, 28, 3023. [Google Scholar] [CrossRef] [PubMed]
- Musumeci, T.; Bonaccorso, A.; De Gaetano, F.; Larsen, K.L.; Pignatello, R.; Mazzaglia, A.; Puglisi, G.; Ventura, C.A. A Physico-Chemical Study on Amphiphilic Cyclodextrin/Liposomes Nanoassemblies with Drug Carrier Potential. J Liposome Res 2020, 30, 407–416. [Google Scholar] [CrossRef] [PubMed]
- Saha, P.; Rafe, M.R. Cyclodextrin: A Prospective Nanocarrier for the Delivery of Antibacterial Agents against Bacteria That Are Resistant to Antibiotics. Heliyon 2023, 9, e19287. [Google Scholar] [CrossRef] [PubMed]
- Zhang, G.; Yuan, C.; Sun, Y. Effect of Selective Encapsulation of Hydroxypropyl-β-Cyclodextrin on Components and Antibacterial Properties of Star Anise Essential Oil. Molecules 2018, 23, 1126. [Google Scholar] [CrossRef] [PubMed]
- Shah, S.; Wozniak, R.A.F. Staphylococcus Aureus and Pseudomonas Aeruginosa Infectious Keratitis: Key Bacterial Mechanisms That Mediate Pathogenesis and Emerging Therapeutics. Front Cell Infect Microbiol 2023, 13, 1250257. [Google Scholar] [CrossRef] [PubMed]
- Higuchi, T.; Connors, K. A. “Phase Solubility Techniques,” Advanced Analytical Chemistry of Instrumentation, Vol. 4, 1965, Pp. 117-212. - References - Scientific Research Publishing. Available online: https://www.scirp.org/(S(i43dyn45teexjx455qlt3d2q))/reference/ReferencesPapers.aspx?ReferenceID=1706 36 (accessed on 3 May 2023).
- Rescifina, A.; Surdo, E.; Cardile, V.; Avola, R.; Eleonora Graziano, A.C.; Stancanelli, R.; Tommasini, S.; Pistarà, V.; Ventura, C.A. Gemcitabine Anticancer Activity Enhancement by Water Soluble Celecoxib/Sulfobutyl Ether-β-Cyclodextrin Inclusion Complex. Carbohydrate Polymers 2019, 206, 792–800. [Google Scholar] [CrossRef]
- Krieger, E.; Vriend, G. YASARA View - Molecular Graphics for All Devices - from Smartphones to Workstations. Bioinformatics 2014, 30, 2981–2982. [Google Scholar] [CrossRef] [PubMed]
- Gentile, D.; Floresta, G.; Patamia, V.; Chiaramonte, R.; Mauro, G.L.; Rescifina, A.; Vecchio, M. An Integrated Pharmacophore/Docking/3D-QSAR Approach to Screening a Large Library of Products in Search of Future Botulinum Neurotoxin A Inhibitors. Int J Mol Sci 2020, 21, 9470. [Google Scholar] [CrossRef]
- Floresta, G.; Patamia, V.; Gentile, D.; Molteni, F.; Santamato, A.; Rescifina, A.; Vecchio, M. Repurposing of FDA-Approved Drugs for Treating Iatrogenic Botulism: A Paired 3D-QSAR/Docking Approach†. ChemMedChem 2020, 15, 256–262. [Google Scholar] [CrossRef] [PubMed]
- Wang, J.; Wolf, R.M.; Caldwell, J.W.; Kollman, P.A.; Case, D.A. Development and Testing of a General Amber Force Field. J Comput Chem 2004, 25, 1157–1174. [Google Scholar] [CrossRef] [PubMed]
- Jakalian, A.; Jack, D.B.; Bayly, C.I. Fast, Efficient Generation of High-Quality Atomic Charges. AM1-BCC Model: II. Parameterization and Validation. J Comput Chem 2002, 23, 1623–1641. [Google Scholar] [CrossRef] [PubMed]
- Hornak, V.; Abel, R.; Okur, A.; Strockbine, B.; Roitberg, A.; Simmerling, C. Comparison of Multiple Amber Force Fields and Development of Improved Protein Backbone Parameters. Proteins 2006, 65, 712–725. [Google Scholar] [CrossRef] [PubMed]
- Essmann, U.; Perera, L.; Berkowitz, M.L.; Darden, T.; Lee, H.; Pedersen, L.G. A Smooth Particle Mesh Ewald Method. The Journal of Chemical Physics 1995, 103, 8577–8593. [Google Scholar] [CrossRef]
- Krieger, E.; Vriend, G. New Ways to Boost Molecular Dynamics Simulations. J Comput Chem 2015, 36, 996–1007. [Google Scholar] [CrossRef]
- Genheden, S.; Ryde, U. The MM/PBSA and MM/GBSA Methods to Estimate Ligand-Binding Affinities. Expert Opin Drug Discov 2015, 10, 449–461. [Google Scholar] [CrossRef] [PubMed]
- Wongpituk, P.; Nutho, B.; Panman, W.; Kungwan, N.; Wolschann, P.; Rungrotmongkol, T.; Nunthaboot, N. Structural Dynamics and Binding Free Energy of Neral-Cyclodextrins Inclusion Complexes: Molecular Dynamics Simulation. Molecular Simulation 2017, 43, 1356–1363. [Google Scholar] [CrossRef]
- Azzam, A.; Shawky, R.M.; El-Mahdy, T.S. Sub-Inhibitory Concentrations of Ceftriaxone Induce Morphological Alterations and PIA-Independent Biofilm Formation in Staphylococcus Aureus. Braz J Microbiol 2023. [Google Scholar] [CrossRef]
- Weinstein, M.P.; Patel, J.B. Methods for Dilution Antimicrobial Susceptibility Tests for Bacteria That Grow Aerobically: M07-A11; Documents / Clinical and Laboratory Standards Institute; 11. edition; Committee for Clinical Laboratory Standards: Wayne, PA, 2018; ISBN 978-1-56238-836-2. [Google Scholar]
- Cramton, S.E.; Gerke, C.; Schnell, N.F.; Nichols, W.W.; Götz, F. The Intercellular Adhesion (Ica) Locus Is Present in Staphylococcus Aureus and Is Required for Biofilm Formation. Infect Immun 1999, 67, 5427–5433. [Google Scholar] [CrossRef]
- Frutos, M.J.; Rincón-Frutos, L.; Valero-Cases, E. Chapter 2.14 - Rutin. In Nonvitamin and Nonmineral Nutritional Supplements; Nabavi, S.M., Silva, A.S., Eds.; Academic Press, 2019; pp. 111–117. ISBN 978-0-12-812491-8. [Google Scholar]
- Calabrò, M.L.; Tommasini, S.; Donato, P.; Stancanelli, R.; Raneri, D.; Catania, S.; Costa, C.; Villari, V.; Ficarra, P.; Ficarra, R. The Rutin/β-Cyclodextrin Interactions in Fully Aqueous Solution: Spectroscopic Studies and Biological Assays. Journal of Pharmaceutical and Biomedical Analysis 2005, 36, 1019–1027. [Google Scholar] [CrossRef] [PubMed]
- Mabry, T.; Markham, K.R.; Thomas, M.B. The Systematic Identification of Flavonoids; Springer Science & Business Media, 2012; ISBN 978-3-642-88458-0. [Google Scholar]
- Payán-Gómez, S.A.; Flores-Holguín, N.; Pérez-Hernández, A.; Piñón-Miramontes, M.; Glossman-Mitnik, D. Computational Molecular Characterization of the Flavonoid Rutin. Chemistry Central Journal 2010, 4, 12. [Google Scholar] [CrossRef] [PubMed]
- Hübler, C. SupraFit – An Open Source Qt Based Fitting Application to Determine Stability Constants from Titration Experiments**. Chemistry–Methods 2022, 2, e202200006. [Google Scholar] [CrossRef]
- Mura, P. Analytical Techniques for Characterization of Cyclodextrin Complexes in the Solid State: A Review. J Pharm Biomed Anal 2015, 113, 226–238. [Google Scholar] [CrossRef]
- Kringel, D.H.; Antunes, M.D.; Klein, B.; Crizel, R.L.; Wagner, R.; de Oliveira, R.P.; Dias, A.R.G.; Zavareze, E. da R. Production, Characterization, and Stability of Orange or Eucalyptus Essential Oil/β-Cyclodextrin Inclusion Complex. J Food Sci 2017, 82, 2598–2605. [Google Scholar] [CrossRef] [PubMed]
- De Gaetano, F.; Marino, A.; Marchetta, A.; Bongiorno, C.; Zagami, R.; Cristiano, M.C.; Paolino, D.; Pistarà, V.; Ventura, C.A. Development of Chitosan/Cyclodextrin Nanospheres for Levofloxacin Ocular Delivery. Pharmaceutics 2021, 13, 1293. [Google Scholar] [CrossRef] [PubMed]
- Miklasińska-Majdanik, M.; Kępa, M.; Wąsik, T.J.; Zapletal-Pudełko, K.; Klim, M.; Wojtyczka, R.D. The Direction of the Antibacterial Effect of Rutin Hydrate and Amikacin. Antibiotics (Basel) 2023, 12, 1469. [Google Scholar] [CrossRef] [PubMed]
- Paczkowska, M.; Mizera, M.; Piotrowska, H.; Szymanowska-Powałowska, D.; Lewandowska, K.; Goscianska, J.; Pietrzak, R.; Bednarski, W.; Majka, Z.; Cielecka-Piontek, J. Complex of Rutin with β-Cyclodextrin as Potential Delivery System. PLoS One 2015, 10, e0120858. [Google Scholar] [CrossRef] [PubMed]
- Bernard, F.X.; Sablé, S.; Cameron, B.; Provost, J.; Desnottes, J.F.; Crouzet, J.; Blanche, F. Glycosylated Flavones as Selective Inhibitors of Topoisomerase IV. Antimicrob Agents Chemother 1997, 41, 992–998. [Google Scholar] [CrossRef]
- Jhanji, R.; Bhati, V.; Singh, A.; Kumar, A. Phytomolecules against Bacterial Biofilm and Efflux Pump: An in Silico and in Vitro Study. J Biomol Struct Dyn 2020, 38, 5500–5512. [Google Scholar] [CrossRef]
- Wang, Z.; Ding, Z.; Li, Z.; Ding, Y.; Jiang, F.; Liu, J. Antioxidant and Antibacterial Study of 10 Flavonoids Revealed Rutin as a Potential Antibiofilm Agent in Klebsiella Pneumoniae Strains Isolated from Hospitalized Patients. Microb Pathog 2021, 159, 105121. [Google Scholar] [CrossRef] [PubMed]
- Diriba, K.; Kassa, T.; Alemu, Y.; Bekele, S. In Vitro Biofilm Formation and Antibiotic Susceptibility Patterns of Bacteria from Suspected External Eye Infected Patients Attending Ophthalmology Clinic, Southwest Ethiopia. Int J Microbiol 2020, 2020, 8472395. [Google Scholar] [CrossRef] [PubMed]
- Verderosa, A.D.; Totsika, M.; Fairfull-Smith, K.E. Bacterial Biofilm Eradication Agents: A Current Review. Front Chem 2019, 7, 824. [Google Scholar] [CrossRef] [PubMed]
- Vazquez, N.M.; Mariani, F.; Torres, P.S.; Moreno, S.; Galván, E.M. Cell Death and Biomass Reduction in Biofilms of Multidrug Resistant Extended Spectrum β-Lactamase-Producing Uropathogenic Escherichia Coli Isolates by 1,8-Cineole. PLoS One 2020, 15, e0241978. [Google Scholar] [CrossRef] [PubMed]
Figure 1.
Molecular structure of RTN (left) and schematic structure of SBE-β-CD (right).
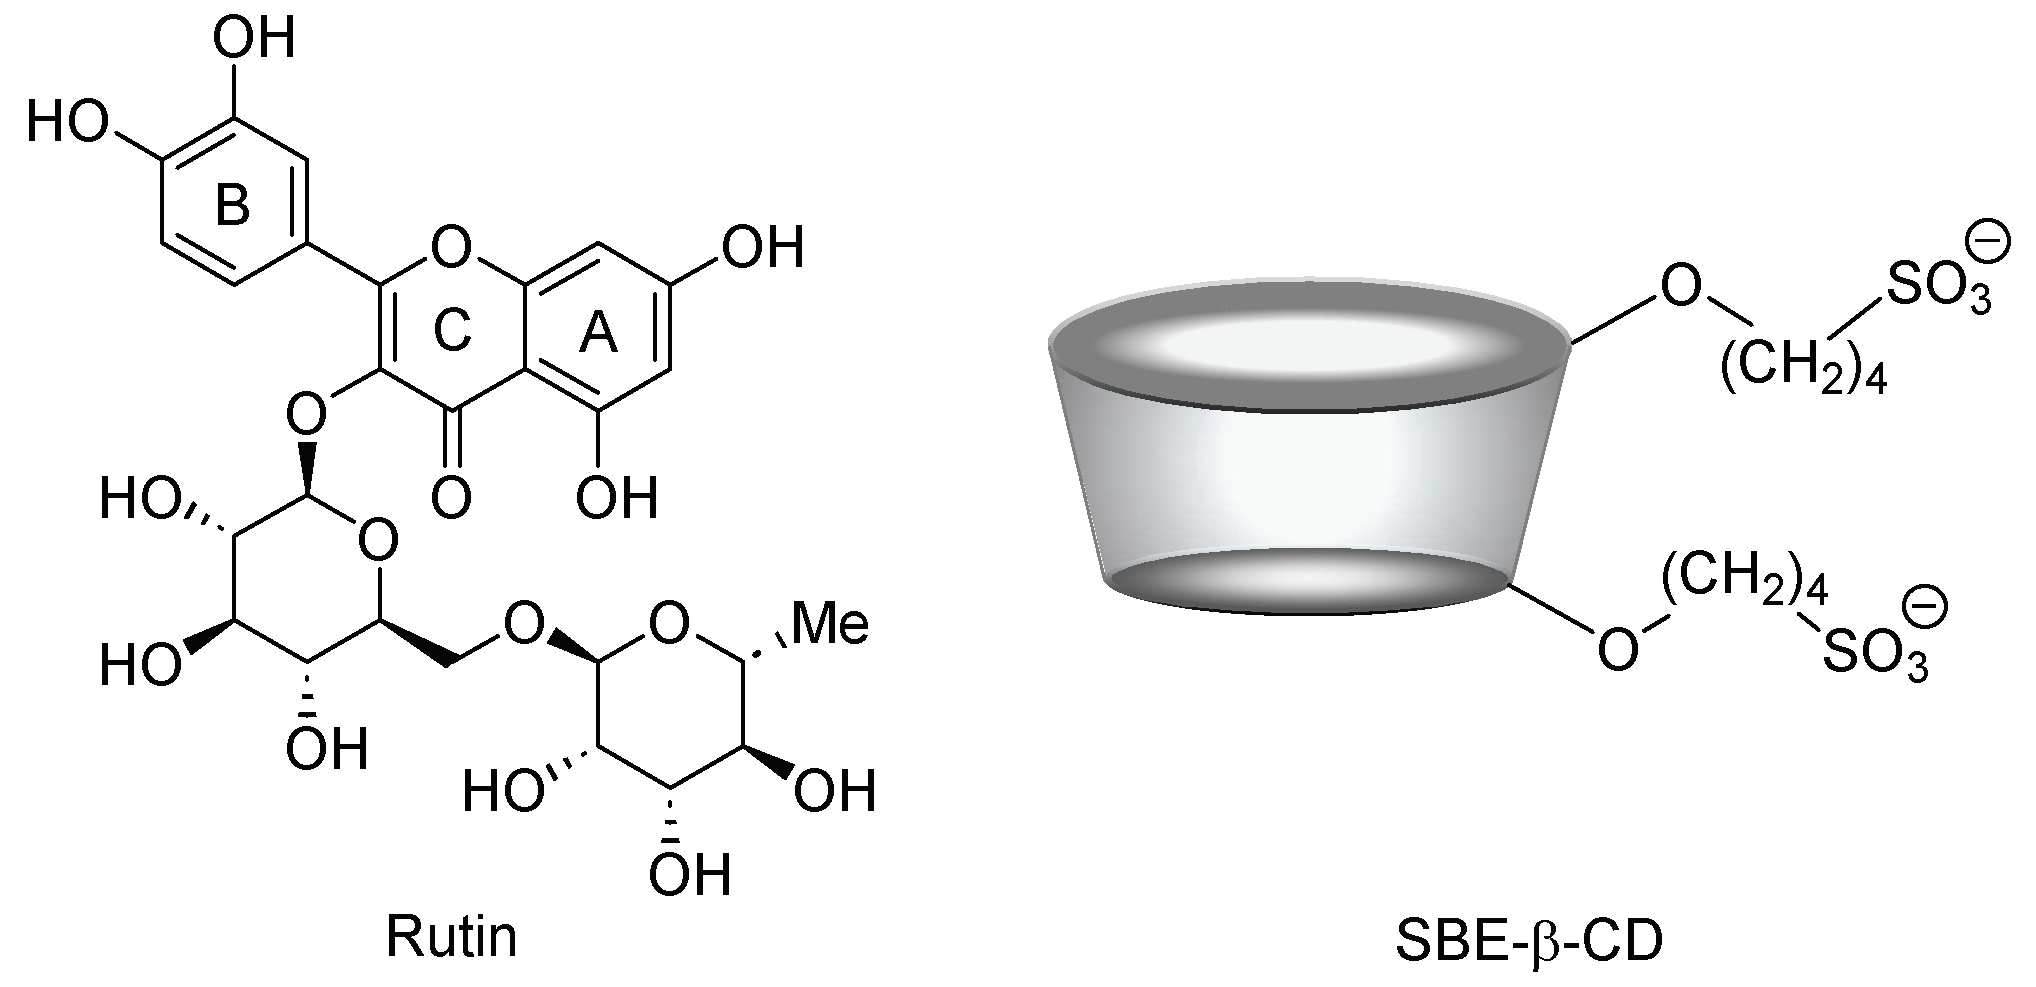
Figure 2.
Dissolution profiles of free RTN (green line) and RTN/SBE-β-CD inclusion complex (orange line) in water at 25.0 ± 0.5 °C. All values of the inclusion complex are statistically significant compared to free RTN data (*** p < 0.001). The experiments were carried out in triplicate. The results are presented as the mean of three experiments ± standard deviation (SD). The error bar, if not shown, is inside the symbol.
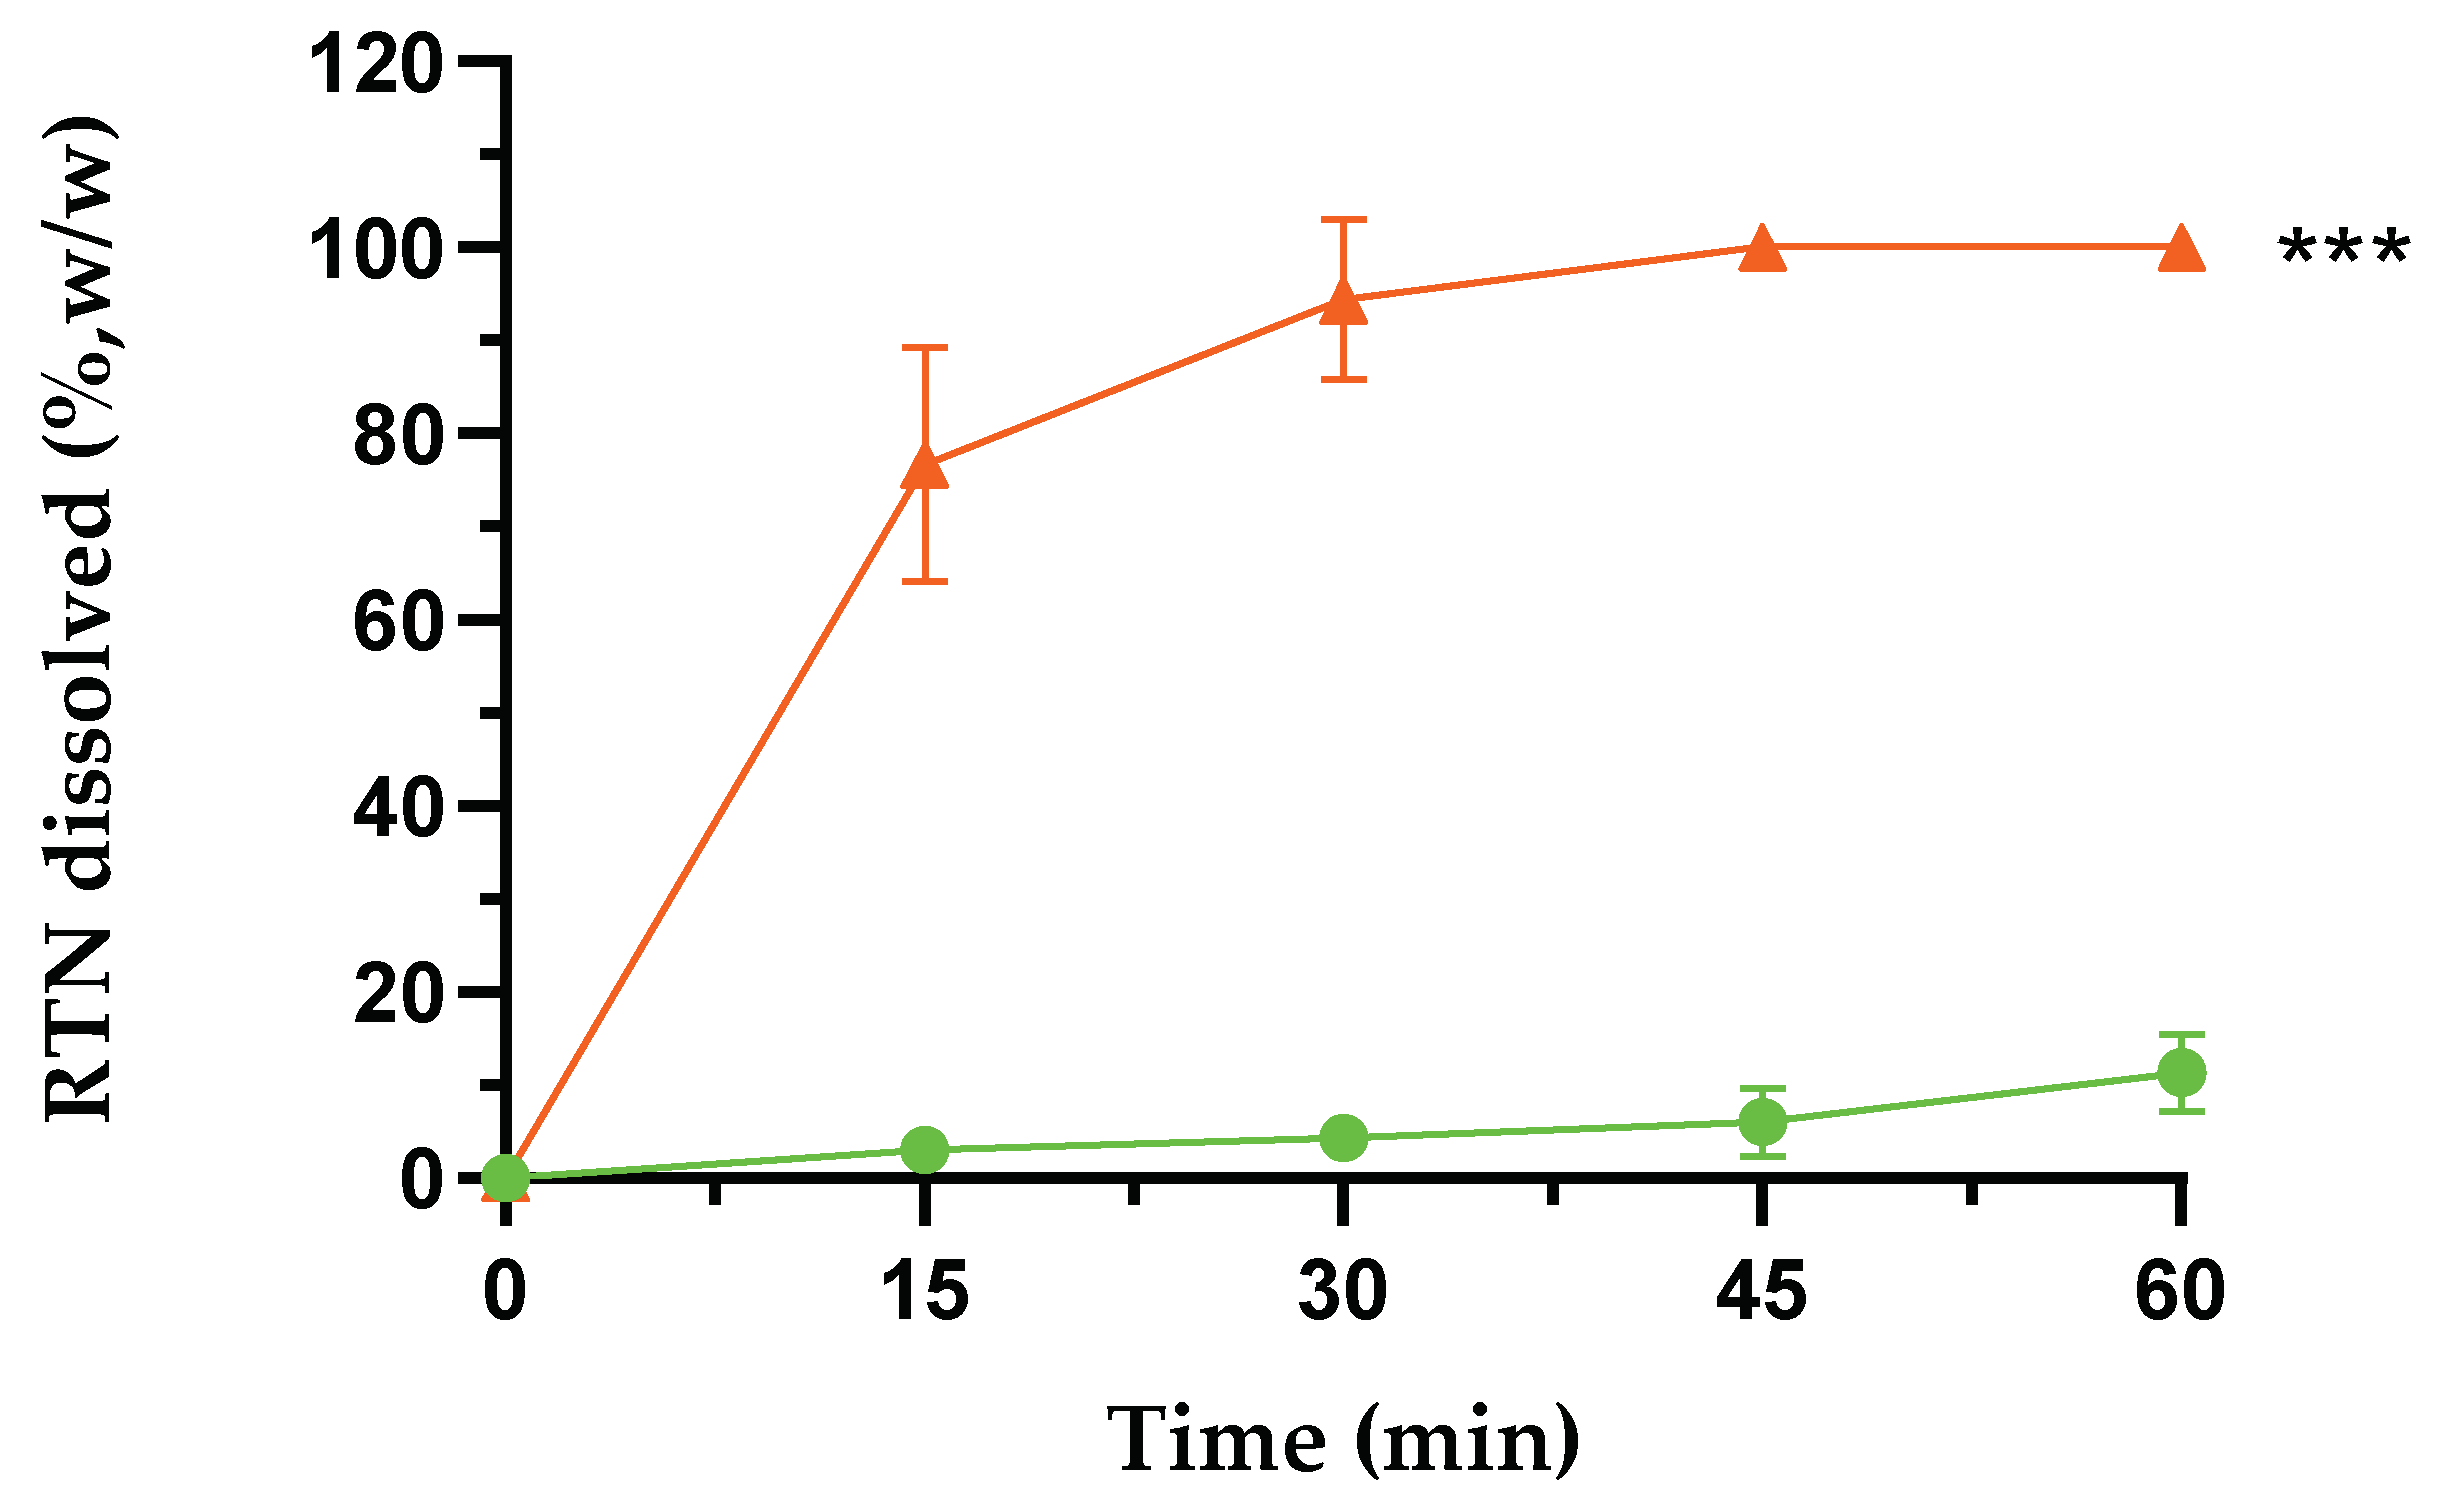
Figure 3.
UV-Vis spectra of free RTN and in the presence of an increasing amount of SBE-β-CD in water:MeOH 80:20 mixture (%,v/v). The experiments were carried out in triplicate.
Figure 3.
UV-Vis spectra of free RTN and in the presence of an increasing amount of SBE-β-CD in water:MeOH 80:20 mixture (%,v/v). The experiments were carried out in triplicate.
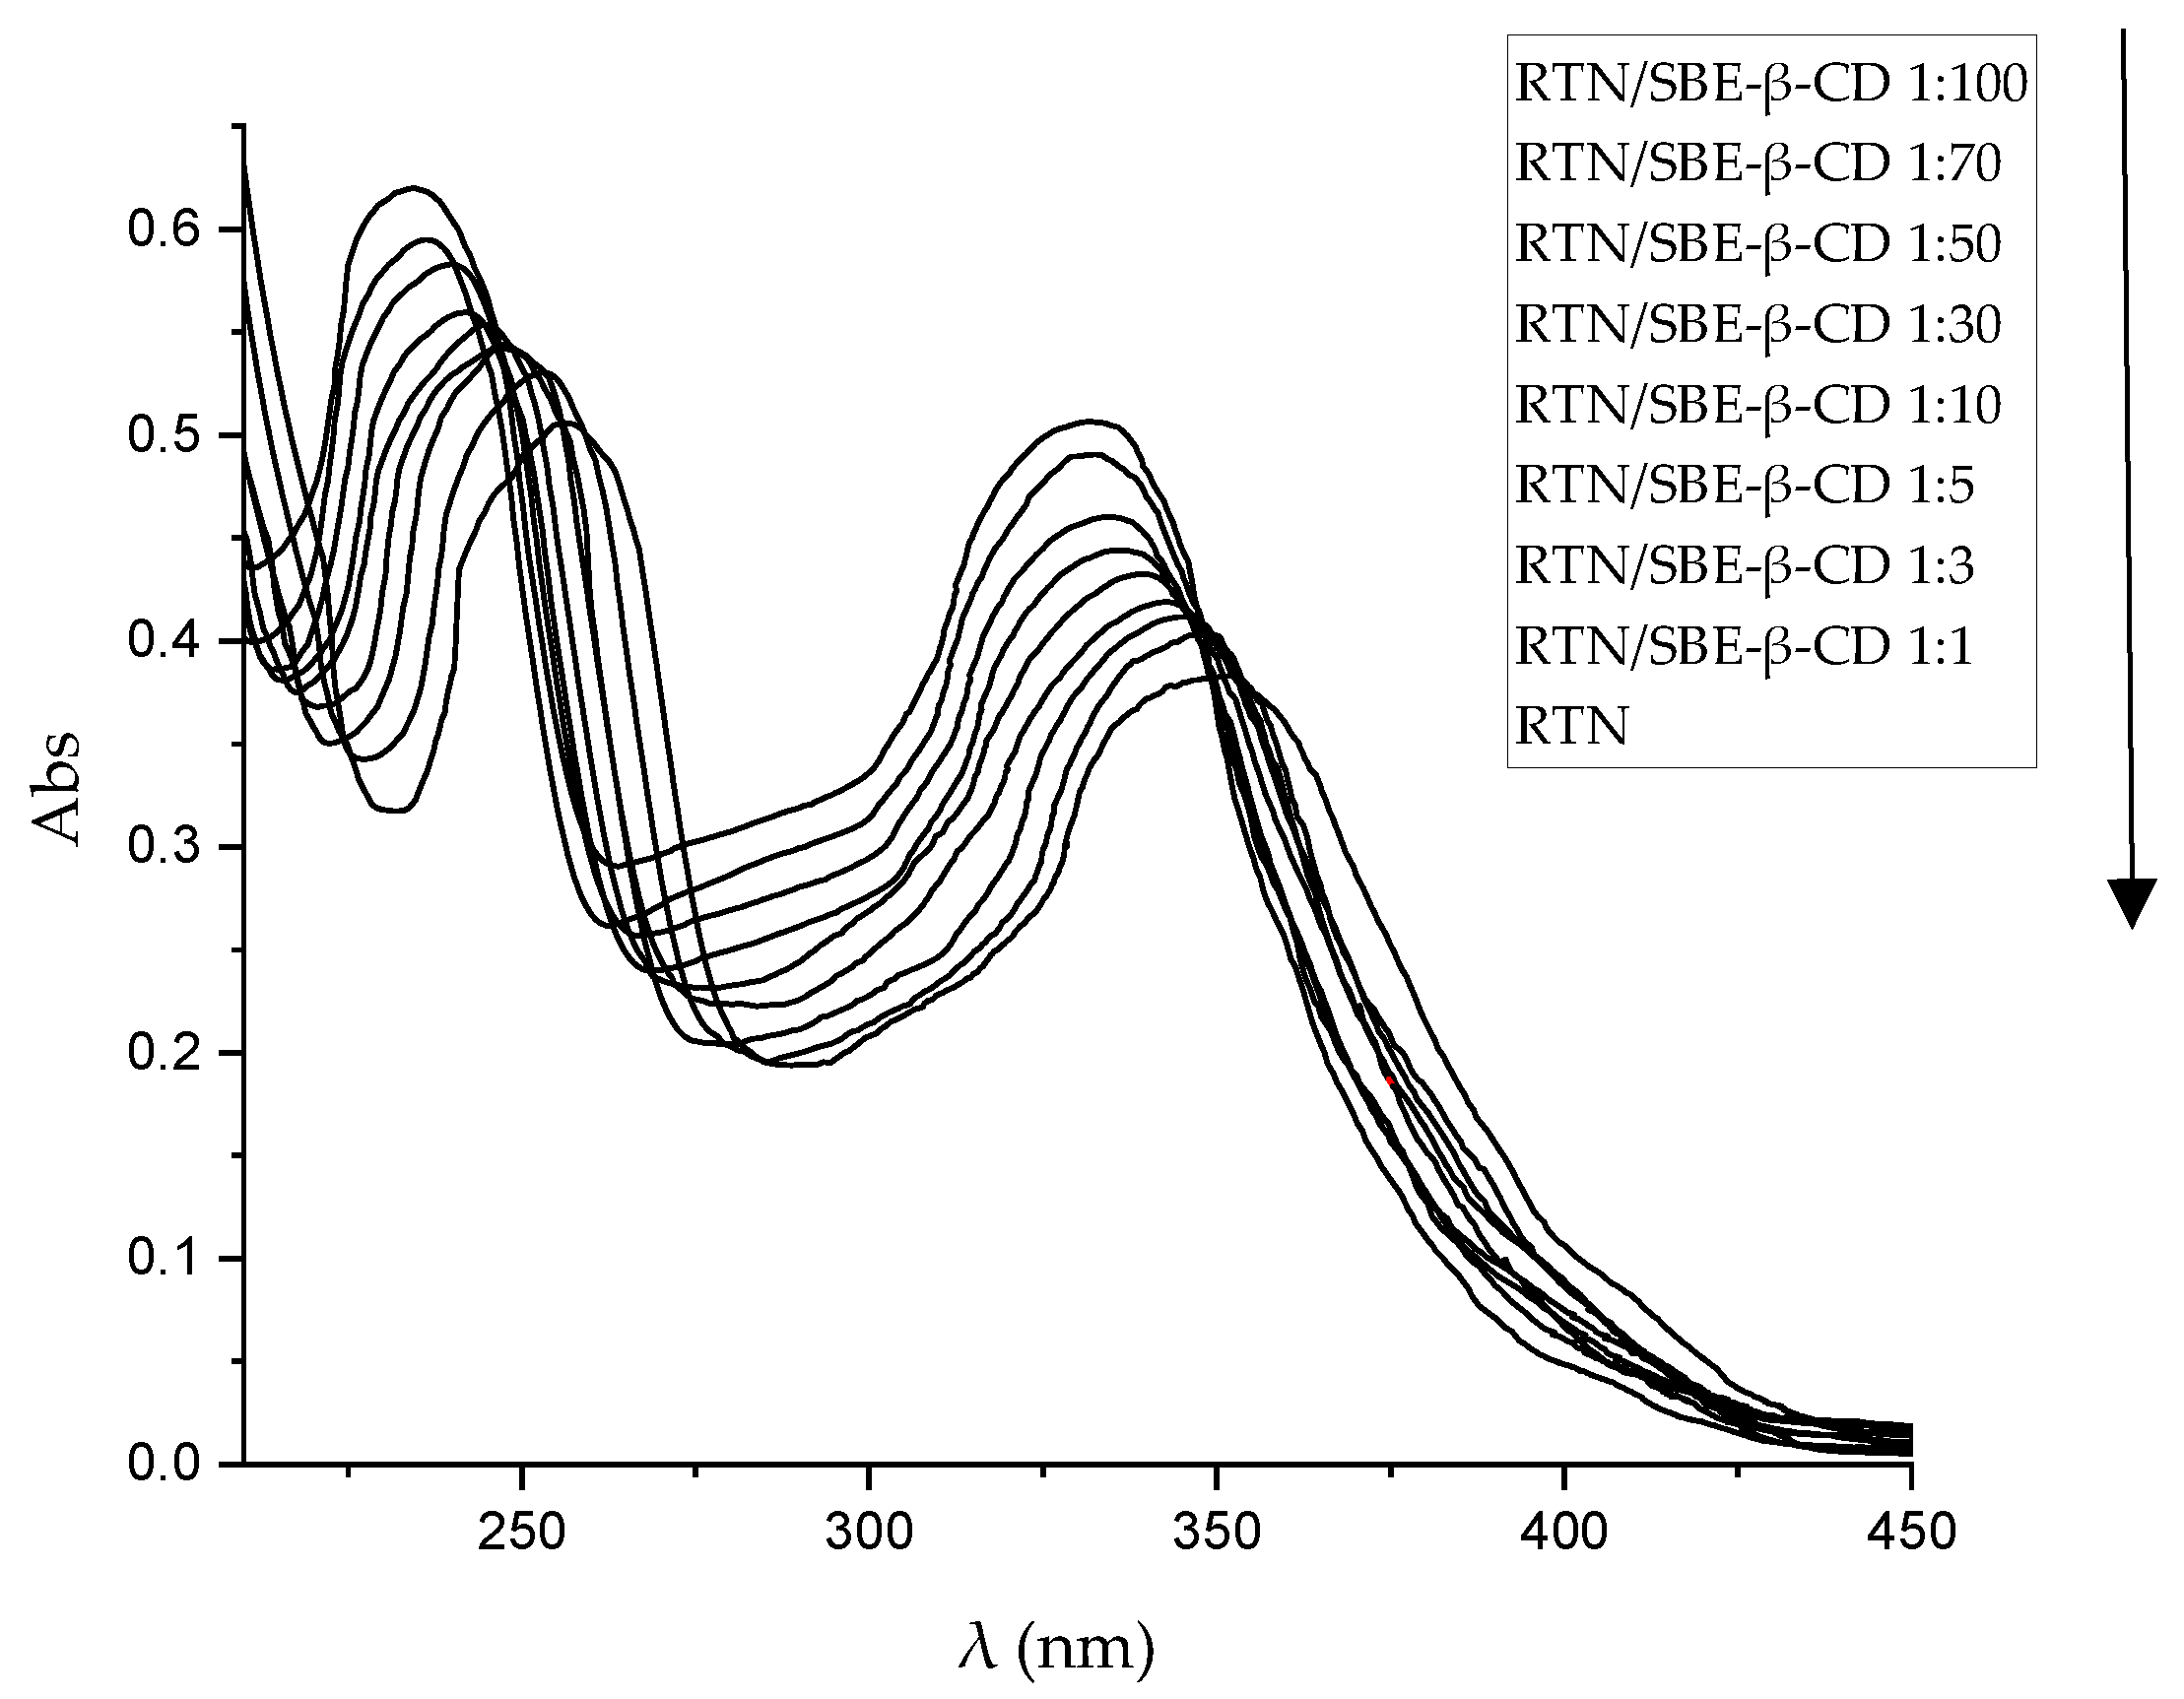
Figure 4.
Phase solubility diagram of RTN/SBE-β-CD inclusion complex. The experiments were carried out in triplicate.
Figure 4.
Phase solubility diagram of RTN/SBE-β-CD inclusion complex. The experiments were carried out in triplicate.
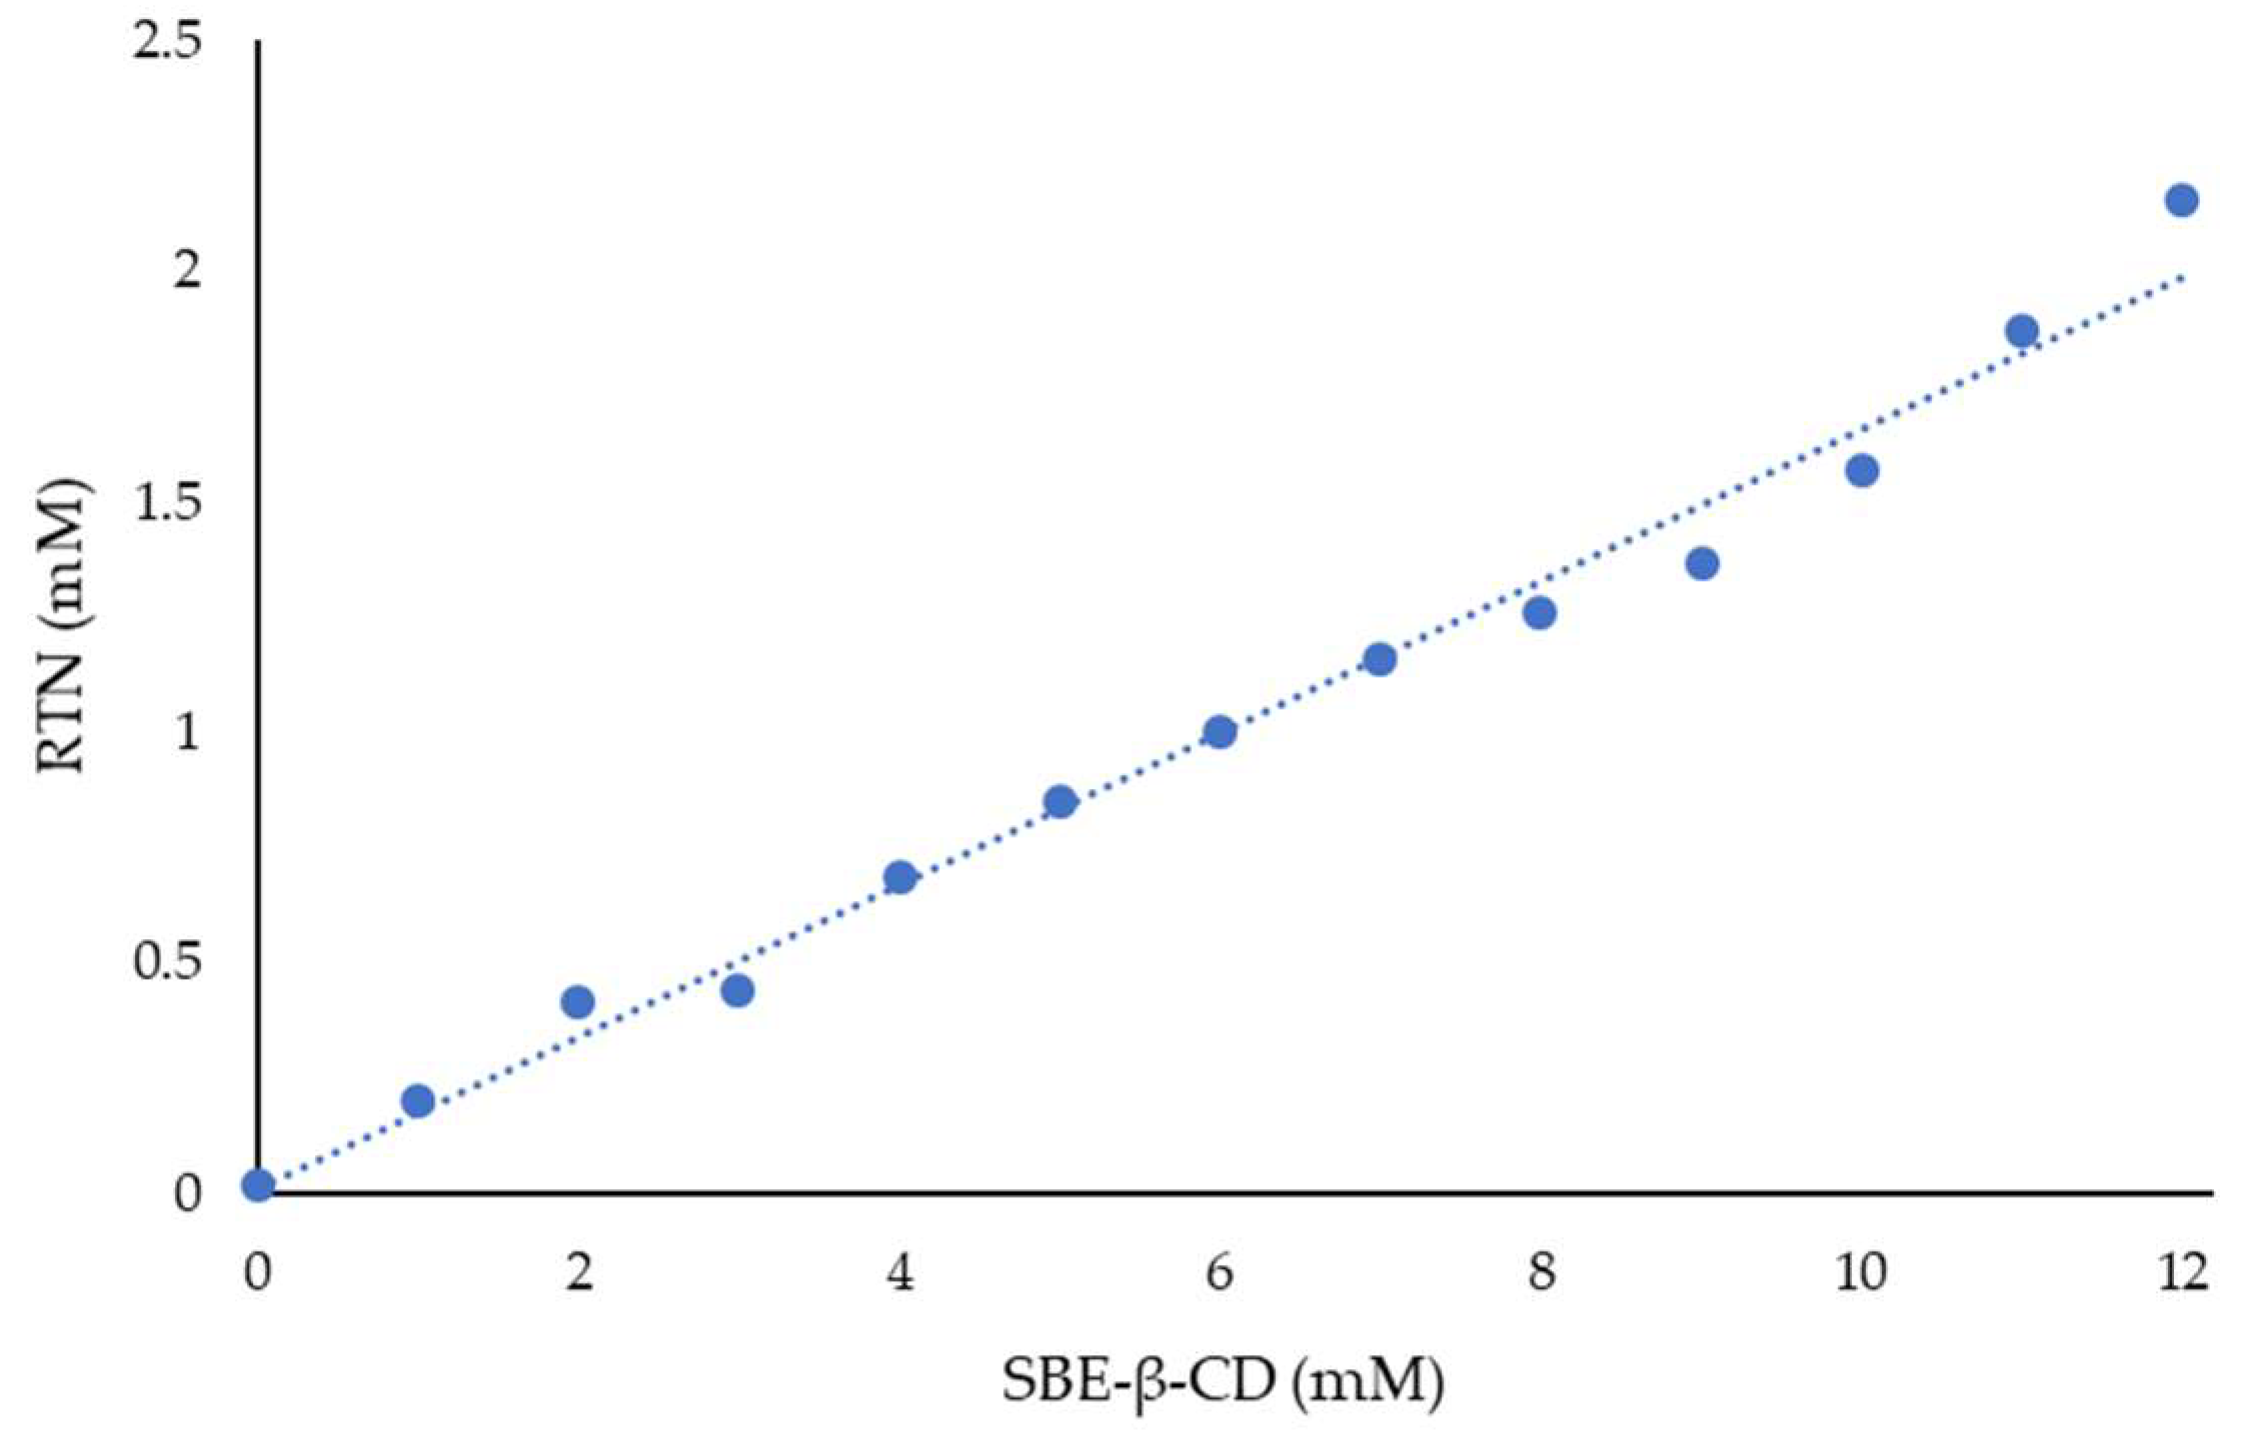
Figure 5.
WAXD patterns of free RTN (green line), SBE-β-CD (black line), physical mixture (blue line), and inclusion complex (orange line).
Figure 5.
WAXD patterns of free RTN (green line), SBE-β-CD (black line), physical mixture (blue line), and inclusion complex (orange line).
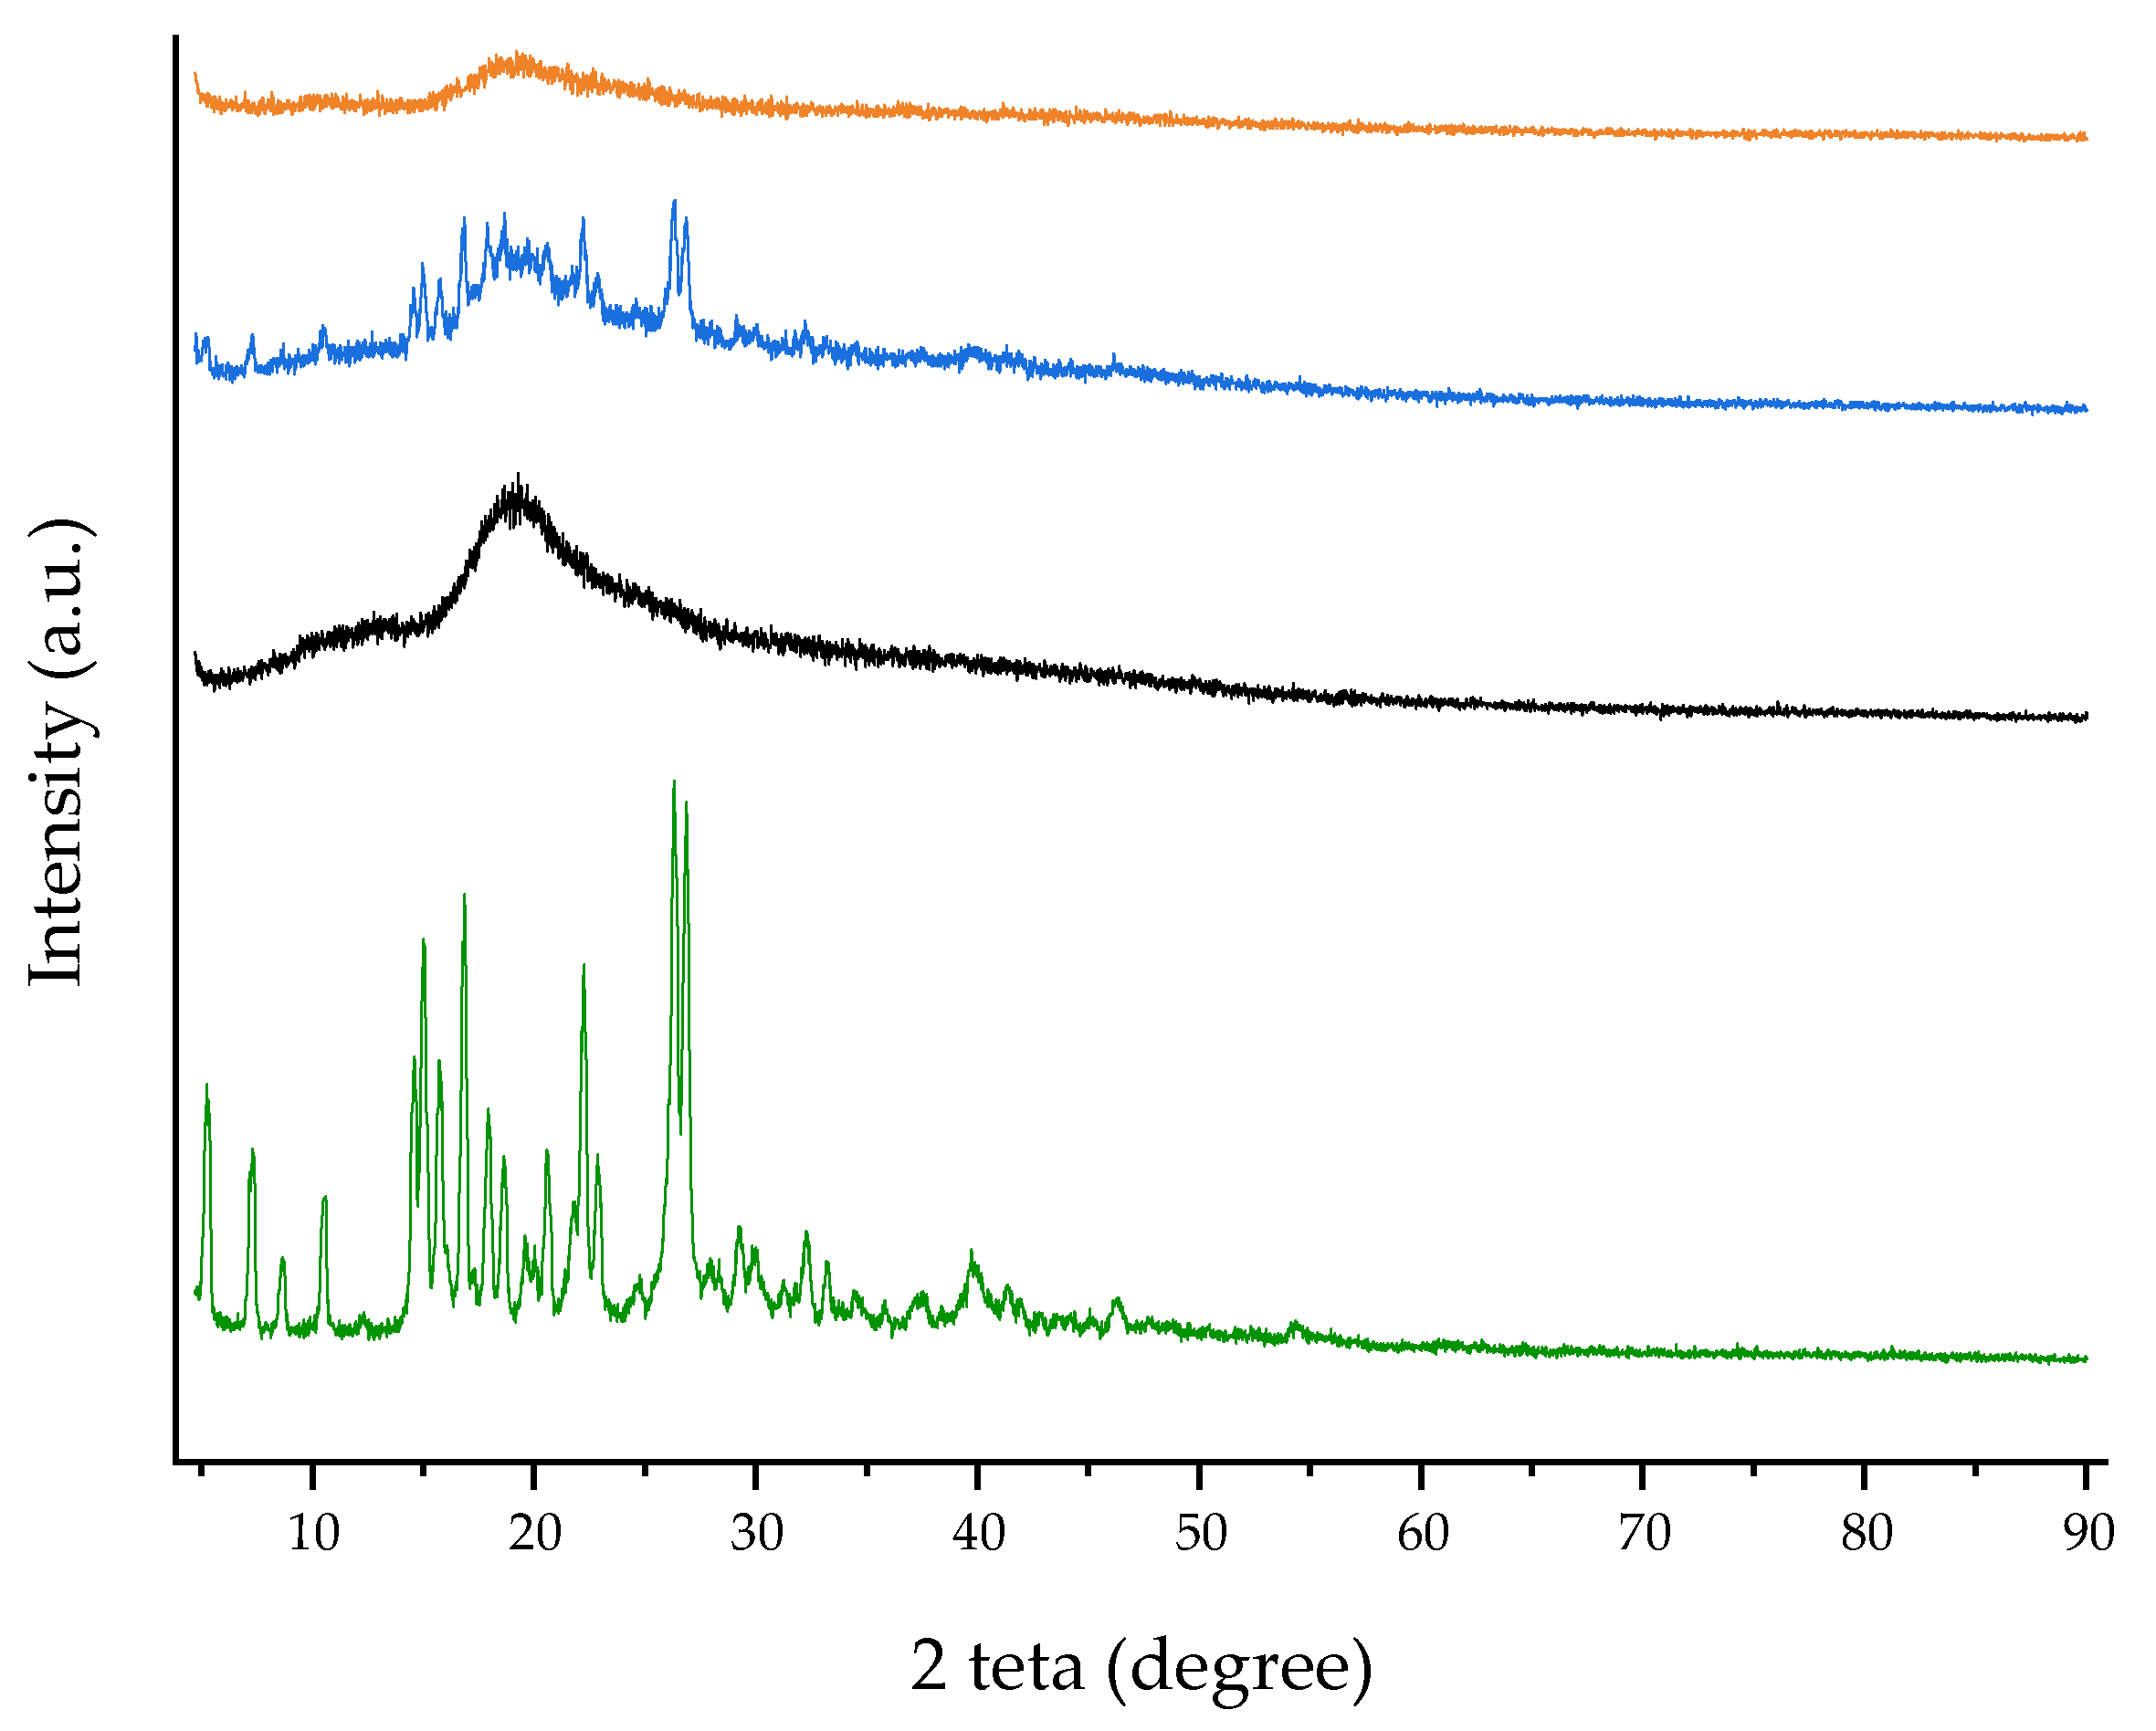
Figure 6.
TGA curves of free RTN (green line), SBE-β-CD (black line), physical mixture (blue line), and inclusion complex (orange line).
Figure 6.
TGA curves of free RTN (green line), SBE-β-CD (black line), physical mixture (blue line), and inclusion complex (orange line).
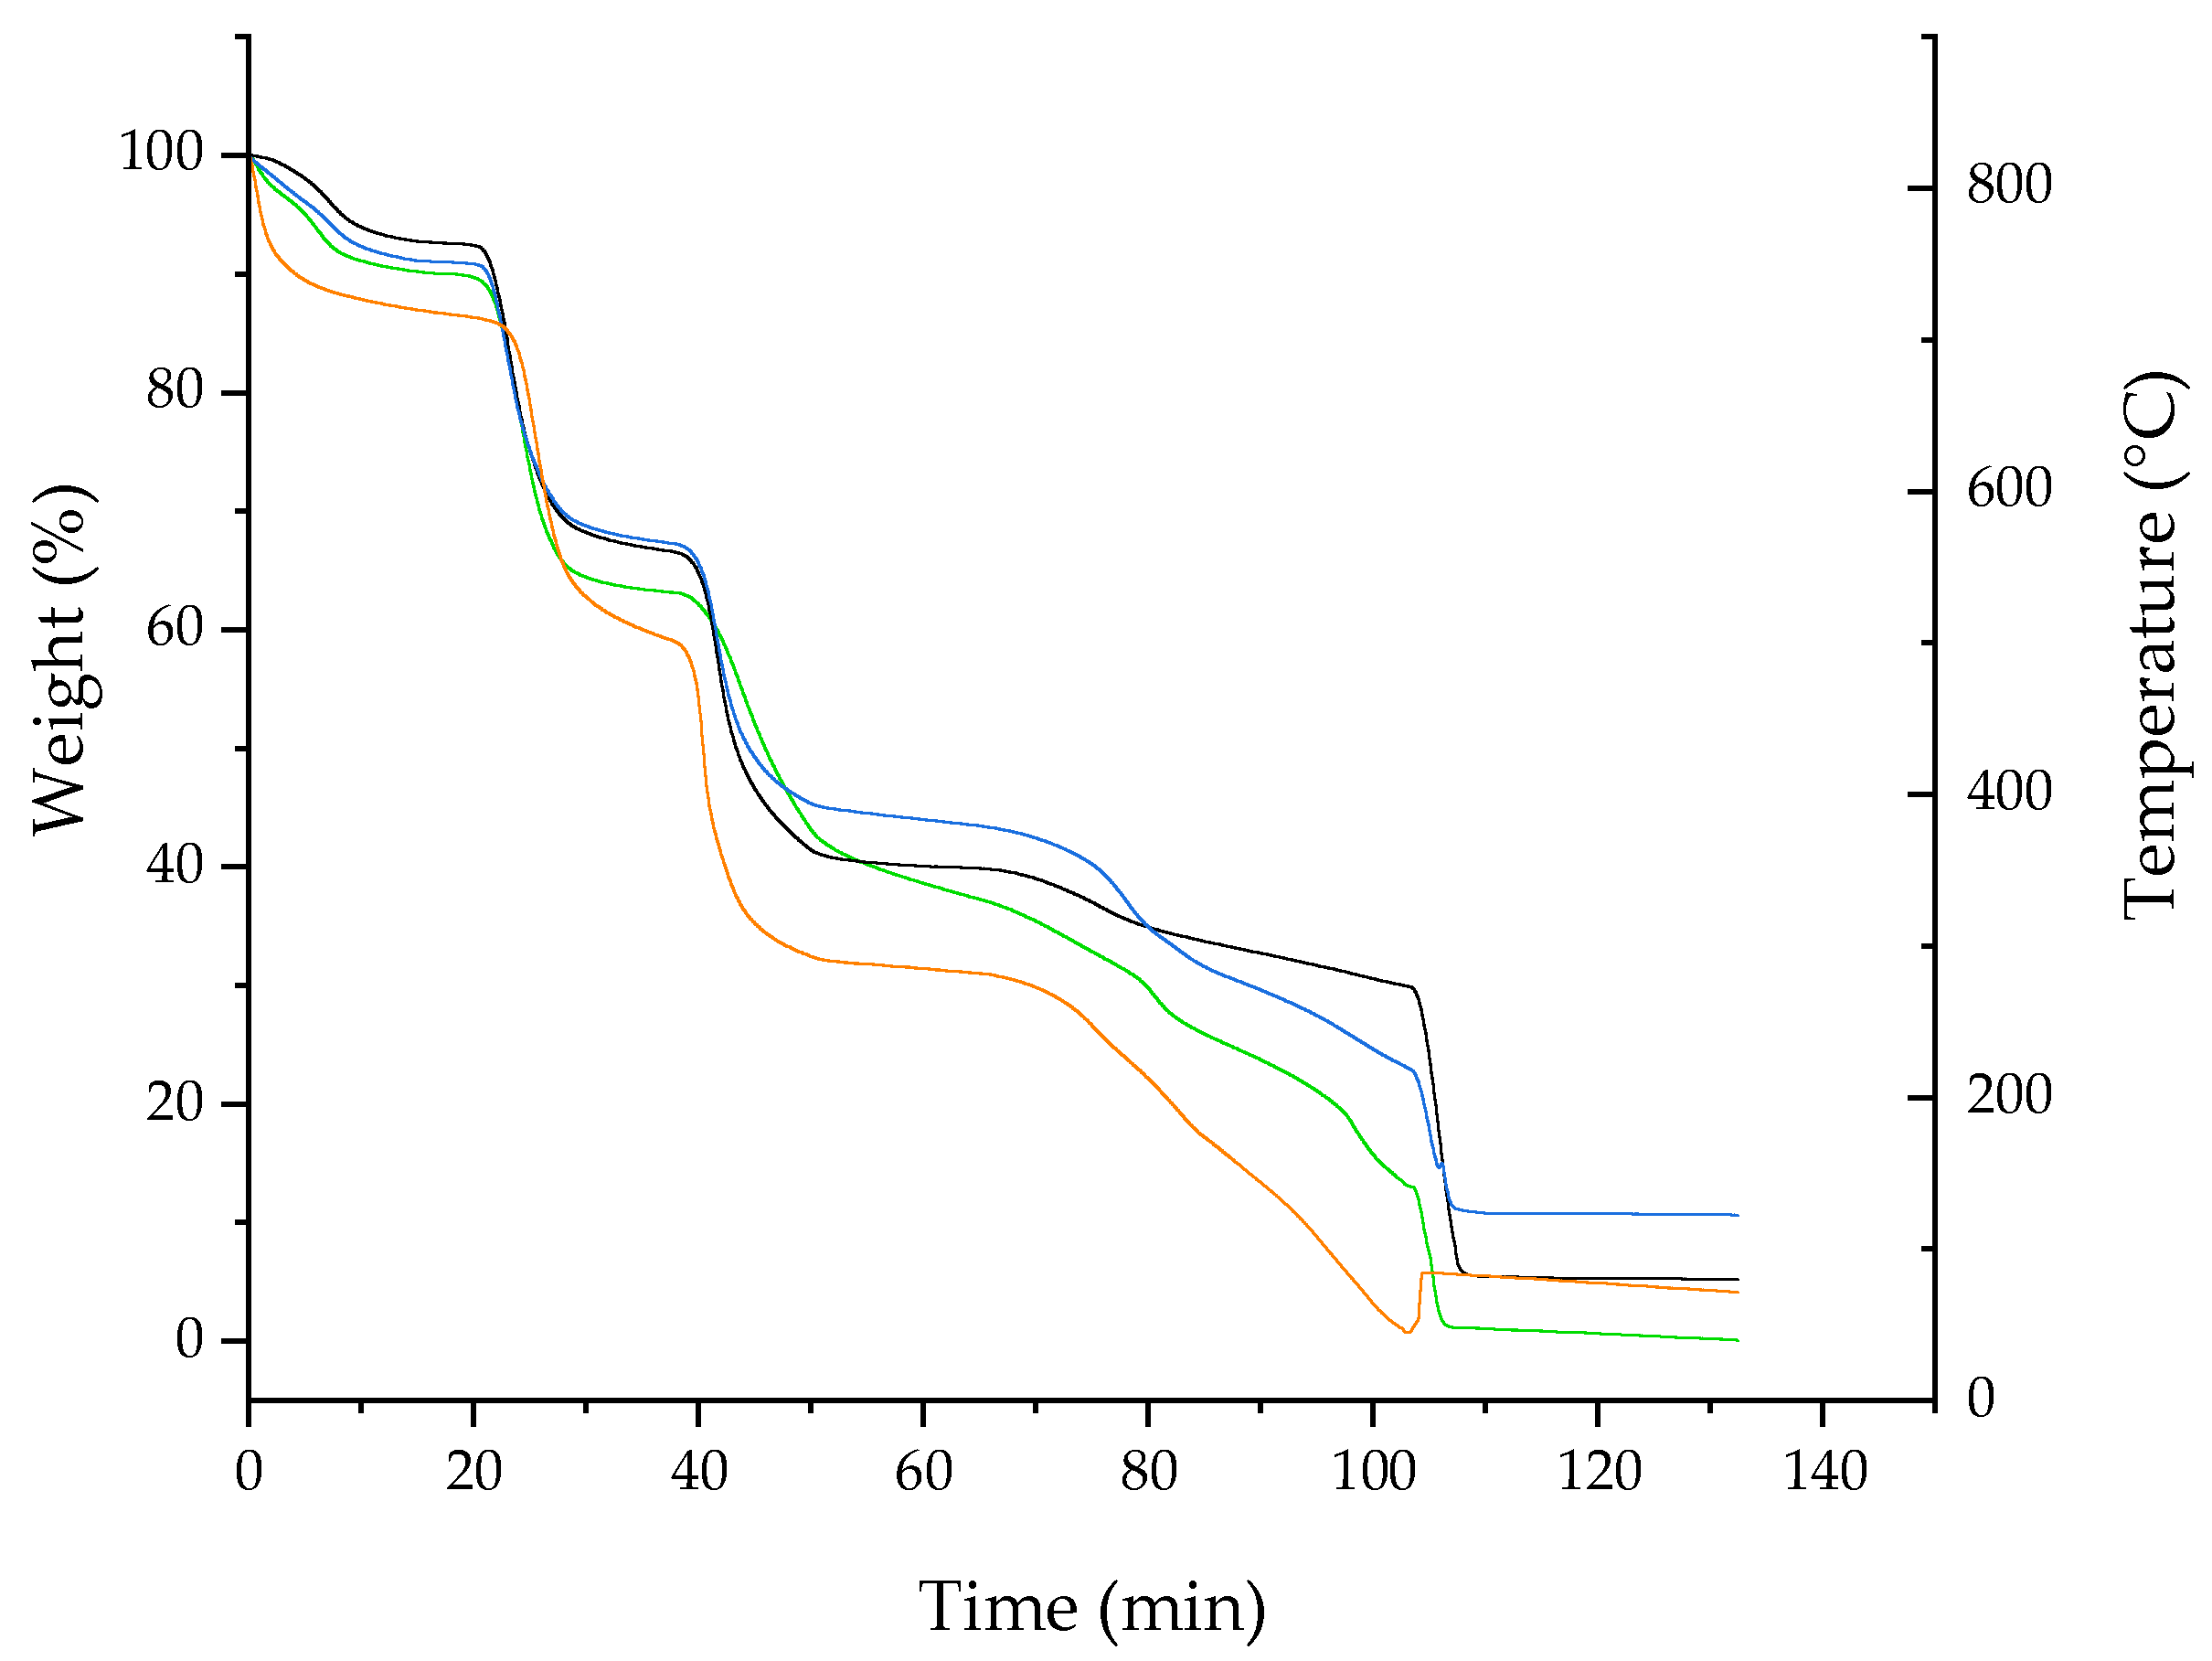
Figure 7.
FT-IR spectra recorded at 25 °C of free RTN (green line), SBE-β-CD (black line) physical mixture (blue line), and inclusion complex (orange line).
Figure 7.
FT-IR spectra recorded at 25 °C of free RTN (green line), SBE-β-CD (black line) physical mixture (blue line), and inclusion complex (orange line).
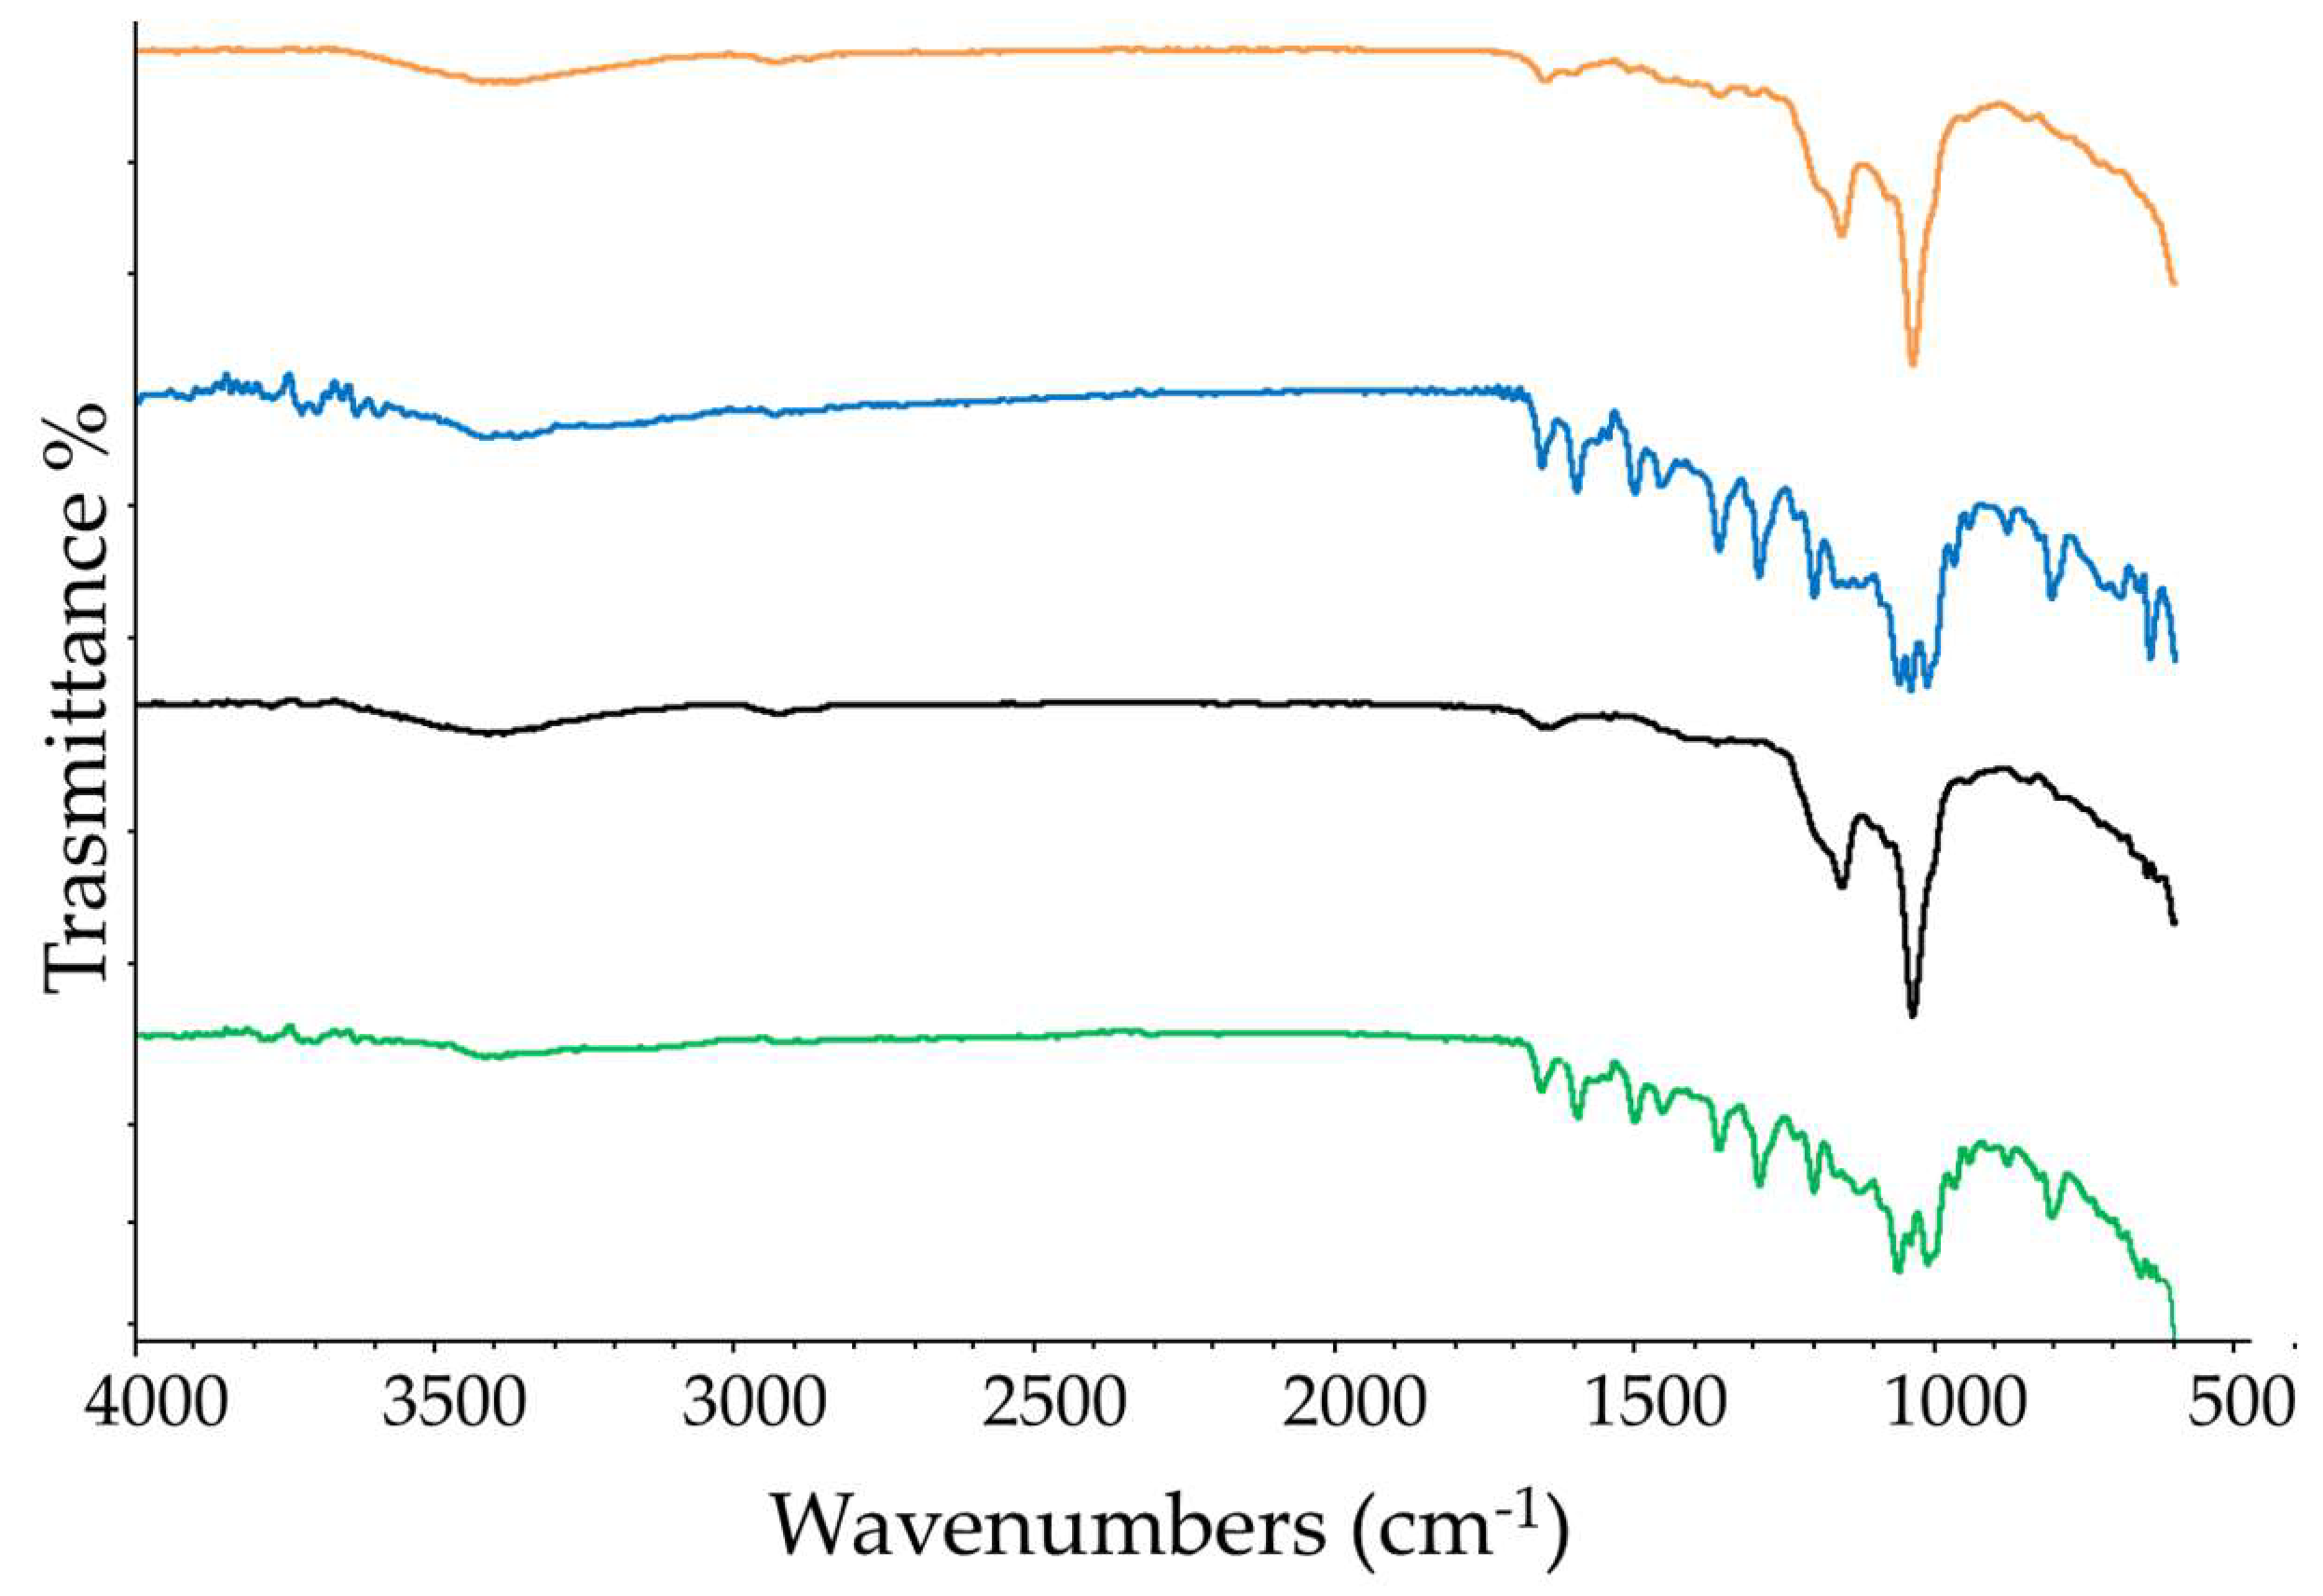
Figure 8.
Scanning electron microscope (SEM) images of free RTN (a), SBE-β-CD (b) physical mixture (c), and inclusion complex (d) at different magnifications.
Figure 8.
Scanning electron microscope (SEM) images of free RTN (a), SBE-β-CD (b) physical mixture (c), and inclusion complex (d) at different magnifications.
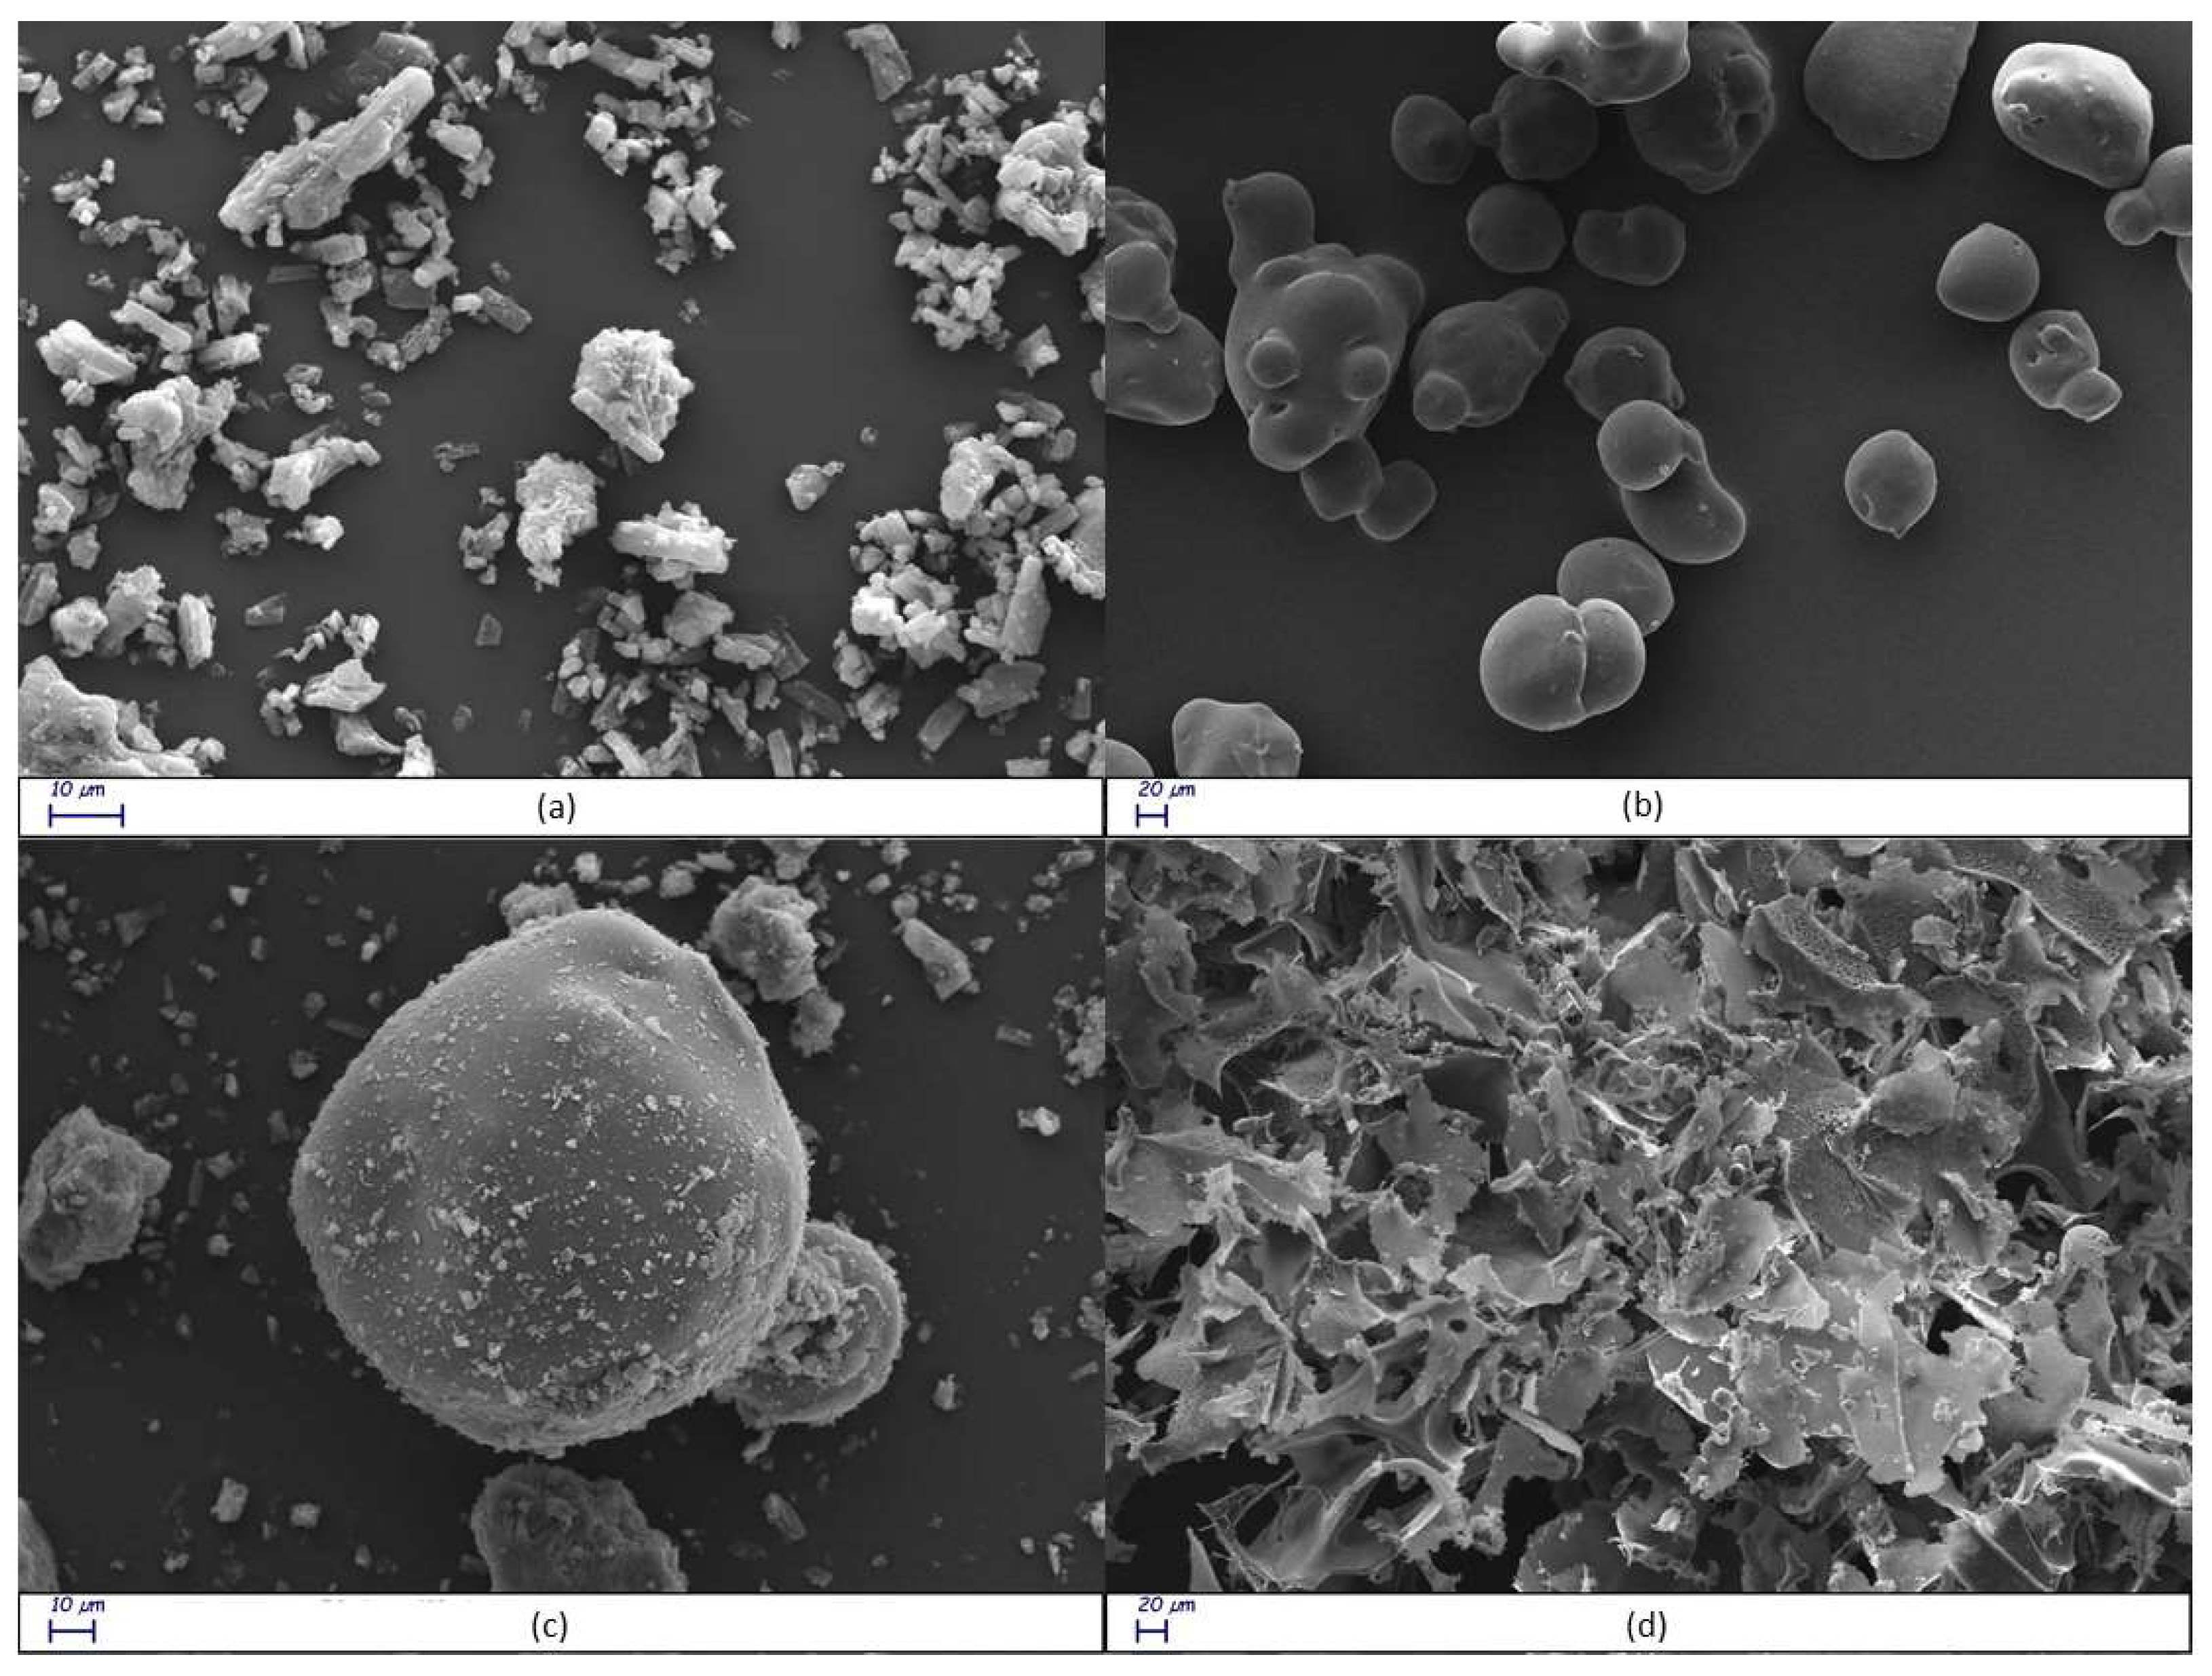
Figure 9.
Stacked portions of the 1H NMR spectra relative to the free RTN (blue line) and RTN/SBE-β-CD (black line) inclusion complex. Only those diagnostic signals relative to RTN are reported.
Figure 9.
Stacked portions of the 1H NMR spectra relative to the free RTN (blue line) and RTN/SBE-β-CD (black line) inclusion complex. Only those diagnostic signals relative to RTN are reported.
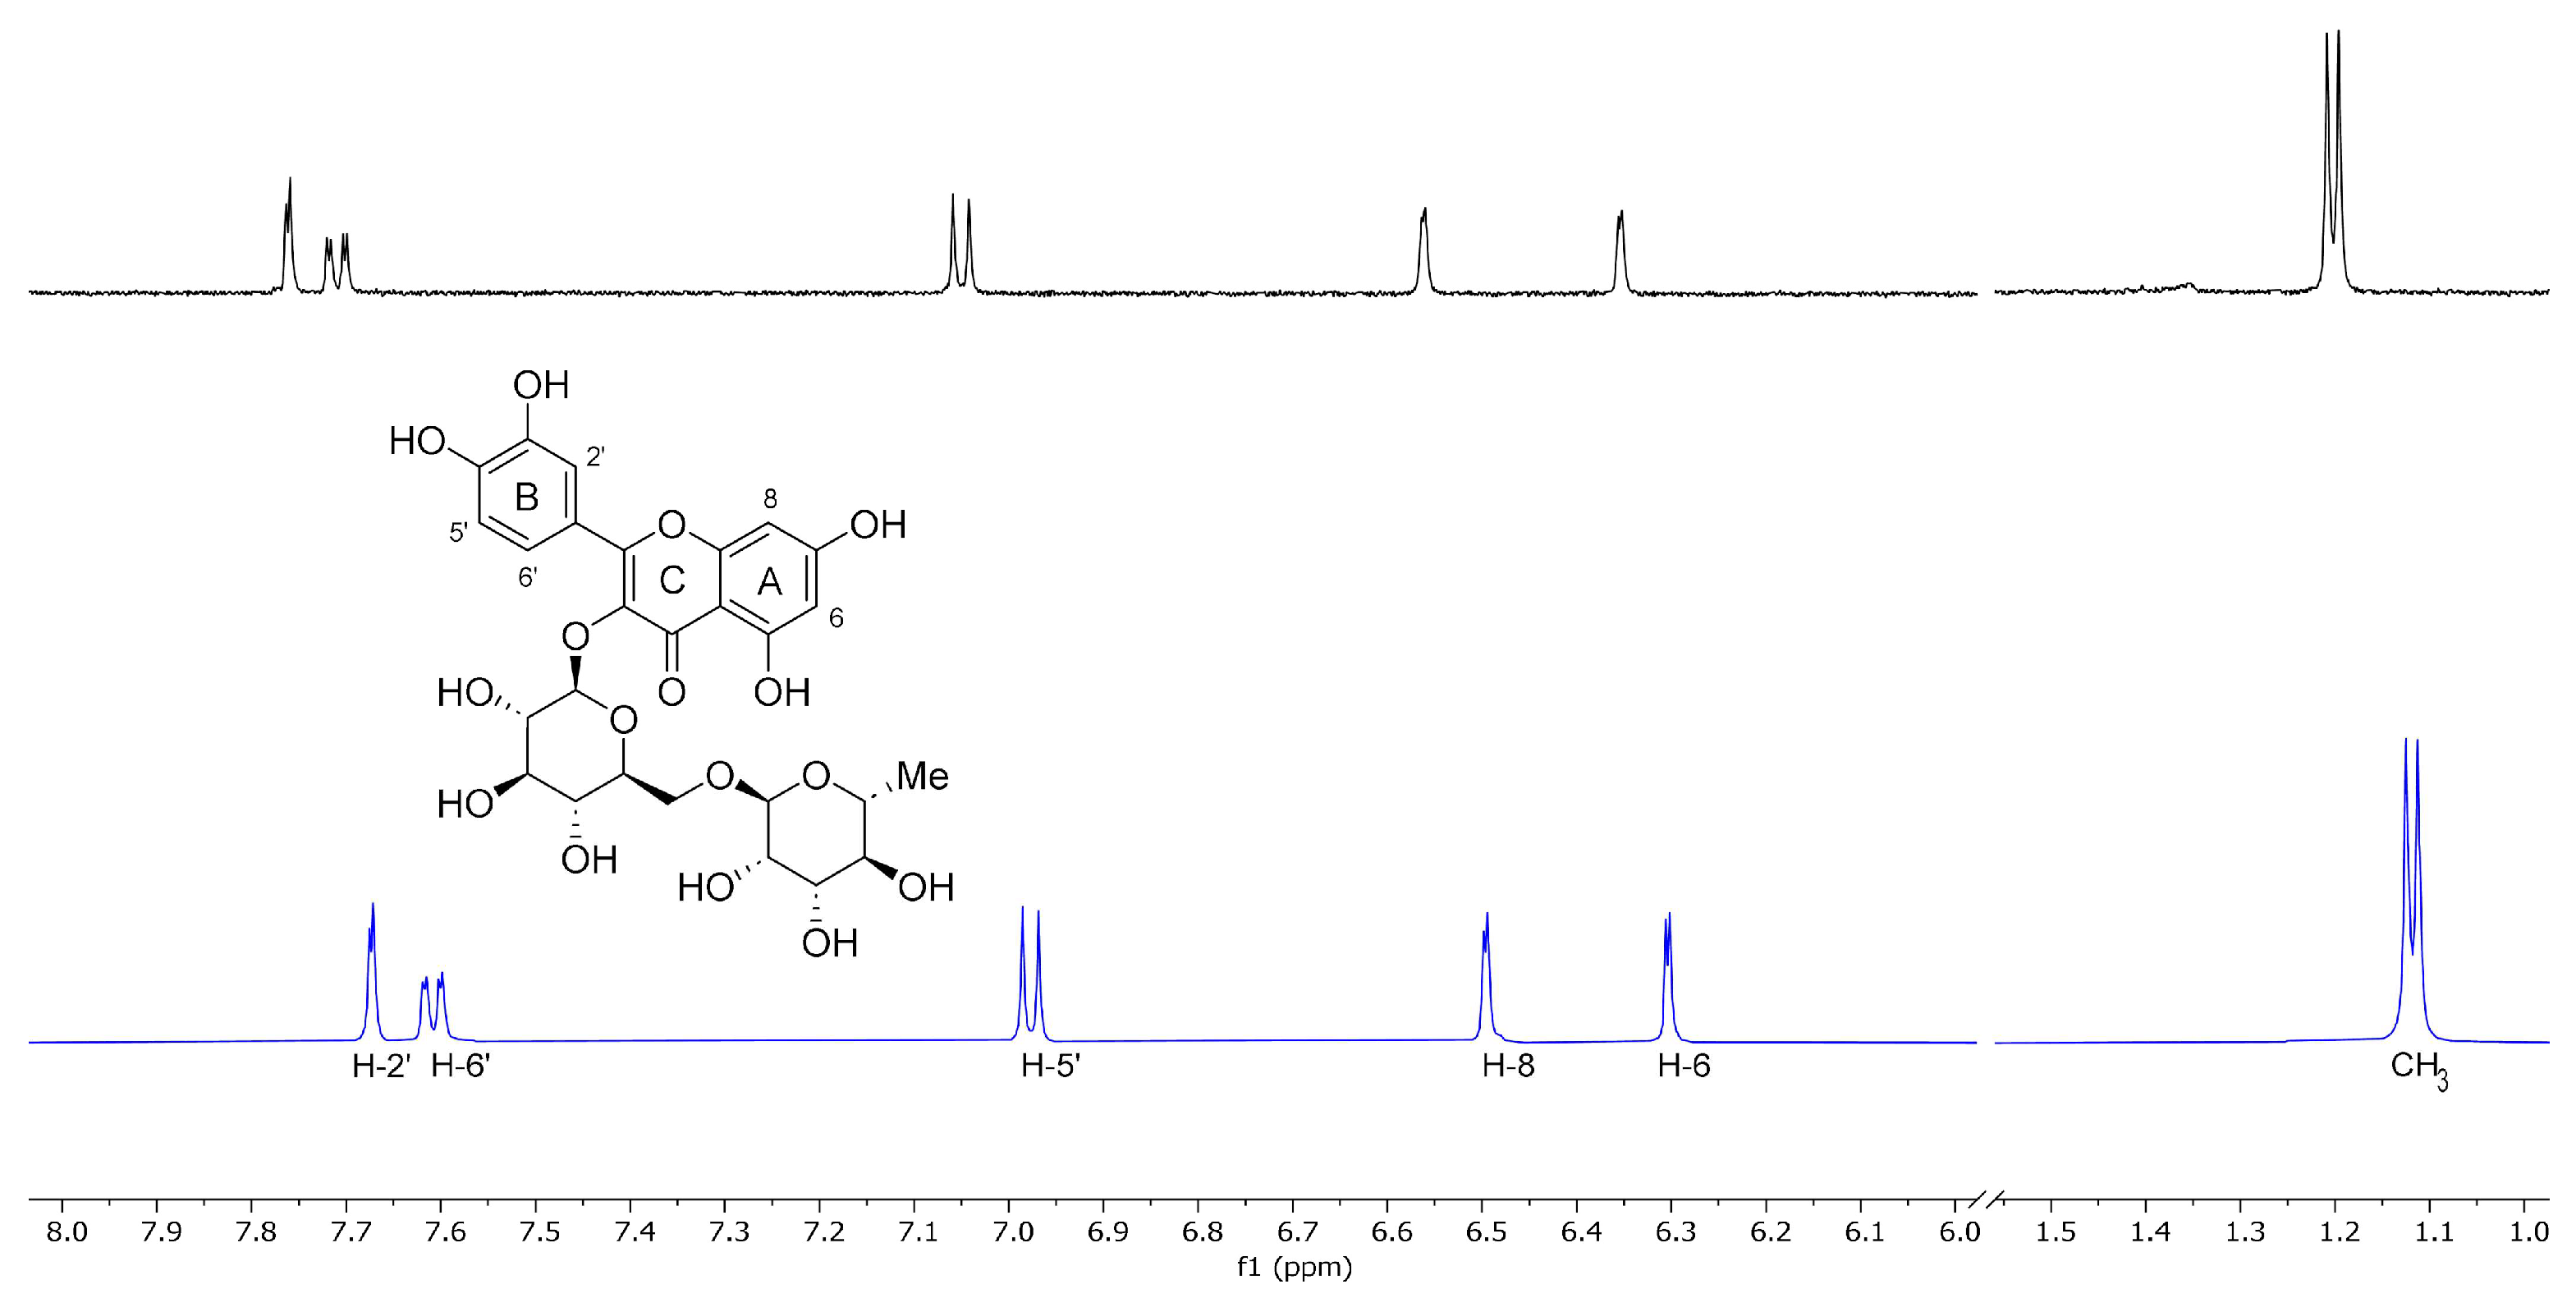
Figure 10.
3D full minimized structure of RTN/SBE-β-CD inclusion complex. Top view (left) and side view (right). Hydrogen bonds were represented as a yellow dotted line.
Figure 10.
3D full minimized structure of RTN/SBE-β-CD inclusion complex. Top view (left) and side view (right). Hydrogen bonds were represented as a yellow dotted line.
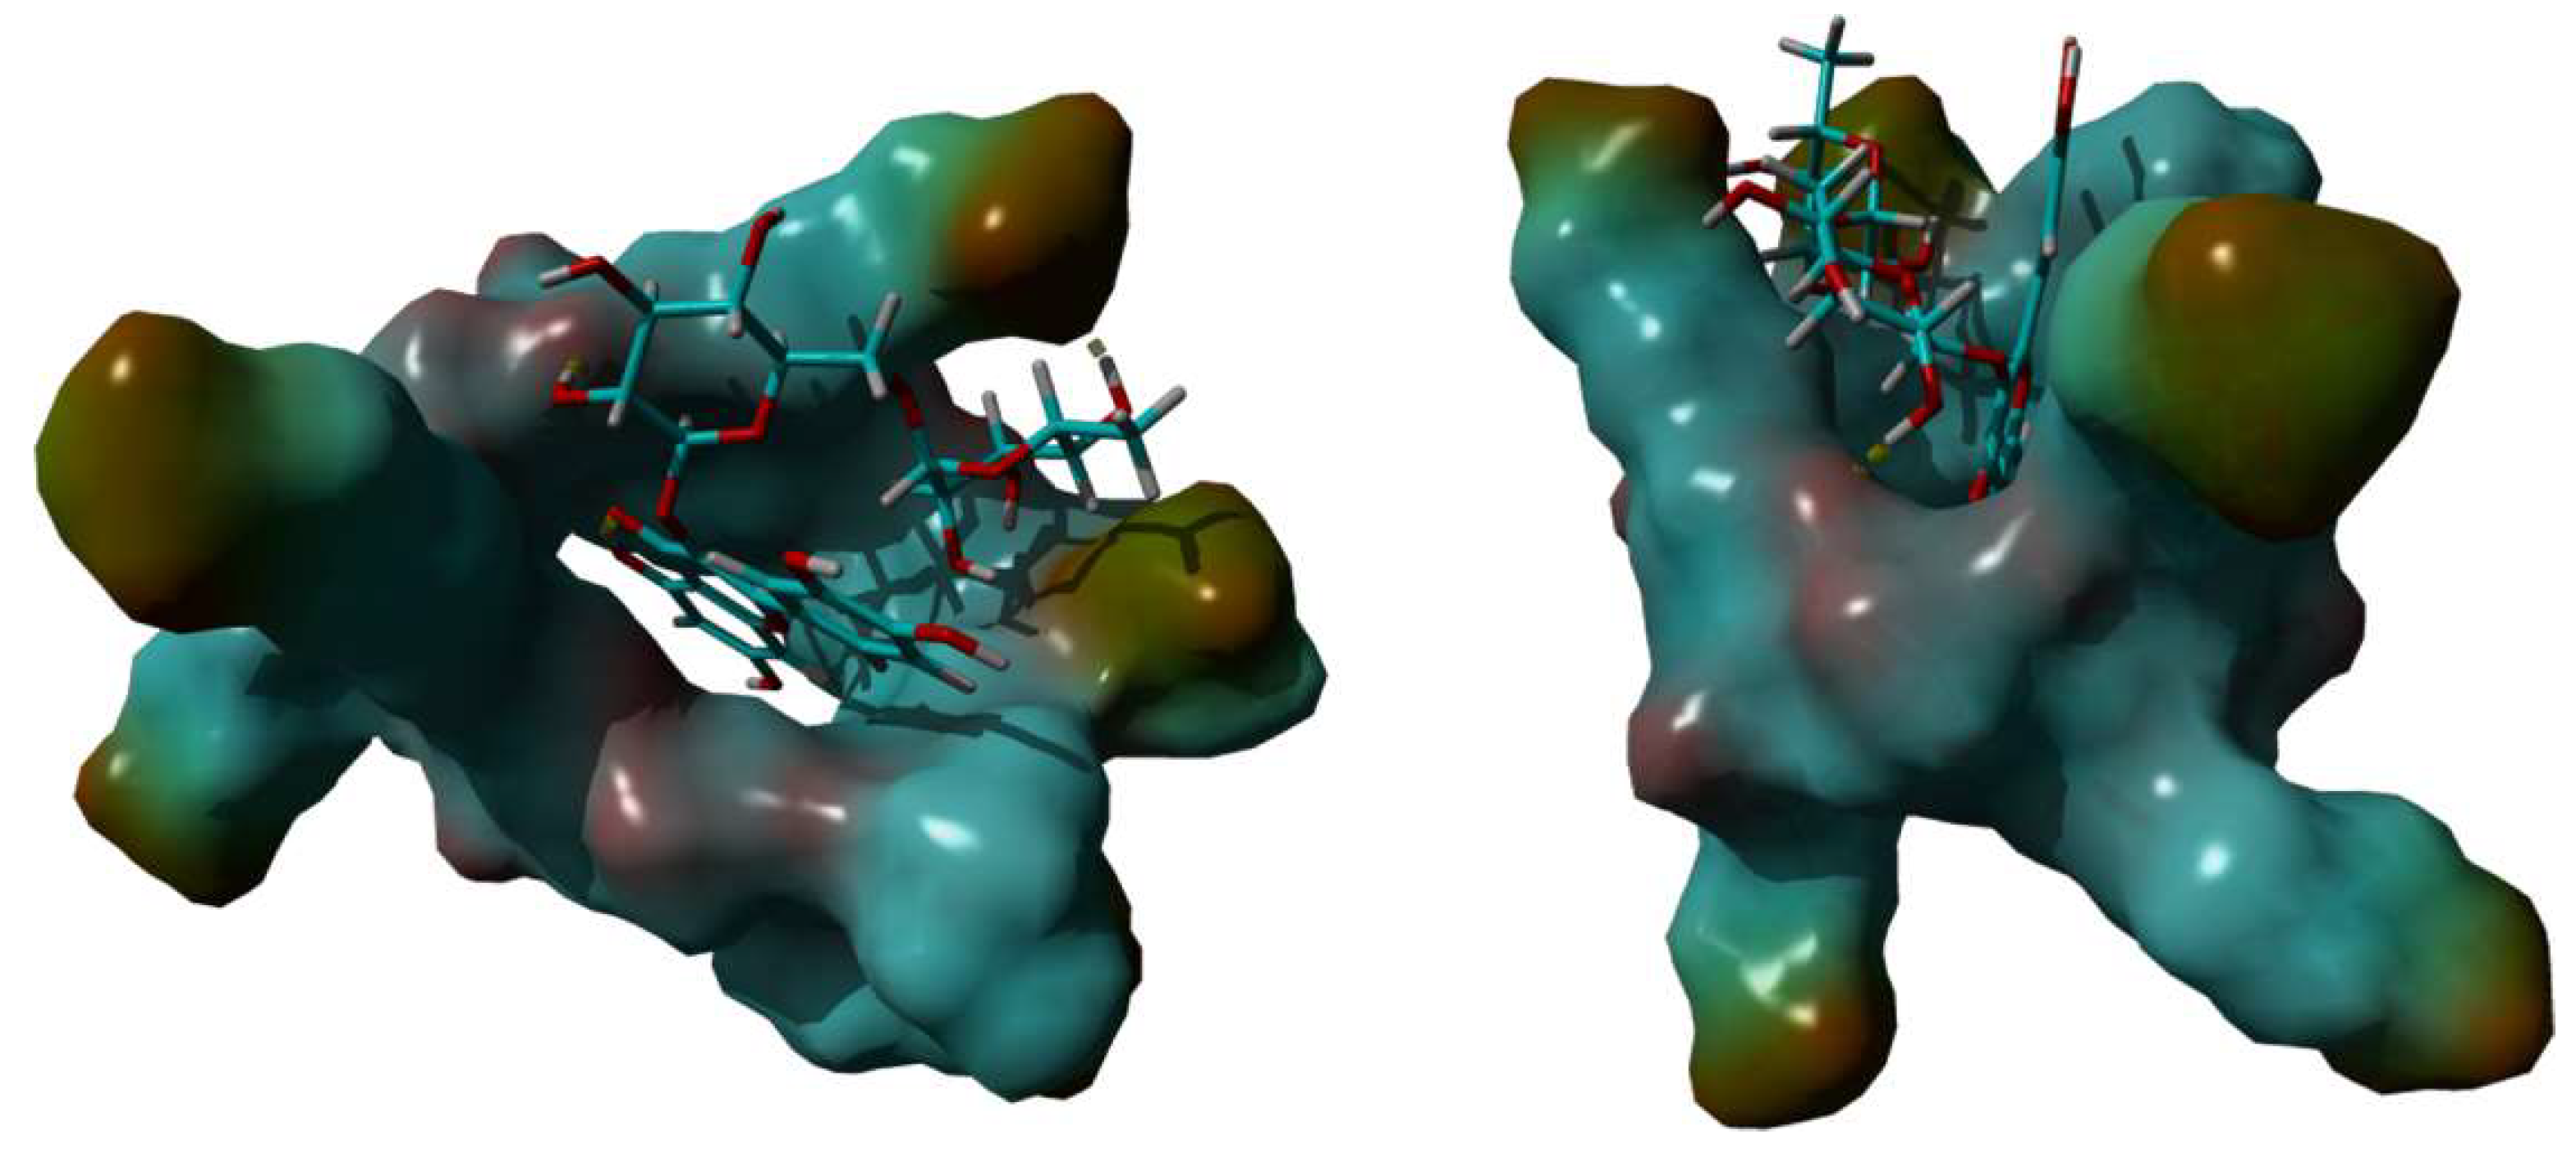
Figure 11.
The results are expressed as mean ± SD. RTN/SBE-β-CD inclusion complex significantly reduced S. aureus ATCC 6538 biofilm formation at 0.5 MIC (0.61 μg/mL in RTN). a). Biofilm biomass is expressed as crystal violet optical density (O.D. 497 nm) (* p < 0.05); b). Cell viability is expressed as Log10 CFU/mL (**** p < 0.0001).
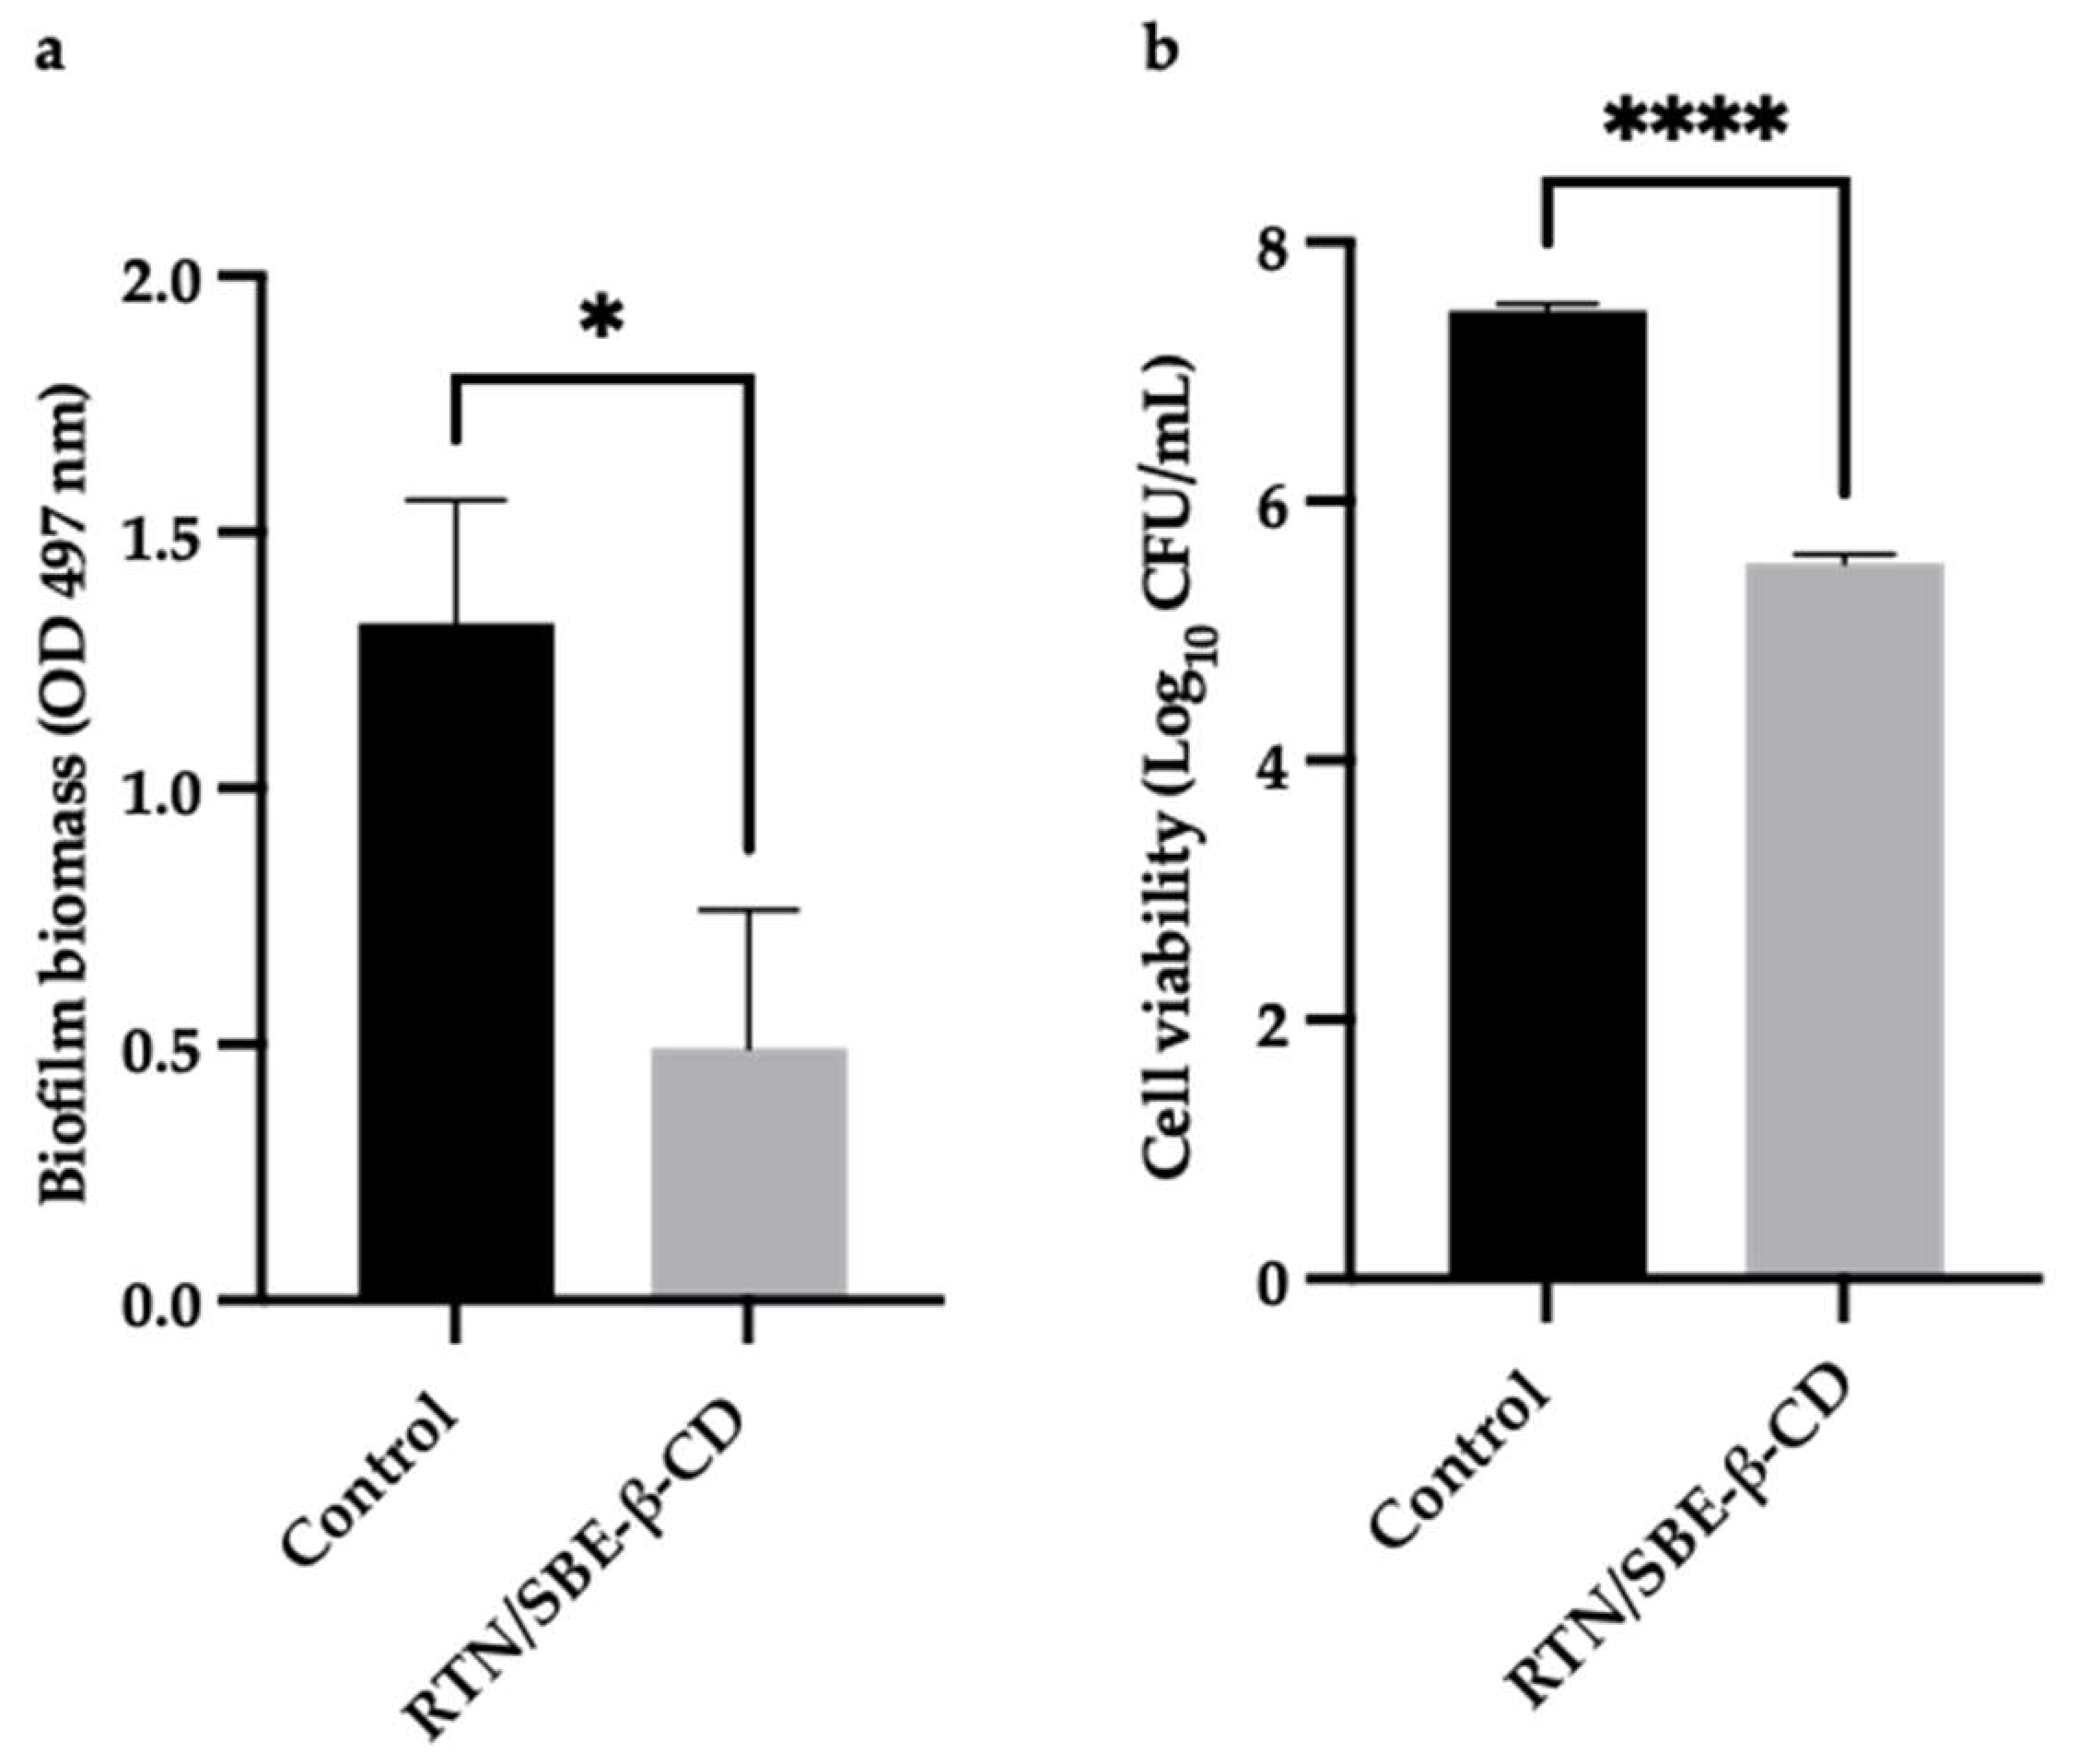
Figure 12.
The results are expressed as mean ± SD. RTN/SBE-β-CD inclusion complex significantly reduced S. aureus ATCC 43300 biofilm formation at 0.5 MIC (0.61 μg/mL in RTN). a). Biofilm biomass is expressed as crystal violet optical density (O.D. 497 nm) (** p < 0.01); b). Cell viability is expressed as Log10 CFU/mL (**** p < 0.0001).
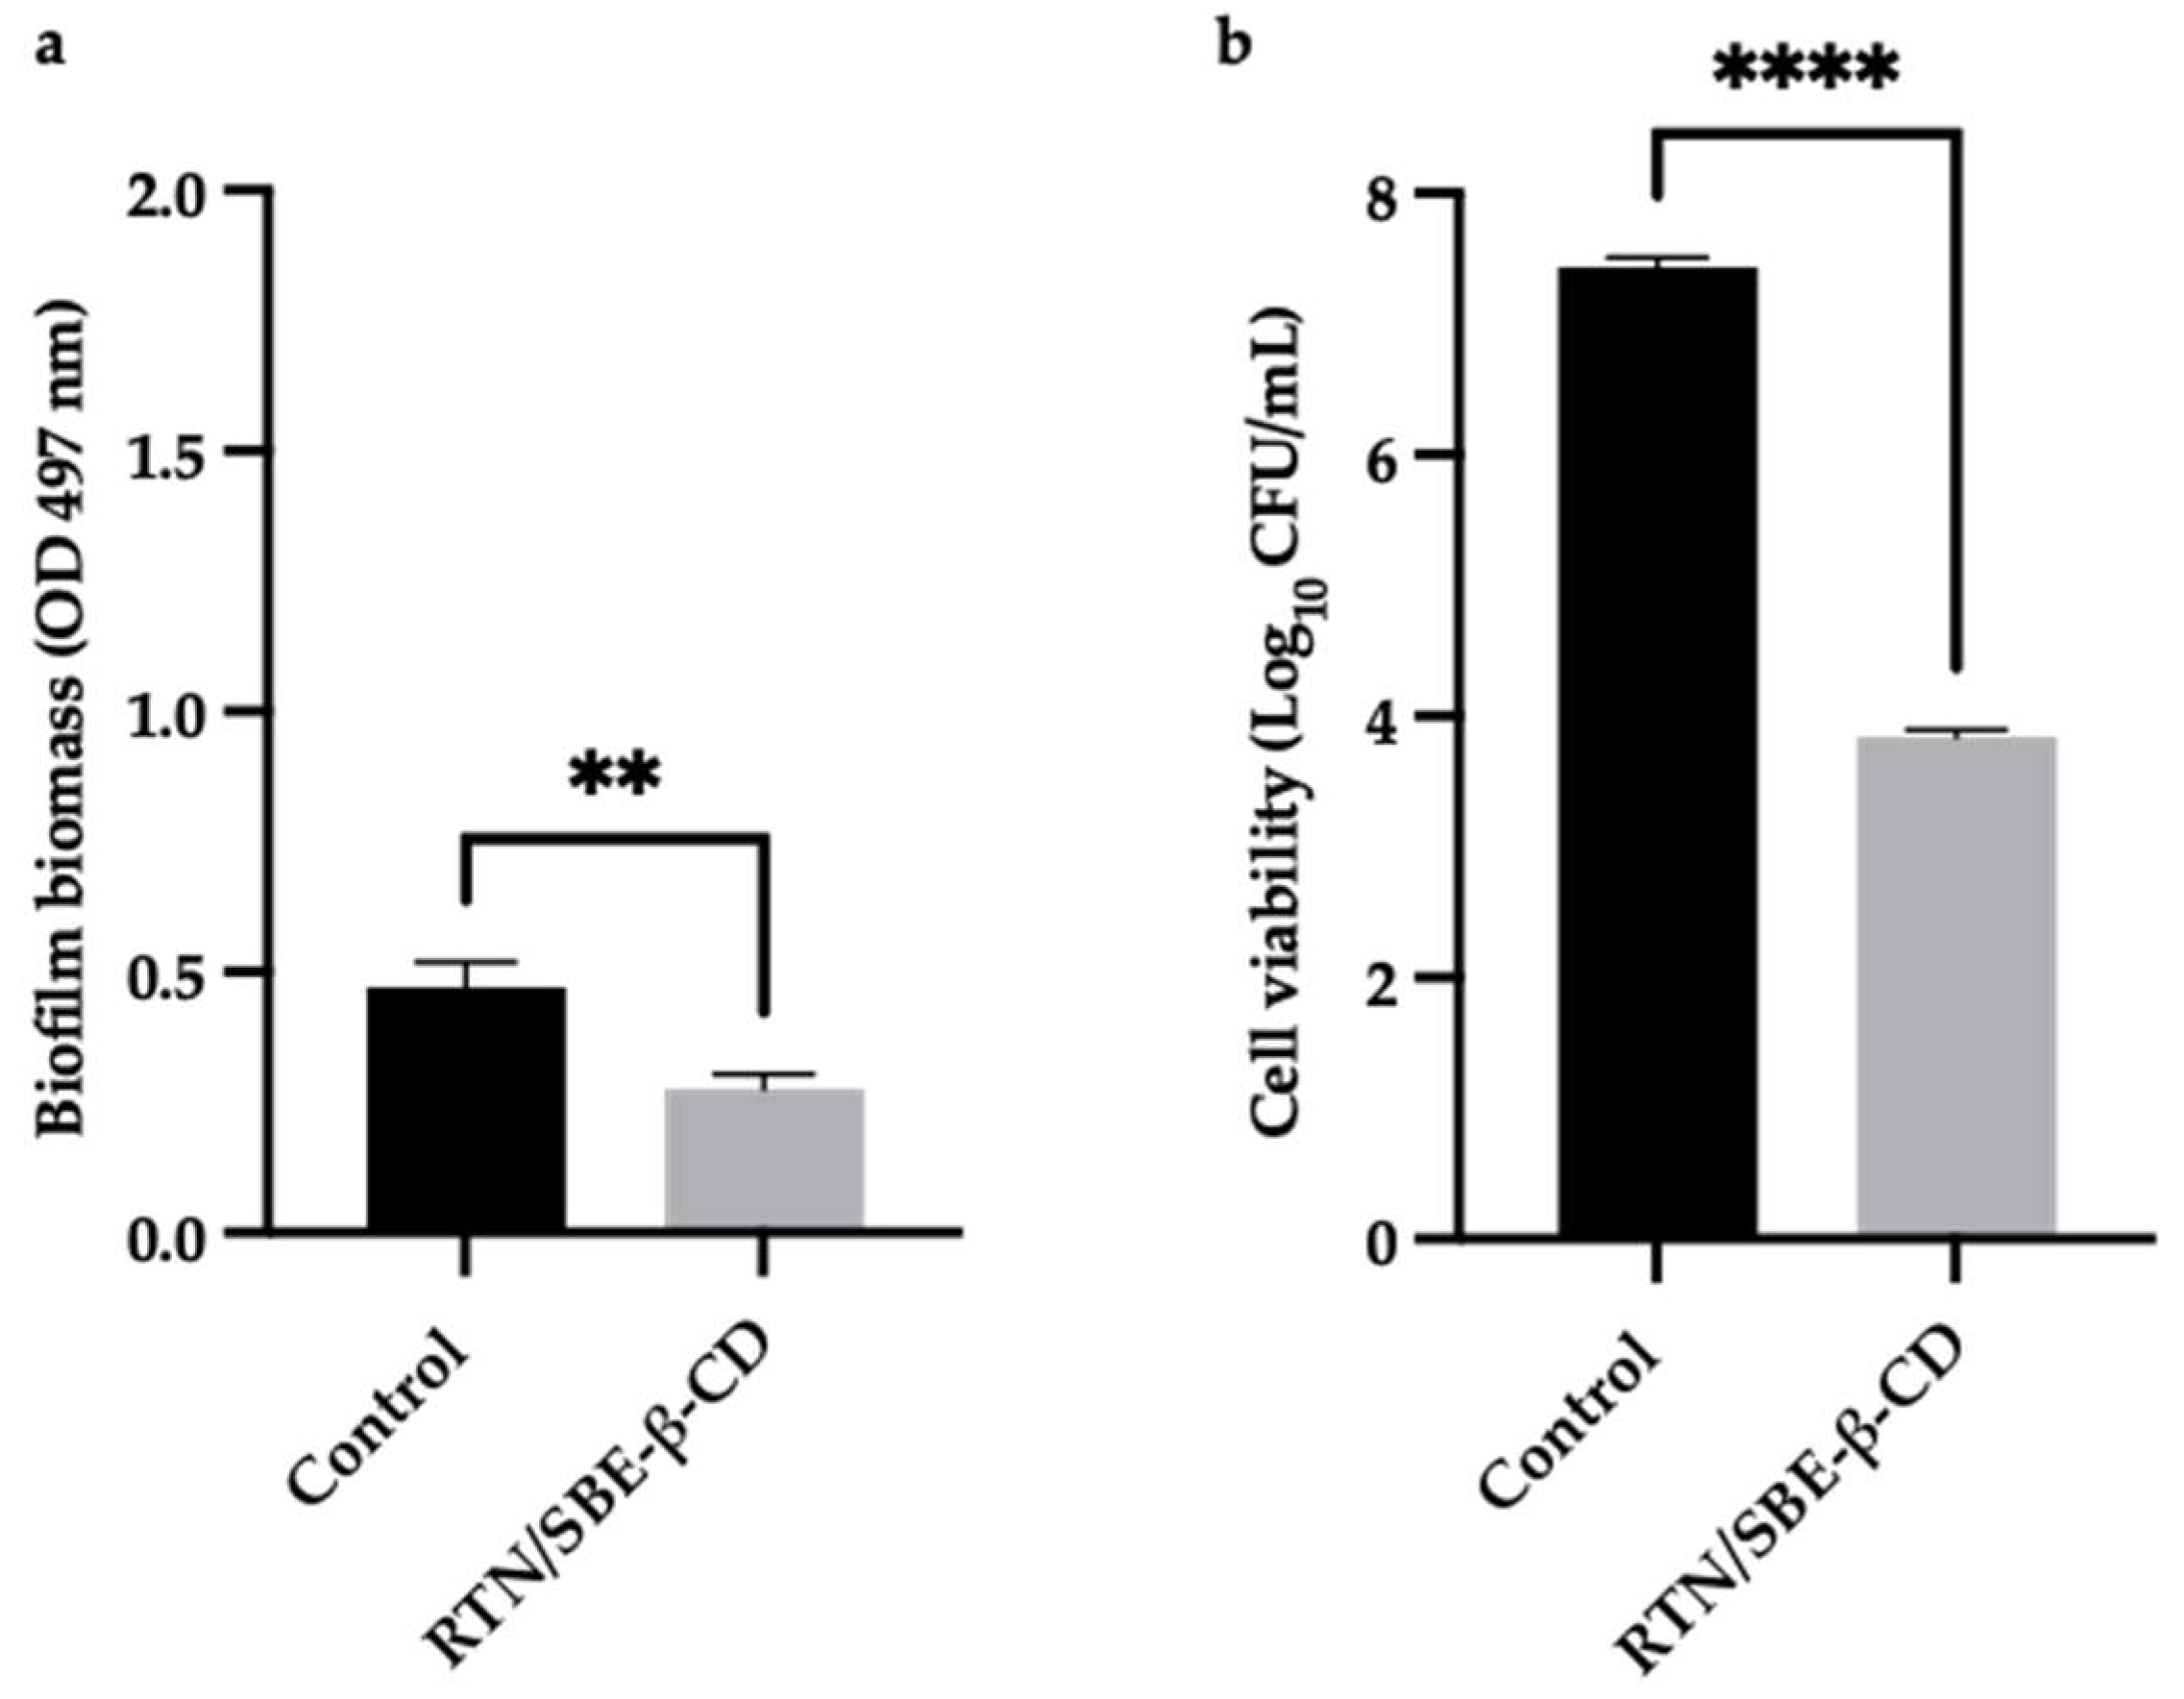
Table 1.
1H NMR chemical shifts in δ and ∆δ of RTN protons in the free state and RTN/SBE-β-CD 1:1 complex [9 mM in a 7:3 D2O/MeOD solution]; for doublet or double-doublet, the reported δ refer to the centered signal.
Table 1.
1H NMR chemical shifts in δ and ∆δ of RTN protons in the free state and RTN/SBE-β-CD 1:1 complex [9 mM in a 7:3 D2O/MeOD solution]; for doublet or double-doublet, the reported δ refer to the centered signal.
| Protons | RTN | RTN/SBE-β-CD | ∆δa |
|---|---|---|---|
| 2ʹ | 7.67 (d) | 7.76 (d) | 0.09 |
| 5ʹ | 6.98 (d) | 7.05 (d) | 0.07 |
| 6ʹ | 7.61 (dd) | 7.71 (dd) | 0.10 |
| 6 | 6.30 (d) | 6.35 (d) | 0.05 |
| 8 | 6.49 (d) | 6.56 (d) | 1.07 |
| CH3 | 1.12 (d) | 1.20 (d) | 0.08 |
a ∆δ = δcomplex - δfree.
Table 2.
Minimum inhibitory concentration (MIC) and minimum bactericidal concentration (MBC) of RTN/SBE-β-CD inclusion complex compared to free RTN.
Table 2.
Minimum inhibitory concentration (MIC) and minimum bactericidal concentration (MBC) of RTN/SBE-β-CD inclusion complex compared to free RTN.
| Strains | Free RTN (μg/mL) | RTN/SBE-β-CD a (μg/mL) |
|---|---|---|
| S. aureus ATCC 6538 | ||
| MIC | 75 | 1.22 |
| MBC | 150 | 4.88 |
| S. aureus ATCC 43300 | ||
| MIC | — | 1.22 |
| MBC | — | 4.88 |
| P. aeruginosa ATCC 9027 | ||
| MIC | 150 | 39.06 |
| MBC | — | 39.06 |
| P. aeruginosa DSM 102273 | ||
| MIC | — | 1250 |
| MBC | — | — |
a The concentration is referred to as the complexed RTN; — none activity.
Disclaimer/Publisher’s Note: The statements, opinions and data contained in all publications are solely those of the individual author(s) and contributor(s) and not of MDPI and/or the editor(s). MDPI and/or the editor(s) disclaim responsibility for any injury to people or property resulting from any ideas, methods, instructions or products referred to in the content. |
© 2024 by the authors. Licensee MDPI, Basel, Switzerland. This article is an open access article distributed under the terms and conditions of the Creative Commons Attribution (CC BY) license (http://creativecommons.org/licenses/by/4.0/).
Copyright: This open access article is published under a Creative Commons CC BY 4.0 license, which permit the free download, distribution, and reuse, provided that the author and preprint are cited in any reuse.
MDPI Initiatives
Important Links
© 2024 MDPI (Basel, Switzerland) unless otherwise stated

