Submitted:
15 January 2024
Posted:
16 January 2024
You are already at the latest version
Abstract
Keywords:
1. Introduction
2. Experiments
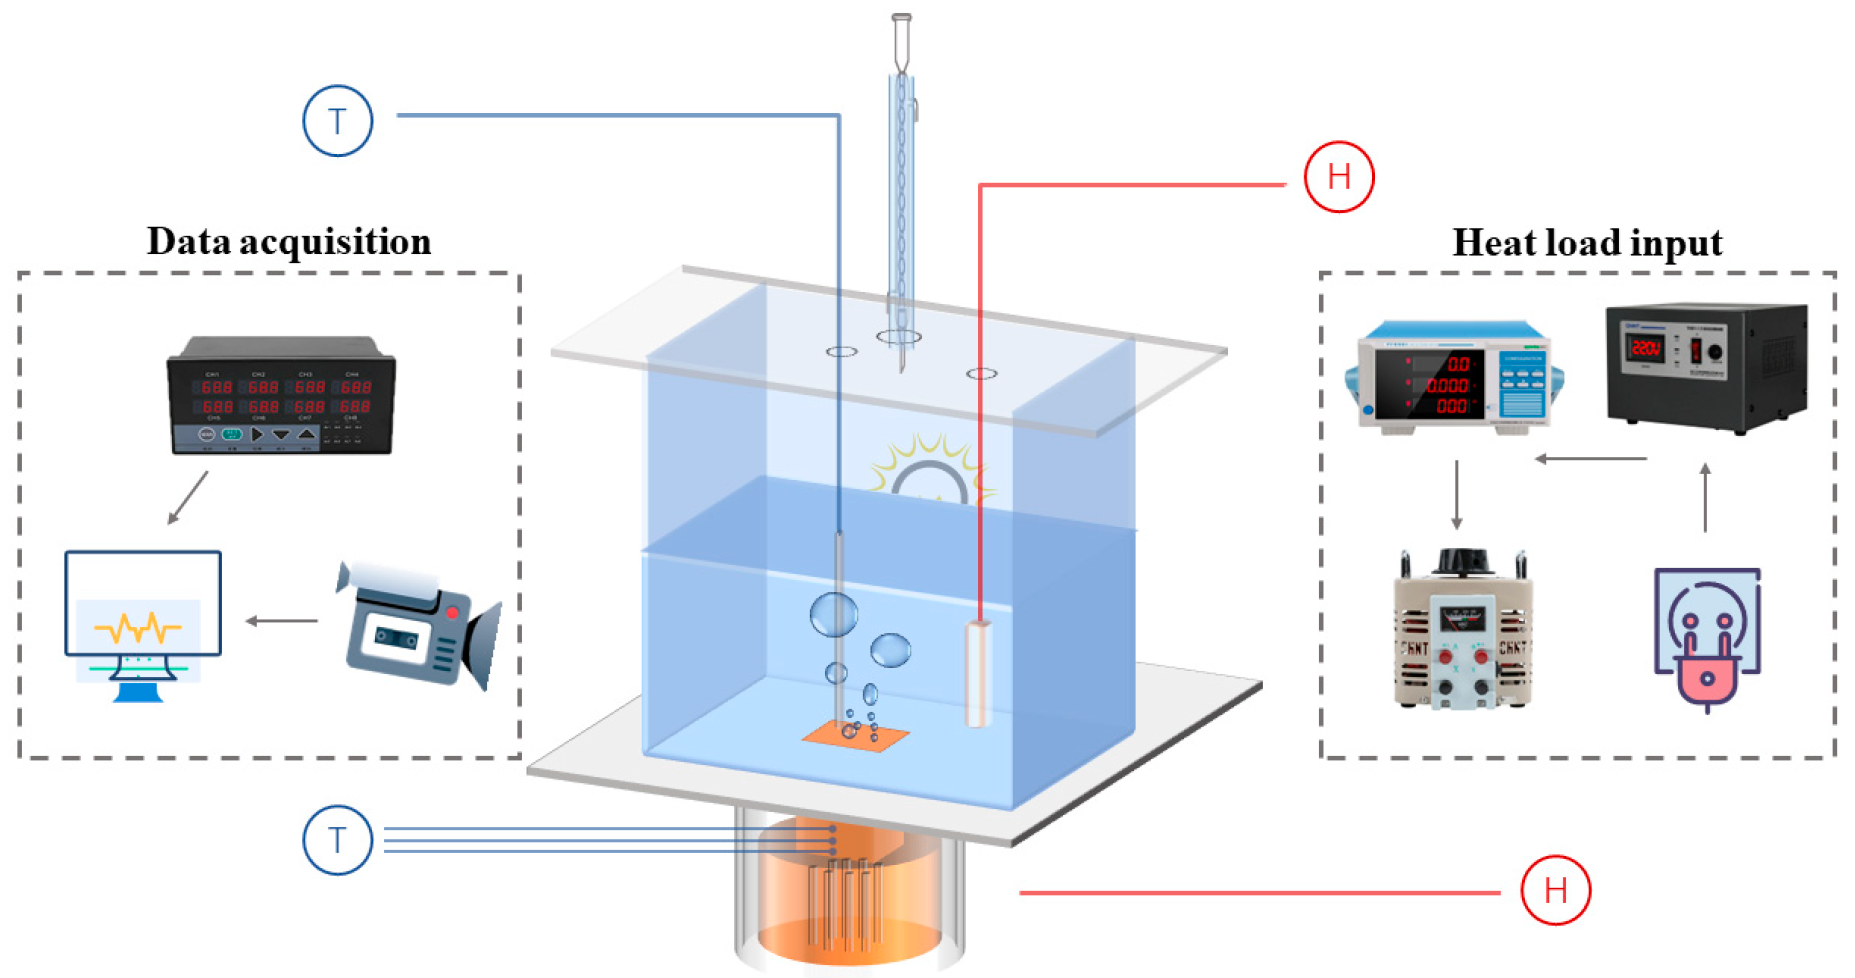
2.1. Experimental apparatus and procedure
2.2. Data reduction
2.3. Uncertainty analysis
3. Results and discussion
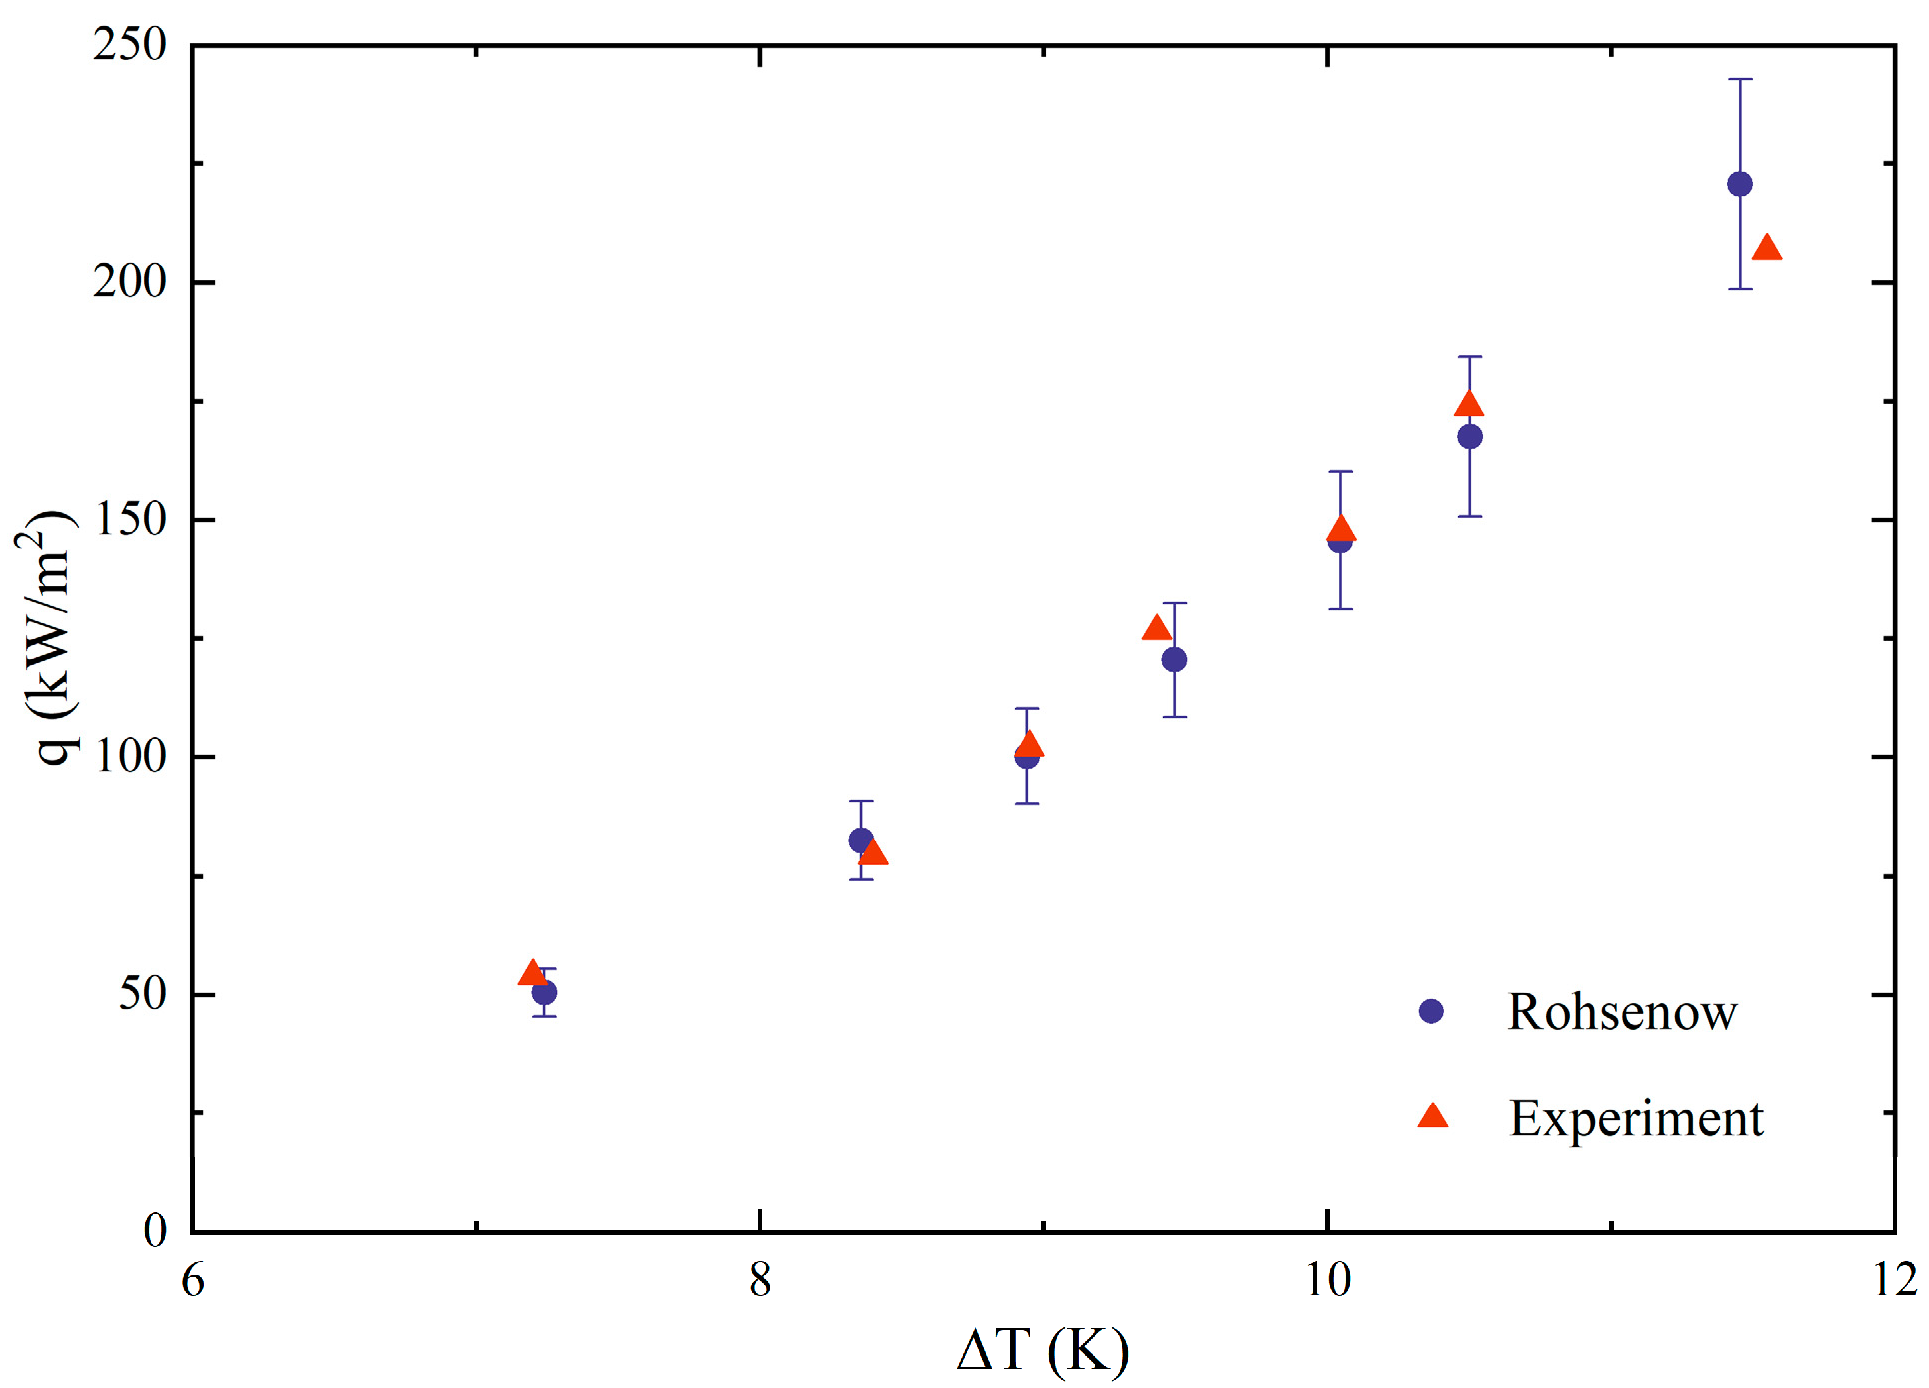
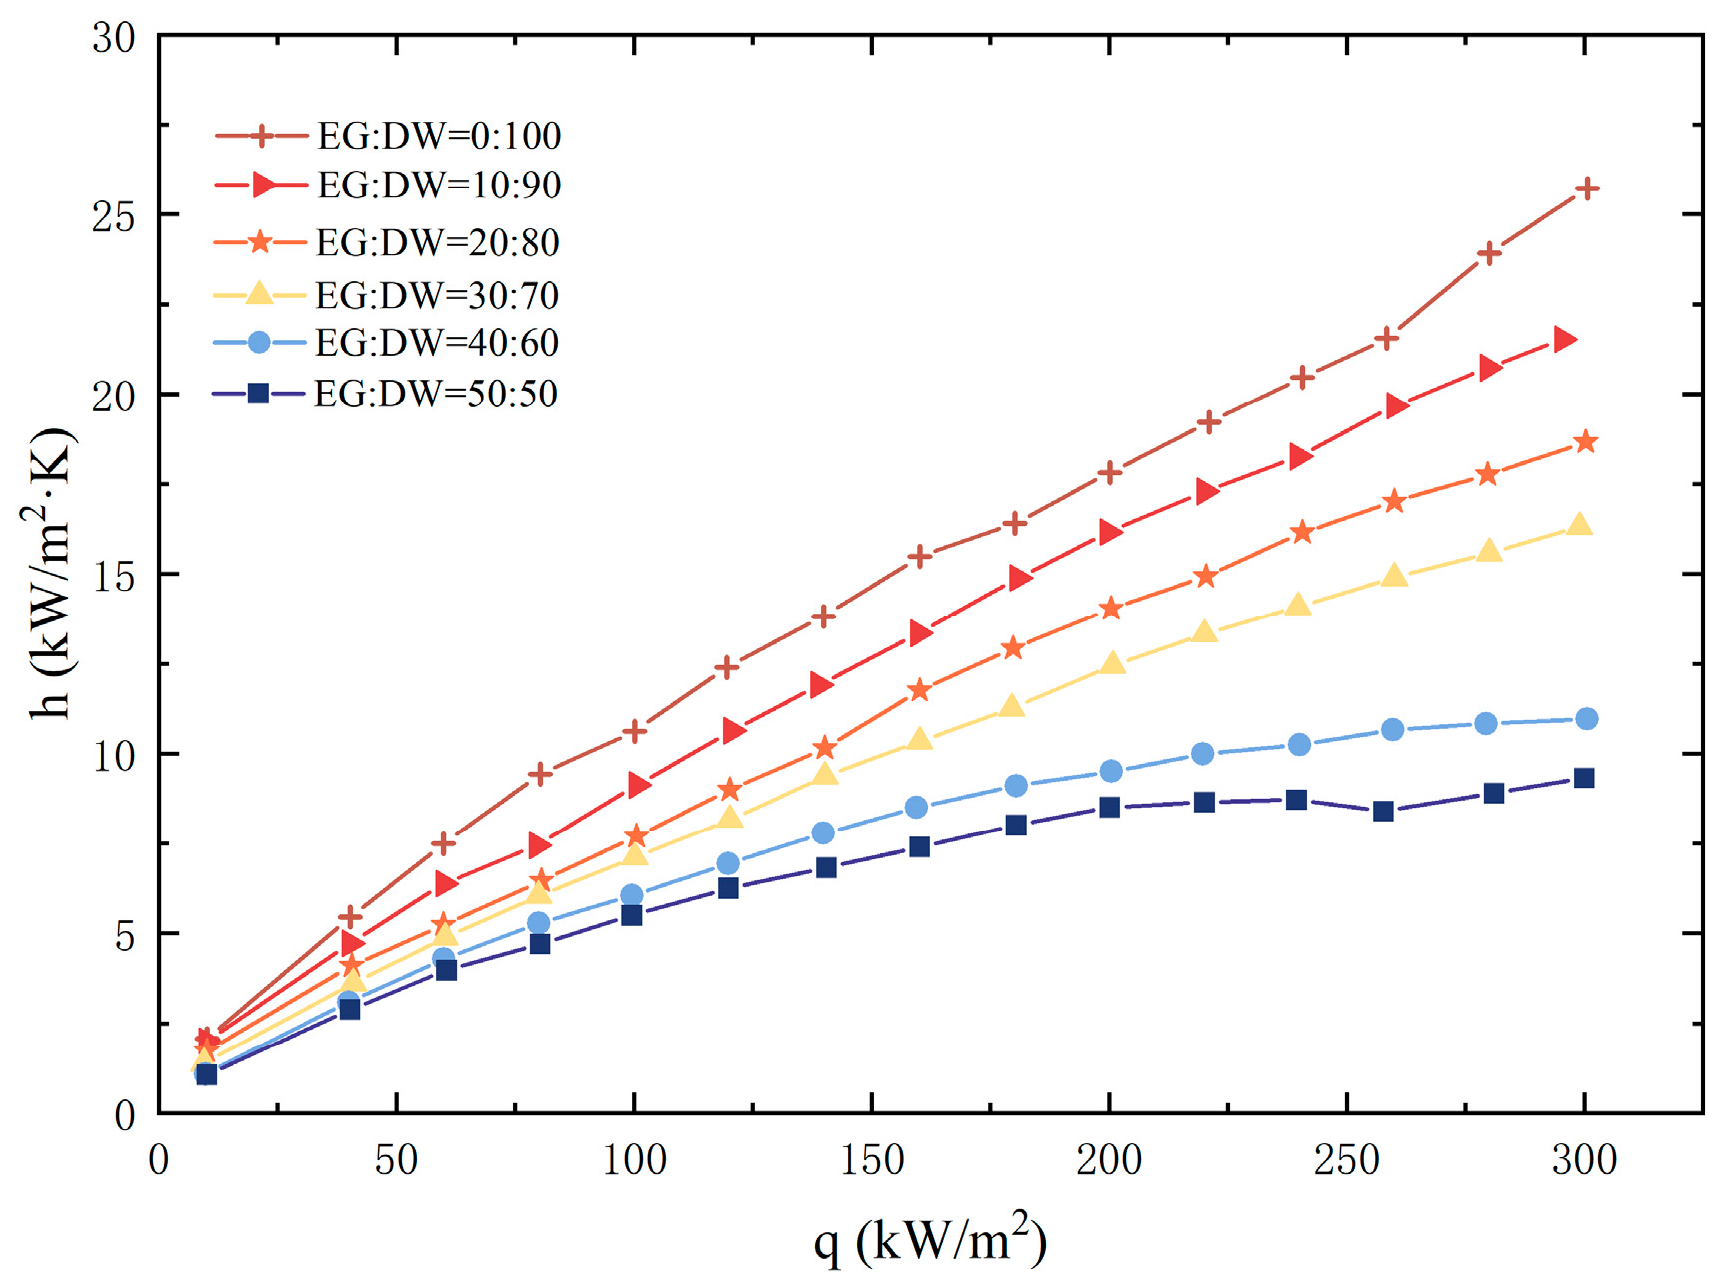
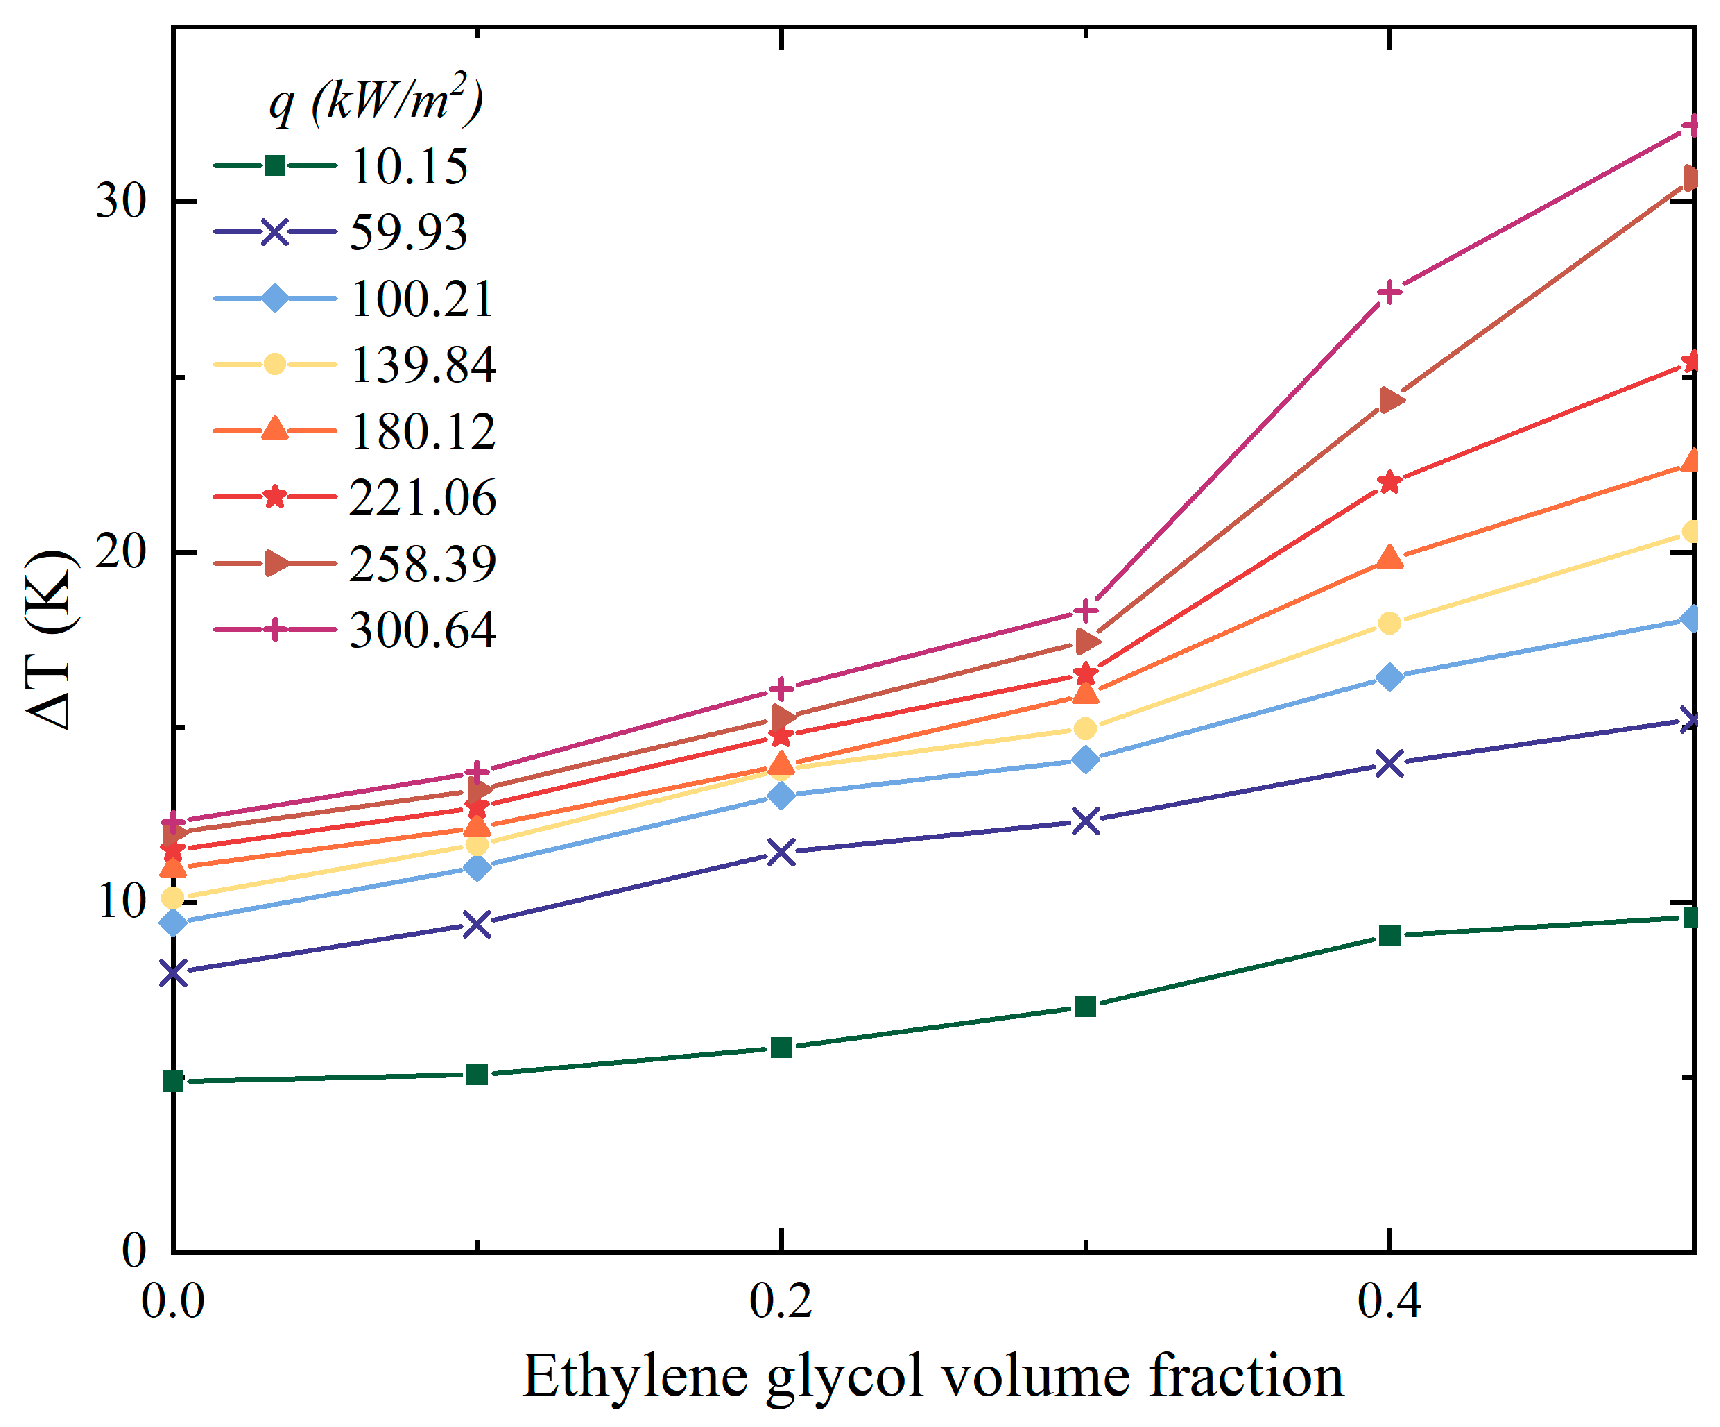
3.1. Pool boiling heat transfer performance
3.2. Thermophysical properties
3.3. Correlations of heat transfer coefficient
- The empirical constant calculated from using deionized water as the pure working fluid is not applicable to binary mixtures;
- The characteristics of non-azeotropic mixture during boiling are much more complex than those of pure components.
4. Conclusions
Author Contributions
Funding
Conflicts of Interest
Nomenclature
| A | heating surface area (m2) |
| b1,b2,b3,b4 | coefficients in Ünal’s correlation |
| B0 | empirical parameter |
| B1 | empirical constant |
| C1,C2,C3 | empirical parameter |
| Cp | specific heat at constant pressure(J·kg-1·K-1) |
| Csf | empirical constant |
| Db | bubble diameter (m) |
| f | bubble departure frequency |
| g0 | conversion coefficient (lbmft/hr2 lbf) |
| g | gravitational acceleration (m·s-2) |
| h | heat transfer coefficient (W·m-2·K) |
| hfg | latent heat of vaporization (kJ·kg-1) |
| I | electrical current (A) |
| Ja | Jacob number |
| K | deterioration factor |
| m | empirical parameter |
| P | pressure (Pa) |
| Pc | critical pressure of volatile component (Pa) |
| q | heat flux (kW·m-2) |
| rs | active cavity radius |
| S | coefficient affected by a heat flux |
| ∆T | superheat temperature (K) |
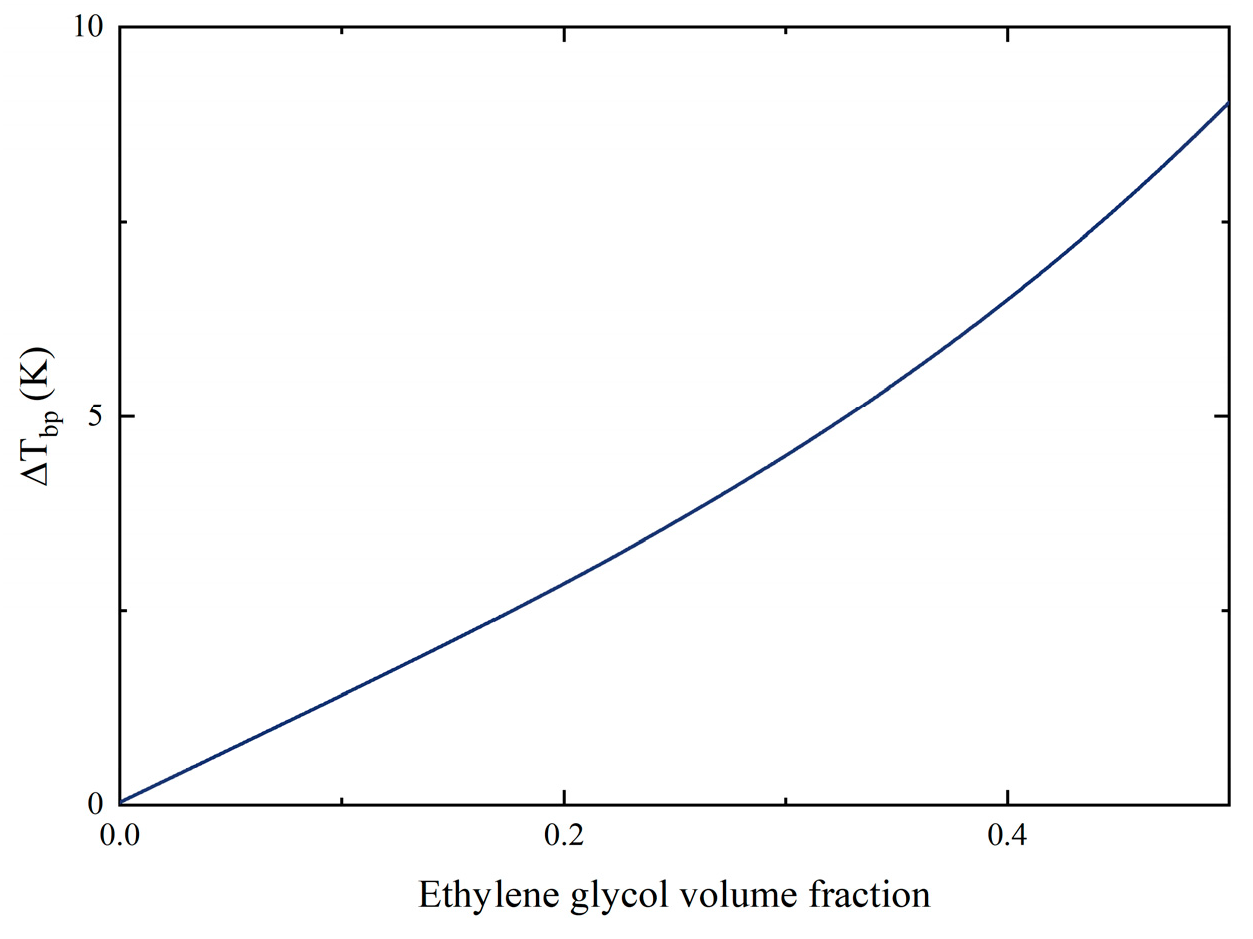
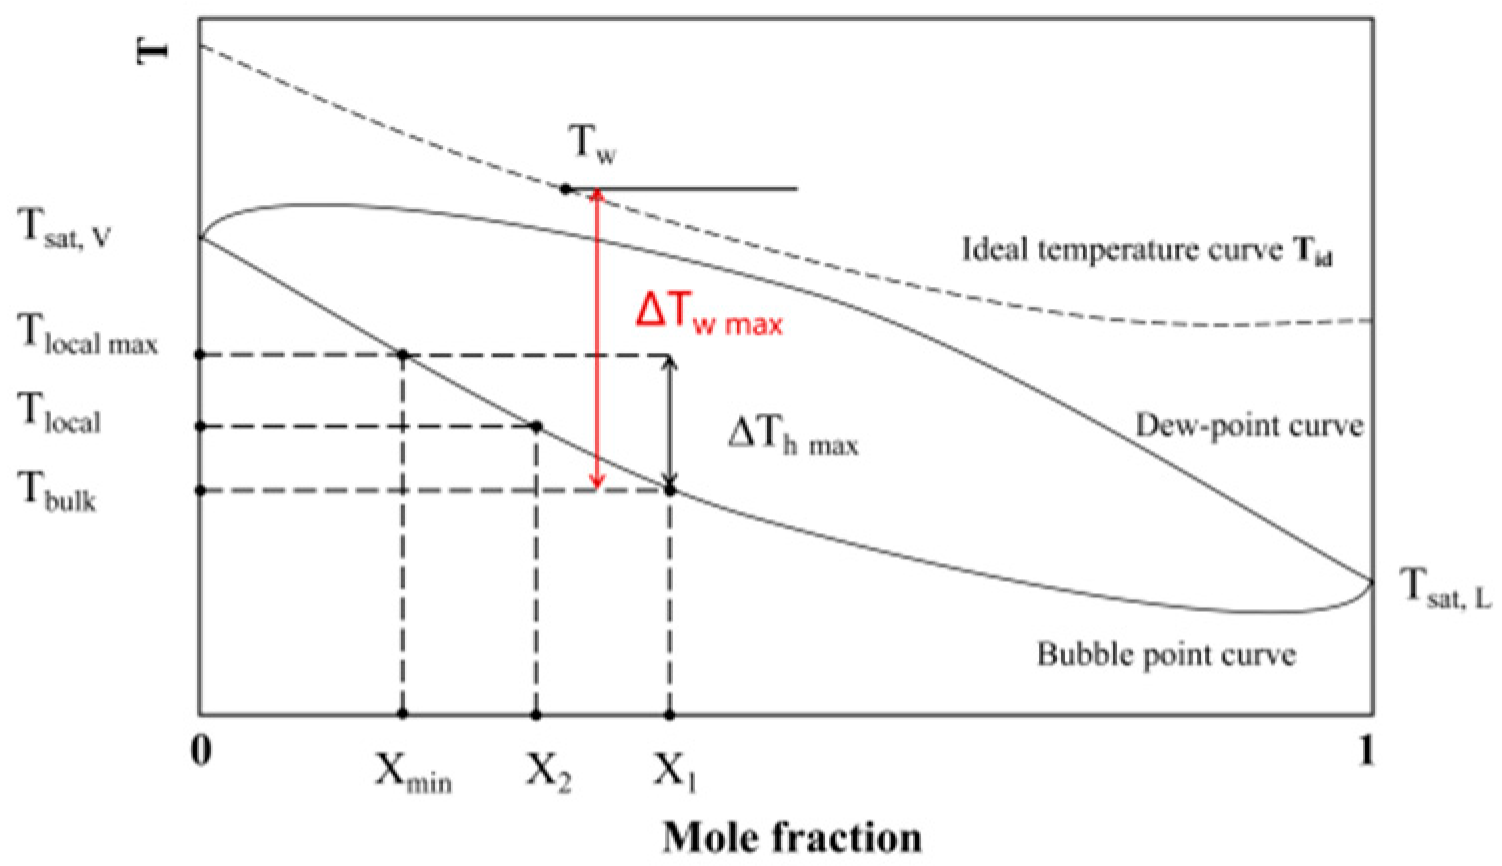
| ∆Tbp | temperature glide (K) |
| ∆TE | temperature difference between boiling and dew points (K) |
| Tbulk | boiling temperature before bubble occurring (K) |
| Ti | temperature at the corresponding measurement point of thermocouple (K) |
| Tk | average temperature of three thermocouples (K) |
| Tlocal | boiling temperature near nucleate cavity (K) |
| Tsat | saturate temperature of mixture (K) |
| Tw | temperature of heated surface (K) |
| V | electrical voltage (V) |
| x | mole fraction of the volatile phase |
| X | mole fraction of the volatile phase during boiling |
| y | mole fraction of the non-volatile phase |
| Greek symbols | |
| βL | mass transfer coefficient (m·s-1) |
| δ | the distance between two measurement point (m) |
| ε | distance between the corresponding measurement point and the top heating surface (m) |
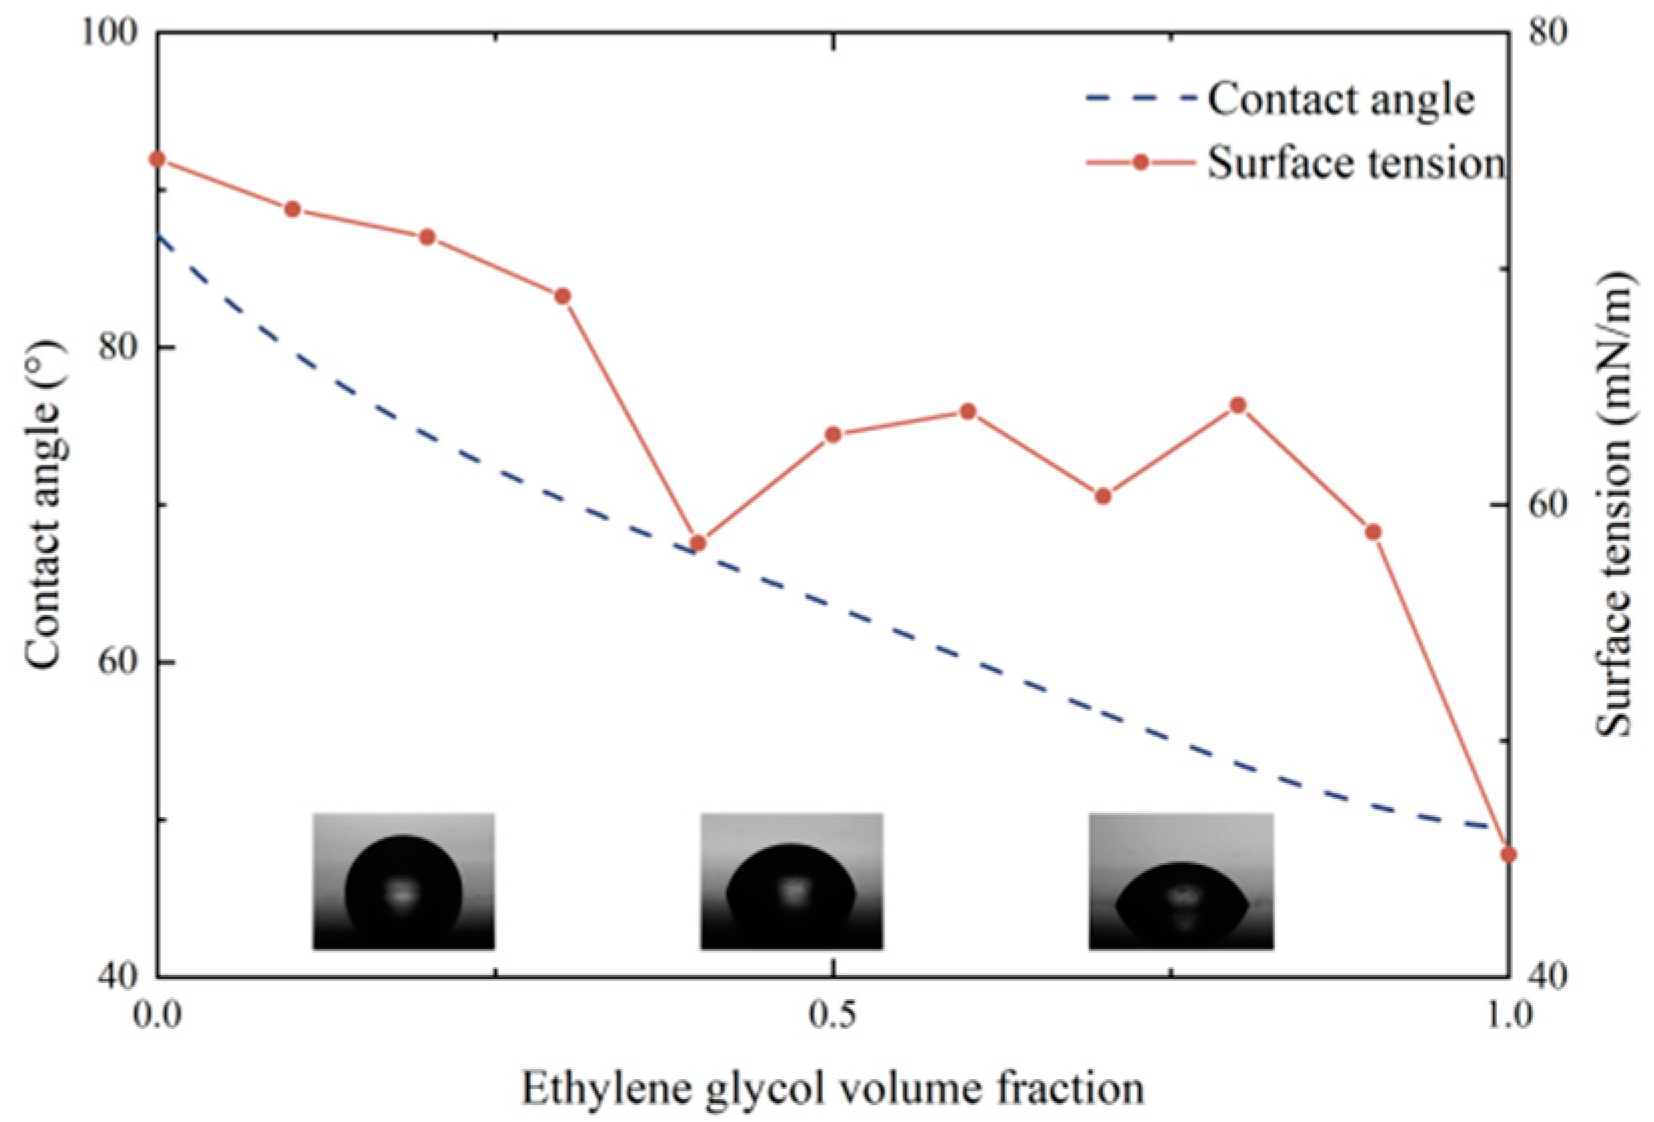
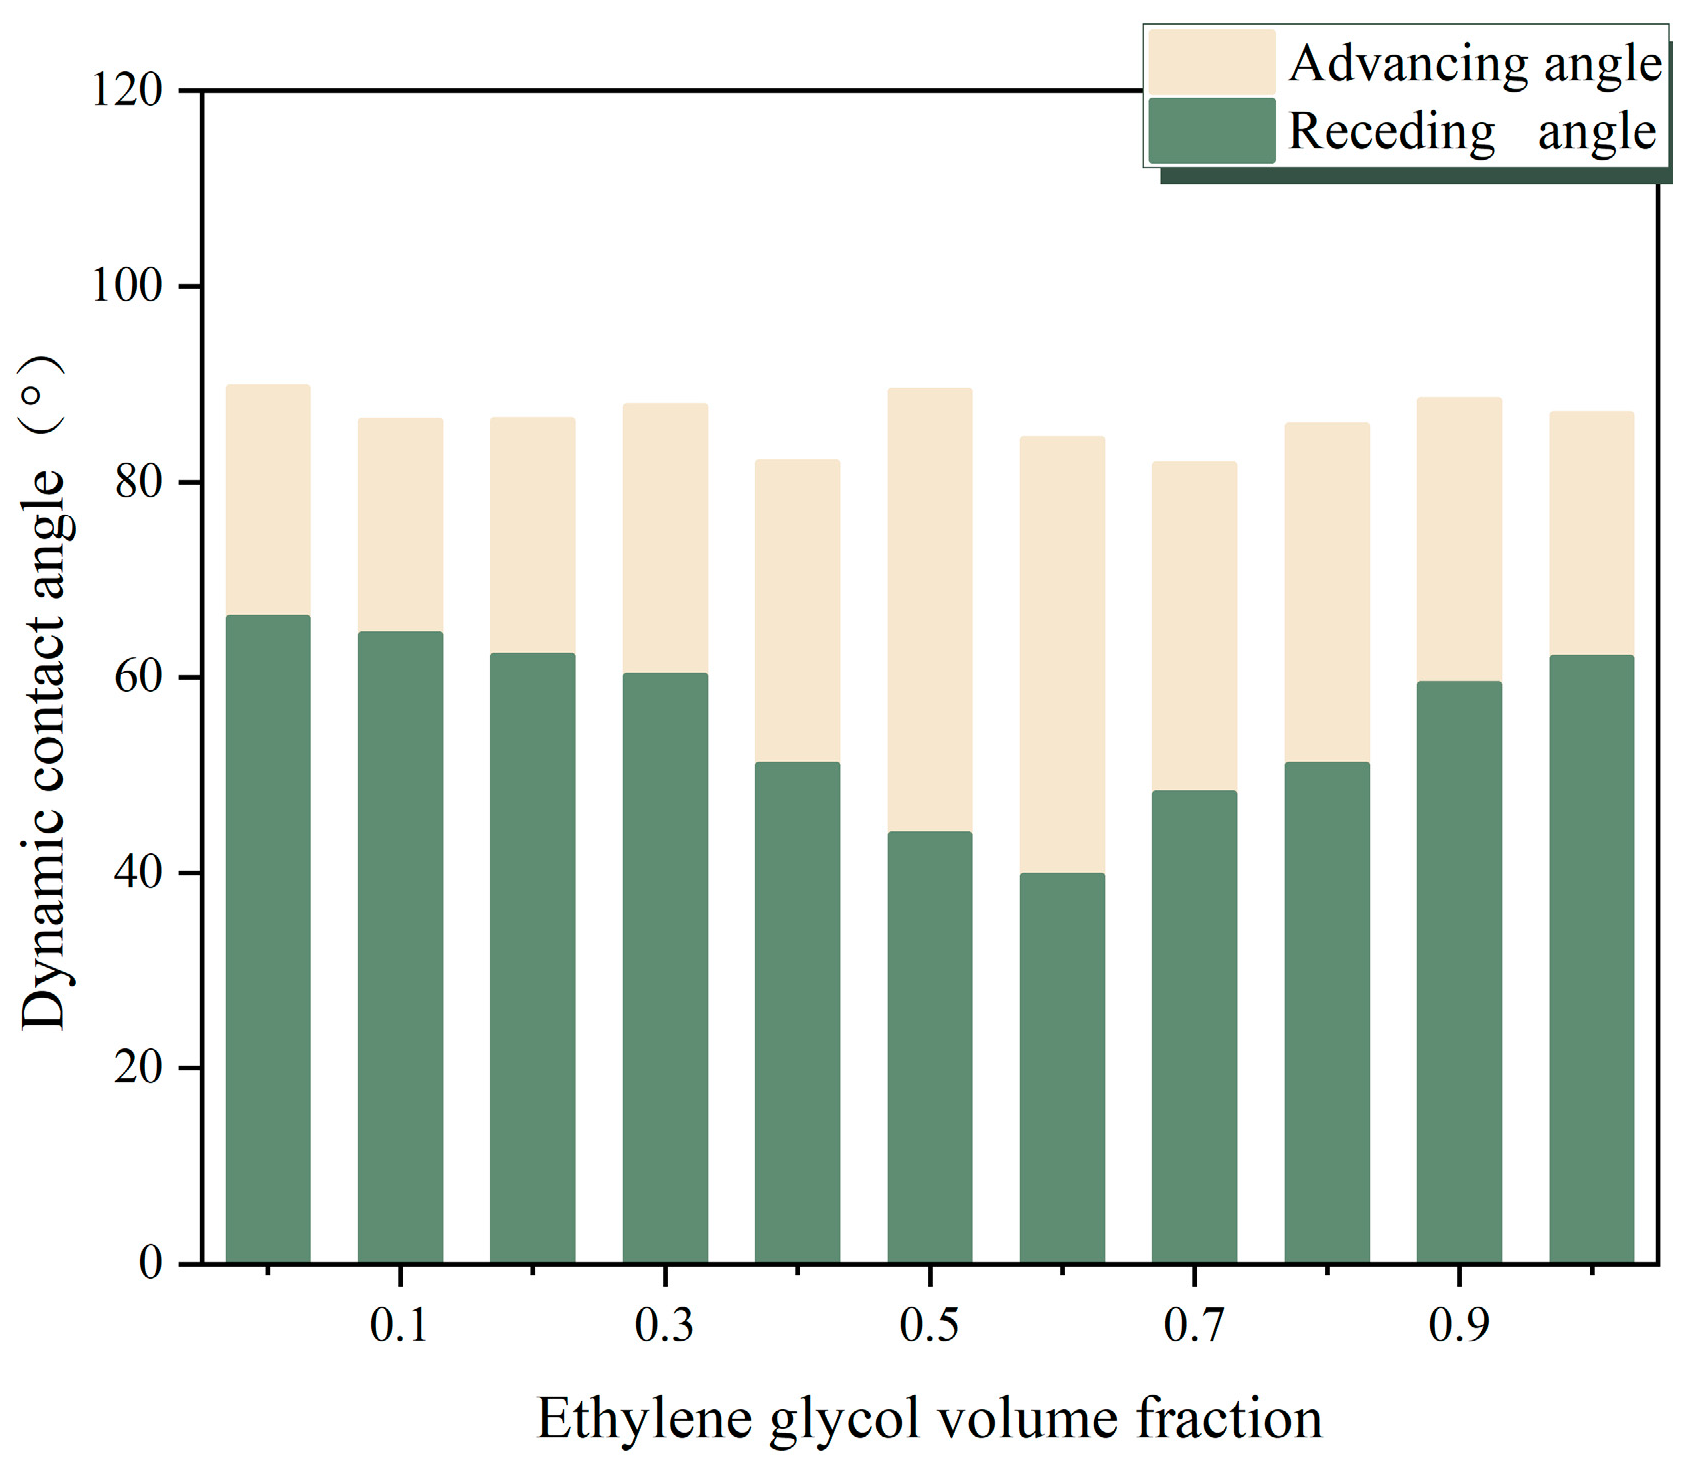
| θ | static contact angle (°) |
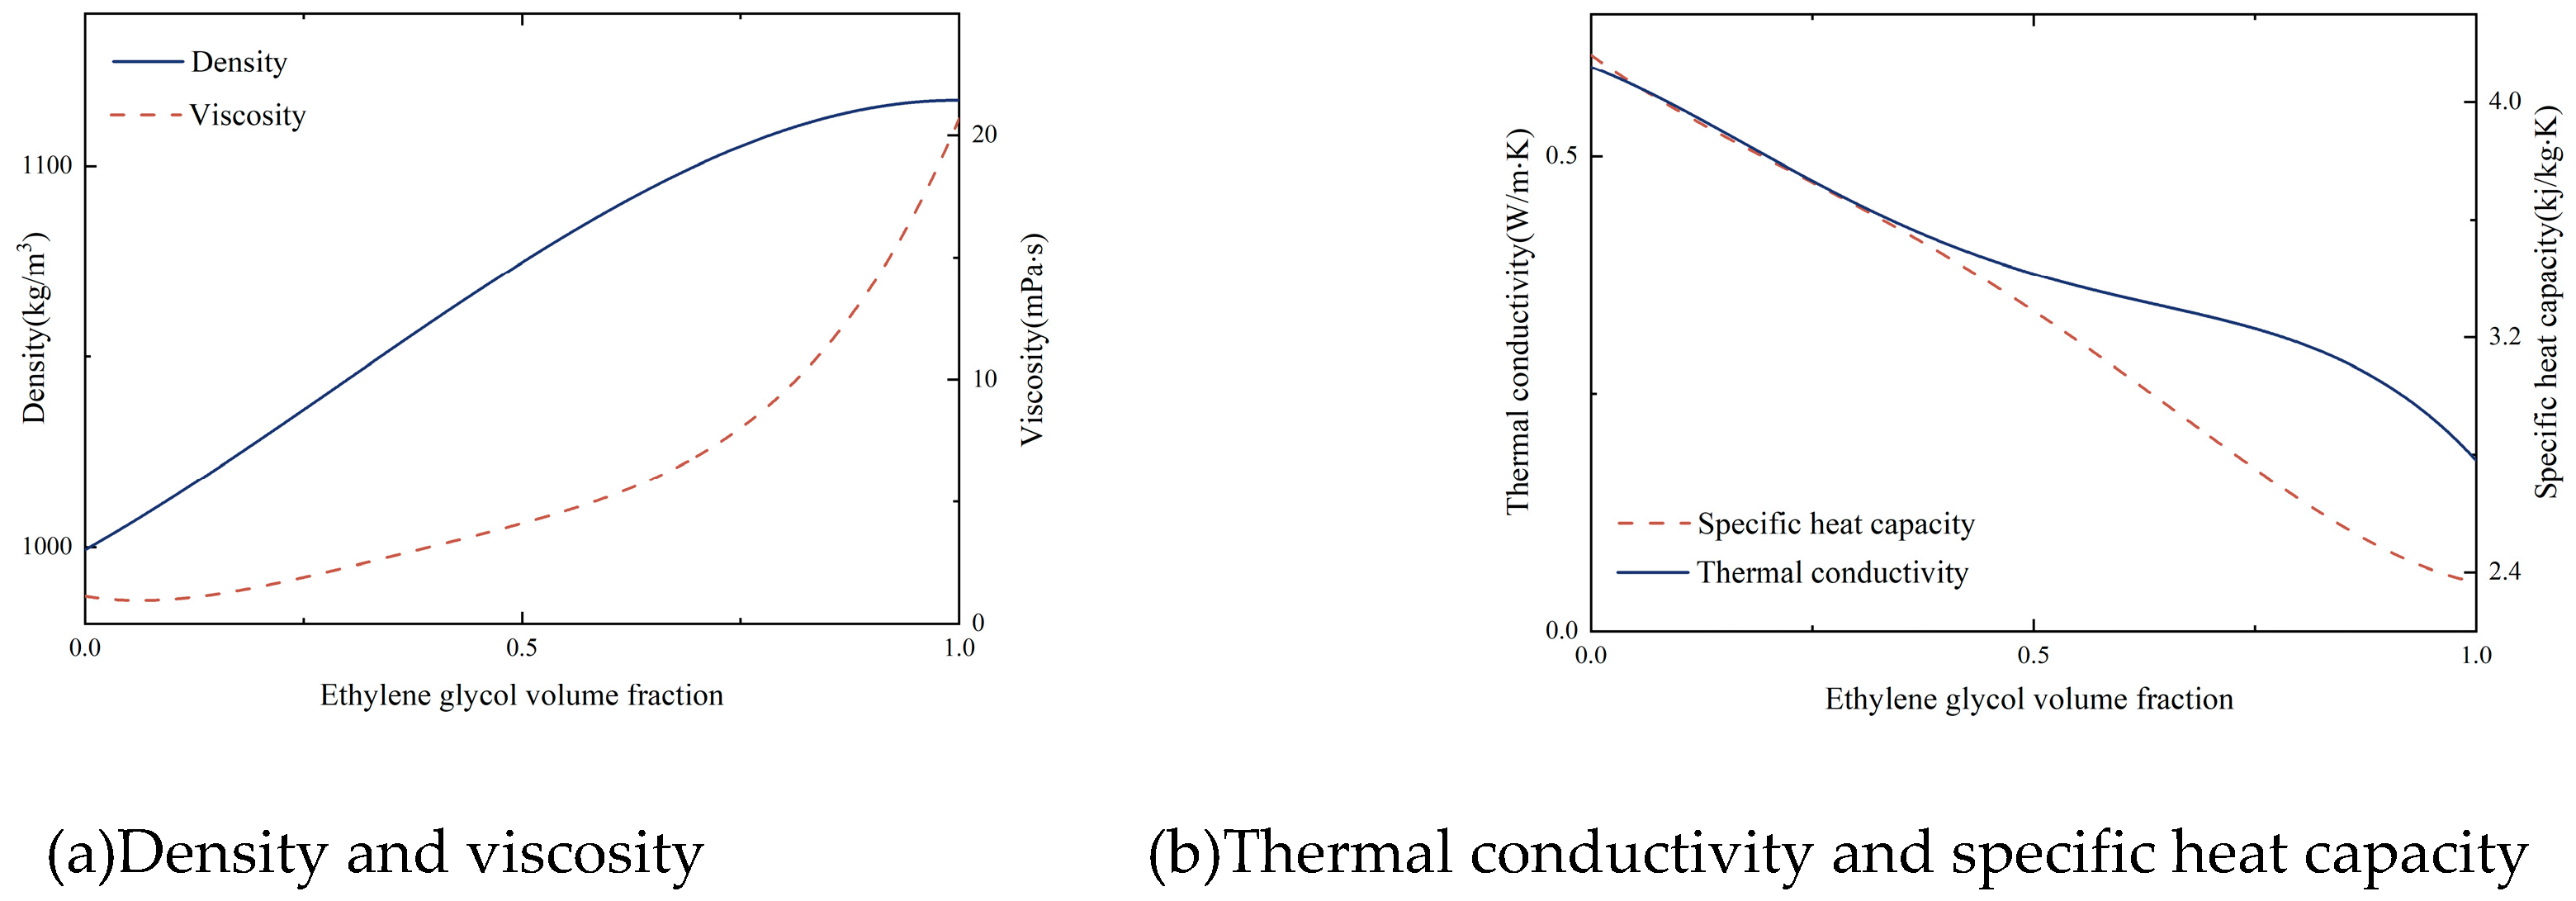
| λ | thermal conductivity (W·m-1·K-1) |
| μ | dynamic viscosity (mPa·s) |
| ρ | density (kg·m3) |
| σ | surface tension (mN·m-1) |
| φ | phase difference between voltage and electrical current |
| Subscripts | |
| sat | saturation |
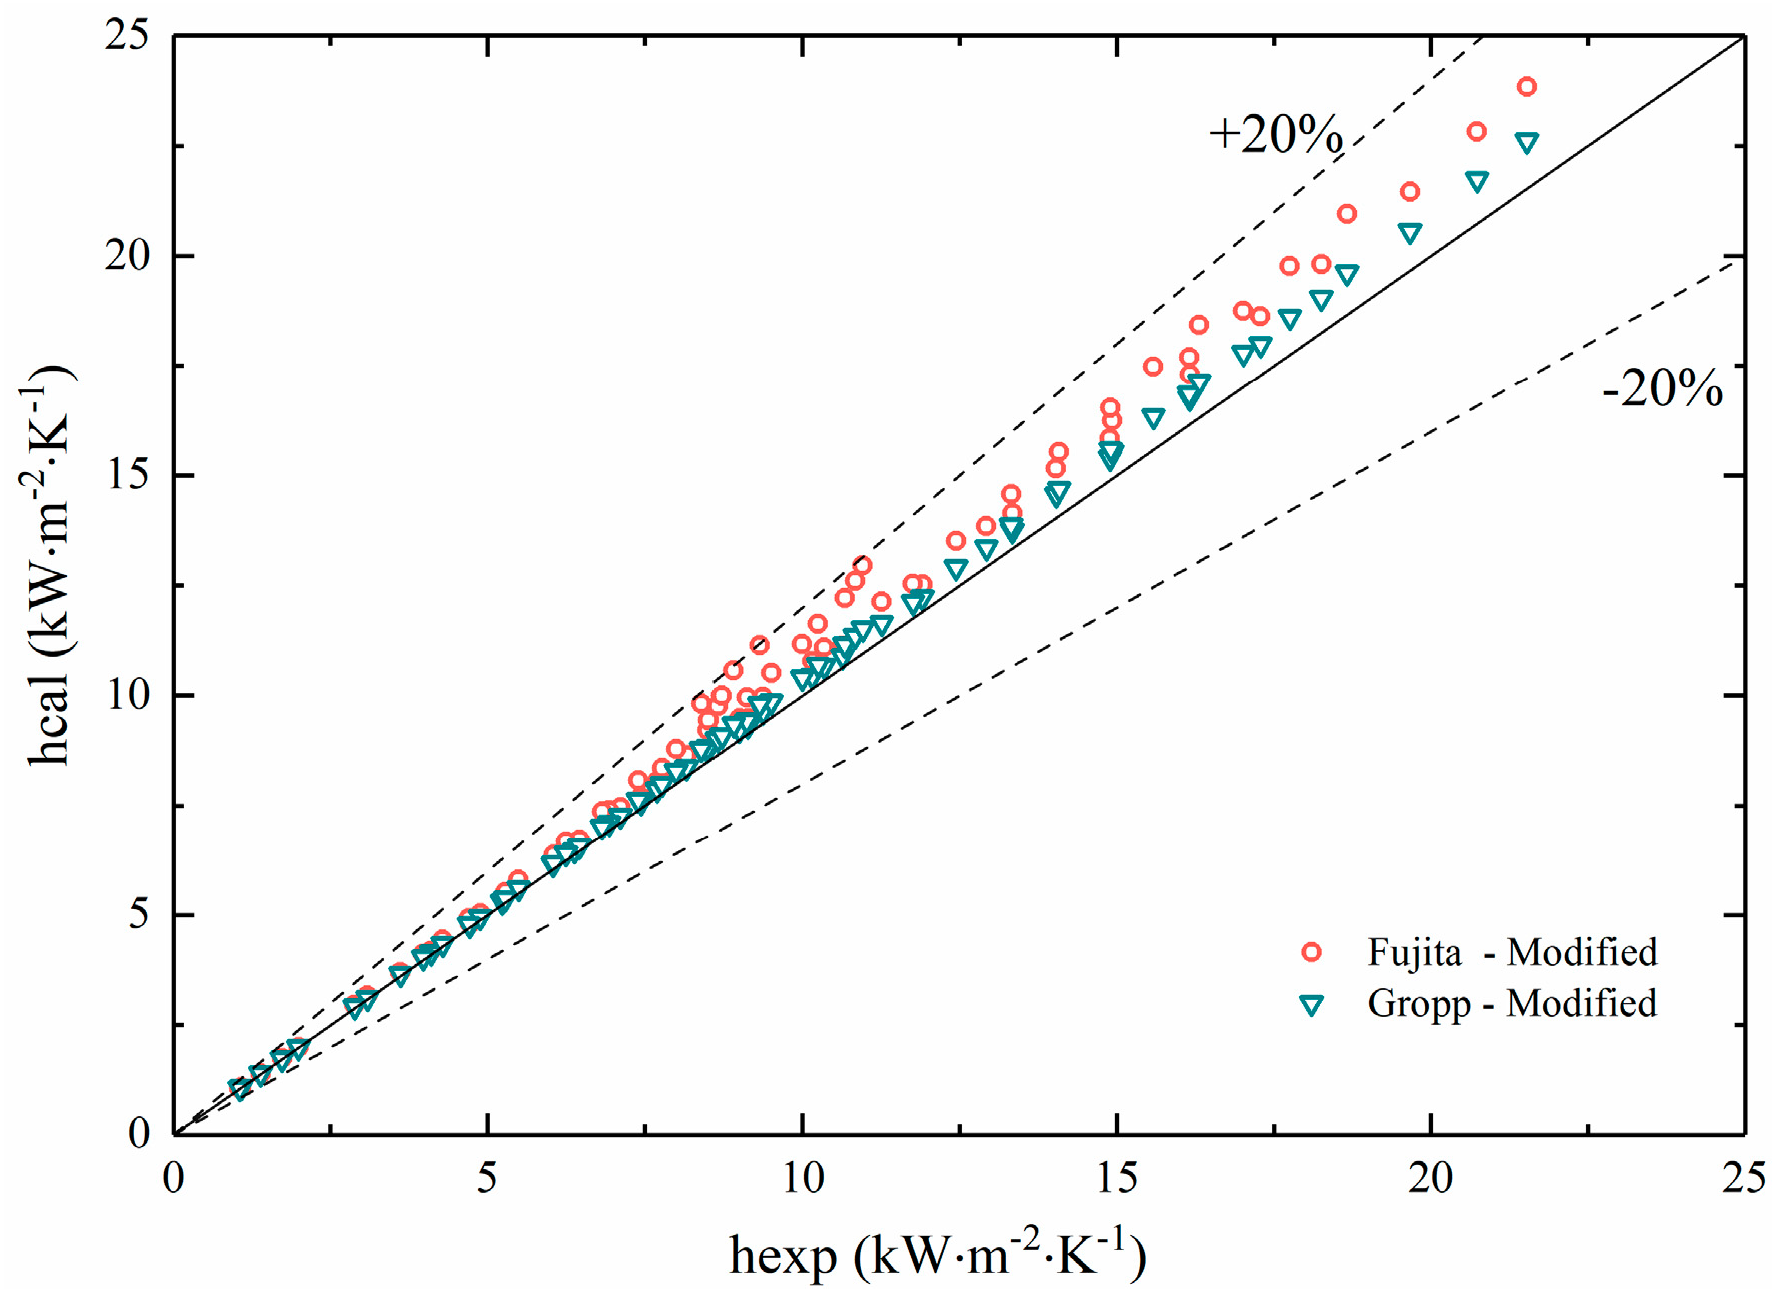
| exp | experimental |
| id | ideal |
| 1 | volatile component |
| 2 | less volatile component |
| c | critical |
| i | serial number of temperature measurement points |
| l | liquid phase |
| v | vapor phase |
References
- M. Song, J. Zhengyong, D. Chaobin, J. Yuyan, S. Jun, and L. Xiaoyan, “Mathematical modeling investigation on flow boiling and high efficiency heat dissipation of two rectangular radial microchannel heat exchangers,” International Journal of Heat and Mass Transfer, vol. 190, p. 122736, Jul. 2022. [CrossRef]
- H. Chen et al., “Advance and prospect of power battery thermal management based on phase change and boiling heat transfer,” Journal of Energy Storage, vol. 53, p. 105254, Sep. 2022. [CrossRef]
- X. Ma and P. Cheng, “3D simulations of pool boiling above smooth horizontal heated surfaces by a phase-change lattice Boltzmann method,” International Journal of Heat and Mass Transfer, vol. 131, pp. 1095–1108, Mar. 2019. [CrossRef]
- H. Peng, G. Ding, W. Jiang, H. Hu, and Y. Gao, “Heat transfer characteristics of refrigerant-based nanofluid flow boiling inside a horizontal smooth tube,” International Journal of Refrigeration, vol. 32, no. 6, pp. 1259–1270, Sep. 2009. [CrossRef]
- J. Xu, X. Ji, W. Zhang, and G. Liu, “Pool boiling heat transfer of ultra-light copper foam with open cells,” International Journal of Multiphase Flow, vol. 34, no. 11, pp. 1008–1022, Nov. 2008. [CrossRef]
- Y. Tang, J. Zeng, S. Zhang, C. Chen, and J. Chen, “Effect of structural parameters on pool boiling heat transfer for porous interconnected microchannel nets,” International Journal of Heat and Mass Transfer, vol. 93, pp. 906–917, Feb. 2016. [CrossRef]
- A. Suriyawong and S. Wongwises, “Nucleate pool boiling heat transfer characteristics of TiO2–water nanofluids at very low concentrations,” Experimental Thermal and Fluid Science, vol. 34, no. 8, pp. 992–999, Nov. 2010. [CrossRef]
- H. Lv, H. Ma, Y. Zhao, N. Mao, and T. He, “Numerical simulation of flow boiling heat transfer characteristics of R134a/Ethane binary mixture in horizontal micro-tube,” International Journal of Refrigeration, vol. 146, pp. 126–134, Feb. 2023. [CrossRef]
- R. Prabakaran, M. Salman, P. G. Kumar, D. Lee, and S. C. Kim, “Boiling of R290+CF3i mixture inside an offset strip fin plate heat exchanger,” Applied Thermal Engineering, vol. 216, p. 119070, Nov. 2022. [CrossRef]
- C. Xu, Z. Qian, and J. Ren, “A Comprehensive Experimental Investigation of Additives to Enhance Pool Boiling Heat Transfer of a Non-Azeotropic Mixture,” Entropy, vol. 24, no. 11, p. 1534, Oct. 2022. [CrossRef]
- B. Markmann et al., “Experimental results of an absorption-compression heat pump using the working fluid ammonia/water for heat recovery in industrial processes,” International Journal of Refrigeration, vol. 99, pp. 59–68, Mar. 2019. [CrossRef]
- P. P. J. Vorster and J. P. Meyer, “Wet compression versus dry compression in heat pumps working with pure refrigerants or non-azeotropic binary mixtures for dierent heating applications,” International Journal of Refrigeration, 2000.
- S. Zhang, H. Wang, and T. Guo, “Experimental investigation of moderately high temperature water source heat pump with non-azeotropic refrigerant mixtures,” Applied Energy, vol. 87, no. 5, pp. 1554–1561, May 2010. [CrossRef]
- J.-Y. Jung, E. S. Kim, Y. Nam, and Y. T. Kang, “The study on the critical heat flux and pool boiling heat transfer coefficient of binary nanofluids (H2O/LiBr + Al2O3),” International Journal of Refrigeration, vol. 36, no. 3, pp. 1056–1061, May 2013. [CrossRef]
- Y. Fujita and M. Tsutsui, “Heat transfer in nucleate pool boiling of binary mixtures,” International Journal of Heat and Mass Transfer, vol. 37, pp. 291–302, Mar. 1994. [CrossRef]
- D. Jung, K. Song, K. Ahn, and J. Kim, “Nucleate boiling heat transfer coefficients of mixtures containing HFC32, HFC125, and HFC134a,” International Journal of Refrigeration, vol. 26, no. 7, pp. 764–771, Nov. 2003. [CrossRef]
- M. Gong, Y. Wu, L. Ding, K. Cheng, and J. Wu, “Visualization study on nucleate pool boiling of ethane, isobutane and their binary mixtures,” Experimental Thermal and Fluid Science, vol. 51, pp. 164–173, Nov. 2013. [CrossRef]
- P. Gupta, M. Hayat, and R. Srivastava, “A Review on Nucleate Pool Boiling Heat Transfer of Binary Mixtures,” AJW, vol. 16, no. 2, pp. 27–34, Apr. 2019. [CrossRef]
- S. A. Alavi Fazel, “A genetic algorithm-based optimization model for pool boiling heat transfer on horizontal rod heaters at isolated bubble regime,” Heat Mass Transfer, vol. 53, no. 9, pp. 2731–2744, Sep. 2017. [CrossRef]
- W. M. Rohsenow, “A Method of Correlating Heat-Transfer Data for Surface Boiling of Liquids,” Journal of Fluids Engineering, vol. 74, no. 6, pp. 969–975, Aug. 1952. [CrossRef]
- B. B. Mikic and W. M. Rohsenow, “A New Correlation of Pool-Boiling Data Including the Effect of Heating Surface Characteristics,” Journal of Heat Transfer, vol. 91, no. 2, pp. 245–250, May 1969. [CrossRef]
- D. S. Wen and B. X. Wang, “Effects of surface wettability on nucleate pool boiling heat transfer for surfactant solutions,” International Journal of Heat and Mass Transfer, vol. 45, no. 8, pp. 1739–1747, Apr. 2002. [CrossRef]
- C. H. Wang and V. K. Dhir, “Effect of Surface Wettability on Active Nucleation Site Density During Pool Boiling of Water on a Vertical Surface,” Journal of Heat Transfer, vol. 115, no. 3, pp. 659–669, Aug. 1993. [CrossRef]
- J. Li, L. Lin, S. Li, Z. Yang, and Y. Duan, “Experimental study on nucleate pool boiling heat transfer characteristics of R32 + R1234yf binary mixtures,” Applied Thermal Engineering, vol. 205, p. 118047, Mar. 2022. [CrossRef]
- K. Stephan and M. Körner, “Berechnung des Wärmeübergangs verdampfender binärer Flüssigkeitsgemische: Berechnung des Wärmeübergangs verdampfender binärer Flüssigkeitsgemische,” Chemie Ingenieur Technik, vol. 41, no. 7, pp. 409–417, Apr. 1969. [CrossRef]
- H. C. Ünal, “Prediction of nucleate pool boiling heat transfer coefficients for binary mixtures,” International Journal of Heat and Mass Transfer, vol. 29, no. 4, pp. 637–640, Apr. 1986. [CrossRef]
- Y. Fujita and M. Tsutsui, “Heat Transfer in Nucleate Boiling of Binary Mixtures. (Development of a Heat Transfer Correlation).,” JSME Int. J., Ser. B, vol. 40, no. 1, pp. 134–141, 1997. [CrossRef]
- U. Gropp and E. U. Schldnder, “The influence of liquid-side mass transfer on heat transfer and selectivity during surface and nucleate boiling of liquid mixtures in a falling film”.
- T. Inoue, N. Kawae, and M. Monde, “Characteristics of heat transfer coefficient during nucleate pool boiling of binary mixtures,” Heat and Mass Transfer, vol. 33, no. 4, pp. 337–344, Feb. 1998. [CrossRef]
| Parameter | Range | Uncertainty |
| q kW/m2 | 8~325 | 1.8%~8.21% |
| Tw K | 373~408 | 0.1% |
| Tsat K | 373~382 | 0.1% |
| h kW/m2·K | 0~30 | 2.01%~8.6% |
Disclaimer/Publisher’s Note: The statements, opinions and data contained in all publications are solely those of the individual author(s) and contributor(s) and not of MDPI and/or the editor(s). MDPI and/or the editor(s) disclaim responsibility for any injury to people or property resulting from any ideas, methods, instructions or products referred to in the content. |
© 2024 by the authors. Licensee MDPI, Basel, Switzerland. This article is an open access article distributed under the terms and conditions of the Creative Commons Attribution (CC BY) license (http://creativecommons.org/licenses/by/4.0/).


