Preprint
Article

Renewable Microgrid Modeling for Power Quality Analysis

Altmetrics

Downloads

147

Views

94

Comments

0

Submitted:

16 January 2024

Posted:

16 January 2024

You are already at the latest version

Alerts
Abstract
Currently, one of the main focuses of attention in academia is microgrids (MGs) and their ability to maintain stable, resilient, reliable and high–power quality operations. A crucial component in MGs is power converters (PC), which facilitate the decentralization of power generation. This decentralization, however, poses challenges in terms of power quality. This paper presents a microgrid model based on the IEEE 14–bus distribution system and aims to investigate the power quality when the MG operates while connected to the conventional power grid. The MG model has been developed using MATLAB–Simulink®, a specialized tool for electrical engineering simulations. The results obtained are subjected to rigorous analysis and compared with the compatibility levels established by the IEEE–519 standard. This approach allows an accurate assessment of the MGs’ ability to maintain power quality at acceptable levels while interconnected to the conventional power grid. Finally, this study provides a valuable contribution to the MGs’ field of microgrids by providing a detailed and quantitative assessment of power quality, which will aid in the design and optimization of MGs’ for effective implementation in real electric power systems.
Keywords: 
Subject: Engineering  -   Electrical and Electronic Engineering

1. Introduction

With the increase in energy demand, it is necessary to make full use of distributed generation units (DGUs) because of their numerous advantages, such as the reduction of both energy losses and greenhouse gas emissions, voltage regulation, maximum load reduction, a greater supply reliability compared with traditional centralized generations and improvements in power quality [1]. These DGUs are an important part of the electrical microgrid (MG), which is defined as a set of loads, DGUs and Energy Storage Systems (ESSs) with clearly defined electrical boundaries that have the capacity to operate autonomously and independently of the conventional distribution grid, thus ensuring the continuity of the electricity supply with a high level of reliability and to provide effective support for the large electrical grid [2,3,4,5]. MGs are easily affected by the load, however, mainly if it is unbalanced or nonlinear loads because of the high penetration of DGUs such as a photovoltaic (PV) system and wind power, as well as by the devices based on power electronics, which will significantly affect the power quality of the entire MG and potentially cause the collapse of the MG system itself [6].
This condition creates voltage issues such as distortion, fluctuations, and variations in a weak grid [7]. On the other hand, MGs can operate in two operating modes: islanding mode and grid–connected mode. When operating in islanding mode, the probability of disturbances such as distortion or voltage unbalance is high because of the impedance levels of the system. For the MG operating in a mode connected to the electrical grid, the most frequent problems are harmonic distortion and grid unbalances [8]. These events cause a series of complications, including poor performance of protection relays, the overheating of motors and transformers, as well as failure of capacitors that improve power factor [9,10]. Therefore, an important task is to provide a good power quality to supply both basic and commercial end users [11].
Research on power quality in MGs is not sufficiently addressed in scientific articles since the vast majority of researchers have focused their studies on large electrical grids [12]. Only a few studies of MGs are available in the literature; for example, in [13] the authors analyzed the power quality of a hybrid MG composed of a PV system, battery based ESSs and capacitive loads. The study was performed using DSS® software. The result of that study concluded that the total harmonic distortion (THD) values of voltage and current were high when PV system penetration increased in the MG. In [14], the authors examined the voltage stability limit in a distribution grid based on the IEEE 30-bus grid model for power flow studies. The design of the MG was performed using MATLAB–Simulink® software. The study concluded that voltage stability is robust in bus 30, while voltage stability weakened in bus 26. Power quality problems were analyzed in [15] in a typical MG by considering different levels of renewable energy penetration (33.3%, 66.6% and 99.9%), as well as different meteorological conditions. The design of the MG was carried out in MATLAB–Simulink®, and it was concluded that power quality problems occur with greater severity as renewable penetration increases. In [16], the authors analyze the power quality problems of an alternating current (AC) MG composed of a PV system using the PSS–SINCAL® software as a tool for MG modeling. The study determined the power flow variation and voltage at the local bus under solar disturbance conditions where the highest voltage THD index was found at the bus where the nonlinear load was connected. In [17] the authors examined three power quality problems: voltage imbalances, waveform distortion and voltage THD. Regarding the latter, it was concluded that as solar penetration varies the impact is greater in the nonlinear load than in the linear loads. In addition, it was determined that the voltage THD in non-linear loads was above the IEEE–519 standard limit (greater than 50%). In [18], the authors examined the performance of an AC–MG, through experimental evaluation, to determine the voltage THD of the MG buses that are within the limit established by IEEE–519. However, the current THD increased as solar generation decreased because of disturbances caused by shading or cloud effect. Finally, it was concluded that the current THD never exceeded the 5% limit permissible by the IEEE–519 standard when solar generation is above 60%.
In summary, most of the research studies available in the literature exhibit particular features determined by the configuration, topology, and the particular components used. Each study addresses challenges such as the dynamics and limited capacity of ESSs, the diversity of DGUs, power converters (PC), and the significant presence of nonlinear phenomena. Some approaches choose to model each DGU, simplifying the model to a linear and time-invariant system, characterized by a constant and a gain factor, without considering the dynamics of the grid. Other studies focus on PC-based DGUs, considering the full dynamic model of the grid instead of the PC, dividing the MG into three elements: PC, power grid, and loads. The design and modeling of the MGs proposed in these studies, however, do not consider the dynamic and steady-state behavior of the DGUs, as well as the imbalance and nonlinearity of the loads and the dynamics of the ESSs. They also do not face the problem of accidental or scheduled disconnection from the electrical grid, nor the minimum or maximum demand to which are subject to in their operation. Therefore, the motivation of this paper focuses on analyzing the most important aspects of the power quality of a 14–bus hybrid MG based on the original IEEE 14–bus distribution system, which operates in a mode connected to the electrical grid while considering the dynamics, the characteristics of the DGUs in steady-state, voltage variations, the nature of the loads, the dynamics of the ESSs, the disconnections of the electrical grids and the maximum demand scenario. Finally, the results obtained are compared and discussed considering the IEEE–519 standard to verify the effectiveness of the proposed model. The most important contributions of this document are listed below.
A fully detailed 14–bus MG system is designed and modeled, which operates in grid-connected mode for power quality studies. In this MG, DGUs, such as solar and wind power, as well as balanced and imbalanced loads that include both linear and nonlinear devices, battery-based ESSs, power transformers and distribution lines, are considered. In addition, some PCs are considered to which open-loop control strategies and other closed-loop control strategies have been implemented. It is worth mentioning that these rectifiers or inverters use pulse width modulation (PWM) techniques of different carrier frequencies.
This study provides information about the conflicts that arise related to the bidirectionality of power flows and the insertion of DGUs such as PV systems and wind power. Note that the proposed MG has a capacity of 4 MW and that 75% of that power is supplied by conventional generation based on a 3–MW diesel generator. Therefore, the most notable conflicts in this study are as follows: voltage variations, variations in the power factor (PF) in each bus of the MG and variations in the voltage and current THD index in each bus of the MG. Therefore, the study and analysis are relevant when compared with the IEEE–519 standard in this document.
Finally, this work is a starting point for the analysis of many current topics regarding MGs, optimization techniques, fault diagnosis, system identification and fault-tolerant control, among others, which will be detailed and expanded in future research.
As follows is how the document is organized. Section 2 addresses the generalities of MGs, including composition, structure, operation modes, classification and current challenges. Section 3 describes in detail the design and modeling of the proposed hybrid MG for power quality studies. The hybrid MG model is performed MATLAB–Simulink® software. Section 4, the results obtained from the hybrid MG operating in the electrical grid-connected mode are analyzed, discussed and compared with the IEEE–519 standard to verify the effectiveness of the proposed model. Finally, Section 5 summarizes the most important conclusions of the research.

2. Microgrid generalities

MGs are small-scale electrical power systems (EPSs) composed of DGUs, ESSs, PCs, AC–DC buses, mixed loads, control units, system monitoring and software interfaces. The technical complexity involved in modeling and simulation of MG is more complex than a conventional EPS, even though they are considered small-scale. Consequently, the implementation of models that facilitate dynamic analysis becomes a crucial element to guarantee the operational stability of future MGs [5].

2.1. Microgrid architecture

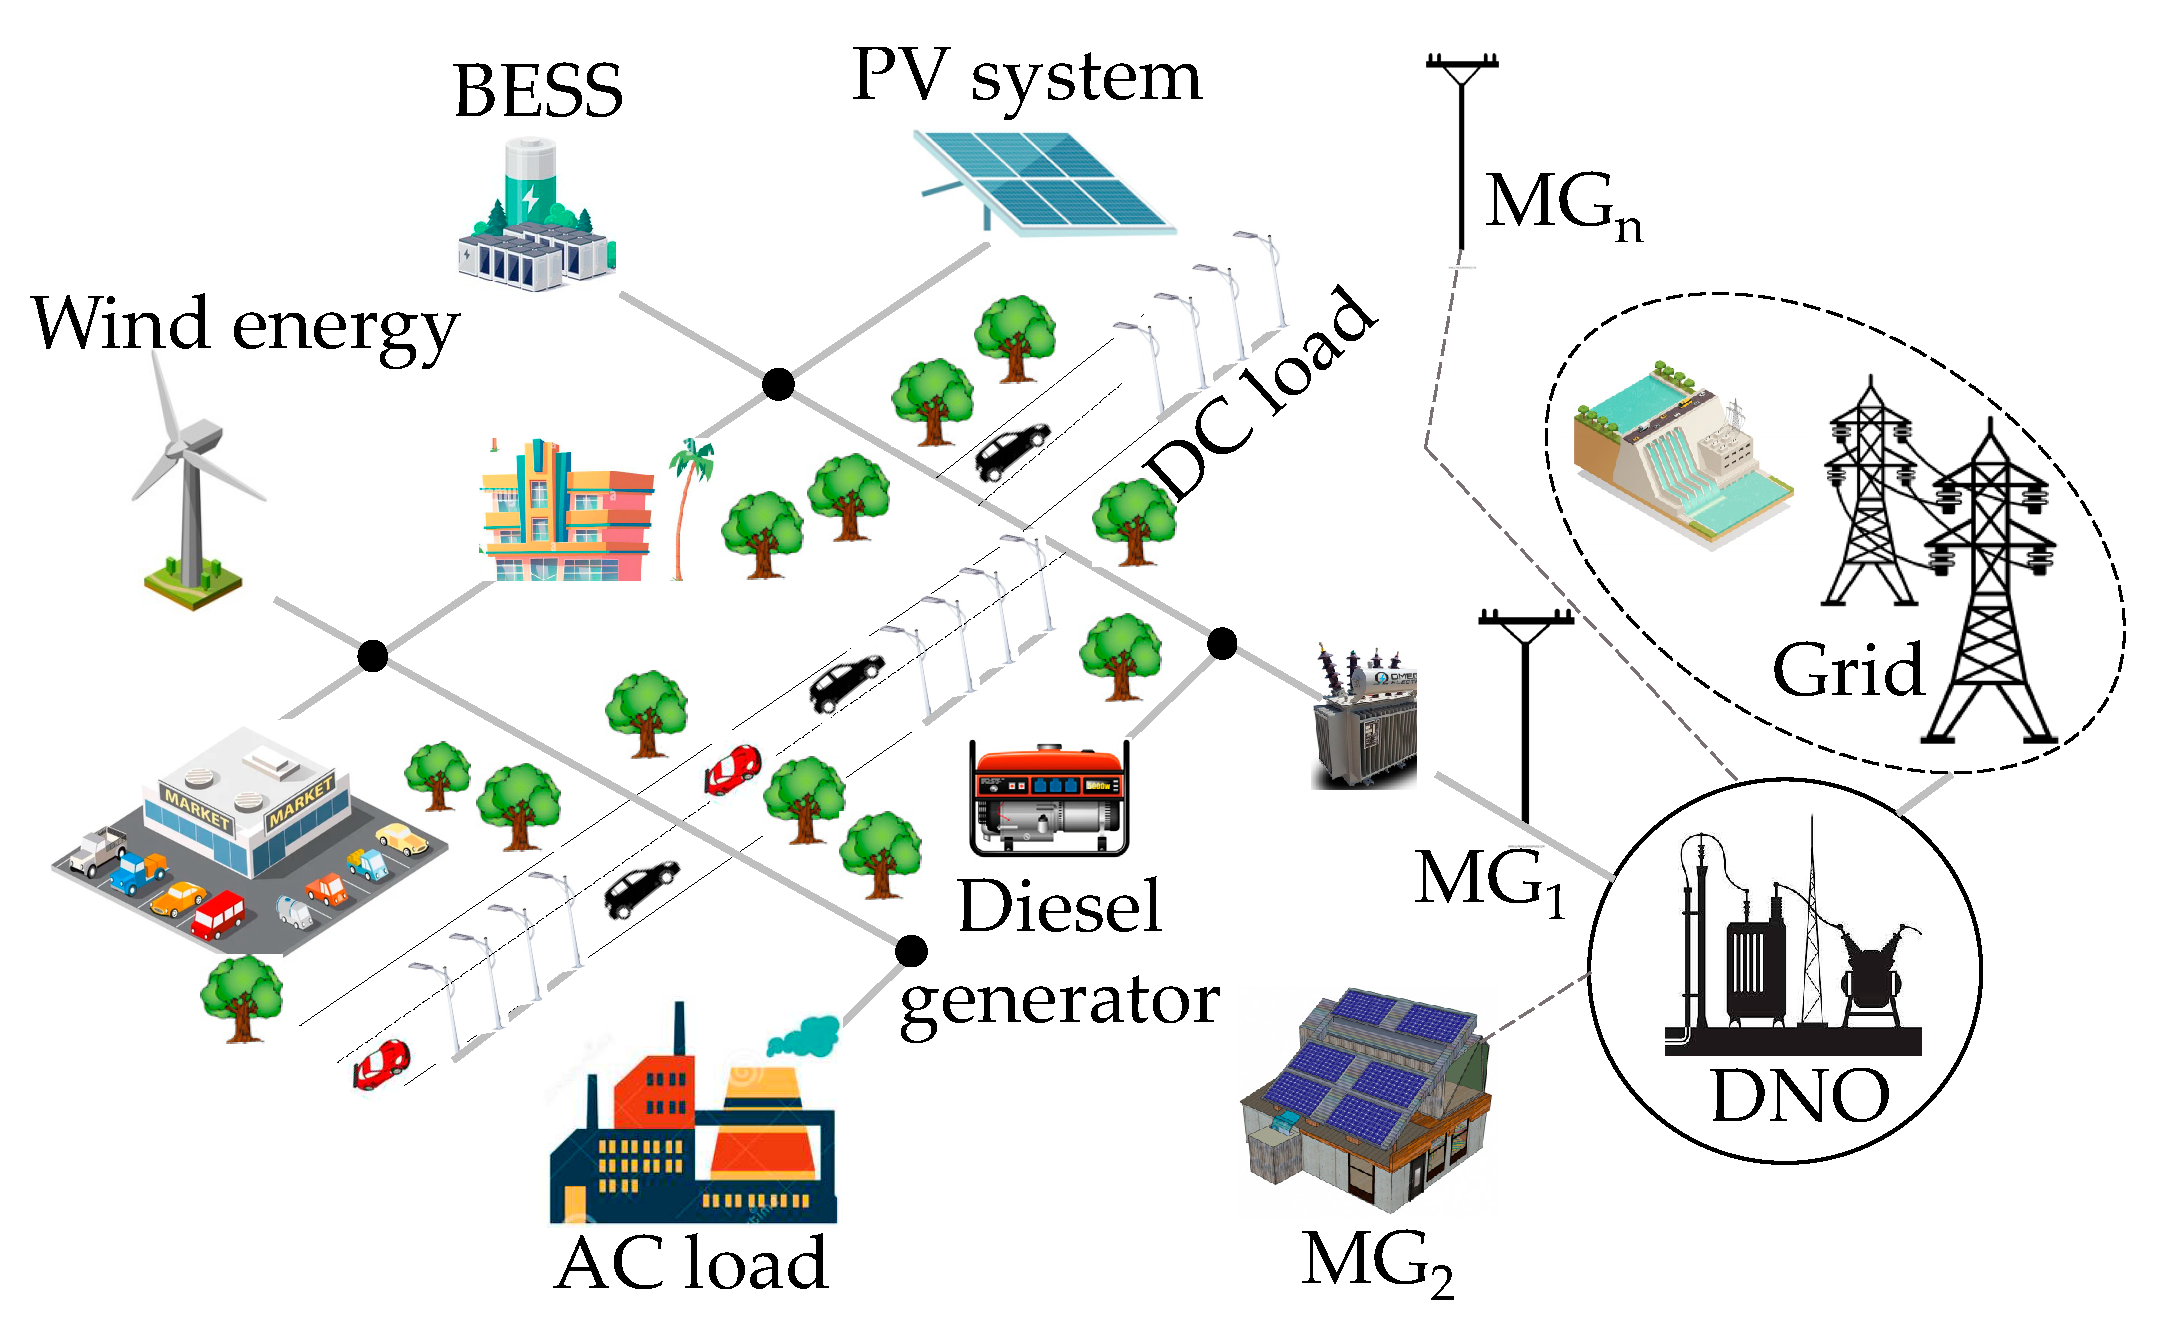
The MGs are comprised of a series of systems and subsystems, as seen in Figure 1. These can operate in islanding mode, with autonomous power supplies, and in grid–connected mode, where all grid set points are assumed. MGs can also be classified by their voltage type (AC, DC and hybrid), by their number of phases (single-phase or three-phase), by their voltage level (low or medium) and by their structure (radial or ring), etc.

2.1.1. AC Microgrid (AC–MG)

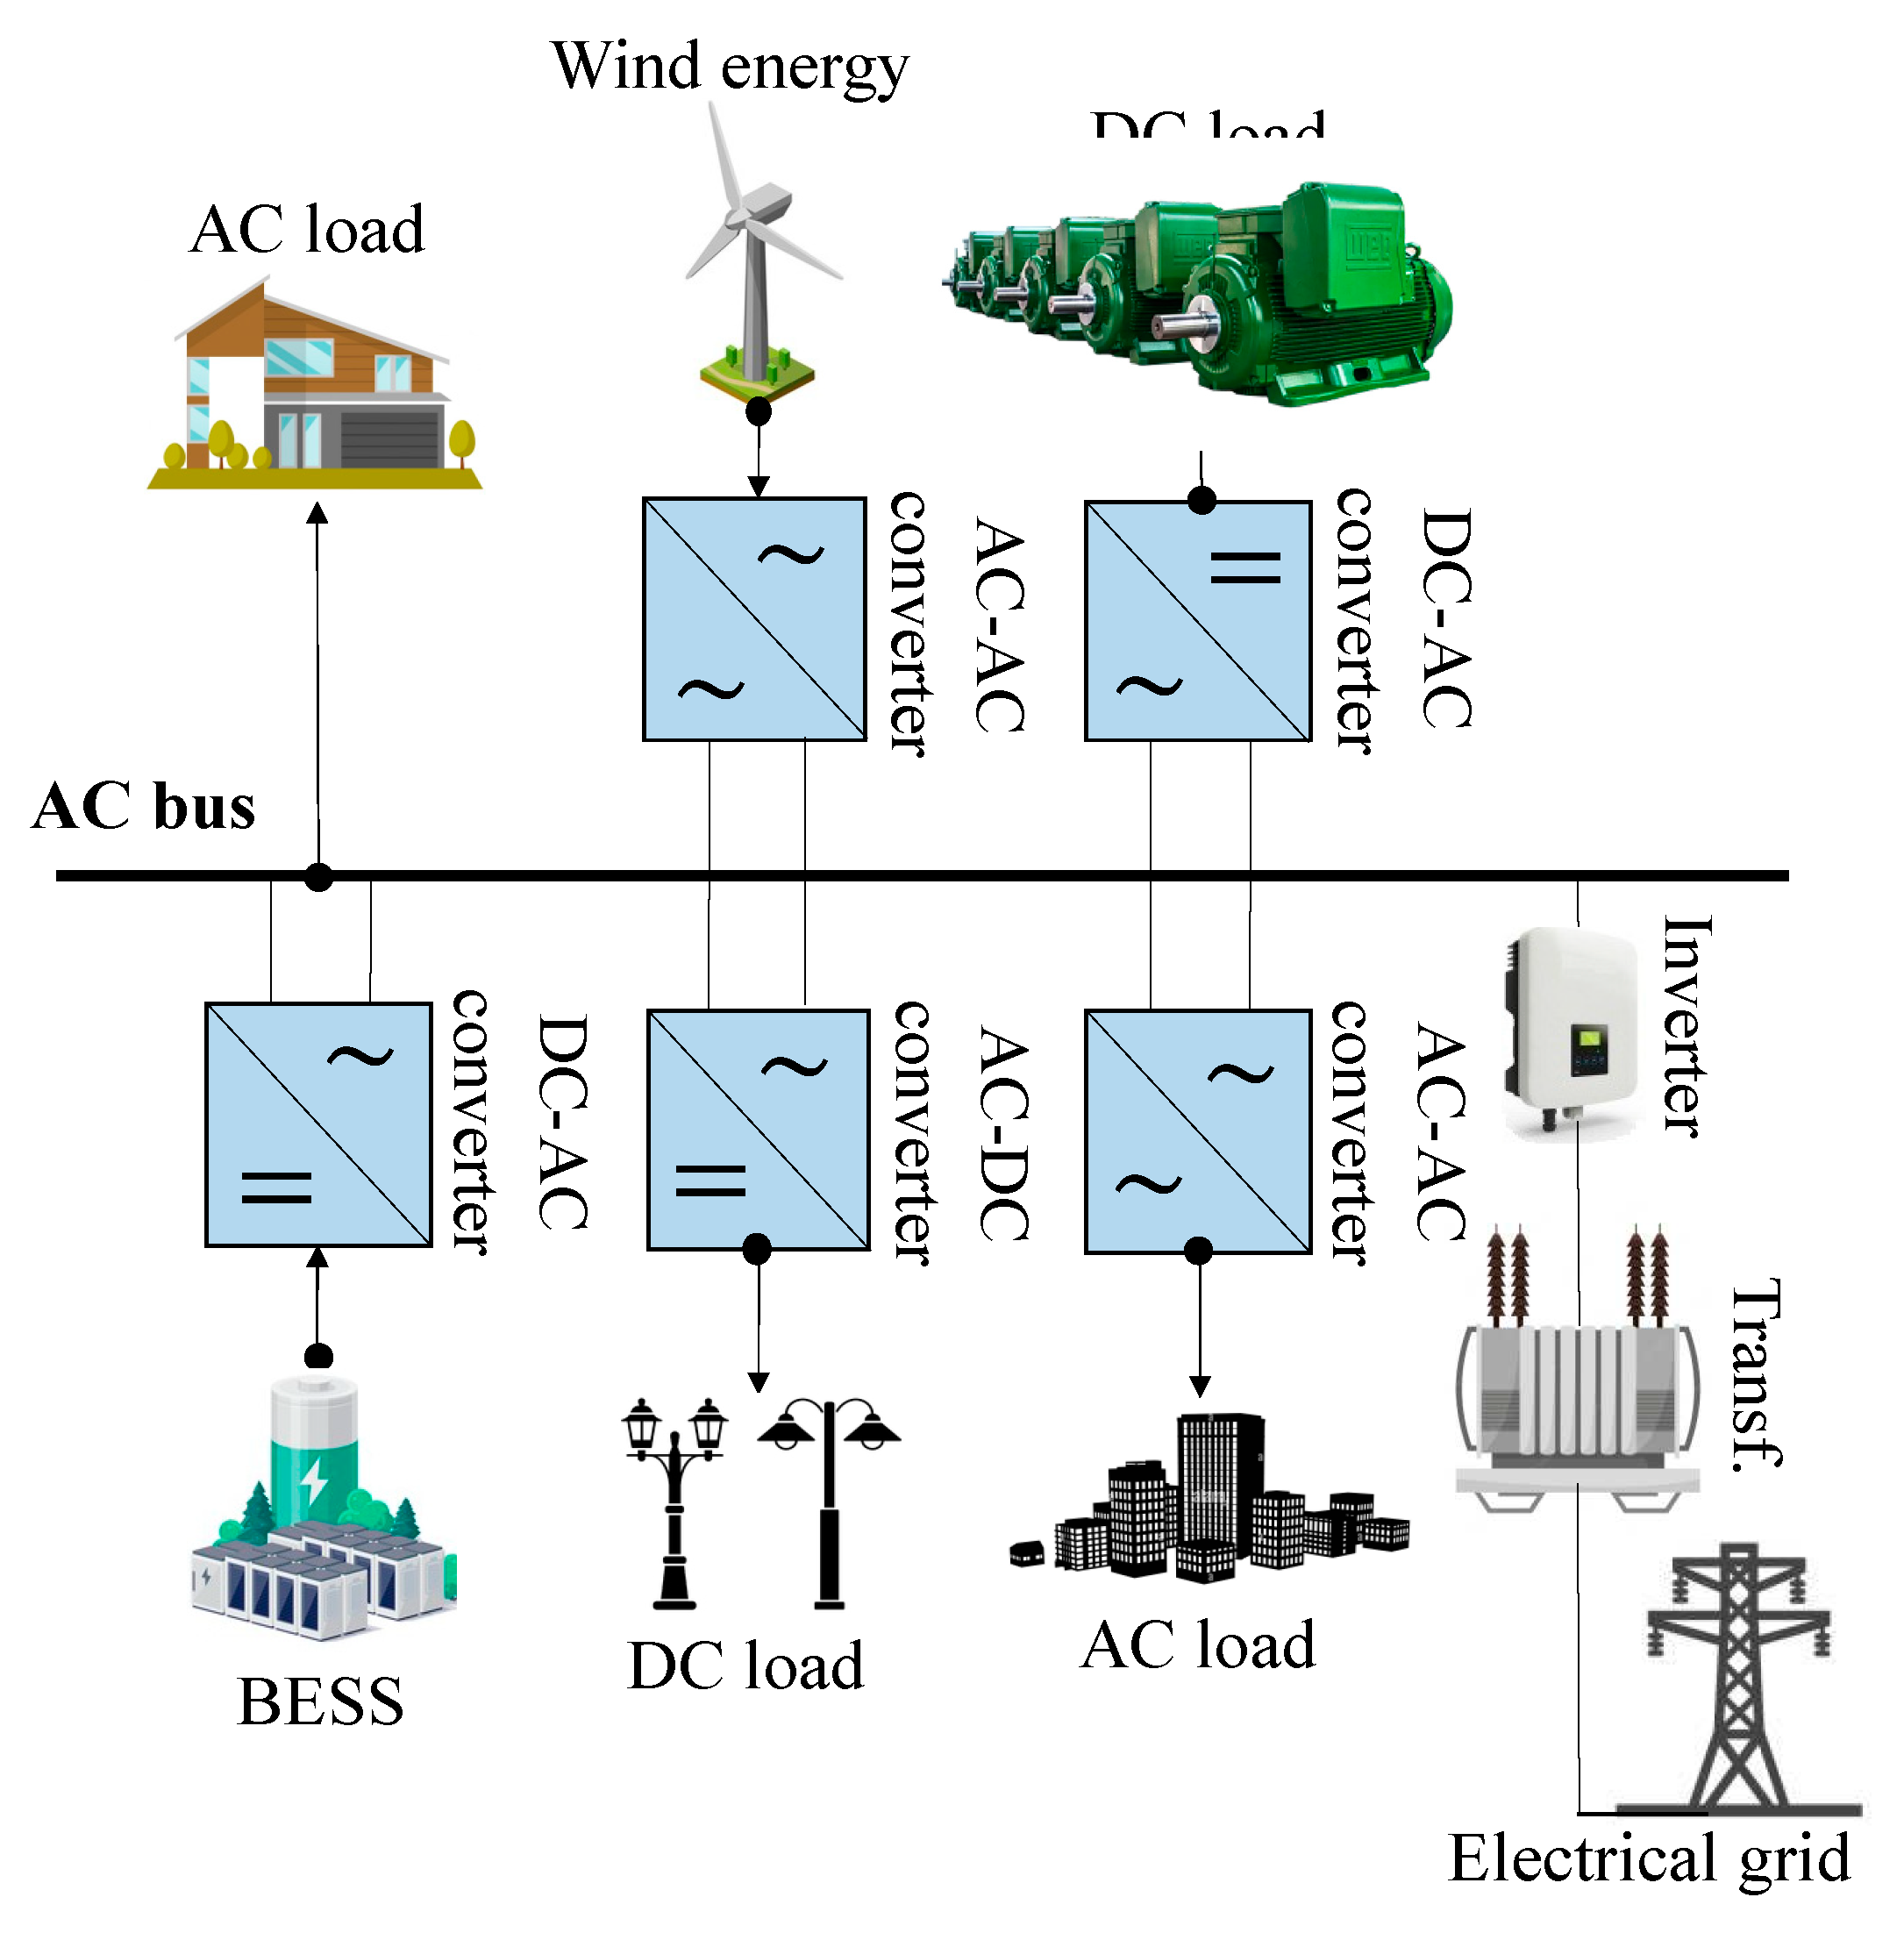
Figure 2 illustrates the schematic of an AC–MG. In this schema, all DGUs, including ESSs and loads, are linked to AC buses via a PC. It should be noted that it is possible, however, to connect AC generators, such as hydro-turbines, diesel and wind generators, directly to the power grid without using the PC. In contrast, to integrate DGUs such as PV system and battery-based ESSs into the power grid, a DC–AC PC is required.

2.1.2. DC Microgrid (DC–MG)

Most of the generators that are part of a MG generate electricity in DC, which needs to be transformed into AC to fit the grid system. For this purpose, DC conversion should be performed at the end of the system, because certain devices require AC power for proper operation. Transforming the energy of DC/AC/DC into an AC–MG, however, can reduce efficiency and cause energy loss. This condition can be corrected using high-voltage direct current operation as a reference, since the DC–MG has been designed with the specific purpose of addressing this situation.
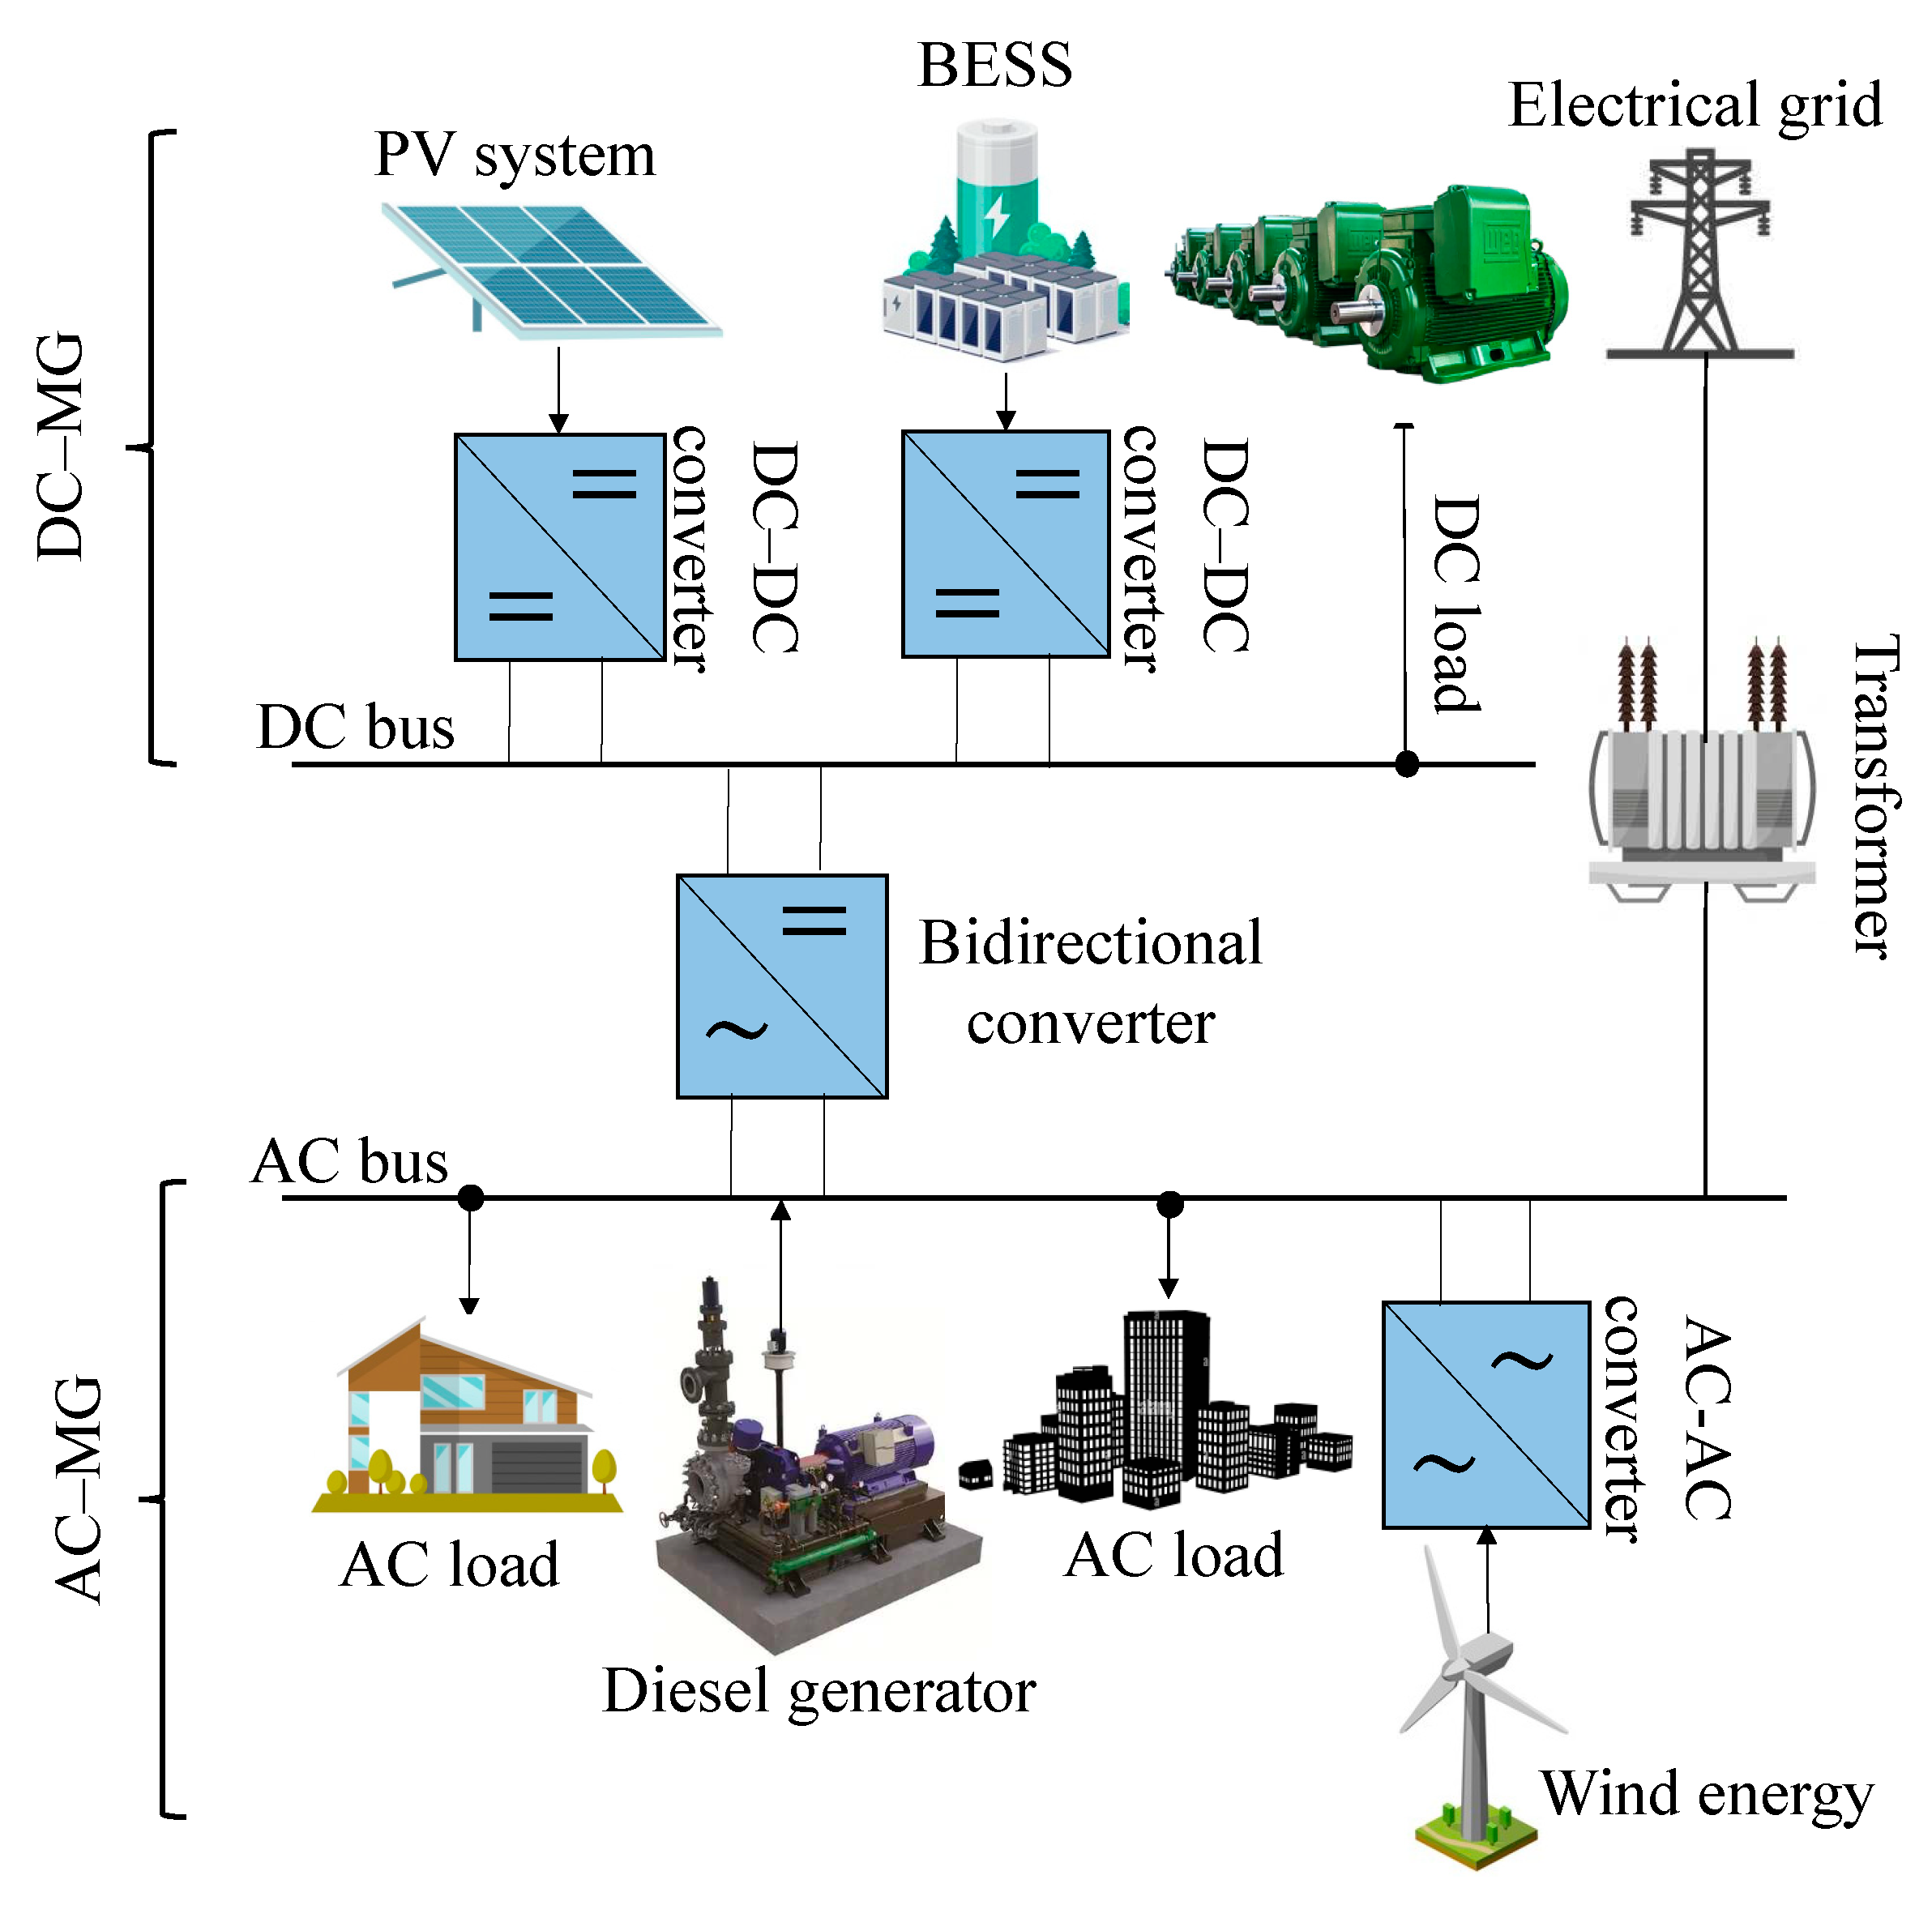
Figure 3 illustrates the configuration of an DC–MG. In contrast to an AC–MG, the DC–MG achieves significant energy savings by decreasing the number of PCs in a single process through a single PC. In [19], it is argued that DC–MGs are more appropriate for residential environments compared to AC distribution grids, which leads to less power quality issues. One of the main advantages of the DC–MG is its ability to address certain control problems in the MG, eliminating the need for synchronization of generators and ensuring that controls depend on the voltage at the DC bus. Additionally, the primary control is greatly simplified by not requiring reactive power flow management.
On the other hand, many modern devices operate with DC and lack power electronics that can generate harmonic distortion. Therefore, the conversion stages in the DC–MG is reduced, as the AC conversion stage is omitted [20,21]. In conclusion, the performance of a DC–MG is more efficient than an AC–MG, as it does not require phase and frequency management.

2.1.3. AC–DC or Hybrid Microgrid

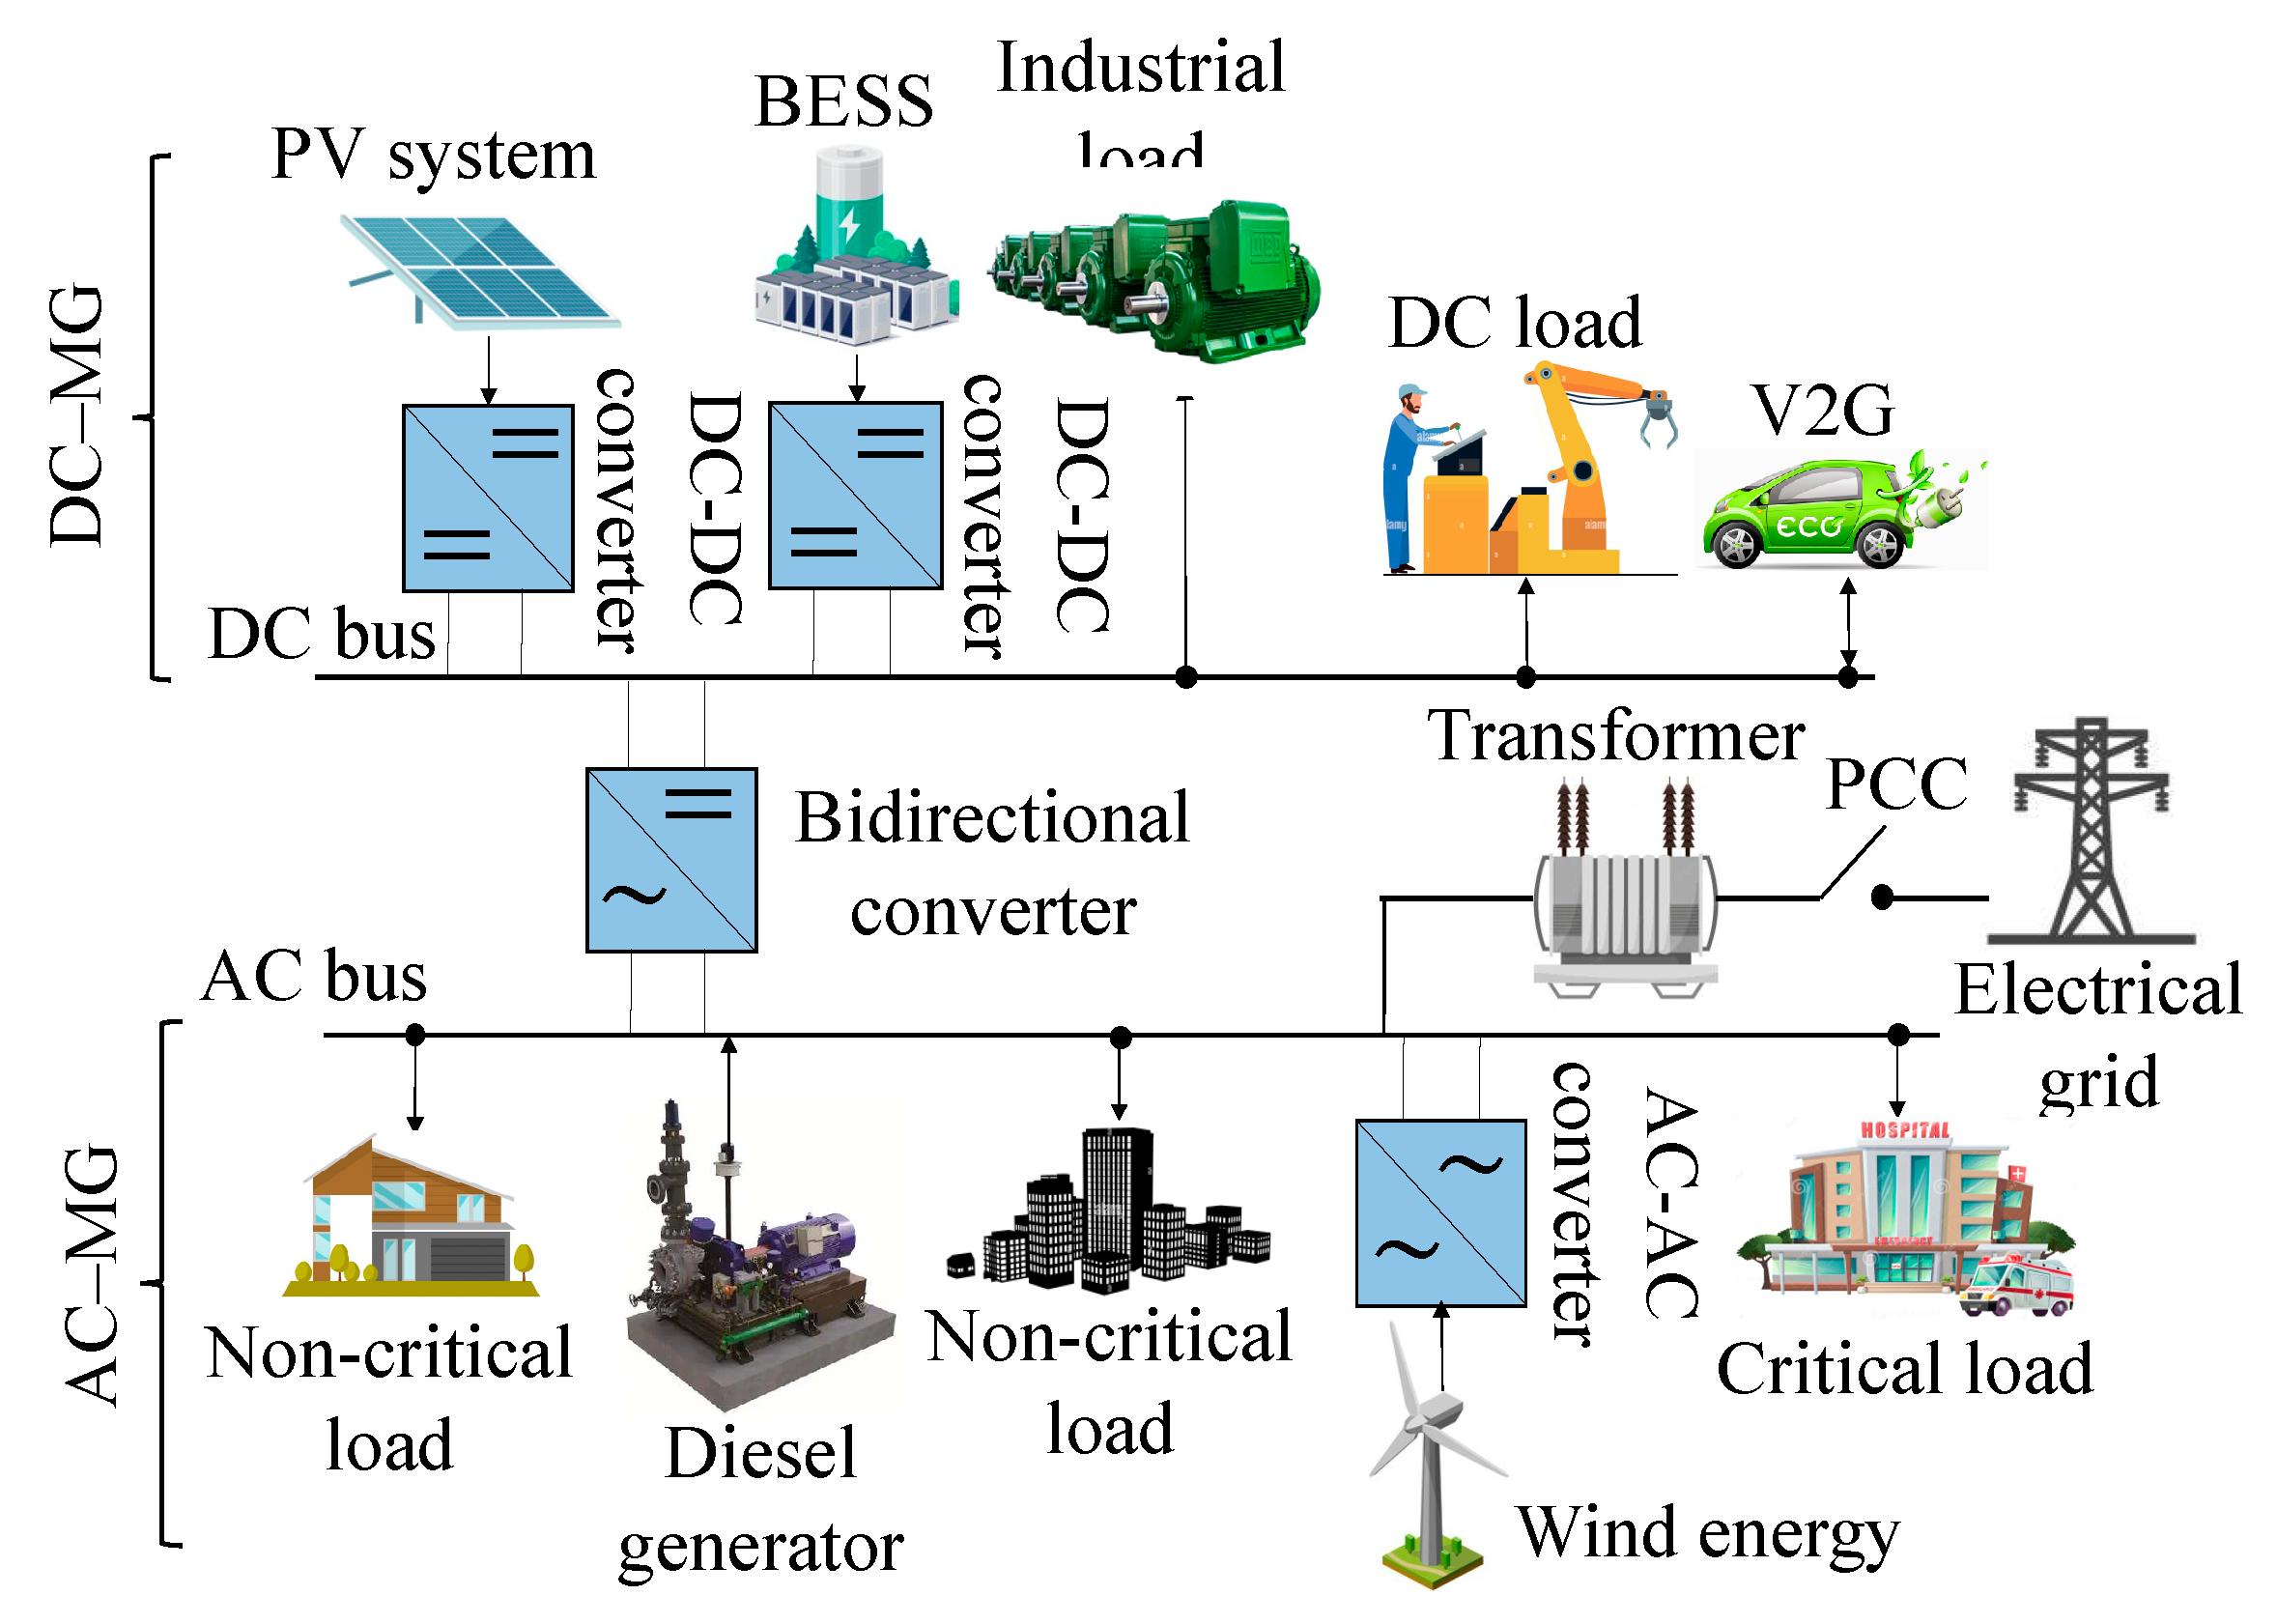
A hybrid MG involves the interconnection of AC and DC grids through multidirectional PCs. This method has the potential to reduce the conversion steps (DC/AC/DC and AC/DC/AC) in individual DC or AC MGs, which would decrease the incidence of power quality issues. In these hybrid microgrids, DC DGUs and loads are linked to the DC grid, while the AC DGUs and loads are linked to the AC grid. The ESSs can be connected to either MG. Figure 4 shows the characteristic scheme of a hybrid MG [22,23].
In these MGs, to meet the needs of power generation and loads, can operate in the grid–connected mode to supply or consuming power from a conventional grid. During grid–connected operation, the MG operates efficiently to ensure a reliable delivery of power to the critical load. In disturbance situations, it is necessary for the MG to disconnect from the power grid and operate in islanding mode. It is essential to properly control the transient, which occurs during the change of operation mode, to prevent damage to the MG devices. Therefore, power quality issues need more research in this case [24].

2.2. Microgrid operation modes

In relation to operation modes, the MG can be linked to the power grid through one or more points of common coupling (PCCs), or islanding mode operation is possible for it. Operational requirements differ in each situation, and there are also variations in control and stability specifications.

2.2.1. Islanding mode operation of the Microgrid

The islanding mode of MG operation is a condition in which a part of the distribution grid is supplied by one or several DGUs when the main grid is disconnected and isolated from the system.
The “controlled island” mode feature represents a substantial improvement in EPS reliability. Furthermore, dis-connection can generate multiple complications related to power quality, in systems with high DGUs integration. There-fore, to maximize the advantages of DGUs, it is recommended to select MG operation in "intentional island" mode. According to the IEEE 1547 standard one of the standard’s tasks for the future consideration of the smart grid is the implementation of intentional islands. For the successful execution of this mode, it is essential for the system to promptly identify grid disconnection as soon as it occurs, so an efficient island detection algorithm is required. By operating in islanding mode, MGs must maintain a constant balance between generation and demand. In this context, information acquisition systems play a crucial role in achieving optimal operation. Another point that must be considered in this type of MG operation is the disconnection from and subsequent reconnection to the electrical grid, for synchronization reasons. The PCC must provide the facilities so that the MG can connect to the grid when necessary. Table 1 shows the limits of the synchronization parameters according to the IEEE–1547 standard.
Similarly, during islanding mode operation, the system ground must meet the safety requirements and maintaining impedances at acceptable levels. These considerations are established in the IEEE–1547 standard.

2.2.2. Grid–connected mode operation of the Microgrid

This operation mode of the MG is activated every time the fault in the electrical grid is eliminated. Before switching to grid-connected mode, the MG voltage is resynchronized with the mains voltage before closing the switch. MG, in turn, seeks to satisfy most of the demand, supervising both the charging and discharging of the ESSs. In this way, the electrical grid acts as a balance node, absorbing or delivering energy variations. Additionally, the connection point acts as a reference source for voltage and frequency, making it easier to maintain these parameters within the MG. In this scenario, it is not imperative that all of the energy required by the loads be generated exclusively by the MGs’ DGUs, since any mismatch between generation and consumption can be compensated by the energy flowing through the PCC. Depending on whether the generation is higher or lower than the energy demanded by the loads, the MG could be viewed as a smaller-scale generator or as a load.
This operational approach has the advantage that the control system is designed to reduce energy costs for associated consumers. Likewise, it optimizes the use of local generation when it is economically efficient, reducing dependence on the electrical grid. Figure 5 shows an MG in both operation modes.

2.3. Technical aspects of electrical microgrids

This section details the technical aspects related to the integration of MGs to the EPS.

2.3.1. Power and voltage unbalanced

When the MG transitions from grid–connected mode to islanding mode, it generates a power unbalance and voltage fluctuations. This could also occur because to the slow dynamic response and low inertia of DGUs. A common occurrence in MGs is voltage unbalance. Voltage Unbalance Factor (VUF) evaluates the unbalance magnitude in the system [25]. This scenario could lead to detrimental effects on power electronics and MG devices, as they will experience higher losses and be less stable under unbalanced conditions. Consequently, it is crucial to limit the VUF by applying coherent criteria established in the grid codes, with the purpose of ensuring a stable balanced and reliable integration of MG [25,26].

2.3.2. System stability

Challenges to EPS stability arise because to the diverse operational characteristics of MGs and DGUs. The reasons main of the stability problems are listed below:
  • Decreased inertia of the system, resulting in frequency and angular instability
  • Low voltage stability due to more limited power distribution; and
  • Lower frequency fluctuations due to a change in the proportion of power sharing.
An improvement in system stability can be achieved by decentralizing supply and maintaining an appropriate demand for the supply relationship [27].

2.3.3. Harmonic distortion

The power quality importance in MGs, both in their operation in islanding mode and grid-connected mode, lies in the presence of non–linear and unbalanced loads, which represent a considerable part of the system. These loads cause problems such as harmonic distortion, unbalances and voltage variations in grids with limited capacity [7]. Likewise, high impedances in the system generate harmonic distortion and voltage unbalance, added to the problems in load distribution caused by the variability of DGUs, such as PV systems, wind turbines and fuel cells.
Additionally, harmonic distortion threatens the power grid's ability to operate reliably and consistently if certain precautions are not taken. As a result, the safety of ESSs is compromised since they are more sensitive to harmonic distortion [28], so the use of active and/or passive filters will help eliminate and/or attenuate harmonics of any order (preferably higher order) [29].
Most EPSs have some capacity to tolerate harmonic distortion. Its increase, however, will undoubtedly cause line loss, over-heating, communication failures and activation of the protection switch [30]. Therefore, MGs must minimize the harmonic distortion problem in accordance with current grid standards and codes [31,32]. According to the IEEE–519 standard or IEC standards, the THDs, both voltage ( T H D v ) or current ( T H D i ) must be kept below 5%. The THD is an indicator, essential to quantify the harmonic content of a voltage or current signal, which is based on the relationship between two magnitudes and the effective value of the harmonic residue compared to the fundamental component.

Harmonic distortion in microgrids in grid-connected mode

In this operation mode, the most frequent problem is harmonic distortion [10] [33]. Many grid standards and codes impose new regulations on the integration of DGUs against the high current and voltage THD ratings, as well as overvoltage (HVRT, high voltage ride through) and the ability to withstand voltage sags (LVRT, low voltage ride through). These regulations require MGs to maintain acceptable levels of THD, LVRT and HVRT. If not, the MGs will have to be disconnected from the power grid [34]. Table 2 lists the main power quality issues in MGs operating in grid–connected mode.

Harmonic distortion in microgrids in islanding mode

The interaction between loads, DGUs and ESSs during MG transition states can adversely affect power quality when the MG operate in islanding mode, which reduces the value of MG impedances, generating notable voltage variations and a greater probability of generating high rates of harmonic distortion [35]. Harmonic distortion remains a prominent challenge in terms of power quality in MGs, even during islanding mode operation. This problem not only involves the harmonics of the fundamental frequency, but also involves the presence of inter–harmonics, sub–harmonics and supra–harmonics. To address this problem, control strategies are implemented to reduce the THD index in MGs. Furthermore, voltage deviations are another problem present in islanding mode operation and occur as a consequence of the increase in harmonic voltage distortion derived from resonances at low frequencies [36].

3. Model Description Proposed

This section presents a detailed description of the MG model proposed in this research; see Figure 6. The model was developed in the specialized software MATLAB–Simulink® that strives to provide a tool for the scientific community to better understand the dynamics of MG, as well as its general performances under different operating conditions.
The MG model is comprised of the three sections:
  • AC–MG is the orange dotted area that operates at two voltage levels: 220 V and 13.8 kV through distribution lines. This MG is composed of a 725-kW PV system, a 3-MW diesel generator, a 750-kW wind turbine and a battery-based ESS (BESS_1). In addition, it has a variety of linear, non–linear, balanced and unbalanced loads, etc. It is worth mentioning that this MG operates at a frequency of 60 Hz.
  • DC–MG is the green dotted area where a DC bus comprising BESS_2 is located, as well as 10.5-kW PV system. This MG is connected to the AC–MG through two bidirectional, parallel PCs, which can exchange active and reactive power through the transformers.
  • Finally, at bus 13, the AC–MG is connected to the electrical grid, which is a Thévenin equivalent of 69 kV, 100 MVA and an X/R ratio of 10.
Below, the components considered in the proposed hybrid MG model in Figure 6 are described in detail.

3.1. Photovoltaic system (PV)

A PV system is one of the distributed renewable energy resources considered in the MG. This model includes two PVs that operate with a total irradiance of G=1000 W / m 2 and a temperature of 25 °C. P V 1 system is connected to bus 6 and has more than 1,750 panels that develop a nominal power of 725 kW, while the P V 2 is connected to bus 2 in the DC–MG and has 42 panels, which develop a nominal power of 10.5 kW. Table 3 shows the main parameters of the PVs, which are used by MATLAB–Simulink® to characterize the performance of the solar panels.
Both PV systems need DC interfaces whit the PC. The P V 1 system operates with a voltage-controlled step-up DC–DC PC which has a 6,000 μ F capacitor operating at 300 V D C . Additionally, a closed-loop pulse width modulation (PWM) control strategy is used at 5 kHz. The P V 2 system works with an open-loop sine PWM inverter is used for the P V 2 system. The modulation index, m , is 1 when the voltage drops from 480 V D C to 250 V A C .

3.2. Permant Magnet Synchronous Generator (PMSG) based Wind Turbine

In medium and low voltage MGs, variable speed wind turbines are used: mainly type IV wind turbines, which are also known as permanent magnet synchronous generators (PMSG) [37]. In this instance, the PCs play an important role by decoupling the electric generator from the grid to which it is interconnected. This model includes a 750-kW PMSG wind turbine at 575 V connected to bus 4. Table 4 shows the main parameters of the PMSG, used by MATLAB–Simulink® to characterize the performance of the electric generator.
Like PV systems, the wind turbine needs an AC–AC PC (cycloconverter), which adjusts the parameters of the generator to those of the electrical grid. The voltage and frequency of the wind turbine can be controlled using PWM control schemes for the PC and learning systems for the maximum power point tracker (MPPT).

3.3. Battery–based energy storage system (BESS)

The ESS is a fundamental part within the MG since it allows the grid to become more flexible in the event of contingency or in the transition to islanding mode through a battery bank that is used to store and supply energy during the charging process and download. PbA, Ni-Fe, Ni-Cd, Ni–MH and Li–ion batteries are the principal types of battery-based ESSs for MG applications. These last two are the ones used in this study because they offer potential advantages, such as being environmentally friendly, providing a life cycle equi-valent to that of lead-acid batteries and increasing in their capacity (between 25 and 40 %). As for the Li–ion battery, it has the highest energy density but is very expensive [11].
The B E S S 2 operates on the DC bus, which consists of a Li–ion battery with a nominal capacity of 800 Ah and nominal voltage of 120 V D C . On the other hand, B E S S 1 is conected to bus 1, which consists of three Ni–MH batteries with a nominal voltage of 650 V D C and an individual nominal capacity of 1.5 Ah. The batteries are connected in parallel to an inverter (cascade topology), which in turn increases the nominal voltage from 650 V D C to 900 V A C . Battery parameters are time varying and depend on the state of charge.

3.4. DC-AC power converters

The P V 2 system is interconnected to the 13.8 kV AC system through an inverter that reduces the voltage from 480 V D C to 250 V A C . The inverter is modeled using a three-level PWM controlled insolated-gate bipolar transistor (IGBT) bridge. Operating with a closed loop control strategy and a PWM carrier signal of 2 kHz.
Additionally, the B E S S 2 is interfaced with the 220 V system with an inverter that increases the nominal voltage from 650 V D C to 900 V A C . This inverter is modeled using a multilevel topology, which, according to the literature, is considered the most efficient and reliable topology because it considers power losses, THD and total efficiency Additionally, it uses an open-loop sinusoidal PWM (SPWM) technique with a carrier frequency of 2.5 kHz. It is worth mentioning that the inverter generates, on the AC inverter side, a modulation index equal to 1.2.

3.5. Power transformers

For this study, eight power transformers are considered. One of them is a substation transformer (T1), with a transformation ratio 69-kV/13.8-kV, ∆-Y, and an equivalent series impedance of 1.5% on its MVA base. This transformer connects the MG distribution system to the 69-kV subtransmission system. T2 and T3 transformers are used to convert from 13.8 kV of industrial or commercial use to 220 V residential use. On the other hand, the PV (T4), wind turbine (T5), B E S S 1 (T6) and diesel generator (T7) are used to interface with the MG inverters. Table 2 shows the parameters of the transformers.

3.6. Loads

The electrical load is an important element in the design of an EPS since it is considered an unpredictable parameter. In this study, a maximum demand scenario is considered (the highest peak of all powers in a certain period) with different types of loads, as listed in Table 6, which summarizes the information of the loads connected to the system. It is worth mentioning that balanced and unbalanced linear loads are modeled as constant impedances and that some contain single-phase components that could damage the symmetry of the system voltage and current.
In a distribution system with three-phase currents, the load currents should ideally be equal in magnitude in all three phases of the grid. In the case of an unbalance, however, overloads and heating may occur in power conductors, the activation of protection and the circulation of currents through the electrical grid’s neutral. The percentage of unbalan-ced loads is defined as the percentage value that indicates the maximum deviation of the current in a phase with respect to the average load current. Reducing the value of the unbalance index through different load balancing methods implies reducing losses.

3.6.1. Non-linear loads

In this model, an electric arc furnace located in bus 9 is considered a nonlinear load (see Figure 6). Electric arc furnaces can result in significant disturbance levels for MG applications. Electric arc furnace consists of a crucible or steel plate body lined with refractory material containing scrap and three graphite electrodes supported by a mobile support, allowing them to be lowered or raised according to the output of the control system. The different phases of electric arc furnaces operation (start-up, smelting and refining) have a different impact in terms of the THD of voltage and current.
Basically, a three-phase electric arc furnace can be represented as a variable resistor. Table 7 summarizes the electric arc furnace parameters, which is fed directly from the 13.8-kV distribution grid.

3.7. Distribution lines

In this model, two distribution levels are considered: medium and low AC voltage, which are typical values for applications in MGs. A 1/0 bare copper conductor was selected for the 13.8-kV primary grid. The resistance, reactance and impedance of the line are 0.394 Ω / k m , 0.1168 Ω / k m and 0.411 Ω / k m , respectively. A 4/0 copper TW cable was selected for the 220 V secondary grid. The resistance, reactance and impedance of the line are 0.198 Ω / k m , 0.1089 Ω / k m and 0.227 Ω / k m , respectively. Table 8 shows the line sections used in detail.

4. Analysis and Simulation of Hybrid Microgrid

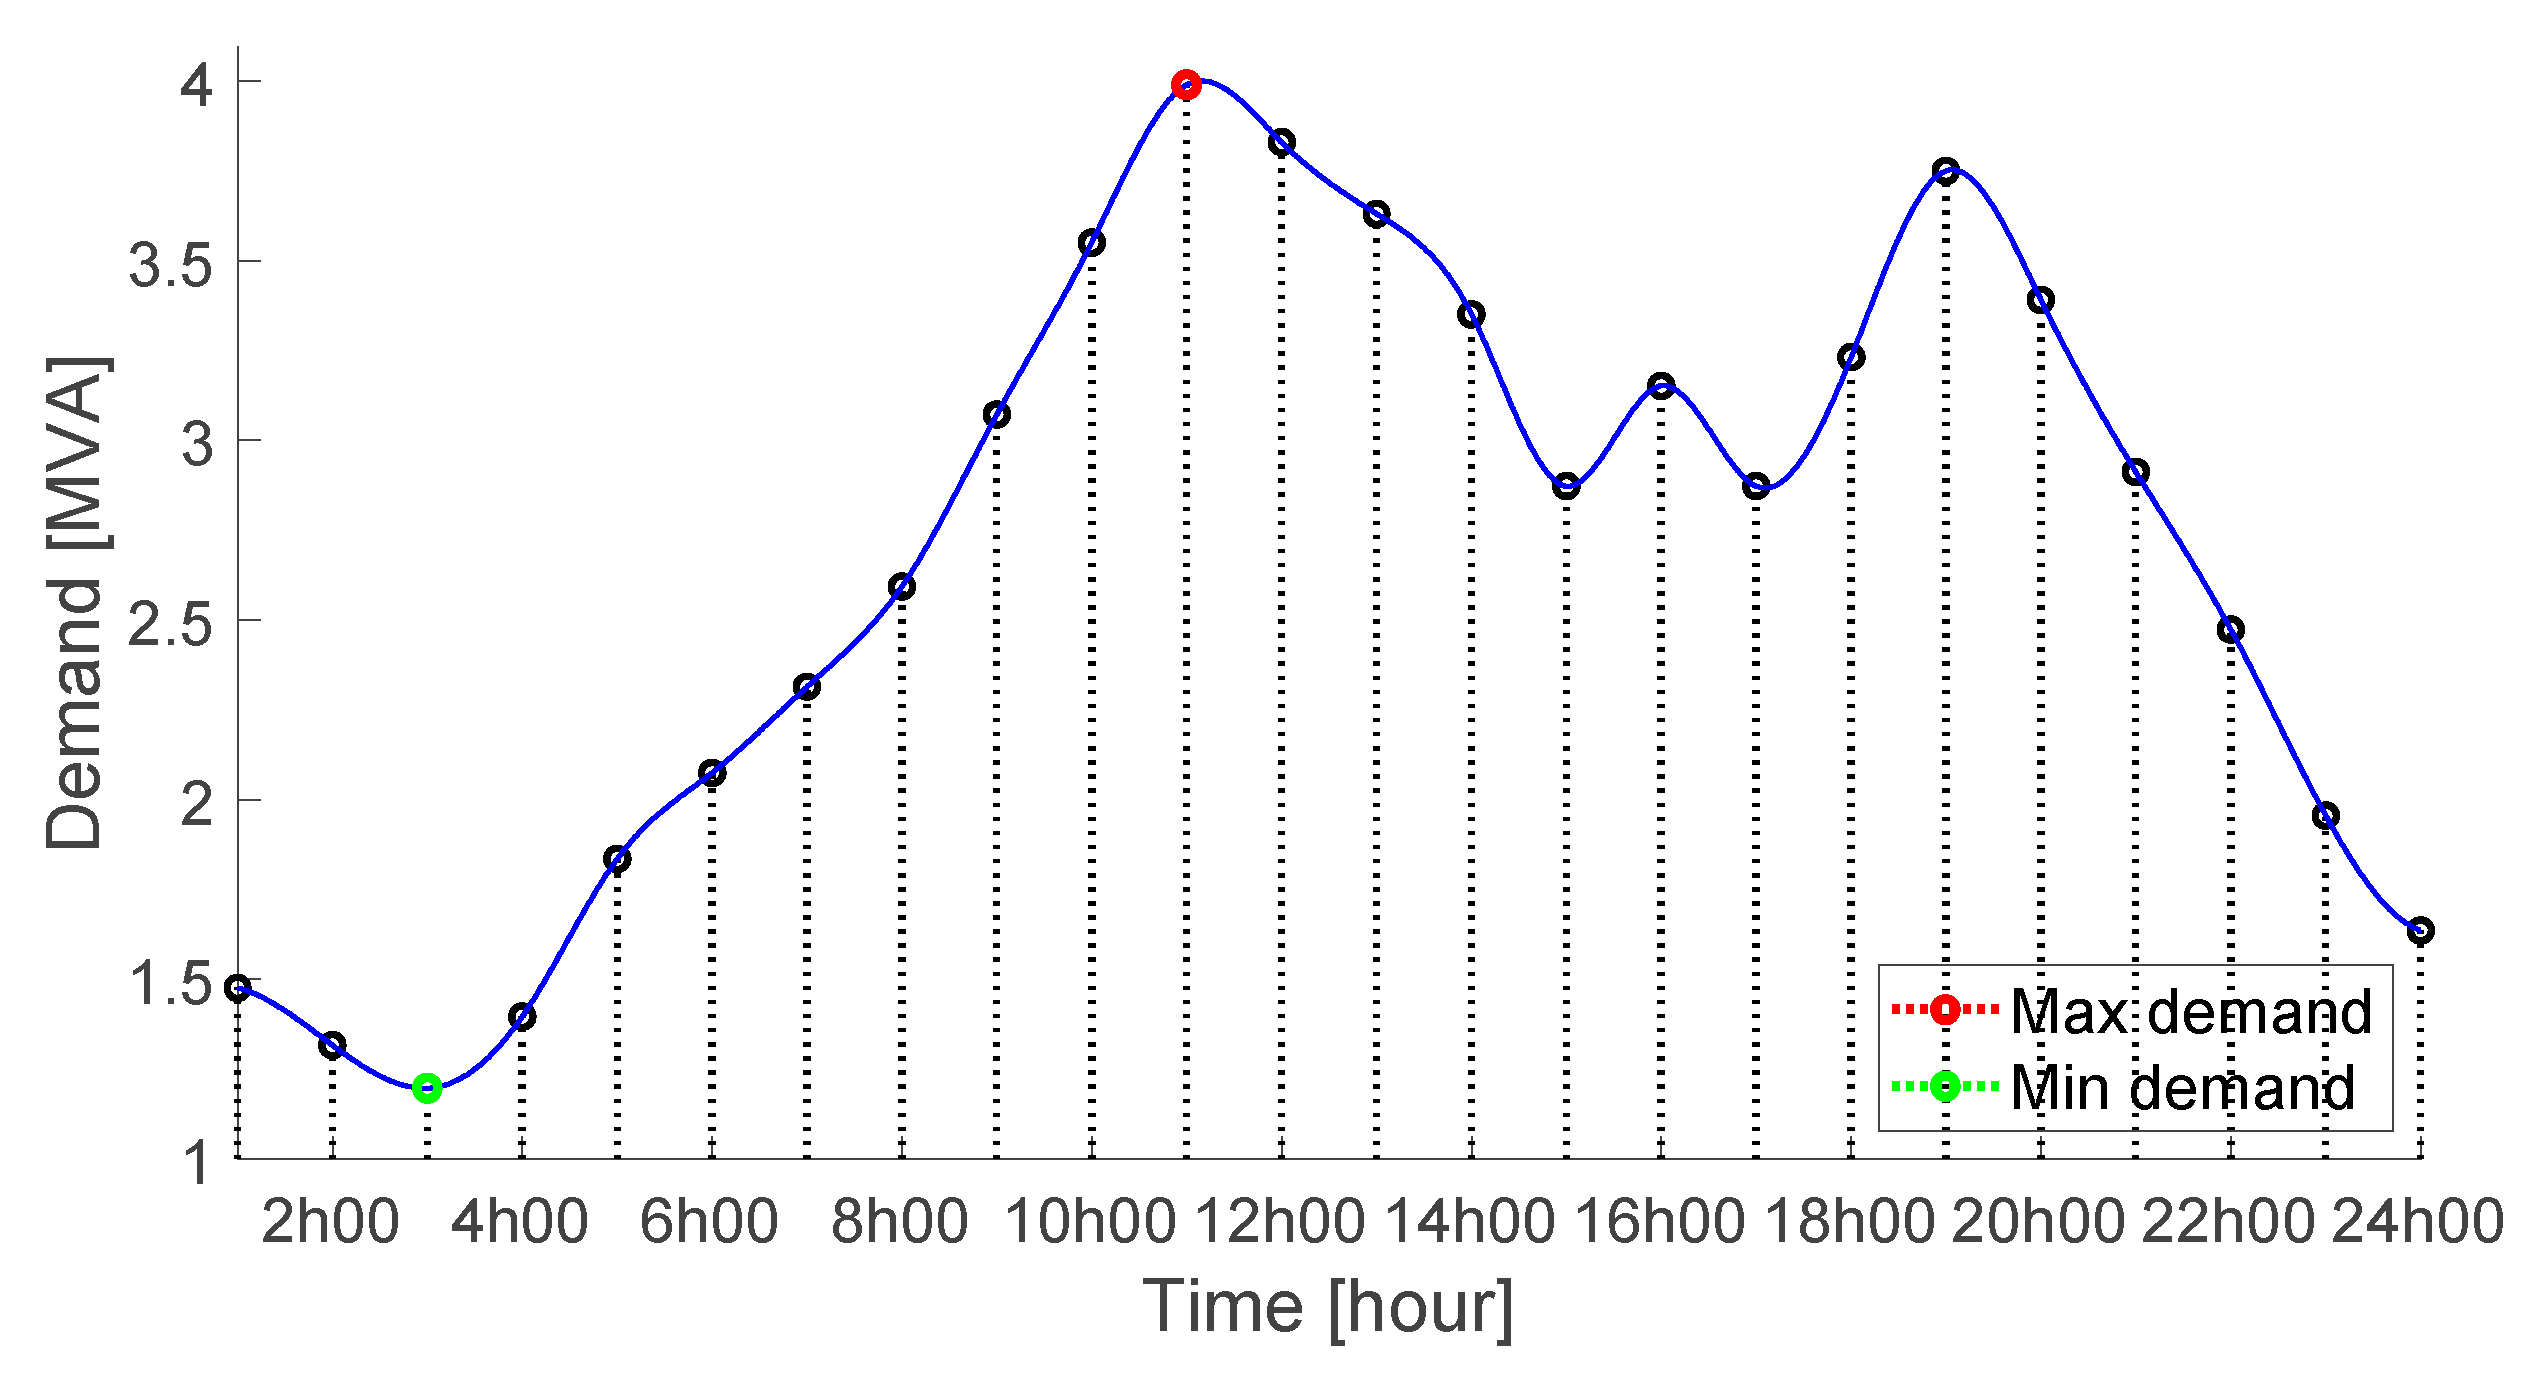
A hybrid MG connected to the electrical grid for power quality studies is considered as a case study. Figure 7 shows the total daily demand curve of the proposed MG, which is obtained from the sum of the hourly demands of each load of the proposed model and mostly considers industrial and commercial loads. The loads were modeled as constant impedances, so a slight difference between the nominal power of the load and the actual power consumed can be determined. It is important to note that the period of maximum demand is at 11:00 a.m., which coincides with the peak of solar radiation and, therefore, with the maximum generation capacity of the PVs. This peak demand during this time is caused by the integration of industrial load curves with residential load curves.

4.1. Voltage profile analysis

One of the power quality indicators for distribution systems designs that the voltage supplied to users must be within certain permitted limits according to the standards imposed by the regulation and control bodies. In Mexico, the regulation dictates that the voltage intervals allowed in the distribution grid for voltages greater than 1 kV and less than 60 kV do not differ from the nominal voltage by ± 5%.
Figure 8 shows the voltage profile of the proposed MG, where a voltage drops in each of the sections of the system. This is because the system has unbalanced loads as a result of the single-phase load components. Although the voltage profile is within admissible operating parameters, there are still significant voltage sags in the LV grid (220 V) in buses 2, 3 and 10. This result allows future studies based on the search of solutions to improve the voltage profile.

4.2. Power factor (PF)

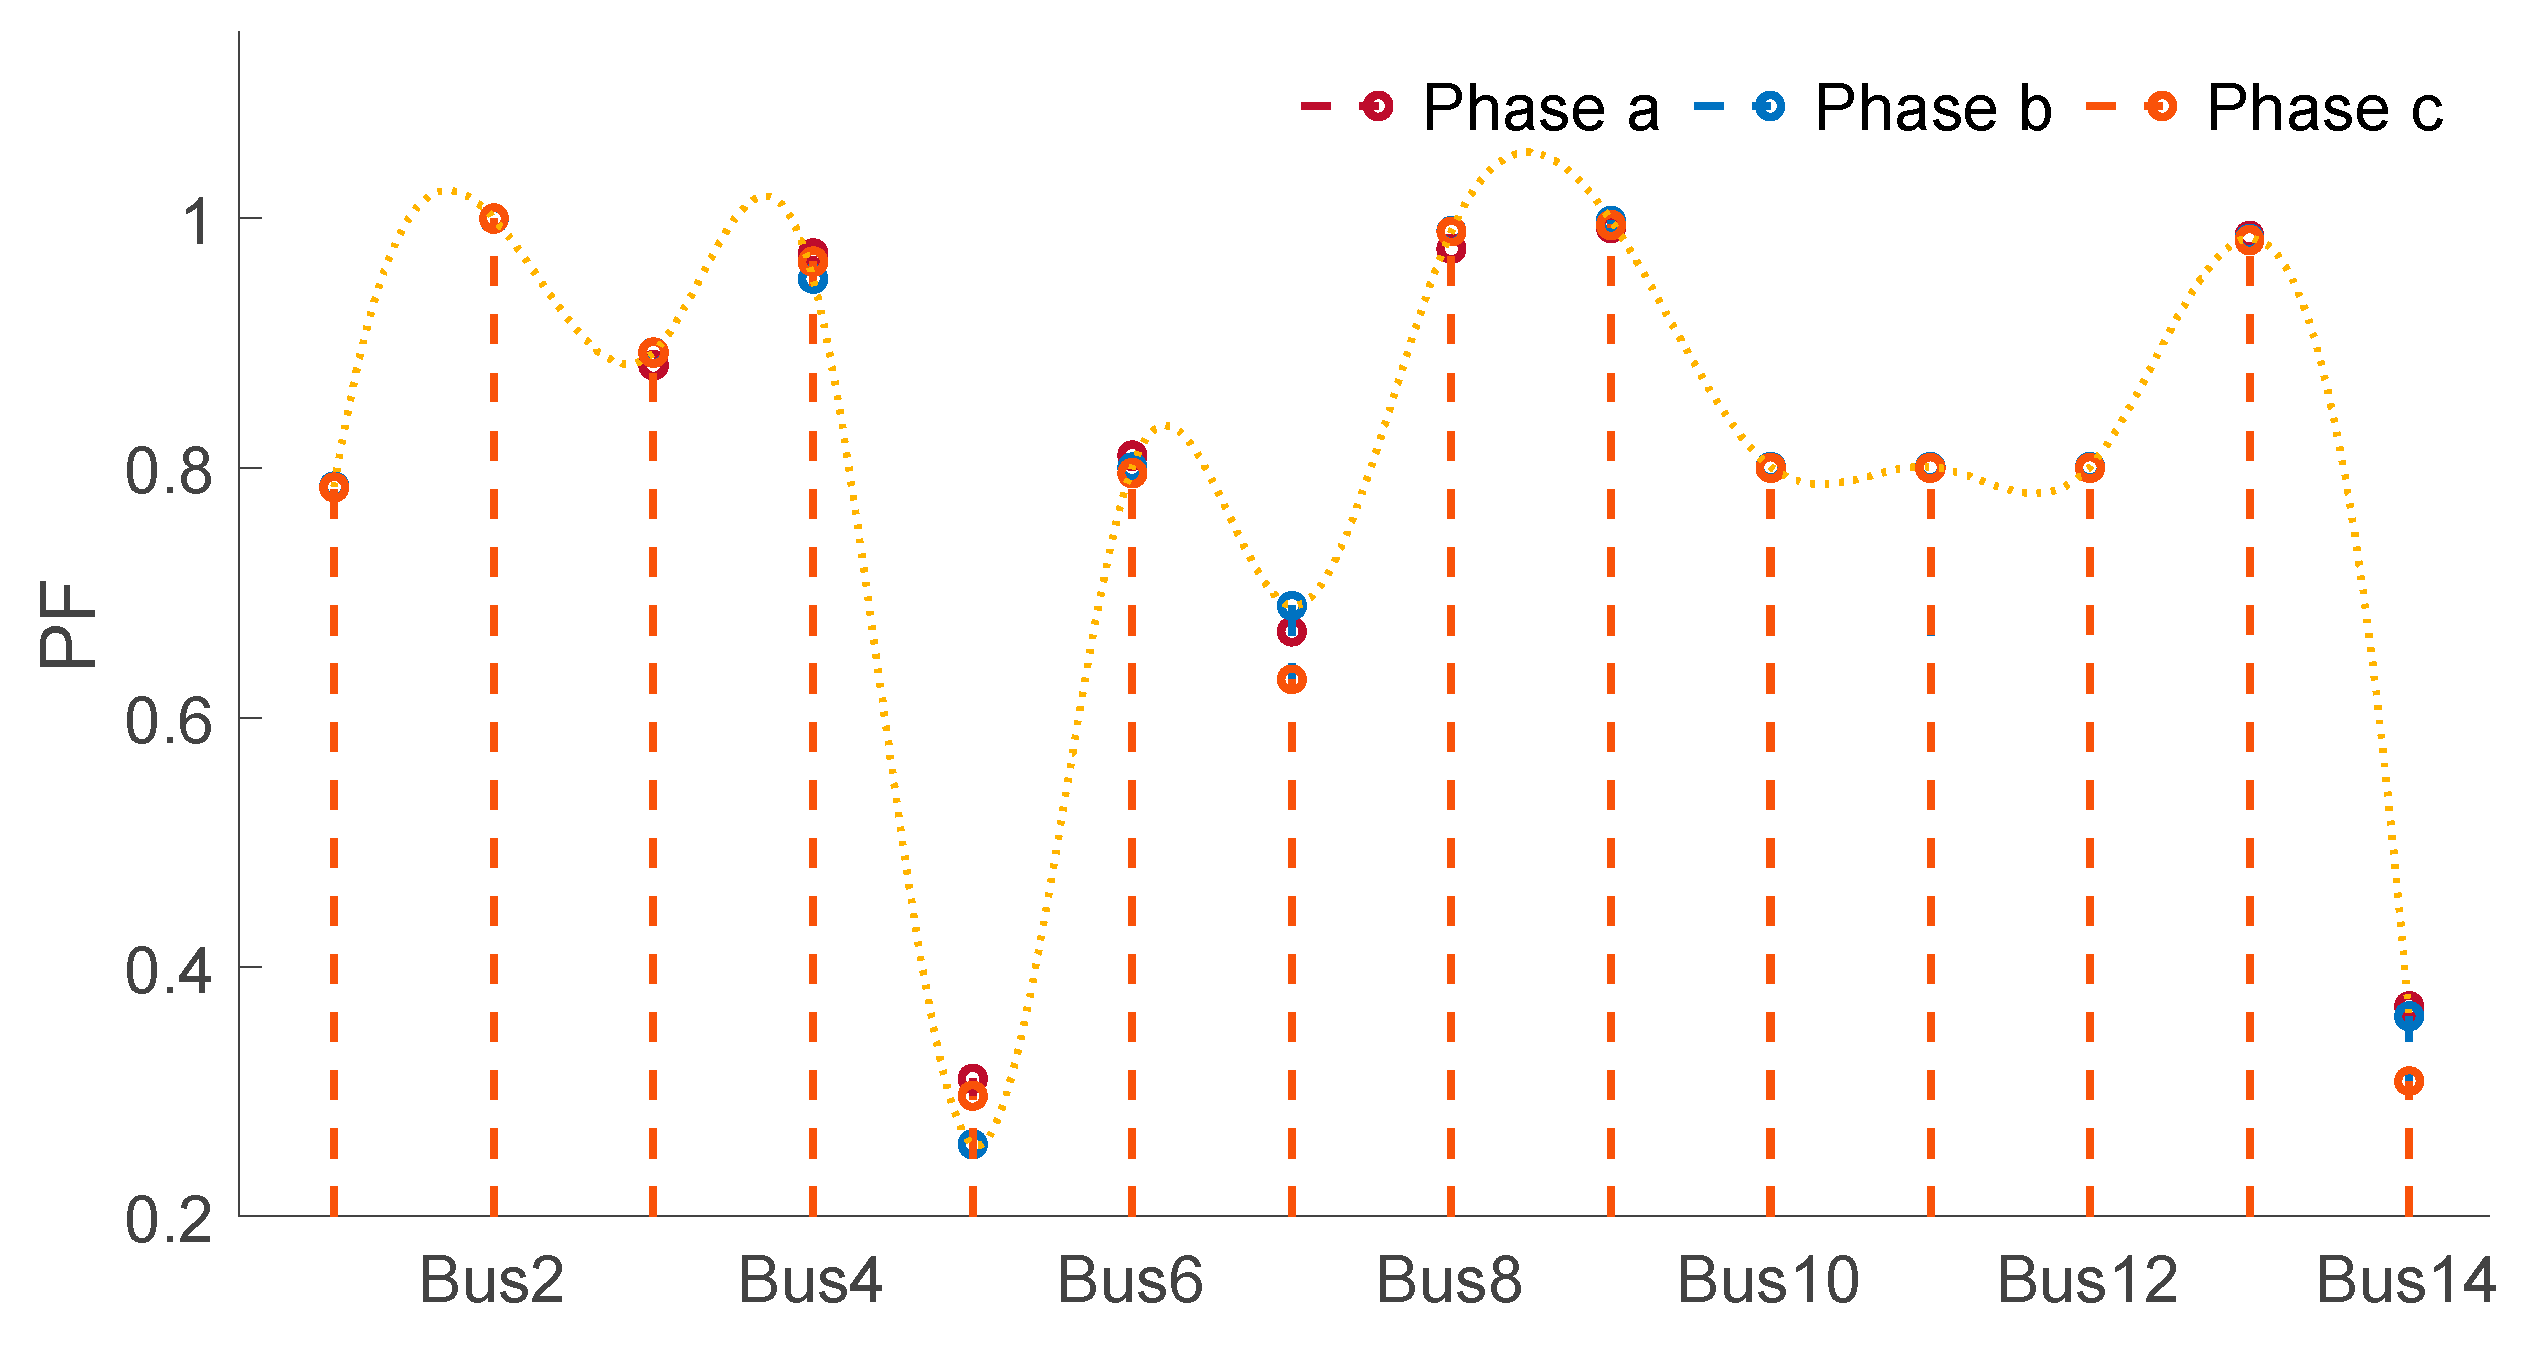
The quality of AC to DC conversion is measured by certain performance parameters. Within these parameters is the PF, which measures the ratio of power used by the electrical loads and the power provided by the DGUs and/or conventional grid. In other words, the PF represents how much the power delivered by the DGU is consumed by the electrical loads, with a low PF indicating that there are harmonic components in the line currents. Figure 9 shows the PF for each bus of the proposed MG.
This Figure shows that the PF in buses 2, 9 and 13 is almost equal to 1. This is because in bus 2 there is only one contribution of active power from the DC–MG, while the almost unitary PF in bus 9 it is because the measurement was made directly in the bus where the electric arc furnace is connected. On the contrary, it is observed that there is a great deterioration of the PF in buses 5 and 14, respectively, because they are power transfer buses, and, in both cases, they transfer more reactive than active power. This phenomenon is due to the loss of an active power contribution from the PV systems that occurs at night when there is no solar radiation. It should be noted that one of the main consequences of presenting a low PF lies in the generation of harmonic component, which causes malfunctions in the electrical grid’s equipment in the electrical grid, such as transformers, switches and control systems, in addition to voltage fluctuations, noise and electrical disturbances such as transients. Finally, it is important to highlight that this analysis shows the conflict that may exist if a PF variable occurs when compensating for an EPS with only the contribution of active power. If only active power is injected, the PF seen by the electrical grid deteriorates, which leads to the need to compensate a system with more criteria and where the joint compensation of active and reactive power is considered.

4.3. Total Harmonic Distortion (THD)

To estimate the harmonic content contained in a waveform, the THD indicator is used. This parameter characterizes the quality of the signal or, alternatively, determines how close its waveform is to a purely sinusoidal one. It can be applied to both voltages and currents.

4.3.1. Voltage THD

The voltage THD is defined as the relationship between the effective value of the total harmonic components and the effective value of the fundamental component. This indicator is used in high, medium and low voltage systems. To evaluate harmonic voltages there are two ways: i) individually, relating its relative amplitude V k to the fundamental component of the effective voltage, " V e f " , and ii) globally by calculating the voltage THD using the following expression:
T H D v = k = 2 V k 2 V ef 2 2
where " V e f " is the effective value of the fundamental voltage wave and " V k " is the effective value of the harmonic k. The recommended limit values for voltage harmonics are reflected in Table 9.
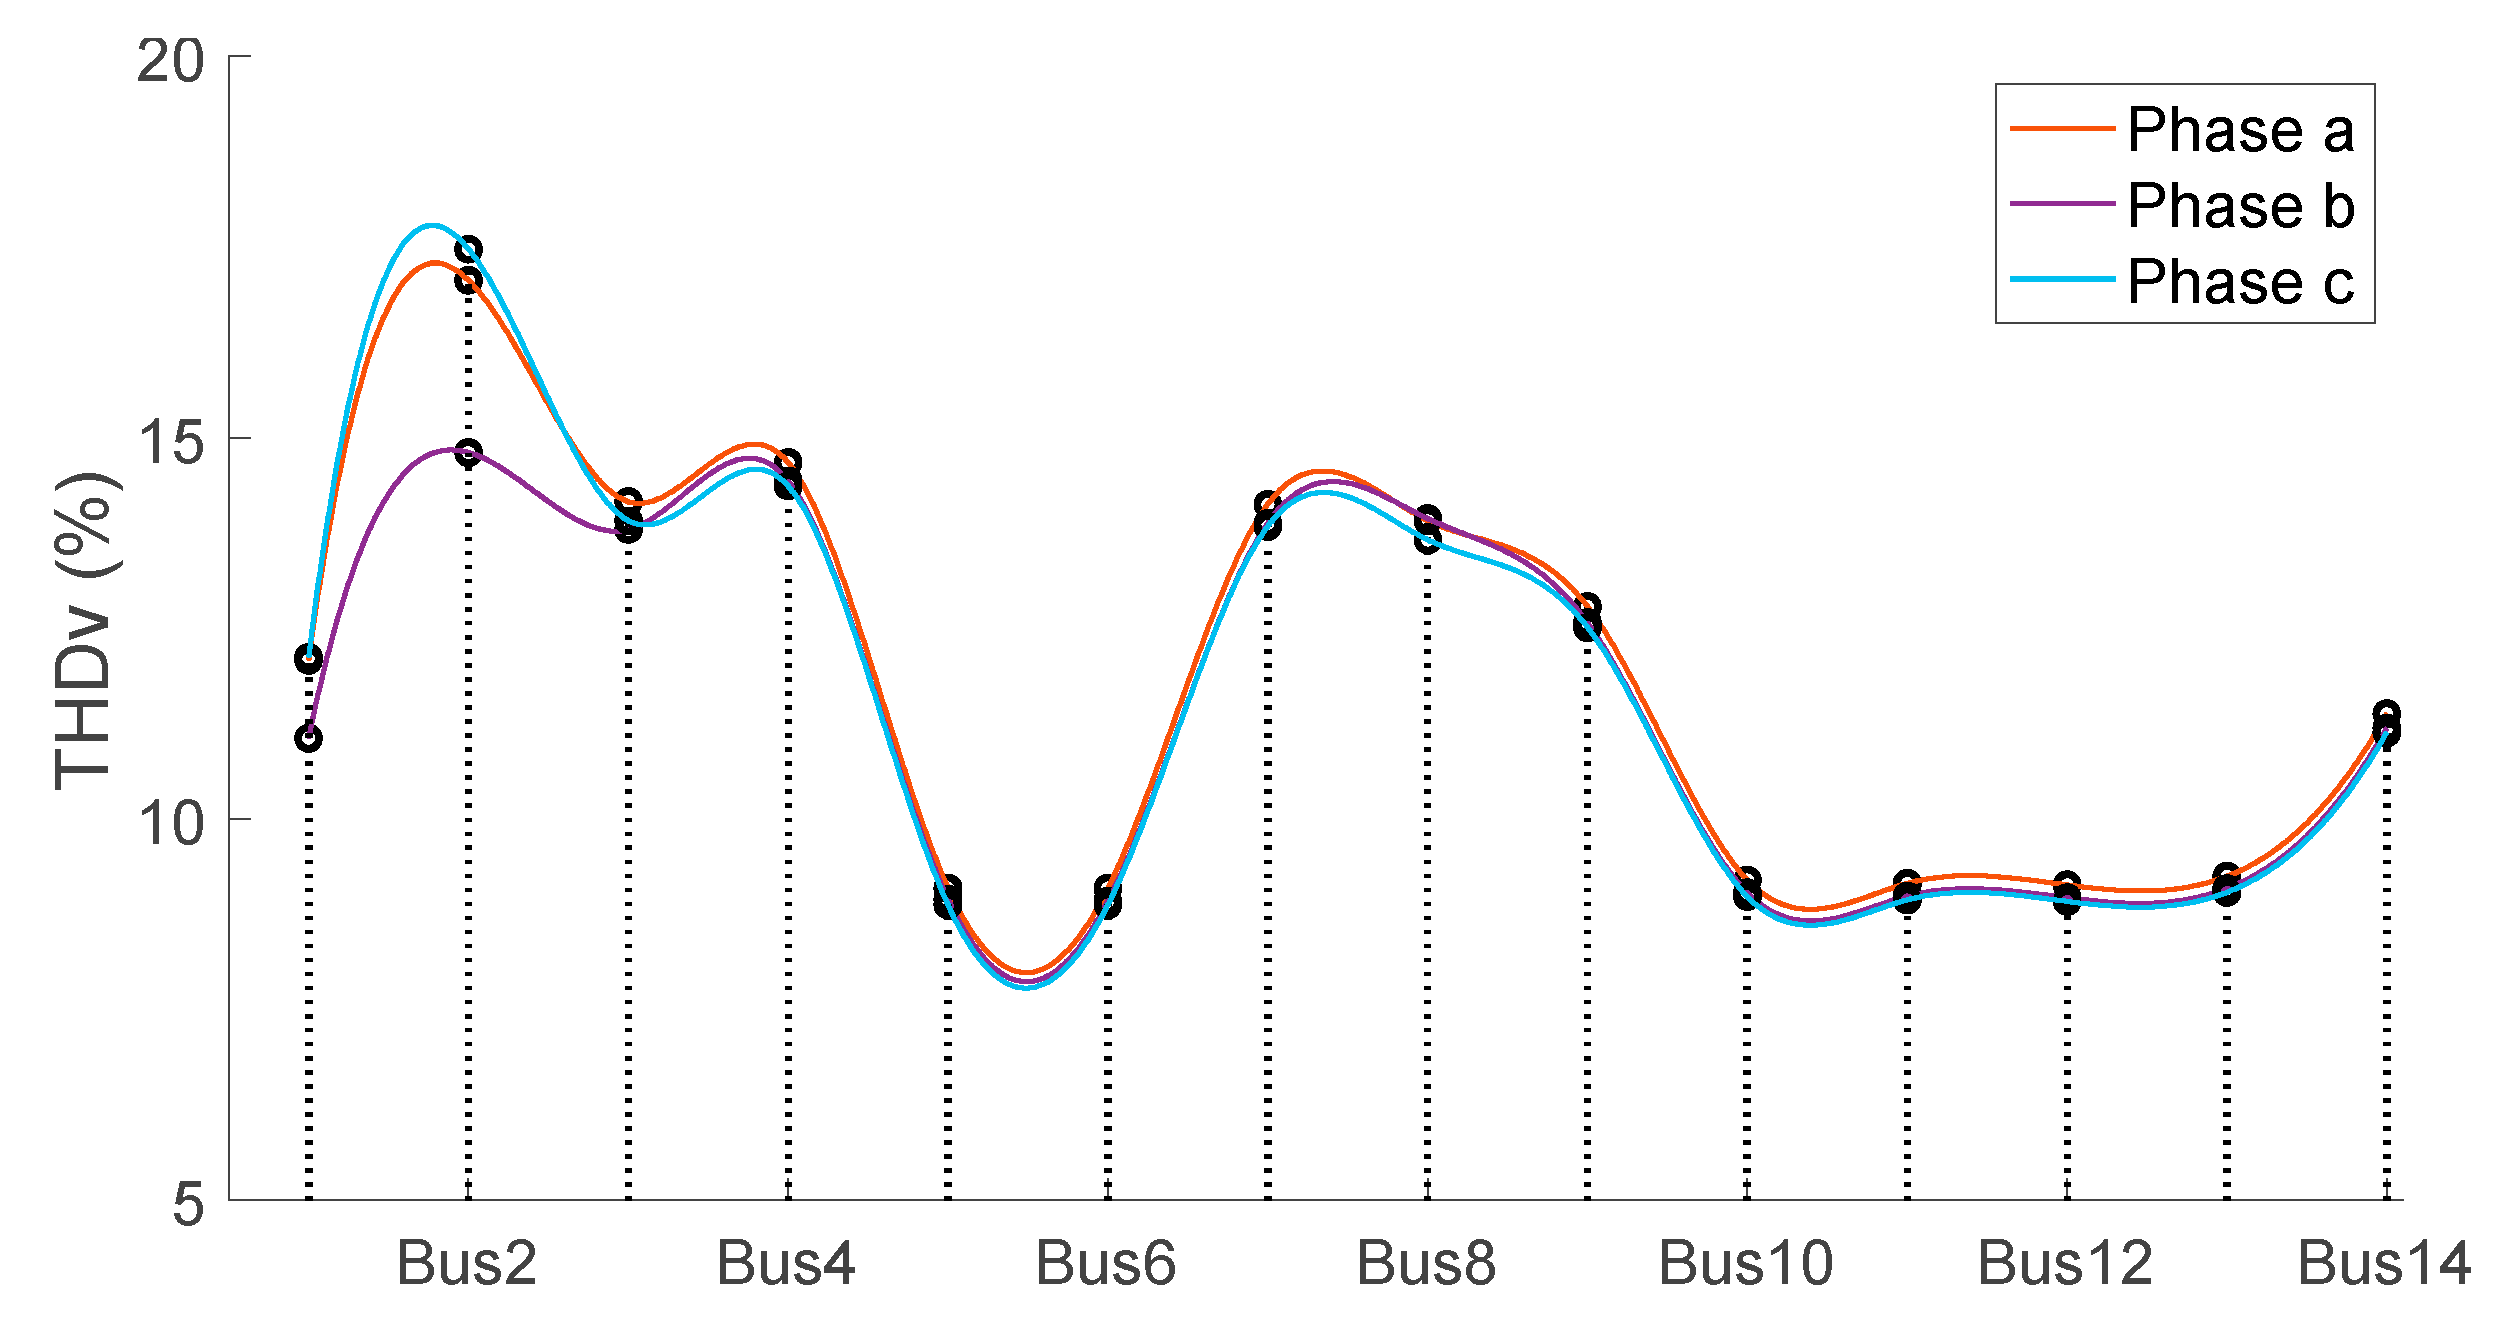
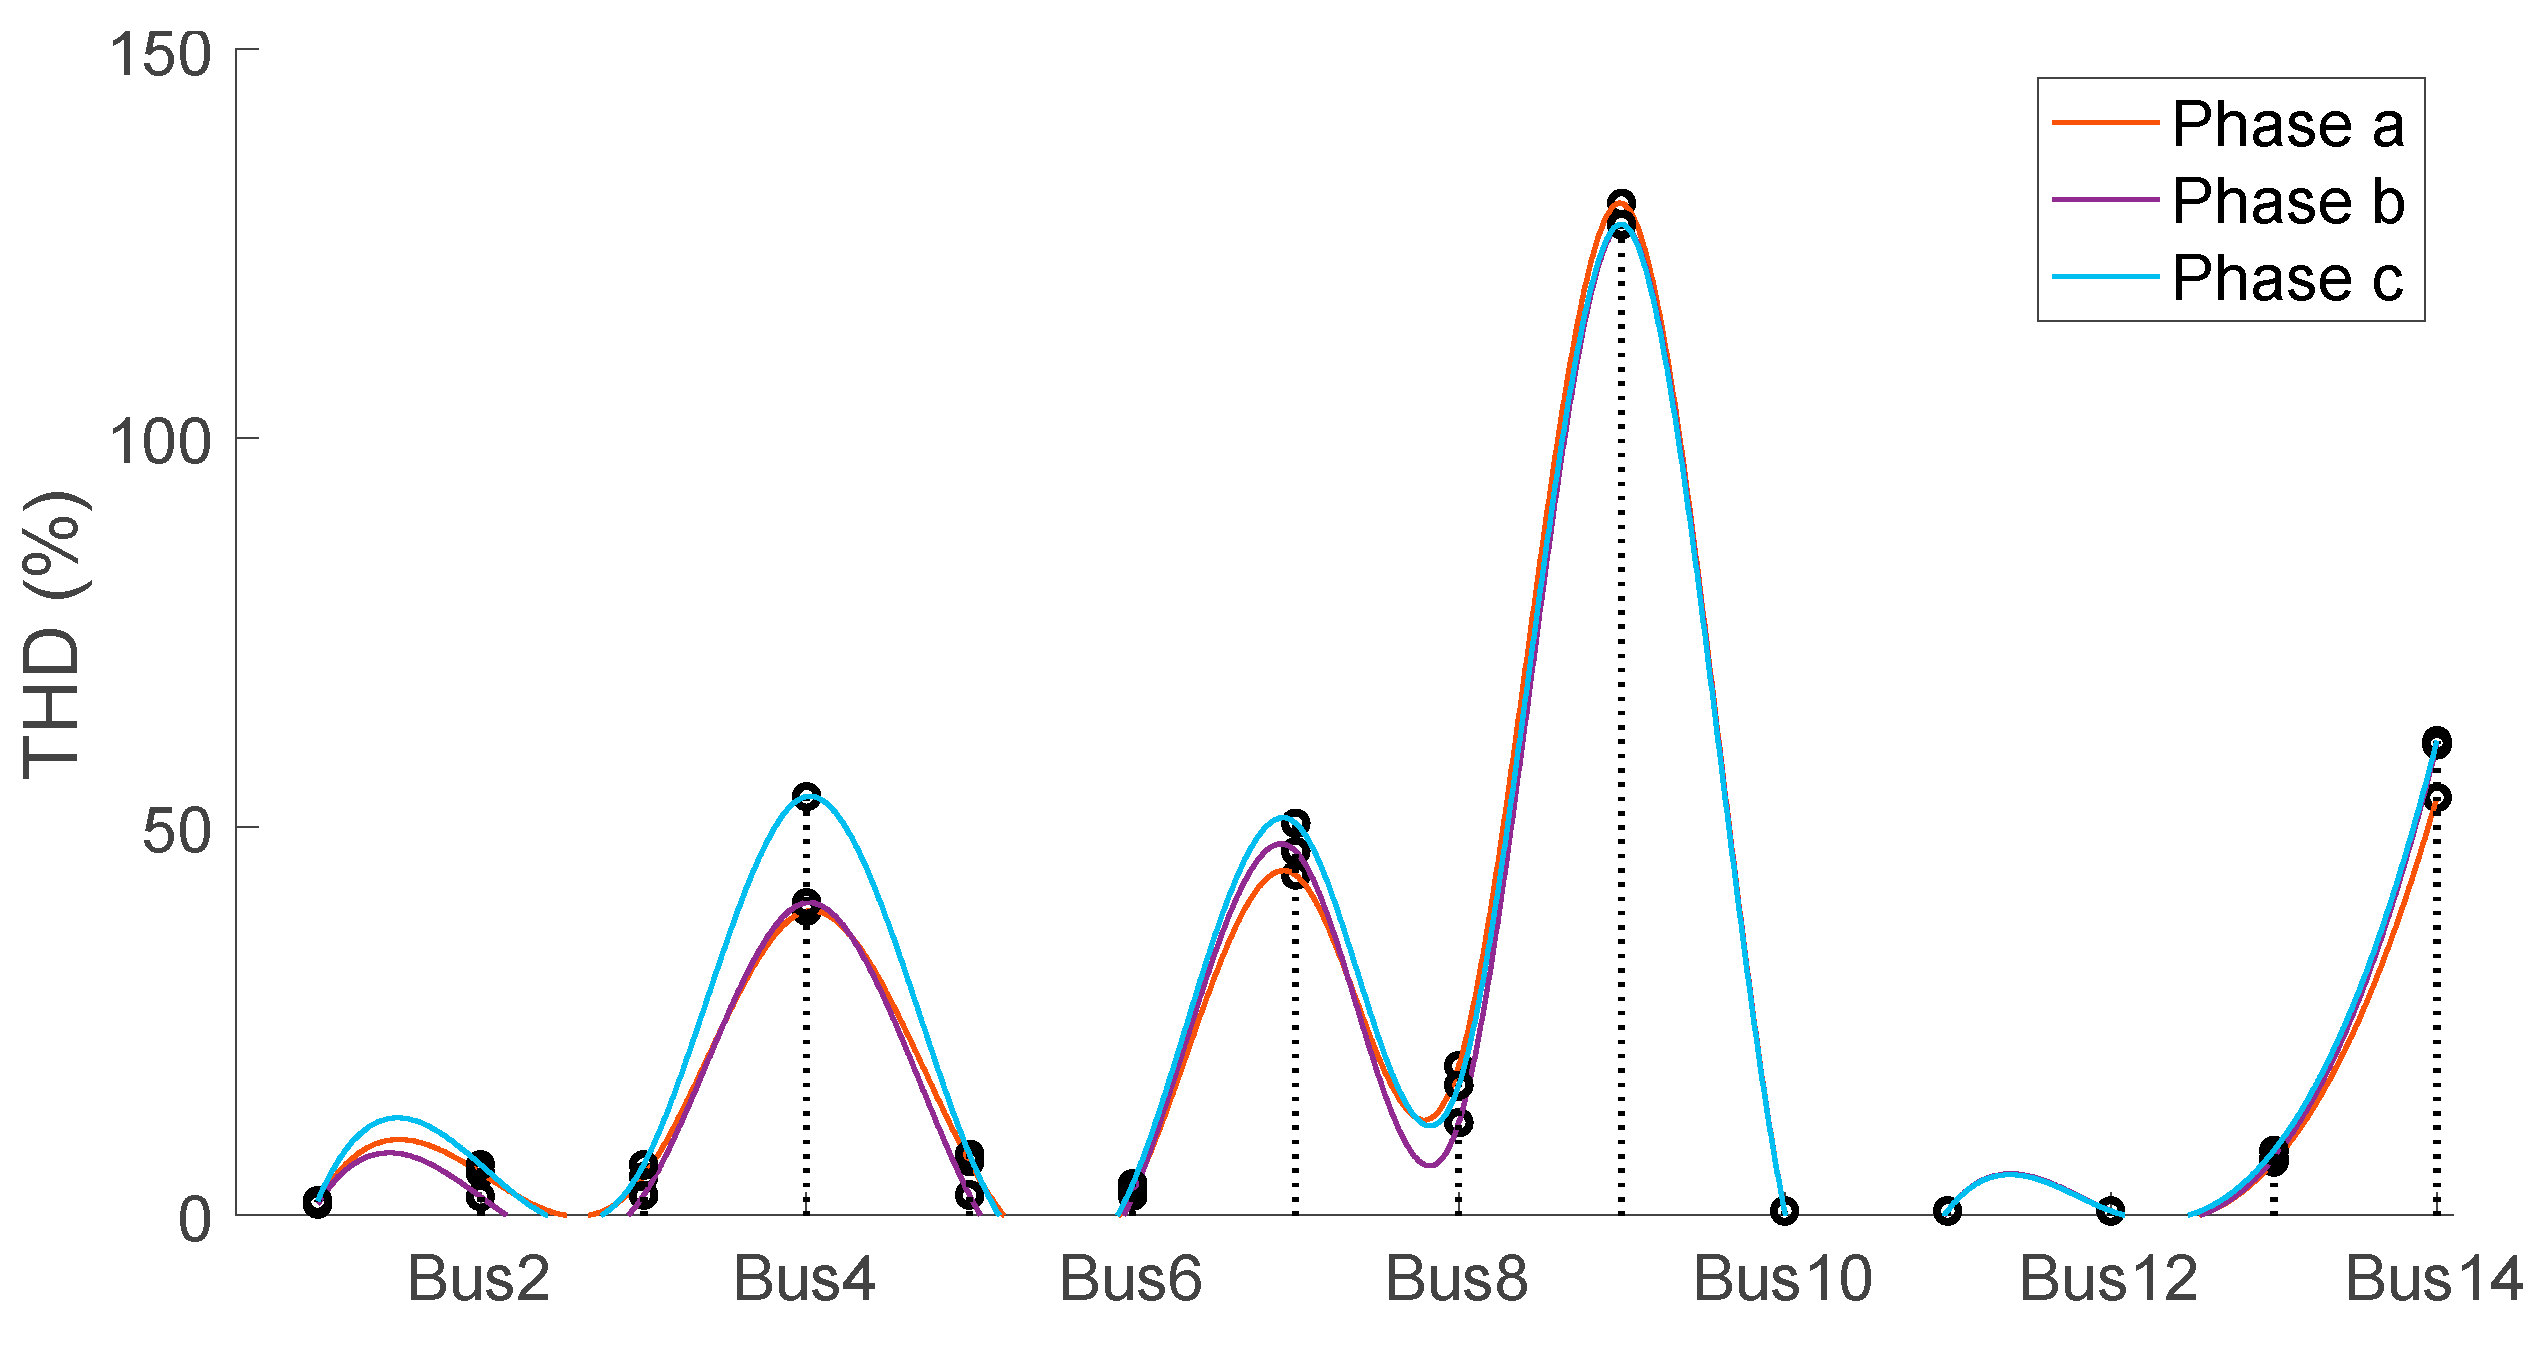
Figure 10 shows the voltage THD index for each of the system buses. The THD at each bus is calculated as shown in (2).
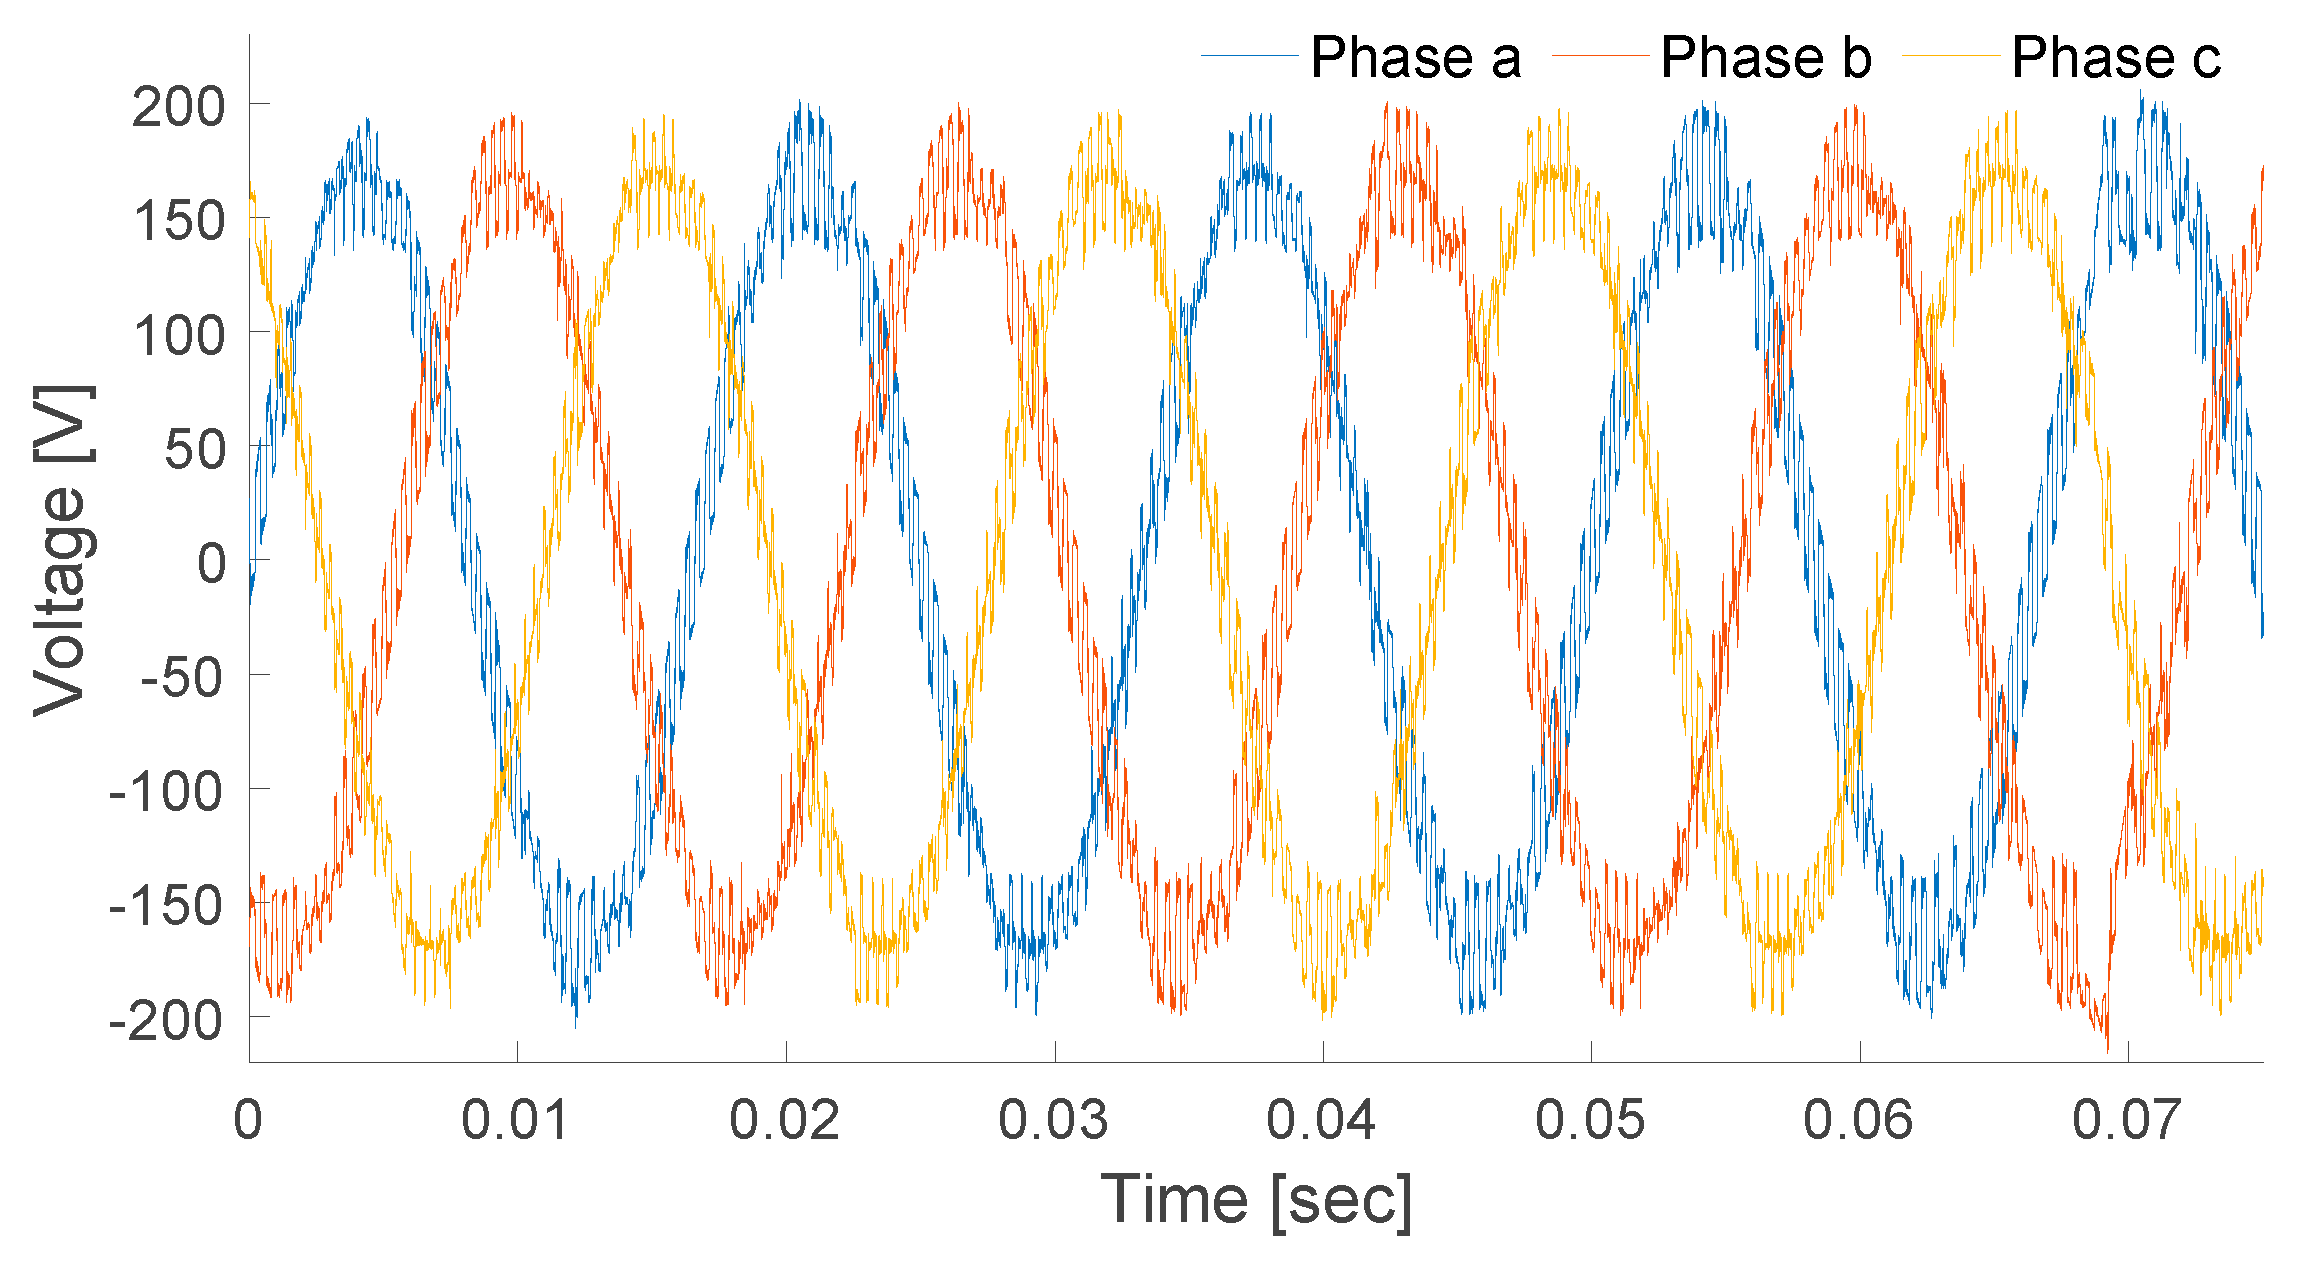
As seen in the figure, the voltage THD fails to comply with the allowable voltage distortion limit of 5% according to the IEEE–519 standard; see Table 9. This is due to the insertion of large nonlinear loads (electric arc furnace) and the participation of large variable DGUs such as the wind turbine, which has a notable impact on the behavior of the MG. Figure 11, Figure 12, Figure 13 and Figure 14 show the three-phase waveform of the voltages as well as each of the buses.

4.3.2. Current THD

THD is one of the problems that affects power quality especially in distribution systems. THD applied to a current signal uses values of harmonic currents, as well as the fundamental harmonic. Furthermore, it can take percentage values of a few units and even exceed 100%, as happens with switched-mode power supplies. To obtain this value, eq. (3) is used:
T H D i = k = 2 I k 2 I ef 2 2
where " I e f " is the effective value of the fundamental current wave and " I k " is the effective value of the harmonic k. Table 10 lists the maximum limits expressed in % of the T H D i for different voltage levels in distribution systems. Figure 15 shows the current THD index for each of the system buses. The THD at each bus is calculated as shown in (3). As seen in Figure 15, many harmonic current signals are generated in the bus where the nonlinear load (electric arc furnace) is connected.
The same procedure is carried out for the voltages on buses 7 and 9, respectively, which are shown in Figure 13 and Figure 14.
This is due to the random variations in the length of the electric arc furnace, which generates random variations in the system current and thus voltage variations proportional to the impedance of the system upstream of the electric arc furnace.
Additionally, the emission of harmonic currents in the system buses measured during the start-up and scrap melting periods is high. To reduce this problem, some method of reactive power compensation or the installation of capacitor banks is recommended. Another alternative would be to raise the short-circuit power in the PCC from 100 to 110 MVA, which is only feasible if it is powered from the next higher voltage level: in this case 13.8 kV. The selection of any of the solutions is based on the project economics and its technical feasibility. If the emission of harmonic current problem is not attended to in time, other types of consequences could arise such as the overheating of the neutral wire in the three-phase system, the voltage difference in the secondary winding of the distribution transformer and, therefore, the increase in the copper loss and heat loss in electrical equipment, which are problems that follow the excessive harmonic distortion produced in a system of these characteristics.
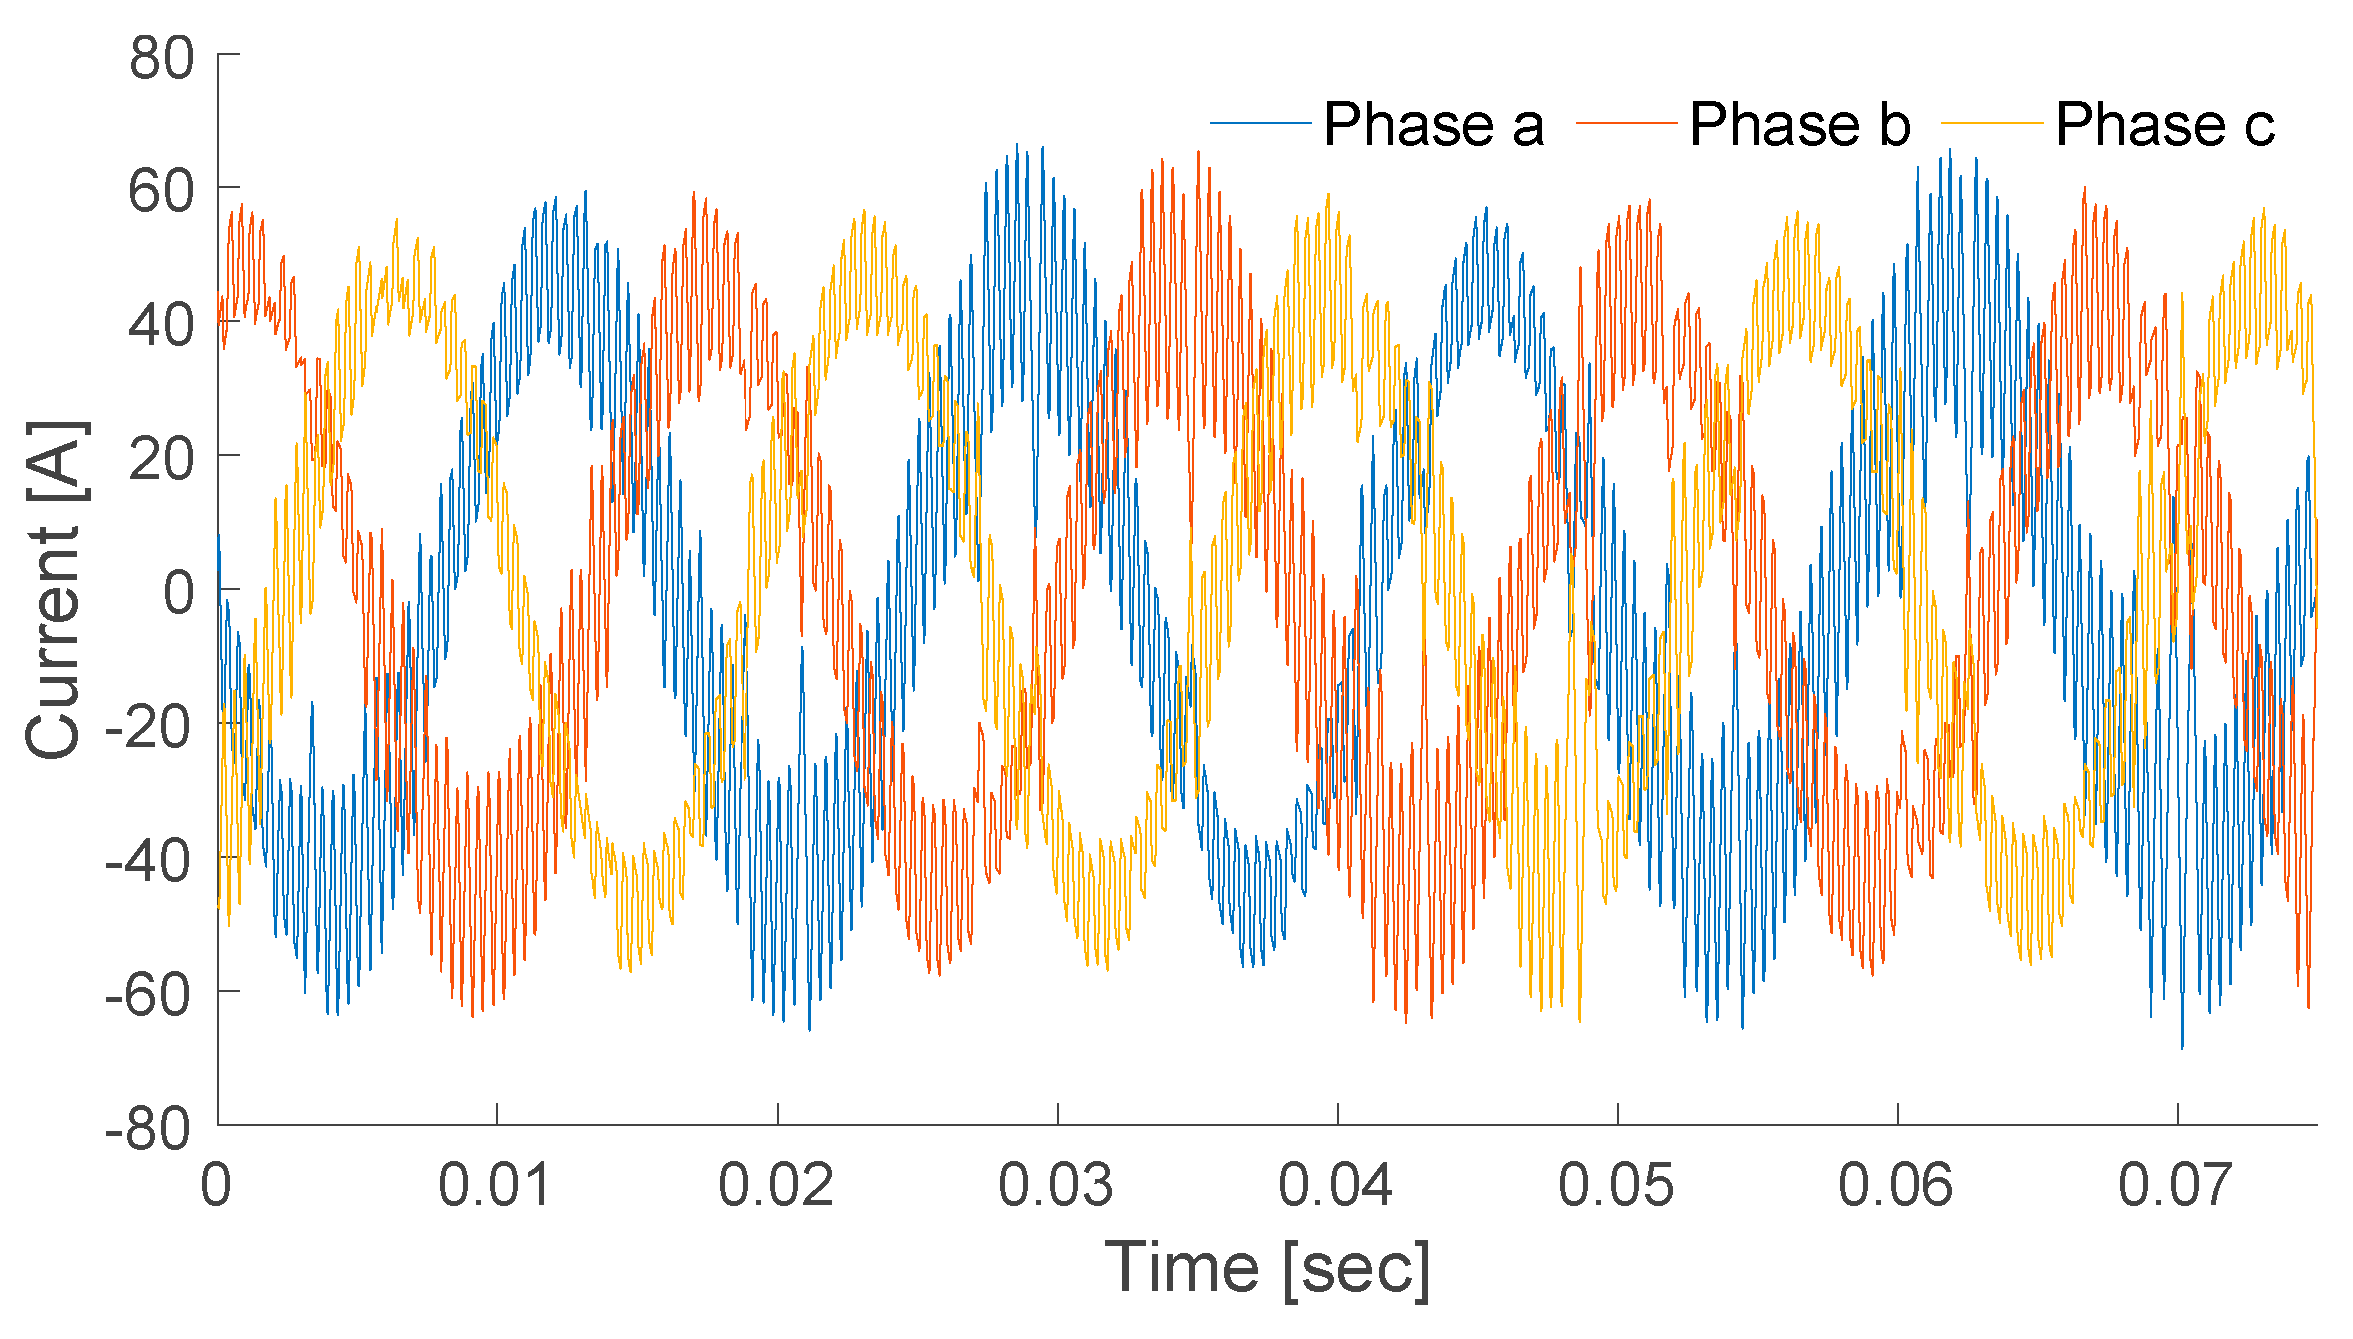
Figure 16 show the three-phase currents at bus 4 and Figure 17, Figure 18 and Figure 19 show the single-phase current waveforms of the most vulnerable buses according to Figure 15.
Finally, Table 11 lists the most significant harmonic components of the currents shown in Figure 17, Figure 18 and Figure 19. It is important to note that not only harmonic components are generated in the voltage and current but also inter–harmonic components, which are injected by the PCs because of their two different frequencies of direct connections with the electrical grid.

5. Conclusion

In this study, a model of a 4-MW hybrid MG was proposed for power quality studies where DGUs such as solar and wind were considered with an injection of 25% and the participation of a conventional generation system with a 75% injection. In addition, linear and non–linear, balanced and unbalanced loads were considered, as well as two battery based ESSs. The proposed MG operates in grid–connected mode. The proposed hybrid MG model was simulated in MATLAB–Simulink®, and the results were validated with the compatibility levels of the IEEE–519 standard. The most important conclusions of this study are listed below.
  • The power quality issues in MGs in this study are due to three reasons: i) micro-sources (because of the unstable production of DGUs such as PV systems and wind turbines), ii) those caused by the power electronics adopted in the MG and iii) those caused by different types of load and the increase in reactive power demands thereof.
  • The current harmonic distortion that was mainly caused by the involvement of power electronics and different types of load causes an increase in voltage harmonics, which has a great impact on reliability and system operational efficiency. Although, in the authors’ opinions, greater importance should be given to the analysis of the current THD than to the analysis of the voltage THD, especially for the PV connected to the grid and operating with variable irradiance.
  • The harmonic currents produced because of nonlinear loads have waveforms that are not sinusoidal because of the additional superimposed waveforms, which produce multiple frequencies in addition to the sine wave at a fundamental frequency. Current distortions in each of the system buses are responsible for voltage distortions. Therefore, it is suggested to continue this study considering the application of an inter–harmonic and sub–harmonic analysis.
  • The magnitude of the THD varies with the number of non–linear loads integrated into the MG, which, if the THD is high, will then produce an effect on the system devices, including transformers, capacitors and electrical rotating machines. Additionally, the unbalanced load directly affects the stability of the system, which can damage the MG power electronic equipment.
  • Finally, as future work it is suggested to implement the three-dimensional space vector PWM technique, as long as the degree of load unbalance is slight, or a robust dis-tributed voltage control strategy to suppress the unbalanced load and also the specific harmonic components.

Author Contributions

E.H.M.: Conceptualization, methodology, investigation, writing–original draft preparation, writing–review and editing, project administration.; C.R.J.R.: Investigation, supervision and writing–original draft.; O.A.J.S.: Investigation and writing–original draft; J.A.E.S.: Conceptualization and visualization; A.L.L.: Conceptualization and visualization; R.A.G.D.: Visualization; S.A.G.L.: Visualization. All authors have read and agreed to the published version of the manuscript.

Funding

This research received no external funding.

Conflicts of Interest

Declare conflicts of interest or state.

References

  1. Li, Y.; Feng, B.; Li, G.; Qi, j.; Zhao, D.; Mu, Y. Optimal distributed generation planning in active distribution networks considering integration of energy storage. Applied Energy 2018, 210, 1073–1081. [CrossRef]
  2. Ali, Z.M.; Calasan, M.; Abdel-Aleem, S.H.E.; Jurado, F.; Gandoman, F.H. Applications of energy storage systems in enhancing energy management and access in microgrids: A review. Energies 2023, 16, 5930. [CrossRef]
  3. Planas, E.; Andreu, J.; Garate, J.I.; Martínez, I.; Ibarra, E. AC and DC technology in microgrids: a review. Renew. Sustain. Energy 2015, 43, 726–749. [CrossRef]
  4. Sarwar, S.; Kirli, D.; Merlin, M.M.C.; Kiprakis, A.E. Major challenges towards energy management and power sharing in a hybrid AC/DC microgrid: A review. Energies 2022, 15, 8851. [CrossRef]
  5. Parhizi, S.; Lotfi, H.; Khodaei, A.; Bahramirad, S. State of the art in research on microgrids: a review. IEEE Access 2015, 3, 890–925. [CrossRef]
  6. Jithin, K., et.al. A review on challenges in DC microgrid planning and implementation. Journal of Modern Power Systems and Clean Energy 2023, 11, 1375–1395. [CrossRef]
  7. Li, Y.; He, J. Distribution system harmonic compensation methods: An overview of DG-interfacing inverters. IEEE Ind. Electron. Mag 2014, 8, 18–31. [CrossRef]
  8. Kow, K.; Wong, Y.; Kajkumar, R. Power quality analysis for PV grid connected system using PSCAD/EMTDC. Int. J. Renew. Energy Res 2015, 5, 121–132.
  9. Alhaiz, H.A.; Alsafran, A.S.; Almarhoon, A.H. Single-phase microgrid power quality enhancement strategies: A comprehensive review. Energies 2023, 16, 5576. [CrossRef]
  10. García, Y.; Dufo, R.; Bernal, J. Optimization of isolated hybrid microgrids with renewable energy based on different battery models and technologies. Energies 2020, 13, 581. [CrossRef]
  11. Talluri, G.; Lozito G.M.; Grasso, F.; García, C.I.; Luchetta, A. Optimal battery energy storage system scheduling within renewable energy communities. Energies 2021, 14, 8480. [CrossRef]
  12. Palizban, O.; Kauhaniemi, K.; Guerrero, J.M. Microgrids in active grid management—Part II: System operation, power quality and protection. Renew. Sustain. Energy Rev., 2014, 36, 440–451. [CrossRef]
  13. Moreira, J.L.; Ferreira, A.; Oliveira, G.; Lima, M.E. Harmonic effects due to the high penetration of photovoltaic generation into a distribution system. Energies 2021, 14, 4021. [CrossRef]
  14. Ai, Q.; Wang, X.; He, X. The Impact of Large-Scale Distributed Generation on Power Grid and Microgrids. Renewable Energy 2014, 62, 417–423. [CrossRef]
  15. Ostrowska, A.; et.al. Power quality assessment in a real microgrid-statistical assessment of different long-term working conditions. Energies 2022, 15, 8089. [CrossRef]
  16. Mariscotti, A. Power quality phenomena, standards, and proposed metrics for DC grids. Energies 2021, 14, 6453. [CrossRef]
  17. Roy, S.; Debnath, A.; Tariq, M.; Behnamfar, M.; Sarwat, A. Characterizing current THD’s dependency on solar irradiance and supraharmonics profiling for a grid–tied photovoltaic power plant. Sustainability 2023, 15, 1214. [CrossRef]
  18. Andishgar, M.; Gholipour, E. An overview of control approaches of inverter-based microgrids in islanding mode of operation. Renew. Sustain. Energy Rev., 2017, 80, 1043–1060. [CrossRef]
  19. Mohamad, A.; Mohamed, Y. Investigation and assessment of stabilization solutions for DC microgrid with dynamic loads. IEEE Trans Smart Grid 2019, 10, 5735–5747. [CrossRef]
  20. Hernandez, E., et. al. A comprehensive review on power quality, optimization techniques, and control strategies of microgrid based on renewable energy sources. Sustainability 2023, 15, 9847. [CrossRef]
  21. Blazek, V.; Petruzela, M.; Vantuch, T.; Slanina, Z.; Misak, S.; Walendziuk, W. The estimation of the influence of household appliances on the power quality in a microgrid system. Energies 2020, 13, 4323. [CrossRef]
  22. Lotfi, H.; Khodaei, A. AC versus DC microgrid planning. IEEE Trans. Smart Grid 2017, 8, 296–304. [CrossRef]
  23. Ma, T.; Cintuglu, M.; Mohammed, O.A. Control of a Hybrid AC/DC microgrid involving energy storage and pulsed loads. IEEE Trans. on. Ind. Appl 2017, 53, 567–575. [CrossRef]
  24. MirESSidi, S.; Dong, X.; Said, M. Towards hybrid AC/DC micro-grids: critical analysis and classification of protection strategies. Renew. Sustain. Energy Rev 2018, 90, 97–103. [CrossRef]
  25. Abubakar, M.; Renner, H.; Schurhuber, R. Development of a novel control scheme to achieve the minimum unbalance factor and real power fluctuations under asymmetrical faults. Energies 2023, 16, 7511. [CrossRef]
  26. Wu, Y.; Lin, J.; Lin, H. Standards and guidelines for grid–connected photovoltaic generation systems: A review and comparison. IEEE Trans. Ind. Appl 2017, 53, 3205–3216. [CrossRef]
  27. Gaur, P.; Singh, S. Investigations on issues in microgrids. J. Clean Energy Technol 2017, 5, 47–51. [CrossRef]
  28. Li, Y.; Vilathgamuwa, D.; Loh, P. A grid-interfacing power quality compensator for three-phase three-wire microgrid applications. IEEE Trans. Power Electron 2006, 21, 1021–1031. [CrossRef]
  29. Khan, M.; Haque, A.; Kurukuru, V.; Wang, H.; Blaabjerg, F. Standalone operation of distributed generation systems with improved harmonic elimination scheme. IEEE J. Emerg. Sel. Topics Power Electron 2021, 9, 6924–6934. [CrossRef]
  30. Martínez, M.; et.al. Distributed control scheme for clusters of power quality compensators in grid-tied AC microgrids. Sustainability 2023, 15, 15698. [CrossRef]
  31. Blooming, T.; Carnovale, D. Application of IEEE Std. 519-1992 harmonic limits. In Proc. Conf. Rec. Annu. Pulp Ind. Tech. Conf., 2006. [CrossRef]
  32. Cho, N.; Lee, H.; Bhat, R.; Heo, K. Analysis of harmonic hosting capacity of IEEE Std. 519 with IEC 61000–3–6 in distribution systems. In IEEE PES GTD Grand Int. Conf. Expo. Asia, 2019. [CrossRef]
  33. Nejabatkhah, F.; Li, Y. Overview of Power Management Strategies of Hybrid AC/DC Microgrid. IEEE Trans. Power Electron 2015, 30, 7072–7089. [CrossRef]
  34. An, C.G. Lee, H.; Kim, T.G.; Yi, J.; Won, C.Y. A study on energy management and cooperative control considering LVRT in a hybrid microgrid. Energies 2023, 16, 4372. [CrossRef]
  35. Bollen, M.; Zhong, J.; Zavoda, F.; Meyer, J.; McEachern, A.; Lopez, F. Power Quality aspects of Smart Grids. Renew. Energ 2017, 1, 1061–1066. [CrossRef]
  36. Kaushal, J.; Basak, P. Power quality control based on voltage sag-swell, unbalancing, frequency, THD and power factor using artificial neural grid in PV integrated AC microgrid. Sustain. Energ. Grids and Netw 2020, 100365. [CrossRef]
  37. Shafiefi, A.; Dehkordi, M.; Kiyoumarsi, A.; Farhangi, S. A Control Approach for Small–Scale PMSG–based WECS in the Whole Wind Speed Range. IEEE Trans. Power Electron 2017, 23, 9117–9130. [CrossRef]
  38. Jiménez, C.R.; Hernández, E.; Madrigal, M. Experimental Comparison of the Different Switching Techniques applied to Back-to-Back Converter connected to DFIG–based Wind Turbine for Harmonic Analysis. IEEE Transaction LatinAmerica 2022, 21, 142–150. [CrossRef]
  39. Jimenez, C.R.; Hernandez, E.; et al. Research trend of wind energy applied to microgrids: A bibliometric analysis (2005-2021). In XIX Simposio Internacional de Ingeniería Electrica SIE 2021, Las Villas, Cuba, 2021.
  40. Jiménez, C.R.; Arredondo, F.; Serrano, D. Harmonic Propagation in Hybrid Microgrids: A Simulation-based Analysis. In EEEIC / I&CPS Europe, Madrid, 2023. [CrossRef]
  41. Popa, G. Electric Power Quality through Analysis and Experiment. Energies 2020, 15, 7947. [CrossRef]
  42. Razmi, D.; et. al., An Overview on Power Quality Issues and Control Strategies for Distribution Networks with the Presence of Distributed Generation Resources. IEEE Access 2023, 11, 10308–10325. [CrossRef]
Figure 1. Typical diagram of an MG.
Preprints 96486 g001
Figure 2. Typical diagram of an AC–MG.
Preprints 96486 g002
Figure 3. Typical diagram of an DC–MG.
Preprints 96486 g003
Figure 4. Typical diagram of an DC–AC or hybrid MG.
Preprints 96486 g004
Figure 5. Operation modes of a hybrid MG.
Preprints 96486 g005
Figure 6. AC-DC or Hybrid MG modes operation.
Preprints 96486 g006
Figure 7. Electrical energy demand curve.
Preprints 96486 g007
Figure 8. Voltage profile.
Preprints 96486 g008
Figure 9. PF in each of the buses.
Preprints 96486 g009
Figure 10. Voltage THD in each of the buses of the proposed MG.
Preprints 96486 g010
Figure 11. Three-phase voltage at bus 4.
Preprints 96486 g011
Figure 12. Phase “a” voltage at bus 4.
Preprints 96486 g012
Figure 13. Phase “a” voltage at bus 7.
Preprints 96486 g013
Figure 14. Phase “a” voltage at bus 9.
Preprints 96486 g014
Figure 15. Current THD in each of the buses of the proposed MG.
Preprints 96486 g015
Figure 16. Three-phase currents at bus 4.
Preprints 96486 g016
Figure 17. Current at bus 4.
Preprints 96486 g017
Figure 18. Current at bus 7.
Preprints 96486 g018
Figure 19. Current at bus 9.
Preprints 96486 g019
Table 1. Synchronization parameters to reconnect the MG to the electrical grid.
Power of the DGUs (MVA) Frequency   difference   f , % Voltage   difference   V , % Angles   difference   Φ , °
0.0 – 0.5 0.3 10 20
>   0.5 – 1.5 0.2 5 15
>   1.5 – 10 0.1 3 10
Table 2. Main power quality issues in MGs operating in grid–connected mode.
Power quality issue PV WT Hydro Biomass Diesel
Voltage sags ×
Voltage swells × × ×
Voltage unbalances × × ×
THD × ×
Interruptions × ×
Table 3. PVs parameters.
PV I m p p P m a x v o c V m p p I c c
1 8.6 A 250 W 37.4 V 30.7 V 8.6 A
2 5.7 A 414.8 W 85.3 V 73 V 6.1 A
I m p p = maximum power point current; P m a x = maximum power; v o c = open circuit voltage; V m p p = voltage at maximum power point; I c c = short-circuit current.
Table 4. PMSG–based wind turbine parameters.
Parameter Value
Power P m 750 kW
Torque T m 318 kN × m
Voltage V s 575 V
Current I s 676 A
Frequency f 60 Hz
Pole Pairs 26
Speed 22.5 rpm
Stator resistance 6.5 m Ω
Rotor resistance 0.76 m Ω
Inductance stator 3.85 mH
Rotor inductance 1.12 mH
Flow magnetic 8.53 Wb
DC Capacitance 0.16 F
DC voltage 1,220 V
Table 5. Transformer parameters.
Transformer P n o m (MVA) Relationship voltage (kV) (AV/BV) R c c (pu) X c c (pu)
T1 100 Yg 69/13.8 D1 0.015 0.015
T2 1.5 Y 13.8/0.22 Y 0.03 0.03
T3 1.5 Y 13.8/0.22 Y 0.03 0.03
T4 1 Yg 13.8/0.25 D1 0.0012 0.03
T5 1 Yg 13.8/0.25 D1 0.0012 0.03
T6 0.5 D1 0.9/0.22 Y 0.003 0.06
T7 3.5 Yg 13.8/2.4 D1 0.015 0.015
P n o m =   Rated power; R c c =   Short circuit resistance and X c c =   short circuit reactance.
Table 6. Parameters of the different types of loads.
Bus Voltage Load type kVA PF % Off
2 LV Unbalanced 40 0.9 13
3 LV Unbalanced 30 0.85 12.6
4 LV Linear 15 0.9
9 MV Non-linear 320 1
10 MV Linear 800 0.8
11 MV Linear 400 0.8
12 MV Linear 800 0.8
14 MV Linear 1600 0.8
DC DC DC load 2 1
PF = Power factor; LV =   Low voltage; MV =   Medium voltage.
Table 7. Non–linear load parameters.
Capacitor Rated voltage Resistance phi   °
10 μ F 18,500 V D C 1,084 Ω 30
Table 8. Distribution lines parameters.
Line Comes out Enters R Ω X   Ω Distance
1 LV 1 LV 2 0.0297 0.016335 0.15 km
2 LV 1 LV 5 0.0396 0.02178 0.2 km
3 LV 2 LV 5 0.0297 0.016335 0.15 km
4 LV 2 LV 4 0.0792 0.04356 0.4 km
5 LV 4 LV 5 0.0792 0.04356 0.4 km
6 LV 2 LV 3 0.0792 0.04356 0.4 km
7 LV 3 LV 4 0.0198 0.01089 0.1 km
8 MV 7 MV 9 0.788 0.2336 2 km
9 MV 6 MV 11 2,364 0.7008 6 km
10 MV 6 MV 12 2,364 0.7008 6 km
11 MV 6 MV 13 1,182 0.3504 3 km
12 MV 10 MV 11 2,364 0.7008 6 km
13 MV 13 MV 14 1,182 0.3504 3 km
14 MV 9 MV 14 0.788 0.2336 2 km
Table 9. Voltage distortion limits.
Bus voltage at PCC Distortion harmonic T H D v (%)
Less than 69 kV 3.0 5.0
69 kV up to 161 kV 1.5 2.5
Greater than 161 kV 1.0 1.5
Table 10. Maximum limits (%) of odd harmonic current distortion for distribution system (120 V up to 69 kV).
I c c I d n < 11 11 n < 17 17 n < 23 35 n THD
< 20 4.0 2.0 1.5 0.6 5 %
20 < 50 7.0 3.5 2.5 1.0 8 %
50 < 100 10.0 4.5 4.0 1.5 12 %
100 < 1,000 12.0 5.5 5.0 2.0 15 %
> 1,000 15.0 7.0 6.0 2.5 20 %
I c c = Short circuit current; I d = Demand current.
Table 11. Harmonic currents components at buses 4, 7 and 9.
Bus Sequence Magnitude (%) Angle (º) Frequency (Hz)
4 0 10.25 148.2 180
5.62 152.2 300
+ 2.50 65.6 420
0 4.86 45.3 540
4.18 47.3 663.2
+ 8.17 24.9 780
6.33 64.4 840
+ 7.40 97.1 1145.2
7.07 37.9 1200
+ 9.66 40.1 1320.3
0 6.55 93.1 1440
4.06 250.3 1562.9
+ 3.08 110.4 1620
7 18.54 11.1 300
+ 7.49 121.6 420
0 6.42 29.4 540
6.05 206.3 673.2
+ 4.94 222.9 784.6
3.71 255.7 840
+ 3.0 125 961.3
6.26 245.9 1020
+ 6.44 57.6 1140
0 2.83 27.0 1260
4.18 168.1 1382.6
+ 4.94 183.0 1500
0 4.15 246 1620
9 84.98 27.0 300
+ 54.09 144.5 420
0 19.23 77.1 540
38.67 191.9 693
+ 6.43 85.8 781
7.05 163.1 856.3
+ 4.27 151.9 960
14.06 48.7 1022.4
+ 11.8 234.8 1320
0 19.57 54.0 1440
15.87 21.2 1579
+ 9.47 237.9 1684.5
Disclaimer/Publisher’s Note: The statements, opinions and data contained in all publications are solely those of the individual author(s) and contributor(s) and not of MDPI and/or the editor(s). MDPI and/or the editor(s) disclaim responsibility for any injury to people or property resulting from any ideas, methods, instructions or products referred to in the content.
Copyright: This open access article is published under a Creative Commons CC BY 4.0 license, which permit the free download, distribution, and reuse, provided that the author and preprint are cited in any reuse.
Prerpints.org logo

Preprints.org is a free preprint server supported by MDPI in Basel, Switzerland.

Subscribe

© 2024 MDPI (Basel, Switzerland) unless otherwise stated