Submitted:
16 January 2024
Posted:
16 January 2024
You are already at the latest version
Abstract
Keywords:
1. Introduction
2. Materials and Methods
-
General features:
- ○
- Location (region, district, and town);
- ○
- Geolocation (coordinates ETRS89 Use 30)
- ○
- Year when built;
- ○
- Year when enlarged;
- ○
- Ownership (state owned; leased to cooperative, institute, or private company; owned by private company or municipality);
- ○
- Use (grain store, disused, or reused);
- ○
- State of conservation. (1) Good condition: The silo is in good condition, i.e., it has no significant construction defects, although the mechanical facilities are in a poor state of repair. (2) Fair condition: The silo is leaky, it has water in its elevator shaft, its electric wiring has been burgled, its perimeter fencing is broken, etc. (3) Unusable: The silo is badly damaged or even in ruins. (4) Demolished: The silo has been demolished.
-
Construction features:
- ○
- Category (reception and storage silo or port silo);
- ○
- Storage capacity (t);
- ○
- Height (m);
- ○
- Ground plan (square or L-shaped);
- ○
- Roof shape (flat roof, gable roof, flat and gable roof, or vaulted roof);
- ○
- Tower position (front tower, side tower, corner tower, or interior tower);
- ○
- Number of storage cells;
- ○
- Number of rows of cells;
- ○
- Number of rows of internal cells or intercellular spaces;
- ○
- Shape of cells (circular or square);
- ○
- Cell dimensions (m);
- ○
- Façade types (straight; semicircular type I, which consists of straight façade, semicircular façade and straight façade; semicircular type II, which consists of semicircular façade and straight façade; semicircular type III, which consists of semicircular façade only);
- ○
- Cell construction material (reinforced concrete or reinforced brick);
-
Technological facilities:
- ○
- Receiving machinery capacity (t/h);
- ○
- Number of elevators;
- ○
- Number of upper-storey horizontal conveyors;
- ○
- Number of lower-storey horizontal conveyors;
- ○
- Existence of firefighting system (yes or no);
- ○
- Existence of lift (yes or no);
- ○
- Existence of temperature sensors (yes or no);
- ○
- Existence of railway (yes or no);
- ○
- Lorry weighbridge (t);
- ○
- Railway weighbridge (t).
-
Socioeconomic aspects:
- ○
- Population;
- ○
- Demographic patterns;
- ○
- Yearly municipal budget (€);
- ○
- Economic activity;
- ○
- Connections by road;
- ○
- Distances to larger urban centres (km).
3. Results and Discussion
3.1. Geographical distribution, development, and evolution of the EPAC silo network
3.2. Layout and construction characteristics
3.2.1. Early silos
3.2.2. Silos from the 1970s
3.2.3. Construction features
3.3. Technological development
3.3.1. Early silos
3.3.2. Silos from the 1970s
3.3.3. Port silos
3.4. Possibilities of reuse for Portugal’s silos
4. Conclusions
Supplementary Materials
Author Contributions
Funding
Data Availability Statement
Acknowledgments
Conflicts of Interest
References
- Teague, W.D. Flour for Man’s Bread: a History of Milling. Minnesota Archive Editions, New York, U.S., 2007.
- Pereira, J.L. 1980. Contribución fiscal del partido de Cáceres durante el siglo XVI: alcabalas y tercias. Norba. Revista de arte geografía e historia 1980, 1. http://hdl.handle.net/10662/810.
- Banham, R. A Concrete Atlantis. US Building and European Modern Architecture; MIT Press, Massachusetts. U.S., 1989.
- Salido, J. El almacenamiento de cereal en los establecimientos rurales hispanorromanos. In: Horrea d'Hispanie et de la méditerranée romaine, Arce, J., Goffaux, B., Eds.; Casa de Velázquez: Madrid, Spain, 2011; pp. 127-141.
- Fernández-Fernández M.V. Catalogación de las unidades de almacenamiento vertical de cereales de la red básica de Castilla y León, propuesta de una nueva clasificación y posibilidades de reutilización. Master’s thesis, Univ. de León, León, Spain 2016.
- DG. Lei de 15 de Julio de 1889. Diário do Governo n.º 156/1889 de 16 de Julho.
- DG. Decreto de 29 de Agosto de 1889. Diário do Governo n.º 198/1889 de 4 de Setiembre.
- DG. Lei de 14 de Julio de 1899. Diário do Governo n.º 156/1899 de 15 de Julho.
- Amaral, L. 1996. Política e economia: O Estado Novo, os latifundiários alentejanos e os antecedentes da EPAC. Analise Social 1996, 31, 465-486.
- Ribeiro, I., Diniz, A. Celeiro Epac. A Paisagem Industrial de Évora. Sciencia Antiquitatis 2019, 2, 153-176.
- Reis, J. “Lei da Fome”: as origens do proteccionismo cerealífero (1889-1914). Análise Social 1979, 15, 745-793.
- Alves, J. Arquiteturas do Trigo: Espaços de Silagem no Alentejo, do século XIX à atualidade. Disssertacao para a obtençao do grau de mestre em arquitectura, Universidade de Évora, Portugal, 2016. http://hdl.handle.net/10174/19745.
- Pais, J. M. Elementos para a história do fascismo nos campos: a campanha do trigo: 1928-38 (I), Análise Social 1976, 12 (46), 401-473.
- Machado, J., Valadas, A.M., Ferrerira, J., Marques, M.F., Gameiro M.M. Elementos para a história do fascismo nos campos: A «Campanha do Trigo»: 1928-38 (II). Análise Social 1978, 14, (54), 321-389.
- Pratas, A.M. Arquitectura e memoria. Proposta de reabilitaçao das moagens de Mértola. Dissertacao de Mestrado Integrado em Arquitetura, Universidade de Coimbra, Portugal, 2018.
- FNPT. Federação Nacional de Produtores de Trigo: XXV aniversário. Federação Nacional de Produtores de Trigo, Lisboa, 1958.
- Galvão, J.M. A campanha do trigo: comemoração do seu trigésimo aniversário: discurso proferido na inauguração do marco comemorativo em Agua de Peixes-Viana do Alentejo em 28/12/59. Ed. Minerva Commercial, Beja, Portugal, 1960.
- Lucena, M. Salazar, a «fórmula» da agricultura portuguesa e a intervençao estatal no sector primario. Análise Social 1991, 26, (110), 97-206. https://www.jstor.org/stable/41010848.
- Palomares, S., Viscomi, P., Quintas, A. La patrimonalización rural del sur ibérico. 4rth international congress for heritage education and socialisation in rural áreas. Zalamea de la Serena. La Descomunal. Revista iberoamericana de patrimonio y comunidad 2016, 187-200.
- Mayer, R. Estabelecimento de silos para trigo em Portugal: Relatório apresentado à Federação Nacional dos Produtores de Trigo. Ed. Sociedade Tipográfica, Lisbon, Portugal, 1938.
- Lyttelton, A. Liberal and Fascist Italy: Short Oxford History of Italy: 1900-1945. Ed. John A. Davis, Oxford University Press, U.K., 2002.
- Clough, S.B. The economic history of modern Italy. Ed. Columbia University Press, Nueva York, U.S., 1964.
- Ferreira-Lopes, P., Mateo, C., Landi, S. La historia y fundamentos de la construcción de la Red Nacional de Silos mediante un análisis comparativo entre España, Italia y Portugal. In Proceedings of the XII Congreso nacional y cuarto congreso internacional hispoanoamericono de Historia de la construcción. Mieres, Spain, 4-8 October 2022.
- Fernández-Fernández, M.V., Marcelo, V., Valenciano, J.B., González-Fernández, A.B. Characterisation of the National Network of Silos and Granaries in Castilla y León, Spain: A Case Study. Sustainability 2023, 15 (4) 3755 . [CrossRef]
- Palmeiro, A. Postais Ilustradros: UM Olhar sobre os silos do distrito de Portalegre. In Proceedings of the III Seminário de I&DT, Centro Interdisciplinar de Investigação e Inovação, Instituto Politécnico de Portalegre, Portugal, 6-7 December 2012.
- DRE. Decreto-Lei 663/76 de 4 agosto de 1976, Institui as empresas públicas Empresa Pública do Abastecimento de Cereais (EPAC) e Instituto dos Cereais, E. P. (ICEP), e aprova os respectivos estatutos. Diário da República (Portugal) n.º 181/1976. Série I de 1976-08-04. https://dre.tretas.org/dre/111961/decreto-lei-663-76-de-4-de-agosto (accessed on 8 January 2024).
- Vieira, J.A. Arquiteturas do trigo: espaços de silagem no Alentejo, do século XIX à atualidade. Trabalho de dissertaçao. Maestrado en Arquitetura, Universidad de Evora, Portugal, 2016.
- EPAC. História. https://epac-comercial.webnode.pt/historia/ (accessed on 8 January 2024).
- Fernández-Fernández, M.V., Marcelo, V., Valenciano, J.B., López, F.J. History, construction characteristics and possible reuse of Spain’s network of silos and granaries. Land Use Policy 2017, 63, 298-311. [CrossRef]
- DRE. Decreto-Lei 26/91 de 11 de janeiro, transforma a Empresa Pública de Abastecimento de Cereais (EPAC) em sociedade anónima. Diário da República (Portugal) n.º 9/1991, Série I-A de 1991-01-11, 175-180. https://dre.pt/dre/detalhe/decreto-lei/26-693841 (accessed on 8 January 2024).
- DRE. Decreto-Lei 572-A/99 de 29 de Dezembro, determina a dissolução e regula a liquidação da EPAC - Empresa para Agroalimentação e Cereais, S. A. Diário da República (Portugal) n.º 301/1999, 1º Suplemento, Série I-A de 1999-12-29, 2-3. https://data.dre.pt/eli/dec-lei/572-a/1999/12/29/p/dre/pt/html (accessed on 8 January 2024).
- DRE. Decreto-Lei nº 188/2001 de 25 de junho, regula o processo de liquidação da SILOPOR - Empresa de Silos Portuários, S. A., e estabelece um conjunto de regras sobre a concessão da actividade da Empresa. Diário da República (Portugal) n.º 145/2001, Série I-A de 2001-06-25. https://dre.tretas.org/dre/142331/decreto-lei-188-2001-de-25-de-junho (accessed on 8 January 2024).
- Vaquero, M. Innovation in times of autarky: the construction of the wheat silos in Fascist Italy. Fabrikart 2011, 10, 264-277.
- Verde, P. Representaçao tipológica através da fotografía silos no Alentejo, partindo da obra de Bernd e Hila Becher. Disssertacao para a obtençao do grau de mestre em arquitectura, Universidade de Evora, Portugal, 2010.
- Maurílio, F. As arquiteturas do cereal em Évora. In Património industrial Ibero-americano: recentes abordagens, Palomares, S., Quintas, A., de Lima, F., Viscomi, P., Eds.; Biblioteca Estudos & Colóquios, Universidad de Evora, Evora, Portugal, 2020; Serie e-books nº 22. https://books.openedition.org/cidehus/13907.
- Benito, P. Patrimonio industrial y cultura del territorio. Boletín de la A.G.E. 2002, 34, 213-227.
- Mateo, C. Red Nacional de Silos y Graneros de España. In Proceeding of the III International Venue of the Agriculture and Food Productivion Section of TICCIH Nogent-sur-Seine, France, 20-22 October 2011.
- Fernández-Fernández, M.V., Marcelo, V., Valenciano, J.B., Boto, J. Catalogación de los silos pertenecientes a la red española de silos y graneros en Castilla y León. In Proceedings of the IX Congreso Ibérico de Agroengenharia, Braganza, Portugal. 4-6September 2017.
- Fernández-Fernández, M.V., Marcelo, V., Valenciano, J.B., López, F.J., Pastrana, P. Spain’s national network of silos and granaries: architectural and technological change over time. SJAR 2020, 18 (3) . [CrossRef]
- Marcelo, V., Valenciano, J.B., López, J., Pastrana P. The D5 Silo of Manganeses of the Lampreana (Zamora): History, construction characteristics and technology. AART 2021, 2 (2). [CrossRef]
- Azcárate, C.A. Catedrales Olvidadas, La Red Nacional de Silos en España 1949-1990. Ed. T6, Ministerio de Medio Ambiente y Medio Rural y Marino, Madrid, Spain, 2009.
- CME. Parecer de construção de um silo para 20000 toneladas na Horta das Figueiras em Évora. Acessível no Divisão de Gestão Urbanística da Câmara Municipal de Évora, Évora, Portugal, 1969.
- Sociedade de construções Valura LDA. Memória descritiva de silos para 20000 toneladas em Évora. Acessível no Divisão de Gestão Urbanística da Câmara Municipal de Évora, Évora, Portugal, 1970.
- Barciela, C.F. La modernización de la agricultura y la política agraria. Papeles de Economía Española 1997, 73, 112-133.
- Moreno A. Un análisis tecnológico sobre la red nacional de silos y graneros desde la ingeniería industrial en el ámbito agrario: ¿con qué maquinaria y cómo funcionaban? In Proceedings of the I Jornadas de patrimonio industrial agrario: silos a debate, Villanueva del Fresno, Spain. 26-28 September 2014.
- Pardo, C.J. El patrimonio industrial en España: Análisis turístico y significado territorial de algunos proyectos de recuperación. Boletín de la Asociación de Geógrafos Españoles 2010, 53, 239-264.
- Fuentes, J.M., López-Sánchez, M., García, A.I., Ayuga, F. Public abattoirs in Spain: History, construction characteristics and the possibility of their reuse. J. Cult. Herit. 2015, 16, 632-639.
- Matoso, R. Visita a antigos espaços industriais - Antigos Celeiros da Epac e Antiga Fábrica de escolha de sementes de trigo. In Ciclo de Conferências «Cultura, Espaço Público e Desenvolvimento - que opções para uma política cultural transformadora». Évora, Portugal, 2014; pp. 33-36.
- MZ. Museo Zer0. https://www.museu0.pt/ (accessed on 8 January 2024).
- Radiopax. Mértola: Antigos celeiros da EPAC vão transformar-se numa Estação Biológica https://www.radiopax.com/mertola-antigos-celeiros-da-epac-vao-transformar-se-numa-estacao-biologica/ (accessed on 8 January 2024).
- Aguilar, E., Merino, D., Migens, M. Cultura, políticas de desarrollo y turismo rural en el ámbito de la globalización. Horizontes Antropológicos, 2003, 20, 161-183.
- FUPIA. Se fallan los Premios Fundación Patrimonio Industrial de Andalucía. Fundación Patrimonio Industrial de Andalucía. http://www.fupia.es (accessed on 8 January 2024).
- JA. Informe final, año 2006, sobre el expediente POZ/2004/SIL sobre la actuación completa en el silo de Pozoblanco iniciado en 2004. Junta de Andalucía, Consejería de Agricultura, Pesca y Desarrollo Rural, Sevilla, Spain, 2006.
- 54. MIRIB. Museo Internacional de Radiotransmisión Inocencio Bocanegra http://www.belorado.es/node/329 (accessed on 8 January 2024).
- 55. Titanes. Arte público e inclusión social. Iamtitanes.com https://iamtitanes.com/ (accessed on 8 January 2024).
- Comune di Genova. Bando pubblico per la ristrutturazione e la gestione del silos Hennebique. https://www.portsofgenoa.com/it/archivio-notizie/item/1357-hennebique.html (accessed on 8 January 2024).
- Río, A.S.; Blanco, S. La tempestad en el silo: reutilización de un almacén de grano para representaciones teatrales. In Espacios industriales abandonados. Gestión del patrimonio y medio ambiente, 15th. ed.; Colección: Los ojos de la memoria; INCUNA, CICEES, Eds.; Miguel A. Álvarez Areces: Gijón, Spain, 2015; pp. 433-440.
- Salazar, A. Del trigo al hombre. Rehabilitar el silo. Trabajo fin de Master, Máster en Intervención Sostenible en el Medio Construido, Escuela Técnica Superior de Arquitectura del Vallès, Universidad politécnica de Cataluña, Barcelona, Spain, 2015.
- Laumain, X., López, A., Moreno, J., Sánchez, D. Turismo como desencadenante de la recuperación de patrimonio industrial. In In Proceedings of the III Jornadas de Patrimonio Industrial Activo, Murcia, Spain, 15-16 November 2013.
- García, A.I., Ayuga, F. Reuse of abandoned buildings and the rural landscape: The situation in Spain. ASABE, 2007, 50, 1383-1394.
- Fuentes, J.M. Methodological bases for documenting and reusing vernacular farm architecture. J. Cult. Herit. 2010, 11, 119-129. [CrossRef]
- Fuentes, J.M., Gallego, E., García, A.I., Ayuga, F. New uses for old traditional farm buildings: The case of the underground wine cellars in Spain. Land Use Policy 2010, 27, 738-748. [CrossRef]
- Cano, M.; Garzón, E.; Sanchez-Soto, P.J. Historic preservation, GIS, & rural development: The case of Almería province, Spain. Appl. Geogr. 2013, 42, 34-47. [CrossRef]

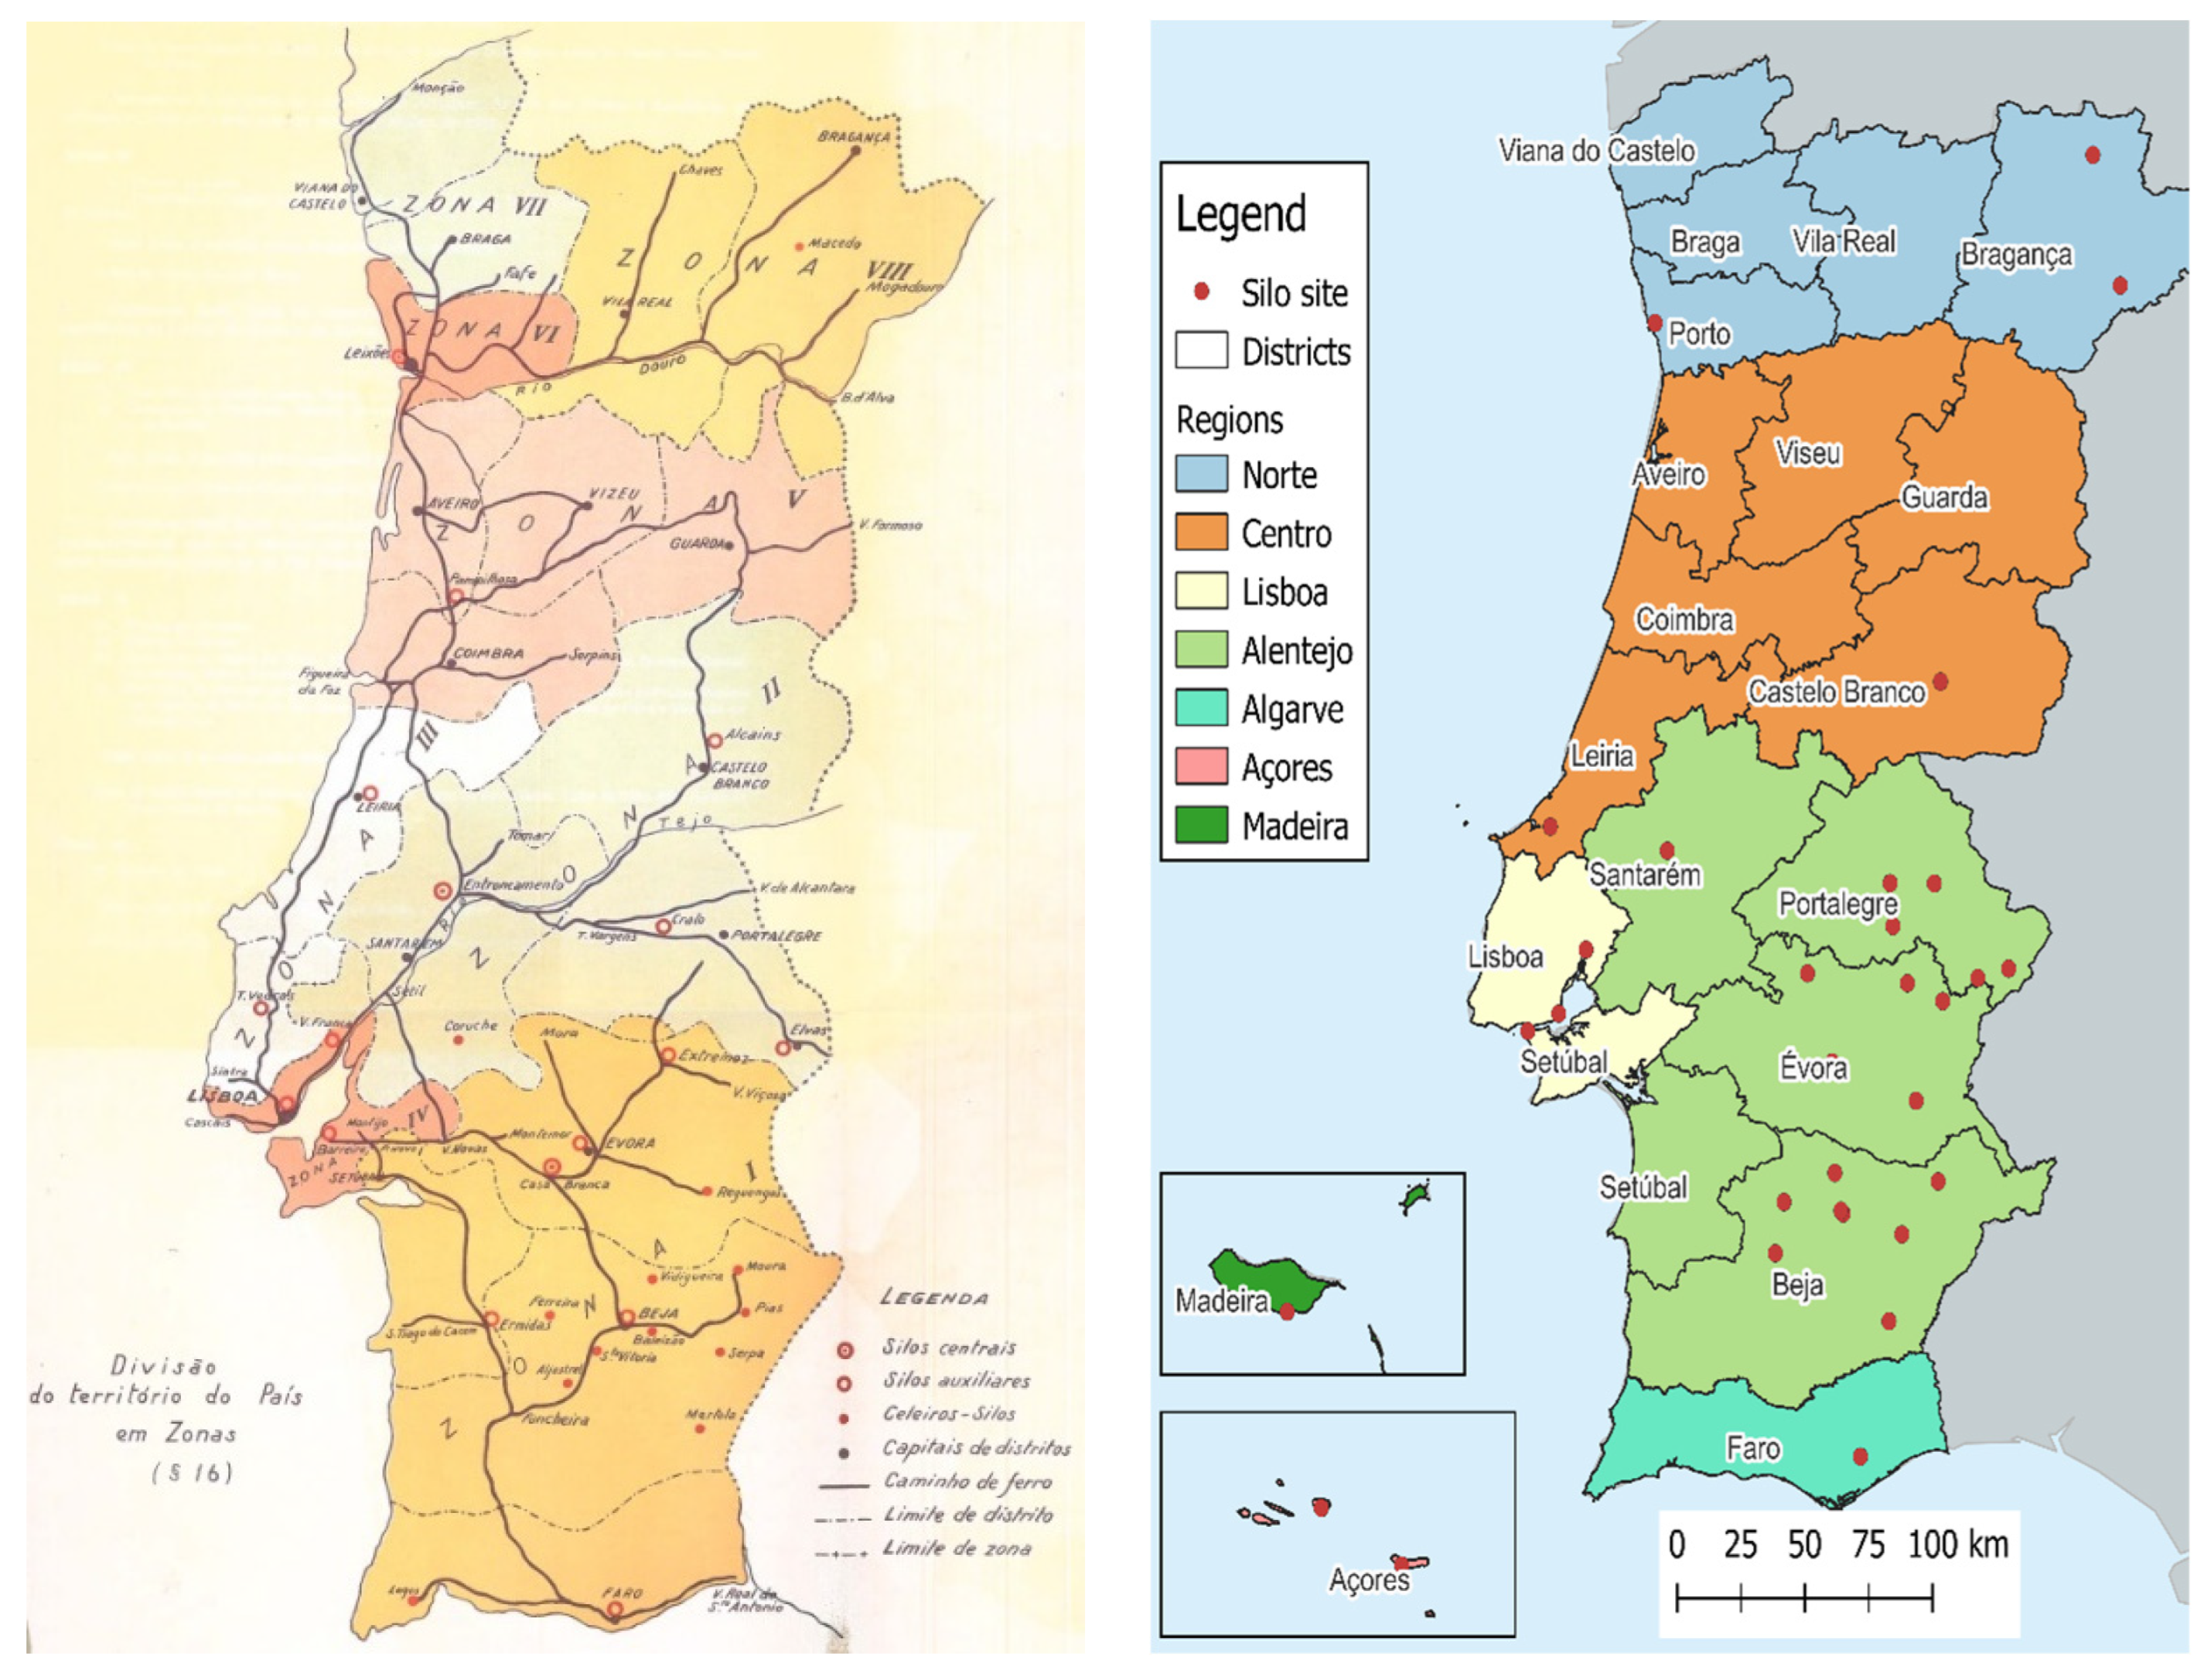
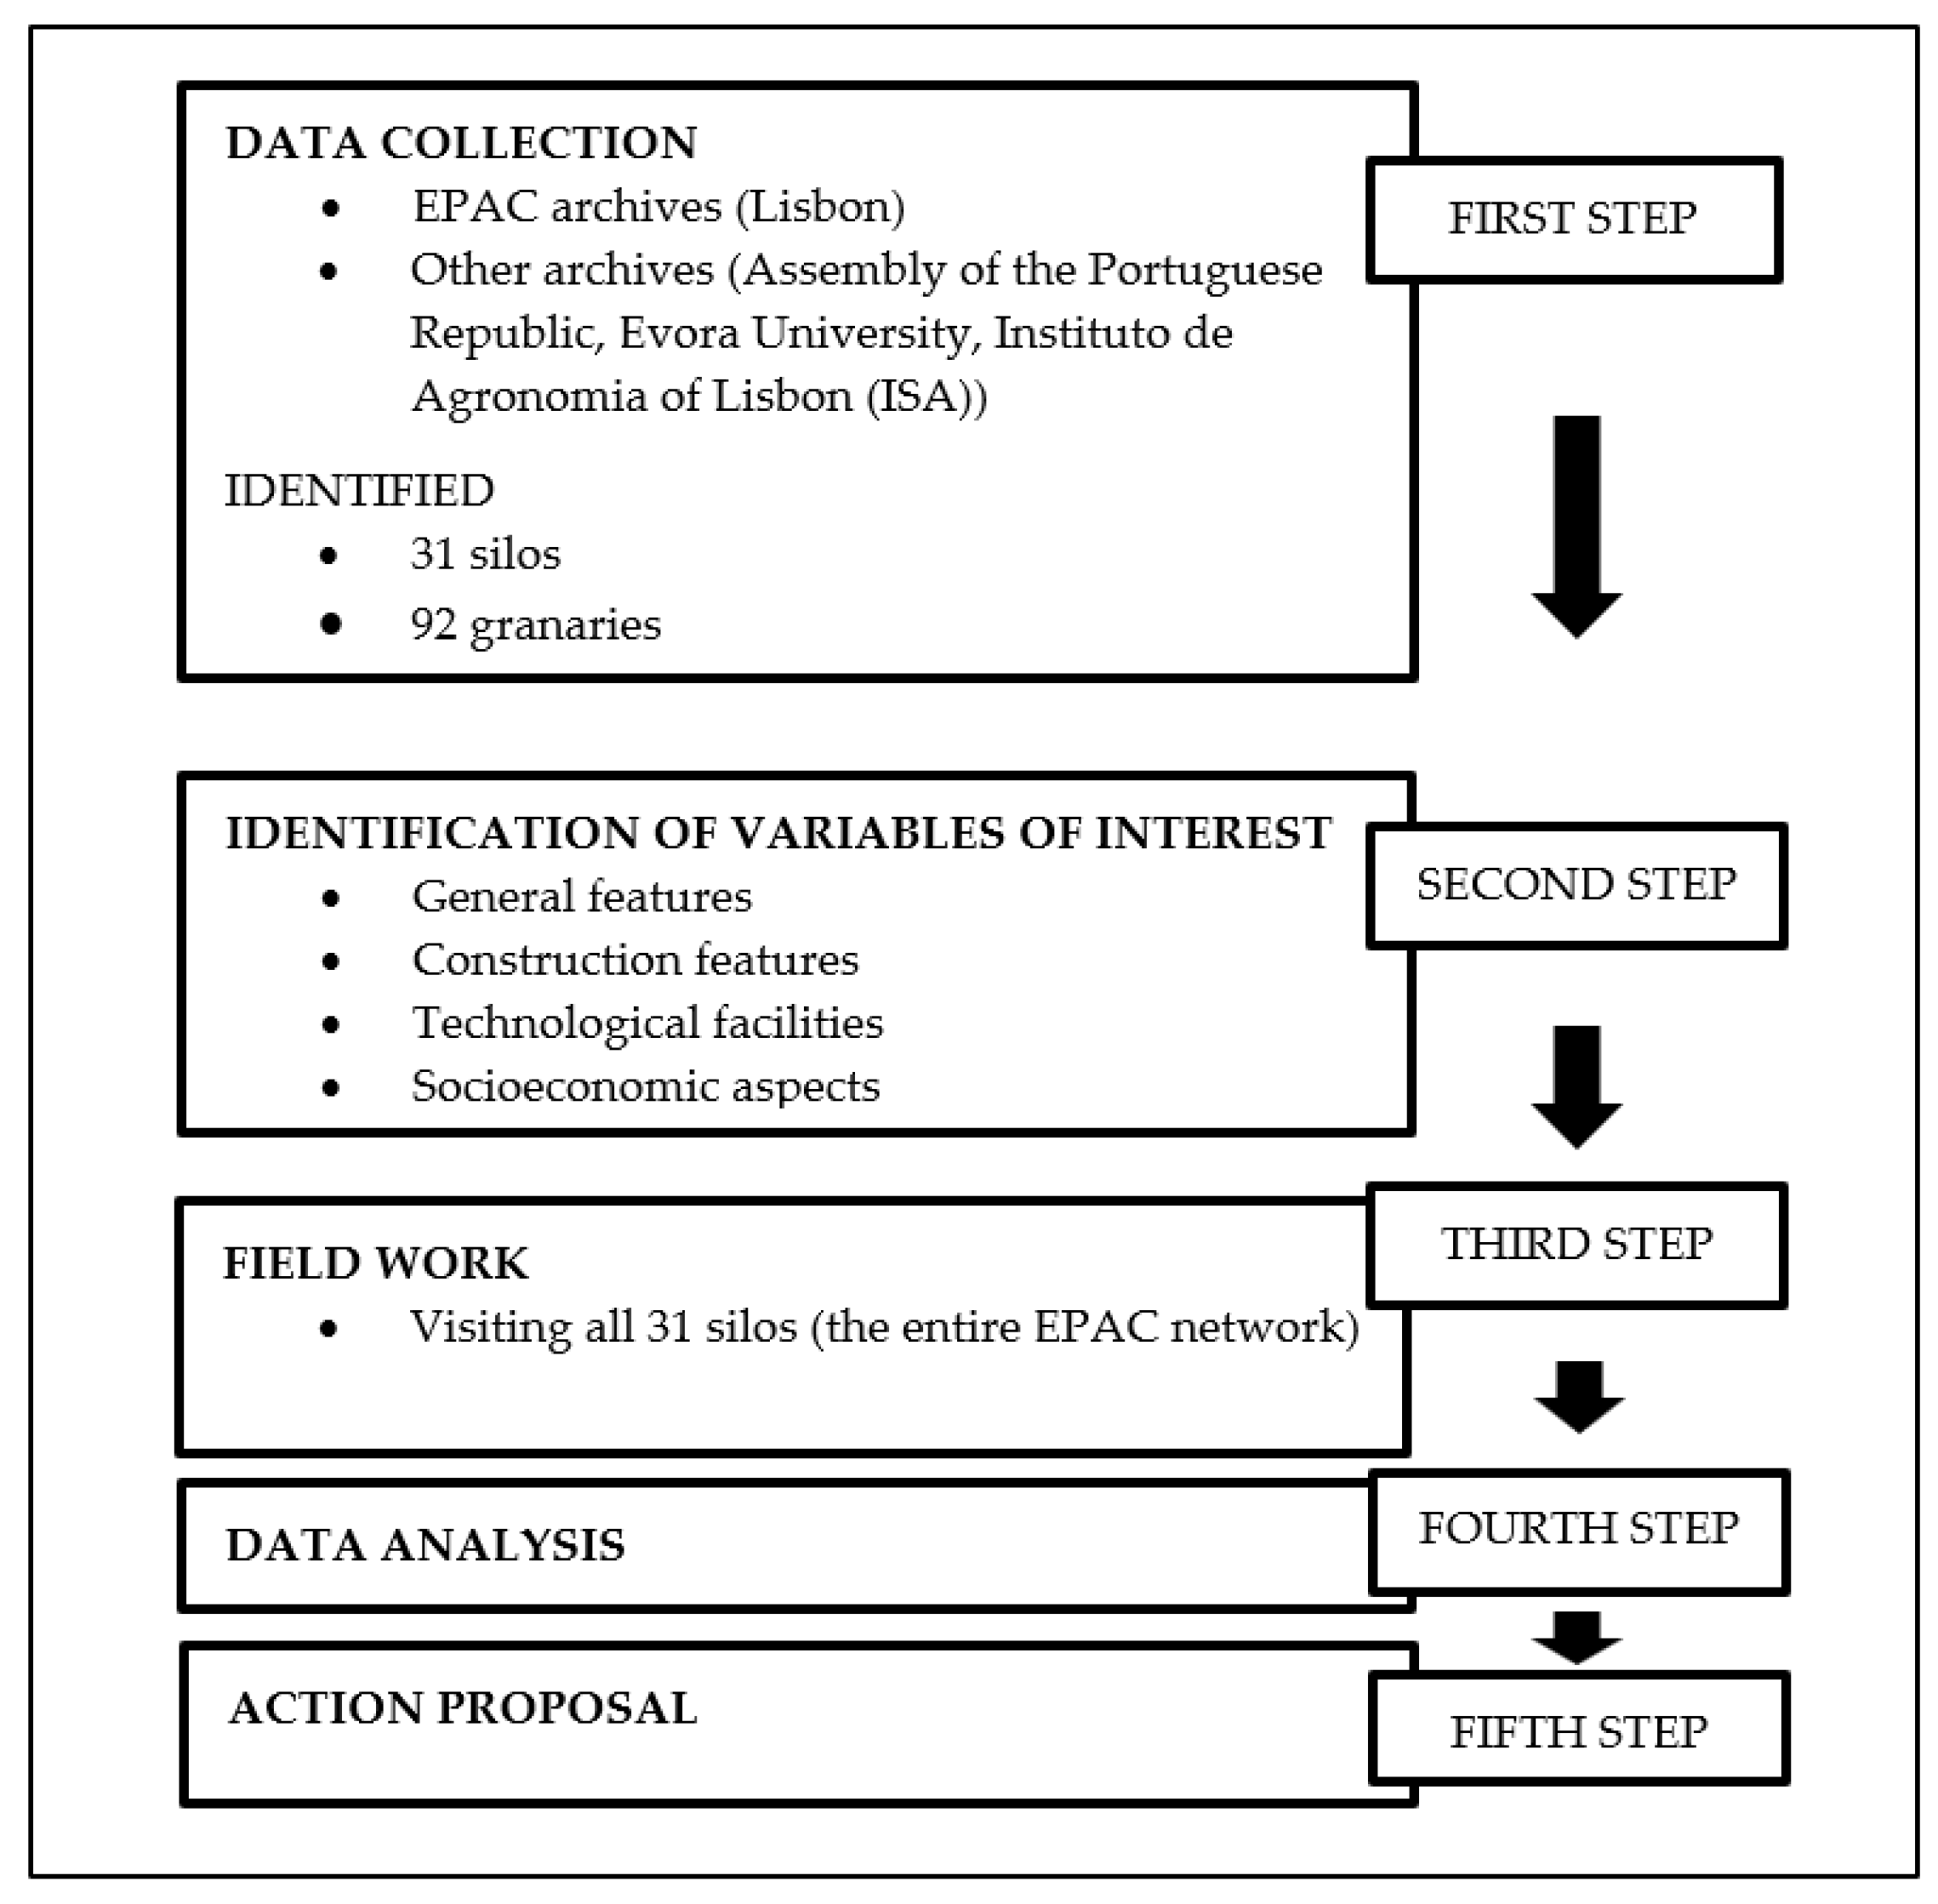
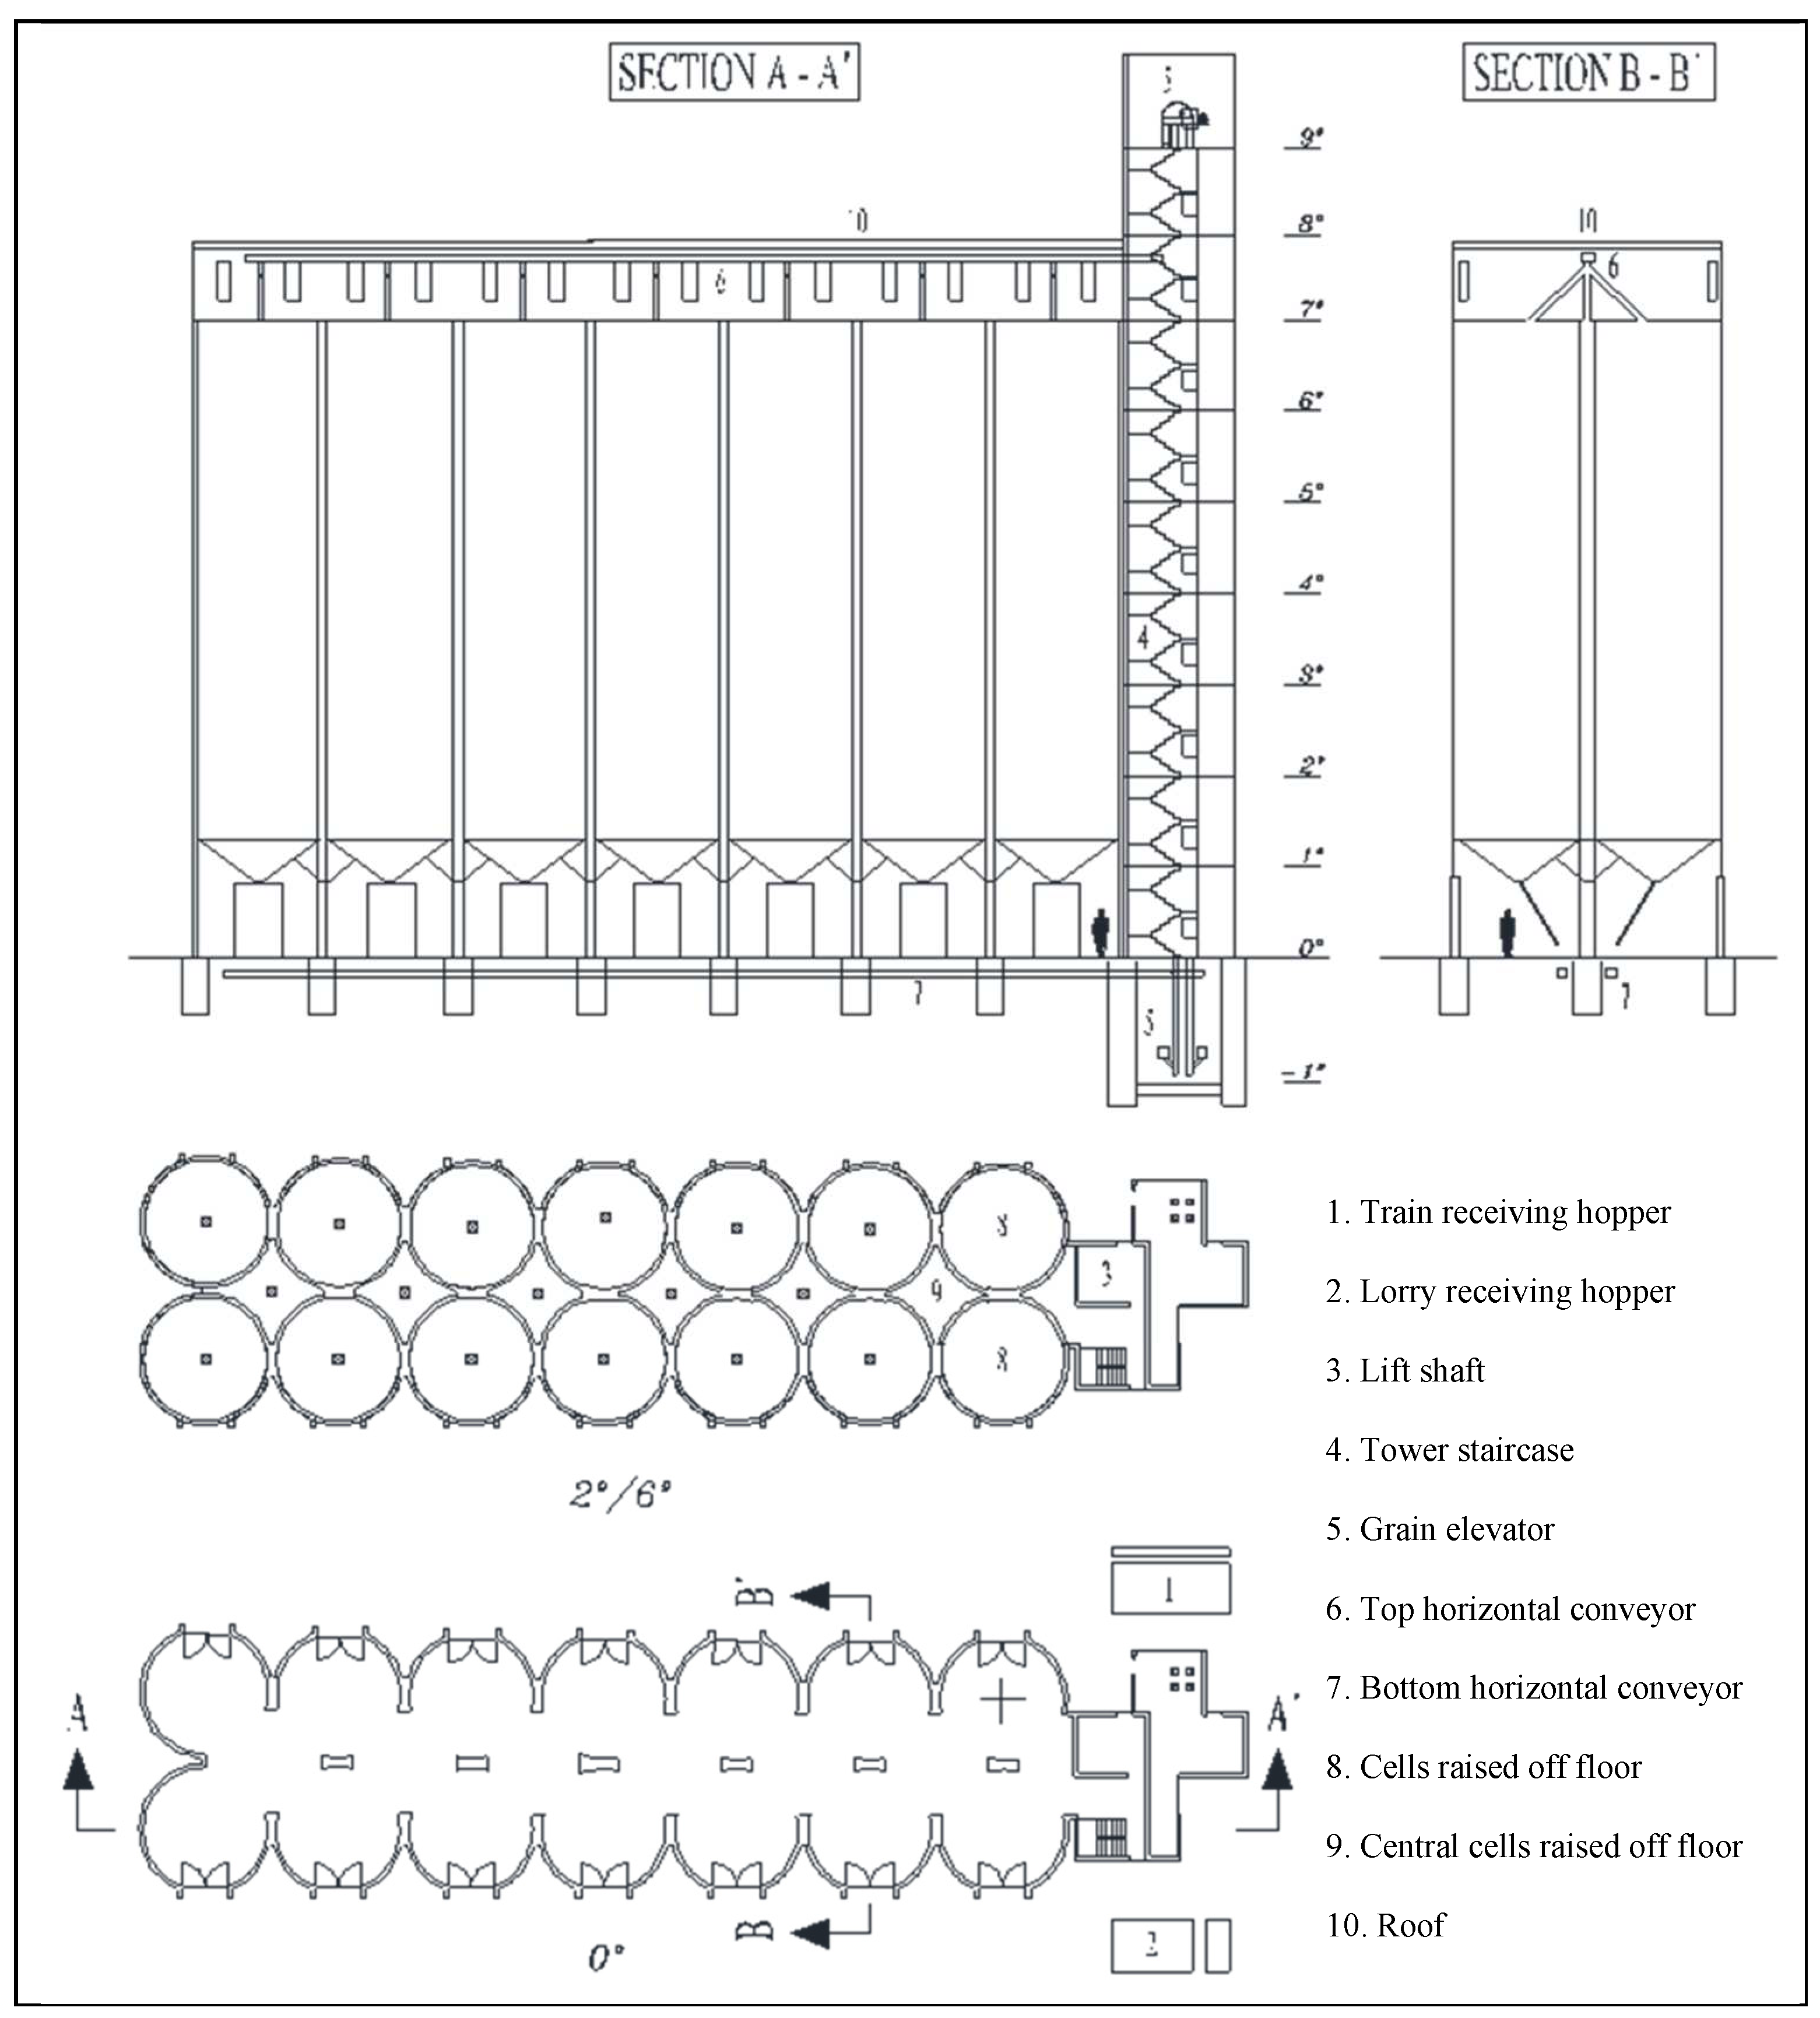

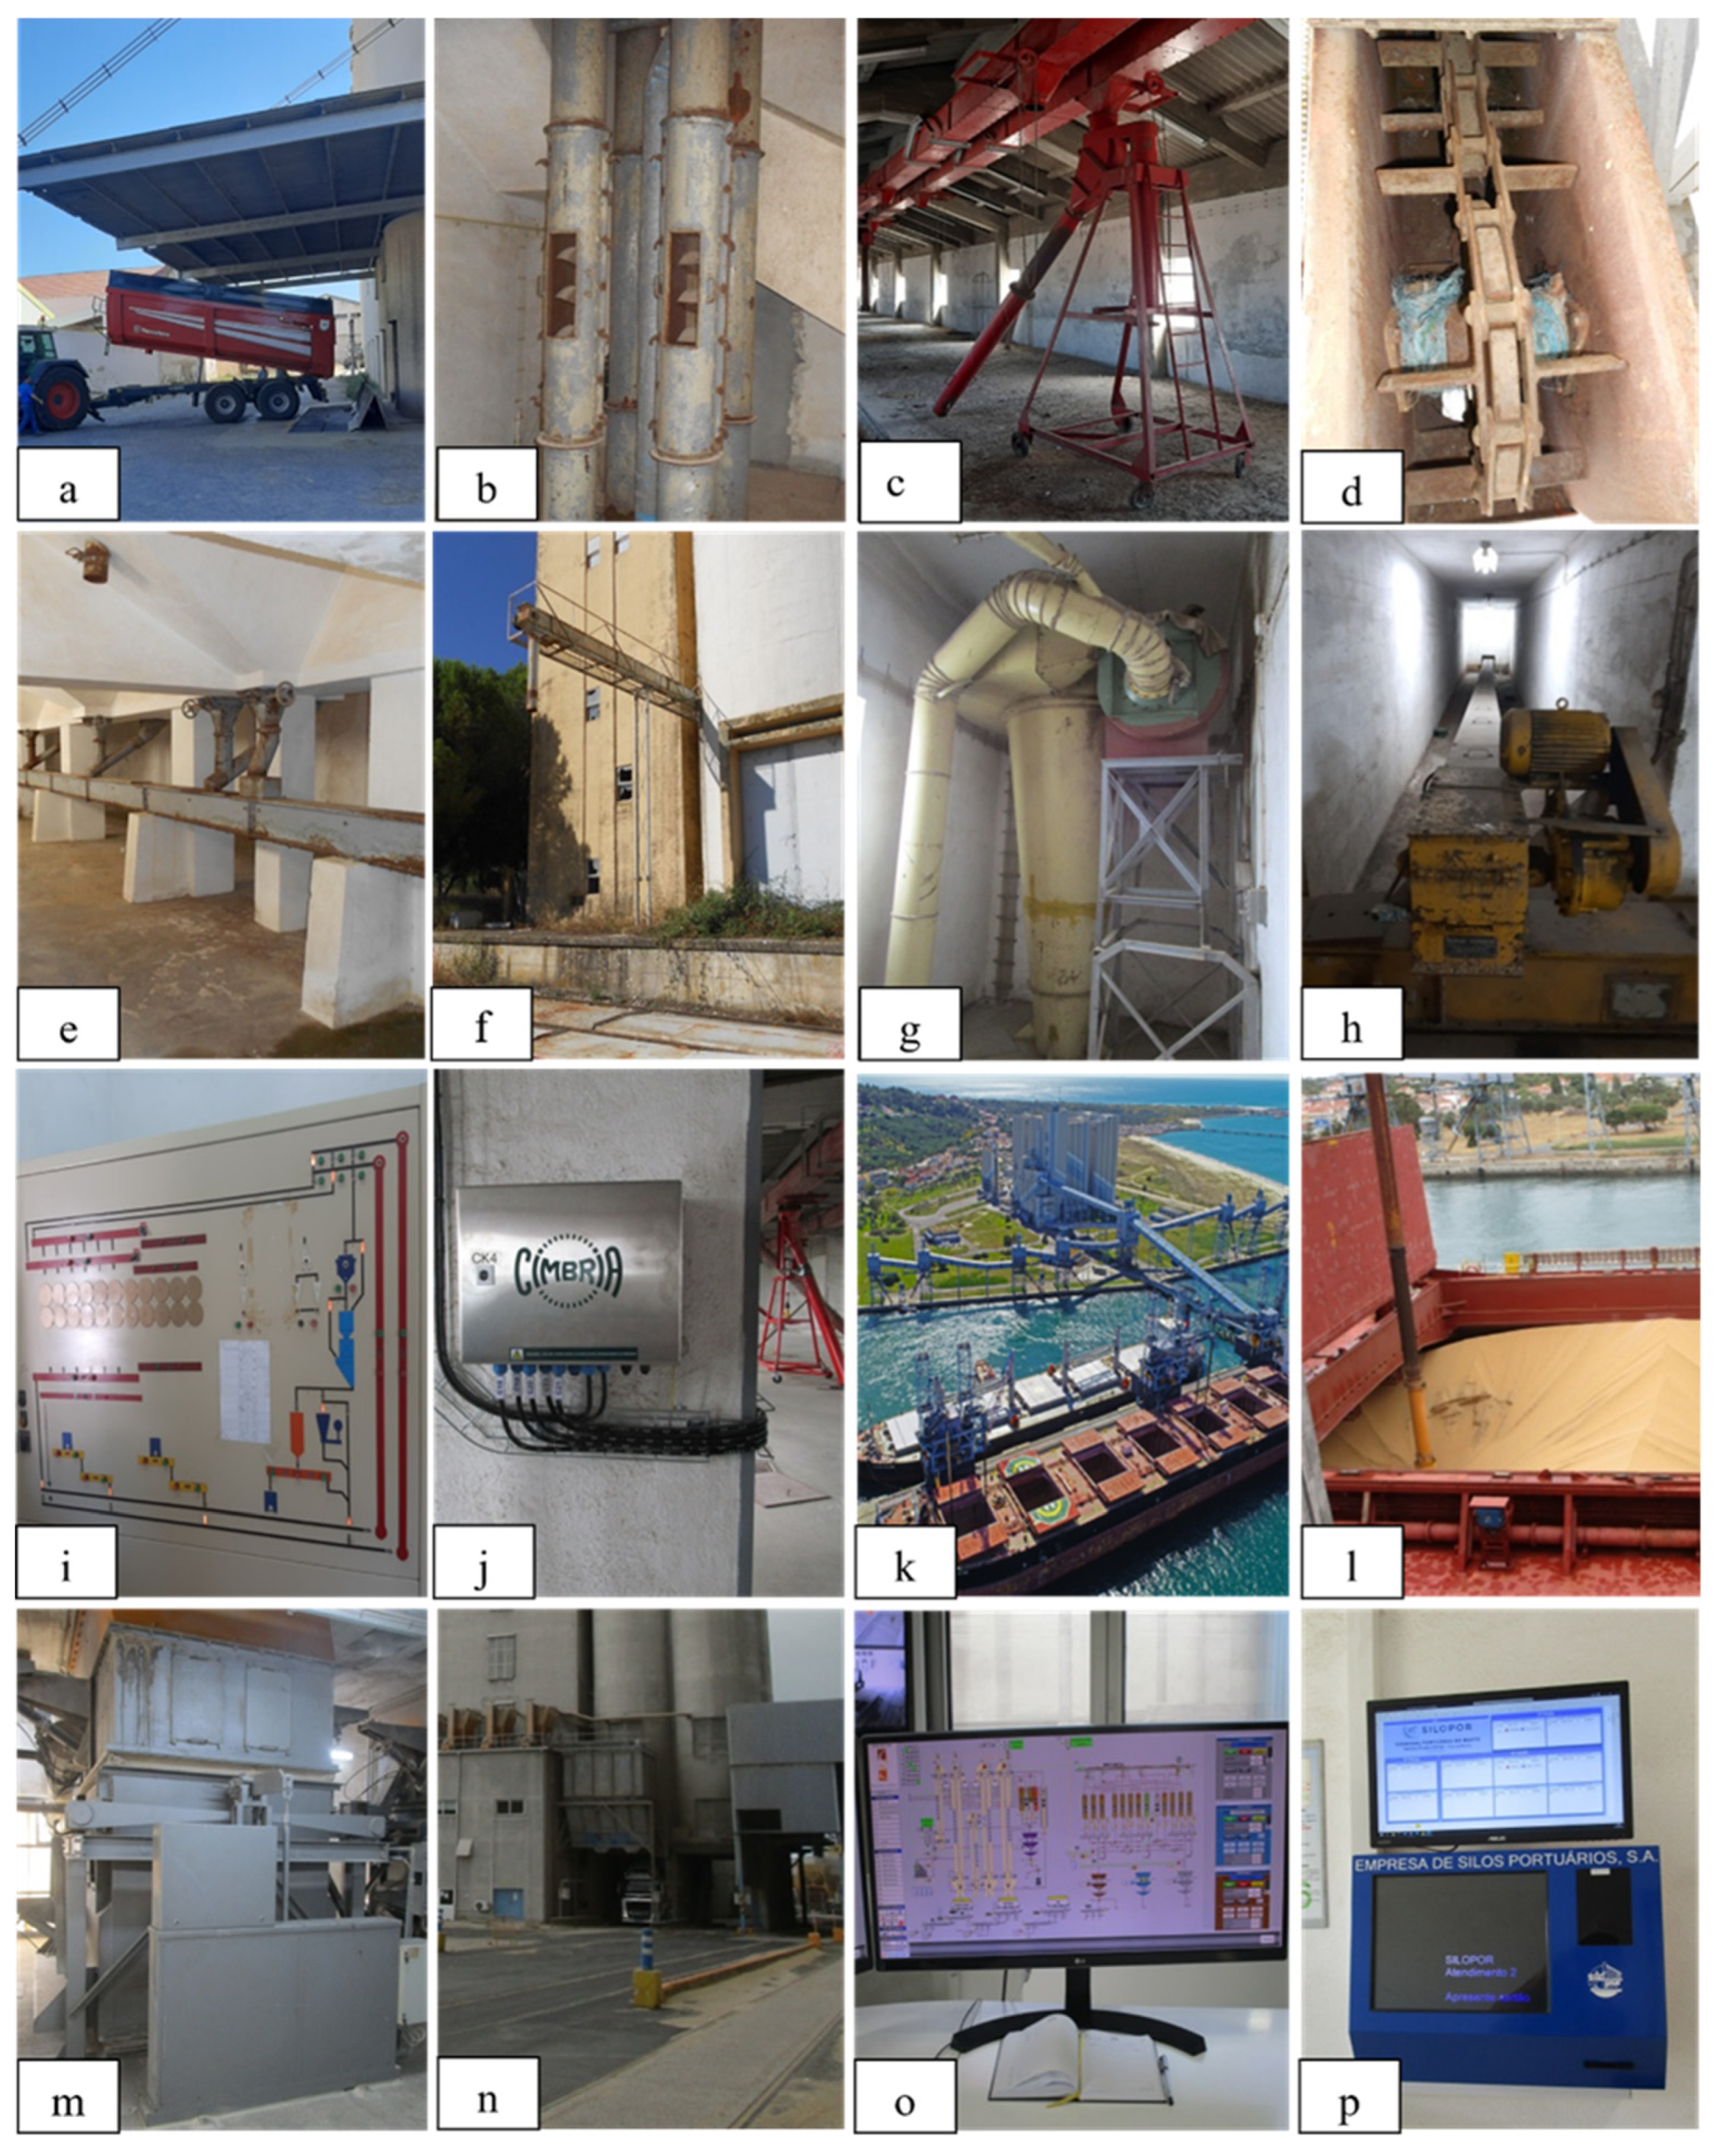
| Categories | Variables of interest |
|---|---|
| General features | Region |
| District Town | |
| Geolocation | |
| Year when built Ownership (state owned; leased to cooperative, institute, or private company; owned by private company or municipality) Use State of conservation | |
| Construction features | Category |
| Storage capacity (t) | |
| Height (m) Ground plan | |
| Roof shape | |
| Tower position | |
| Number of storage cells Number of rows of cells Number of rows of internal cells or intercellular spaces Cell shape Cell dimensions Façade types (straight or semicircular type I, II, or III) Cell construction material | |
| Technological facilities | Receiving machinery capacity (t/h) Number of elevators Number of upper-storey horizontal conveyors Number of lower-storey horizontal conveyors Existence of firefighting system Existence of lift Existence of temperature sensors Existence of railway |
| Lorry weighbridge (t) | |
| Railway weighbridge (t) | |
| Socioeconomic aspects | Population Demographic patterns Yearly municipal budget (€) Economic activity Land communications |
| Distances to larger urban centres (km) |
| Proposed by Mayer (1938) | EPAC network | |||||
|---|---|---|---|---|---|---|
| Zone | Town | Silo type | Capacity (t x 1000) |
Region | Town | Capacity (t x 1000) |
| 1 | Beja | Auxiliary | 2.0 | Alentejo | Inside Beja | 15.0 |
| 1 | Casa Branca | Central | 16.0 | Alentejo | Outside Beja | 26.5 |
| 1 | Ermidas | Auxiliary | 1.4 | Alentejo | Alter do Chão | 8.0 |
| 1 | Estremoz | Auxiliary | 2.0 | Alentejo | Estremoz | 16.0 |
| 1 | Evora | Auxiliary | 2.0 | Alentejo | Evora | 23.0 |
| 1 | Faro | Auxiliary | 2.0 | Alentejo | Fronteira | 16.0 |
| 1 | Lagos | Granary-silo | 2.5 | Alentejo | Vila Viçosa | 2.3 |
| 1 | Sta. Vitoria | Granary-silo | 2.0 | Alentejo | Pavia | 18.0 |
| 1 | Reguengos | Granary-silo | 2.5 | Alentejo | Reguengos de Monsaraz | 35.0 |
| 1 | Moura | Granary-silo | 2.0 | Alentejo | Moura | 10.0 |
| 1 | Serpa | Granary-silo | 3.0 | Alentejo | Serpa | 19.0 |
| 1 | Mértola | Granary-silo | 2.0 | Alentejo | Mértola | 4.5 |
| 1 | Baleizao | Granary-silo | 2.0 | Alentejo | Portalegre | 10.0 |
| 1 | Vidigueira | Granary-silo | 2.0 | Alentejo | Vila de Boím | 4.0 |
| 1 | Ferreira do Alentejo | Granary-silo | 2.0 | Alentejo | Ferreira do Alentejo | 23.5 |
| 1 | Aljustrel | Granary-silo | 2.0 | Alentejo | Aljustrel | 14.5 |
| 1 | Pias | Granary-silo | 2.5 | Alentejo | Elvas | 15.0 |
| 2 | Elvas | Auxiliary | 1.4 | Alentejo | Cuba | 23.5 |
| 2 | Crato | Auxiliary | 2.0 | Centre | Alcains | 10.0 |
| 2 | Alcains | Auxiliary | 1.4 | Centre | Vale de Figueria | 24.0 |
| 2 | Coruche | Granary-silo | 2.0 | Centre | Caldas de Rainha | 6.5 |
| 2 | Entrocamiento | Central | 16.0 | Lisbon | Vila Franca de Xira | 6.5 |
| 2 | Vila Franca de Xira | Auxiliary | 3.0 | Lisbon | Beato | 120.0 |
| 3 | Leiria | Auxiliary | 1.2 | Lisbon | Trafaria | 200.0 |
| 3 | Torres Vedrás | Auxiliary | 1.2 | North | Mogadouro | 6.0 |
| 4 | Barreiro | Auxiliary | 2.0 | North | Braganza | 12.0 |
| 4 | Lisbon | Auxiliary | 2.0 | North | Leixões | 100.0 |
| 5 | Pampilhosa | Auxiliary | 1.2 | Madeira | Funchal | 16.0 |
| 6 | Leixões | Auxiliary | 8.0 | Azores | Punta Delgada | 34.0 |
| 8 | Macedo de Cavaleiros | Granary-silo | 2.0 | Azores | Angra do Heroismo | 21.0 |
| Algarve | Santa Catarina da Fonte do Bispo | 1.3 | ||||
| Total | 30 silos | 92.8 | 31 silos | Total | 841.1 | |
| Category | Total | Min. | Max. | Mean | Silo distribution in percentages |
|---|---|---|---|---|---|
| Region | 7 | 58.1% Alentejo; 9.7% Lisbon; 9.7% Centre; 9.7% North; 6.5% Azores; 3.2% Madeira; 3.2% Algarve | |||
| District | 25.8% Beja; 16.1% Evora; 16.1% Portalegre; 6.5% Lisbon; 6.5% Braganza; remaining districts each contain 3.2% of the silos in the network | ||||
| Town | 30 | ||||
| Year when built | 1938 | 1986 | 1970 | ||
| Year when expanded | 1962 | 1985 | 1977 | ||
| Ownership | 36.7% leased to cooperatives; 33.3% state owned; 13.3% leased to private companies, 10.0% owned by private companies; 3.3% owned by municipalities; 3.3% leased to institutes | ||||
| Use | 51.6% grain store; 38.7% disused; 9.7% reused | ||||
| State of conservation | 51.6% good condition, 33.3% fair condition, 9.6% unusable, 6.5% demolished | ||||
| Category | 3 | ||||
| Capacity (t x 103) | 2,300 | 200,000 | 27,132 | ||
| Height (m) | 26 | 70 | 43.2 | ||
| Ground plan | 96.7% square; 3.3% L-shaped | ||||
| Roof shape | 53.4% flat roof; 40.0% gable roof; 3.3% flat and gable roof; 3.3% vaulted roof | ||||
| Tower position | 83.4% front tower; 6.6% corner tower; 6.6% interior tower; 3.4% side tower | ||||
| No. storage cells | 11 | 157 | 36 | ||
| No. rows of cells | 2 | 4 | 2.4 | ||
| No. rows of internal cells or intercellular spaces | 1 | 3 | 1.5 | ||
| Cell shape | 93.3% circular; 6.7% square | ||||
| Cell dimensions | 2 | 13 | |||
| Façade types | 6.7% straight; 16.7% semicircular I; 53.3% semicircular II; 23.3% semicircular III | ||||
| Construction material | 93.3% reinforced concrete; 6.7% reinforced brick | ||||
| Receiving machinery capacity (t/h) | 50 | 3,000 | 195.6 | ||
| No. elevators | 2 | 14 | 3.2 | ||
| No. upper-storey horizontal conveyors | 1 | 10 | 2.6 | ||
| No. lower-storey horizontal conveyors | 1 | 9 | 2 | ||
| Firefighting system | 53.3% yes; 46.7% no | ||||
| Lift | 85.7% yes; 14.3% no | ||||
| Temperature sensors | 86.6% no; 13.3% yes | ||||
| Railway | 56.7% yes; 43.3% no | ||||
| Lorry weighbridge (t) | 30 | 100 | 66.4 | ||
| Railway weighbridge (t) | 200 | 200 | 200 |
Disclaimer/Publisher’s Note: The statements, opinions and data contained in all publications are solely those of the individual author(s) and contributor(s) and not of MDPI and/or the editor(s). MDPI and/or the editor(s) disclaim responsibility for any injury to people or property resulting from any ideas, methods, instructions or products referred to in the content. |
© 2024 by the authors. Licensee MDPI, Basel, Switzerland. This article is an open access article distributed under the terms and conditions of the Creative Commons Attribution (CC BY) license (http://creativecommons.org/licenses/by/4.0/).


