1. Introduction
Air pollution is considered as a major environmental risk to human health on a global scale [
1], while atmospheric pollutants can harm ecosystems and other elements of the natural environment [
2]. In Europe, in the recent decades, urban air pollutant concentrations have been declining, but PM10 and PM2.5 persist at levels close to established limit values, although the pandemic led to significant but temporary reduction of emissions [
3,
4]. In others parts of the globe though, as in China, India and some parts of Africa, air pollution levels remain fearfully high [
5].
In the last decade, aviation has been a major contributor in global emissions, with 30 to 40 million flights each year [
6]. Air pollutant emissions occur during the whole course of a flight, i.e., during take-off, cruise and landing. Although aircraft cruise emissions are about 4 times larger than the near ground ones, thus contributing significantly to total Greenhouse Gas (GHGs) emissions; in local scale, i.e., in urban areas in the vicinity of airports, take-off and landing emissions are more condensed and direct. For that reason, air quality around airports is an issue of particular concern.
The dispersion of air pollutants around the airports affects different environmental compartments, such as water, soil and biota, however, the most significant potential impact is the risk to public health. A review article by the US National Academies of Sciences, Engineering and Medicine [
7] shows that this impact depends on multiple parameters, including the specifics of the air traffic daily variation, the aircraft fleet and ground activities, as well as local particularities such as the orography and meteorology of the area. Several modern studies focus on the pollutants considered as the most dangerous for human health, namely fine particles, including black carbon particles [
8], and dangerous gases such as formaldehyde and tropospheric ozone. At short distances, concentrations of the main air pollutants from aviation, i.e., CO, NOx, PM10, and SOx, are found to be distinctly higher than the background, but at more distant residential areas levels tend to fall close to background [
7]. Because of this, it is difficult to derive quantitative conclusions on the exact effect of airport air pollutant emissions on public health, which nevertheless remain rather important.
Considering the significance of this issue, the assessment of air pollution is crucial in evaluating the environmental and public health impacts due to airports operation in the neighboring urban areas. Therefore, understanding the factors that determine the reliability of these assessments is of paramount importance.
There are two general categories of methods for assessing air pollution: those based on measurements and those based on computational approaches.
Measurement-based methods rely on performing field measurements of concentrations, using either fixed or mobile equipment. Most of the big cities, such as London, Paris, Rome and Athens, have installed networks of air quality monitoring stations since the late 80s. Measurement-based methods excel in accuracy but lack spatial coverage, and they cannot point out the link between measured concentrations and various emission sources, such as road traffic, heating, industry etc.
Computational methods rely on a variety of simulation systems that calculate and interconnect the emissions from each source with the final concentration occurred. In recent years, these methods became popular due to the abundance of computational power and, at the same time, the necessity for large-scale air quality assessments. Computational methods contain uncertainties related to internal assumptions and simplifications of the models used, as well as to lack of input data details. Despite these uncertainties, the use of computational methods is clearly encouraged by current European legislation.
A recent application of the computational approach to estimate air quality in the vicinity of three major Greek airports, produced detailed results on the emissions and concentrations of air pollutants, helping to form a comprehensive assessment of the impact of each airport on atmospheric environment [
9]. In this work, the calculated concentrations were in good agreement with the measured air pollution levels at the monitoring stations of the airport network.
Computational and measurement-based methods for studying air pollution, can be combined, as it was happened in the 14 recently privatized airports in Greece. The environmental terms of these airports (namely Aktio, Chania, Corfu, Kavala, Kefalonia, Kos, Mykonos, Mytilene, Rhodes, Samos, Santorini, Skiathos, Thessaloniki and Zakynthos), altogether serving more than 200.000 flights per year [
10], require the application of a hybrid environmental monitoring program based on modelling results and a few targeted field measurements. In line with these requirements, an acknowledged model, such as the Emissions and Dispersion Modelling System (EDMS), is regularly fed with detailed data of aircraft movements and local meteorology and calculates air pollution levels in the whole extend of the affected area. The results are then validated using sparse, sample measurements.
Uncertainties in input data, combined with the inherent complexity of most models, make it essential to examine the impact of variations in the initial input data on the model’s results. In particular, it is important to assess the sensitivity of the results to changes in input parameters, especially meteorological factors. Moreover, when computational air pollution assessment methods are applied at airports, either during the design and licensing phase or during their operation, the sensitivity of the results to the input parameters is important for interpreting and assessing modelling results and making sound decisions.
The examination of how model results respond to fluctuations in input parameters or internal coefficients has been the subject of numerous studies. For example, the sensitivity of large-scale, computing-intensive models that include analytical chemical and transport calculations and assumptions, such as the Unified Danish Eulerian Model (UNI-DEM), has been extensively studied via multiple theoretical approaches [
11,
12], including the Monte Carlo technique, aiming at revealing the input variables that influence at most the model results. Another large-scale policy steering model has been recently studied to determine the sensitivity of the results on input uncertainties [
13]. In the past, the sensitivity of a photochemical pollution model has been studied [
14], focusing on the uncertainties of the coefficients that rule the internal description of the chemical reactions, as well as on emissions’ uncertainties. In odour impact assessment, the dispersion model and its uncertainties, which are not well understood, have been studied recently via a large number of impact maps [
15]. Uncertainties related to the source of emission, to the meteorological inputs and to the computational methods affect significantly the dispersion predictions of the early phase of an accidental release of radioactive material, when no measurements are still available [
16]. In other works [
17,
18], different methods for determining the sensitivity of model results are described and tested against the simple approach of varying each input variable while keeping constant all the others (often called “brute force method” or BFM). Finally, the process of evaluating the impact of input parameter variations has been employed in the development of artificial neural network models. This approach intends to predict concentrations based on historical correlations between emissions, meteorological conditions, and field-measured concentrations [
19,
20].
This study adds to the diverse body of research on model uncertainty by generating results for a widely-used air pollution model, such as the EDMS, which can be directly applicable in regulatory or assessment studies. The primary objective is to identify factors with the greatest influence on model results and to quantify their impact. In doing so, we determine and quantify the significance of major input parameters on the model outcomes. These findings offer practical guidance for experts and decision-makers in their pursuit of balanced, evidence-based decisions. Consequently, regulators and environmental scientists will gain a clearer understanding of which parameters have the most substantial effects on model results, which conditions are suitable for evaluating worst-case scenarios, and which input assumptions may lead to under- or overestimation of air pollution levels.
2. Materials and Methods
In an effort to understand how the results of a complicated air pollution modelling system “react” to changes in input parameters, we have performed a series of computational experiments, during which an examined parameter takes different values in each run, while all other parameters remain constant. The examined parameters are the ones that have a physical impact to emissions or concentrations of air pollutants related to airport operations. Namely, those parameters are (i) the time of day, (ii) the speed of wind, (iii) the ambient temperature, (iv) the cloud cover, and (v) the cloud ceiling.
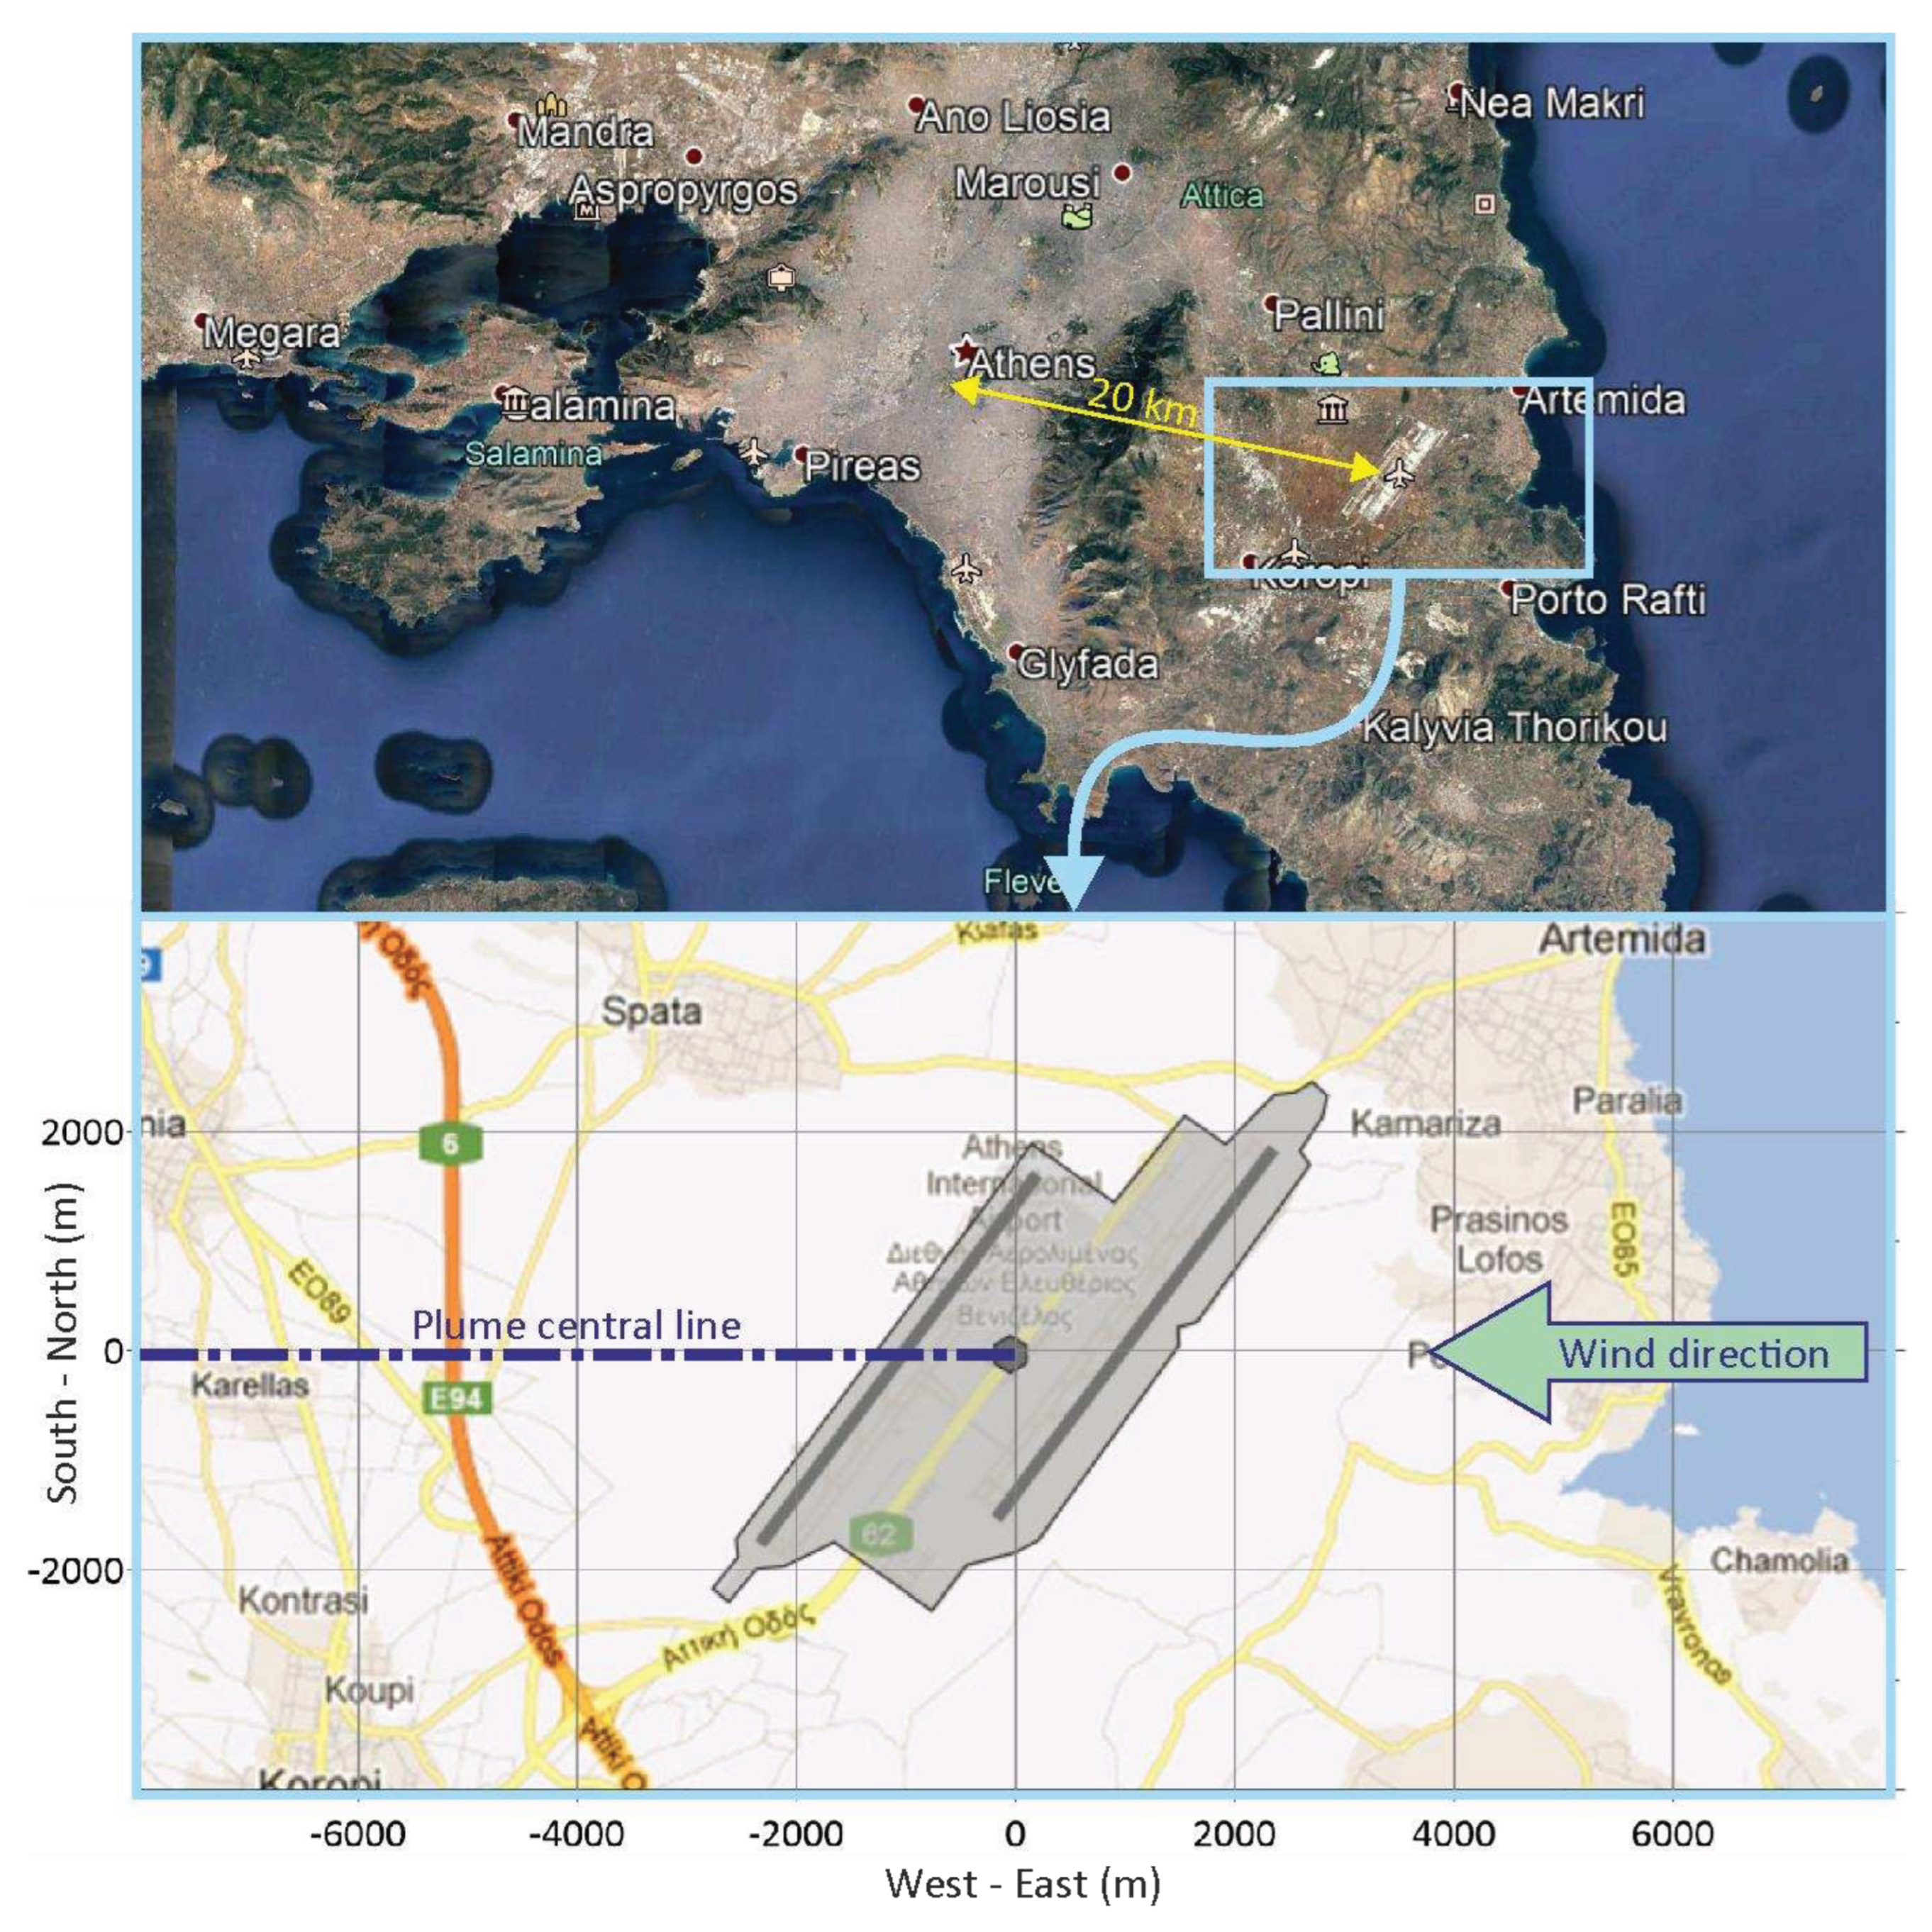
The airport used for our computational experiments is Athens International Airport (AIA). A real airport was chosen, instead of a theoretical one, in an attempt to stay as close as possible to the operational reality of airports and avoid over-simplification. AIA is located about 20 km east of the centre of Athens (the capital city of Greece), in a rather flat area at Mesogaia plain. The key elements of the airport, in relation to aircraft emissions, include two parallel, independent runways of 4 km length each, two main taxiways and several connecting ones, two terminal buildings with a total of 24 aircraft gates and a large apron serving the ground operations of aircraft. The area of the airport is shown in
Figure 1.
In the calculations, constant emission rates (i.e., air traffic) and wind direction were assumed, namely 15 aircraft movements per hour (a number close to AIA’s actual average rate of flights) and eastern wind. An aircraft movement is a “Landing and Take-Off cycle” or LTO, a standardized way to simulate flights served by an airport [
21]. Model runs were performed for a typical winter day. Concentrations are calculated as hourly averages on a 500×500 m grid, consisting of 561 points on the 16×8 km study area. For this setup, a typical run of the model in order to produce 24hours results needed about 20 minutes in a common home/office computer (Intel Core i7-4790, scoring about 216 GFLOPS).
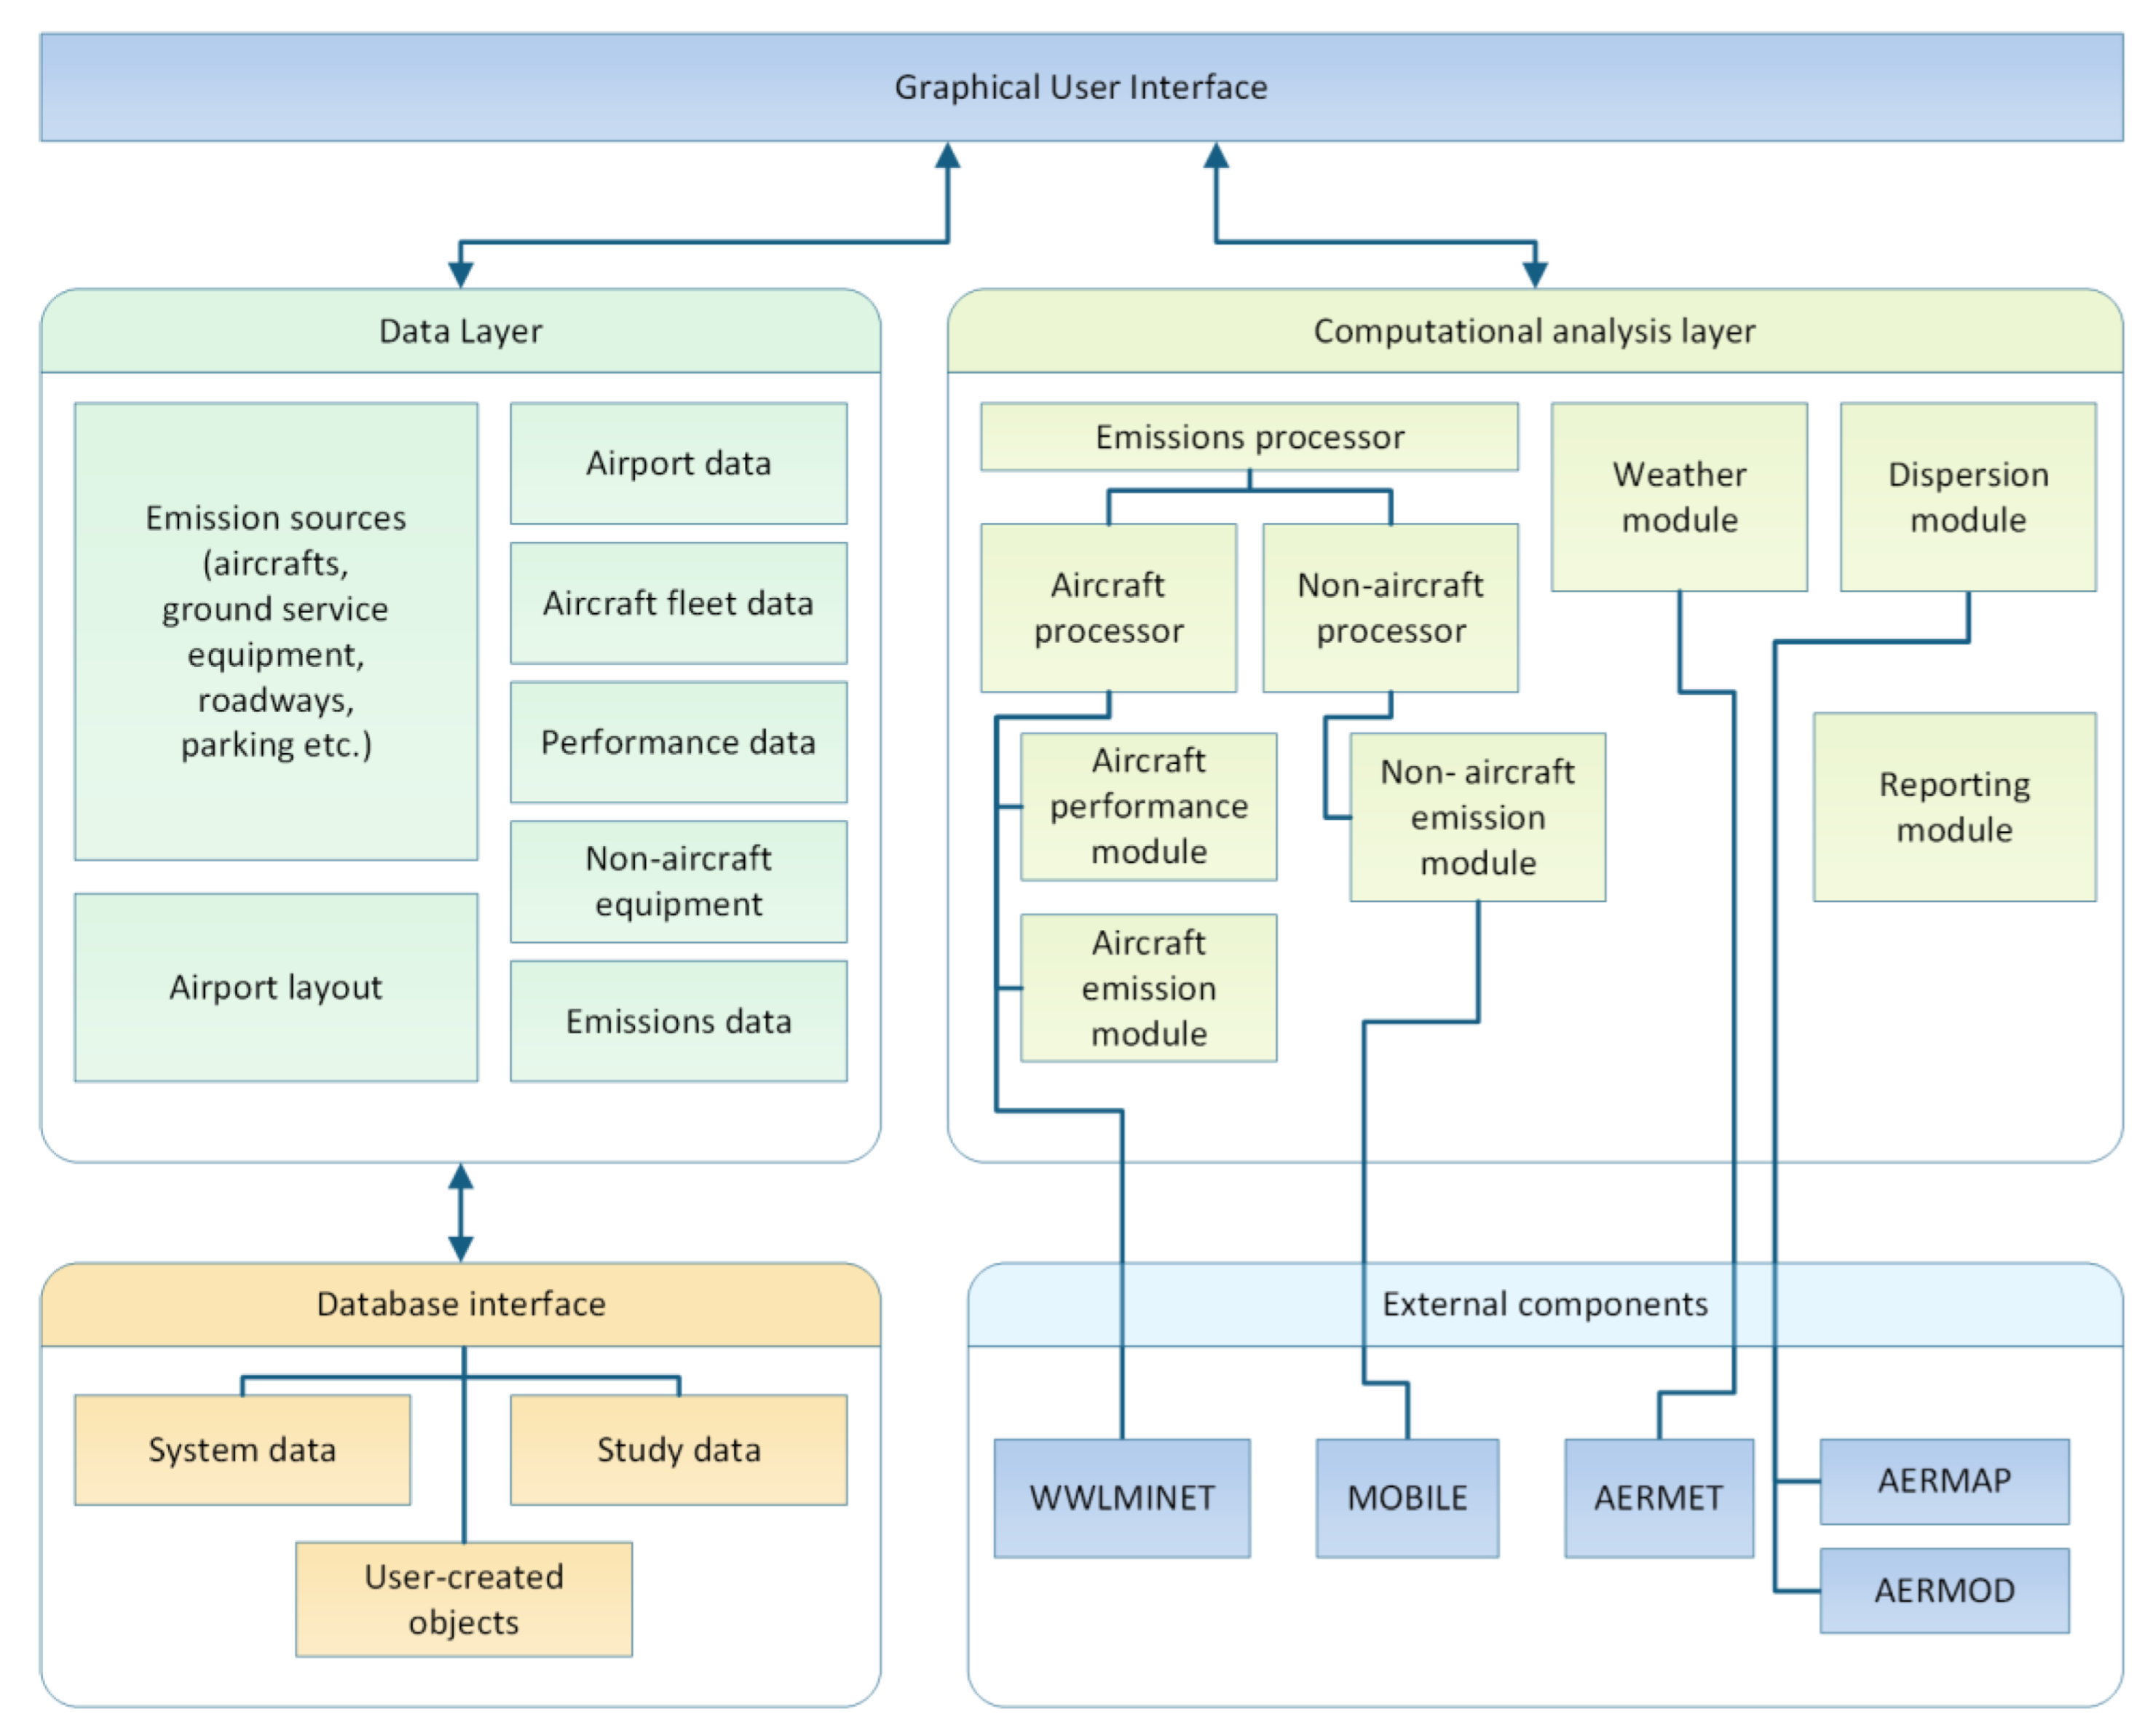
The model used for our calculations is EDMS (“Emissions and Dispersion Modelling System”), the regulatory model proposed by the US EPA for compliance checking of existing or planned airports with air quality limits. EDMS is a modelling system combining emissions and dispersion calculations to assess air quality in the area around airports [
22]. The model generates an air pollutant emission inventory, related to all sources in and around the airport, and simulates air pollutant dispersion in order to assess air pollutant levels in the area of the airport under examination. Emission calculations are carried out by simulating the airport’s activity, based on detailed aircraft data, airport’s layout and scheduling data. Meteorology data, used in dispersion calculations, are produced by the AERMET model [
23], based on weather data from the airport’s location. Dispersion calculations are performed through application of the AERMOD model, coupled with AERMAP. AERMOD is a steady state US EPA recommended dispersion model, developed for short to mid-range (up to 50 km) simulations. In the stable boundary layer, the atmospheric layer adjacent to the ground, within which temperature is stably stratified and the air mass transport is minimum [
24], dispersion follows a Gaussian distribution in both horizontal and vertical axes. Conversely, in the convective boundary layer, the turbulent layer, where stirring and mixing conditions prevail, primarily in the vertical direction, dispersion is Gaussian in the horizontal direction, and bi-Gaussian in the vertical direction. AERMOD is well documented [
25,
26] and tested [
27]. AERMAP is the terrain pre-processor of AERMOD, locating emission sources and concentration receptors on the 3D surface of the study area. The architecture of EDMS, shown in
Figure 2, is typical of modern-day multi-tiered approaches, consisting of several modular components.
EDMS has been used in Europe, Asia and the US to assess air pollutants emissions and concentrations related to airports’ activity [
28,
29,
30,
31,
32,
33] or to compare monitoring and computational results [
34,
35]. Although EDMS has been replaced by the Aviation Environmental Design Tool (AEDT) as of May 2015, the latter has retained the same approach and methodology of EDMS, adding modern user-interface elements including GIS interaction, and mainly integrating air quality with noise assessment [
36]. Nevertheless, EDMS remains still in use in many environmental impact assessment studies throughout Europe and elsewhere, mainly because of its widespread establishment as the standard modelling system of air pollution around airports.
3. Results
3.1. Time of day
The mixing conditions in the atmospheric boundary layer change strongly over the course of the day [
37]. During the day, the soil that has just been warmed by solar radiation, emits heat to the air above it, creating small or larger vortices and favouring dispersion [
38]. During the night, heat emission from the ground is much lower, and when wind speed is low, a stabilized stratification occurs [
39], in which mixing potential is minimal. As a result, when calculating hourly concentrations, the time of day is important, due to this daily cycle of the boundary atmospheric layer.
EDMS takes into account the daily cycle via AERMET module, to calculate the horizontal and vertical temperature and the wind speed as well as other meteorological parameters considered. Moreover, the AERMOD module switches to a bi-Gaussian plume approach in the vertical direction when the convective layer is met, instead of the normal Gaussian plume that is used when the dispersion occurs in the stable atmospheric layer [
25]. So, EDMS incorporates by design the impact of the hour of the day on the concentration results. The sensitivity analysis that follows, aims to display the practical effect of this design and also to identify and examine potential discrepancies (or discontinuities) in the calculated concentrations.
To ensure that solely the time-of-day effect is examined, the following parameters were kept constant: a) ambient temperature 5,2 °C, b) zero cloud cover, c) wind speed 1 m/s. As expected, highest concentrations occur during nighttime, early in the morning and late afternoon, whereas lowest concentrations occur during daytime (
Figure 3).
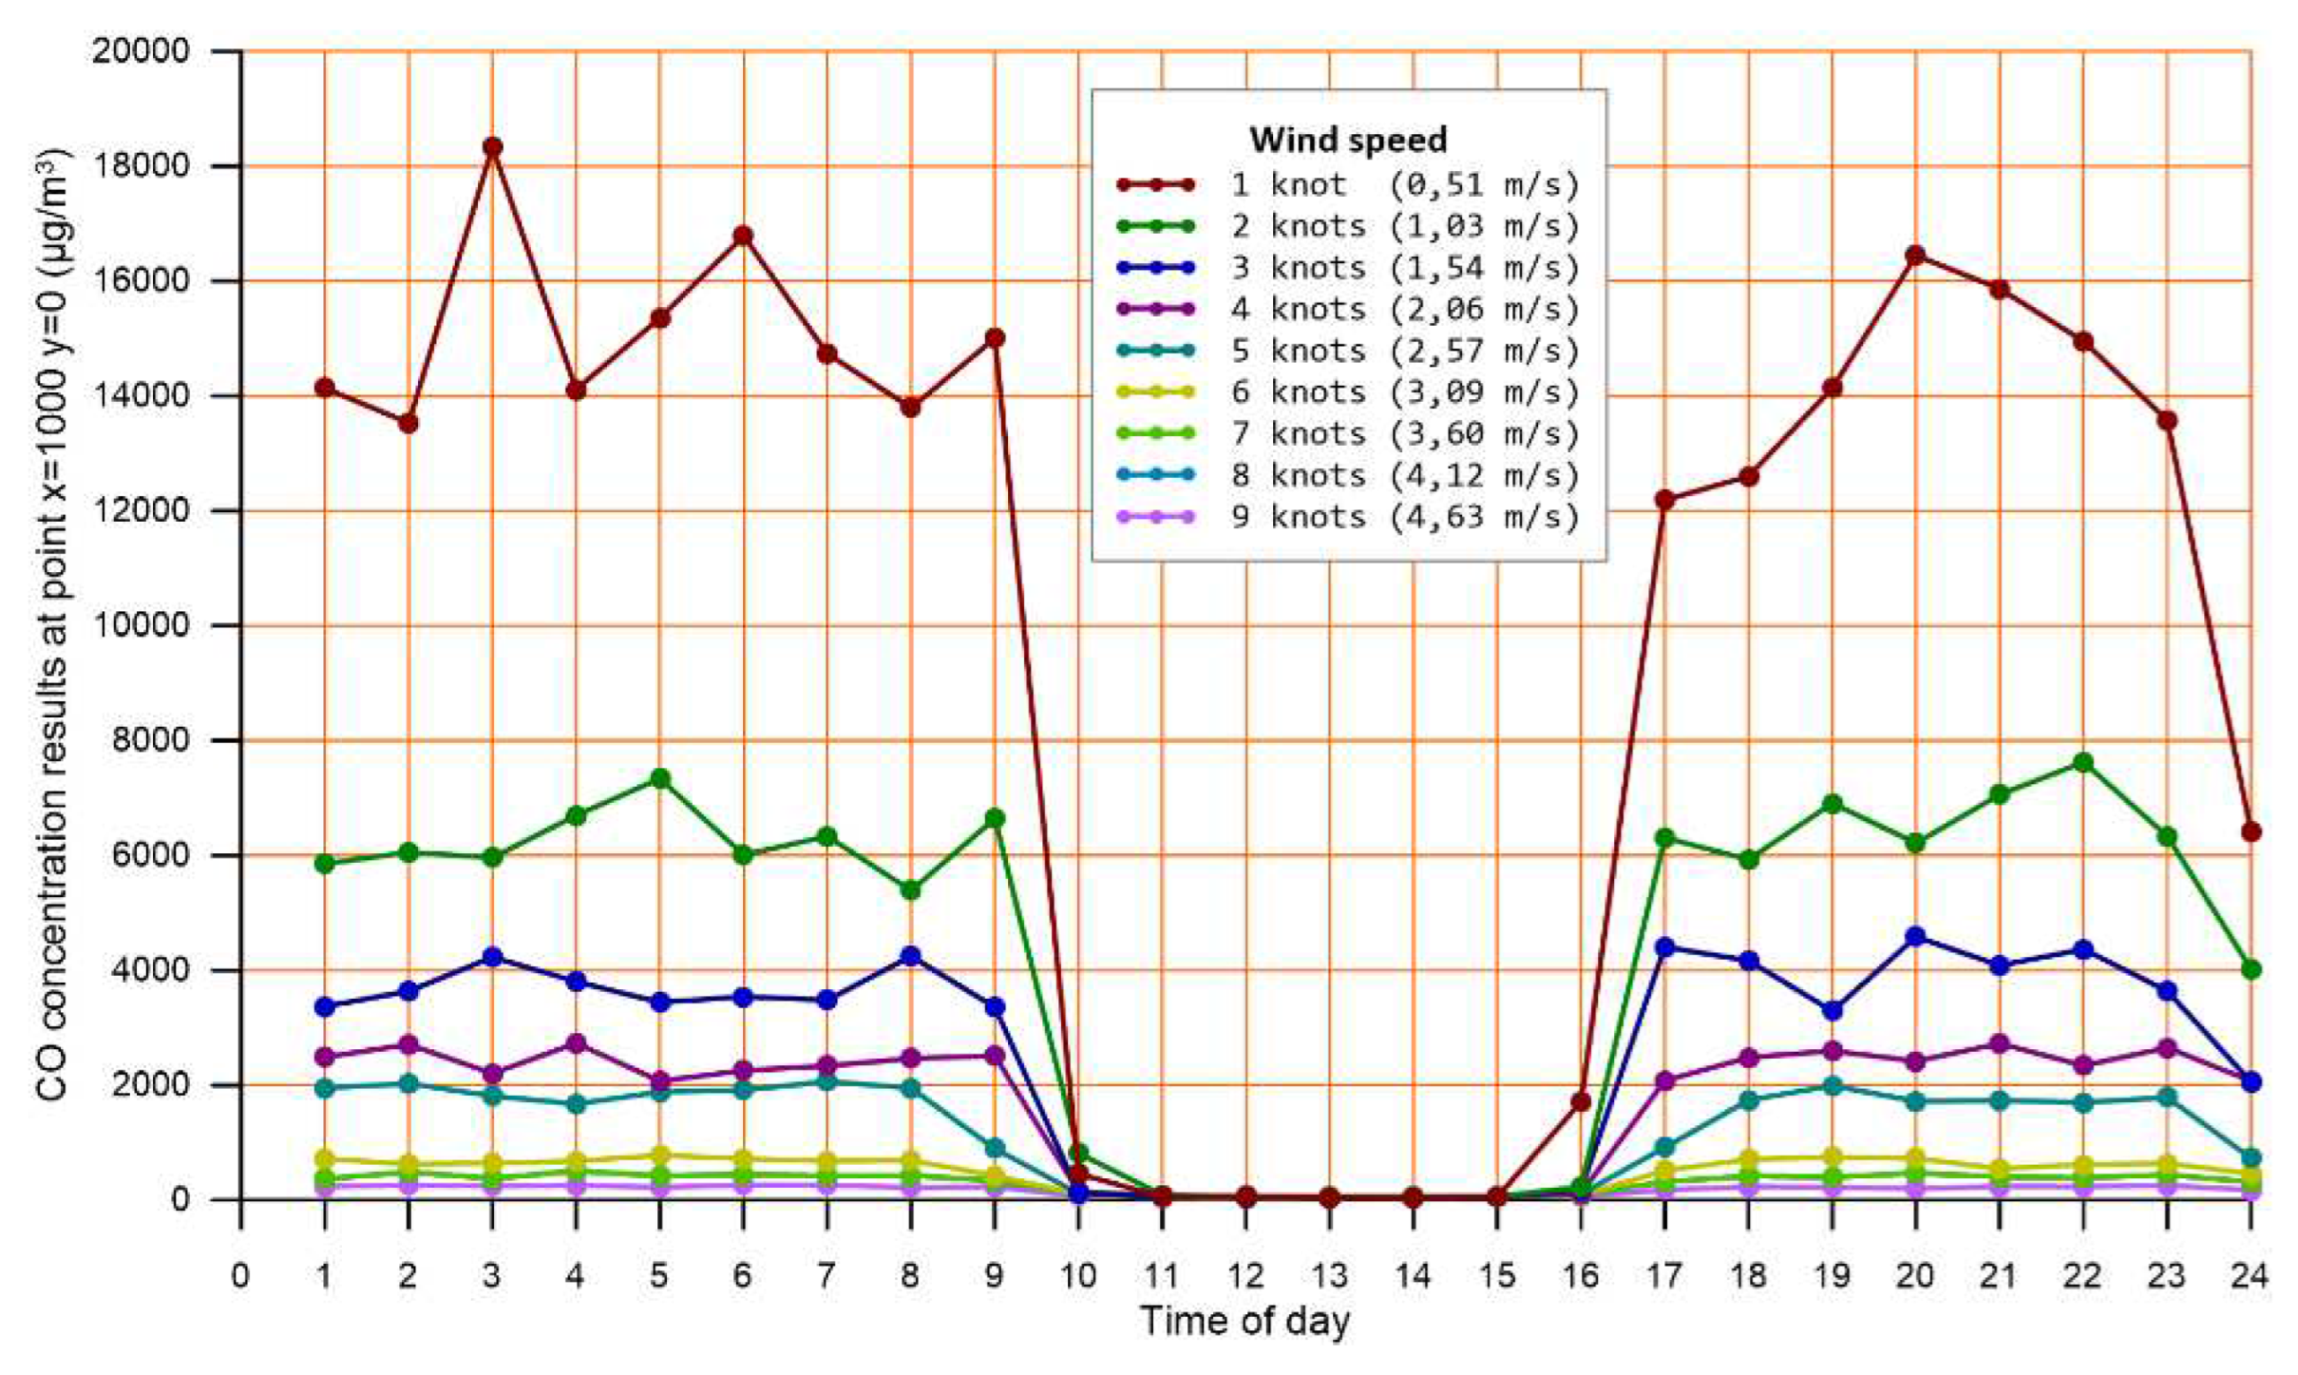
To further examine the sensitivity of concentration results to the hour of the day, the effect of different wind speed scenarios was examined (0.51 to 4.63 m/s). The calculated levels of CO at a point located 1000 m downwind on the plume central line (x=1000, y=0), are displayed in
Figure 4.
The same pattern appears at most of the points downwind the central line, with lower pollutant levels.
This finding shows that the stronger solar radiation, between 10:00 to 16:00, creates a predominating convective layer which enforces air pollutant dispersion mechanisms, despite high emission rates.
3.2. Wind speed
The dispersion caused by wind, which has a convection and a mixing component, has been studied in detail, both physically and computationally [
40,
41,
42]. The modern modelling approach of this mechanism is based on Monin-Obukhov similarity theory [
43,
44,
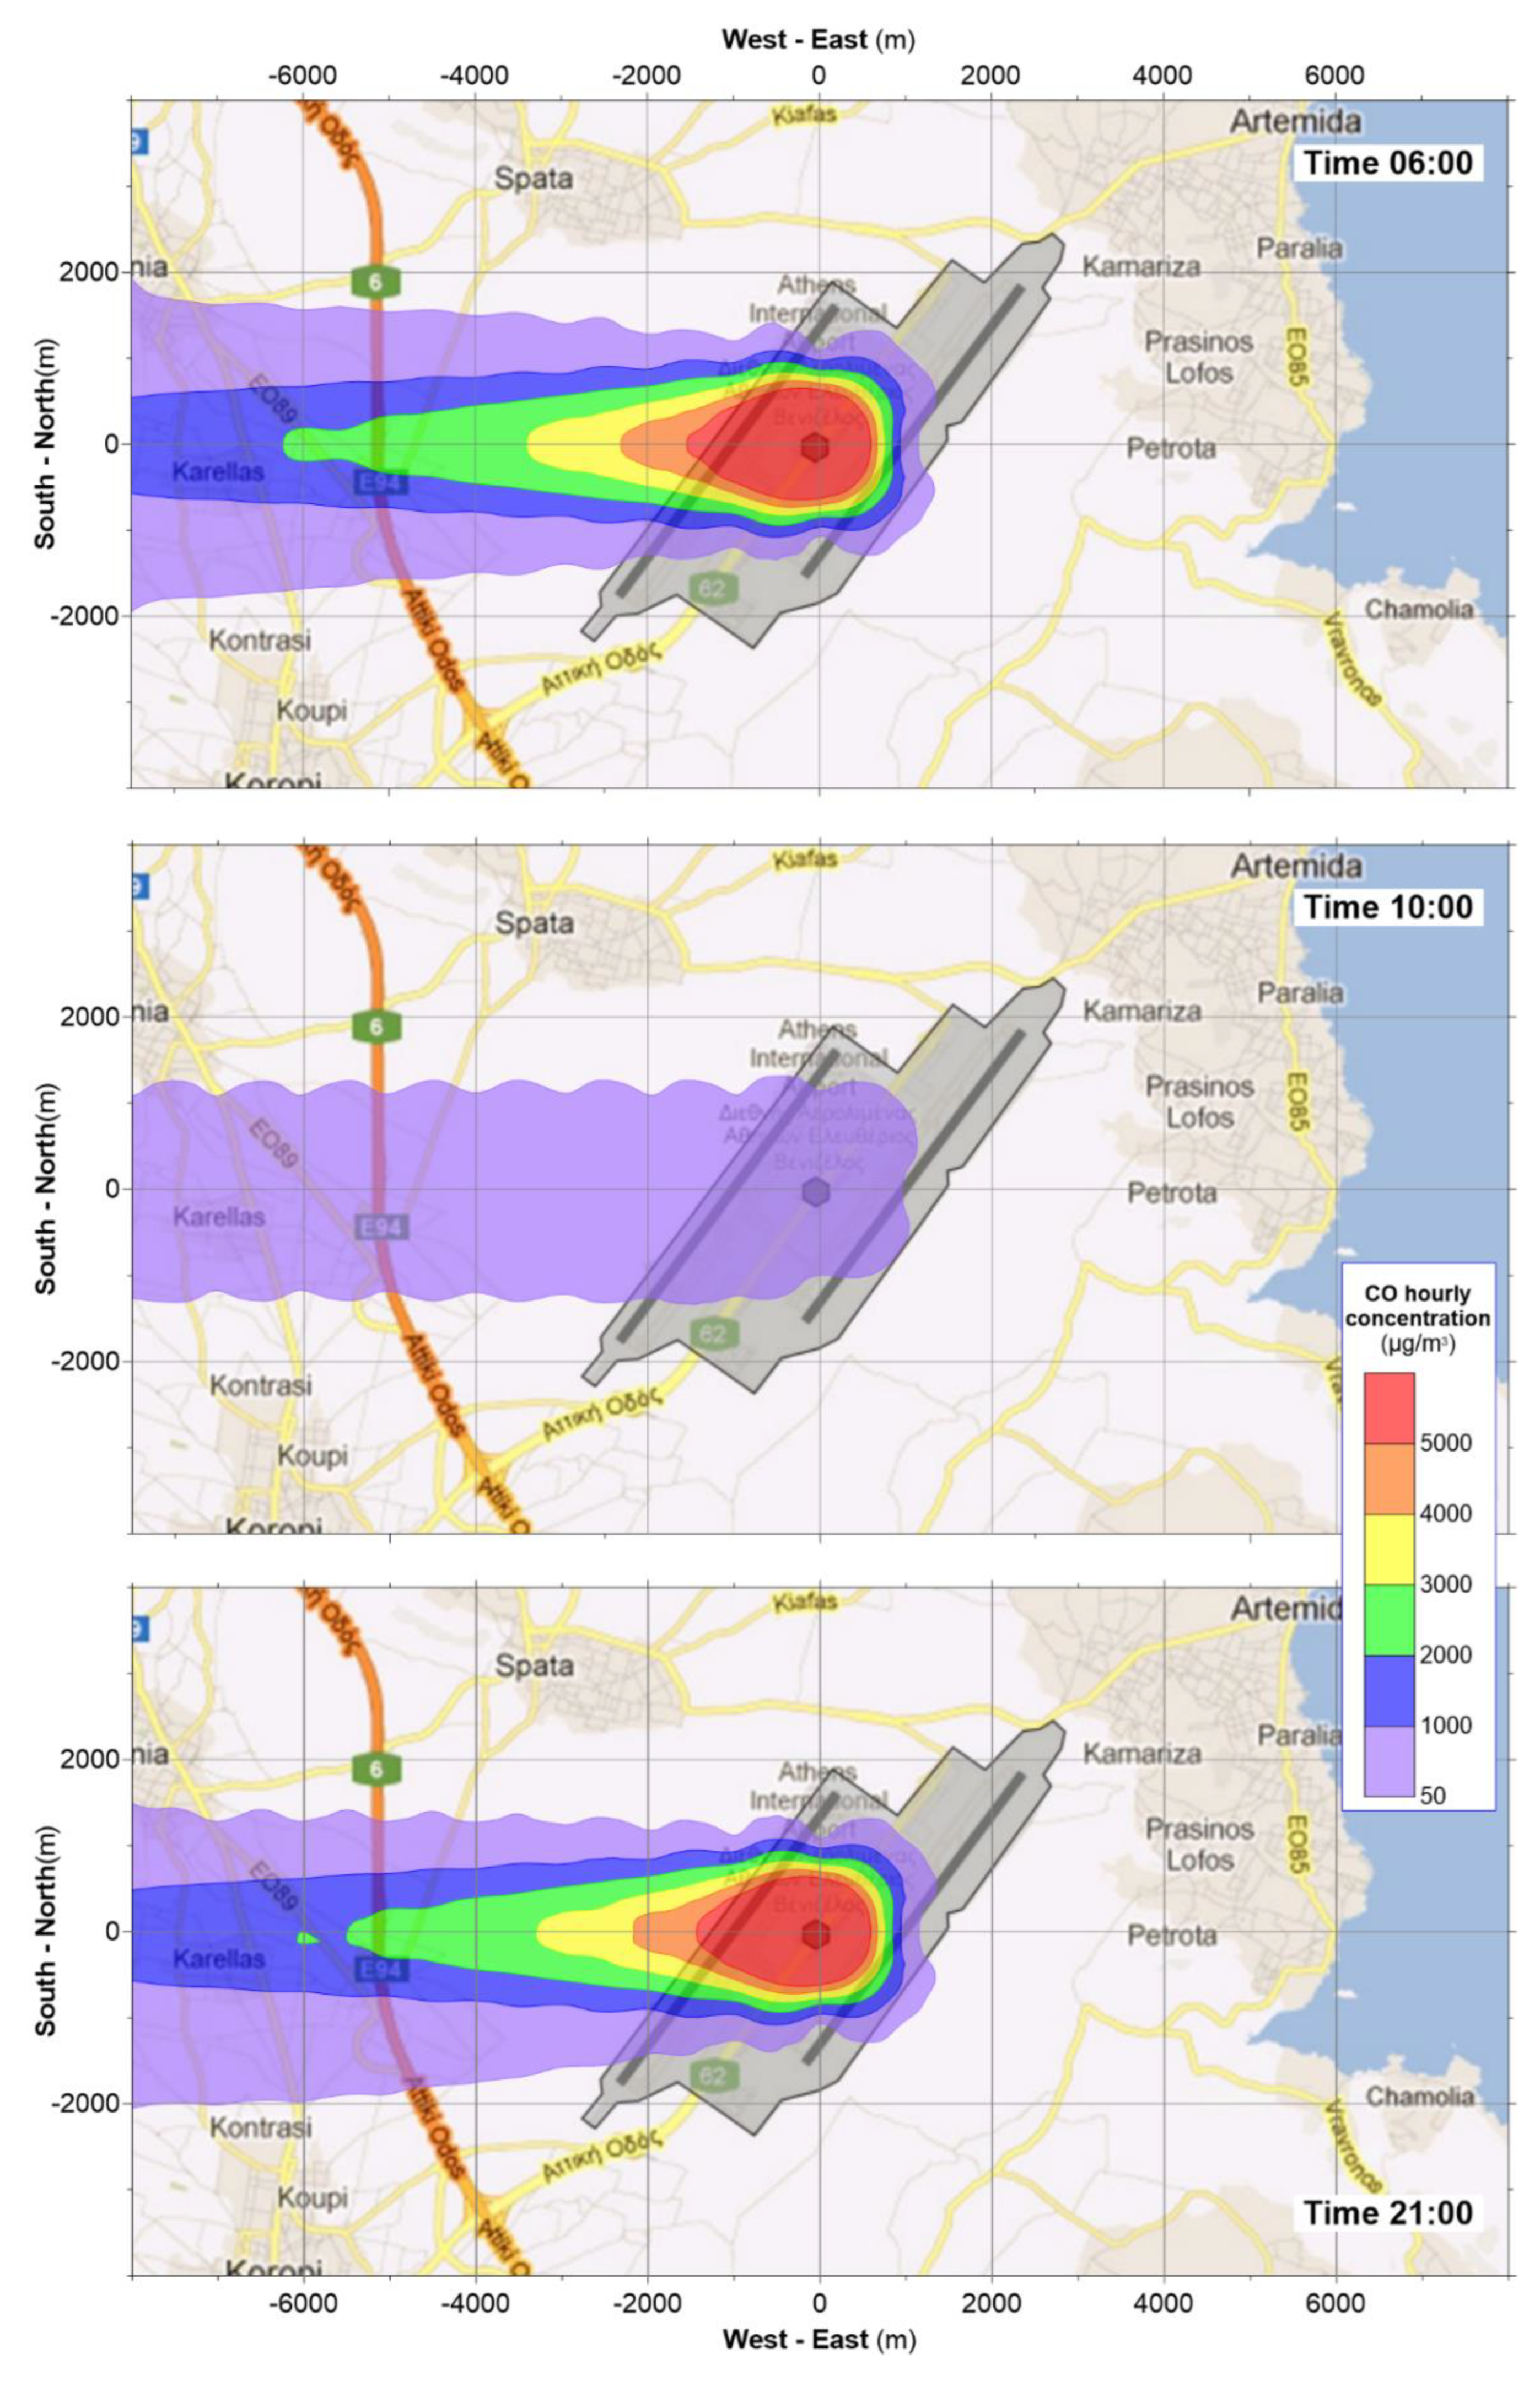
45], which uses a characteristic scale, the Monin-Obukhov length, L, to represent the height of the dynamic turbulence layer, and a related parameter, u*, to account for friction velocity. Both L and u* are interconnected with wind speed and AERMOD uses a repetitive algorithm to determine their values. To investigate the effect of wind speed, the model run for a wind speed range from 0,51 to 4,63 m/s, while all other parameters were kept constant (ambient temperature 5,2 °C, no cloud cover). For the parameter of the time of day, 06:00 was chosen, to represent stable conditions of the surface layer, with minimum vertical mixing potential, which allows for better isolation of the horizontal wind speed effect.
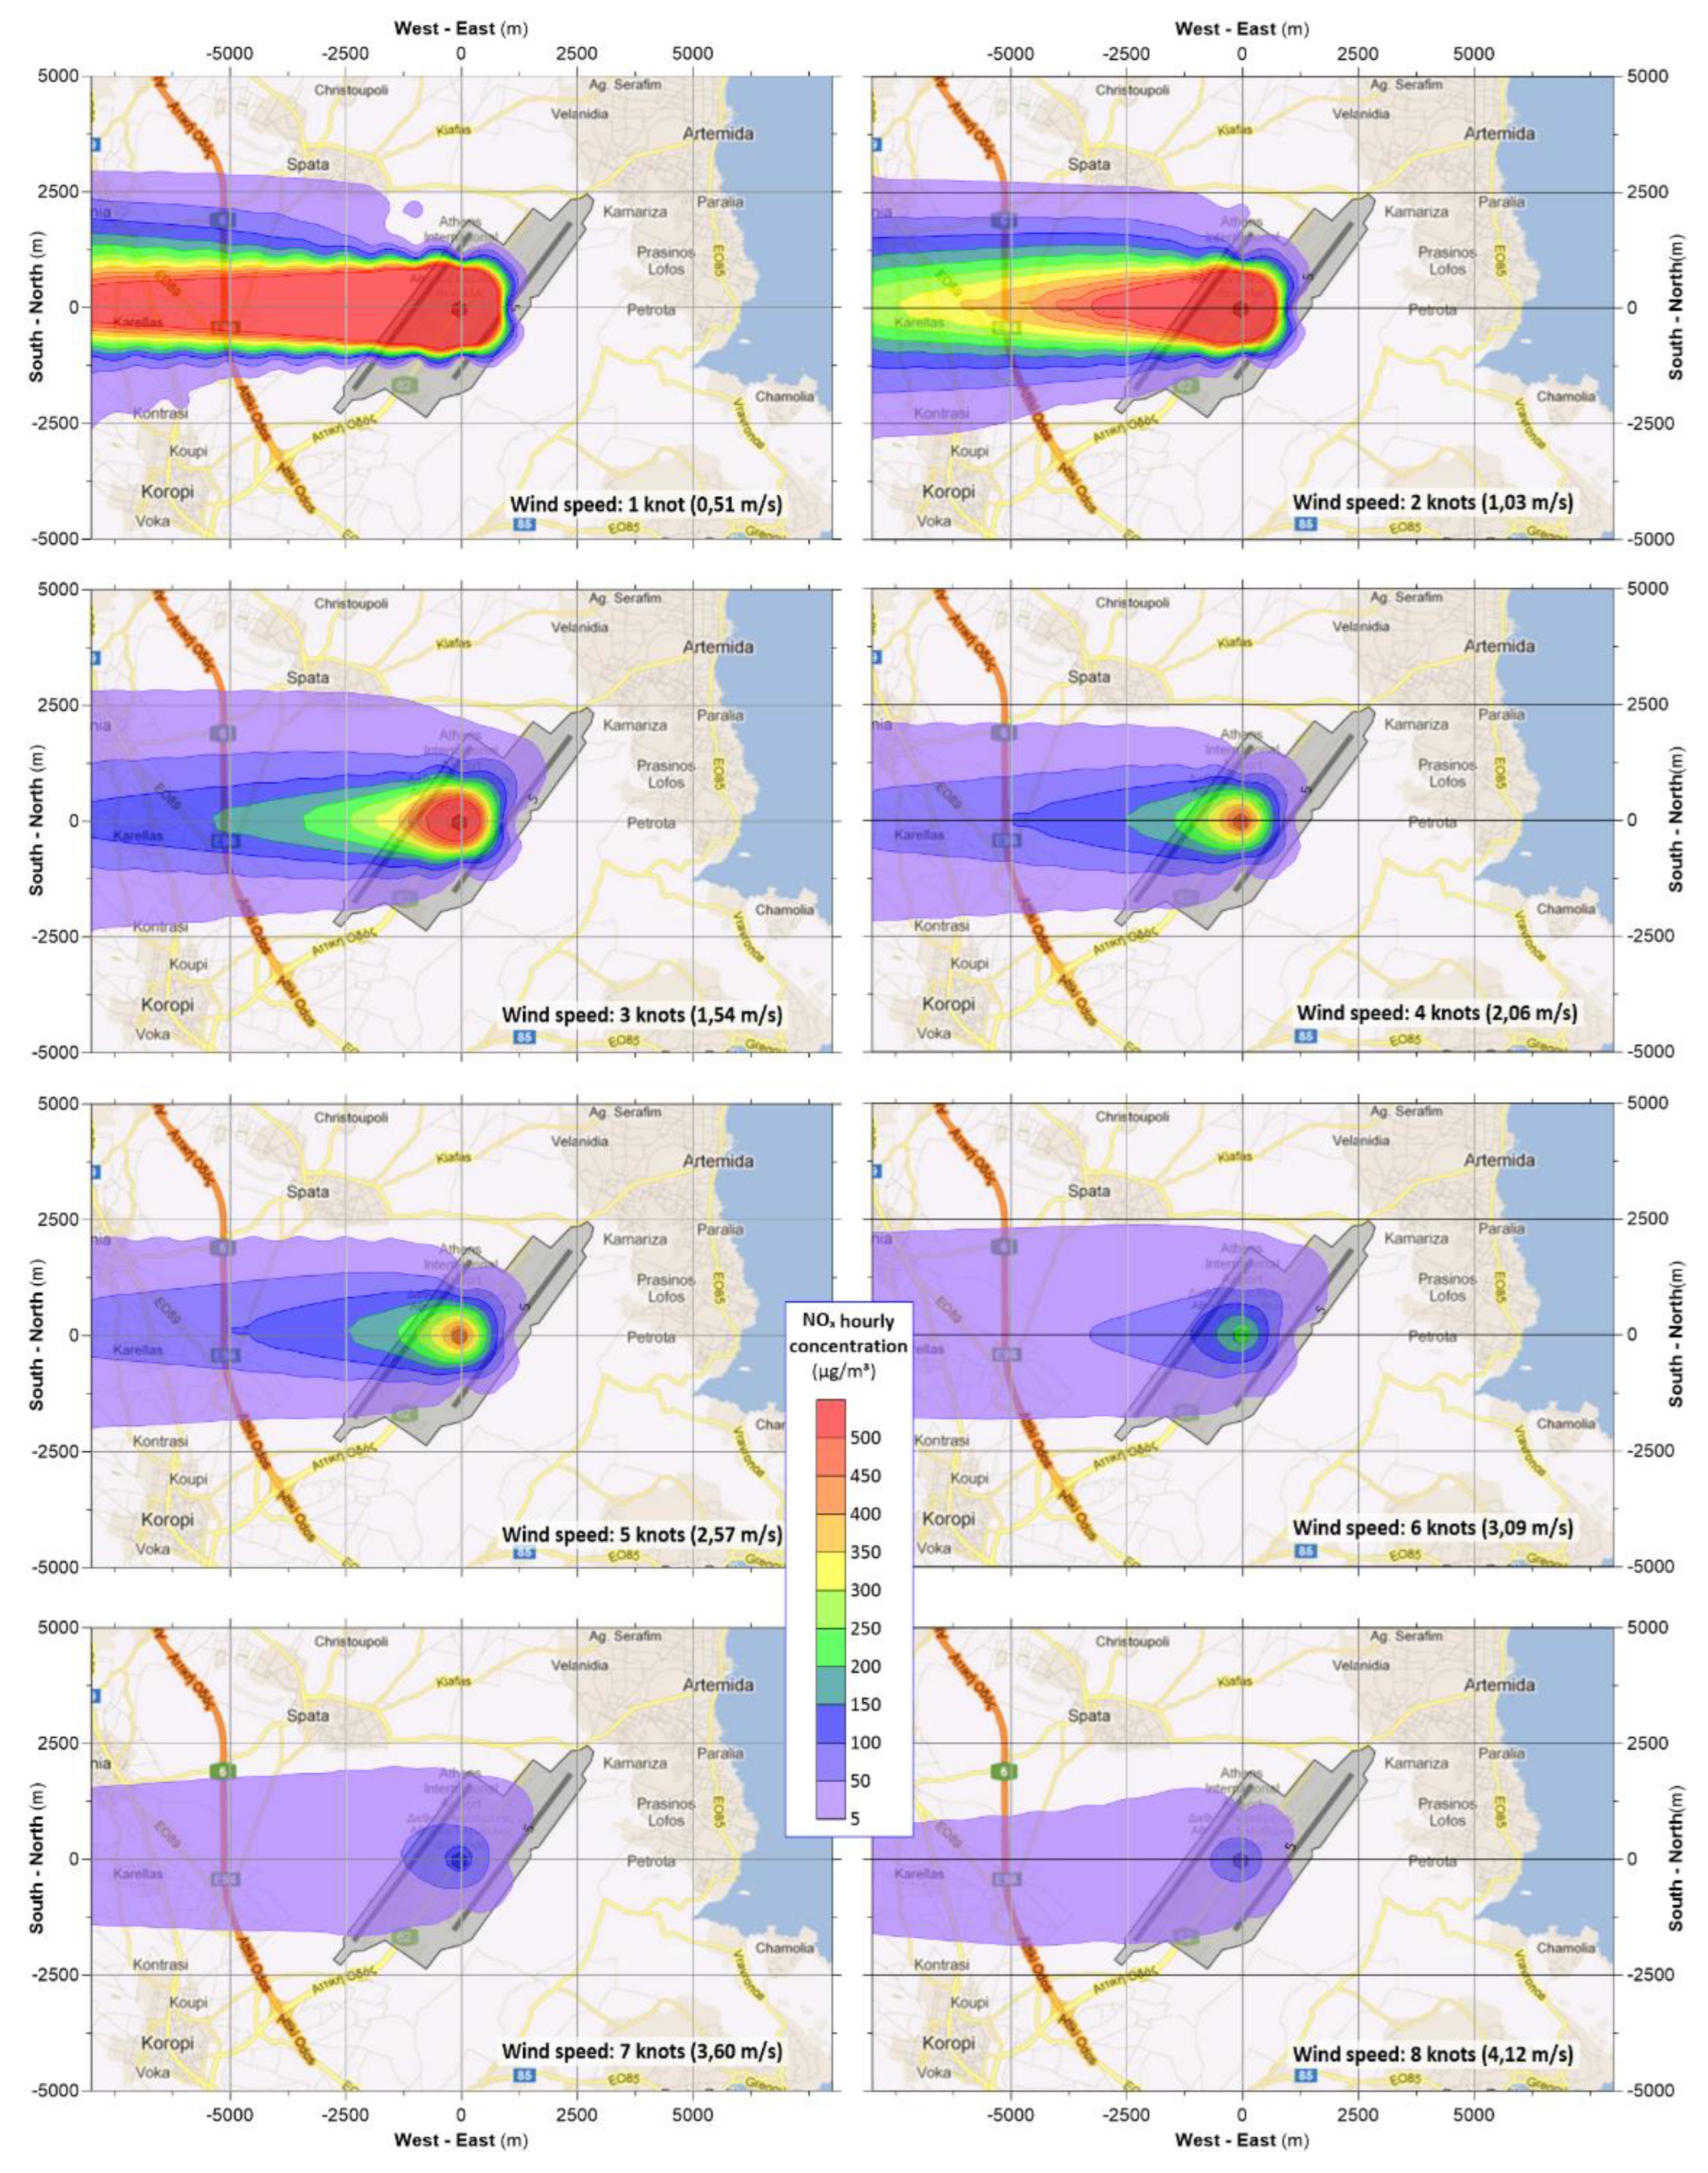
In
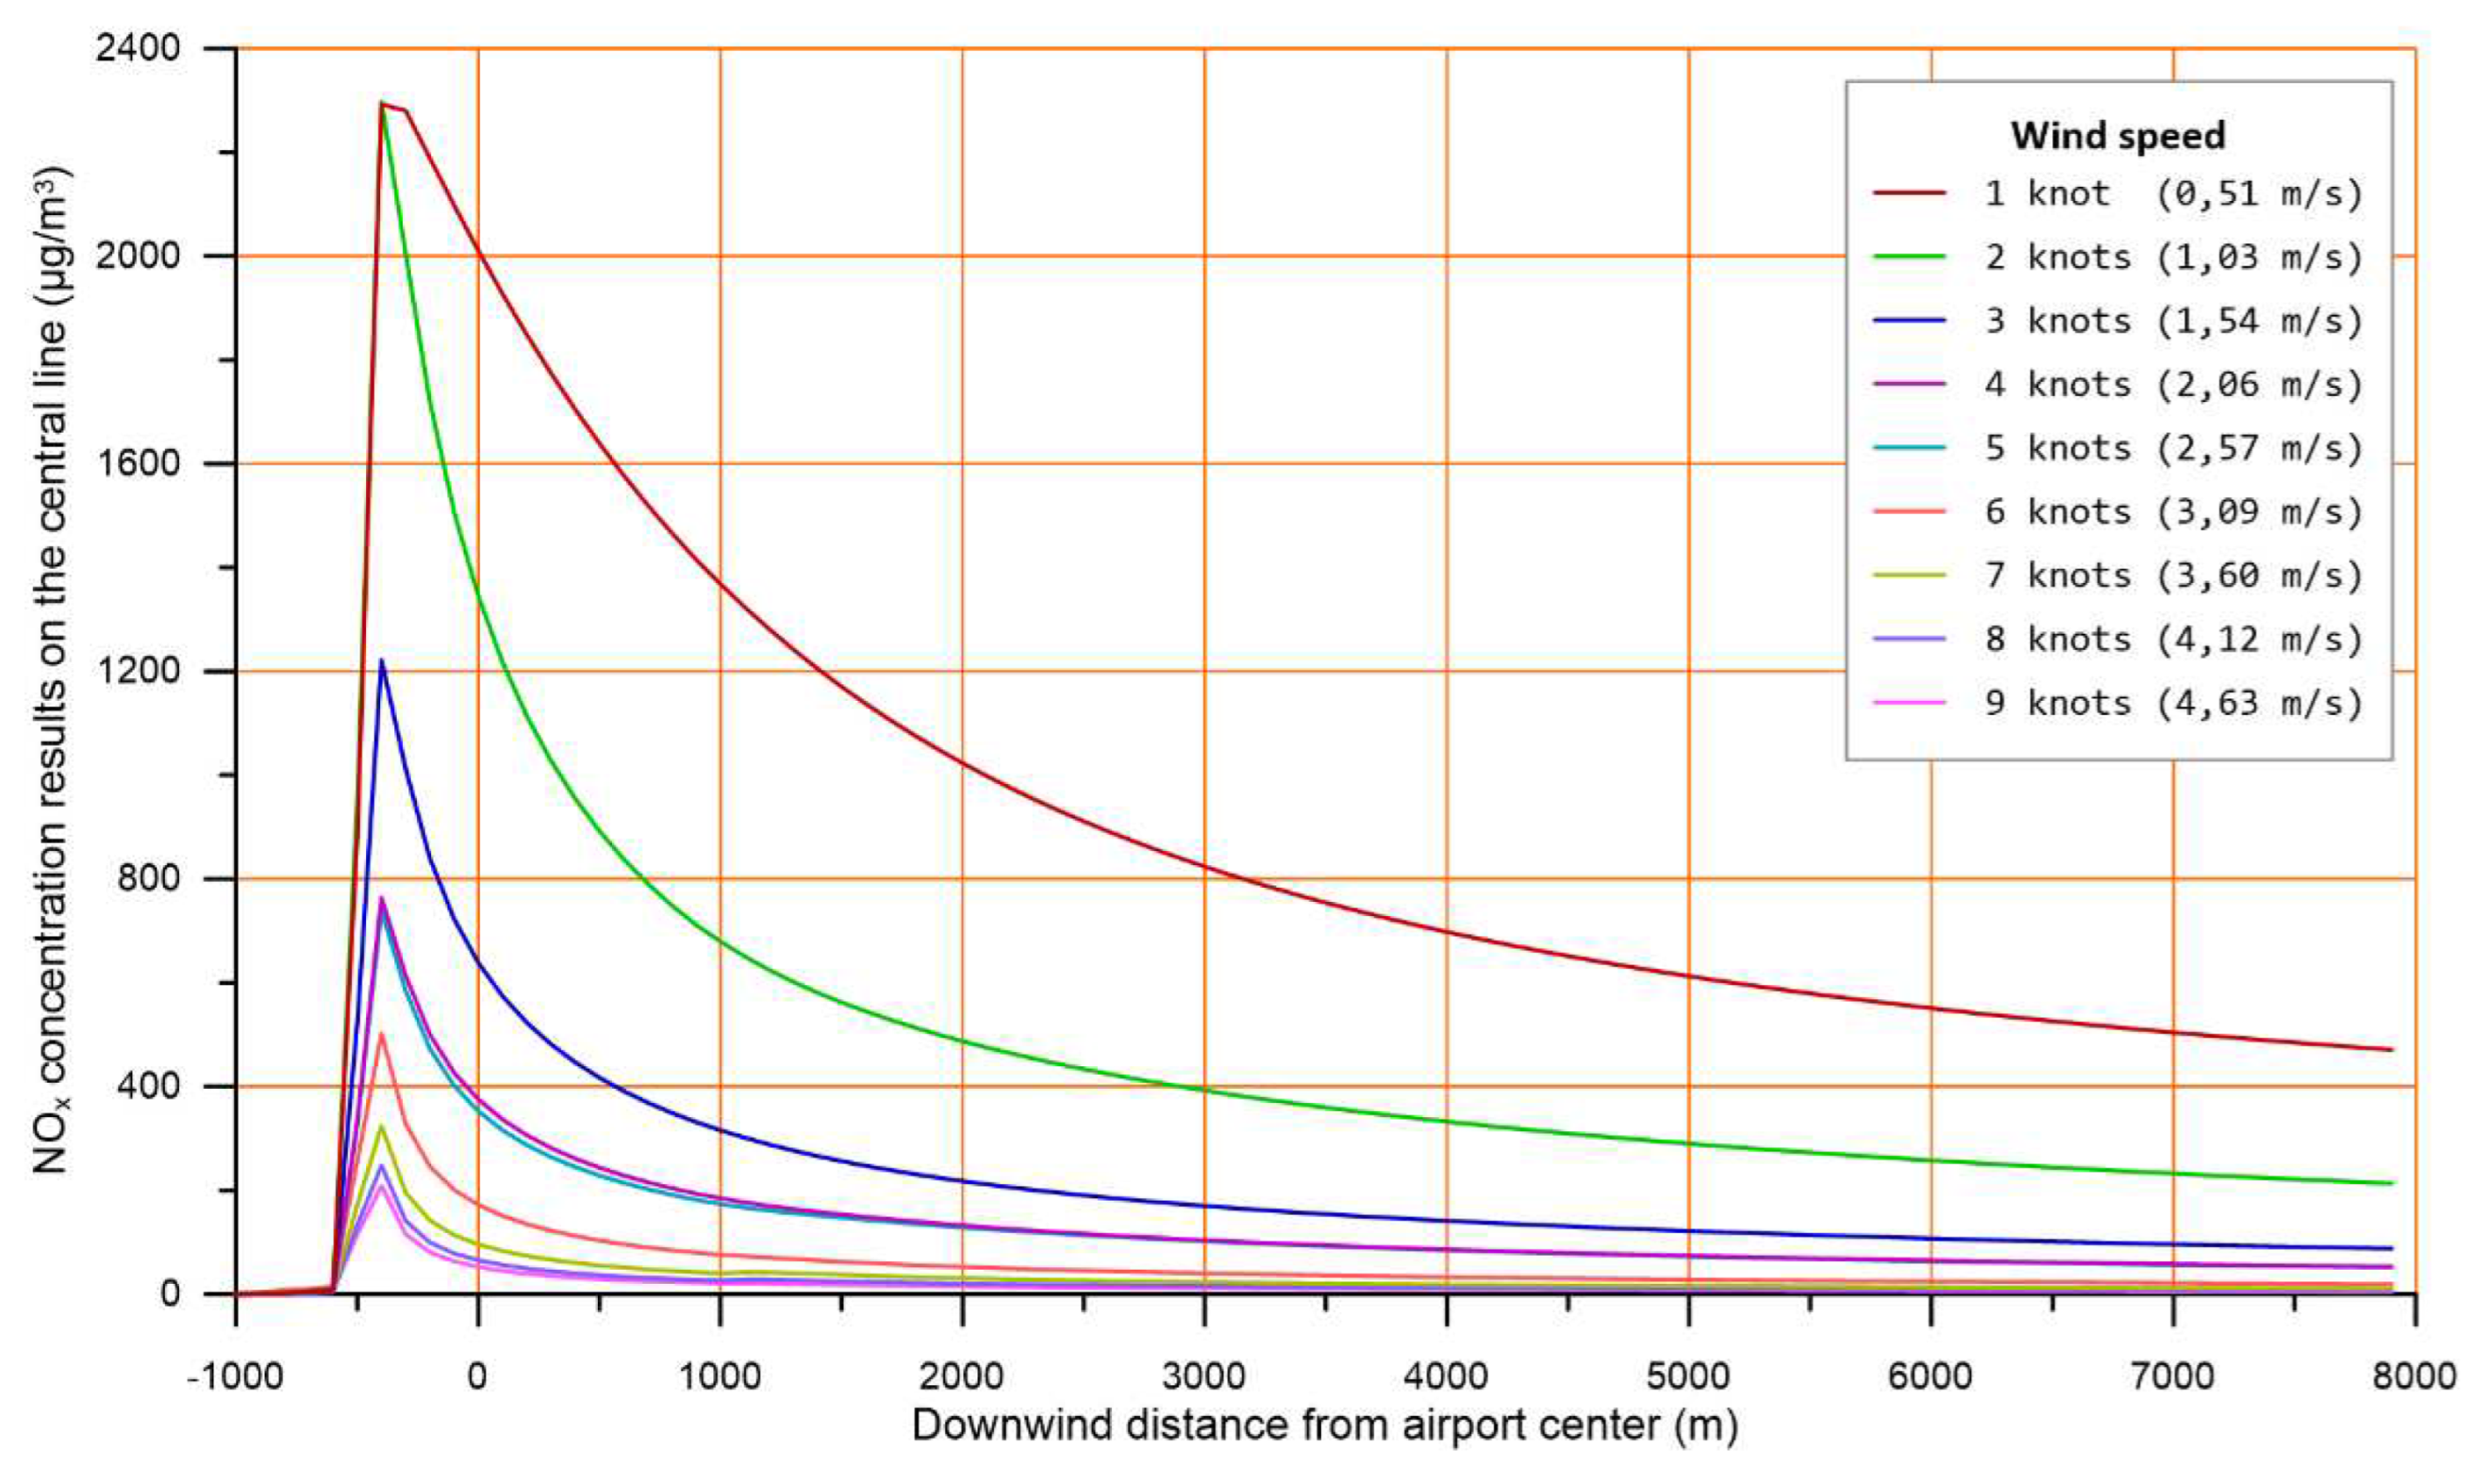
Figure 5, the effect of wind speed on the concentration level and the area covered, is demonstrated, while the detailed impact of this parameter on the intensity of the concentration is further depicted in
Figure 6.
In the graph of
Figure 6, it is demonstrated that wind speed has a significant impact on the calculated concentration levels, since a small wind speed change (i.e., a change of ~0,5 m/s from 2 to 3 knots) results in significant concentration variations (i.e., a difference of 400 μg/m3 at NOx concentration at 1000 m downwind). There also seems to be a regularity in the way concentrations are reduced as wind speed increases, with the exception of the transition from 4 to 5 knots. Upon further investigation, it was found that the calculated concentrations decrease logarithmically with increasing wind speed, and the exemption appearing from 4 to 5 knots seems to be associated with the transition of AERMOD calculations from the stable to the convective layer equations.
The above observations verify the known intense wind speed influence on air pollutant dispersion and furthermore give a quantification sense of how strong this influence is.
3.3. Temperature
Ambient temperature is accounted for by EDMS in several calculations, mainly at the dispersion stage, but also to a smaller extent in the calculation of emissions by vehicles and training fires. The mechanism by which ambient temperature affects the dispersion of gaseous pollutants consists of two main components: (a) the buoyancy component, i.e., the height that the emitted pollutants will ascent to and the relevant dilution due to volume change, and (b) the mixing component, i.e., the diffusion of the exhaust gas stream in the ambient air.
The first component depends inversely on the ambient temperature, Ta; the lower Ta is, the higher the difference between Ta and the exhaust gas temperature, leading thus to greater buoyancy. The second component is defined by the Monin–Obukhov length, L, which is directly related to temperature [
25].
To investigate the temperature effect, the model run for a temperature range from 0 to 40 °C with a step of 3,3 °C. For these runs, wind speed was set to 2 m/s and clear sky was assumed.
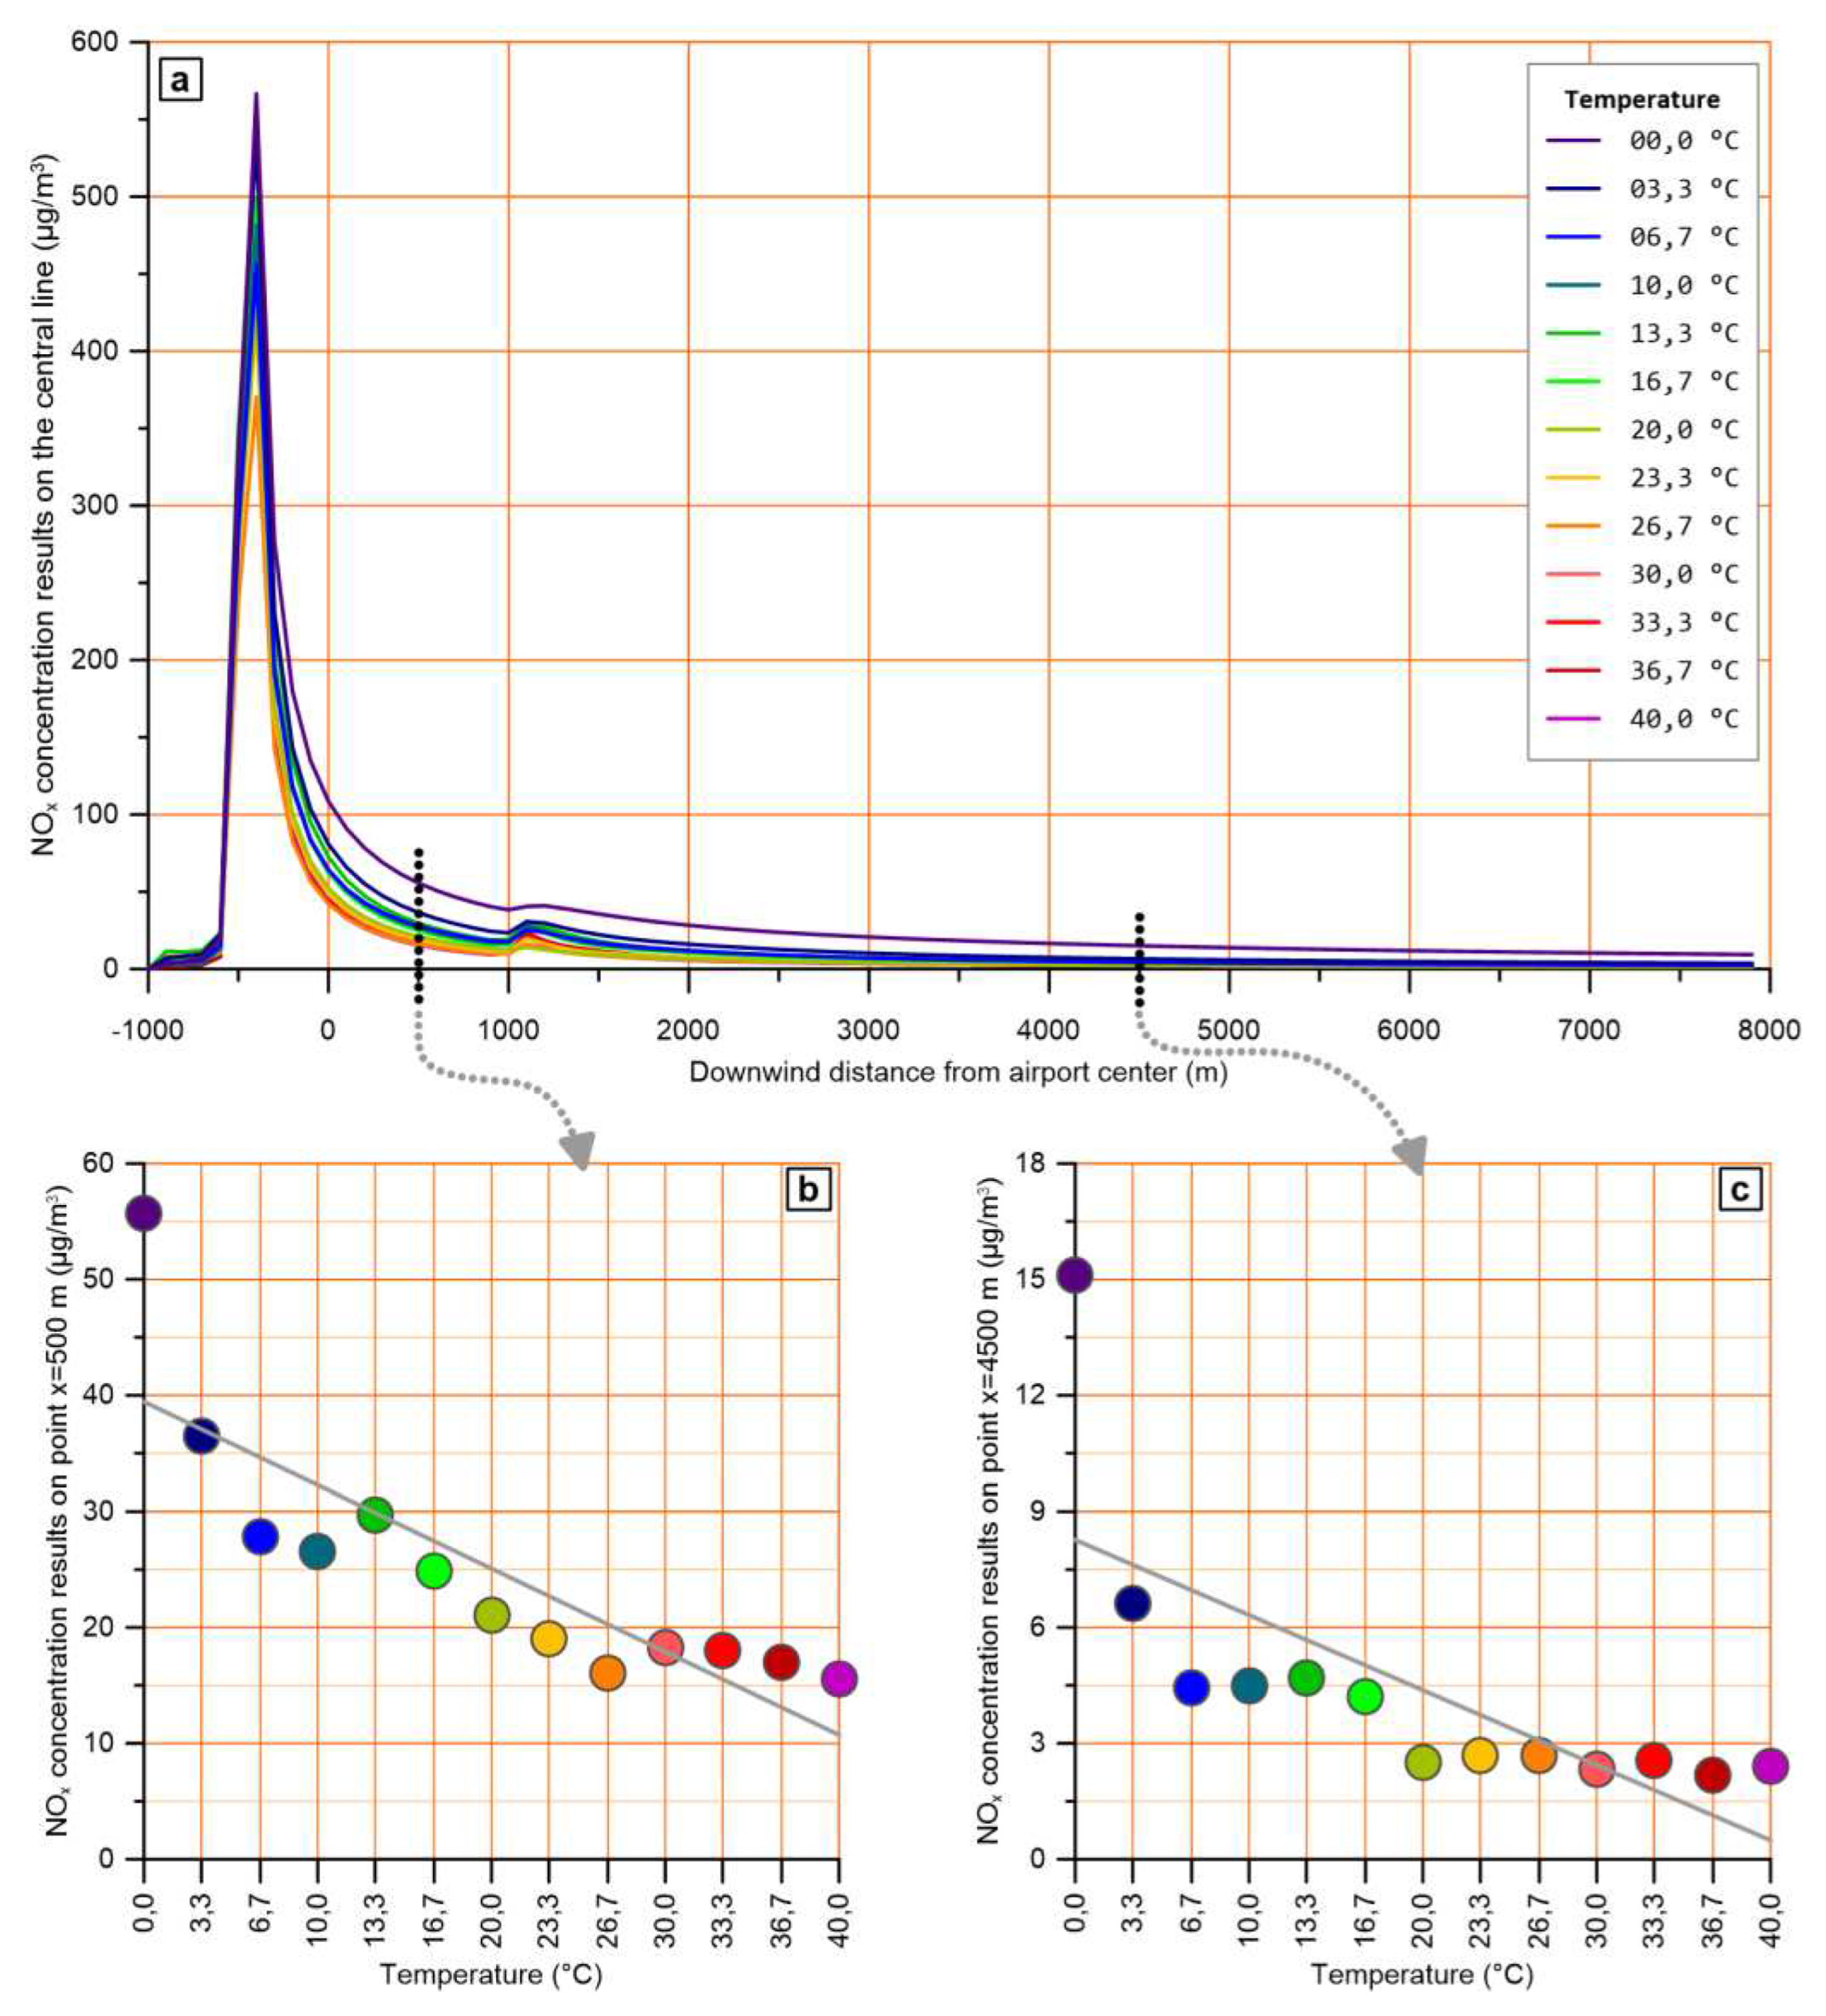
The results show two different types of effects. The first one appears under stable boundary layer conditions, i.e., after sunset and before sunrise (see
Figure 4), during which the ambient temperature slightly affects concentrations, as shown in
Figure 7 (a, b and c) for a representative hour.
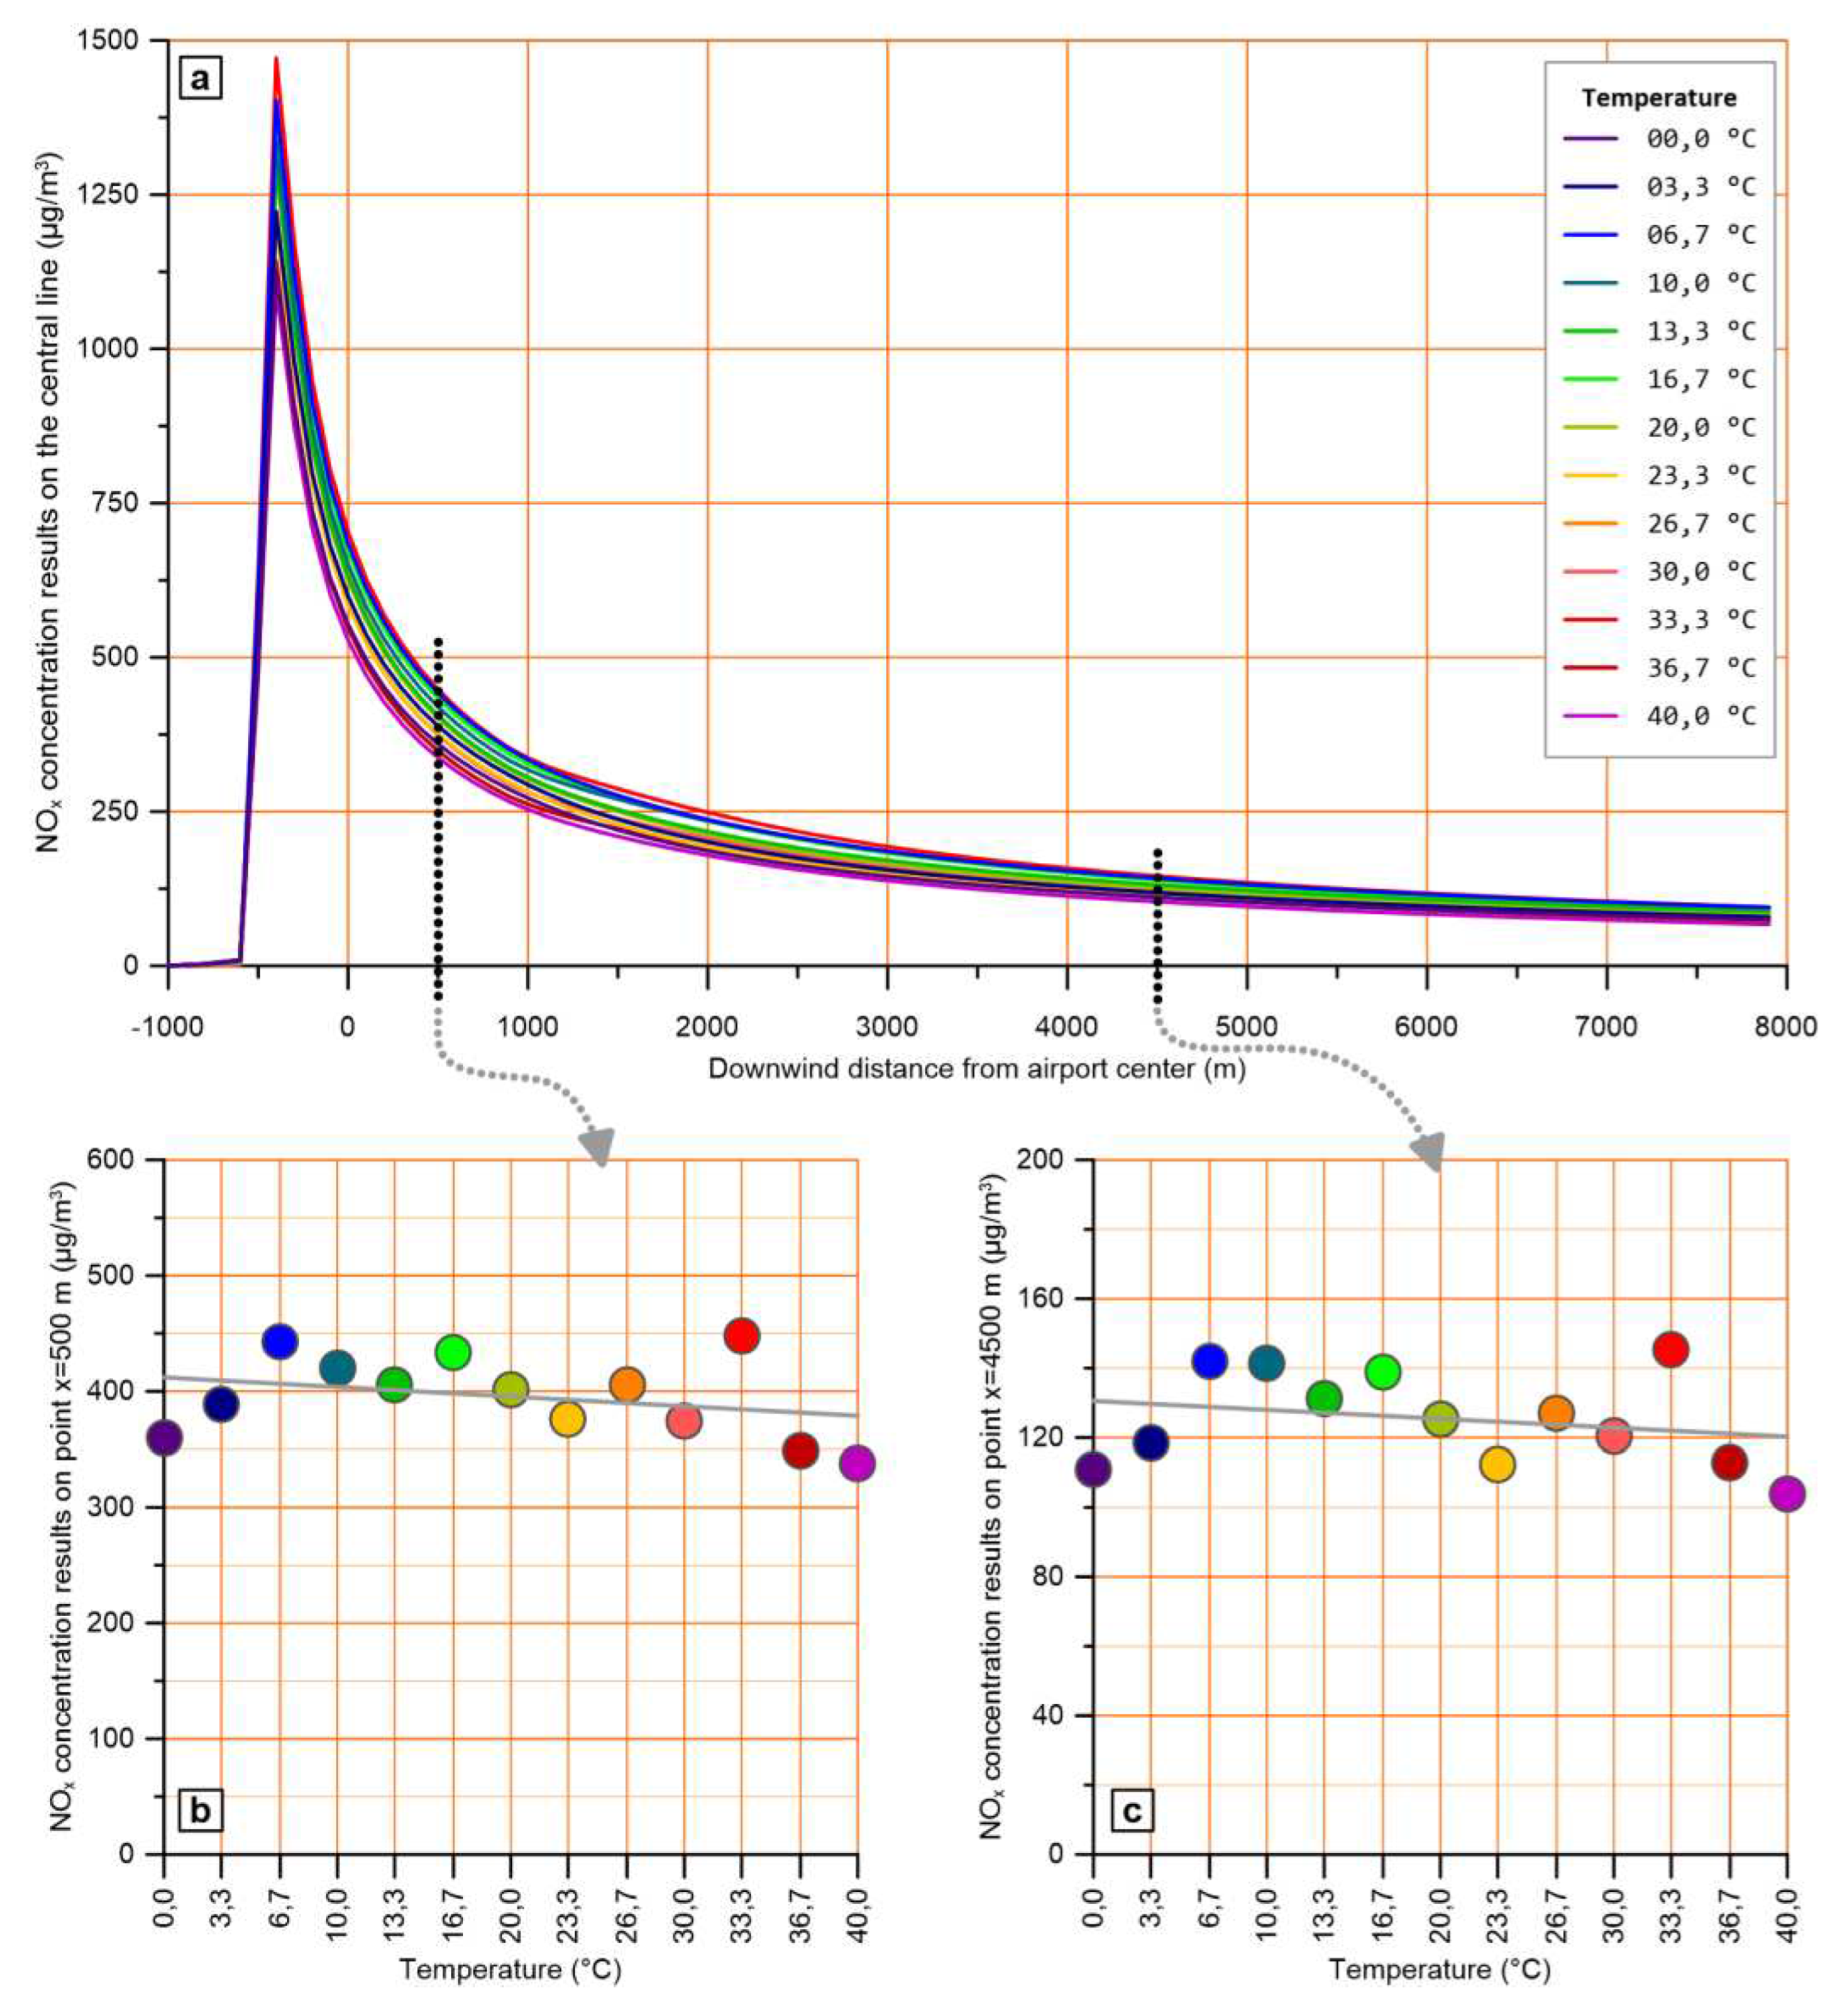
The second type of effect occurs when convective boundary layer conditions prevail, as well as during the transition from stable to convective boundary layer and vice versa, i.e., from 09:00 to 17:00. During these hours, higher temperatures lead to significantly lower concentrations, as shown for a representative hour in
Figure 8 (a, b and c). However, around noon and early afternoon hours, this effect is hampered as a result of the low concentrations.
The general trend that appears in charts (b) and (c) of
Figure 8, namely the decrease of calculated pollutant levels as ambient temperature increases, is in line with previously published works [
46] where AERMOD was used for various meteorological conditions. This trend is attributed to the mixing component of the mechanism mentioned above, related to convective conditions, which is further intensified as temperature rises.
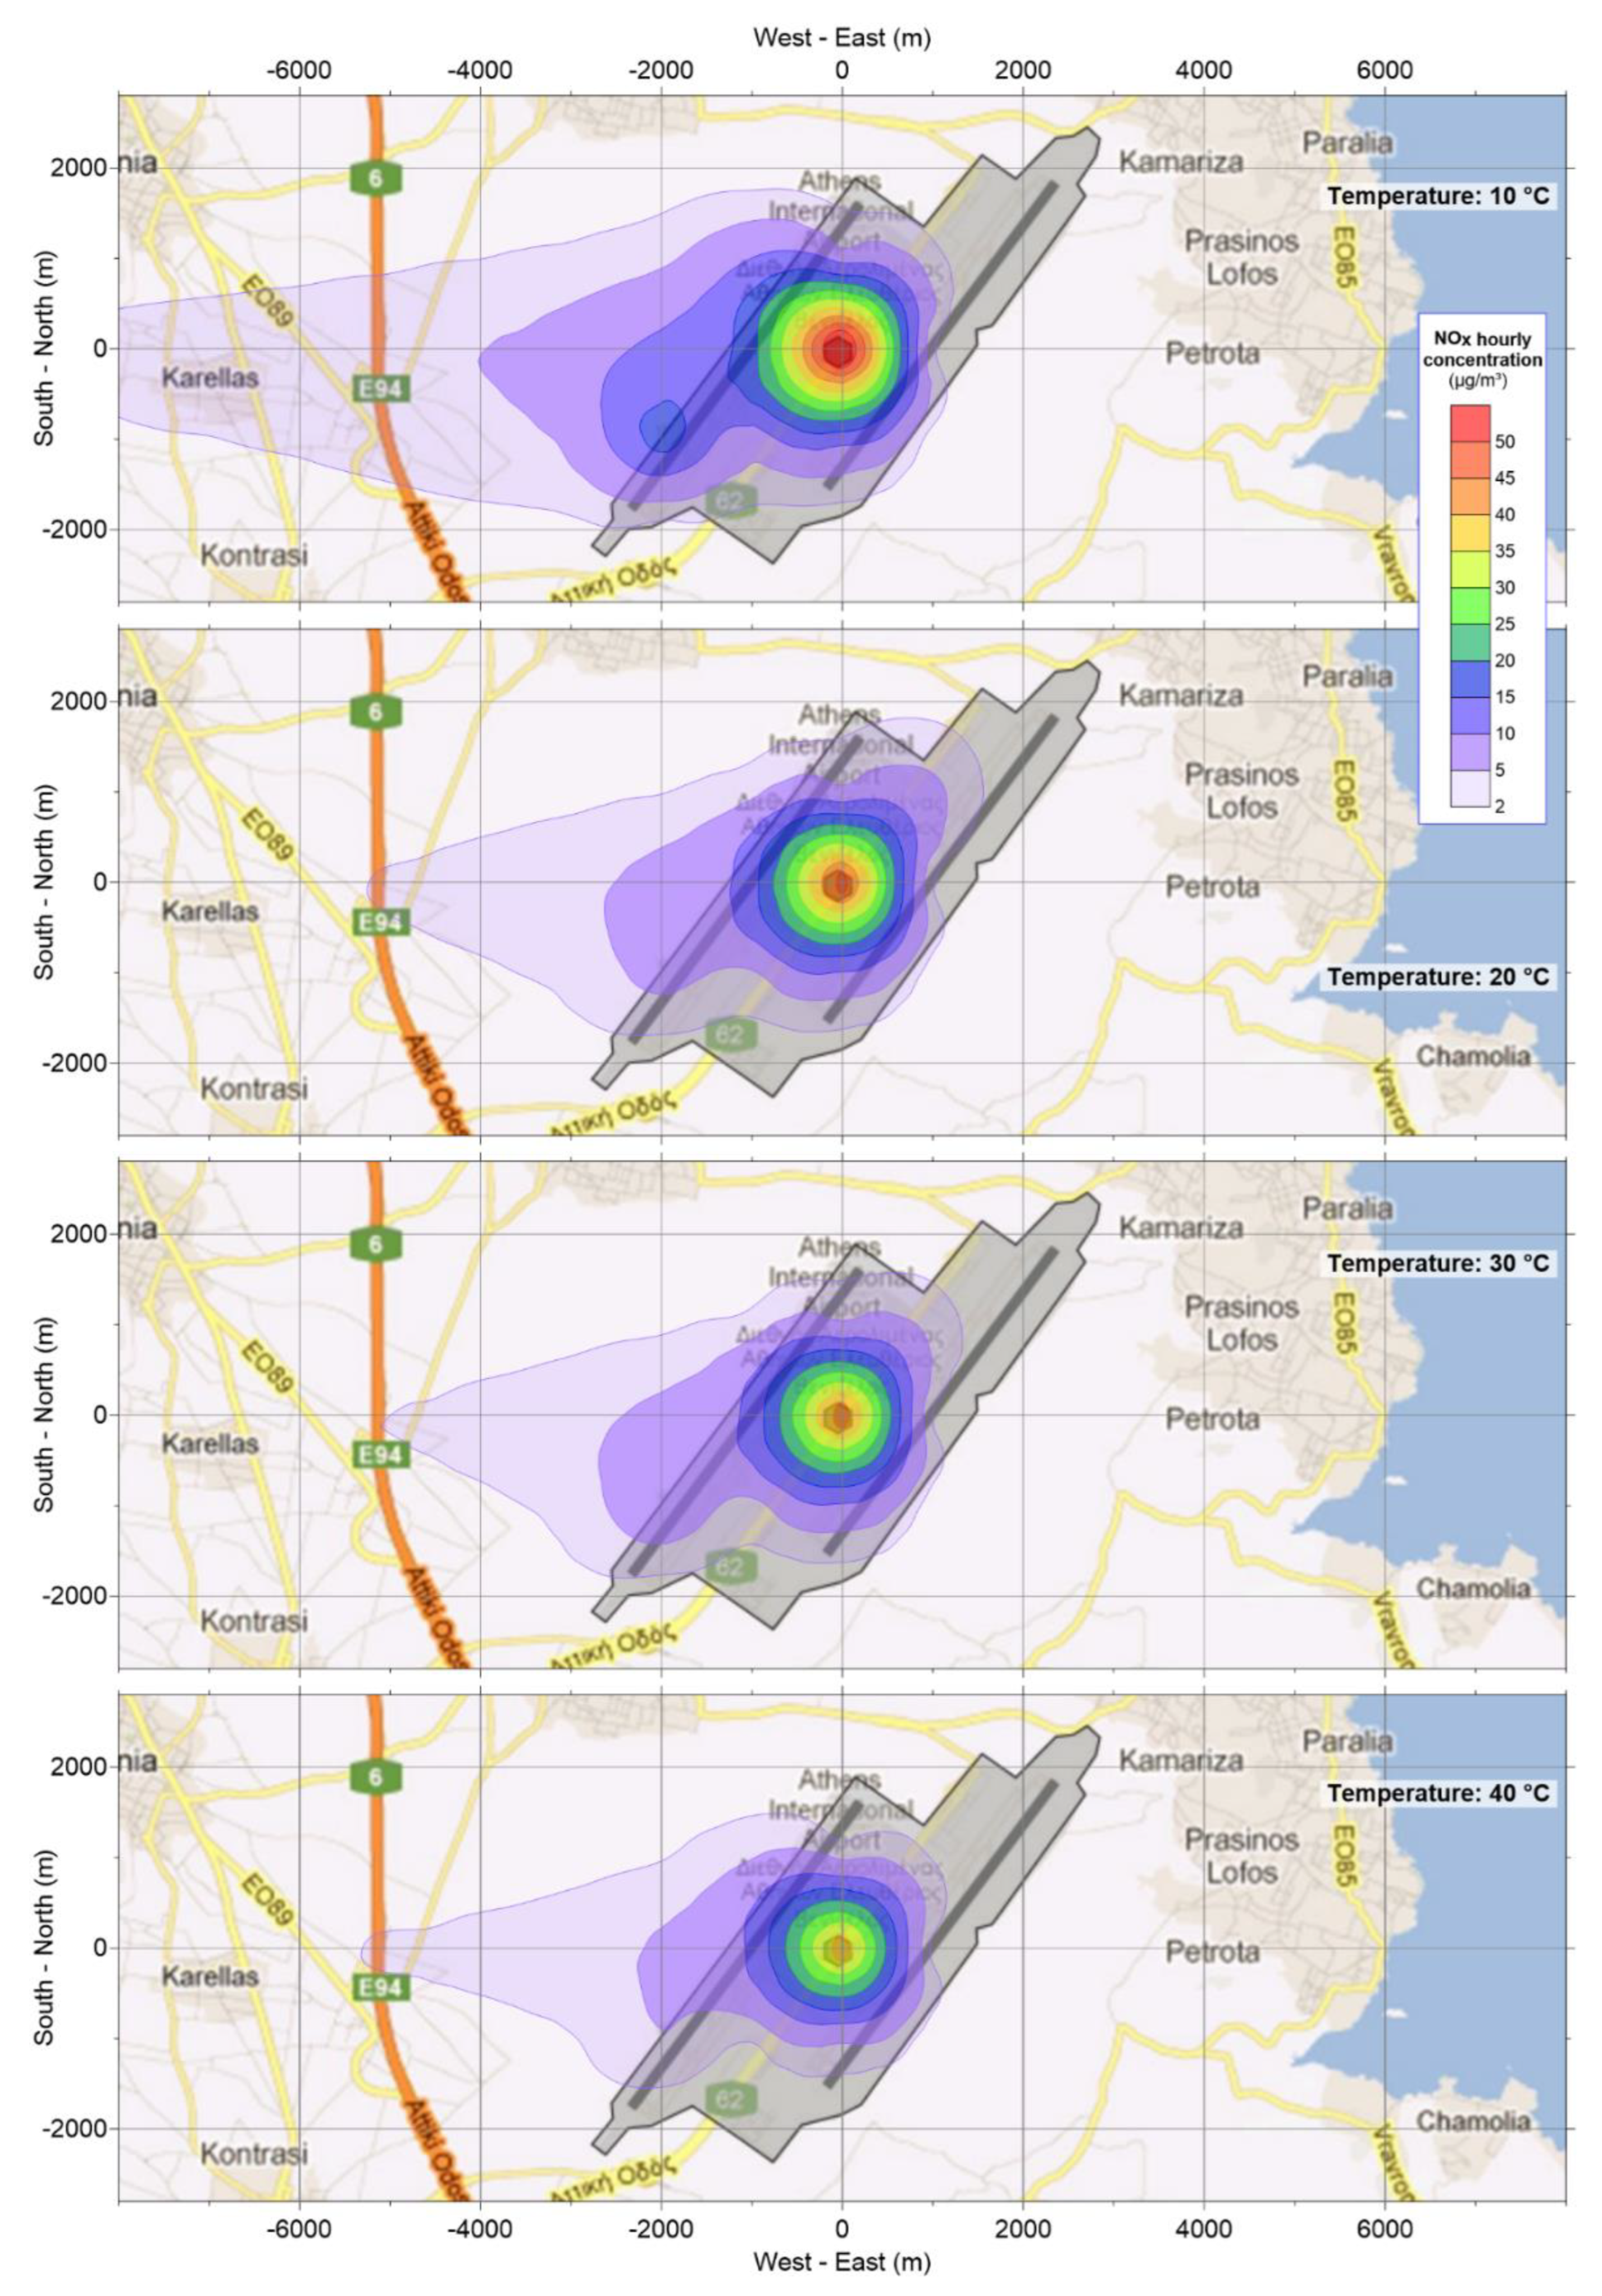
In
Figure 9, the sensitivity of the model’s spatial results to temperature is presented for the same hour (16:00h) as in the previous figure (
Figure 8), showing a gradual decline and contraction of the concentration field as ambient temperature increases.
3.4. Cloud cover
The percentage of sky covered by clouds is a basic meteorological parameter required by most dispersion models, including AERMOD. The cloud cover affects the portion of solar radiation reaching the surface, which in turn, affects the vertical motion of the atmospheric masses due to the heat spread to the ground and air.
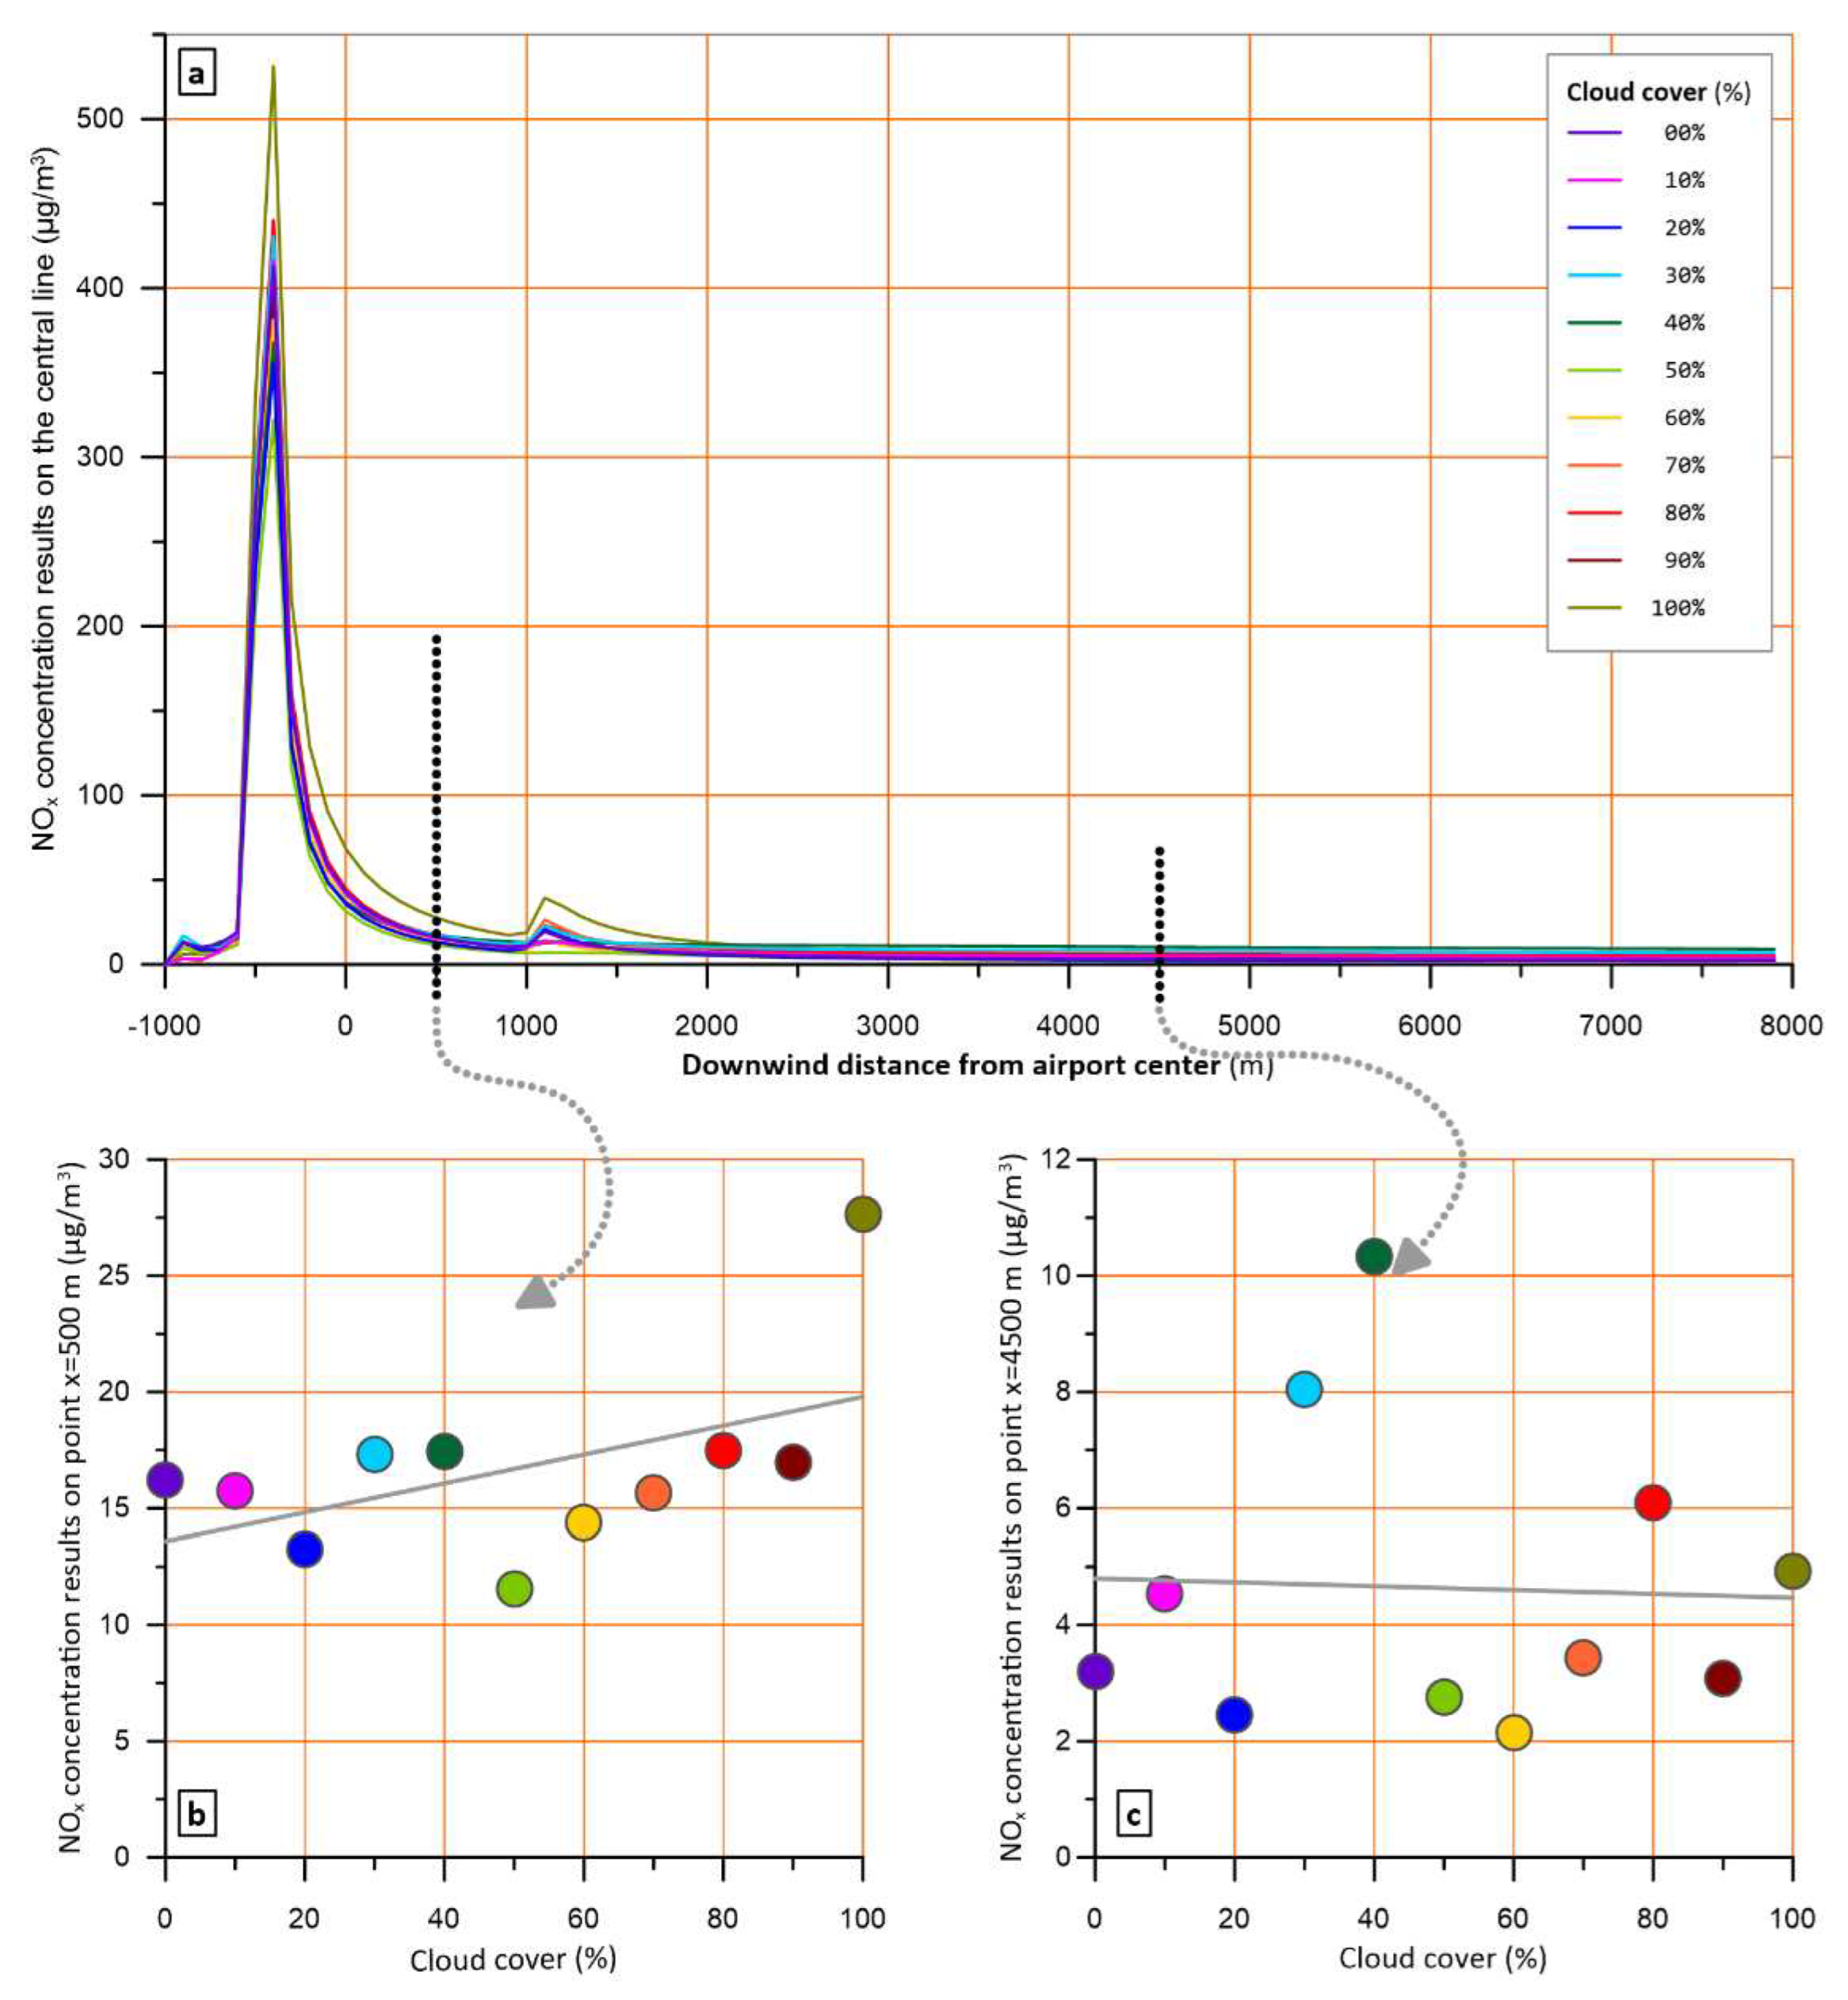
To depict this effect, the model run for cloud cover percentages varying from 0 to 100%, focusing on daytime hours, and keeping all other parameters constant at values that favour high concentrations (wind speed 2 m/s, ambient temperature 10 °C, cloud ceiling 2,1 km).
During daylight, due to convective conditions, cloud cover increase leads to non-systematic concentration fluctuations, which, however, are very low (a, b, c).
Figure 10.
Effect of ambient temperature on pollutant levels across the plume central line at 16:00h, when atmospheric layer is convective. (a) NOx levels across the plume central line for different ambient temperatures, (b) and (c) NOx levels at x=500 m and x=4500 m for each of the examined temperatures.
The above results, are generally in line with previously published findings with a different model [
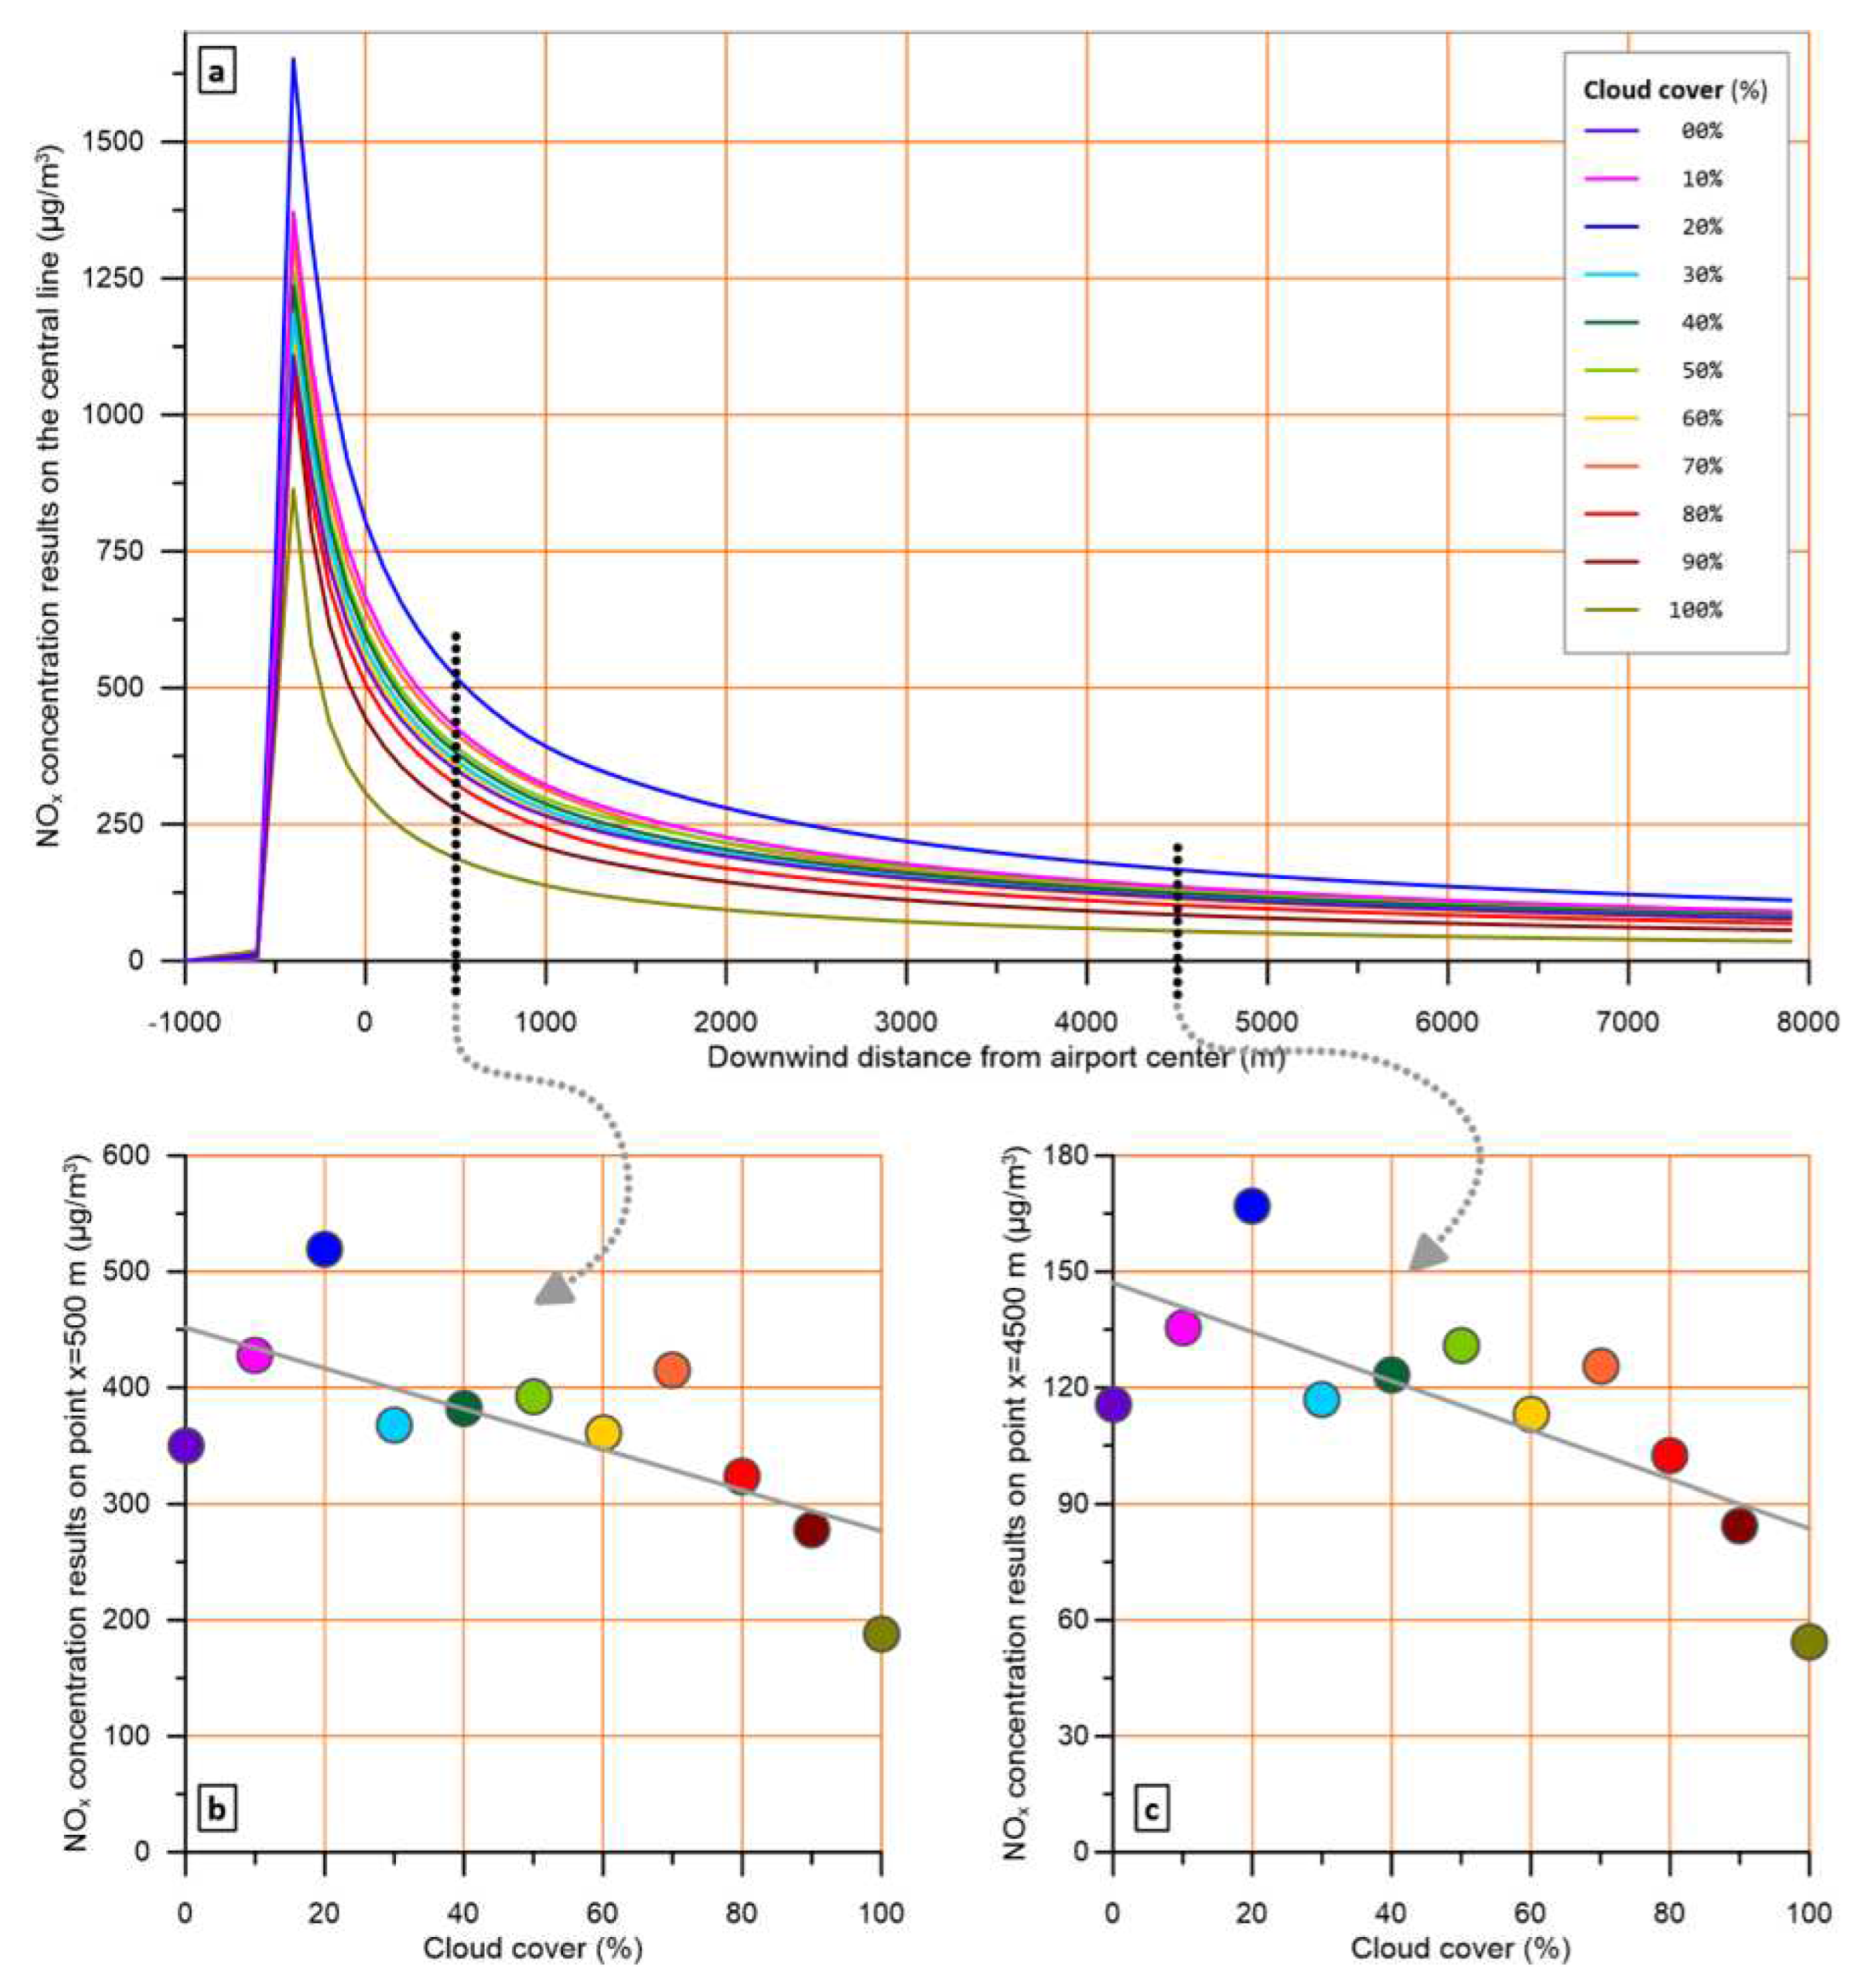
47]. Under stable conditions, the fluctuations are still there but a trend to lower concentrations for increased cloud cover is visible, as shown for a characteristic hour in
Figure 11 (a, b, c).
3.5. Cloud ceiling
The height of clouds, known as cloud ceiling or cloud base, is also included in the meteorological parameters required by several dispersion models, including AERMOD. In the case of EDMS, cloud ceiling is considered, not only in dispersion calculations, but also in emissions algorithm, because of its effect on runway selection and on flight path modifications. Since this effect of cloud ceiling is related with air traffic management, a further discussion on it is not useful for the dispersion sensitivity analysis.
Although cloud ceiling is required as an input by AERMOD, its role in the calculation steps is described rather vaguely; the description of model formulation [
25] or the manual of the meteorological pre-processor AERMET [
23] do not include any relevant information.
A broader search for the role of cloud base in the dispersion of air pollutants yielded only older publications [
48,
49], where this parameter was correlated, along with cloud cover, to the stability class of the atmosphere according to Pasquill - Gifford categories. Given that AERMOD has gone beyond this approach and uses the Monin Obukhov length as a measure of the dispersion capacity of the atmospheric layer, it can be assumed that the cloud ceiling will not have a significant effect on the concentration calculations.
This assumption has been verified by our results, after running the model for a range of cloud ceiling values. Indeed, after several runs of the model, for cloud ceiling values ranging from 1000 to 10000 ft, no significant effect on the results was found.
This insignificant effect of the cloud ceiling on model results is a rather positive finding, since in most cases this parameter is not available.
4. Discussion
4.1. Day/night time
Highest concentrations occur during nighttime, early in the morning and late afternoon, whereas lowest concentrations occur during daytime (
Figure 3). The same pattern is also found for higher wind speeds.
This finding shows that the stronger solar radiation, between 10:00 to 16:00, creates a predominating convective layer which enforces air pollutant dispersion mechanisms, despite high emission rates. Thus, although during daytime highest emissions occur, the effect of convection and turbulent diffusion prevails, leading to lower air pollutant levels. Consequently, the highest concentrations resulting from airport operations are likely to occur during early morning hours and/or after sunset, especially when combined with intense air traffic.
4.2. Wind speed
As anticipated, the influence of wind speed on the dispersion of air pollutants is significant. Modeling results can provide a quantifiable understanding of the extent to which this influence affects dispersion.
The key conclusion of this section is that the wind speed is one of the most important parameters when regulatory modelling is performed, as for example in environmental impact assessments. The selection of this parameter requires careful consideration, taking into account the meteorological conditions unique to each area while also ensuring calculations accommodate the worst reasonably expected case for concentration assessment.
4.3. Temperature
The temperature effect on simulated concentrations is twofold: a) under stable boundary layer conditions, after sunset and before sunrise, the ambient temperature slightly affects concentrations (
Figure 7) and b) when convective boundary layer conditions prevail, higher temperatures lead to significantly lower concentrations (
Figure 8). However, around noon and early afternoon hours, this effect is hampered as a result of the low concentrations.
The general trend that appears in charts (b) and (c) of
Figure 8, namely the decrease of calculated pollutant levels as ambient temperature increases, is in line with previously published works [
46] where AERMOD was used for various meteorological conditions. This trend is attributed to the mixing component of the mechanism mentioned above, related to convective conditions, which is further intensified as temperature rises.
Overall, in cases where a convective surface layer dominates, higher temperatures tend to correlate with lower concentration levels. Therefore, for regulatory modeling aiming to depict worst-case scenarios, it is recommended to base ambient temperature assumptions on the coldest conditions within the study area.
4.4. Cloud cover
During daylight, due to convective conditions, cloud cover increase leads to non-systematic concentration fluctuations, which, however, are very low (
Figure 10 a, b, c).
The above results, are generally in line with previously published findings with a different model [
47]. Under stable conditions, the fluctuations are still there but a trend to lower concentrations for increased cloud cover is visible, as shown for a characteristic hour in
Figure 11 (a, b, c).
From the above, it can be derived that cloud cover has a two-fold role, depending on the mixing conditions, which in turn depends on the hour of the day. Thus, in the scenarios to be examined during an assessment or in a regulatory case, it is proposed to adopt clear sky conditions to avoid inhomogeneities or discrepancies connected to cloud cover.
4.5. Cloud ceiling
As expected, the cloud ceiling (height of clouds) does not have a significant effect on the concentration calculations. This assumption, based on the other parameters considered in AERMOD, such as the Monin Obukhov length, as a measure of the dispersion capacity of the atmospheric layer, was verified by model results.
This insignificant effect of the cloud ceiling on model results is a rather positive finding, since in most cases this parameter is not available.
5. Conclusions
In this study, computational experiments were conducted to assess the uncertainty of the air pollution dispersion model EDMS. These experiments uncovered new aspects of the relationship between input parameters and modelling results, while also verifying and clarifying previously known effects of other parameters on concentration levels.
In regard with the time-of-day parameter, despite the high emission rates, during the sunny hours of the day (10:00-16:00), concentration levels remain at very low levels, while they reach many times higher levels during the rest of the day. This effect is attributed to the way the dispersion model takes into account the intense vertical mixing conditions expected during sunny days. Although the daily shift from stable to convective atmospheric conditions is well known, its effect on air pollutant dispersion modelling has not been extensively discussed, thus, the detailed display of the phenomenon in this work, quantitatively and spatially, can be useful. From a regulatory point of view, when modelling results are used to assess any potential exceedances, it is suggested to focus mostly in the hours during which maximum concentrations occur, i.d. during early morning hours and/or after sunset when combined with intense air traffic.
Concerning wind speed, a small variation in this input parameter leads to large differences in the calculated concentrations, showing that it is one of the most important parameters when air pollution modelling is used for the environmental impact assessment of a future or existing airport. It was also found that the effect of the difference in wind speed is more significant at low speeds (i.e., from 1 to 1,5 m/s) than in higher speeds (i.e., from 3,5 to 4 m/s), following a roughly logarithmic decline.
Regarding the effect of ambient temperature, for stable atmospheric conditions, largely different values of this parameter lead to only small changes of model results. On the contrary, for the sunny hours of the day (convective conditions), a significant decrease in the calculated concentration levels is observed as the ambient temperature increases. This finding is consistent with previously published results and it seems to be related to the mixing component of the dispersion mechanism (the one that is defined by the Monin–Obukhov length), which gets more intense as temperature increases. For regulatory purposes, when a decision should be reached based on model results it is recommended to consider the coldest conditions of the assessed area.
Examining the effect of cloud cover, a bi fold role is observed, depending on the mixing conditions, which in turn depends on the hour of the day. For the sunny hours of a day, cloud cover increase results in non-systematic fluctuations on modelled concentrations, while for the non-sunny hours, fluctuations show a decline trend as cloud cover increases. So, in case of a regulatory assessment, it is recommended to assume clear sky conditions.
