Preprint
Article

Spatiotemporal Evolution of the Land Cover over Deception Island, Antarctica, Its Driving Mechanisms and Its Impact on the Shortwave Albedo

Altmetrics

Downloads

88

Views

24

Comments

0

A peer-reviewed article of this preprint also exists.

Submitted:

16 January 2024

Posted:

16 January 2024

You are already at the latest version

Alerts
Abstract
The aim of this work is to provide a full description of how air temperature and solar radiation induce changes in the land cover over an Antarctic site. We use shortwave broadband albedo (albedo integrated in the range 300-3000 nm) from a spaceborne sensor and from field surveys to calculate the monthly relative abundance of landscape units. Field albedo data were collected using a portable albedometer over seven landscape units: clean fresh snow; clean old snow; rugged landscape composed of dirty snow with disperse pyroclasts and rocky outcrops; dirty snow; stripes of bare soil and snow; shallow snow with small bare soil patches; bare soil. MODIS MCD43A3 daily albedo product was downloaded using the Google Earth Engine API from the 2000-2001 season to the 2020-2021 season. Each landscape unit was characterized by an albedo normal distribution. The monthly relative abundance of the landscape units were calculated by fitting a linear combination of the normal distributions to the histogram of the MODIS monthly mean albedo. The monthly relative abundance of the landscape unit consisting of rugged landscape composed of dirty snow, with dispersed clasts and small rocky outcrops exhibits a high linear positive correlation with the monthly mean albedo (R2=0.87) and a high linear negative correlation with the monthly mean air temperature (R2= 0.69). The increase of the solar radiation energy flux from September to December coincides with the decrease of the relative abundance of the landscape unit composed of dirty snow with dispersed clasts and small rocky outcrops. We propose a mechanism to describe the evolution of the landscape: uncovered pyroclasts act as melting centres favouring the melting of surrounding snow. Ash does not play a decisive role in the melting of the snow. The results also explain the observed decreasing of the thaw depth of the permafrost on the island in the period 2006-2014, resulting from an increase in the snow cover over the whole island.
Keywords: 
Subject: Environmental and Earth Sciences  -   Remote Sensing

1. Introduction

The cover of snow and ice in Antarctica plays a crucial role in the atmosphere and surface energy budget. At a global scale, it explains the different role played by the shortwave radiation in the Arctic and the Antarctic [1]. At a local scale, at locations with exposed bare soil, the relative amount of snow-covered and snow-free surface determines the surface energy balance [2,3]. The impact of albedo distribution on melt rates has been quantified. The shifts in dominant surface type from snow to bare ice and clean ice to impurity-rich surfaces are important drivers in increasing seasonal ice sheet melt rates [4]. Moreover, in places with permafrost, the spatial extent and thickness of the snow cover play a crucial role in the freezing and thawing of the permafrost active layer [5]. The main factor controlling the thaw depth is the duration and thickness of the snow cover, which, above certain thresholds insulate the ground from warming [6]. A detailed description of the evolution of the land cover at sites with varying extensions of snow-covered and snow-free surfaces is mandatory to gain insight into the processes mentioned above. Deception Island, in the South Shetland Islands, is a site with a mixture of bare soil and snow, with the amount of surface occupied by each varying along the season, making it a suitable place to carry out this kind of studies; and as an extra motivation for this work, Deception Island is also a site with widespread permafrost [7].
Information on the relative abundance of snow or bare soil can be obtained from reflectance data. The reflectance, expressed in the albedo, of the surface in areas covered totally or partially by snow and ice depends on the properties of the snow and ice and on the relative amount of snow, ice and bare soil. Snow reflectance evolves over time at different time scales: it can change abruptly in few hours, and it also exhibits daily, monthly, and seasonal variations, along with long-term variations (trend) [8]. Moreover, in areas with a shallow snow cover and where snow melt is ubiquitous, the albedo of the surface varies over the summer with the exposition of bare soil. Although high-resolution satellite sensors may provide an accurate instantaneous picture of the land cover, their low temporal resolution is a serious drawback to obtain long time series with sufficient temporal resolution. When using mid-resolution satellite sensors, the sole estimation of a mean albedo in such cases provides a poor description of the real picture. For example, a decrease in albedo can be due to the metamorphization of the snow or to an increase of the abundance of bare soil. On the other hand, albedo can increase because of new fresh snow or to an increase of the area covered by snow.
The aim of this work is to provide a precise description of the land cover evolution and its driving mechanisms over Deception Island, Antarctica. In order to do so we will show that the combined use of satellite and field shortwave broadband albedo measurements (albedo integrated in the range 300-3000 nm) can provide an accurate description of the land cover over an Antarctic site. The advantage of the method presented lies in the fact that field measurements are easy to carry out, the equipment being rough, light and easy to transport over snowed and iced areas.
The results of this investigation can open new ways to tackle the problem of how to increase surface albedo in the framework of the so called solar radiation management, one branch of the Geoengineering focused on increasing the amount of solar radiation reflected to the atmosphere [9,10,11].

2. Materials and Methods

In this section we describe the materials (study area, in-situ and field data and satellite data) and the methodology (data processing).

2.1. Study area

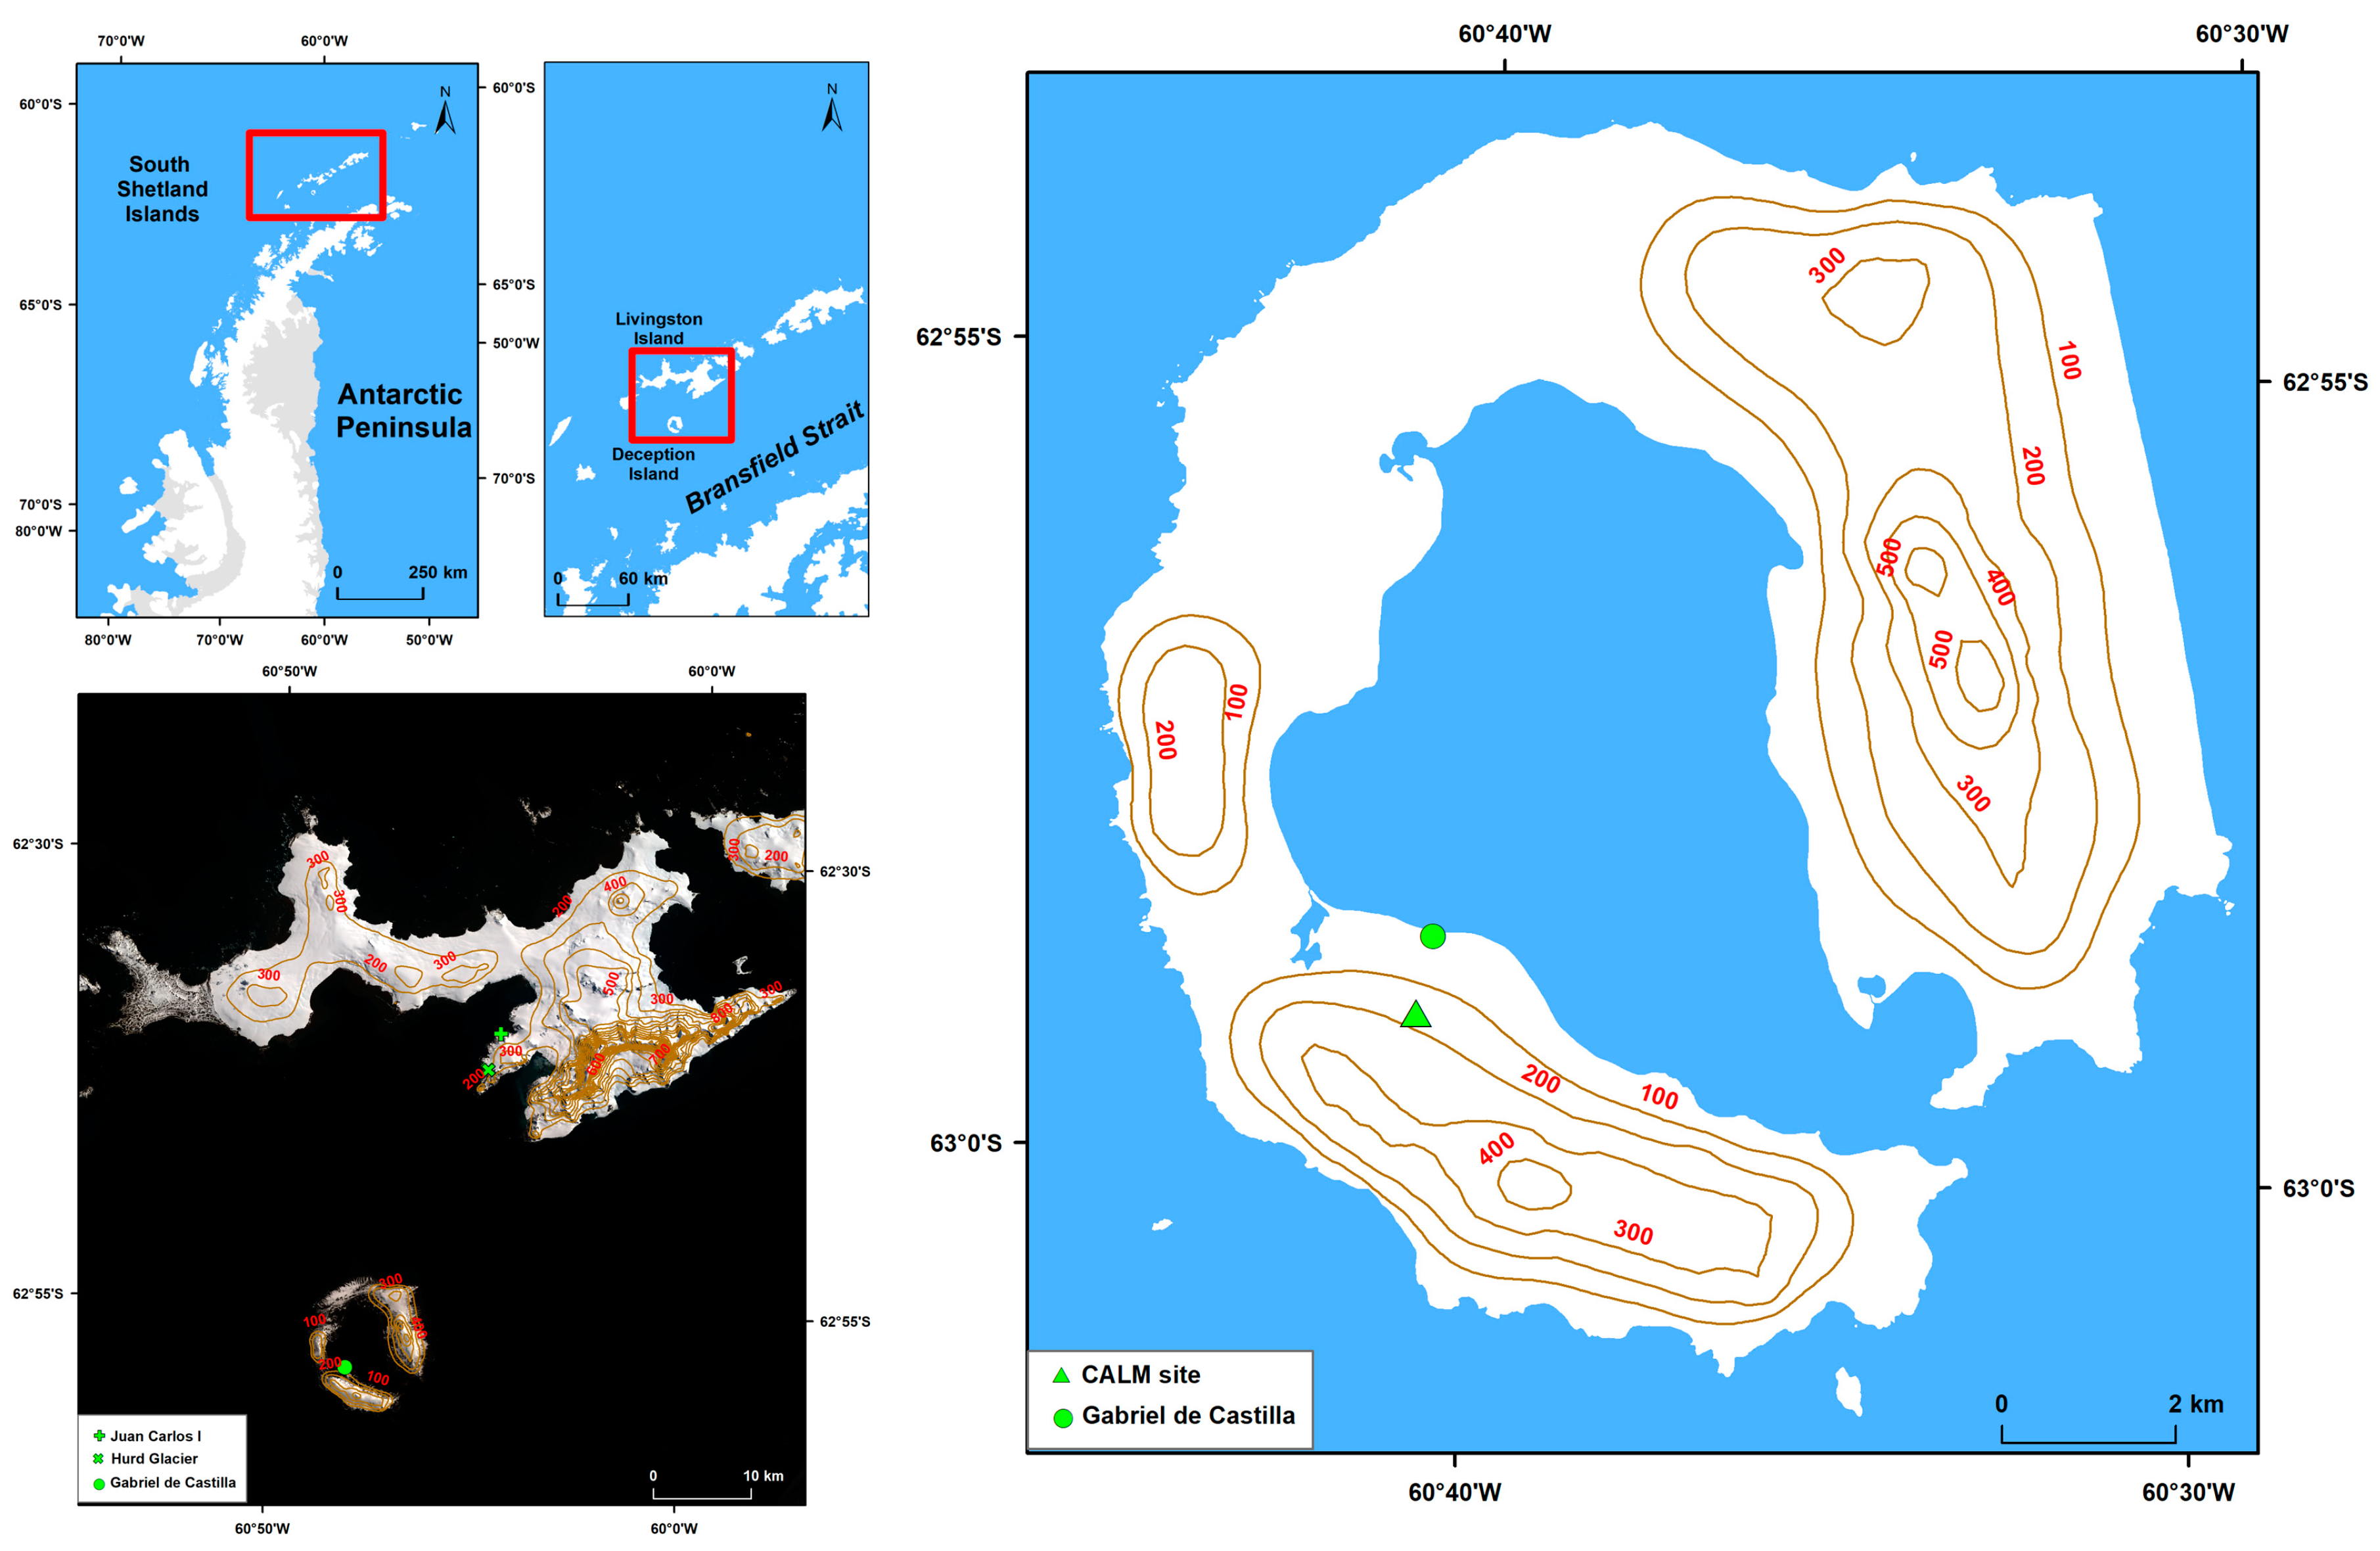
The study area is Deception Island, located in the South Shetland Islands Archipelago, on the NW coast of the Antarctic Peninsula (Figure 1). Deception Island is an active volcano with three recent eruptions in 1967, 1969 and 1970 [12] and unrest episodes in 1992, 1997 and 2015 [13,14]. As a result of recent eruptions, Deception Island is covered by volcanic ash and pyroclasts, and many of the glaciers remain ash-covered today. The soils are composed of ashes and pyroclasts with high porosity [6]. It has areas of dark soil of varying extension during summer as well as large areas of snow covered by volcanic ash and lapilli. The changing mixture of bare soil and snow/ice makes it a suitable location for detecting changes in the land cover. The Spanish Antarctic Station Gabriel de Castilla is located on the island, providing access and long-term series of meteorological observations. The climate is cold oceanic, with frequent summer rainfall, a moderate annual temperature range (10℃ monthly mean deviations) and mean annual air temperatures close to -3℃ at sea level [15]. A CALM (Circumpolar Active Layer Monitoring) site (The Crater Lake CALM-S) is located on the island to monitor the status of the permafrost active layer; it is placed in a small and relatively flat plateau-like step covered by volcanic and pyroclastic sediments at 85 m a.s.l. (62°59′06.7″ S, 60°40′44.8″ W).

2.2. In-situ and field data

We have used data from three Automatic Weather Stations (AWS) and data collected over different locations on Deception Island with a portable albedometer. The data collected with the portable albedometer will be referred to as field data from now on.
Two AWSs are located on Livingston Island (Figure 1, Table 1): one close to Juan Carlos I Station (JCI AWS), one located on Hurd Glacier (HG AWS); the third AWS is in the vicinity of Gabriel de Castilla Antarctic Station on Deception Island (GdC AWS) (Figure 1, Table 1). From JCI and HG AWSs we used radiation data of 25/01/2019, 31/01/2019, 1/02/2019 for the calibration of field albedo measurements, as explained in Appendix B. The calibration could not be carried out on Deception Island because the GdC AWS does not provide reflected shortwave radiation data.
GdC AWS has been providing air temperature and incident sun radiation data every 10 minutes since 1/09/2005 [16]. The air temperature and the radiation data from GdC AWS are going to be used to study the evolution of albedo and landscape units as a function of radiation and temperature. All the data from JCI and GdC AWSs can be downloaded from the AEMET (Spanish Meteorological Service) webpage [16].
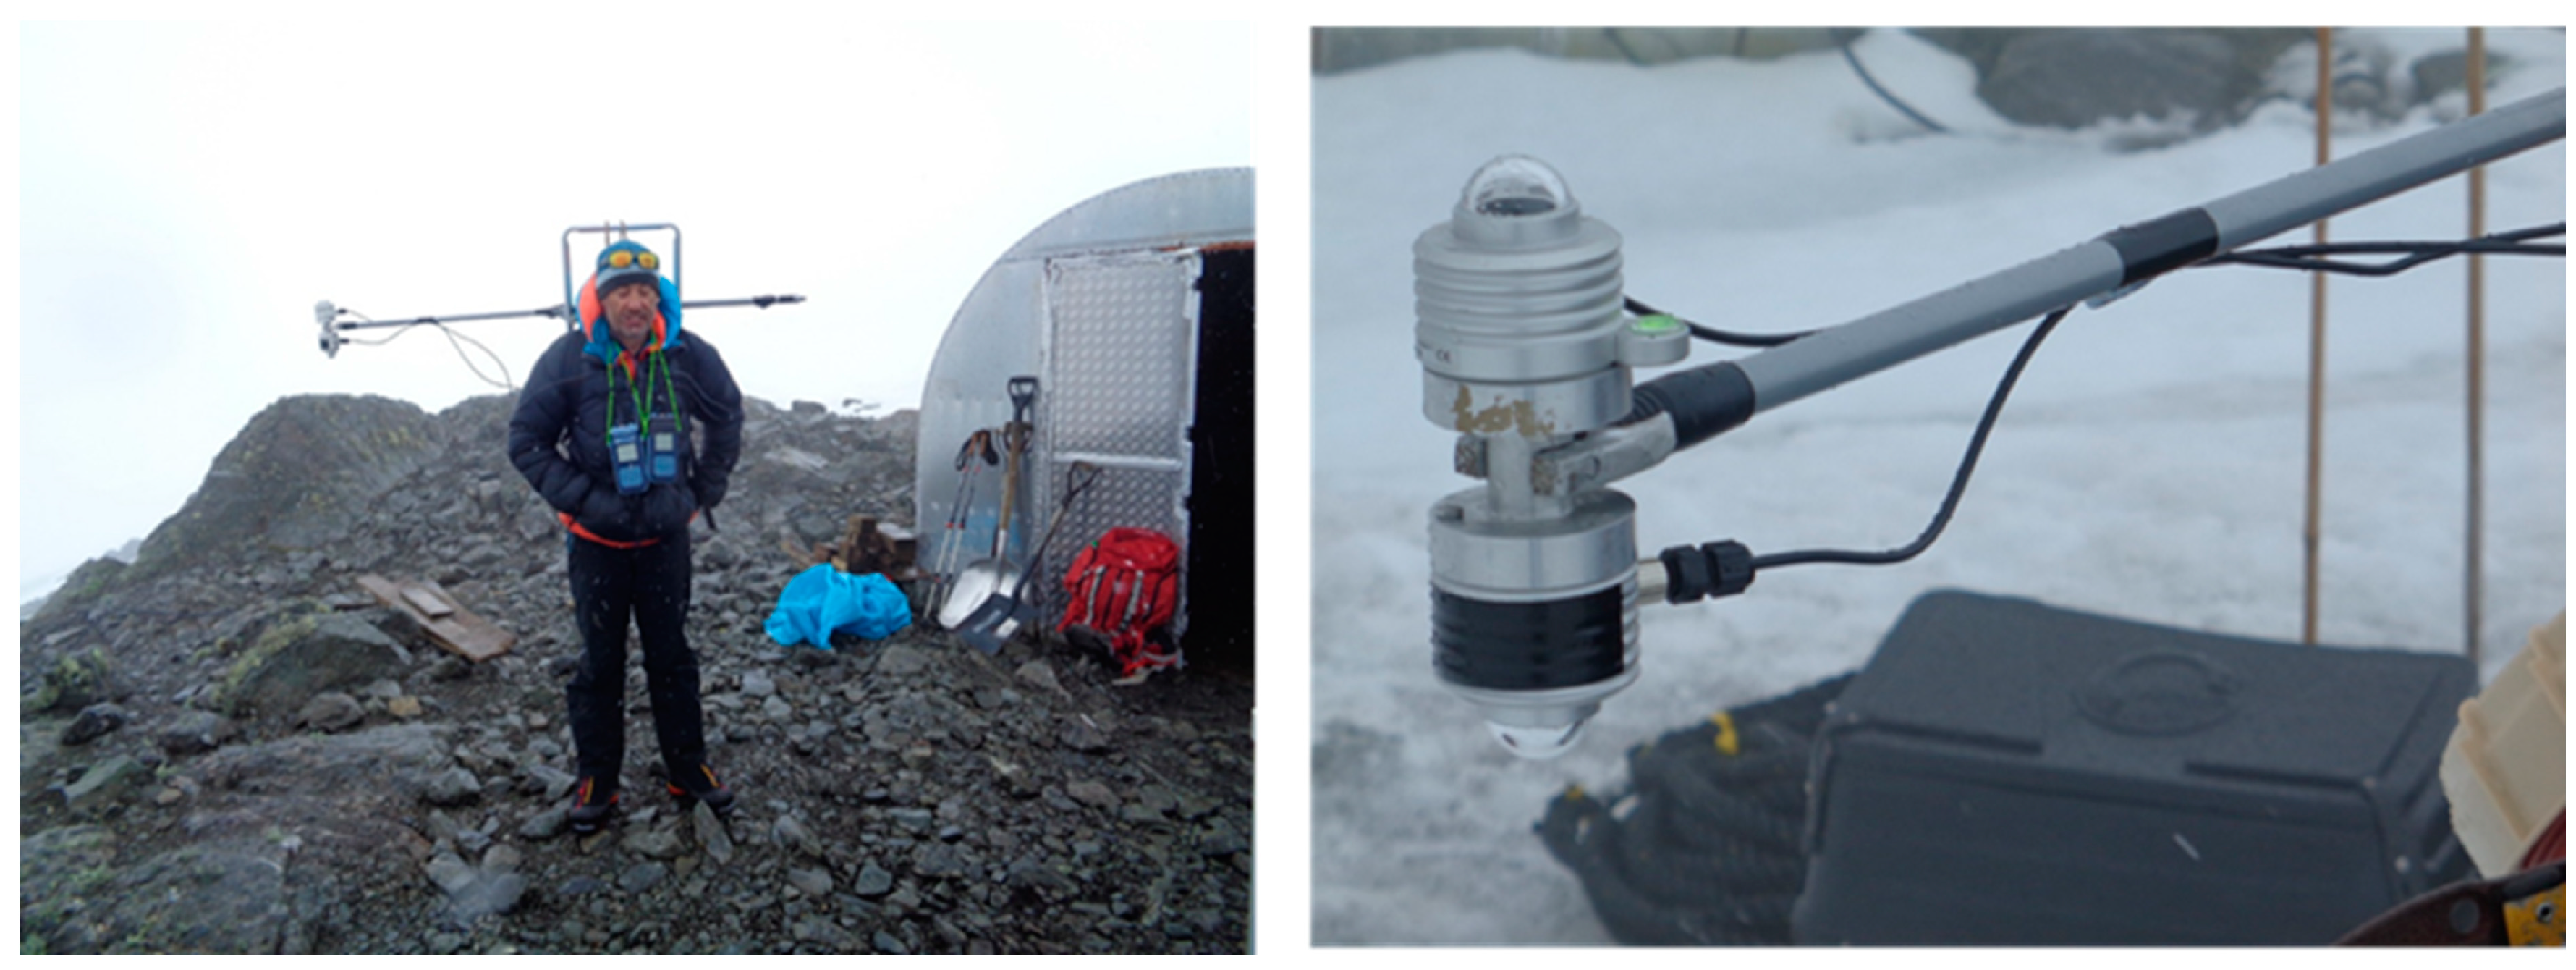
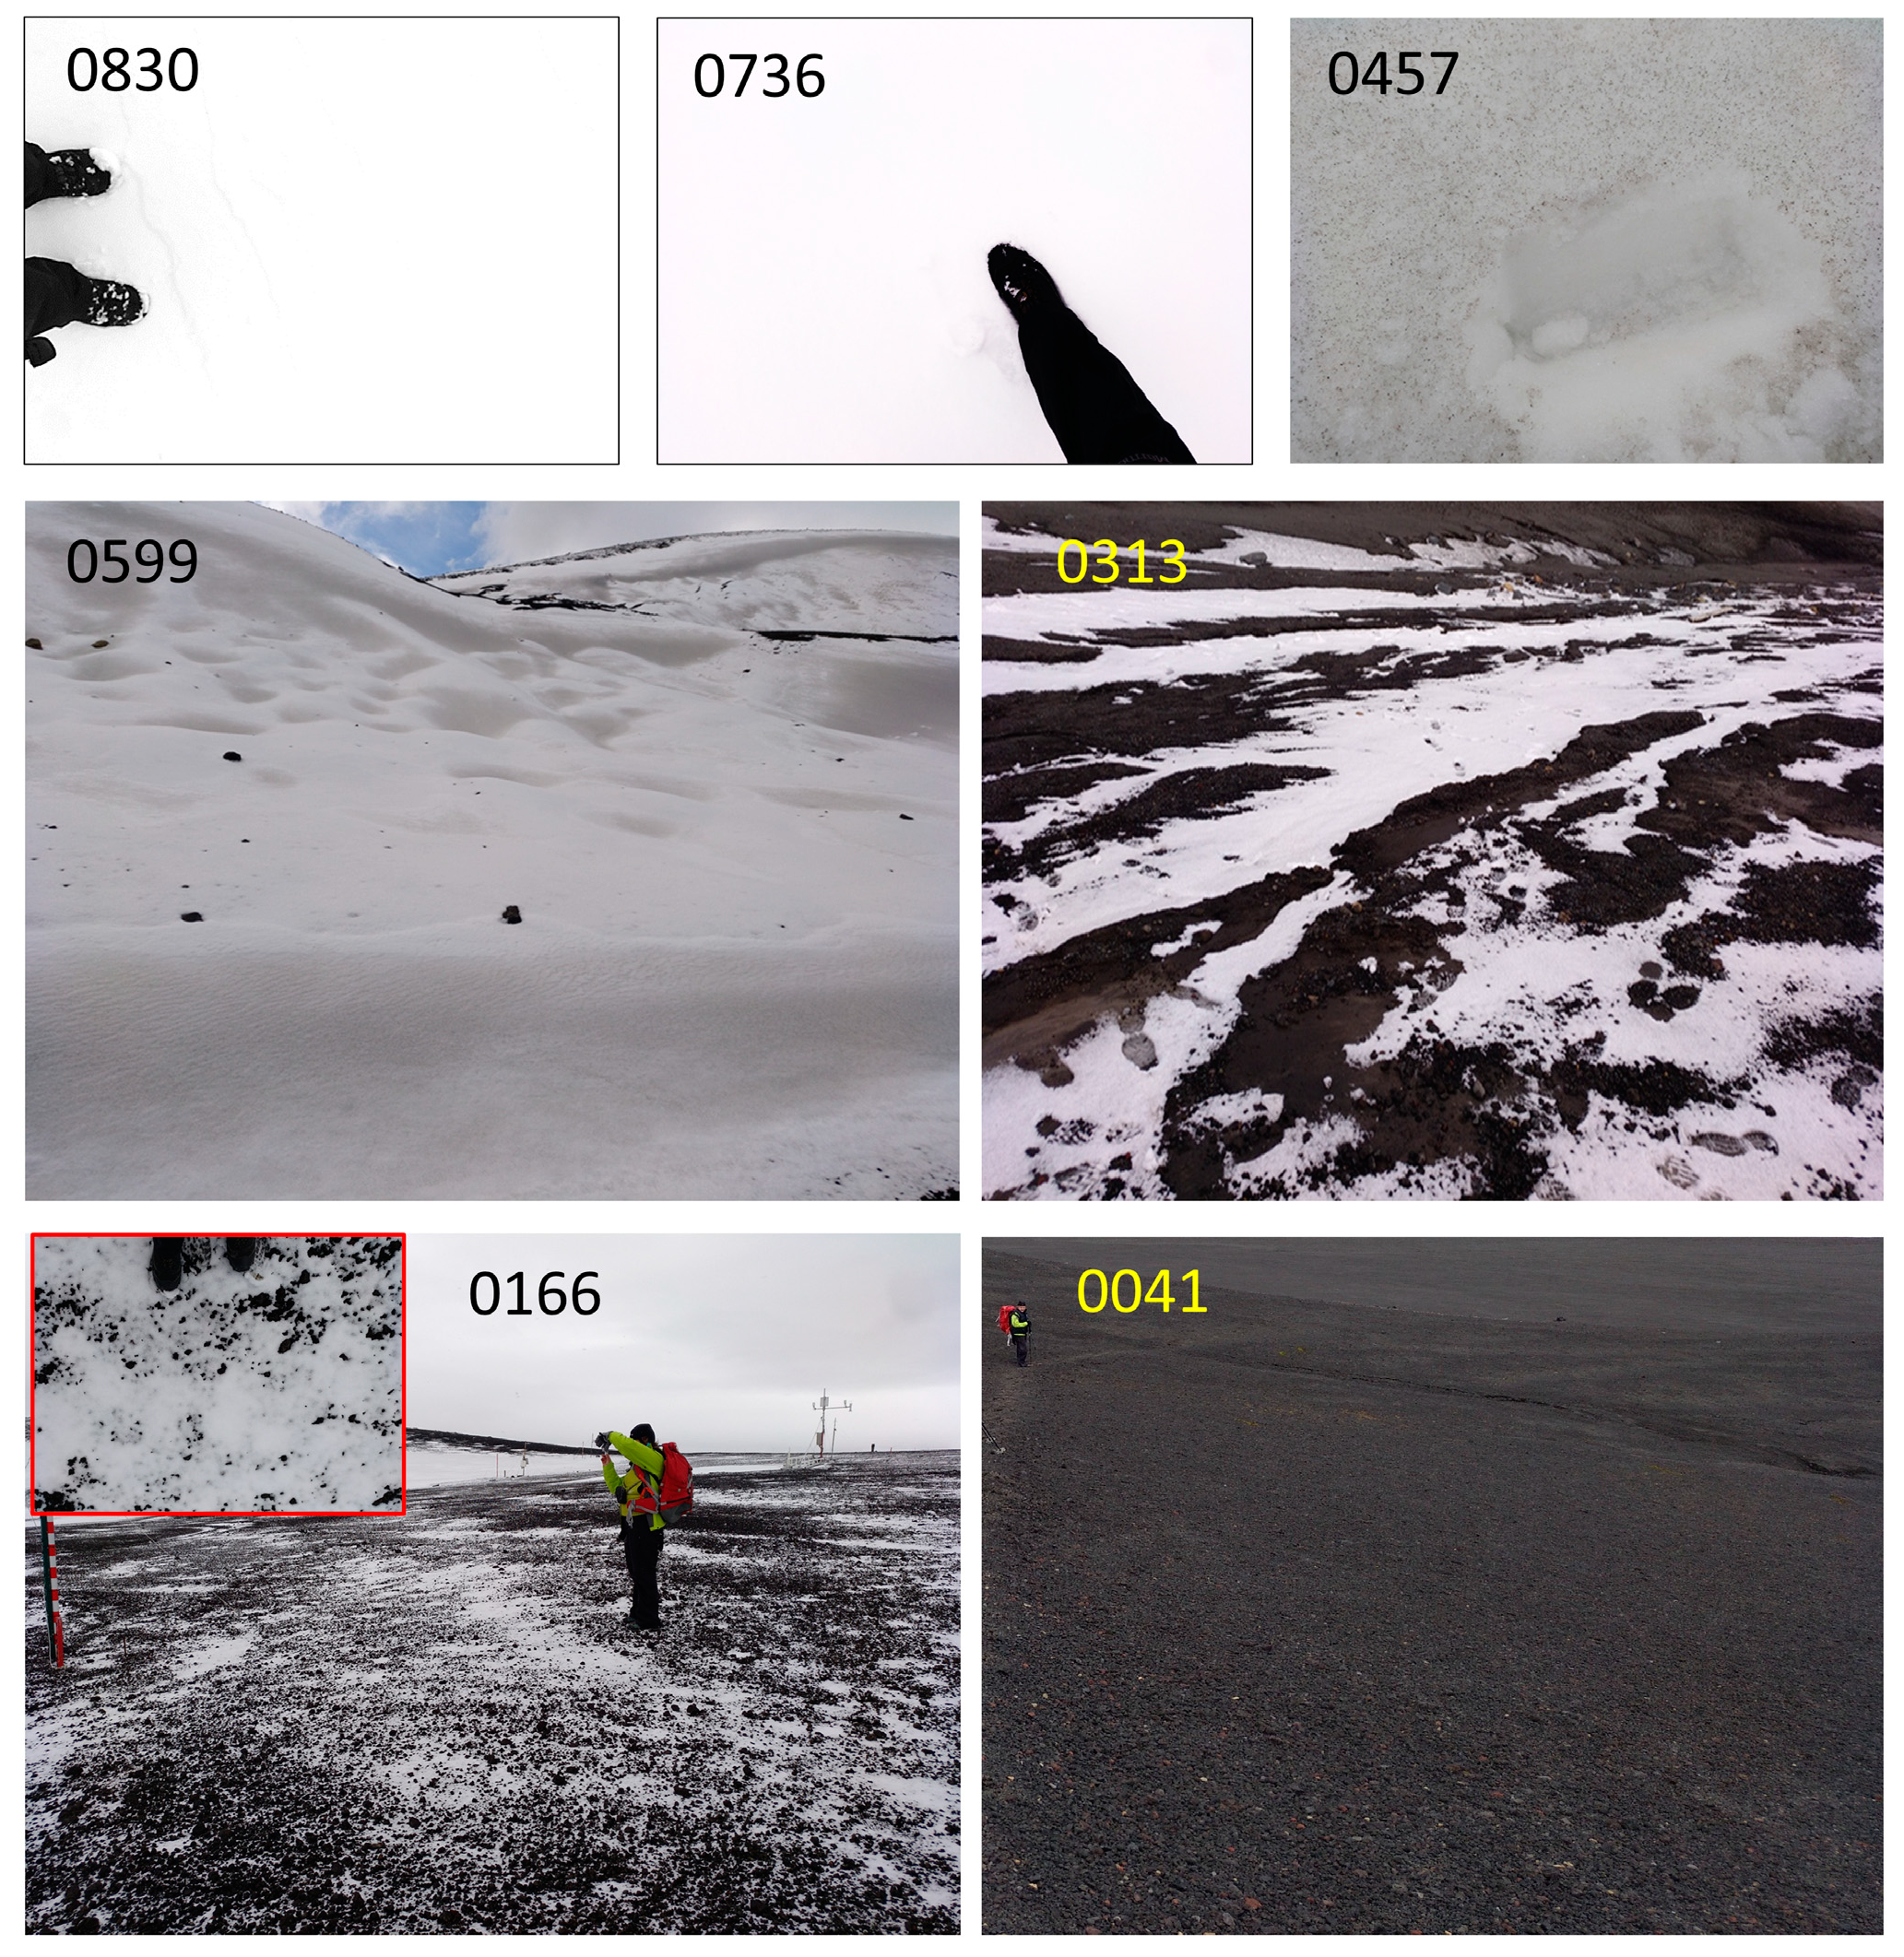
We also collected field albedo data in January and February 2019 over different locations on Deception Island. Field albedo measurements were carried out using a homemade portable albedometer consisting of two pyranometers, one facing the sky and another facing the surface, and two synchronized dataloggers (Figure 2). We used Class C DeltaOHM LPPYRA03 pyranometers, based on the thermopile principle, with a viewing solid angle of 2π sr, a spectral range of 300−2800 nm, and HD2102.2 DeltaOHM dataloggers. The pyranometers are rigidly attached to a pole which is in turn rigidly attached to a back rack carried by the researcher. The ratio of the signal from the pyranometer facing the surface to the signal of the pyranometer facing the sky provides the albedo of the surface. Sampling frequency was 0.2 Hz. The selected sampling sites were flat and the pyranometers were kept horizontal by visual inspection using a bubble level. Measurements were carried out on different locations inside each sampling site to obtain the albedo variation due to surface changes. Data were collected while standing still with the portable albedometer carried as shown in Figure 2 and around local noon. Seven sampling sites were chosen corresponding to seven landscape units representative of the landscape of Deception Island. The selection of the landscape units was done following the expert criteria, taking into account the definition of landscape unit as a homogeneous tract of land at the scale at issue [17]. In this work we are going to use data from a spaceborne sensor with a spatial resolution of 500 m. The chosen landscape units spread over areas with a characteristic length of at least that size. The landscape units and their identification codes are (Figure 3, Table 2): continuous clean fresh snow (0830); continuous clean old snow (0736); rugged landscape composed of dirty snow with disperse pyroclasts and rocky outcrops (0599); continuous dirty snow (0457); stripped mixture of snow and bare soil (0313); shallow snow with small bare soil patches (0166); continuous bare soil (0041). The identification code of each landscape unit is the mean value of the broadband albedo; this will make the reading easier. Although both 0313 and 0166 are a mixture of bare soil and shallow snow, they differ in the distribution pattern of snow and bare soil and they coexist along the season. Clean fresh snow is barely seen over Deception Island in the months of January and February, when data were collected. We took advantage of a snowfall event on February 13 2019 to sample some clean fresh snow that disappeared very quickly. We assume that this kind of land cover can be present at the beginning of the season, so we include it as a landscape unit. Landscape unit 0166 appears as a consequence of light snow events covering bare soil areas.

2.3. Satellite data

MODIS daily albedo product MCD43A3 (C6) was used in this work [18]. The time span is from the 2000-2001 season to the 2020-2021 season. Only data with Sun Zenith Angle (SZA) < 75⁰ are considered, this means that a season spans from September 1 of a year to March 31 of the next year. Data were downloaded using the Google Earth Engine API [19]. MCD43A3 includes one band of shortwave Black Sky Albedo (BSA), and one band of shortwave White Sky Albedo (WSA). In this work we present the results obtained using the shortwave BSA band. The actual albedo of the surface, the so-called blue-sky albedo can be obtained from WSA and BSA as:
α = d × W S A + 1 d × B S A
Where the calculation of the actual blue-sky albedo α requires the fraction of diffuse radiation (d in Equration (1)). The maximum relative difference between WSA and BSA in this work is 3 %. The relative difference between α and BSA and α and WSA is below that value [20]. So, we take BSA as the blue-sky albedo in this work.

2.4. Methods

In this section we describe the processing of in-situ and field data to obtain the albedo normal distribution of each landscape unit, the satellite data processing to calculate the monthly average albedo and the corresponding monthly histogram, and the fit of the monthly average histogram to the normal distributions of the landscape units.

2.4.1. In-situ and field data processing

Regarding the data form the GdC AWS, daily means were calculated only if data were available for at least 80% of the 10- minute daily data, and monthly and seasonal means of meteorological variables were calculated only if daily means were available for at least 80% of the days [21].
Regarding field albedo measurements with the portable albedometer, we have to be sure that the variations in the albedo inside a sampling site are exclusively due to variations in the surface. While soil albedo is known to be insensitive to changes in incident irradiance [22], snow albedo depends to a great extent on cloudiness [23,24]. Furthermore, because we intend to describe each landscape unit by a normal distribution, we must be able to establish the minimum albedo variation that can be detected with the portable albedometer, in order to ensure that the standard deviation of the normal distribution is above the minimum albedo variation that can be measured. Because of time constraints and logistics during the Antarctic campaign, some of the albedo measurements had to be done under cloudy conditions. Because these data are going to be compared with satellite data, which are supposed to be cloud-free, field albedo data must be corrected for the effect of clouds. In general, field albedo measurements are affected by the following factors:
  • Fluctuations due to incident irradiance fluctuations (changes in the incident irradiance during the sample collection due to varying atmospheric conditions or to uncontrolled tilt of the pyranometers). Data must be corrected for this effect to ensure that albedo variations inside a sampling site are exclusively due to changes in the surface; the influence of fluctuations of incident irradiance on the albedo will also allow us to estimate the precision of the portable albedometer;
  • Bias caused by the experimental set-up (pyranometers model, influence of the body of the researcher carrying the pyranometers);
  • Cloudiness (field data are going to be compared with satellite data, which are supposed to be cloud-free data).
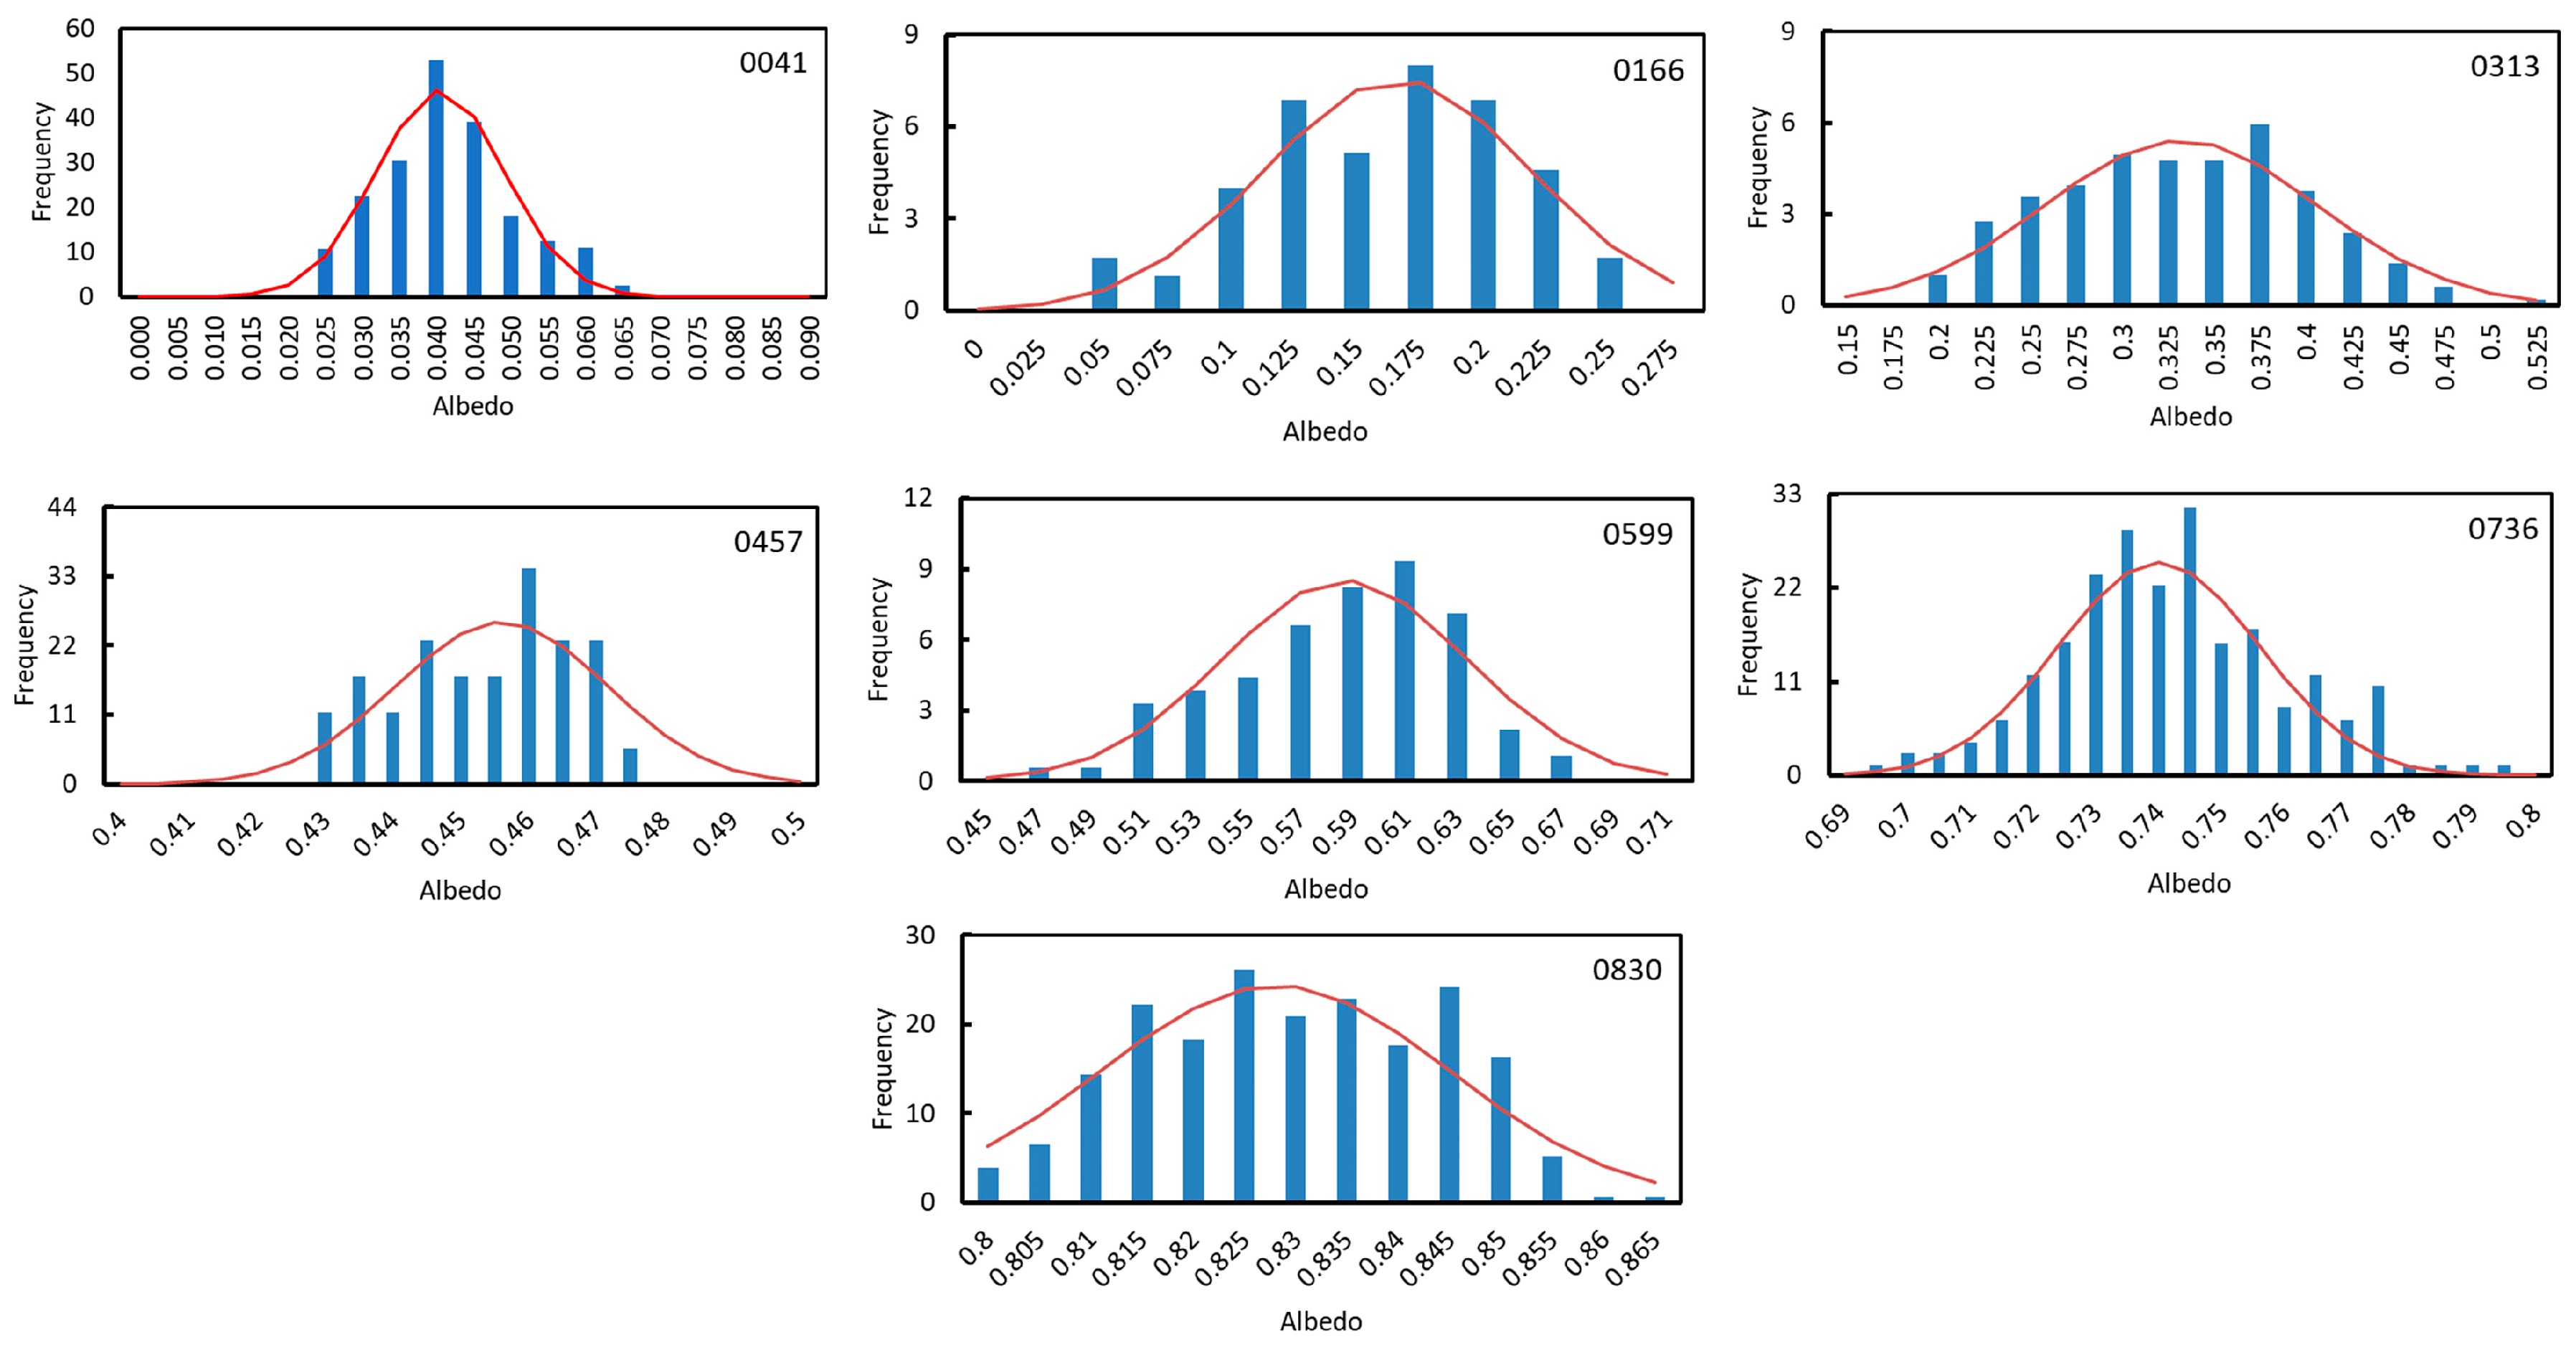
The detailed description of these points is provided in Appendix B. In this work, field albedo data were only corrected for fluctuations in the incident irradiance. Bias and cloudiness are introduced as uncertainties in the albedo and their impact is discussed in Appendix B. This is because a correction of bias and cloudiness for each cover type is impossible, but we can still estimate uncertainties. In Appendix B we demonstrate that although bias and clouds have an impact on the values of the albedo, the general trends and the discussion of the results of this work are not affected by them. Taking into account these considerations, after collecting the samples, we proceeded as follows: 1) Estimation of albedo fluctuations due to changes in incident irradiance, 2) data filtering and calculation of histograms, and fit to normal distributions. Data sets from each sampling site were filtered eliminating outliers in incident and reflected irradiance until building a set with a Coefficient of Variation of incident irradiance below 6% to ensure that the variations in albedo are exclusively due to changes in the surface (Appendix B). Then, we checked that there was no correlation between the incident irradiance and the albedo. With the remaining data set we built a histogram for each landscape unit L (L = 0041, 0166, 0313, 0457, 0599, 0736, 0830). Each histogram was fitted to a normal distribution N μ L , σ L . The results are shown in Table 2 and Figure 4.

2.4.2. Satellite data processing

We have calculated monthly averages from September to March. We calculated the monthly average of a pixel only if two conditions are met: 1) there are at least 4 albedo data points in the month; 2) the time interval between the first and the last data point is larger than 15 days. These conditions were established to ensure that the mean average tracks the evolution of the snow cover: we have at least 4 albedo data points and they are evenly distributed over the month. The resulting monthly average image has several gaps because many pixels do not meet the conditions above. Several gap-filling algorithms have been proposed, but we are not using them to avoid artifacts in the data. We instead devised a procedure to label a given monthly image as representative of the island. We divided Deception Island in 16 sectors of the same size and calculated, for each monthly average image, the number of pixels with data in each sector. A sector is considered representative if the percentage of pixels with data is above 20%. Then, for an image to be taken as representative of the whole island, at least 10 sectors (out of 16) must have been labeled as representative. We are aware that this procedure reduces the number of months available for the analysis, but on the other hand, we assure that no artifacts are introduced due to an excessive data processing. Once a monthly average albedo image was labeled as representative of Deception Island, a histogram of the frequency of albedo was built. We also calculated, for each representative image, the mean monthly albedo over Deception Island, which will be called <α> from now on.

2.4.3. Satellite albedo histogram fit to field albedo normal distributions.

To estimate the contribution of each landscape unit, characterized by a normal distribution, to the satellite data, a linear combination of the probability density function of each normal distribution is performed.
Let M be a month and S a season (M = S, O, N, D, J, F, M; S = 2000-2001, 2001-2002, …, 2020-2021), and let L denote a landscape unit (L = 0041, 0166, 0313, 0457, 0599, 0736, 0830). The probability density function of each landscape unit L was calculated as explained in Section 2.4.1., and a histogram that shows the frequency of pixels of each bin of MODIS monthly mean was constructed following the procedure explained in Section 2.4.2. We denote by HiMS the frequency of bin i for month M and season S in the MODIS histogram.
The area below the normal distribution of landscape unit L in each bin HiMS is calculated from the corresponding probability density function.
F L x i M S F L x i 1 M S = 1 σ L 2 π x i 1 M S x i M S e u μ L 2 2 σ L 2 d u ,   L = 0041 ,   0166 ,   0313 ,   0457 ,   0599 ,   0736 ,   0830 ;     i = 1 , , N
with F L x the probability density function of landscape unit L. N is the number of bins, μ L and σ L are the mean albedo and the standard deviation of the normal distribution of landscape unit L respectively, u denotes the albedo, and x i 1 M S , x i M S represents the i t h bin of the histogram of month M of season S.
Then, a linear combination of these areas is performed for each bin and the residuals from the pixels’ frequency are obtained.
r i M S = H i M S L a L M S F L x i M S F L x i 1 M S ,   i = 1 ,   . ,   N  
The coefficients of the linear combination ( a L M S ) are estimated minimizing the residuals using the least squares method. These coefficients are interpreted as the relative abundance of landscape unit L in month M of season S. Finally, the best fit of a linear combination of the normal distributions to each histogram is obtained. To validate the results of the fitting, the root-mean-square error (RMSE) of the residuals is calculated, obtaining a value of 5 % .
We then calculated the relative abundance of each landscape unit for each month (mean monthly relative abundance) in the period 2000-2001 to 2020-2021 as:
a L M = S = 1 N M a L M S N M
Where a L M is the relative abundance of landscape unit L in month M; NM is the number of months M in the study (see Table 3).
We also calculated the seasonal relative abundance as:
a L S = M a L M S N S
Where a L S is the abundance of landscape unit L in season S; NS is the number of representative months in season S (for example, 2012-2013 and 2013-2014 seasons are the only seasons with N2012-2013= N2013-2014 = 7).

3. Results

3.1. Field albedo data

The name of the landscape units, as well as the mean and the standard deviation of the normal distributions are given in Table 2. Each landscape unit is given the name of the mean albedo. In Figure 4 we show the histograms of the field measurements and the corresponding fits to a normal distribution. The landscape units with the larger standard deviation are those that consist of a mixture of bare soil and snow (0599, 0313, and 0166). On the other hand, those consisting of a single and continuous type of cover (0041, 0457, 0736, and 0830) exhibit a lower standard deviation.

3.2. MODIS data

The number of months meeting the representativeness criteria proposed in Section 2.4.2 over the period 2000-2001 to 2020-2021 is summarised in Table 3. The full list of representative months for each season is given in Table A1 of Appendix A. September is the only month labelled as representative for all the seasons.
The total number of months considered in this study is 106. Only seasons 2012-2013 and 2013-2014 have all the months labelled as representative. In the rest of the seasons there was at least one month that did not reach the label of representative. The low number of seasons with representative December, January and February months is due to the high cloudiness in the area in those months. Radiation data has been measured on JCI AWS since 1998 during summer months. Mean values of diffuse and global radiation and their ratio in the period 1998-2014 is shown in Table 4. Although these data correspond to Livingston Island, they can give an idea of the situation over the whole South Shetland Islands, including Deception Island.
The ratio of diffuse to global radiation is higher in December, January, and February, likely due to an increase of cloudiness in the area, explaining the low number of representative December, January, and February months. However, due to the high number of March months (NM = 19 for March, Table 3), we consider that the resulting month distribution is sufficient to be used to track the albedo evolution over the whole season. Moreover, in Section 3.4 we will show that the results obtained for seasons 2012-2013 and 2013-2014 agree with those obtained using the whole set of data, indicating that the missing months do not affect the general discussion.

3.3. MODIS albedo and air temperature

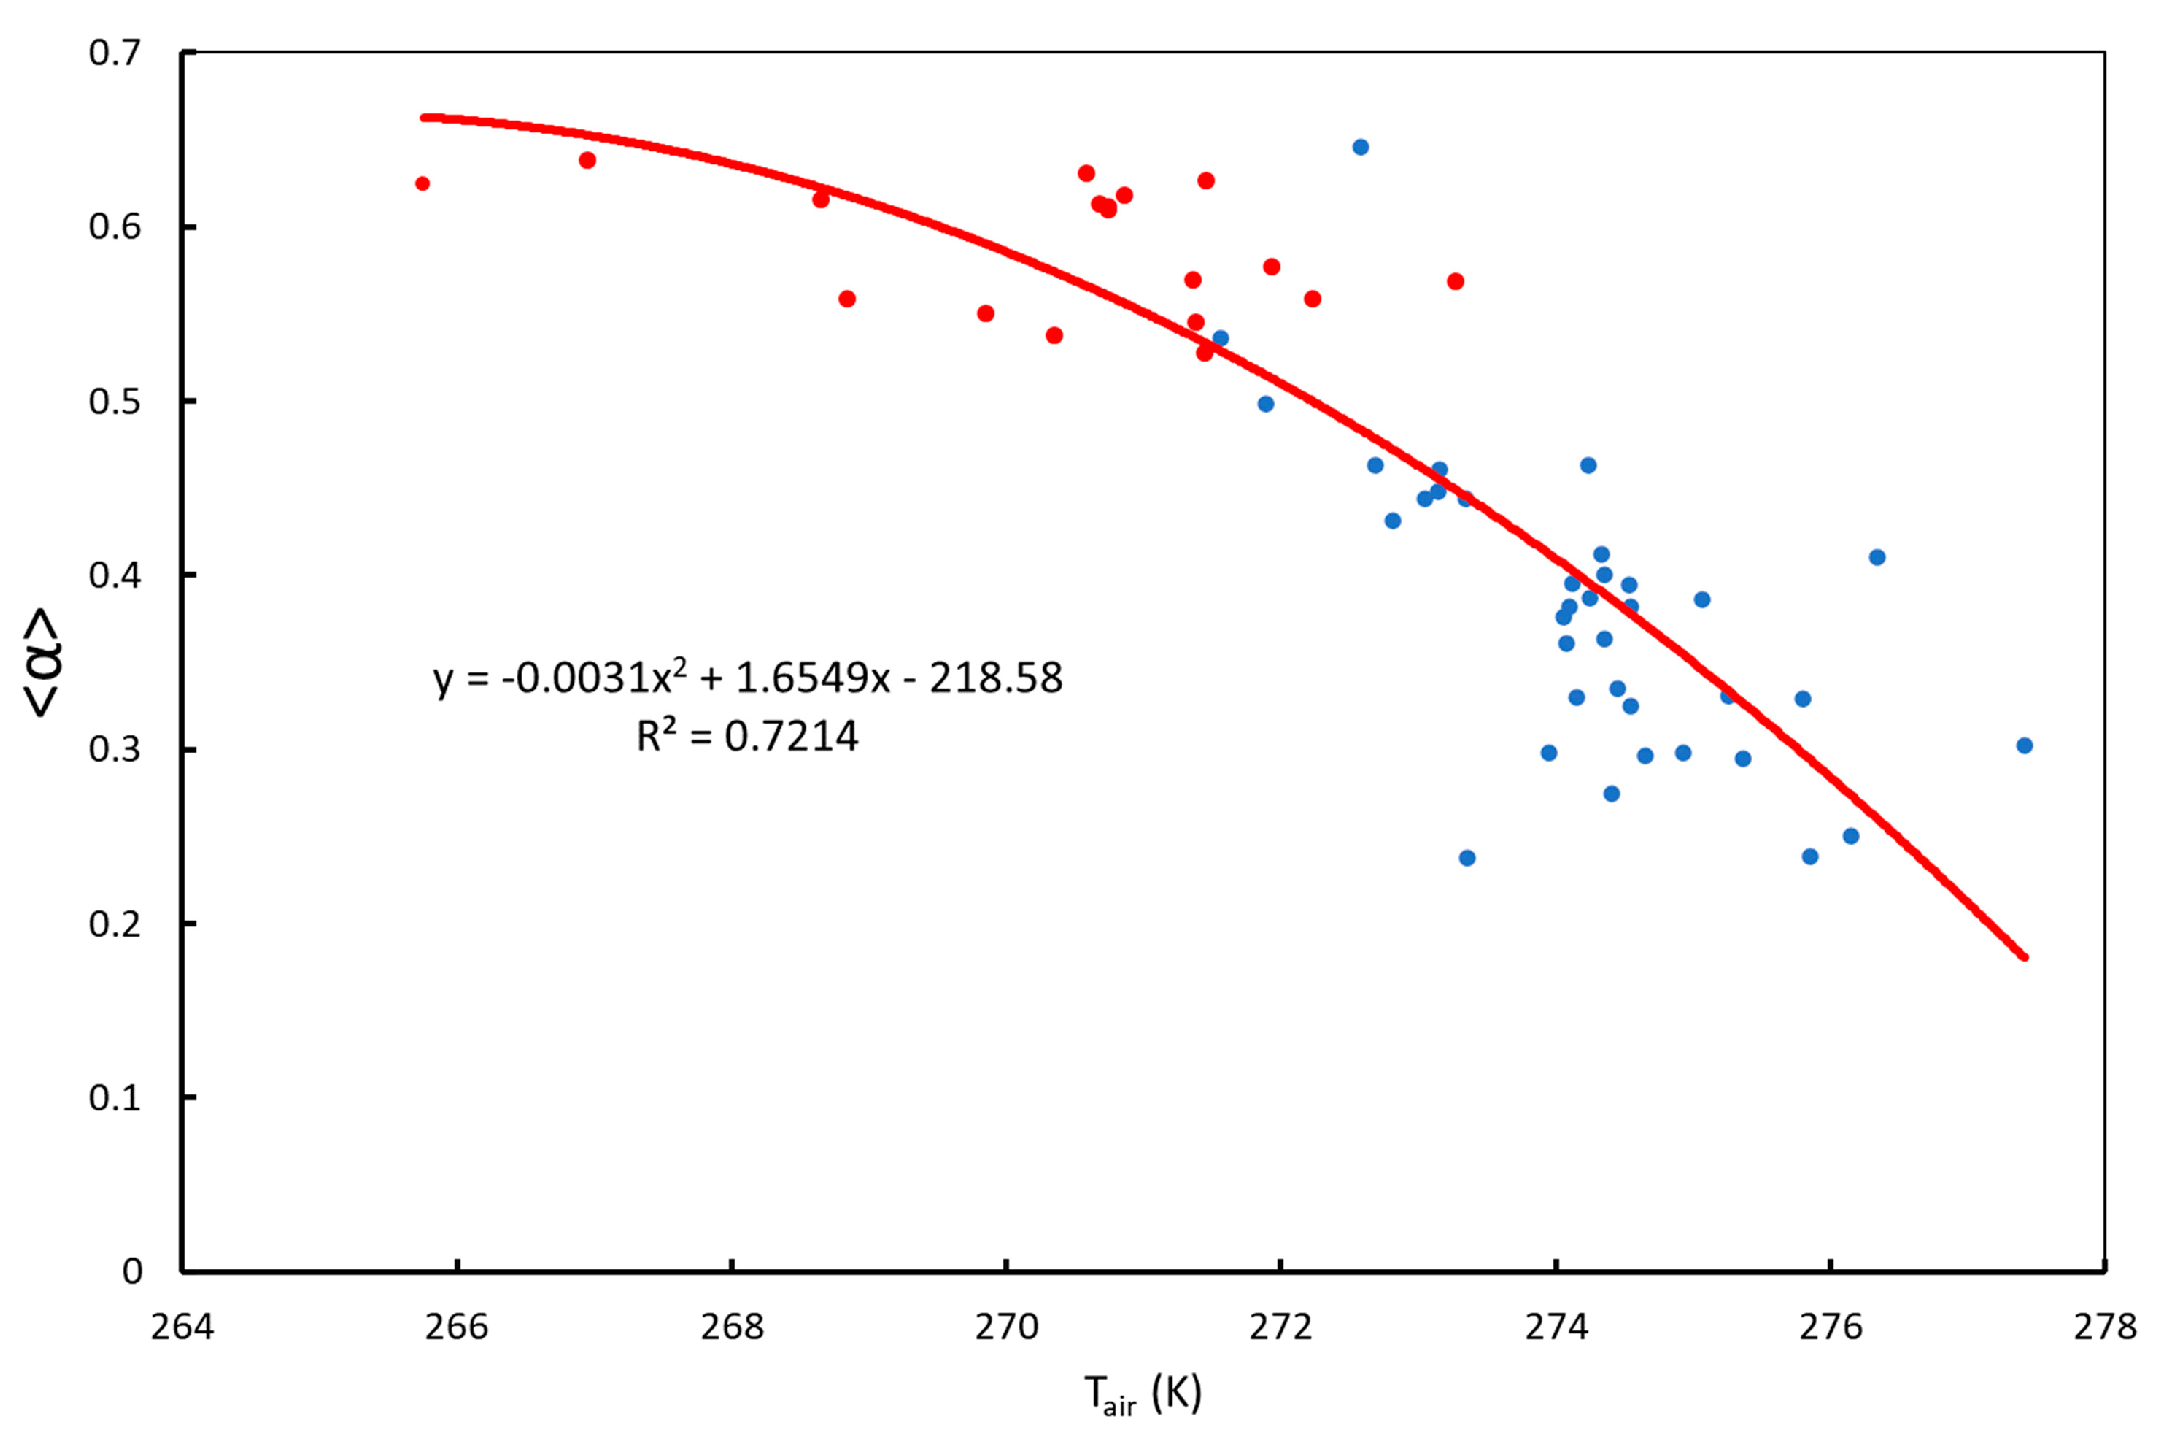
The mean monthly albedo (<α>) against the mean monthly air temperature from GdC AWS in the period 2006-2007 to 2020-2021 is shown in Figure 5. Monthly mean albedo decreases with temperature, at a rate that increases with increasing temperature. The mean monthly albedo attains a maximum value between 0.6 and 0.7.

3.4. Relative abundance of landscape units

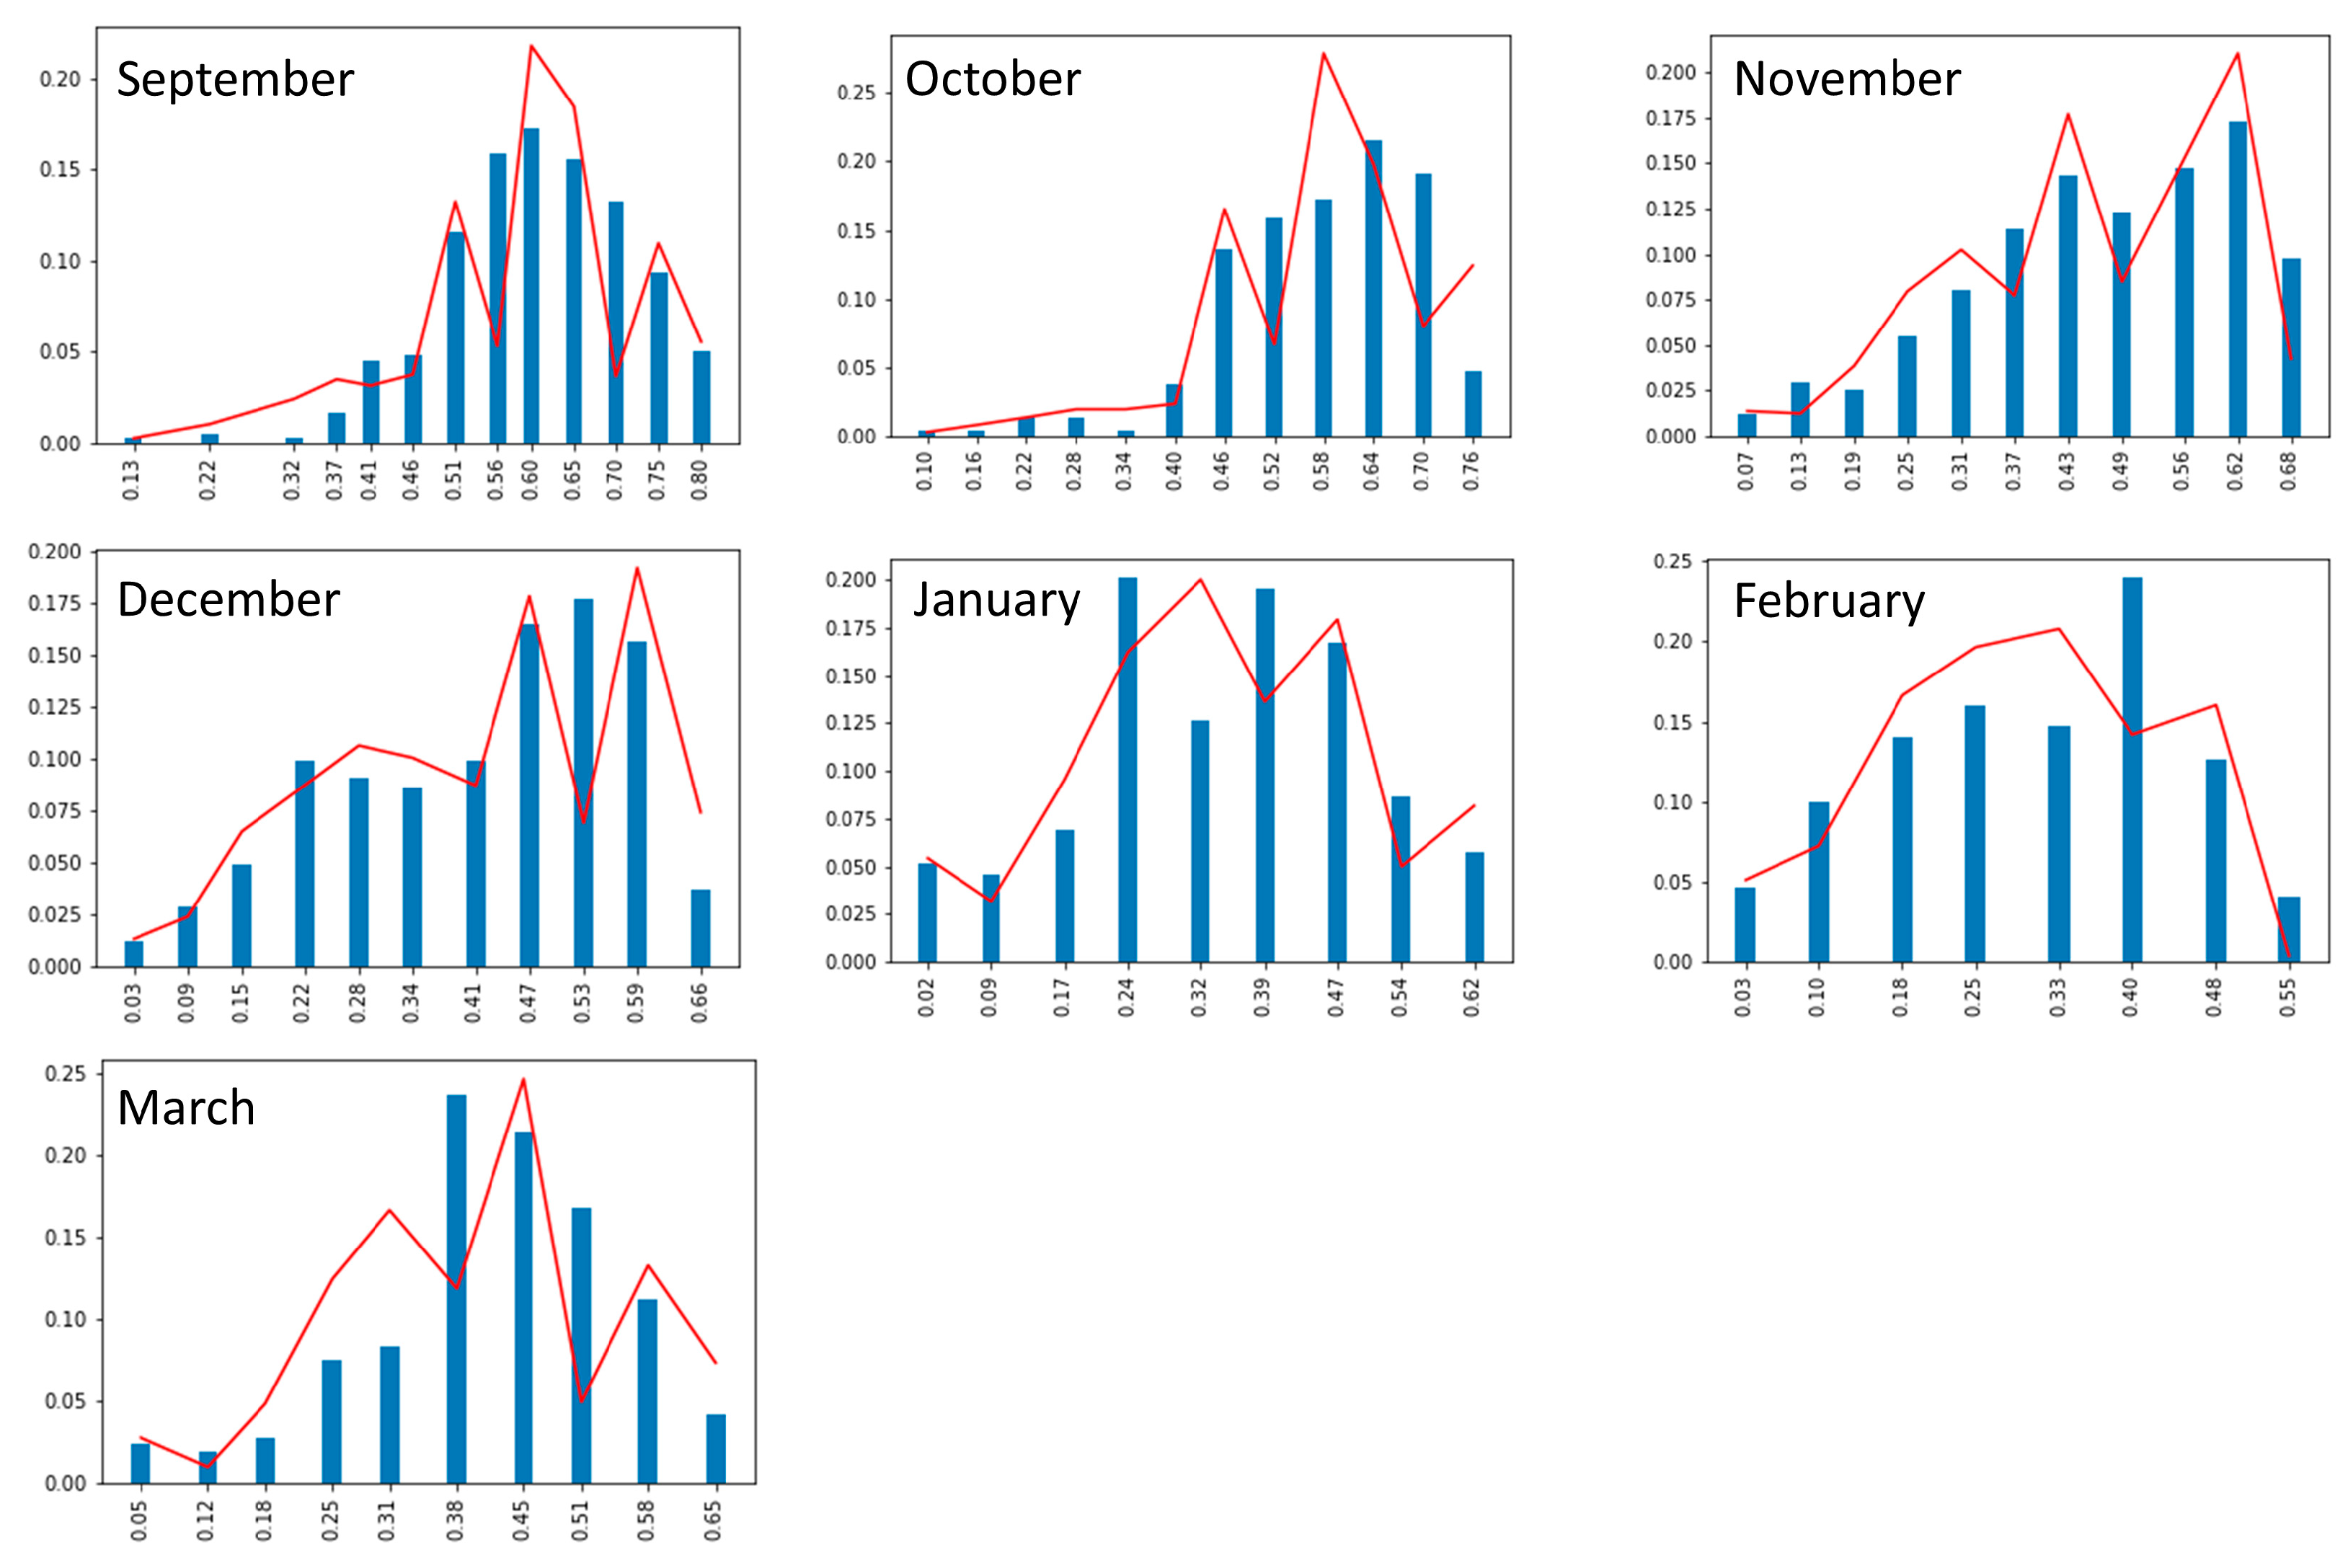
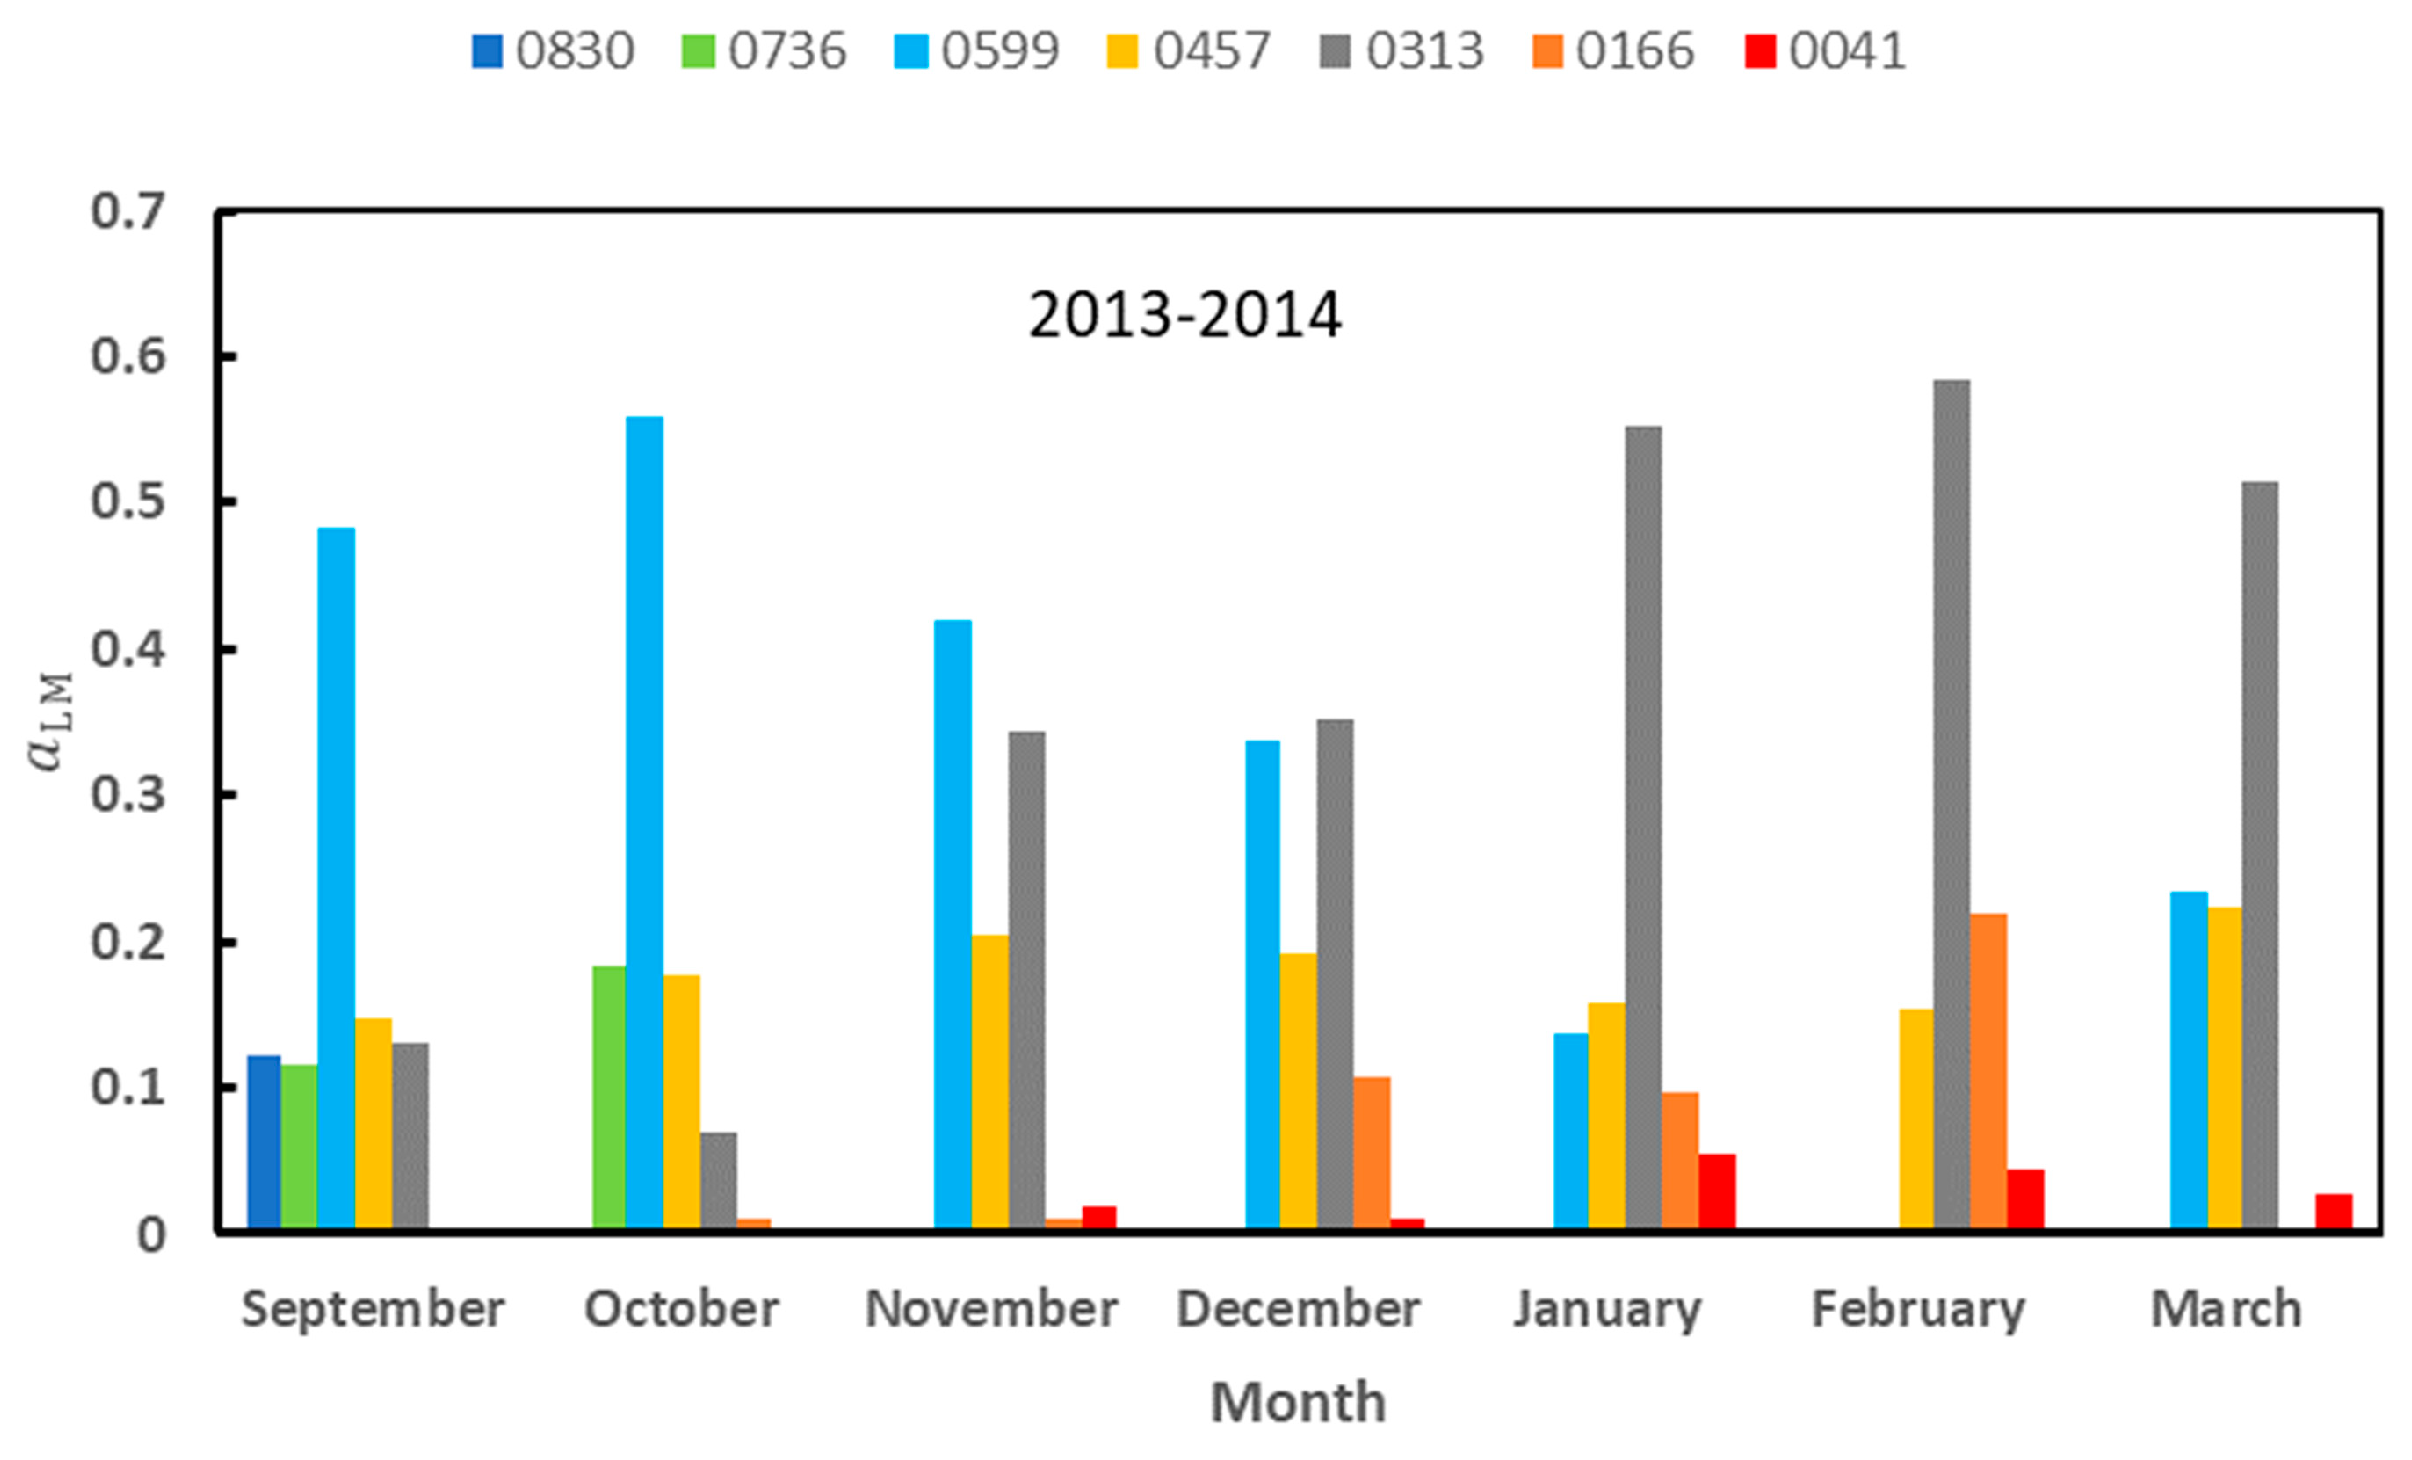
For each landscape unit we calculated the monthly relative abundance (relative abundance of landscape unit L in month M of season S) a L M S as explained in Section 2.4.3. As an example, in Figure 6 we show the albedo histograms and the corresponding fit to a linear combination of N μ L , σ L for the 2013-2014 season.

3.4.1. Mean monthly relative abundance

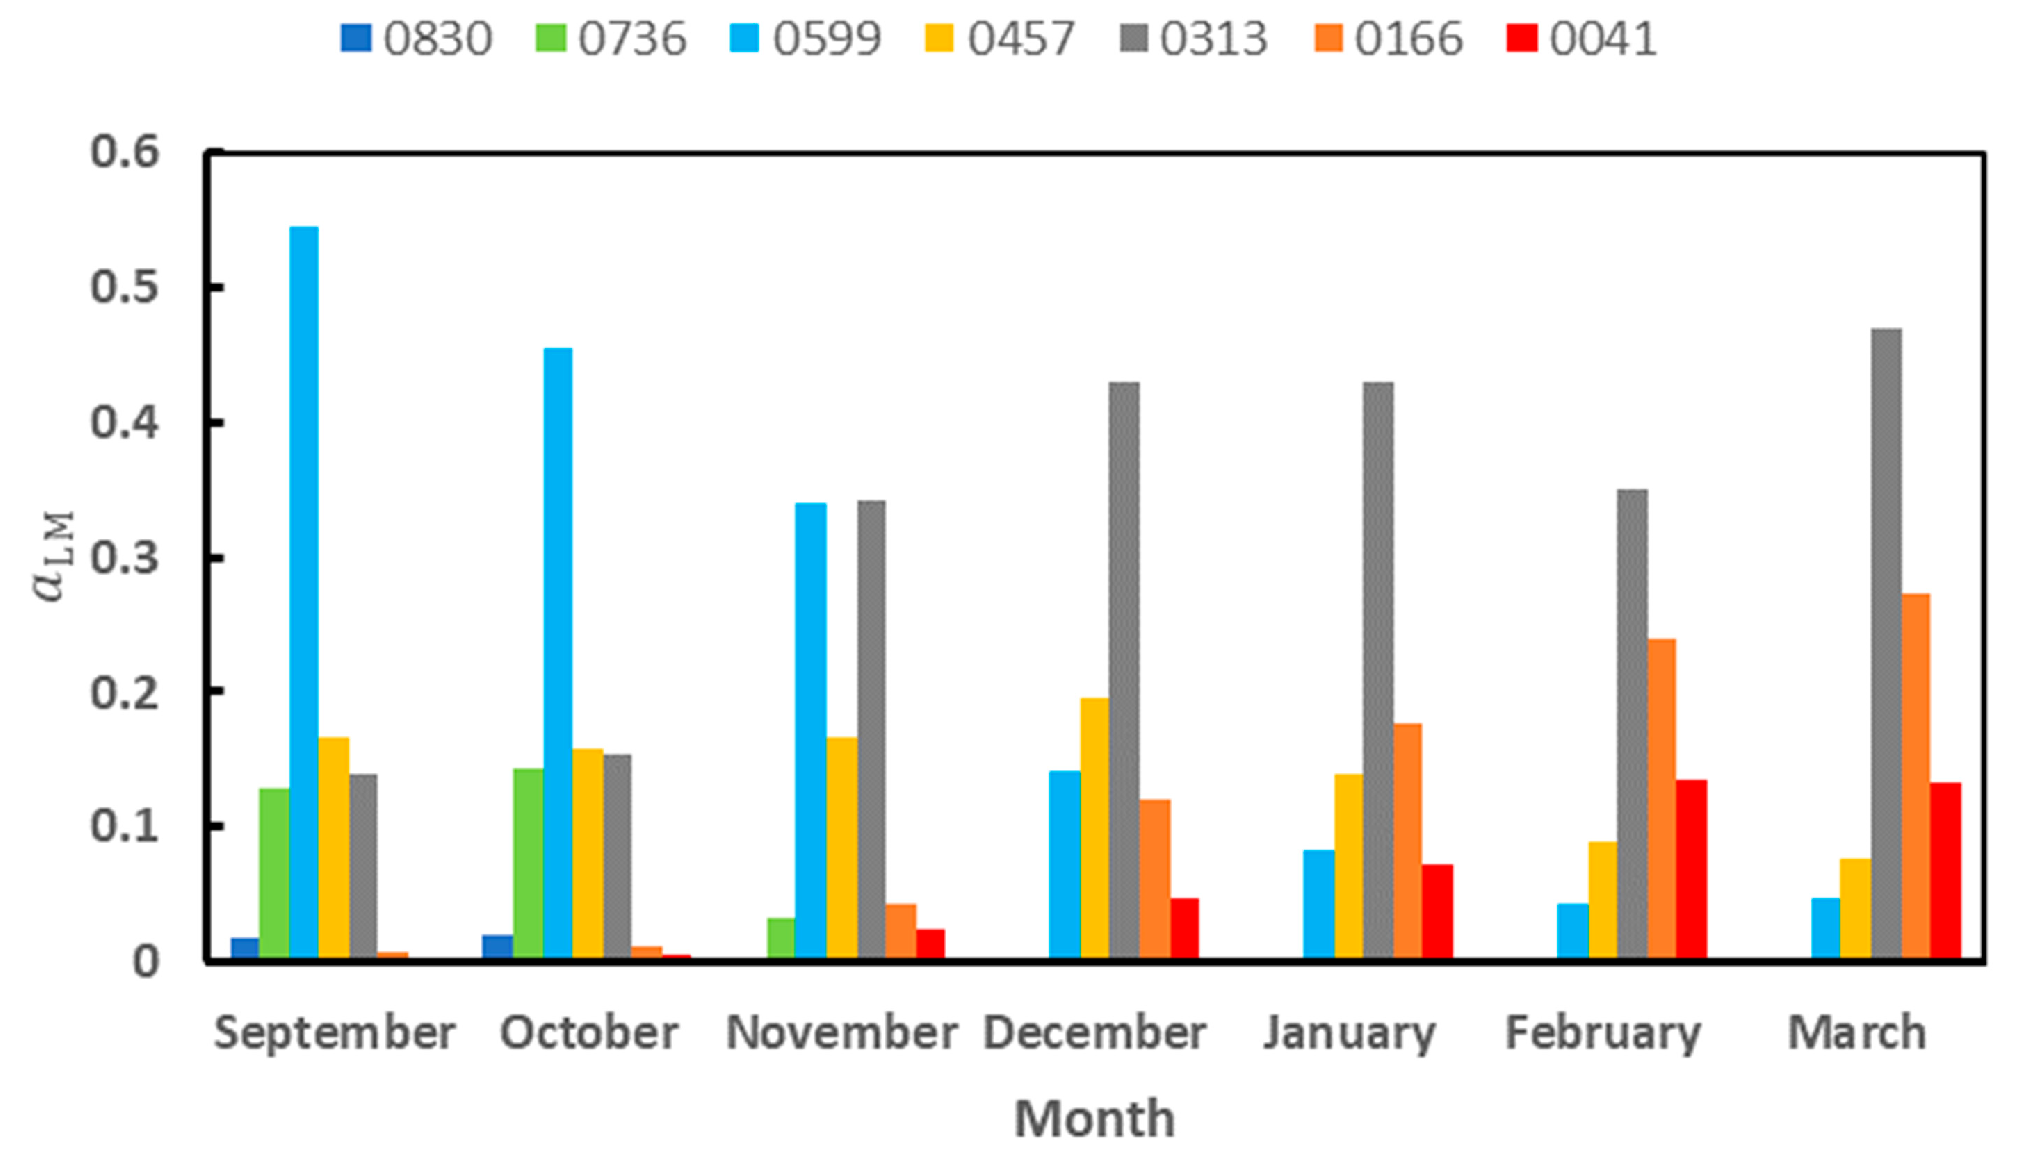
The mean monthly relative abundance ( a L M ) in the period 2000-2001 to 2020-2021 of each landscape unit is shown in Figure 7. Clean snow has a small relative abundance and disappears very soon in the season: 0830 is only present in September and November, and 0736 in September, November and December. On the other hand, bare soil appears in November and it is present until the end of the season with increasing relative abundance over the season, as expected. The landscape units with the largest relative abundance are 0599 at the beginning of the season and 0313 and 0166 in the second half of the season. It is worth noting that the relative abundance of dirty snow (0457) remains nearly constant over the season, being the only landscape unit with this behaviour.

3.4.2. Monthly relative abundance and driving mechanisms

The relationship between the monthly relative abundance ( a L M S ) and the monthly mean albedo over the whole island and the monthly mean air temperature at GdC AWS is summarized in Table 5. Landscape unit 0457 (dirty snow) exhibits the lowest correlation with <α> and Tair because of its nearly constant presence over the season. Albedo increase seems to be mainly due to the increase of the surface occupied by 0599 and to a lesser extent by 0736. The surface occupied by landscape unit 0536 diminishes with increasing Tair.
The relationship between the monthly relative abundance of the landscape units was also investigated, and the results summarized in Table 6. It is remarkable that the relative abundance of landscape unit 0599 exhibits a very large negative correlation with the relative abundance of 0041, 0166, and 0313. This is expected from the results shown in Figure 7, since the vanishing of 0599 gives way to the increasing abundance of 0166 and 0313.
In order to address the issue of validity of the results because of lack of data for some months, we have evaluated the results as shown above now only for seasons 2012-2013 and 2013-2014, since for these seasons all months are representative. These results are shown in Table 7 and Table 8.
Comparing Table 5 and Table 7 we see that the correlations of monthly <α> and Tair with the monthly relative abundance obtained in the overall analysis follows the same behaviour as those obtained for 2012-2013 and 2013-2014 seasons. Discrepancies are observed in some cases, but the general picture is not affected. The same can be said when comparing the results of Table 6 and Table 8.
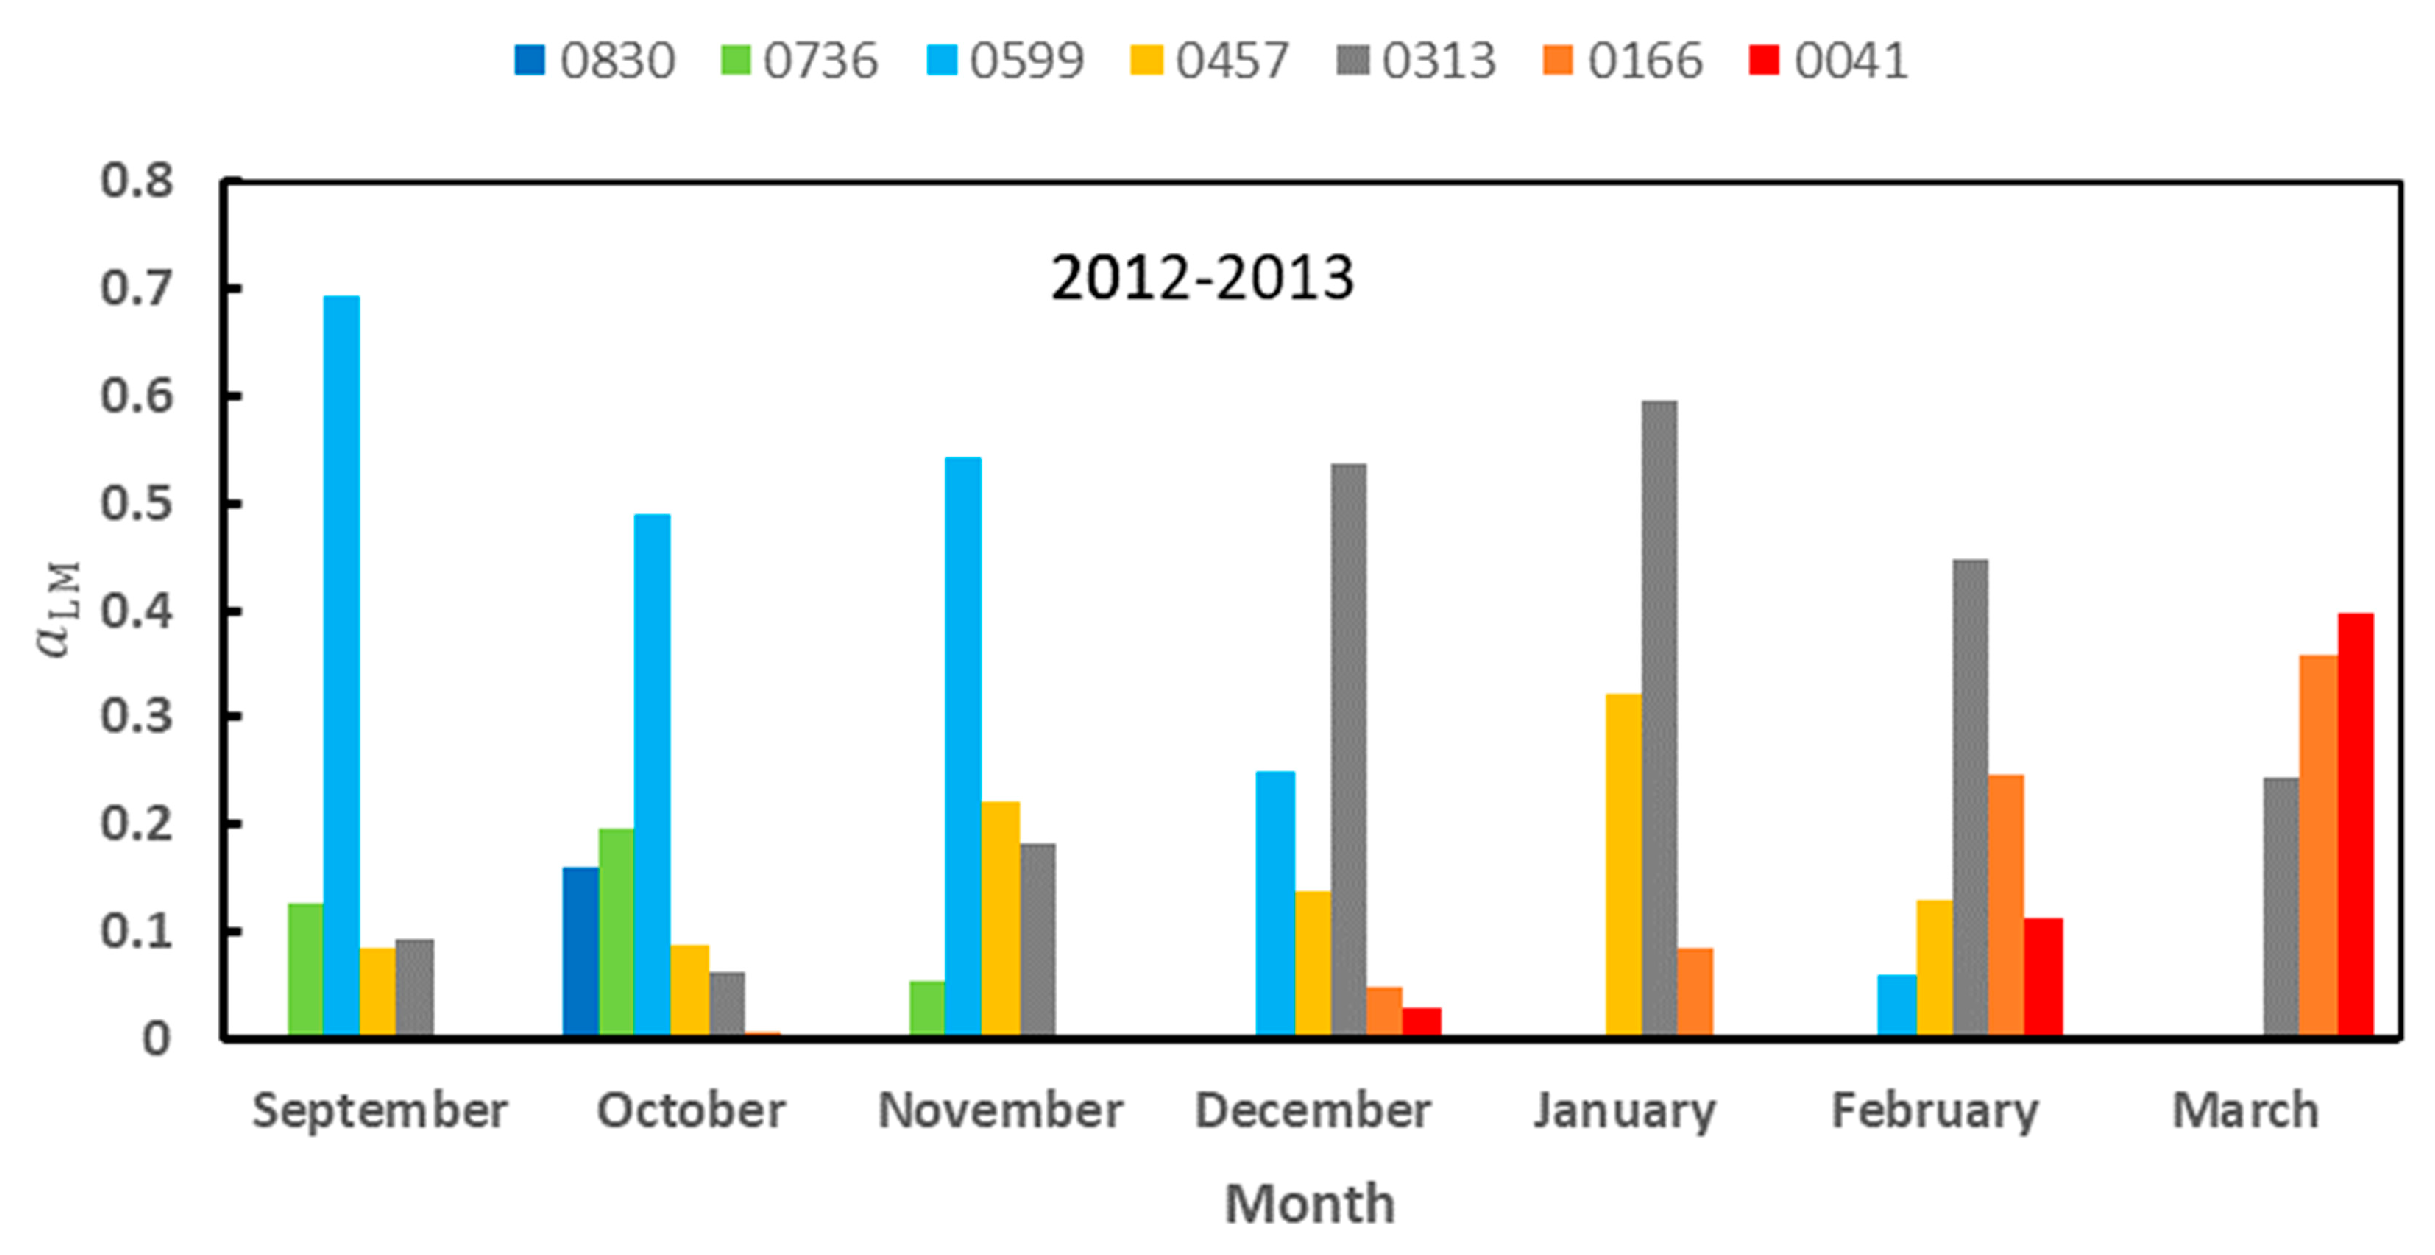
A more comprehensive view of the landscape evolution can be acquired by looking at the monthly evolution of the relative abundance in seasons 2012-2013 and 2013-2014 (Figure 8 and Figure 9):
When we compare the trend of the mean monthly relative abundances in Figure 7 with those in Figure 8 and Figure 9, we see that they follow the same general pattern: 0830 and 0736 vanish very soon in the season; 0599 follows a descending trend over the season; 0457 exhibits a nearly constant relative abundance over the season; 0313, 0166, and 0041 take the space left by 0599, their relative abundance increasing in the second half of the season. From these comparisons we conclude that the results obtained using the whole-time span is not affected by the missing months.

3.4.3. Seasonal relative abundance

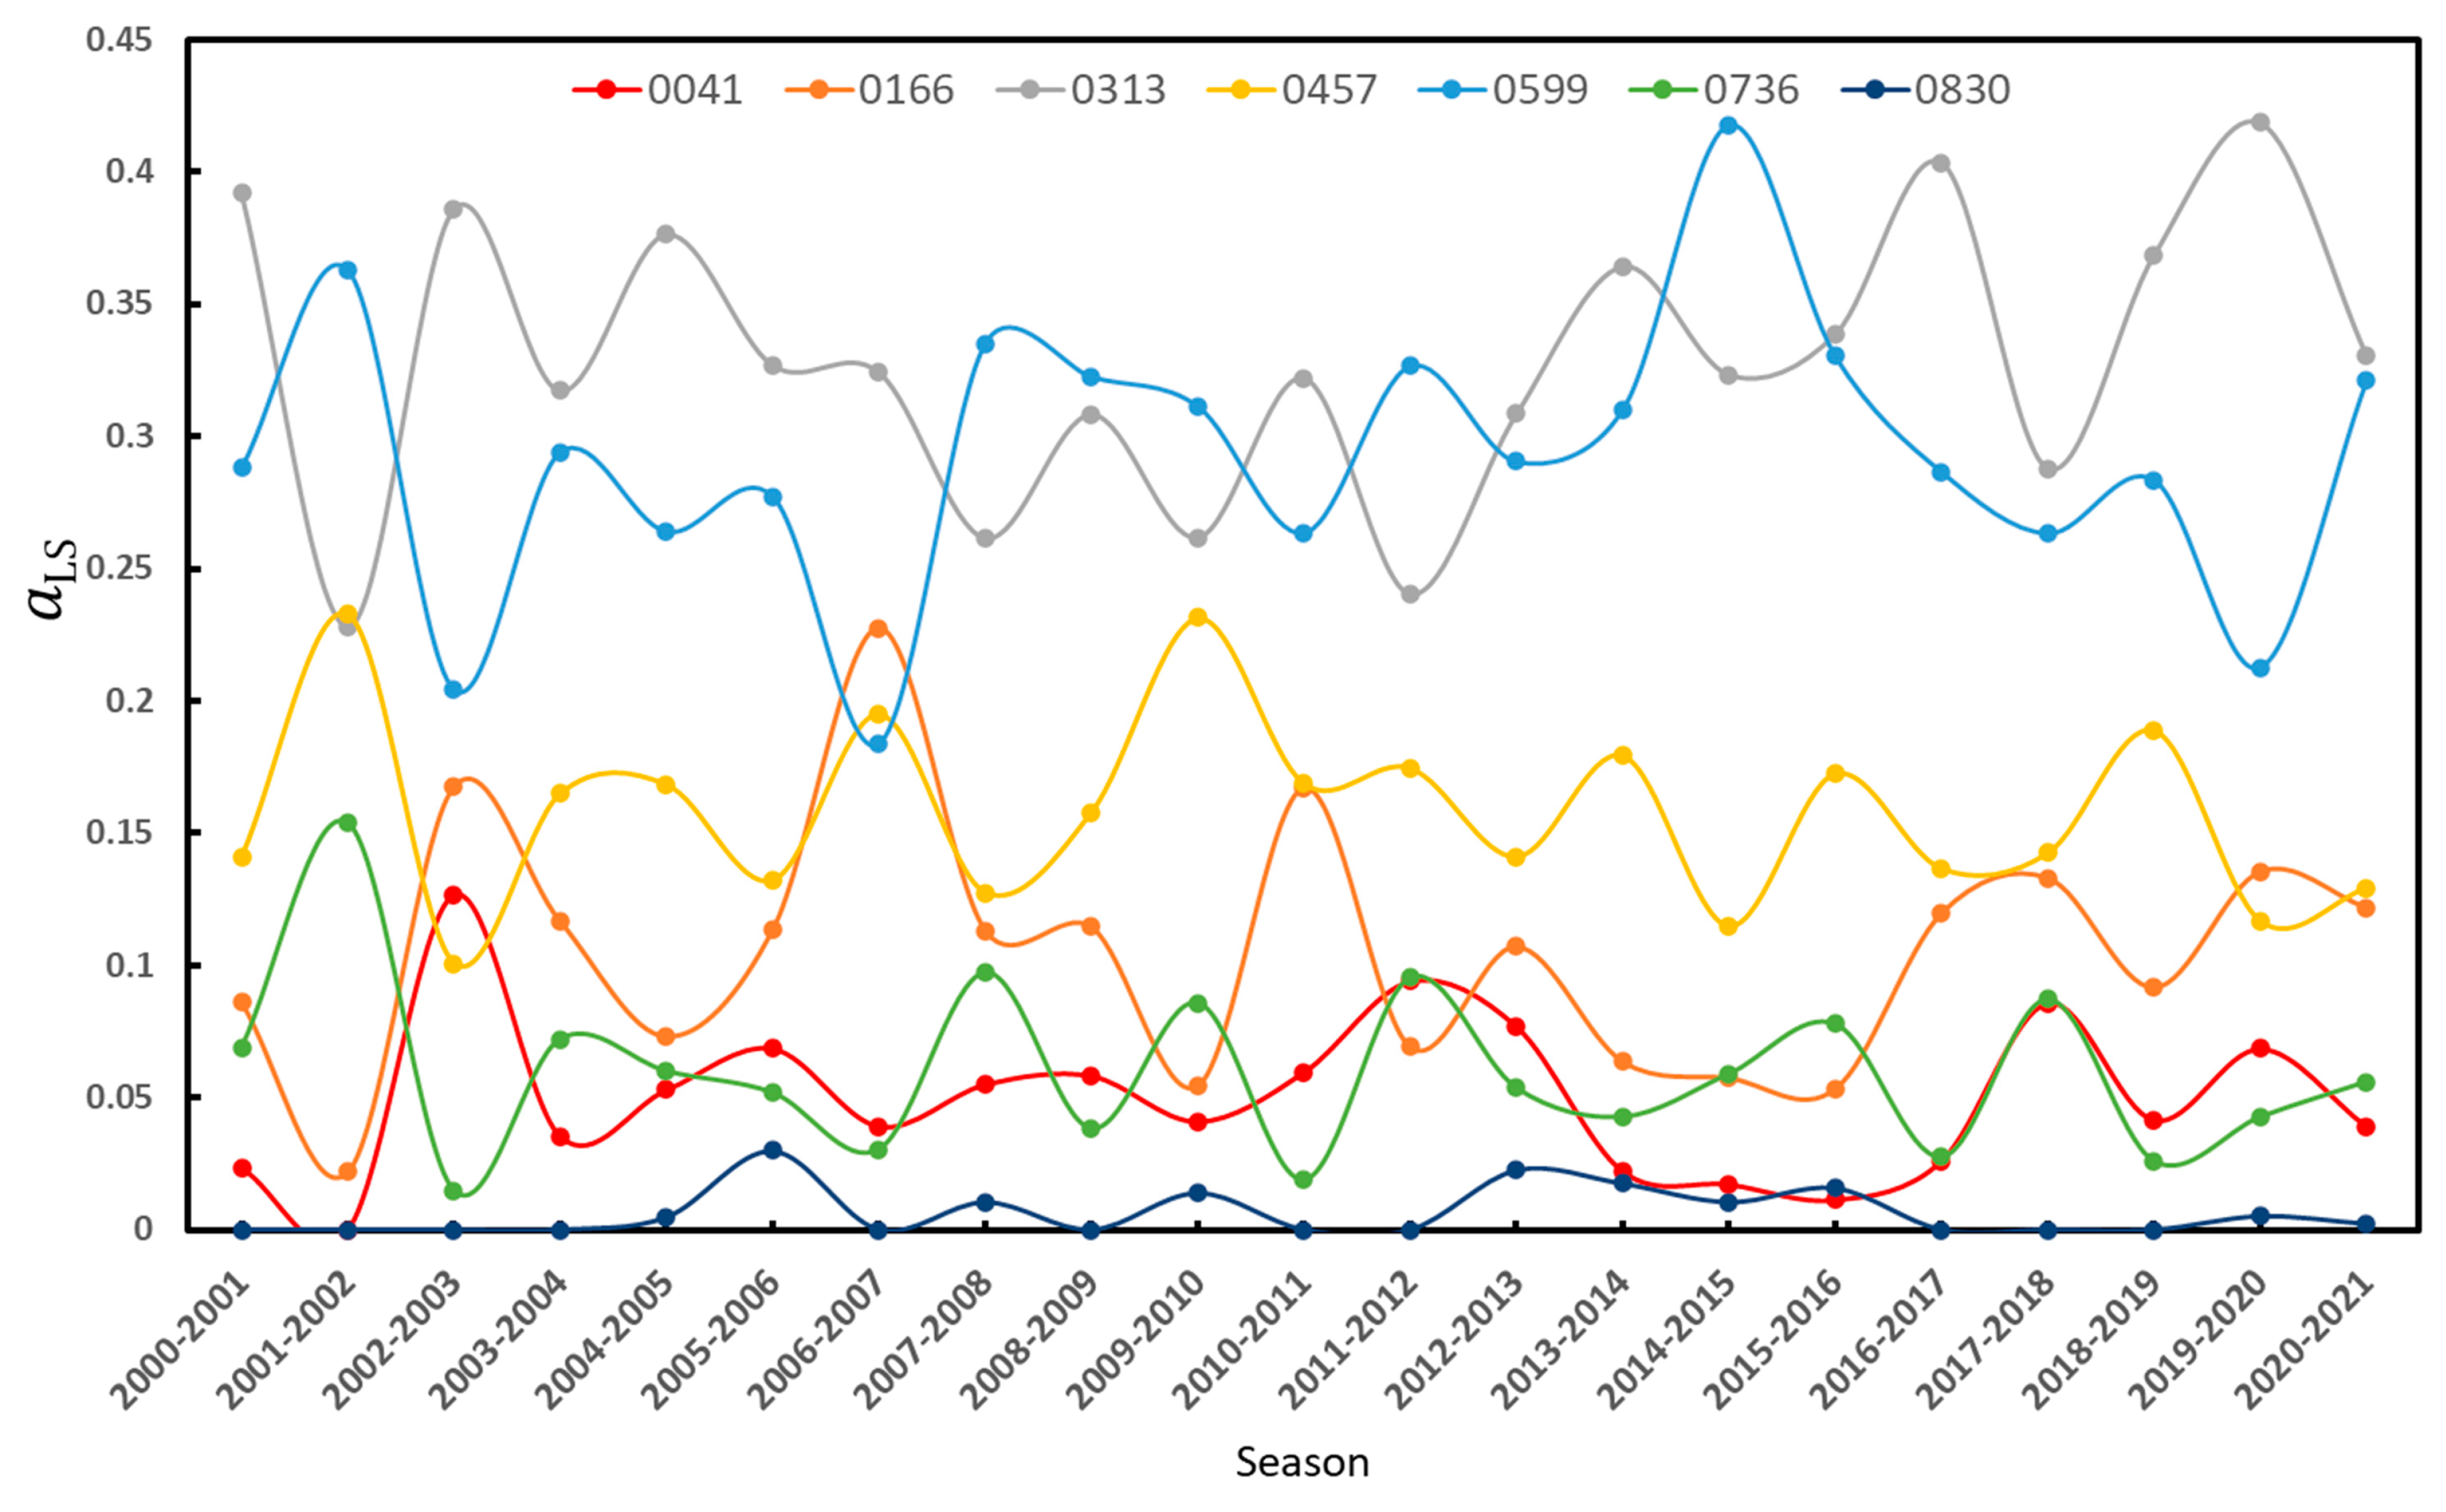
In Figure 10 we present the seasonal relative abundance   a L S over the period 2000-2001 to 2020-2021. There does not seem to be a clear trend in the seasonal evolution of the relative abundances. Nevertheless, we will show in the next Section that there is a relationship between the relative abundances and meteorological variables.

4. Discussion

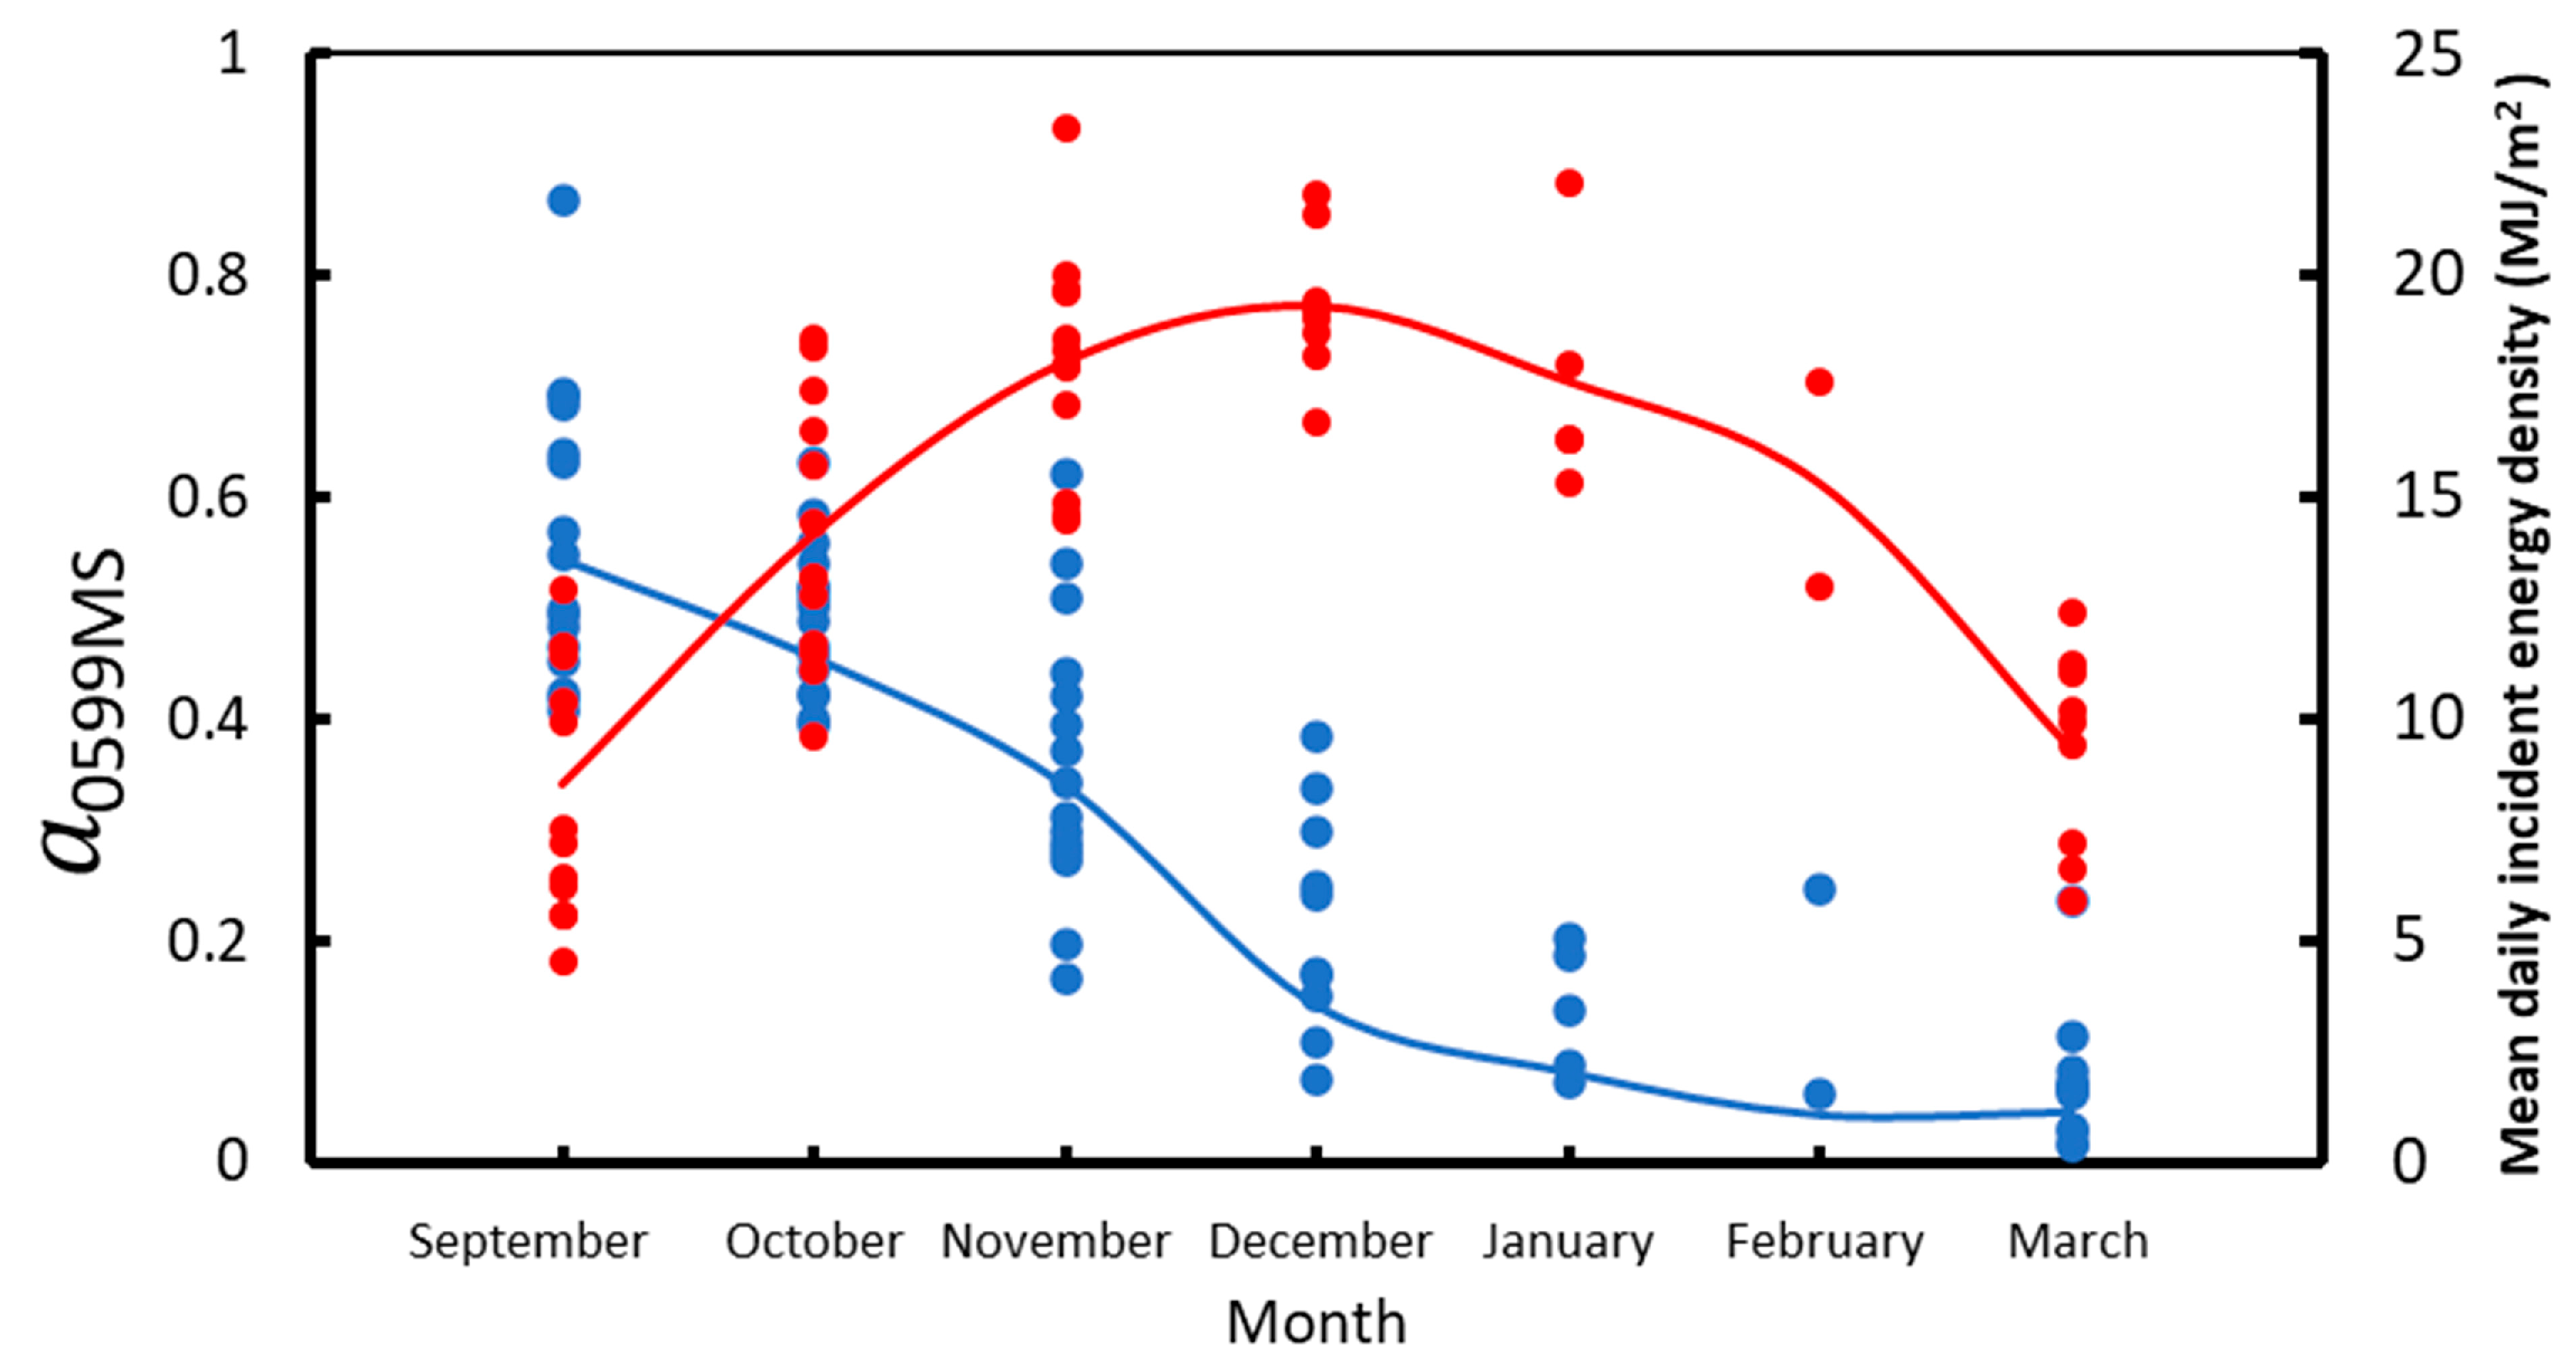
The mean monthly albedo over Deception Island (<α>) decreases steadily with increasing temperature, and the decreasing rate increases dramatically for temperatures above 272 − 273 K (Figure 5). A similar behaviour has been found for snow albedo on other sites in Antarctica [24]. All the landscape units exhibit a significant correlation with <α>, except 0457 and 0830 (Table 5). In the case of 0830, this is because the clean fresh snow disappears very soon in the season, probably due to the quick metamorphization, and/or melting of the snow, and because clean snow is very soon covered by ash carried by the wind. In the case of 0457, dirty snow, the cause is different. Dirty snow is present during the whole season with very small variation in the relative abundance. 0457 is the only landscape unit with this behaviour (see Figure 7). This has an important impact on the description of albedo over Deception Island: it appears that ash covering snow, resulting in dirty snow, does not promote the melting of snow, contrary to what is expected based on physical arguments, since ash diminishes the albedo of snow. This could also be due to the fact that the layer of dirty snow is too thick to disappear completely. This point needs further investigation. Of all the meteorological variables measured at the GdC AWS, the mean monthly air temperature was the one exhibiting the highest correlation with monthly abundance of a certain unit (Table 5), especially in the case of 0599, of which the relative abundance diminishes with increasing air temperature. On the other hand, the relative abundance of 0599 exhibits a high negative correlation with the monthly relative abundance of 0313 and 0166 (Table 6). We conclude that 0599 evolves into 0313, the evolution being driven by air temperature. Furthermore, solar radiation plays a fundamental role at the beginning of the season in the evolution of the relative abundance of 0599. A previous study of snow albedo decay over Livingston Island, showed that albedo decay starts very soon in the season (in September) being driven by the solar energy flux density [25]. In Figure 11 we show the evolution of the mean daily solar energy flux density from GdC AWS and the monthly relative abundance of 0599 from September to March between seasons 2005-2006 and 2020-2021. We can see that until December, increasing radiation coincides with decreasing relative abundance of 0599.
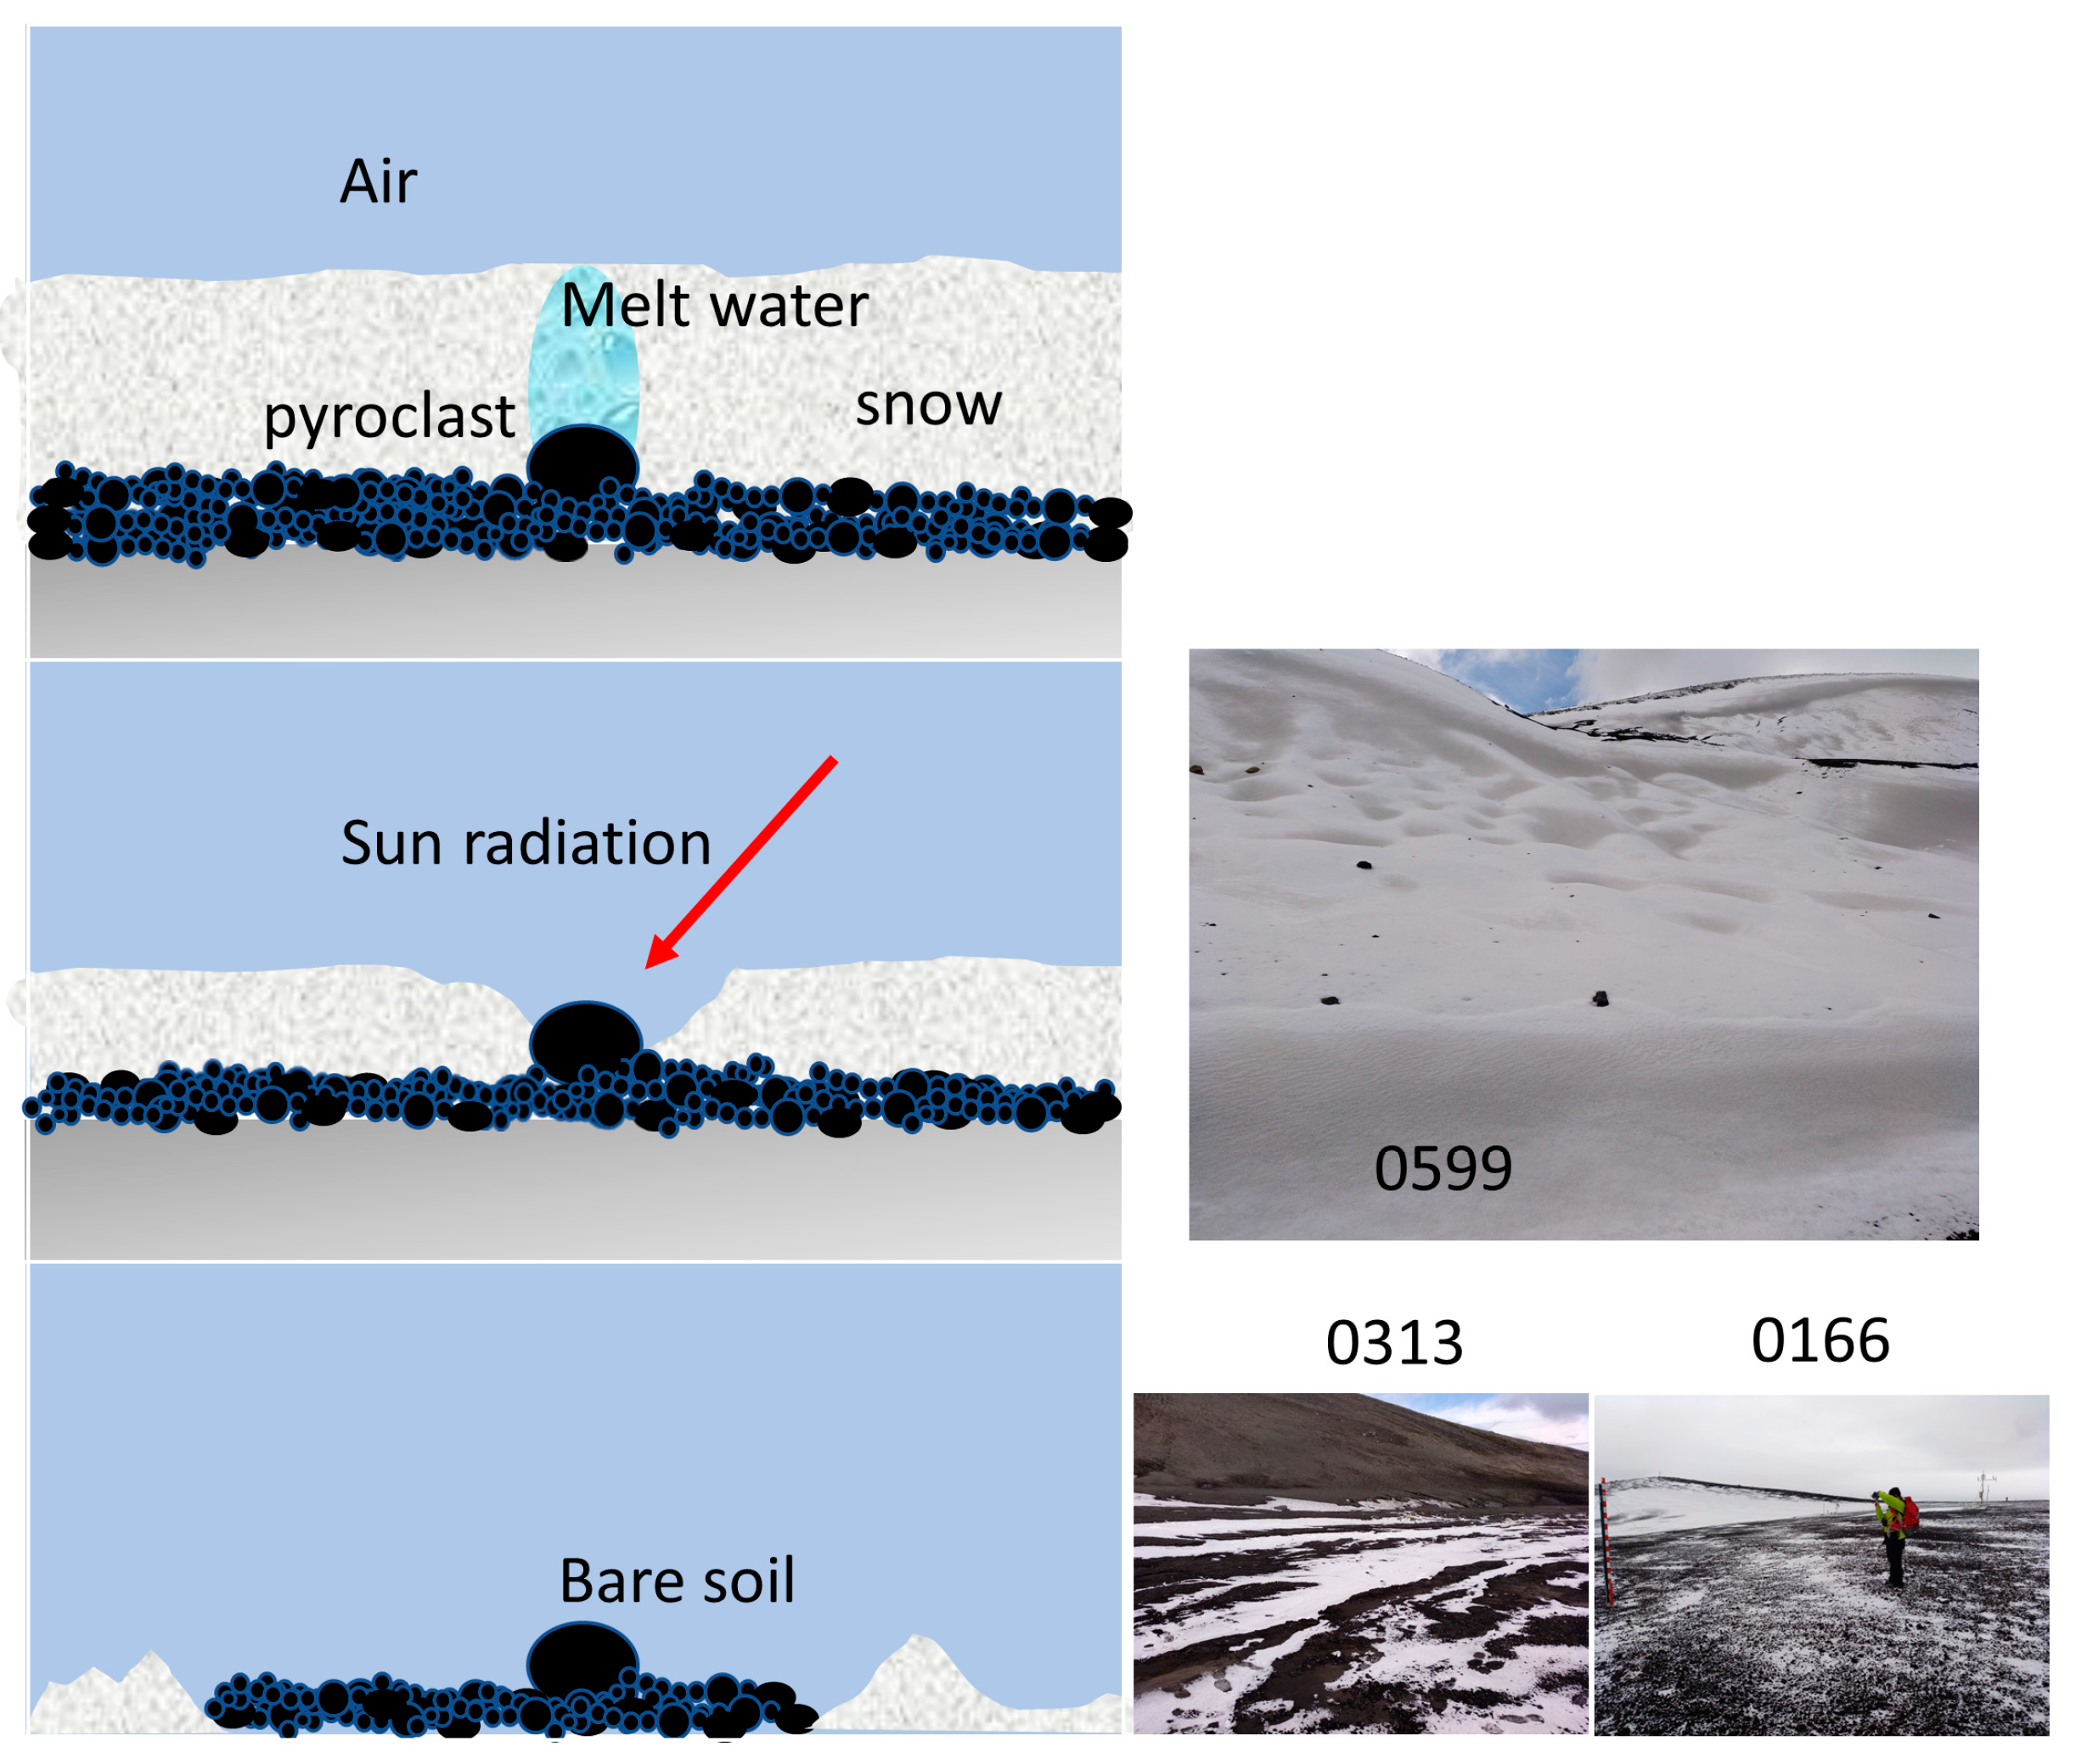
The results provide an accurate description of the land cover evolution during the season. Clean snow is only present at the beginning of the season, and it disappears very soon, melted or being covered by ash. As temperature and solar energy flux rise, snow melts. Pyroclasts beneath the snow surface, with high porosity, high air content and large intergranular pore space, induce fast percolation of melt water [5]. This results in the exposure of coarse pyroclasts and small outcrops around the exposed pyroclasts, so that the rugged landscape of snow and pyroclasts (0599) becomes the dominant landscape unit. Solar radiation and air temperature heat the exposed pyroclasts, which act as melting centres, promoting the transition from the rugged landscap (0599) to stripes of bare soil and snow (0313). Landscape units 0313 and 0041 coexist and share the space earlier in the season occupied by 0599. The transition between 0599 to 0313 and / or 0041 is driven by the microtopography pattern, where some areas, with a rough soil surface, are prone to the transition from 0599 to 0313 while others, flatter, are prone to the transition from 0599 to 0041. A detailed study considering the topography is mandatory in order to fully understand in what cases 0599 evolves into 0313 or 0041. Landscape unit 0166 is actually a variant of 0041. Landscape unit 0166 is a very ephemeral cover that forms when a light snowfall falls on bare ground. An illustration of this mechanism is shown in Figure 12.
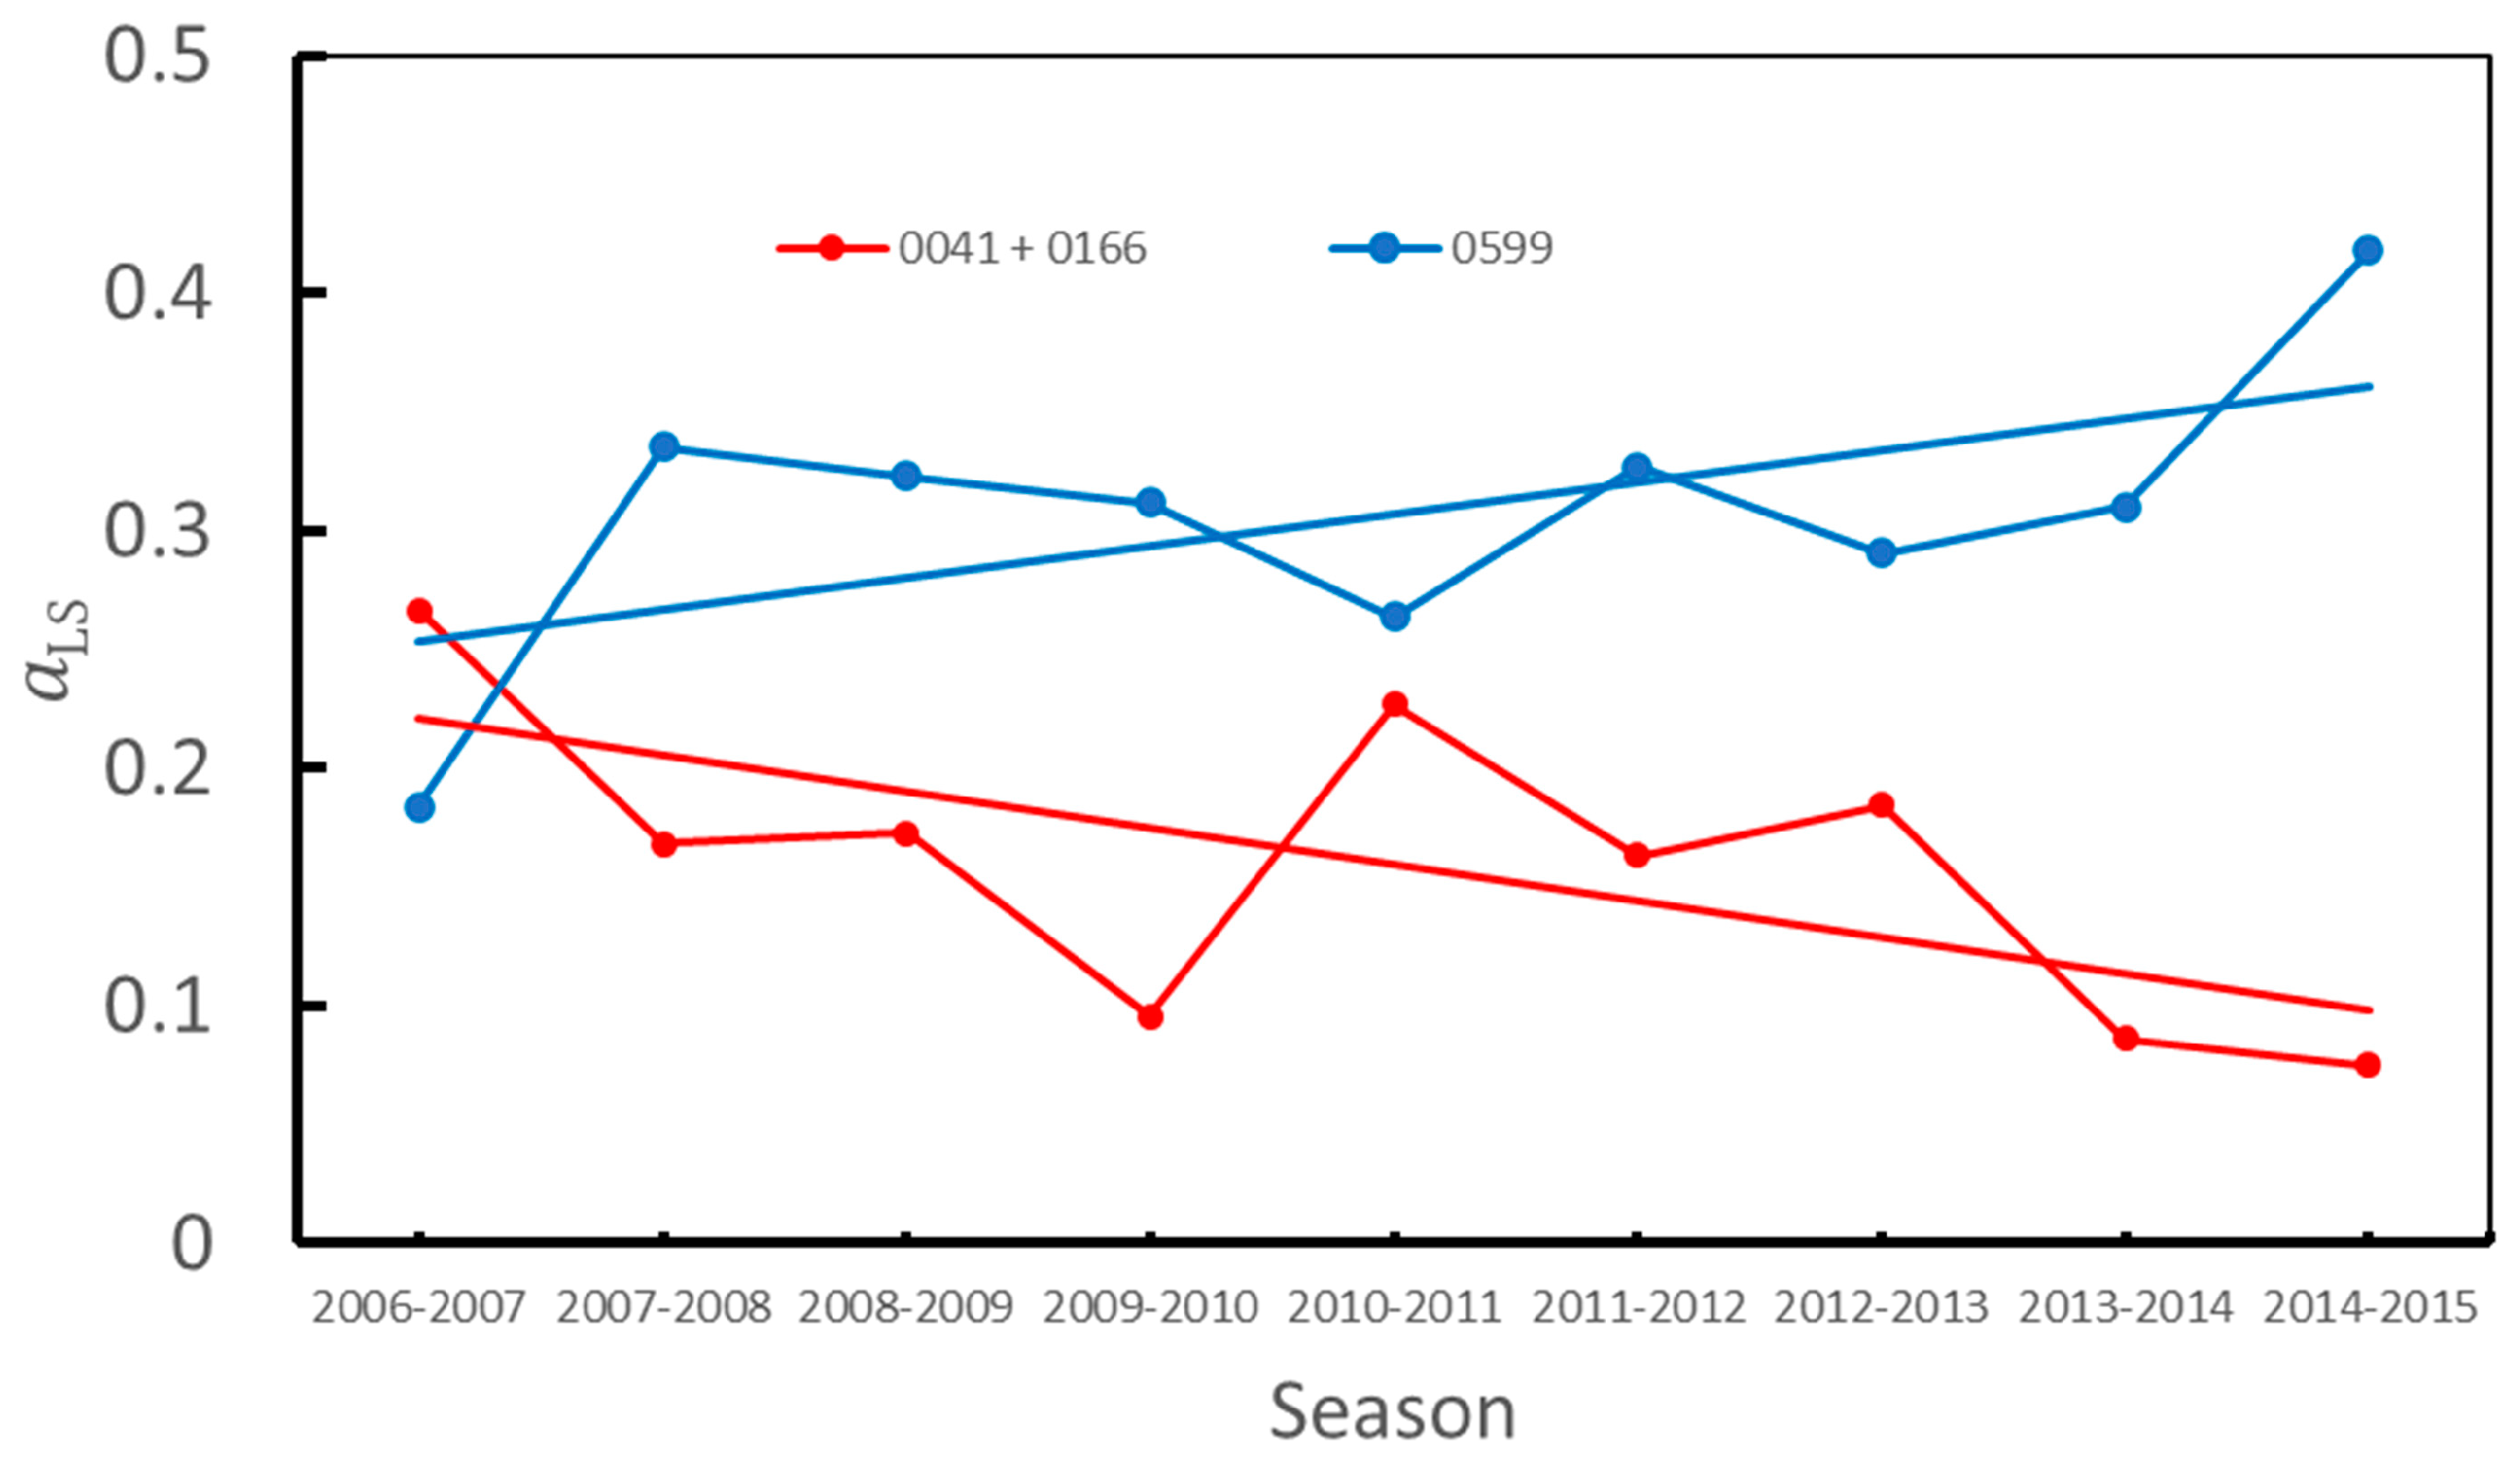
The distribution of landscape units may also explain the evolution of the permafrost active layer at the CALM site on Deception Island. The duration of the snow cover at the CALM-S site, showed an increase from 2006 to 2014, especially with longer lasting snow cover in the spring and early summer [6]. In Figure 13 we show the seasonal relative abundance of 0599 and the combination of 0041 and 0166 from 2006-2007 to 2014-2015. The increase of 0599 and the decrease of 0041+0166 is consistent with these results as presented in a previous research [6]. It is thus likely that this change in snow cover has occurred over the whole island. This trend in snow cover is also consistent with the deceleration in the glacial retreat observed on Livingston Island [26].
Field albedo measurements over the landscape units combined with MODIS data with a spatial resolution of 500 m has been applied to different locations, and with different landscape units, in other studies. The selection of landscape units depends on the area under study, but in all the cases they are chosen such that they have an area of the size of a MODIS pixel or larger. A study to validate MODIS data and study the variability of the albedo over a MODIS pixel was carried out in Canada [27]. In that study the authors distinguished six landscape units and use them to investigate the influence of albedo variability inside each landscape unit on the observed MODIS albedo. The authors concluded that the accuracy of MODIS albedo depends on the albedo spatial variability of the land cover, suggesting a fundamental limit to the Root Mean Square Error between MODIS albedo and in-situ albedo close to to 0.05 for snowfields and tundra.
A research over the southwestern Greenland Ice sheet [4] defined four different landscape units, each one described by a normal distribution of shortwave albedo: clean ice, dirty ice, shallow streams, and cryoconite holes. The normal distributions were computed from field measurements along transects over the landscape units. The authors used these normal distributions along with information of their relative abundance to compute the albedo distribution over the melt season and compare it with the albedo distribution obtained from MODIS data. They found an increase of 51 % in surface melt in the transition from an albedo distribution dominated by dark pixels to an albedo distribution dominated by brighter pixels, each distribution having a different relative abundance of the landscape units. The authors obtained the relative abundance of each landscape unit at different times during the melting season from a previous field survey [28]. The novelty of our approach lies in the fact that we have estimated the relative abundance of each landscape unit from the fit to satellite data. This opens the possibility of carrying out this kind of study in areas with the landscape units used in this study.

5. Conclusions

We have devised a procedure to describe the evolution of the landscape over large areas and we have tested and applied it to an Antarctic site. The site chosen is Deception Island, which exhibits a seasonal changing landscape consisting of snow and bare soil. The procedure is based on combining broadband albedo data from a spaceborne sensor (MODIS) and from field surveys to obtain the monthly abundance of previously chosen landscape units. The landscape units are chosen following an expert criteria and having a typical size of the order of the spatial resolution of the spaceborne sensor (MODIS). Each landscape unit is described by a normal distribution of broadband albedo, which is obtained from field measurements over selected sampling sites. The data are conveniently filtered to assure that albedo variations over a sampling site are due to surface changes. We have also used MODIS MCD43A3 (C6) Black Sky Albedo (BSA) to obtain the monthly mean albedo. The histograms of the MCD43A3 BSA are fitted to a linear combination of the normal distributions of the landscape units and the coefficients of the linear combination are interpreted as the abundance of the landscape units. The results show that the evolution of the landscape is driven by the solar irradiance at the beginning of the season (September, October) and by the mean air temperature. The correlation between the abundances provides information on how some landscape units evolve into others. In the case under study, a landscape unit consisting of a rugged landscape composed of dirty snow, with dispersed pyroclasts and small rocky outcrops, evolves into bare soil and a mixture of snow and bare soil patches. Pyroclasts beneath the surface, with high porosity, high air content and large intergranular pore space, induce the fast percolation of snowmelt; this provokes the exposition of coarse pyroclasts and small outcrops around. Solar radiation and air temperature heat the exposed pyroclasts which act as melting centres, promoting the transition. The transition is driven by the microtopography patterns. Ash on the snow surface does not seem to promote snow melt.

Author Contributions

Conceptualization, J.F.C., S.F.; methodology, J.F.C., J.O.; software, R.M., J.O.; formal analysis, J.F.C., J.O. and R.M.; investigation, J.F.C. and S.F.; resources, J.F.C., J.O., R.M., S.F..; data curation, J.F.C., R.M. and S.F.; writing—original draft preparation, J.F., J.O. and C.R.; writing—review and editing, all authors.; visualization, J.F.C., J.O., A.C-P.; supervision, J.F.C., S.F.; project administration, J.F.C., S.F.; funding acquisition, J.F.C., J.O., F.N., M.A.de P., S.F. All authors have read and agreed to the published version of the manuscript.

Funding

This research was funded by This work was supported by the Spanish Ministry of Science and Innovation under grants PID2021-127060OB-I00, PID2020-113051RB-C31, CTM2017-84441-R, and CTM2014-52021-R. The work of Alejandro Corbea-Pérez was supported by the Ph.D. Grant: “Severo Ochoa” from the Government of the Principality of Asturias [BP17-151].

Acknowledgments

The authors thank the assistance of the technical staff of Spanish Antarctic Stations Juan Carlos I and Gabriel de Castilla during the 2017-2018 and 2018-2019 campaigns.

Conflicts of Interest

The authors declare no conflicts of interest.

Appendix A

MODIS mean monthly albedo (<α>) was only calculated for months which met the criteria described in section 2.4.2 to be classified as representative of Deception Island. The full list of months meeting these criteria are the ones marked with an X in Table A1.
Table A1. Months labeled as representative for the calculation of the monthly mean albedo <α>. X = representative, Blank = not representative.
Season S O N D J F M
2000-2001 X X
2001-2002 X
2002-2003 X X X X
2003-2004 X X X X X
2004-2005 X X X X X
2005-2006 X X X X X
2006-2007 X X X X X X
2007-2008 X X X X X X
2008-2009 X X X X
2009-2010 X X X X
2010-2011 X X X X X X
2011-2012 X X X X X
2012-2013 X X X X X X X
2013-2014 X X X X X X X
2014-2015 X X X X
2015-2016 X X X X X X
2016-2017 X X X X X X
2017-2018 X X X X X X
2018-2019 X X X X X X
2019-2020 X X X X X X
2020-2021 X X X X X

Appendix B. Calibration of the portable albedometer. Effect of clouds on field albedo measurements

For the purpose of calibration, we carried out five experiments with the portable albedometer:
Experiment A.- Standing still on bare soil. Pyranometers carried on the shoulders. January 31 2019. Close to the AWS at JCI station. Overcast sky. 327 samples (27 minutes).
Experiment B.- Standing still on bare soil. Pyranometers carried on the shoulders. January 31 2019. Close to the AWS at JCI station. Overcast sky. Very stable incident irradiance. 73 samples (6 minutes).
Experiment C.- Standing still on bare soil. Pyranometers carried on the shoulders. February 1 2019. Close to the AWS at JCI station. Clear sky with clouds, large fluctuations in incident irradiance. 367 samples (31 minutes).
Experiment D.- Standing still on clean snow. Pyranometers carried on the shoulders. January 25 2019. Close to the AWS at Hurd Glacier, Livingston Island. Clear sky. Very stable incident irradiance. 100 samples (8 minutes).
Experiment E.- Standing still on clean snow. Pyranometers carried on the shoulders. February 1 2019. Close to the AWS at Hurd Glacier, Livingston Island. Overcast sky. 120 samples (10 minutes).
The surface cover at the AWS close to JCI station is bare soil between January and March, the surface cover at the AWS on Hurd Glacier is snow or ice all year round. Both AWSs provide incident irradiance, reflected irradiance and albedo every 10 minutes.
1)
Estimation of fluctuations due to incident irradiance fluctuations
We analyse the incident irradiance, the reflected irradiance and the albedo measured with the portable albedometer from Experiments A, B, C, D and E. The data from the AWSs is not used at this point. The results are shown in Table B1.
Table B1. Results of the calibration experiments A, B, C, D, and E run in the proximity of the AWSs. Exp means Experiment. CV = coefficient of variance calculated as the ratio of the standard deviation to the mean.
Exp Incident (W /m2) Reflected (W /m2) Albedo
A Mean 566 59 0.104
Standard deviation 34 3 0.003
CV (%) 6 5 3
B Mean 556 59 0.106
Standard deviation 5 2 0.002
CV (%) 1 3 2
C Mean 568 62 0.108
Standard deviation 160 20 0.007
CV (%) 28 3 7
D Mean 821 440 0.540
Standard deviation 5 3 0.004
CV (%) < 1 < 1 < 1
E Mean 466 266 0.571
Standard deviation 31 17 0.006
CV (%) 7 6 1
The results show that:
a)
As long as the Coefficient of variance (CV) of the incident irradiance is below 7%, the standard deviation of albedo is below 0.003 for bare soil (Experiments A and B) and below 0.004 for snow (Experiment D). For other cover types, consisting of a mixture of bare soil and snow, we assume values in between these two values. This means that when working with a dataset with a CV of the incident irradiance of 6% or less, variations of albedo above 0.003 for bare soil and above 0.004 for snow can be attributed to changes in the surface.
b)
According to experiments B and D (both correspond to very stable incident irradiance) we see that the noise of the portable albedometer (internal noise of the pyranometers plus noise caused by uncontrolled tilt of the pyranometers due to tiredness of the researcher or tilting of the body of the researcher over time, like for example when standing on snow) causes variations in albedo below 0.004. Variations above 0.004 under stable illumination must be caused by changes in the surface.
2)
Estimation of biased uncertainties caused by the experimental set-up (pyranometers model, influence of the body of the researcher carrying the pyranometers).
In this case, the results obtained with the portable albedometer in experiments D and E were averaged and compared to the acquisition of the AWSs. We take the data from the AWS as truth. Unfortunately, the AWS at JCI does not provide any data for the dates of Experiments A, B and C, so the biased uncertainties could only be tested on snow. The results are shown in Table B2 below.
Table B2. Results of experiments D and E. Ratio is the ratio of the data from the portable albedometer to the data from the AWS. Exp means Experiment. The relative difference is calculated as (Potable albedometer – AWS) / AWS.
Exp Incident (W /m2) Reflected (W /m2) Albedo
D AWS 847 513 0.606
Portable albedometer 820 441 0.538
Ratio 0.968 0.860 0.888
Relative Difference - 0.032 - 0.140 - 0.112
E AWS 554 354 0.639
Portable albedometer 488 278 0.570
Ratio 0.881 0.785 0.892
Relative Difference - 0.119 - 0.215 - 0.108
The maximum difference in albedo is -11.2 % (Experiment D). The relative difference is larger for the reflected irradiance than for the incident irradiance, due to the blocking of light by the body of the researcher. On the other hand, although the difference in the reflected irradiance can be as high as 21.5% (experiment E), this is compensated by the difference in the incident irradiance.
3)
Effect of clouds
Because of time constraints and logistics during the Antarctic campaign, some of the field albedo measurements had to be done under cloudy conditions. While snow albedo is very sensitive to clouds, that of bare soil is not. Clouds change the spectral composition of the incident radiation due to the strong absorption in the infrared part of the spectrum. Snow spectral albedo exhibits a great dependence on wavelength, while soil spectral albedo depends very smoothly on wavelength. Snow-covered landscape units (0457, 0599, 0736, and 0830) were corrected for cloudiness following the method proposed in a previous work [29]. The method consists in calculating the albedo under clear sky from the actually measured albedo as:
α c l e a r = α c l o u d + 0.05 n 0.5
Where αclear is the albedo that would have been measured under a clear sky, αcloud is the actually measured albedo and n is the cloud index (n =1 means a completely overcast sky, n = 0 means a completely clear sky). Equation (A1) can only be applied on snow covered surfaces. The cloud index can be calculated from the cloud transmittance (T) and the altitude above sea level of the observation site (h) using the relation:
T = 1 A n 2 e B h
with A = 0.78 and B = 0.00085, empirically derived constants.
The value of T is calculated assuming that
T = E c l o u d E c l e a r
where E(cloud) is the actually measured irradiance and E(clear) is the irradiance that would have been measured under clear sky conditions. E(clear) depends on the Sun Zenith Angle (SZA). To calculate E(clear) at the time of the acquired E(cloud) we used the measured irradiance on the closest date with clear sky conditions. In our case, this happened on February 16, 2019. E(clear) at any time of the day was obtained by fitting hourly irradiance to the SZA:
E c l e a r = a cos S Z A b
From the fit we obtained a = 1088 W/m2 and b = 1.7, with a coefficient of determination R2 = 0.97.
The results of the correction are shown in Table B3.
Table B3. Mean albedo and standard deviation of landscape units L = 0457, 0599, 0736, and 0830 before (measured) and after (corrected) the cloudiness correction. R. D. = Relative Difference measured as (Measured – Corrected)/Corrected.
L
0457 0599 0736 0830
<α> σ <α> σ <α> σ <α> σ
Corrected 0.437 0.016 0.578 0.041 0.722 0.014 0.805 0.016
Measured 0.457 0.018 0.599 0.040 0.736 0.013 0.830 0.016
R. D. 0.05 0.10 0.04 -0.02 0.02 -0.07 0.03 0.00
The effect of clouds is an increase in albedo mean between 2% and 5%, and a variation in the standard deviation between – 7% and 10%. We assume that the correction for bare soil due to clouds is negligible. The correction for mixtures of bare soil and snow cannot be quantified, but we assume that it is below that obtained for surfaces completely covered by snow.
In summary, we have calculated the effect of the experimental set-up and clouds on snow-covered surfaces. The effect of the experimental set-up is a decrease of the measured albedo with respect to that from the AWSs, with a maximum decrease of -11.2 %. On the other hand, clouds produce an increase of the measured albedo with respect to the cloud-free one in the range 2% to 5 % and an uncertainty in the standard deviation in the range -7 % to 10%. It has been impossible to calculate the correction due to these factors on the rest of the landscape units: on the one hand, the AWS at JCI (bare soil) does not provide data for the dates of the experiments; on the other hand, a procedure to correct albedo measurements for the effect of clouds is only known for a snow-covered surface. We think it would not be a good procedure to correct some surfaces and not others.
4)
Impact of corrections
To estimate the impact bias and clouds on the results, we assume that landscape units 0041, 0166, and 0313 are only affected by the bias due the experimental set up, and landscape units 0457, 0599, 0736, and 0830 are affected by bias and by cloudiness. We assume that bias provoke a decrease in albedo of 11.2% (the maximum observed) for all the landscape units, while clouds provoke the increase in albedo and the variation in the standard deviation shown in Table B3. Taking account of all these corrections, we assume that the corrected landscape units are the ones shown in Table B4 (the identification codes are the same as in the main body of the manuscript).
Table B4. Landscape unit code (L), mean albedo (μL) and standard deviation (σL) of the normal distribution of each landscape unit after correction for cloudiness and bias due to the experimental setup.
L Description μL σL
0830 Clean fresh snow 0.898 0.016
0736 Clean old snow 0.804 0.014
0599 Rugged landscape of snow and pyroclasts 0.647 0.041
0457 Dirty snow 0.488 0.016
0313 Stripes of bare soil and snow 0.348 0.080
0166 Shallow snow and bare soil holes 0.185 0.053
0041 Bare soil 0.046 0.009
We repeated the calculations of Section 2.4.3 with the new normal distributions. Let us denote by aLMS the monthly relative abundance obtained. We have calculated the correlation of <α> and Tair with aLMS and the correlation between the aLMS for the 2012-2013 and 2013-2014 seasons together. These two seasons were chosen because all the months attained the label of representative. The results are shown in Tables B4 and B5 below, and they have to be compared with those of Table 7 and Table 8 in the main body of the article. Although the values of the coefficients of correlations change, the main results remain unchanged.
Table B4. Coefficient of determination between the monthly relative abundance ( a L M S ) and the monthly mean albedo over Deception Island (<α>) and the monthly mean air temperature from the GdC AWS (Tair) for seasons 2012-2013 and 2013-2014. Data in red are statistically significant at a 95% level (p-value < 0.05). Values with very high coefficient of determination are marked in bold. The correlation is linear in all the cases, being positive (+) or negative (-) as indicated.
L 0041 0166 0313 0457 0599 0736 0830
<α> 0.44 (-) 0.75 (-) 0.63 (-) 0.03 0.74 (+) 0.67 (+) Only 2 data
Tair < 0.01 0.18 0.81 (+) 0.20 0.55 (-) 0.49 Only 2 data
Table B5. Coefficient of determination between monthly relative abundance ( a L M S ) of landscape units for seasons 2012-2013 and 2013-2014. Data in red are statistically significant at a 95% level (p-value < 0.05). Values with very high coefficient of determination are marked in bold. The correlation is linear, being positive (+) or negative (-) as indicated. The symbol (exp) means that the correlation is exponential. Landscape units 0830 and 0041 coincide in only one month over the whole time period and the correlation cannot be calculated.
L 0166 0313 0457 0599
0041 0.64 (+) < 0.01 0.13 0.64 (exp) (-)
0166 0.12 0.22 0.71 (exp) (-)
0313 0.18 0.67 (-)
0457 0.10

References

  1. Previdi, M.; Smith, K. L.; Polvani, L. M. The Antarctic Atmospheric Energy Budget. Part I: Climatology and Intraseasonal-to-Interannual Variability. J. Clim. 2013, 26, 6406–6418. [Google Scholar] [CrossRef]
  2. Ambrožová, K.; Hrbáček, F.; Láska, K. The Summer Surface Energy Budget of the Ice-Free Area of Northern James Ross Island and Its Impact on the Ground Thermal Regime. Atmosphere (Basel). 2020, 11. [Google Scholar] [CrossRef]
  3. Choi, T.; Lee, B. Y.; Kim, S.-J.; Yoon, Y. J.; Lee, H.-C. Net radiation and turbulent energy exchanges over a non-glaciated coastal area on King George Island during four summer seasons. Antarct. Sci. 2008, 20, 99–112. [Google Scholar] [CrossRef]
  4. Moustafa, S. E.; Rennermalm, A. K.; Smith, L. C.; Miller, M. A.; Mioduszewski, J. R.; Koenig, L. S.; Hom, M. G.; Shuman, C. A. Multi-modal albedo distributions in the ablation area of the southwestern Greenland Ice Sheet. Cryosph. 2015, 9, 905–923. [Google Scholar] [CrossRef]
  5. Farzamian, M.; Vieira, G.; Monteiro Santos, F. A.; Yaghoobi Tabar, B.; Hauck, C.; Paz, M. C.; Bernardo, I.; Ramos, M.; de Pablo, M. A. Detailed detection of active layer freeze--thaw dynamics using quasi-continuous electrical resistivity tomography (Deception Island, Antarctica). Cryosph. 2020, 14, 1105–1120. [Google Scholar] [CrossRef]
  6. Ramos, M.; Vieira, G.; de Pablo, M. A.; Molina, A.; Abramov, A.; Goyanes, G. Recent shallowing of the thaw depth at Crater Lake, Deception Island, Antarctica (2006–2014). CATENA 2017, 149, 519–528. [Google Scholar] [CrossRef]
  7. Goyanes, G.; Vieira, G.; Caselli, A.; Cardoso, M.; Marmy, A.; Santos, F.; Bernardo, I.; Hauck, C. Local influences of geothermal anomalies on permafrost distribution in an active volcanic island (Deception Island, Antarctica). Geomorphology 2014, 225, 57–68. [Google Scholar] [CrossRef]
  8. Calleja, J. F.; Corbea-Pérez, A.; Fernández, S.; Recondo, C.; Peón, J.; Ángel De Pablo, M. Snow albedo seasonality and trend from MODIS sensor and ground data at johnsons glacier, livingston island, maritime antarctica. Sensors (Switzerland) 2019, 19. [Google Scholar] [CrossRef]
  9. Caldeira, K.; Bala, G.; Cao, L. The Science of Geoengineering. Annu. Rev. Earth Planet. Sci. 2013, 41, 231–256. [Google Scholar] [CrossRef]
  10. Weihs, P.; Laimighofer, J.; Formayer, H.; Olefs, M. Influence of snow making on albedo and local radiative forcing in an alpine area. Atmos. Res. 2021, 255, 105448. [Google Scholar] [CrossRef]
  11. Blakely, B. J.; Rocha, A. V; McLachalan, J. S. A Century of Forest Regrowth and Snow Loss Alters the Cooling Effect of Historical Land Use in the Upper Midwest. Ecosystems 2020, 23, 1056–1074. [Google Scholar] [CrossRef]
  12. Bartolini, S.; Geyer, A.; Martí, J.; Pedrazzi, D.; Aguirre-Díaz, G. Volcanic hazard on Deception Island (South Shetland Islands, Antarctica). J. Volcanol. Geotherm. Res. 2014, 285, 150–168. [Google Scholar] [CrossRef]
  13. Almendros, J.; Carmona, E.; Jiménez, V.; Díaz-Moreno, A.; Lorenzo, F. Volcano-Tectonic Activity at Deception Island Volcano Following a Seismic Swarm in the Bransfield Rift (2014–2015). Geophys. Res. Lett. 2018, 45, 4788–4798. [Google Scholar] [CrossRef]
  14. Antoniades, D.; Giralt, S.; Geyer, A.; Álvarez-Valero, A. M.; Pla-Rabes, S.; Granados, I.; Liu, E. J.; Toro, M.; Smellie, J. L.; Oliva, M. The timing and widespread effects of the largest Holocene volcanic eruption in Antarctica. Sci. Rep. 2018, 8, 17279. [Google Scholar] [CrossRef] [PubMed]
  15. Ramos, M.; de Pablo, M. A.; Sebastian, E.; Armiens, C.; Gómez-Elvira, J. Temperature gradient distribution in permafrost active layer, using a prototype of the ground temperature sensor (REMS-MSL) on deception island (Antarctica). Cold Reg. Sci. Technol. 2012, 72, 23–32. [Google Scholar] [CrossRef]
  16. AEMET Weather Services Available online: https://www.aemet.es/es/datos_abiertos/AEMET_OpenData.
  17. Zonneveld, I. S. The land unit — A fundamental concept in landscape ecology, and its applications. Landsc. Ecol. 1989, 3, 67–86. [Google Scholar] [CrossRef]
  18. Schaaf, C.; Wang, Z. MCD43A1 MODIS/Terra+Aqua BRDF/Albedo Model Parameters Daily L3 Global - 500m V006 [Data set]. Accessed 2022-10-28. [CrossRef]
  19. Gorelick, N.; Hancher, M.; Dixon, M.; Ilyushchenko, S.; Thau, D.; Moore, R. Google Earth Engine: Planetary-scale geospatial analysis for everyone. Remote Sens. Environ. 2017, 202, 18–27. [Google Scholar] [CrossRef]
  20. Corbea-Perez, A.; Calleja, J. F.; Recondo, C.; Fernandez, S. Evaluation of the MODIS (C6) Daily Albedo Products for Livingston Island, Antarctic. Remote Sens. 2021, 13. [Google Scholar] [CrossRef]
  21. Bañón, M.; Vasallo, F. AEMET en la Antártida. 2016. [Google Scholar]
  22. Duchon, C. E.; Hamm, K. G. Broadband Albedo Observations in the Southern Great Plains. J. Appl. Meteorol. Climatol. 2006, 45, 210–235. [Google Scholar] [CrossRef]
  23. Key, J. R.; Wang, X.; Stoeve, J. C.; Fowler, C. Estimating the cloudy-sky albedo of sea ice and snow from space. J. Geophys. Res. Atmos. 2001, 106, 12489–12497. [Google Scholar] [CrossRef]
  24. Pirazzini, R. Surface albedo measurements over Antarctic sites in summer. J. Geophys. Res. Atmos. 2004, 109, n/a-n/a. [Google Scholar] [CrossRef]
  25. Calleja, J. F.; Muñiz, R.; Fernández, S.; Corbea-Pérez, A.; Peón, J.; Otero, J.; Navarro, F. Snow Albedo Seasonal Decay and Its Relation With Shortwave Radiation, Surface Temperature and Topography Over an Antarctic Ice Cap. IEEE J. Sel. Top. Appl. Earth Obs. Remote Sens. 2021, 14, 2162–2172. [Google Scholar] [CrossRef]
  26. Navarro, F. J.; Jonsell, U. Y.; Corcuera, M. I.; Martín-Español, A. Decelerated mass loss of Hurd and Johnsons Glaciers, Livingston Island, Antarctic Peninsula. J. Glaciol. 2013, 59, 115–128. [Google Scholar] [CrossRef]
  27. Williamson, S. N.; Copland, L.; Hik, D. S. The accuracy of satellite-derived albedo for northern alpine and glaciated land covers. Polar Sci. 2016, 10, 262–269. [Google Scholar] [CrossRef]
  28. Chandler, D. M.; Alcock, J. D.; Wadham, J. L.; Mackie, S. L.; Telling, J. Seasonal changes of ice surface characteristics and productivity in the ablation zone of the Greenland Ice Sheet. Cryosph. 2015, 9, 487–504. [Google Scholar] [CrossRef]
  29. Greuell, W.; Konzelmann, T. Numerical modelling of the energy balance and the englacial temperature of the Greenland Ice Sheet. Calculations for the ETH-Camp location (West Greenland, 1155 m a.s.l.). Glob. Planet. Change 1994, 9, 91–114. [Google Scholar] [CrossRef]
Figure 1. Location of Deception Island and Livingston Island, including the location of the AWSs and the CALM site.
Preprints 96504 g001
Figure 2. Portable albedometer and experimental set-up.
Preprints 96504 g002
Figure 3. Landscape units and their identification code, see also Table 2. The inset in 0166 corresponds to a nadir view of the cover. The large area covered by 0166 in the lower left panel is the CALM site.
Preprints 96504 g003
Figure 4. Broadband albedo histograms obtained from albedo distributed measurements over the sampling plots of each landscape unit. The solid red line is the normal distribution that best fits to the histogram. Both the histogram and the normal distribution are normalized to unit area.
Preprints 96504 g004
Figure 5. Mean monthly albedo over Deception Island versus mean monthly air temperature from GdC AWS in the period 2006-2007 to 2020-2021. Red dots correspond to September and October months. The fit is given as a visual guide.
Preprints 96504 g005
Figure 6. Mean monthly albedo histograms (MODIS data, blue bars) for the 2013-2014 season. The red line is the fit to a linear combination of the normal distributions of the landscape units.
Preprints 96504 g006
Figure 7. Relative abundance of each landscape unit for each month   ( a L M ) over the periods 2000-2001 to 2020-2021.
Preprints 96504 g007
Figure 8. Relative abundance of each landscape unit for each month for the season 2012-2013 ( a L M ,   2012 2013 ) .
Preprints 96504 g008
Figure 9. Relative abundance of each landscape unit for each month for the season 2013-2014 ( a L M ,   2013 2014 ) .
Preprints 96504 g009
Figure 10. Seasonal relative abundance of each landscape unit in the period 2000-2001 – 2020-2021.
Preprints 96504 g010
Figure 11. Monthly relative abundance of landscape unit 0599 (blue dots and blue solid line) and mean daily incident energy density between seasons 2005-2006 and 2020-2021. Each point represents a month. The solid line follows the mean value for each month and is given as a guide for the eye.
Preprints 96504 g011
Figure 12. Mechanism proposed for the transition from landscape unit 0599 to either 0313 or 0166. Left panels describe the physical processes. Right panels the corresponding landscape units.
Preprints 96504 g012
Figure 13. Seasonal relative abundance of landscape units 0041 and 0166 combined and 0599 in the period 2006-2007 −2014-2015. Linear fits (solid straight lines) are shown as a visual guide of the trend.
Preprints 96504 g013
Table 1. Location of the Automatic Weather Stations, and instrumentation used. The last row describes the purpose of the data in this study.
Livingston Island Deception Island
Juan Carlos I (JCI)
62°39´48´´S 60°23´19´´ W; ASL: 13 m
Hurd Glacier (HG)
62°41´48´´S 60°24´44´´ W; ASL: 140 m
Gabriel de Castilla (GdC)
62°58´38´´S 60°40´31´´ W; ASL: 13 m. Since 4/02/2005
moved to
62°58´38´´S 60°40´33´´ W; ASL: 12 m. Since 12/02/2007
Albedo KIP-ZONEN CM11 Incident solar radiation KIP-ZONEN CM11
Air temperature HMP45C
Calibration of distributed albedo measurements
Ratio of diffuse to global radiation to discuss the cloudiness in the area
Solar radiation and air temperature over the study site as driving mechanisms of albedo and landscape evolution
Table 2. Landscape unit code (L), mean albedo (μL) and standard deviation (σL) of the normal distribution of each landscape unit.
L Description μL σL
0830 Clean fresh snow 0.830 0.016
0736 Clean old snow 0.736 0.013
0599 Rugged landscape of snow and pyroclasts 0.599 0.040
0457 Dirty snow 0.457 0.018
0313 Stripes of bare soil and snow 0.313 0.080
0166 Shallow snow and bare soil holes 0.166 0.053
0041 Bare soil 0.041 0.009
Table 3. Number of months with a representative monthly albedo image in the period 2000-2001 to 2020-2021 (NM). Number of months with presence of each landscape unit. In parenthesis the percentage of months in which each landscape unit is present.
September October November December January February March
NM 21 18 18 15 9 6 19
N (0830) 7 (33%) 3 (17%) 0 0 0 0 0
N (0736) 21 (100%) 18 (100%) 7 (39%) 1 (7%) 0 0 0
N (0599) 21 (100%) 18 (100%) 18 (100%) 11 (73%) 6 (67%) 2 (33%) 13 (68%)
N (0457) 21 (100%) 18 (100%) 18 (100%) 15 (100%) 9 (100%) 6 (100%) 19 (100%)
N (0313) 20 (95%) 18 (100%) 18 (100%) 15 (100%) 9 (100%) 6 (100%) 19 (100%)
N (0166) 13 (62%) 16 (89%) 18 (100%) 15 (100%) 9 (100%) 6 (100%) 19 (100%)
N (0041) 2 (10%) 4 (22%) 14 (78%) 14 (100%) 8 (89%) 6 (100%) 19 (100%)
Table 4. Mean daily incident sun energy density (KJ/m2) in November, December, January, and February in the period 1998-2014. Values for global and diffuse radiation are given separately. The ratio of the diffuse to the global radiation is also given. Data from the JCI AWS on Livingston Island.
Month November December January Febraury
Global 17077 15855 13645 8678
Diffuse 9723 11062 9599 6678
Ratio 0.57 0.70 0.70 0.77
Table 5. Coefficient of determination between the monthly relative abundance ( a L M S ) and the monthly mean albedo over Deception Island (<α>) and the monthly mean air temperature from the GdC AWS (Tair). Data in red are statistically significant at a 95% level (p-value < 0.05). Values with very high coefficient of determination are marked in bold. The correlation is linear in all the cases, being positive (+) or negative (-) as indicated.
L 0041 0166 0313 0457 0599 0736 0830
<α> 0.50 (-) 0.77 (-) 0.63 (-) 0.12 0.87 (+) 0.45 (+) 0.26
Tair 0.21 (+) 0.46 (+) 0.47 (+) 0.02 0.69 (-) 0.15 0.29
Table 6. Coefficient of determination between monthly relative abundance ( a L M S ) of landscape units. Data in red are statistically significant at a 95% level (p-value < 0.05). Values with very high coefficient of determination are marked in bold. The correlation is linear, being positive (+) or negative (-) as indicated. The symbol (exp) means that the correlation is exponential. Landscape units 0830 and 0041 coincide in only one month over the whole time period and the correlation cannot be calculated.
L 0166 0313 0457 0599 0736 0830
0041 0.32 (+) 0.02 (-) 0.26 (-) 0.42 (exp) (-) 0.38 (-) X
0166 0.15 (+) 0.33 (-) 0.81 (exp) (-) 0.09 (-) 0.06 (-)
0313 0.01 (-) 0.73 (-) 0.31 (-) 0.22 (-)
0457 0.02 (+) 0.12 (-) 0.13 (-)
0599 < 0.01 0.10 (-)
0736 0.03 (+)
0830
Table 7. Coefficient of determination between the monthly relative abundance ( a L M S ) and the monthly mean albedo over Deception Island (<α>) and the monthly mean air temperature from the GdC AWS (Tair) for seasons 2012-2013 and 2013-2014. Data in red are statistically significant at a 95% level (p-value < 0.05). Values with very high coefficient of determination are marked in bold. The correlation is linear in all the cases, being positive (+) or negative (-) as indicated.
L 0041 0166 0313 0457 0599 0736 0830
<α> 0.53 (-) 0.61 (-) 0.89 (-) 0.02 0.82 (+) 0.66 (+) Only 2 data
Tair 0.25 0.40 0.75 (+) 0.04 0.86 (-) 0.49 Only 2 data
Table 8. Coefficient of determination between monthly relative abundance ( a L M S ) of landscape units for seasons 2012-2013 and 2013-2014. Data in red are statistically significant at a 95% level (p-value < 0.05). Values with very high coefficient of determination are marked in bold. The correlation is linear, being positive (+) or negative (-) as indicated. The symbol (exp) means that the correlation is exponential. Correlations with 0830 were not calculated due to the few data available.
L 0166 0313 0457 0599 0736 0830
0041 0.78 (+) < 0.01 0.39 (-) 0.93 (exp) (-) 0.05 X
0166 0.04 0.18 0.86 (exp) (-) 0.15 X
0313 0.18 0.63 (-) 0.35 (-) X
0457 < 0.01 < 0.01 X
0599 < 0.01 X
0736 X
0830
Disclaimer/Publisher’s Note: The statements, opinions and data contained in all publications are solely those of the individual author(s) and contributor(s) and not of MDPI and/or the editor(s). MDPI and/or the editor(s) disclaim responsibility for any injury to people or property resulting from any ideas, methods, instructions or products referred to in the content.
Copyright: This open access article is published under a Creative Commons CC BY 4.0 license, which permit the free download, distribution, and reuse, provided that the author and preprint are cited in any reuse.
Prerpints.org logo

Preprints.org is a free preprint server supported by MDPI in Basel, Switzerland.

Subscribe

© 2024 MDPI (Basel, Switzerland) unless otherwise stated