Submitted:
17 January 2024
Posted:
17 January 2024
You are already at the latest version
Abstract
Keywords:
1. Introduction
2. Materials and Methods
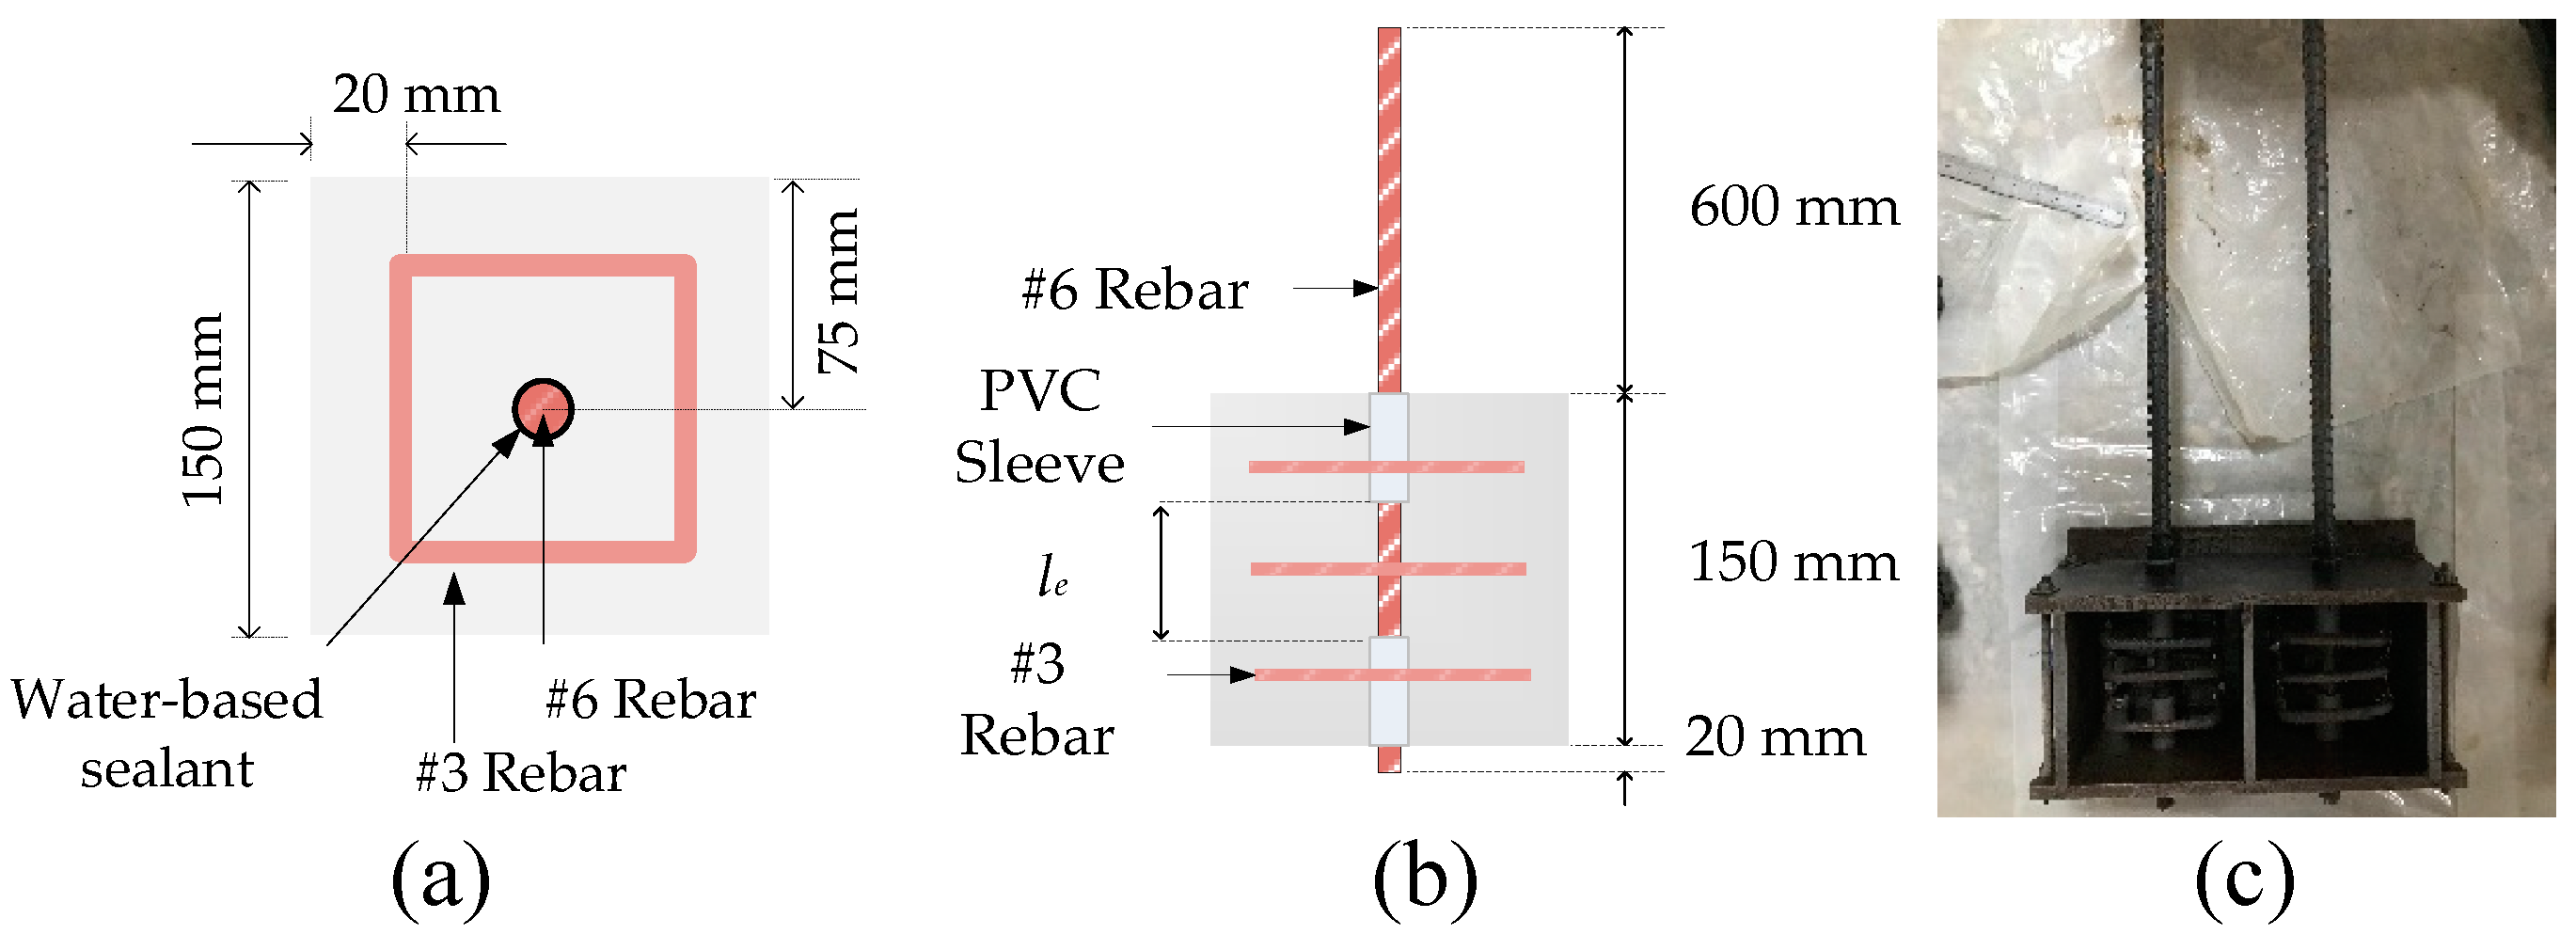
2.1. Experimental program
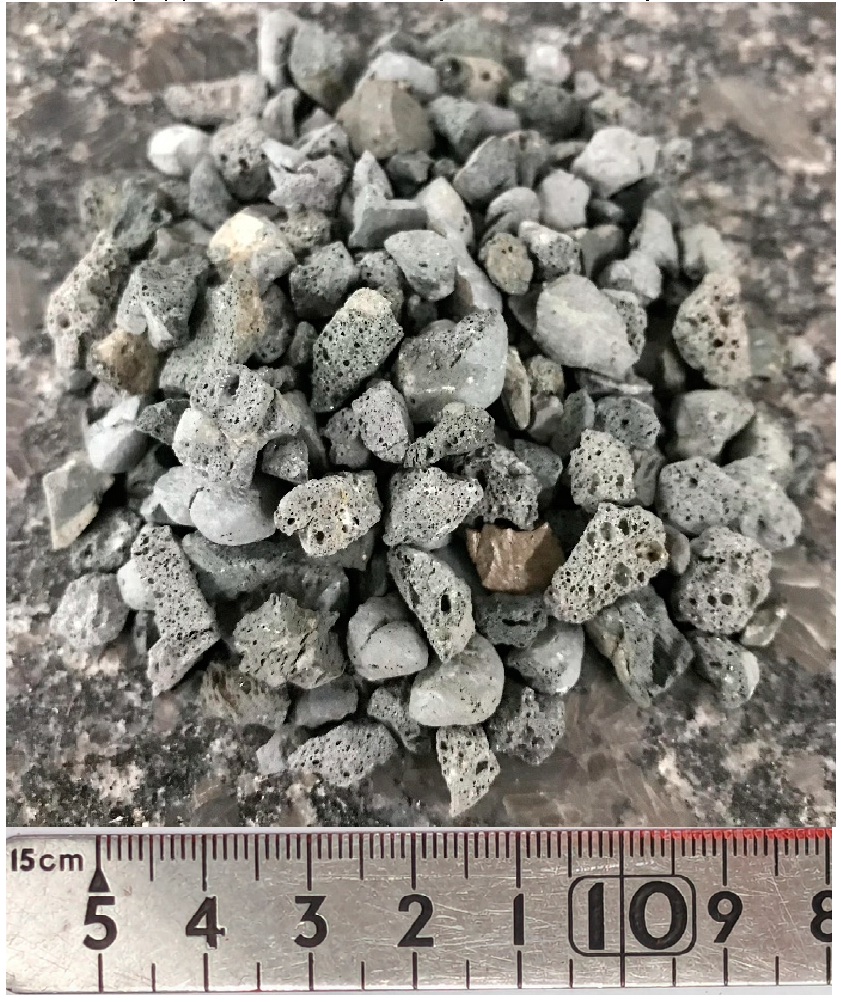
2.2. Materials
2.3. Strain implantation and the Mixing Proportions of LWAC
2.4. The casting and curing of the specimens
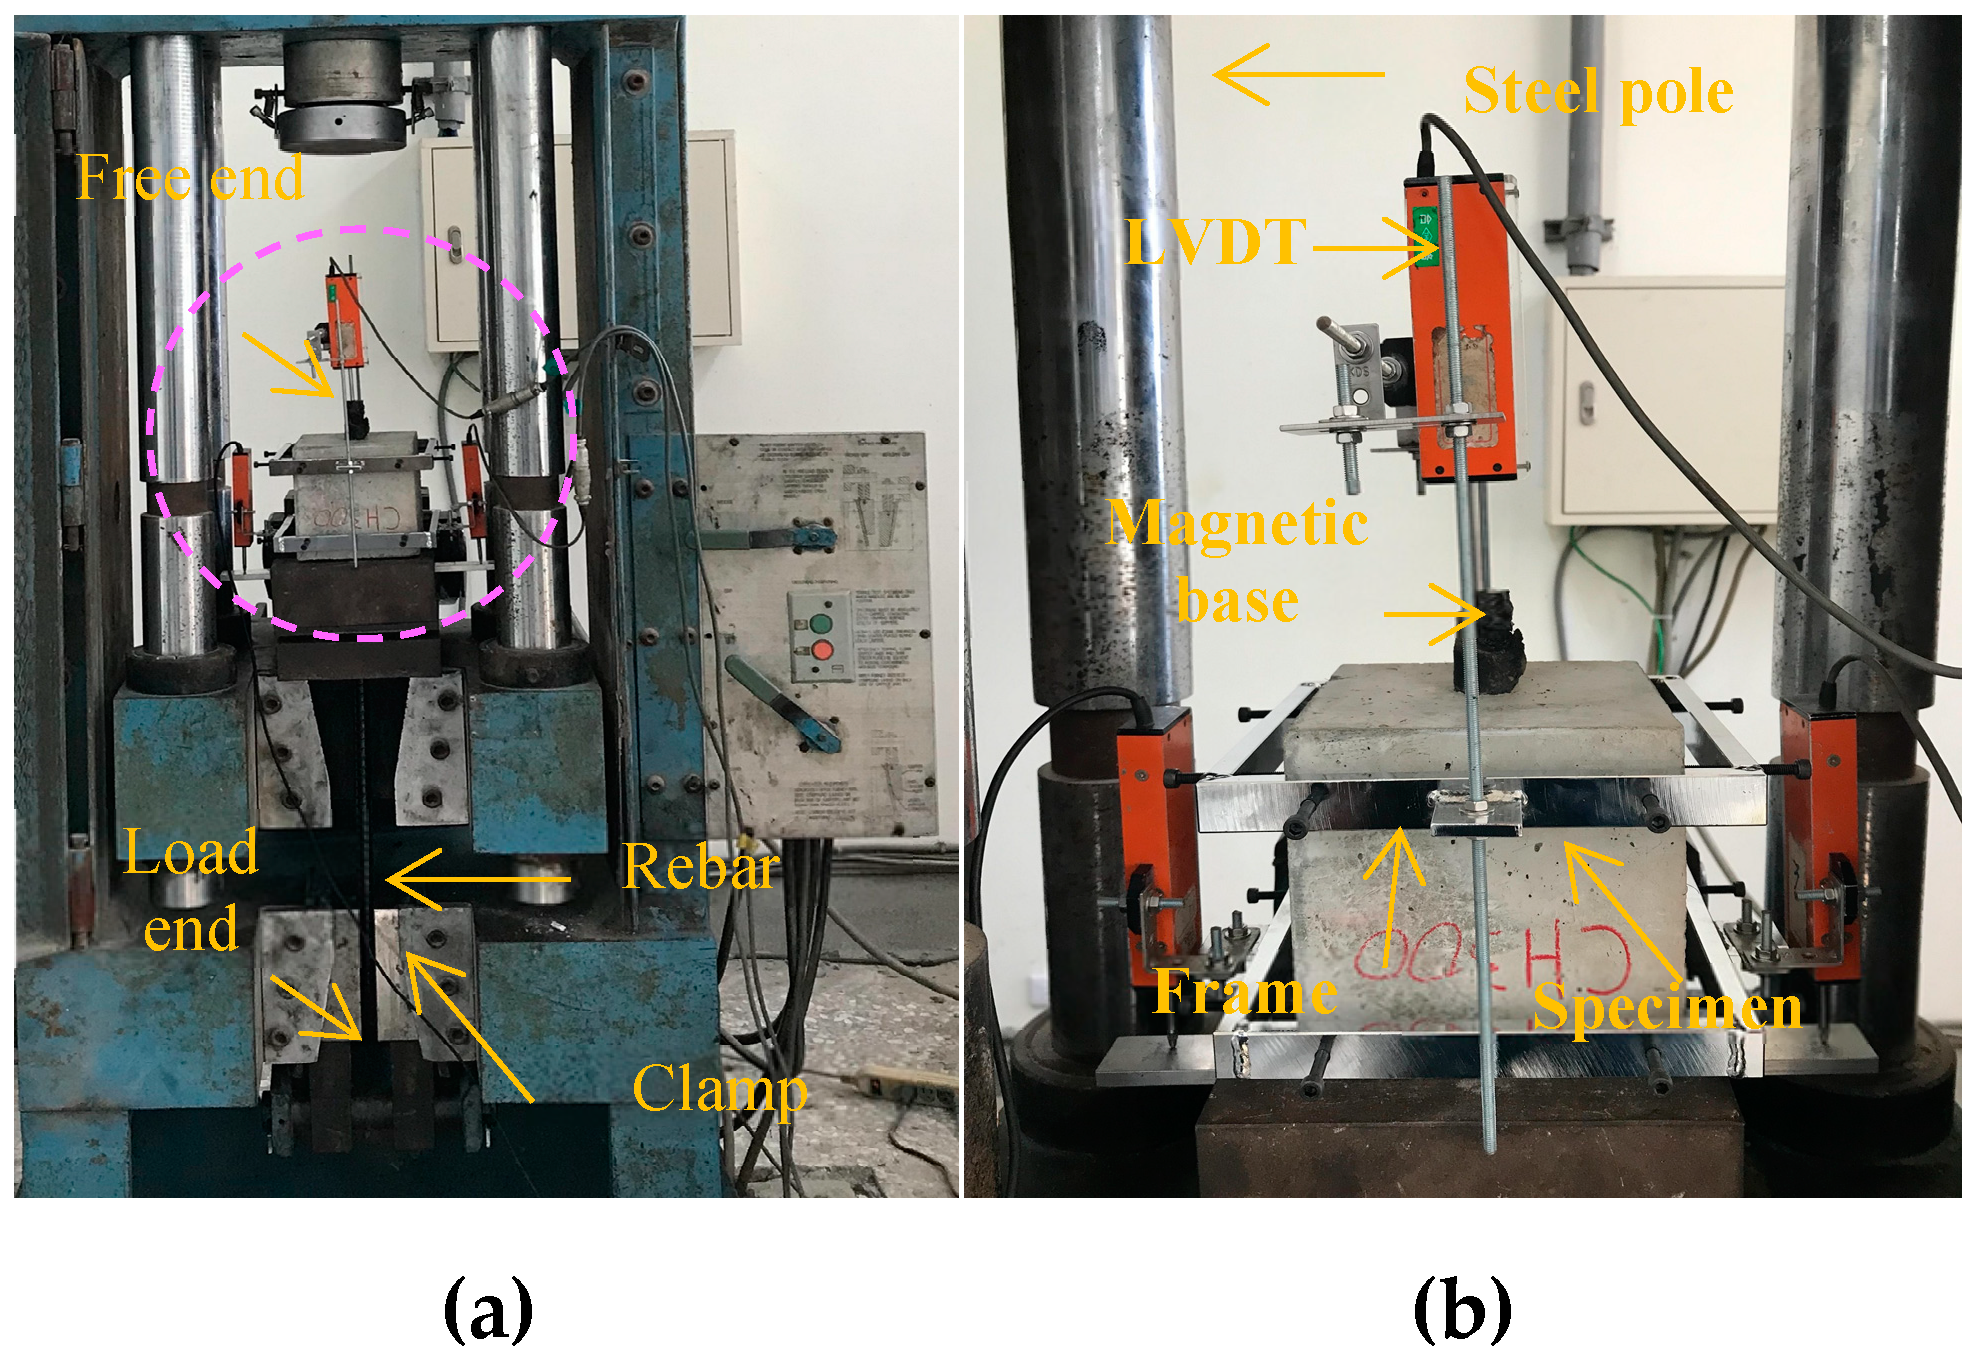
2.5. Test methods and data analysis
3. Experimental Results and Discussions
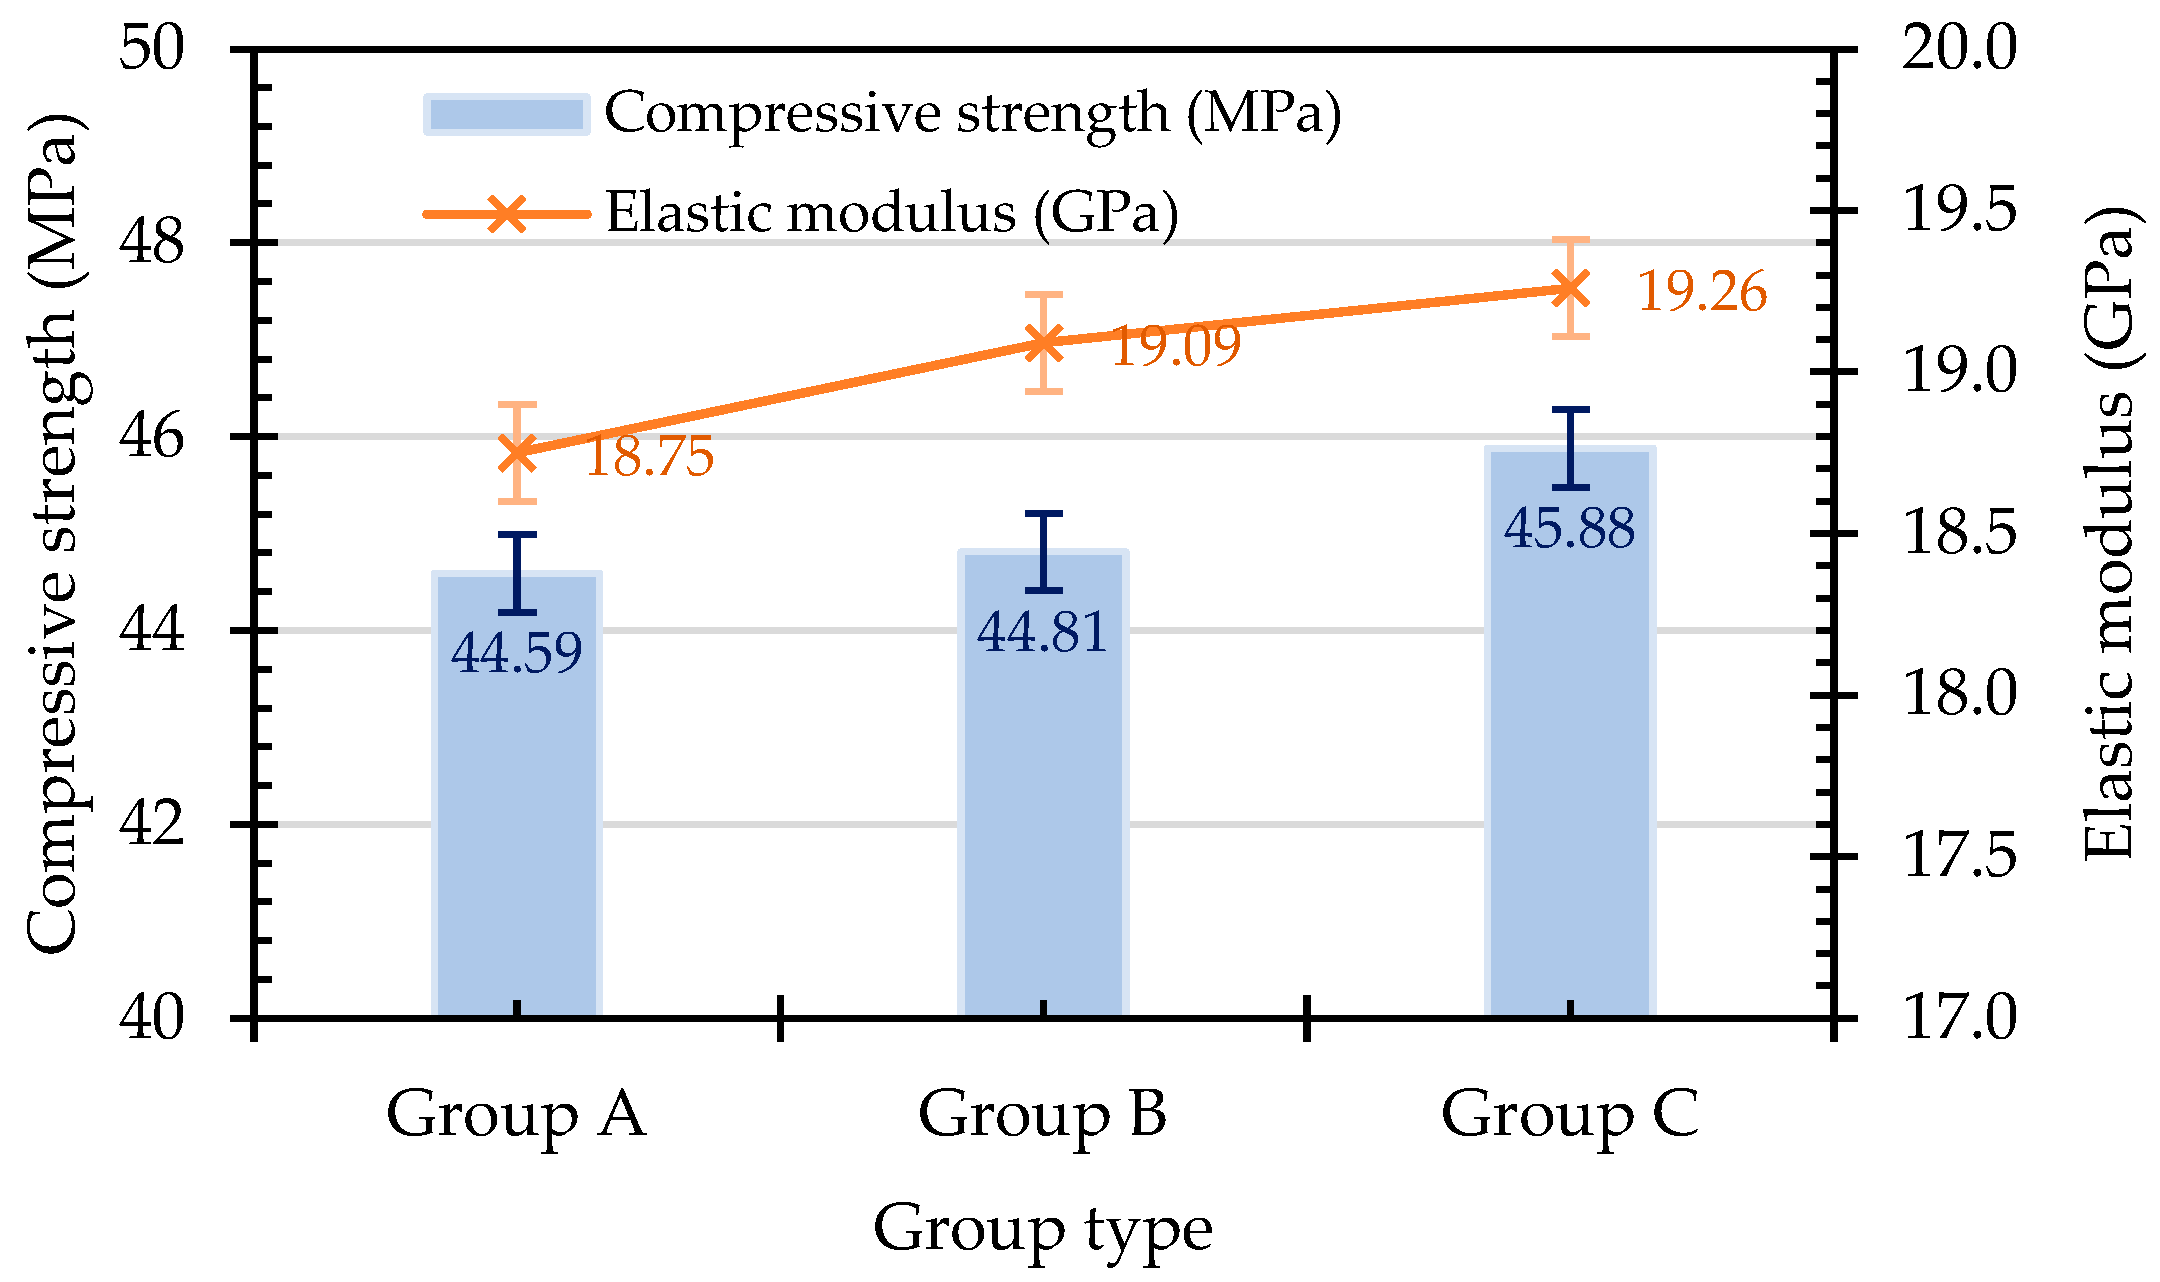
3.1. Results of the Fresh Properties Test and Compression Test
3.2. Results of the Pull-Out Test
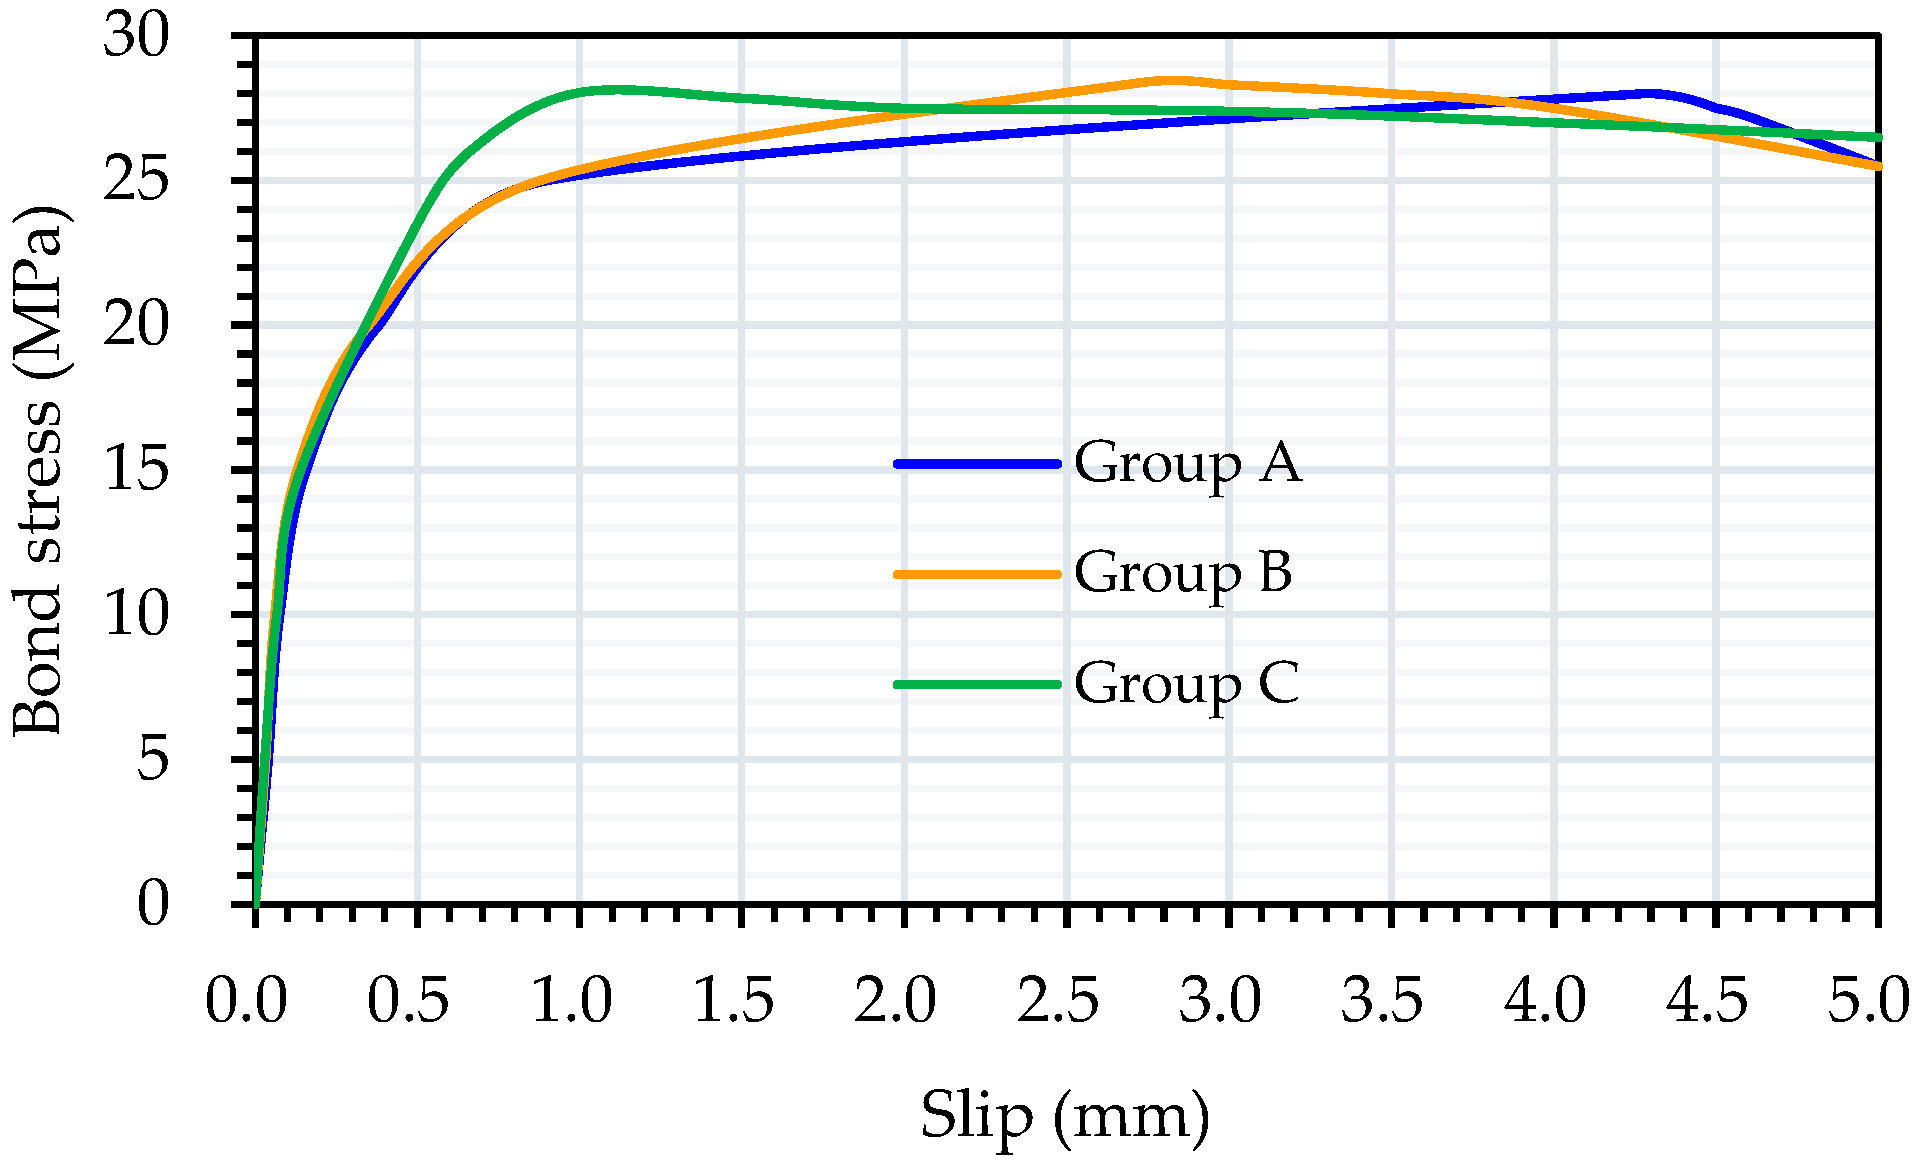
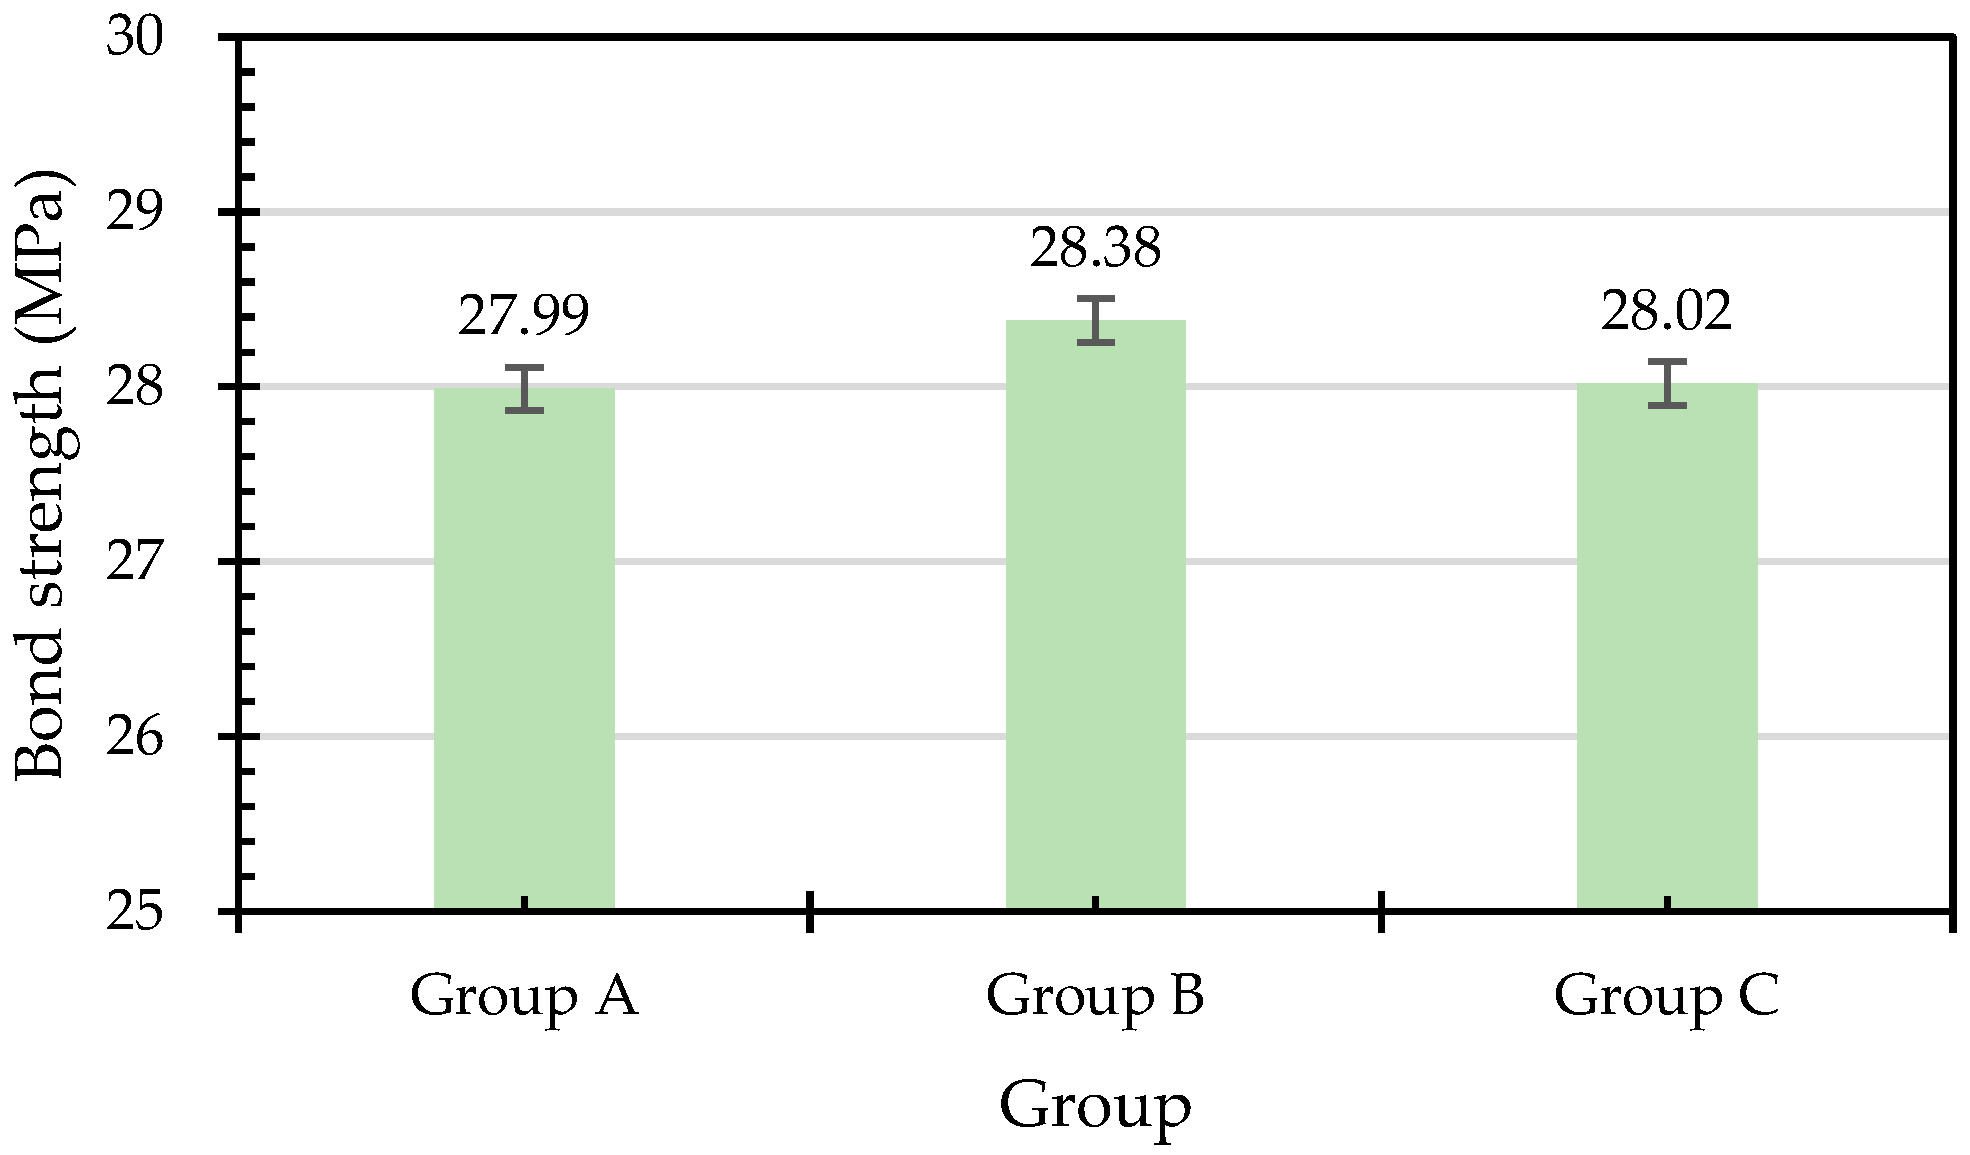
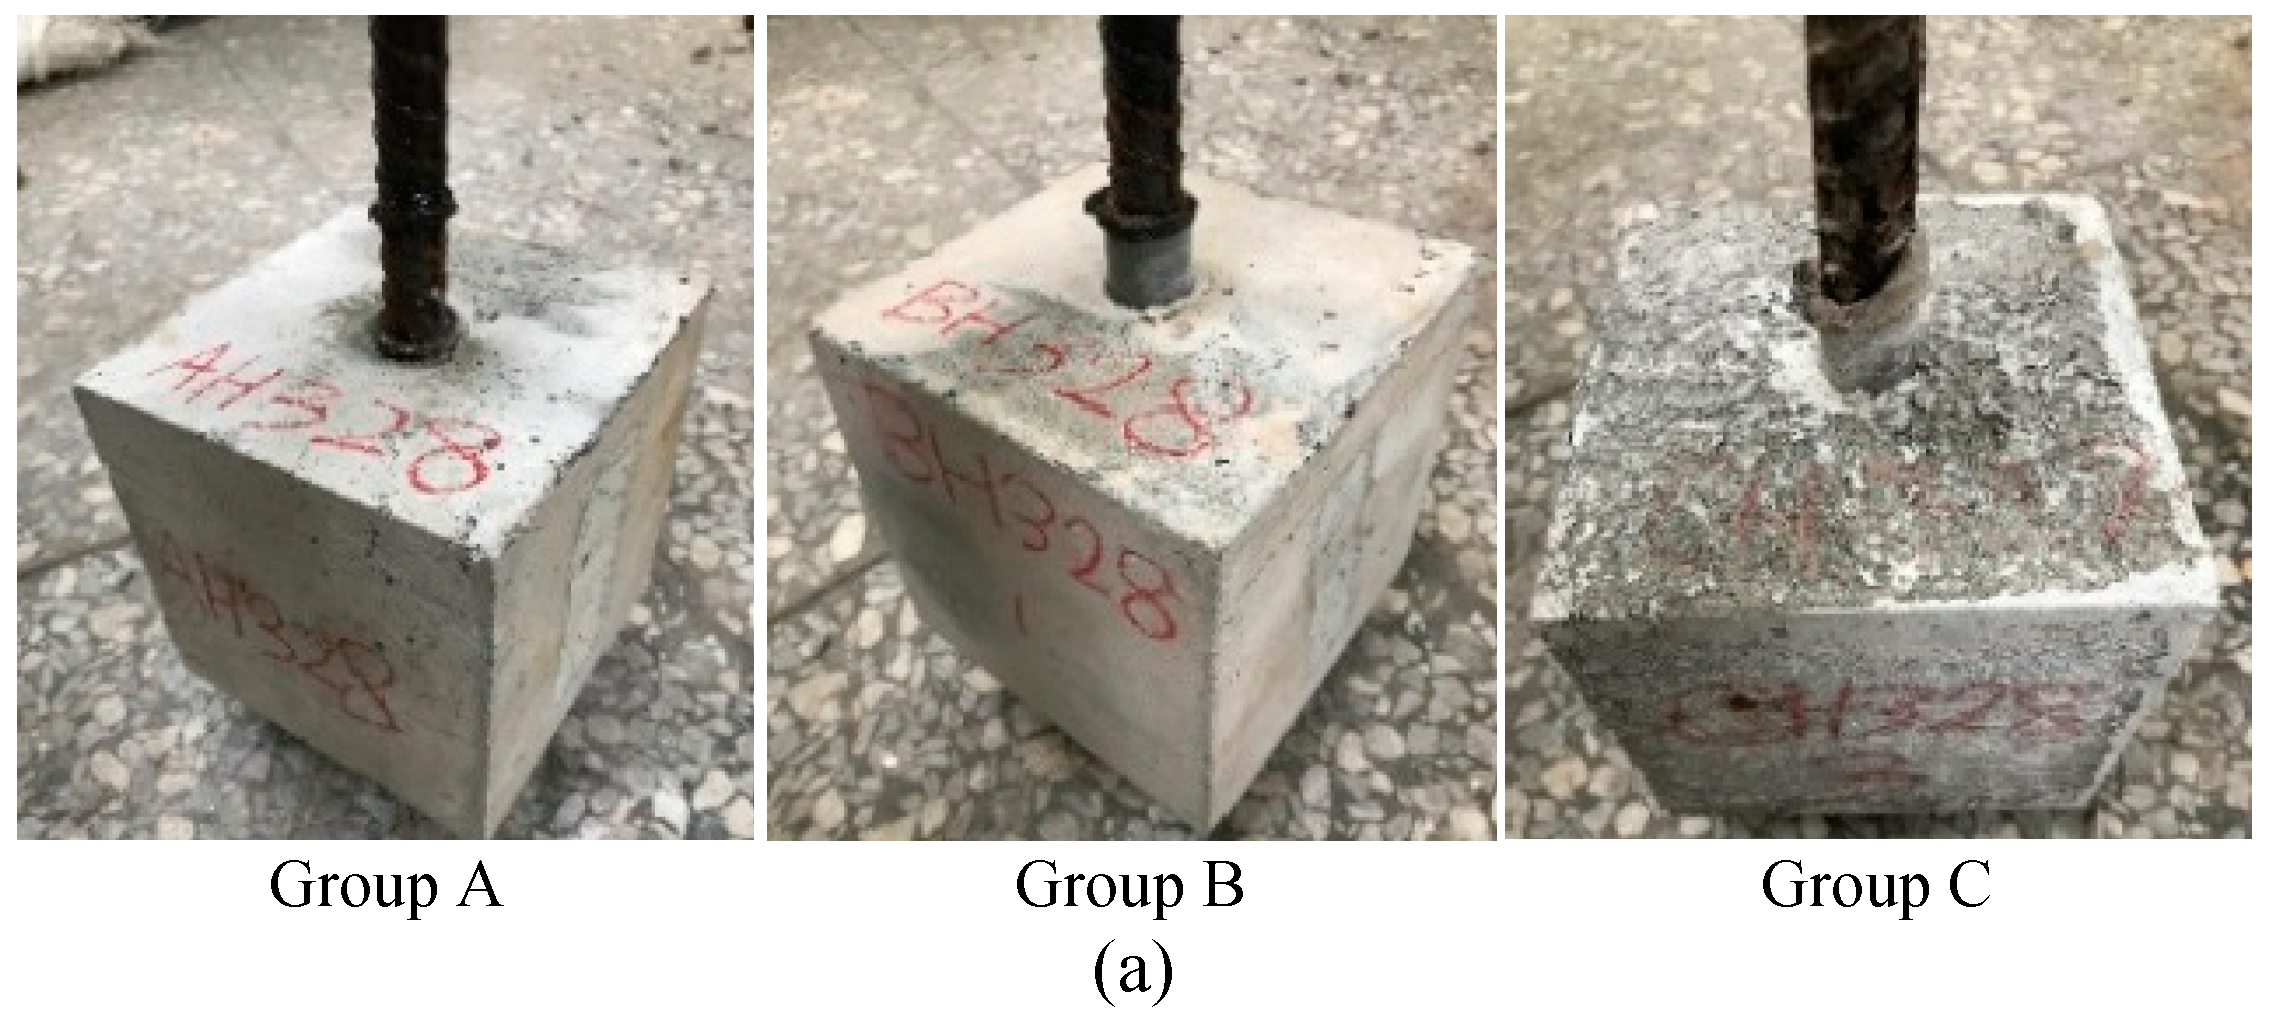
3.2.1. Local Bond–Slip Relationship and Bond Strength in LWAC at Room Temperature
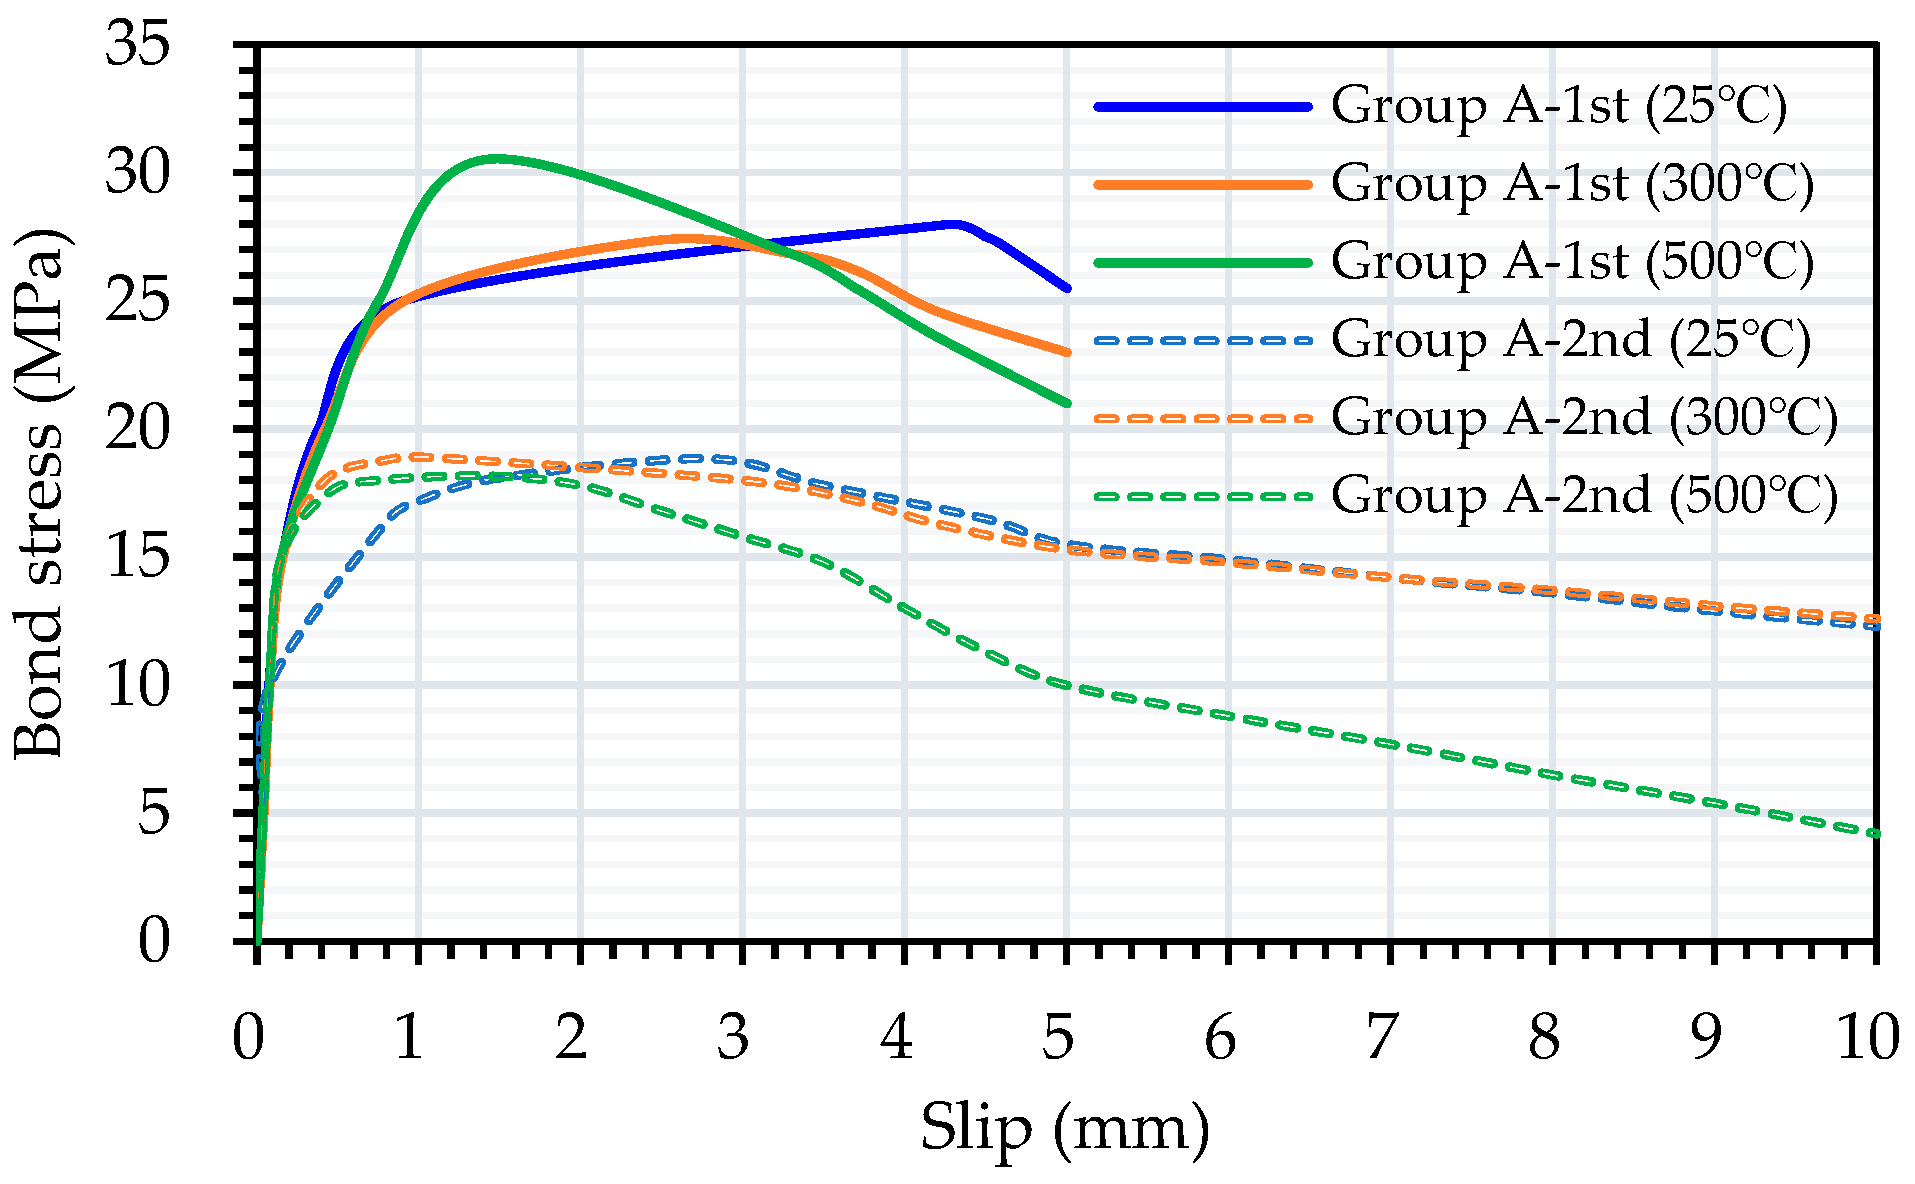
3.2.2. Local Bond–Slip Relationship and Bond Strength in Unhealed LWAC after Exposure to High Temperatures
3.2.3. Local Bond–Slip Relationship and Bond Strength in Healed LWAC after Exposure to High Temperatures
3.3. The Results of the Concrete Crack-Healing Observation
3.4. The Results of FESEM, EDS, and XRD Analysis
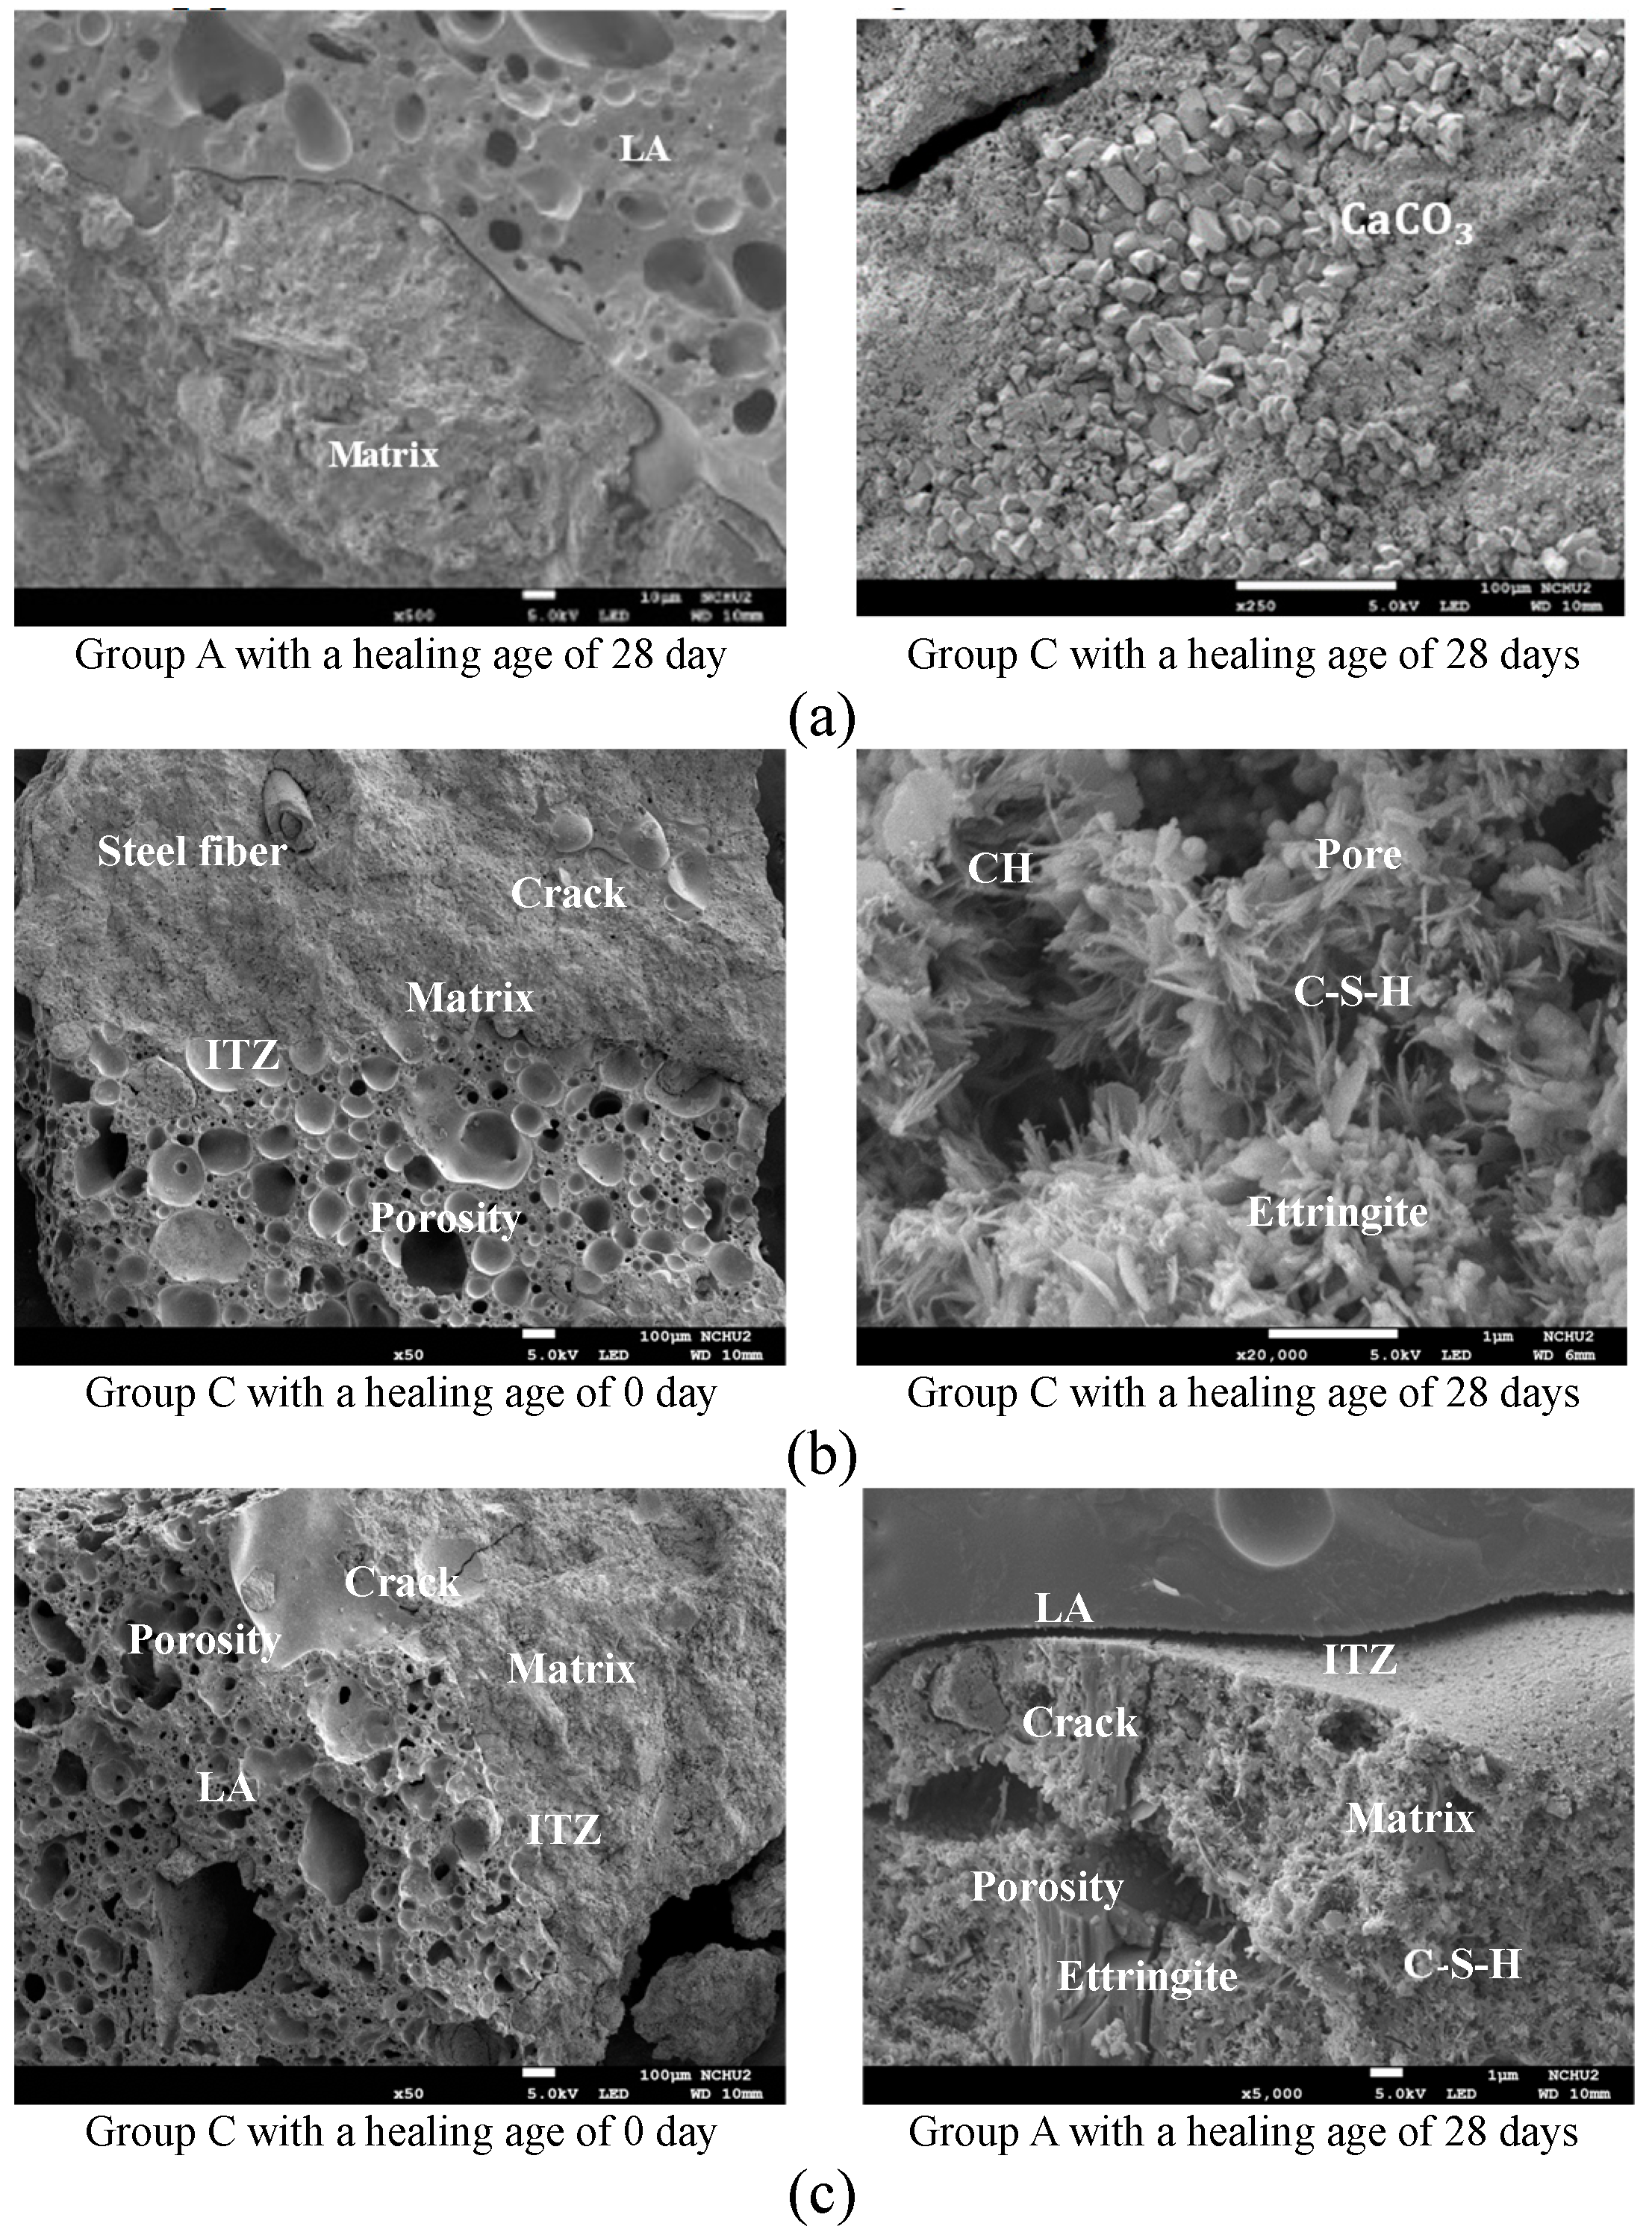
3.4.1. Results of the FESEM images
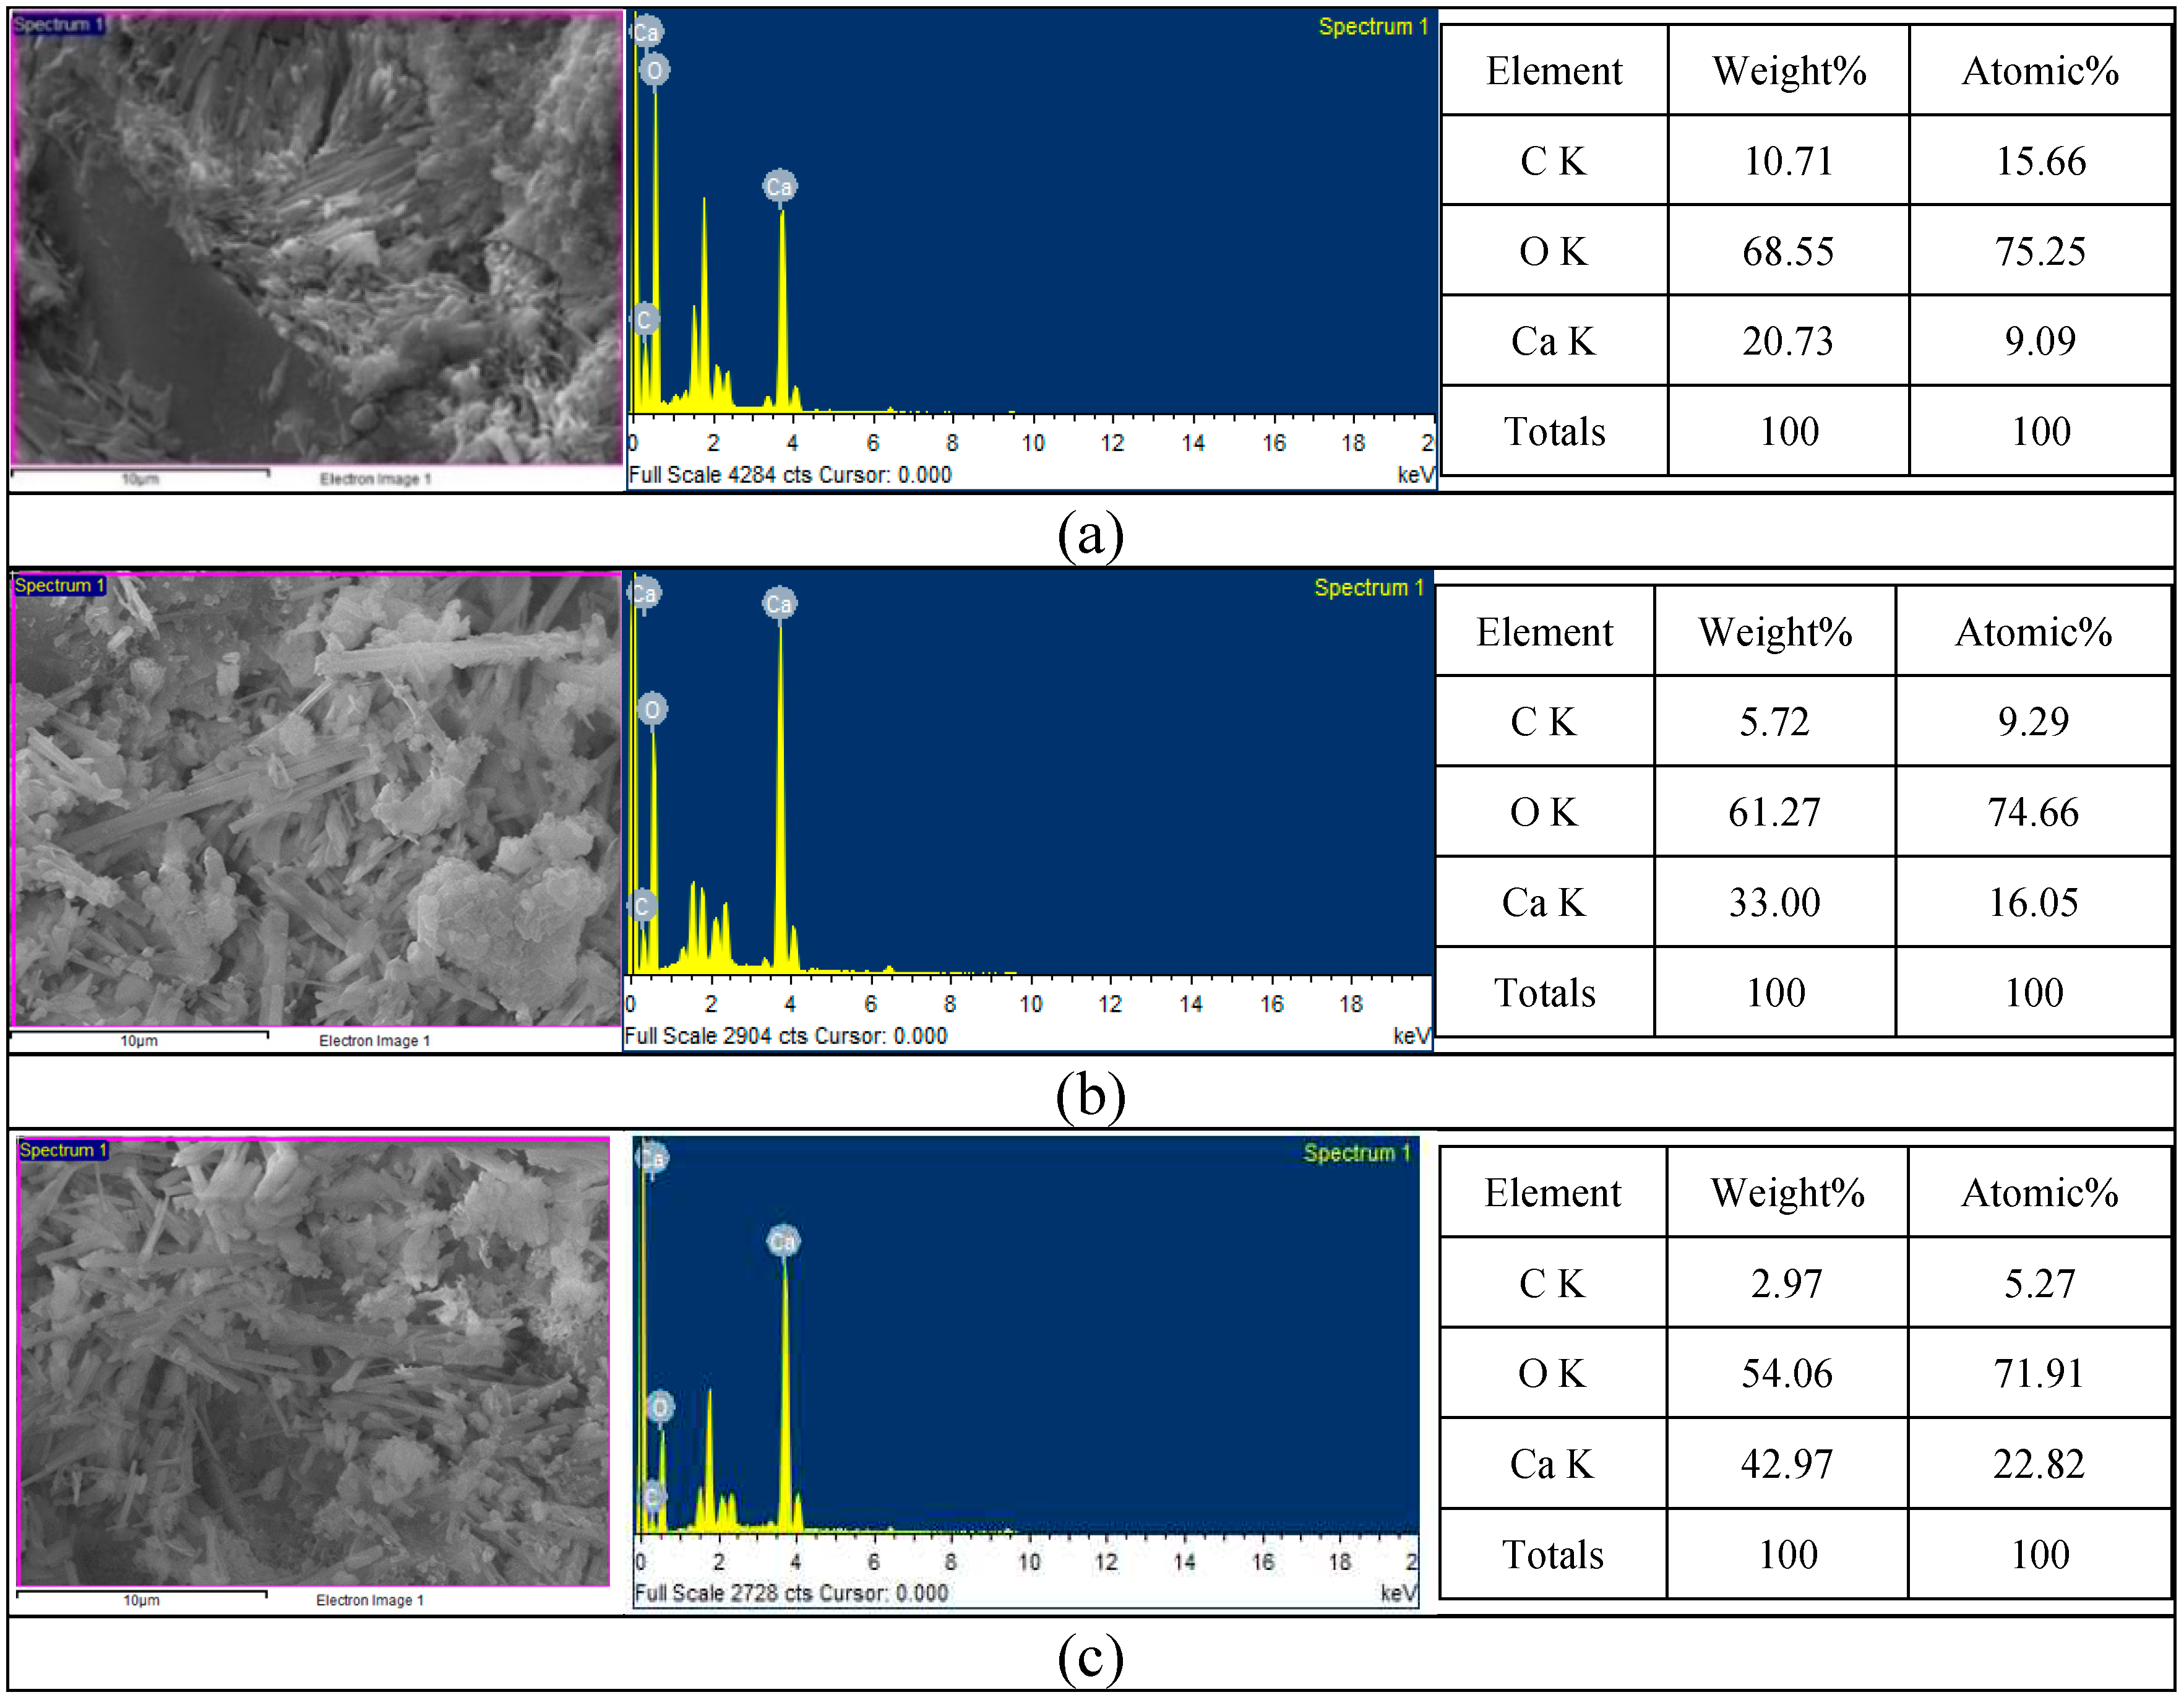
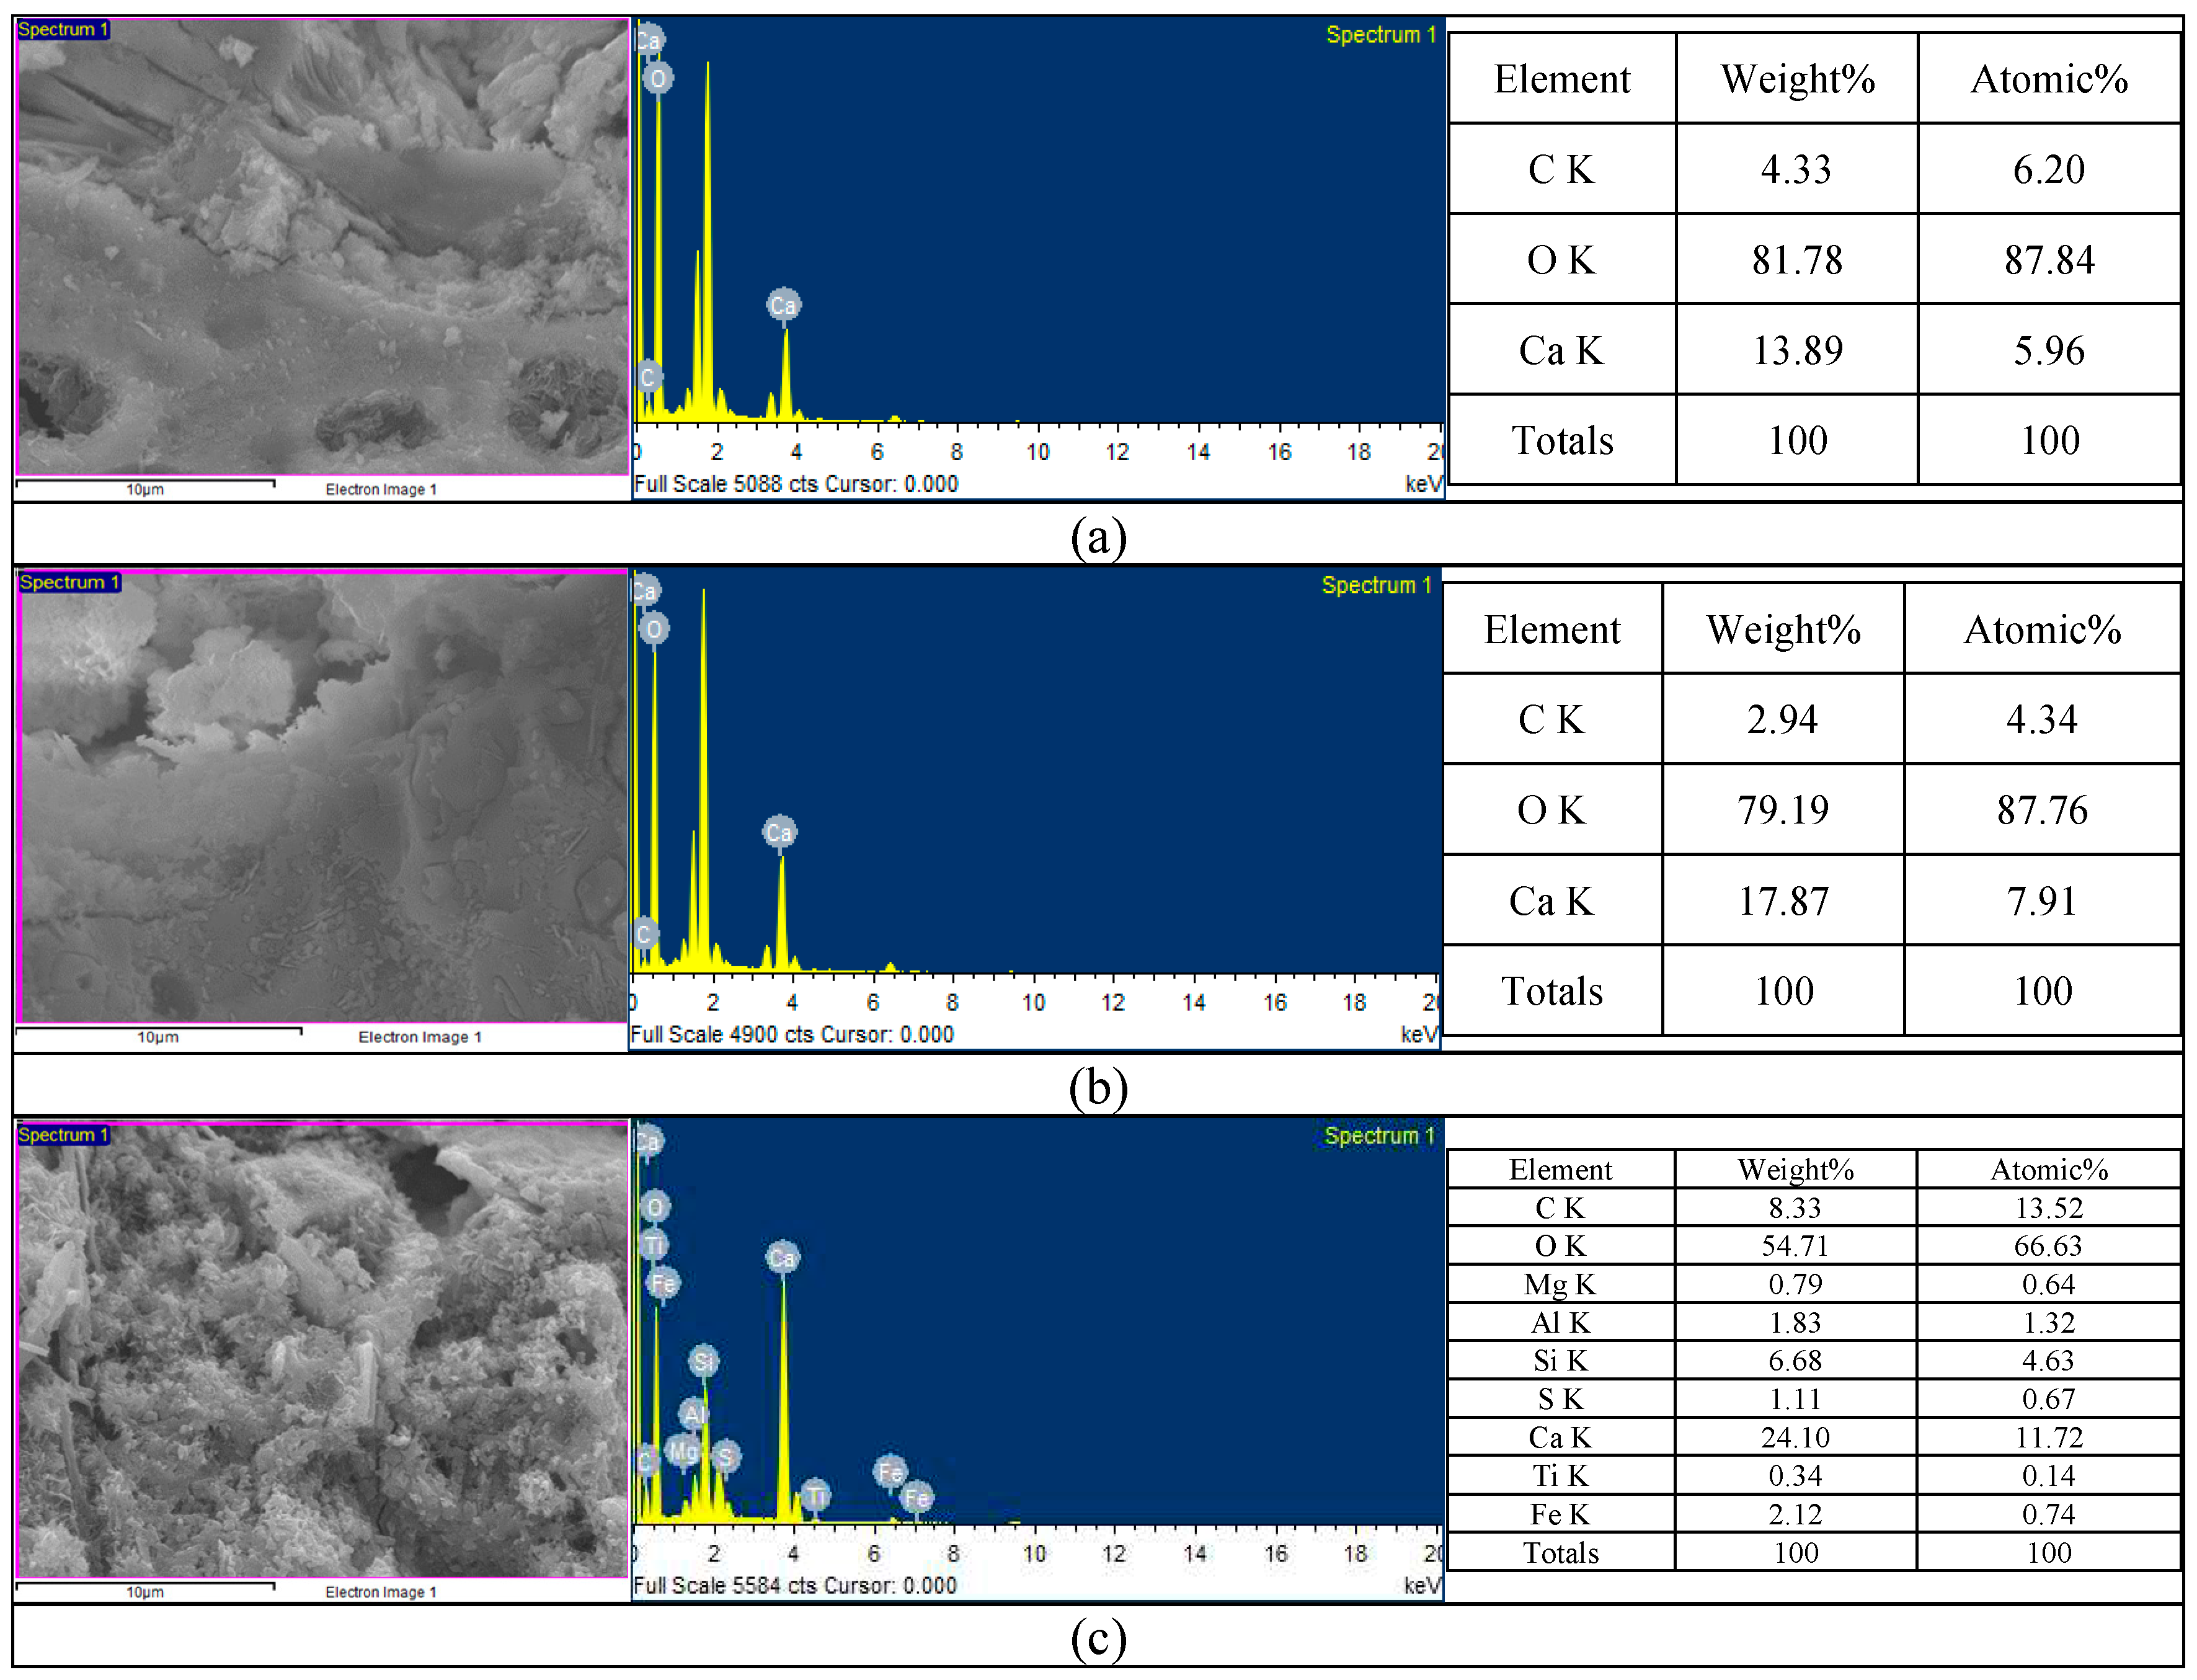
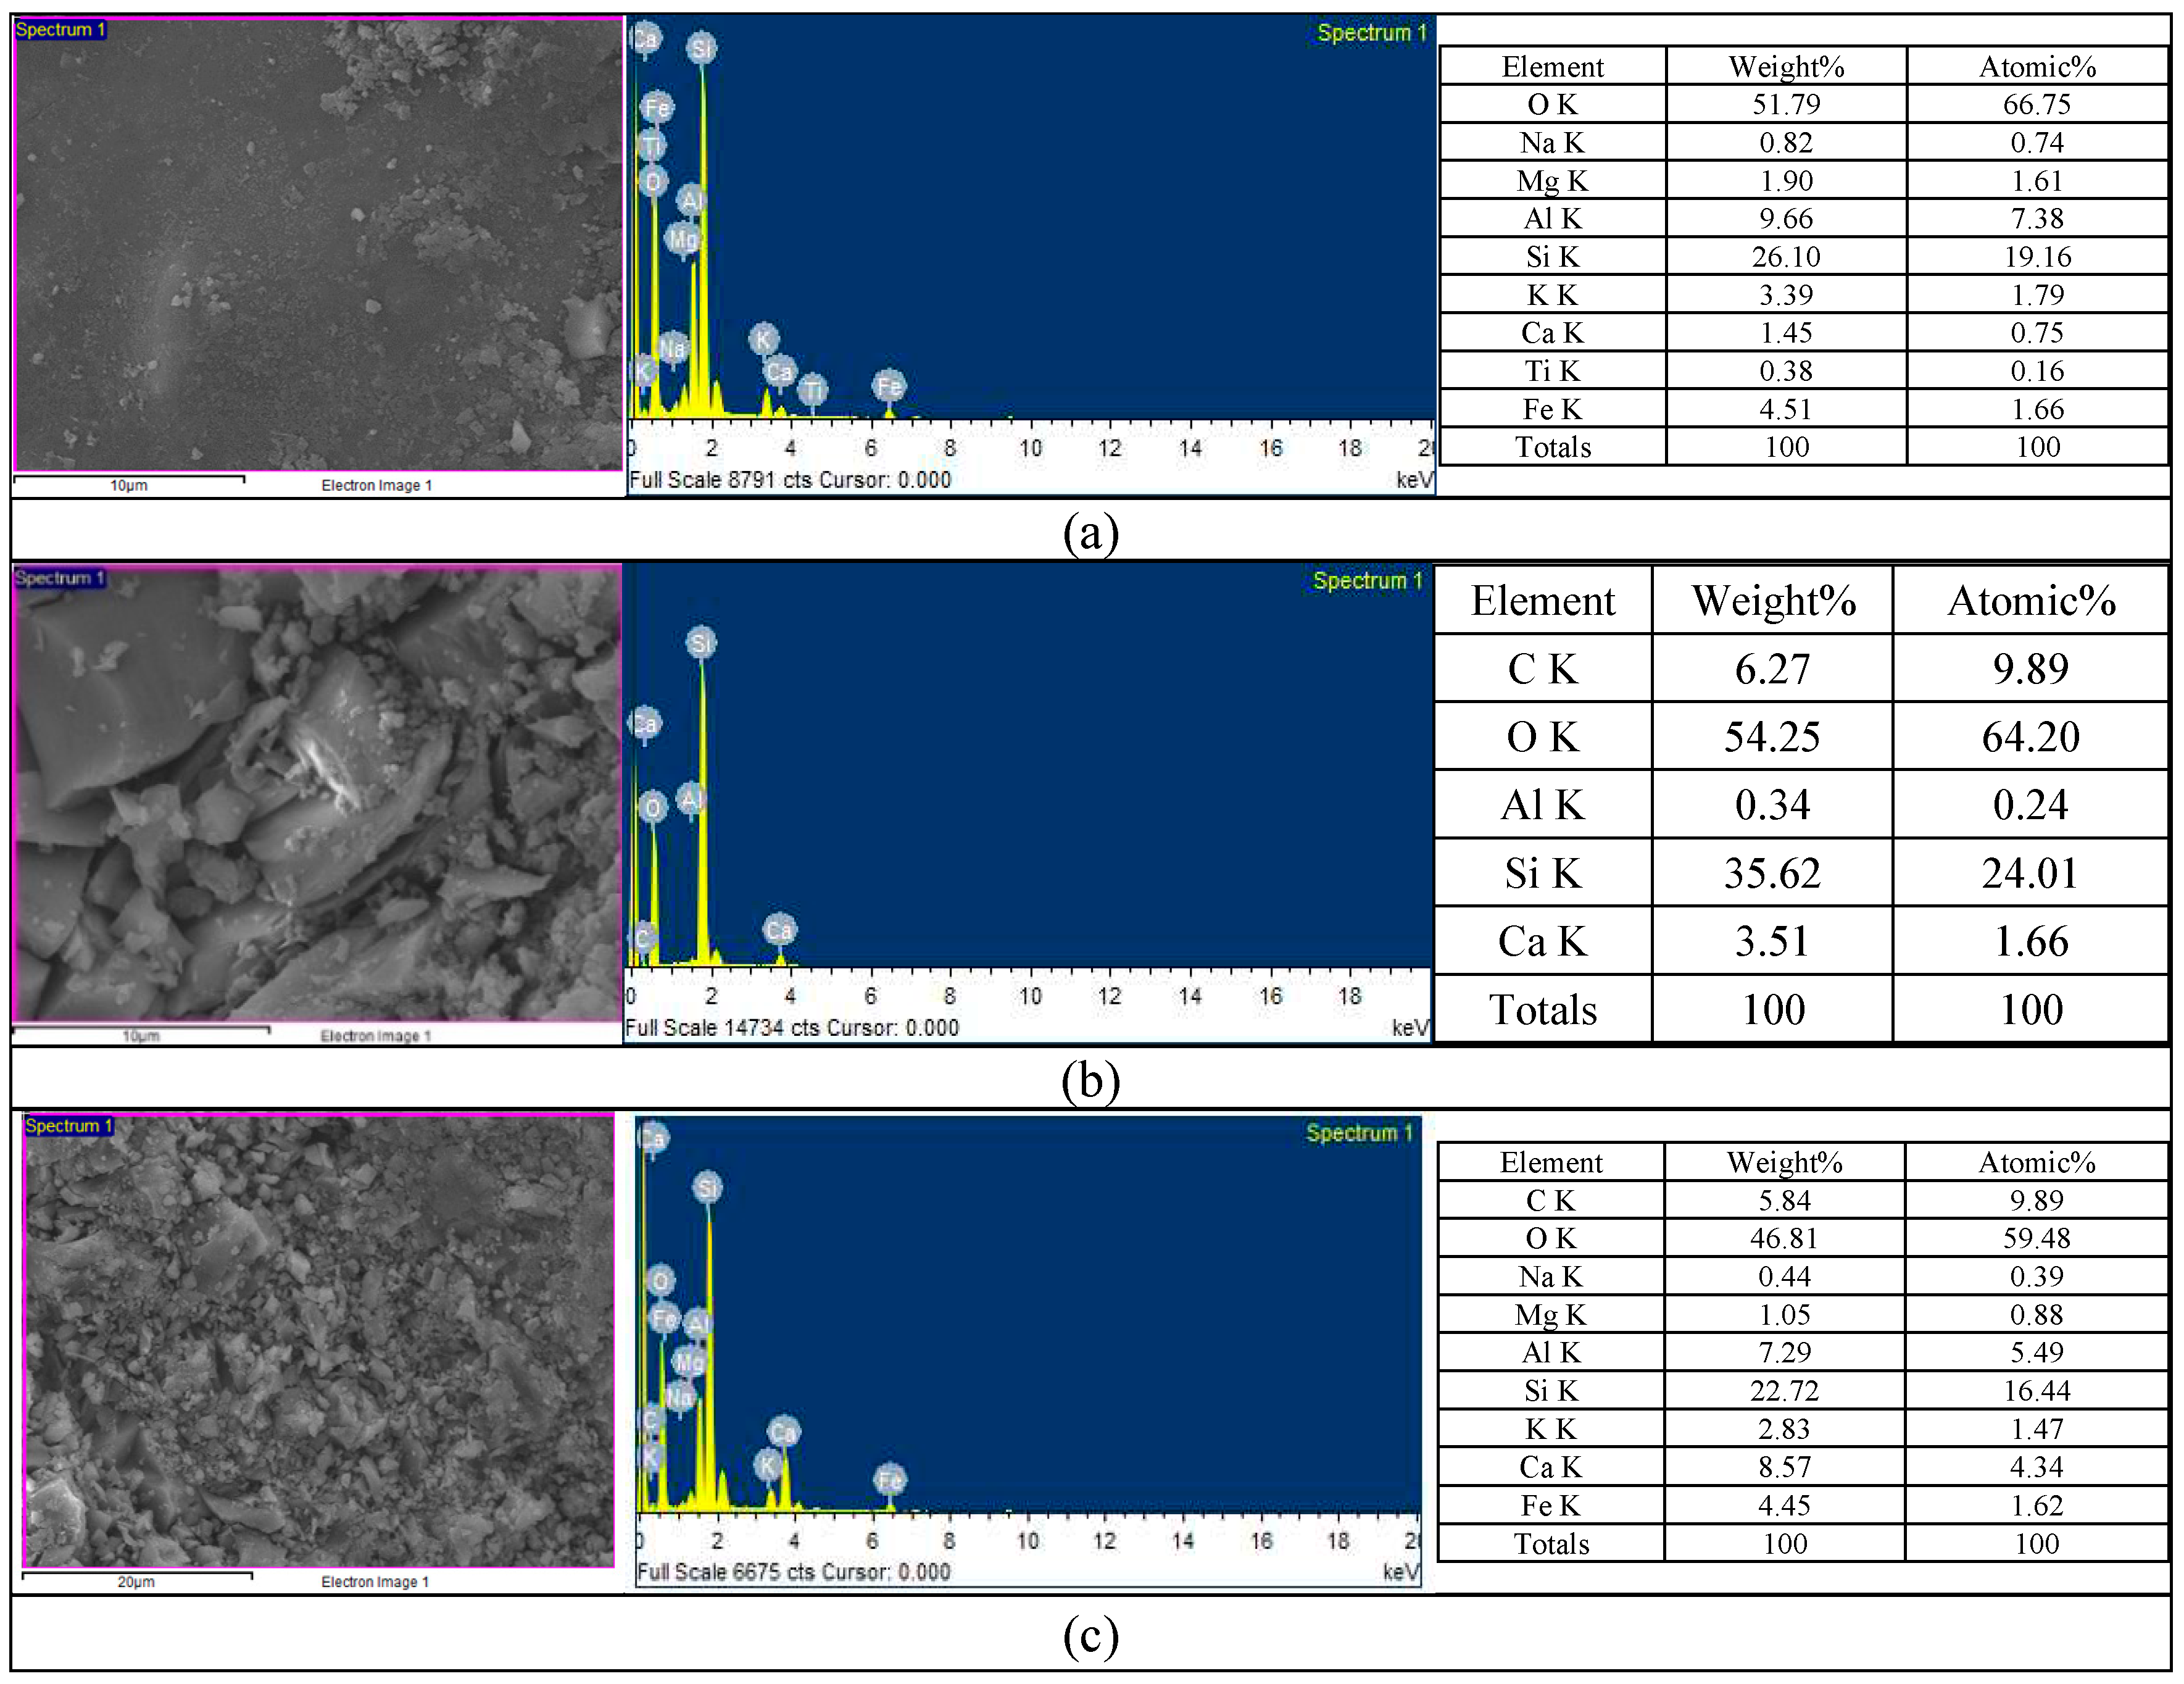
3.4.2. Results of the EDS analysis
3.4.3. Results of the XRD Analysis
4. Conclusions
Author Contributions
Funding
Institutional Review Board Statement
Informed Consent Statement
Data Availability Statement
Acknowledgments
Conflicts of Interest
References
- Tang, C.-W. Uniaxial bond stress-slip behavior of reinforcing bars embedded in lightweight aggregate concrete. Struct. Eng. Mech. 2017, 62, 651–661. [Google Scholar] [CrossRef]
- Gao, J.; Suqa, W.; Morino, K. Mechanical properties of steel fiber-reinforced, high-strength, lightweight concrete. Cem. Concr. Compos. 1997, 19, 307–313. [Google Scholar] [CrossRef]
- Guneyisi, E.; Gesoglu, M.; Azez, O.A.; Öz, H.Ö. Effect of nano silica on the workability of self-compacting concretes having untreated and surface treated lightweight aggregates. Construct. Build. Mater. 2016, 115, 371–380. [Google Scholar] [CrossRef]
- Inozemtcev, A.S.; Epikhin, S.D. Conditions for the Preparation of Self-Compacting Lightweight Concrete with Hollow Microspheres. Materials 2023, 16, 7288. [Google Scholar] [CrossRef] [PubMed]
- Bicer, A.; Celik, N.; Ozgen, F.; Kistak, C.; Taskiran, A. Thermomechanical Properties of a Concrete Composed of Cherry Tree Resin and Expanded Clay (Exclay) Aggregate. Appl. Sci. 2024, 14, 336. [Google Scholar] [CrossRef]
- Stratoura, M.C.; Lazari, G.-E.D.; Badogiannis, E.G.; Papadakis, V.G. Perlite and Rice Husk Ash Re-Use As Fine Aggregates in Lightweight Aggregate Structural Concrete—Durability Assessment. Sustainability 2023, 15, 4217. [Google Scholar] [CrossRef]
- Youssf, O.; Roychand, R.; Elchalakani, M.; Tahwia, A.M. Assessment of the Efficiency of Eco-Friendly Lightweight Concrete as Simulated Repair Material in Concrete Joints. Buildings 2024, 14, 37. [Google Scholar] [CrossRef]
- Różycki, M.; Hager, I.; Zdeb, T.; Sitarz, M.; Mróz, K.; Zdeb, J.; Smorońska, N. Mechanical Properties and Water Permeability of Textile-Reinforced Reactive Powder Concrete with Lightweight Aggregate. Materials 2023, 16, 7619. [Google Scholar] [CrossRef] [PubMed]
- Chen, H.-J.; Chen, T.-K.; Tang, C.-W.; Chang, H.-W. The Evaluation of the Effectiveness of Biomineralization Technology in Improving the Strength of Damaged Fiber-Reinforced LWAC. Materials 2024, 17, 214. [Google Scholar] [CrossRef]
- Zhao, M.; Zhao, M.; Chen, M.; Li, J.; Law, D. An experimental study on strength and toughness of steel fiber reinforced expanded-shale lightweight concrete. Constr. Build. Mater. 2018, 183, 493–501. [Google Scholar] [CrossRef]
- Kovács, T.; Gyurkó, Z.; Jakab, L.; Nemes, R. Influence of Unidirectional Cyclic Loading on Bond between Steel Bars Embedded in Lightweight Aggregate Concrete. Solids 2022, 3, 397–415. [Google Scholar] [CrossRef]
- Abed, M.A.; Alkurdi, Z.; Fořt, J.; Černý, R.; Solyom, S. Bond Behavior of FRP Bars in Lightweight SCC under Direct Pull-Out Conditions: Experimental and Numerical Investigation. Materials 2022, 15, 3555. [Google Scholar] [CrossRef] [PubMed]
- Solyom, S.; Di Benedetti, M.; Balázs, G.L. Bond of FRP bars in air-entrained concrete: Experimental and statistical study. Constr.Build. Mater. 2021, 300, 124193. [Google Scholar] [CrossRef]
- Solyom, S.; Balázs, G.L. Analytical and statistical study of the bond of FRP bars with different surface characteristics. Compos. Struct. 2021, 270, 113953. [Google Scholar] [CrossRef]
- Huang, L.; Chi, Y.; Xu, L.; Chen, P.; Zhang, A. Local bond performance of rebar embedded in steel-polypropylene hybrid fiber reinforced concrete under monotonic and cyclic loading. Constr. Build. Mater. 2016, 103, 77–92. [Google Scholar] [CrossRef]
- ACI Committee 408; Bond and Development of Straight Reinforcing Bars in Tension (ACI 408R–03). American Concrete Institute: Farmington Hills, MI, USA, 2003.
- ACI Committee 318-19; Building Code Requirements for Structural Concrete and Commentary. American Concrete Institute: Farmington Hills, MI, USA, 2019.
- Hossain, K.M.A. Bond characteristics of plain and deformed bars in lightweight pumice concrete. Constr. Build. Mater. 2008, 22, 1491–2149. [Google Scholar] [CrossRef]
- Mo, K.H.; Alengaram, U.J.; Visintin, P.; Goh, S.H.; Jumaat, M.Z. Influence of lightweight aggregate on the bond properties of concrete with various strength grades. Constr. Build. Mater. 2015, 84, 377–386. [Google Scholar] [CrossRef]
- CEB-FIP. Fib Model Code for Concrete Structures 2010; Comité Euro international du Béton/Federation Internationale de la Precontrainte: Lausanne, Switzerland, 2013. [Google Scholar]
- Wang, B.; Zhu, E.; Zhang, Z.; Zhu, C. Bond-slip behaviour of lightweight aggregate concrete based on virtual crack model with exponential softening characteristics. Constr. Build. Mater. 2022, 345, 128349. [Google Scholar] [CrossRef]
- Liu, Y.; Liu, X.; Wu, T.; Luo, X.; Feng, W. Bond-slip behavior between corroded rebar and lightweight aggregate concrete. Constr. Build. Mater. 2023, 367, 130268. [Google Scholar] [CrossRef]
- Yang, X.; Wu, T.; Liu, X.; Liu, Y. Bond-slip relationship of rebar in lightweight aggregate concrete. Structures 2022, 45, 2198–2209. [Google Scholar] [CrossRef]
- Varghese, A.; Anand, N.; Arulraj, G.P.; Alengaram, U.J. Influence of fibers on bond strength of concrete exposed to elevated temperature. J. Adhe. Sci. Tech. 2019, 33, 1521–1543. [Google Scholar] [CrossRef]
- Kevinly, C.; Du, P.; Tan, K.H. Local bond-slip behaviour of reinforcing bars in fibre reinforced lightweight aggregate concrete at ambient and elevated temperatures. Constr. Build. Mater. 2023, 377, 131010. [Google Scholar] [CrossRef]
- Tang, C.-W. Local bond–slip behavior of fiber reinforced LWAC after exposure to elevated temperatures. Struct. Eng. Mech. 2020, 73, 437–445. [Google Scholar] [CrossRef]
- Hermawan, H.; Wiktor, V.; Gruyaert, E.; Serna, P. Experimental investigation on the bond behaviour of steel reinforcement in self-healing concrete. Constr. Build. Mater. 2023, 383, 131378. [Google Scholar] [CrossRef]
- Dry, C.M. Three designs for the internal release of sealants, adhesives, and waterproofing chemicals into concrete to reduce permeability. Cem. Concr. Res. 2000, 30, 1969–1977. [Google Scholar] [CrossRef]
- Stanaszek-Tomal, E. Bacterial Concrete as a Sustainable Building Material? Sustainability 2020, 12, 696. [Google Scholar] [CrossRef]
- Jonkers, H.M.; Thijssen, A.; Muyzer, G.; Copuroglu, O.; Schlangen, E. Application of bacteria as self-healing agent for the development of sustainable concrete. Ecol. Eng. 2010, 36, 230–235. [Google Scholar] [CrossRef]
- Xu, J.; Wang, X.; Zuo, J.; Liu, X. Self-healing of concrete cracks by ceramsite-loaded microorganisms. Adv. Mater. Sci. Eng. 2018, 2018, 5153041. [Google Scholar] [CrossRef]
- Nimafar, M.; Samali, B.; Hosseini, S.J.; Akhlaghi, A. Use of Bacteria Externally for Repairing Cracks and Improving Properties of Concrete Exposed to High Temperatures. Crystals 2021, 11, 1503. [Google Scholar] [CrossRef]
- Chen, H.-J.; Chang, H.-L.; Tang, C.-W.; Yang, T.-Y. Application of biomineralization technology to self-healing of fiber-reinforced lightweight concrete after high temperatures. Materials 2022, 15, 7796. [Google Scholar] [CrossRef]
- Krishnapriya, S.; Babu, D.L.V.; Arulraj, G.P. Isolation and identification of bacteria to improve the strength of concrete. Microbiol. Res. 2015, 174, 48–55. [Google Scholar] [CrossRef] [PubMed]
- Wiktor, V.; Jonkers, H.M. Case Studies in Construction Materials Field performance of bacteria-based repair system: Pilot study in a parking garage. Case Stud. Constr. Mater. 2015, 2, 11–17. [Google Scholar]
- De Muynck, W.; Verstraete, W. Bacterial carbonate precipitation as an alternative surface treatment for concrete. Constr. Build. Mater. 2008, 22, 875–885. [Google Scholar] [CrossRef]
- Chen, H.-J.; Peng, C.-F.; Tang, C.-W.; Chen, Y.-T. Self-Healing Concrete by Biological Substrate. Materials 2019, 12, 4099. [Google Scholar] [CrossRef] [PubMed]
- Tang, C.-W. Local bond stress-slip behavior of reinforcing bars embedded in lightweight aggregate concrete. Comput. Concr. 2015, 16, 449–466. [Google Scholar] [CrossRef]
- Meng, L.; Zhang, C.; Wei, J.; Li, L.; Liu, J.; Wang, S.; Ding, Y. Mechanical properties and microstructure of ultra-high strength concrete with lightweight aggregate. Case Stud. Constr. Mater. 2023, 18, e01745. [Google Scholar] [CrossRef]
- Bremner, T.W.; Holm, T.A. Elastic compatibility and the behavior of concrete. ACI J. 1986, 83, 244–250. [Google Scholar] [CrossRef]
- Lu, J.X. Recent advances in high strength lightweight concrete: From development strategies to practical applications. Constr. Build. Mater. 2023, 400, 132905. [Google Scholar] [CrossRef]
- Cairns, J.; Jones, K. An evaluation of the bond-splitting action of ribbed bars. ACI Mater J 1996, 93, 10–19. [Google Scholar]
- Harajli, M.H.; Hout, M.; Jalkh, W. Local bond stress-slip behaviour of reinforcing bars embedded in plain and fibre concrete. ACI Mater. J. 1995, 92, 343–353. [Google Scholar] [CrossRef]
- Shima, H.; Chou, L.L.; Okamura, H. Micro and macro models for bond in reinforced concrete. J. Fac. Eng. 1987, 39, 133–194. [Google Scholar]
- Soroushian, P.; Mirza, F.; Alhozaimy, A. Bonding of confined steel fiber reinforced concrete to deformed bars. ACI Mater. J. 1994, 91, 144–149. [Google Scholar]
- Metha, P.K.; Monteiro, P.J.M. Concrete: Microstructure, Properties and Materials, 3rd ed.; McGraw-Hill: New York, NY, USA, 2006. [Google Scholar]
- Siddique, R.; Kaur, D. Properties of concrete containing ground granulated blast furnace slag (GGBFS) at elevated temperatures. J. Adv. Res. 2012, 3, 45–51. [Google Scholar] [CrossRef]
- Bazant, Z.P.; Kaplan, M.F. Concrete at High Temperatures; Longman Group: London, UK, 1996; pp. 1–20. [Google Scholar]
- Wang, H.; Lyu, H.; Liu, T.; Li, Y.; Tan, K.H. Effect of post-fire curing on compressive strength of ultra-high performance concrete and mortar. Constr. Build. Mater. 2022, 346, 128447. [Google Scholar] [CrossRef]
- Kadapure, S.A.; Deshannavar, U.B. (Bio-smart material in self-healing of concrete. Materials Today: Proceedings 2022, 49, 1498–1503. [Google Scholar] [CrossRef]
- Phillips, A.J.; Gerlach, R.; Lauchnor, E.; Mitchell, A.C.; Cunningham, A.B.; Spangler, L. Engineered applications of ureolytic biomineralization: A review. Biofouling 2013, 29, 715–733. [Google Scholar] [CrossRef]
- Gao, Y.; Zhu, X.; Corr, D.J.; Konsta-Gdoutos, M.S.; Shah, S.P. Characterization of the interfacial transition zone of CNF-Reinforced cementitious composites. Cem. Concr. Compos. 2019, 99, 130–139. [Google Scholar] [CrossRef]






| Test Items | Test Parameters | ||
|---|---|---|---|
| Curing/healing method | Self-healing age (day) | Target temperature (°C) | |
| Pull-out test (before and after exposure to high temperatures) | Incubator, water tank | 0, 28, 90 | 300, 500 |
| Secondary pull-out test (after self-healing) | Incubator and cyclical treatment | 28, 90 | 300, 500 |
| Observation of crack repair of the pull-out specimens after exposure to high temperatures | Incubator and cyclical treatment | 7, 14, 21, 28 | 300, 500 |
| FESEM, EDS, and XRD analyses | Incubator and cyclical treatment | 0, 28 | 300, 500 |
| W/B | Water (kg/m3) |
Cement (kg/m3) |
LWA (kg/m3) |
FA (kg/m3) |
SF (kg/m3) |
PP (kg/m3) |
SP (kg/m3) |
|---|---|---|---|---|---|---|---|
| 0.45 | 220 | 489 | 345 | 734 | 58.5 | 1.17 | 0.978 |
| Test Item | Test Sequence |
|---|---|
| Pull-out test of the LWAC after 28 days of curing at room temperature | Curing→loading |
| First pull-out test of the unhealed LWAC damaged in high-temperature tests | Curing→heating→loading |
| Secondary pull-out test of the unhealed LWAC damaged in high-temperature and first pull-out tests | Curing→heating→loading→self-healing→reloading |
| First pull-out test of the healed LWAC damaged in high-temperature tests | Curing→heating→self-healing→loading |
| Secondary pull-out test of the healed LWAC damaged in high-temperature and first pull-out tests | Curing→heating→self-healing→loading→self-healing→reloading |
| Group | BS at RT (MPa) |
Residual BS (MPa) | Relative BS Ratio | ||
|---|---|---|---|---|---|
| 300 °C | 500 °C | 300 °C | 500 °C | ||
| Group A | 27.99 (1.56) | 27.35 (0.68) | 30.53 (1.75) | 0.98 | 1.09 |
| Group B | 28.38 (1.34) | 27.07 (1.14) | 30.02 (1.97) | 0.95 | 1.06 |
| Group C | 28.02 (0.40) | 27.41 (0.69) | 30.34 (1.20) | 0.98 | 1.08 |
| Group | BS at RT (MPa) |
Residual BS (MPa) | Relative BS Ratio | ||
|---|---|---|---|---|---|
| 300 °C | 500 °C | 300 °C | 500 °C | ||
| Group A | 27.99 (1.56) | 18.89 (0.89) | 18.17 (1.20) | 0.68 | 0.65 |
| Group B | 28.38 (1.34) | 20.48 (1.57) | 18.35 (1.24) | 0.72 | 0.65 |
| Group C | 28.02 (0.40) | 20.70 (1.46) | 19.00 (0.58) | 0.74 | 0.68 |
| Group | Unhealed BS (MPa) |
Residual BS (MPa) | Relative BS Ratio | ||
|---|---|---|---|---|---|
| 28 days of self-healing | 90 days of self-healing | 28 days of self-healing | 90 days of self-healing | ||
| Group A | 27.35 (0.68) | 28.82 (0.55) | 29.99 (1.19) | 1.05 | 1.10 |
| Group B | 27.07 (1.14) | 28.36 (2.23) | 30.37 (0.63) | 1.05 | 1.12 |
| Group C | 27.41 (0.69) | 28.64 (0.32) | 31.08 (0.72) | 1.05 | 1.13 |
Disclaimer/Publisher’s Note: The statements, opinions and data contained in all publications are solely those of the individual author(s) and contributor(s) and not of MDPI and/or the editor(s). MDPI and/or the editor(s) disclaim responsibility for any injury to people or property resulting from any ideas, methods, instructions or products referred to in the content. |
© 2024 by the authors. Licensee MDPI, Basel, Switzerland. This article is an open access article distributed under the terms and conditions of the Creative Commons Attribution (CC BY) license (http://creativecommons.org/licenses/by/4.0/).


