
Submitted:
09 January 2024
Posted:
17 January 2024
You are already at the latest version
Abstract
The molecular entity that catalyzes ferredoxin (Fd)-dependent cyclic electron flow around photosystem I (PSI) (Fd-CEF) remains unknown. To elucidate the in vivo molecular mechanism of Fd-CEF, the evaluation of Fd reduction‒oxidation kinetics is a good indicator of Fd-CEF activity. Recent research showed that the expression of Fd-CEF activity requires the oxidation of plastoquinone, and furthermore, chloroplast NAD(P)H dehydrogenase does not catalyze Fd-CEF in Arabidopsis thaliana. In the present research, the effect of reduced Fd on Fd-CEF activity was analyzed by comparing wild-type and pgr5-deficient mutants (pgr5hope1). PGR5 has been proposed to be the mediator of Fd-CEF, and pgr5hope1 showed the same CO2 assimilation rate and the same reduction‒oxidation level of PQ as WT, but P700 oxidation with Fd was highly reduced, unlike WT. As expected, the activity of Fd-CEF was enhanced in pgr5hope1 compared to the wild type, and its activity was also enhanced with the oxidation of PQ by the increase in the CO2 assimilation rate. The present in vivo research clearly shows that the expression of Fd-CEF activity requires reduced Fd in addition to oxidized PQ, and PGR5 does not catalyze Fd-CEF.
Keywords:
cyclic electron flow
; ferredoxin
; NADH dehydrogenase
; pgr5
; photosynthesis
; photosystem I
1. Introduction
In oxygenic photosynthesis, the photon energy absorbed by the light-harvesting systems of both photosystem II (PSII) and photosystem I (PSI) of the photosynthetic electron transport system excites the reaction center chlorophylls, P680 in PSII and P700 in PSI. The excitation of both reaction center chlorophylls starts their catalytic reactions of electron flow from oxidation to reduction: H2O oxidation with O2 evolution to plastoquinone (PQ) reduction in PSII and PQ oxidation through cytochrome (Cyt) b6/f and plastocyanin to the reduction of ferredoxin (Fd) through electron transport carriers, including phylloquinone, Fx, and FA/FB in PSI. The reduced Fd delivers electrons mainly to NADPH production catalyzed by Fd-NADP oxidoreductase. Simultaneously, with the photosynthetic linear electron flow from H2O to NADPH, protons accumulate in the lumen of thylakoid membranes, forming ΔpH across thylakoid membranes. These accumulated protons originate from water oxidation in PSII and transport from the stroma to the lumen by the Q-cycle during PQ oxidation in the cytochrome b6/f complex. The ΔpH, as a proton motive force, drives ATP synthase to produce ATP. These energy compounds, the reduced Fd, NADPH, and ATP produced in the light reaction, drive the dark reactions of CO2 assimilation and photorespiration in C3 plants.
The photosynthetic linear electron flow is potentially exposed to the threat of the production of reactive oxygen species (ROS). The supply rate of NADPH to ATP produced in the photosynthetic linear electron flow is larger than the consumption rate of NADPH to ATP in the dark reaction even in non-photorespiratory conditions [1,2,3]. The excess supply of NADPH by the photosynthetic linear electron flow is further enhanced under photorespiratory conditions because much more ATP is consumed in dark reactions [2]. Furthermore, as CO2 assimilation is stimulated by photosynthetic linear electron flow, the excess NADPH supply is further enhanced. That is, the photosynthetic linear electron flow, which is the only flow to provide electrons for NADPH production in photosynthesis, accumulates NADPH and fulfills electrons in the photosynthetic electron transport system. The accumulation of electrons in PSI is observed as the reduction of electrons carried at the acceptor side of PSI; the Fe/S-series, Fx, FA/FB and Fd, triggers O2 reduction to produce O2-, and O2- degrades Fe/S compounds and inactivates PSI [4].
The mismatch issue that the supply rate of NADPH surpasses its demand rate, which is brought by the photosynthetic linear electron flow, is solved by the cyclic electron flow around PSI [1]. The cyclic electron flow induces ΔpH across thylakoid membranes and produces ATP without any production of electrons for NADPH supply. Rather, the cyclic electron flow stimulates the consumption of NADPH and contributes to the activation of the dark reaction. That is, the cyclic electron flow around PSI has the potential to alleviate the threat of photosynthetic linear electron flow.
The potential threat of the photosynthetic linear electron flow thus far has not been explored, and the physiological function of the cyclic electron flow around PSI has not been examined from the aspect of oxidative stress. Of course, CO2 assimilation could proceed at an ATP supply-limited rate even under photorespiratory conditions unless NADPH accumulates. Since the accumulation of electrons at the acceptor side of PSI, observed as the reduction of the electron carriers, Fe/S-clusters, causes ROS production [4], the accumulation of NADPH should be alleviated, which would be why the cyclic electron flow around PSI functions. The cyclic electron flow would promote the consumption of NADPH by supplying ATP in the dark reaction.
A molecular mechanism catalyzing Fd-CEF, Fd-quinone oxidoreductase (FQR), has been proposed: both chloroplast NAD(P)H dehydrogenase (NDH) and PGR5/PGRL1 function in Fd-CEF [5,6,7,8,9,10,11]. In vivo, the activity of Fd-CEF has been shown as the excess quantum yield of PSI against the apparent quantum yield of PSII [Y(II)] [2,11,12,13,14]. The apparent quantum yield of PSI [Y(I)] becomes excessive against Y(II) with oxidized P700 [15]. However, these observations were artifacts [15]. The value of Y(I) was measured by the saturation-pulse illumination method [16]. The saturation-pulse illumination under actinic light illumination excites the ground state of P700 to oxidized P700 (P700+) through light-excited P700 (P700*), and the ratio of induced P700+ to total P700 has been estimated as Y(I). The amount of P700+ induced by saturation-pulse illumination depends on the rate-determining step of the P700 photooxidation reduction cycle in PSI [15]. In the P700 photooxidation reduction cycle, P700* is oxidized to P700+ by donating electrons to the electron acceptors Ao, A1, Fx, and FA/FB sequentially to Fd. P700+ is reduced to the ground state of P700 by electrons from PSII through PQ, the Cyt b6/f complex, and plastocyanin (PC). If the reduction of P700+ in the cycle was the rate-determining step, in which oxidized P700 accumulated under actinic light illumination, the amount of the ground state of P700 was overestimated by the saturation-pulse illumination method [15]. On the other hand, if the oxidation of P700* in the cycle was the rate-determining step, the amount of the ground state of P700 was underestimated by the saturation-pulse illumination method [16]. It is too difficult to estimate the true Y(I) when evaluating Fd-CEF activity [15].
Furthermore, the ability of electron donation from the reduced Fd to the oxidized PQ through FQR has been evaluated using the isolated thylakoid membrane [7,17,18]. The addition of Fd/NADPH to the thylakoid membrane increased the minimal yield of Chl fluorescence, and PQ was reduced by the reduced Fd. The rate of increase in the minimal yield of Chl fluorescence was treated as the activity of FQR. However, the reduced Fd donates electrons to PSII, not PQ [19]. Furthermore, the reduced Fd donates electrons to Cyt b559, which is inhibited by antimycin A [17]. The effect of antimycin A also inhibits Fd-dependent quenching of 9-aminoacridine fluorescence, which is driven by far-red light illumination [17]. The quenching of 9-aminoacridine fluorescence shows ΔpH formation across the thylakoid membrane. Far-red-driven quenching has been considered to be induced by Fd-CEF activity. However, as described above, electron donation from the reduced Fd to PSII could also induce the quenching of 9-aminoacridine fluorescence by maintaining the photosynthetic linear electron flow.
As described above, no credible methods have been available to detect and evaluate Fd-CEF activity, that is, FQR activity. To elucidate the physiological function of Fd-CEF, an assay system capable of measuring Fd-CEF in vivo was needed. In the present research, we monitored the redox reaction of Fd simultaneously with Chl fluorescence, P700+ and PC+ absorbance changes, and net CO2 assimilation using intact leaves of Arabidopsis thaliana. We have already succeeded in measuring electron flux in Fd-CEF in Arabidopsis thaliana [20]. The oxidation rate of the reduced Fd, not related to the photosynthetic linear electron flow, that is, the extra oxidation rate of Fd, was defined as the electron flux in Fd-CEF, vCEF. vCEF is regulated by the reduction‒oxidation state of PQ. As PQ is oxidized with enhanced CO2 assimilation, vCEF increases [20]. These characteristics follow the model of cyclic electron flow [1]. This would be one of the reasons why we were unable to detect the extra Fd oxidation reaction [20,21,22]. Under limited photosynthesis, where PQ was highly reduced and the apparent quantum yield of PSII was low, the extra Fd oxidation reaction was suppressed in vivo. We proposed that the extra Fd oxidation reaction reflects the activity of Fd-CEF.
Surprisingly, the NDH-less mutant (crr4) of Arabidopsis thaliana showed almost the same Fd-CEF activity as the wild type (WT) in vivo [20]. In the present research, we comparatively analyzed the activity of Fd-CEF in a PGR5-less mutant (pgr5hope1) of Arabidopsis thaliana. We used the mutant pgr5hope1, not pgr5. pgr5 is a double mutant that is deficient in both pgr5 and ptp1 (At2G17240) [23]. Due to the loss of ptp1, the CO2 assimilation rate was significantly lower than that of WT Arabidopsis thaliana. The Arabidopsis thaliana mutant deficient in pgrl1, which also shows the loss of PGR5 protein, shows the same CO2 assimilation rate as WT [24]. To elucidate the physiological function of PGR5, either the pgr5hope1 or pgrl1 mutant should be used. Unless Fd-CEF functions, the CO2 assimilation rate should not be maintained in pgr5hope1. However, pgr5hope1 shows the same rate of CO2 assimilation and photosynthetic linear electron flux as WT [4,23]. These facts also showed that pgr5hope1 does not function as a mediator of Fd-CEF. On the other hand, pgr5hope1 showed a higher reduced state of Fd than WT [4]. This is due to the suppressed oxidation of P700 in PSI [4]. That is, if Fd-CEF activity, as defined in a previous report [20], required reduced Fd, pgr5hope1 would show increased Fd-CEF activity. As expected, pgr5hope1 showed higher Fd-CEF activity than WT. We discuss the molecular mechanisms and physiological functions of Fd-CEF in vivo.
2. Results
Both the gross CO2 assimilation rate and the apparent quantum yield of PSII [Y(II)] were plotted against the intercellular partial pressures of CO2 (Ci) (Figure 1). These two parameters showed the same dependencies on Ci in both WT and pgr5hope1.
The parameters P700+, PC+, and Fd− against Y(II) are plotted in Figure 2. With the decrease in Y(II) caused by lowering Ci, P700 was oxidized from approximately 10 to 40% in WT (Figure 2A). On the other hand, P700 was not oxidized even with the decrease in Y(II) in pgr5hope1 (Figure 2A). Similarly, PC was oxidized from 65 to 90% in WT (Figure 2B). On the other hand, the oxidized PC percentage decreased from 20 to 5% with the decrease in Y(II) in pgr5hope1 (Figure 2B). In contrast to both P700+ and PC+, Fd− did not change in response to the decrease in Y(II) in WT (Figure 2C). This is due to the oxidation of P700 in PSI [4]. On the other hand, Fd− in pgr5hope1 was higher than that in WT and increased from 40 to 55% with the decrease in Y(II) (Figure 2C). This shows that the limitation of the electron sink accumulates electrons as the reduced form of Fd, which is why the oxidized PC percentage decreased (Figure 2B) [4].
The parameters nonphotochemical quenching (NPQ) and plastoquinone reduced state (1 − qP) against Y(II) are plotted in Figure 3. The increase in NPQ showed the enhancement of heat dissipation of photon energy absorbed by PSII. With the decrease in Y(II), NPQ increased from approximately 0.5 to 1.5 in WT (Figure 3A). On the other hand, NPQ in pgr5hope1 was lower than that in WT, and NPQ increased from 0.2 to 0.9 with the decrease in Y(II) in pgr5hope1 (Figure 3A). An increase in 1 − qP showed a reduction in the plastoquinone pool. WT and pgr5hope1 showed the same dependence of 1 − qP on the decrease in Y(II), where 1 − qP increased with the decrease in Y(II) (Figure 3B). With the decrease in Y(II), 1 − qP increased from approximately 0.25 to 0.6 in WT (Figure 3B). On the other hand, with the decrease in Y(II), 1 − qP increased from approximately 0.35 to 0.75 in pgr5hope1 (Figure 3B). Although the dependence of 1 – qP on Y(II) in pgr5hope1 was the same as that of WT, the values of 1 − qP in pgr5hope1 further increased with lowering Y(II) from 0.25 to 0.15 compared to WT.
The parameters apparent quantum yield of PSI [Y(I)] and apparent quantum yield of nonphotochemical energy dissipation of photoexcited P700 [Y(NA)] are plotted in Figure 4. Both Y(I) and Y(NA) were estimated by illuminating the leaves with saturation-pulse light under actinic light illumination. Y(I) reflected the strength of the donor-side limitation of the P700 photooxidation reduction cycle, and Y(NA) reflected that of the acceptor-side limitation during saturation-pulse illumination [15]. That is, if P700 was highly oxidized under actinic light, Y(I) showed a higher value, and the reverse was also true [20]. For example, if Y(NA) was higher, Y(I) was lower [16]. A higher Y(NA) has a positive relationship with a higher reduced state of Fd at the steady-state illumination of actinic light [4]. With the decrease in Y(II), Y(I) decreased from approximately 0.8 to 0.5 in WT (Figure 4A). On the other hand, with the decrease in Y(II), Y(I) decreased from approximately 0.5 to 0.2 in pgr5hope1 (Figure 4A). Furthermore, the dependence of Y(I) on Y(II) in pgr5hope1 was different from that in WT, and the Y(I) values in pgr5hope1 were lower than those in WT. Y(NA) in WT was kept at lower values from 0.1 to 0.05 with the decrease in Y(II); on the other hand, Y(NA) in pgr5hope1 was higher than that in WT (Figure 4B). The Y(NA) value in pgr5hope1 increased from 0.5 to 0.8 with the decrease in Y(II) (Figure 4B), which seems to be related to the dependence of Fd reduction on Y(II) (Figure 2C). The Y(NA) obtained by saturation-pulse light illumination reflects the reduction‒oxidation state of Fd under actinic light illumination.
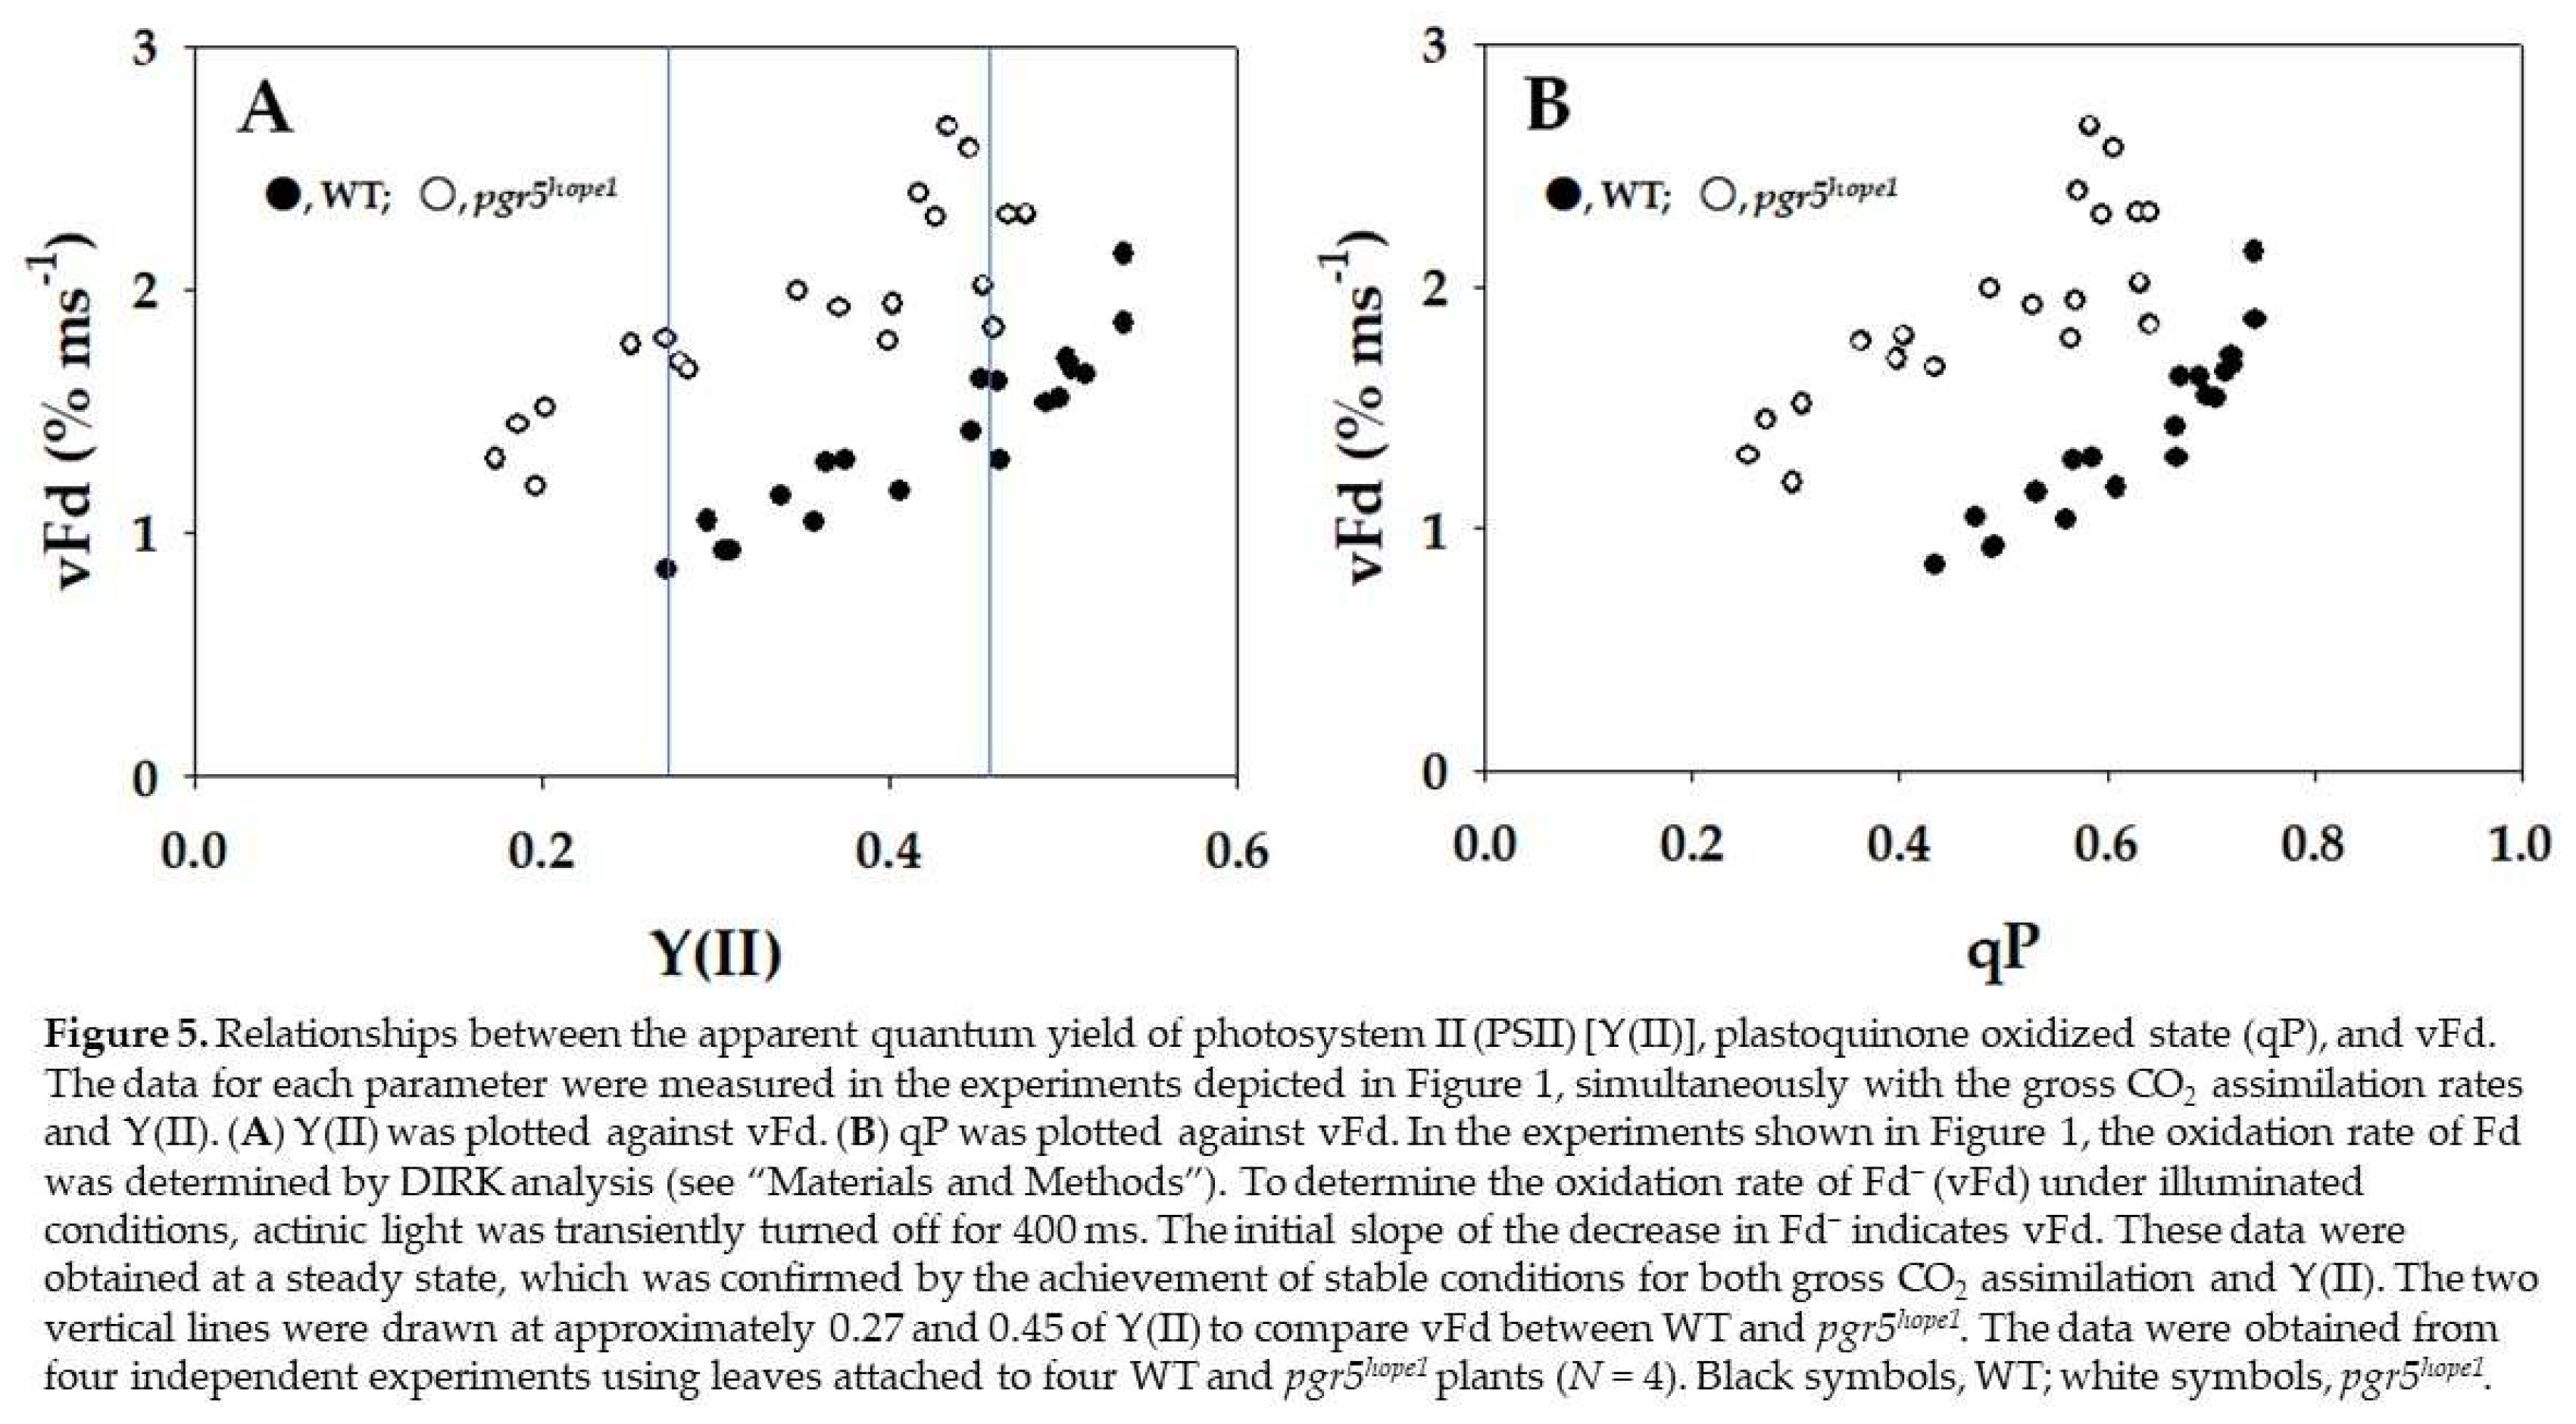
Finally, the oxidation rates of the reduced Fd (vFd) against Y(II) under steady-state conditions, which were estimated by DIRK analysis (see Section 4), are plotted in Figure 5. vFd did not show a linear relationship with Y(II) in either WT or pgr5hope1 (Figure 5A). In WT, increasing Y(II) increased vFd, and a nearly linear relationship between vFd and Y(II) was found in the low range of Y(II) from 0.25 to 0.35. However, above Y(II) = 0.35, as Y(II) became saturated, vFd further increased. That is, excessive turnover of the redox reaction of Fd against Y(II) appeared in the higher range of Y(II). This behavior of vFd against Y(II) in pgr5hope1 was similar to WT (Figure 5A). In pgr5hope1, a nearly linear relationship between vFd and Y(II) was found in the low range of Y(II) from 0.15 to 0.3. Above Y(II) = 0.3, although Y(II) became saturated, vFd further increased. The excessive turnover of the redox reaction of Fd against Y(II) in pgr5hope1 also appeared in the higher range of Y(II), similar to WT. Surprisingly, the values of vFd were larger than those in WT. Typical kinetics of the oxidation of Fd after turning off the actinic light in the DIRK analysis were compared between WT and pgr5hope1 at approximately the same two values of Y(II) (Supplemental Figure S1A). At approximately 0.45 of Y(II), the initial decay rate of the reduced Fd in pgr5hope1 was larger than that in WT. The reduced level of Fd before turning off the actinic light showed a reduced level at the steady state. At approximately 0.27 of Y(II) at lower Ci, the initial decay rate of the reduced Fd in pgr5hope1 was also larger than that in WT (Supplemental Figure S1B). Furthermore, vFd showed a dependence on the increase in qP (Figure 5B). The increase in qP, reflecting PQ oxidation, stimulated the appearance of excessive vFd in WT and pgr5hope1. That is, the activation of photosynthetic linear electron flow oxidized PQ and induced excessive vFd, as observed in the increase in Y(II).
Figure 5.
Relationships between the apparent quantum yield of photosystem II (PSII) [Y(II)], plastoquinone oxidized state (qP), and vFd. The data for each parameter were measured in the experiments depicted in Figure 1, simultaneously with the gross CO2 assimilation rates and Y(II). (A) Y(II) was plotted against vFd. (B) qP was plotted against vFd. In the experiments shown in Figure 1, the oxidation rate of Fd was determined by DIRK analysis (see “Section 4”). To determine the oxidation rate of Fd− (vFd) under illuminated conditions, actinic light was transiently turned off for 400 ms. The initial slope of the decrease in Fd− indicates vFd. These data were obtained at a steady state, which was confirmed by the achievement of stable conditions for both gross CO2 assimilation and Y(II). The two vertical lines were drawn at approximately 0.27 and 0.45 of Y(II) to compare vFd between WT and pgr5hope1. The data were obtained from four independent experiments using leaves attached to four WT and pgr5hope1 plants (N = 4). Black symbols, WT; white symbols, pgr5hope1.
3. Discussion
In the present research, we used pgr5hope1 because pgr5hope1 showed a higher reduced state of Fd at the steady state. Thus, we expected pgr5hope1 to be a good experimental material to test the effect of Fd on Fd-CEF activity in vivo. We compared the activity of Fd-CEF in Arabidopsis thaliana WT and pgr5hope1. The mutant pgr5hope1 shows the same values of both the gross CO2 assimilation rate and the same reduction oxidation level of PQ as WT (Figure 1) [4,23]. The oxidation rate of the reduced Fd showed a nonlinear relationship against Y(II) in both WT and pgr5hope1 (Figure 5A). The increase in vFd deviated from the increase in Y(II) in both WT and pgr5hope1. These results indicate the presence of excessive vFd unrelated to photosynthetic linear electron flow, the electron flux in Fd-CEF (Figure 5A) (Ohnishi et al. 2023). A deviation of vFd from the linear relationship was also found between vFd and qP in both WT and pgr5hope1 (Figure 5B). The increase in qP reflected the oxidation of the reduced PQ, which was induced by the stimulation of the photosynthetic linear electron flow. These characteristics of the expression of the excessive vFd corresponded to a previous report [20]. That is, the appearance of Fd-CEF needed PQ oxidation in both WT and pgr5hope1, which follows the molecular mechanism of Fd-CEF (Supplemental Figure S2) [1].
Furthermore, we found an enhanced oxidation rate of the reduced Fd in pgr5hope1 compared to WT (Figure 5A). That is, the electron flux of Fd-CEF in pgr5hope1 was enhanced. In Fd-CEF, the reduced Fd donates electrons to PQ through FQR. The electron donor is the reduced Fd, and the electron acceptor is the oxidized PQ. The electron flux in Fd-CEF (vCEF) is proportional to the product of the concentrations of both the reduced Fd, [Fd-], and the oxidized PQ, [PQ] and depends on the activity of FQR, the rate constant, k.
vCEF = k × [PQ] × [Fd-]
If PQ was completely reduced, the electron flux of Fd-CEF was zero, even if Fd was reduced (Supplemental Figure S2) [1,20]. Conversely, if PQ was completely oxidized, the activity of Fd-CEF was also zero because Fd did not possess any electrons for the reduction of PQ [1]. Similarly, if Fd was completely reduced with PQ completely reduced, Fd-CEF could not function. Furthermore, if Fd was completely oxidized with PQ completely oxidized, Fd-CEF could not function. In the present research, the reduction level of Fd in pgr5hope1 was higher than that in WT, and Fd was further reduced by the decrease in photosynthetic linear electron transport (Figure 2C). This was due to the suppression of P700 oxidation in pgr5hope1 (Figure 2A). In contrast to WT, the rate-determining step in the P700 photo-oxidation reduction cycle is the oxidation of the excited P700 by the electron acceptor in PSI of pgr5hope1 [4,25], which was observed as the larger Y(NA) and the higher reduced level of Fd (Figure 2 and Figure 4). This was due to the lower ΔpH across thylakoid membranes in pgr5hope1 compared to WT (Supplemental Figure S3). pgr5hope1 showed lower ΔpH because of the higher value of H+-conductance (gH+) compared to WT [26]. However, the molecular mechanism by which gH+ is decreased in pgr5hope1 has not been elucidated. The observed lower ΔpH in pgr5hope1 did not suppress the oxidation of the reduced PQ by the cytochrome b6/f-complex. As a result, the rate-determining step in the P700 photo-oxidation reduction cycle in pgr5hope1 would shift from the reduction of the oxidized P700 to the oxidation of the excited P700. This is the reason for the enhanced reduction in Fd in pgr5hope1, which was further strengthened in response to the suppression of photosynthetic linear electron transport. Following the expression model of Fd-CEF activity (Equation 1), the increase in [Fd-] increases vCEF. In fact, at the same qP values, e.g., 0.4 and 0.6, that is, the same [PQ], vFd in pgr5hope1 was higher than that in WT (Figure 5B). These behaviors of vCEF followed the Fd-CEF model (Supplemental Figure S2) [1]. That is, Fd-CEF requires both oxidized PQ and reduced Fd in vivo.
The contribution of Fd-CEF to the induction of ΔpH across thylakoid membranes has been discussed [1,27]. Although ΔpH in pgr5hope1 was lower than that in WT (Supplemental Figure S3), ΔpH in both WT and pgr5hope1 did not increase in response to the increase in Fd-CEF from the CO2 compensation point to the higher Ci (Supplemental Figure S3). The increase in Fd-CEF activity was accompanied by the stimulation of the gross CO2 assimilation rate as Ci increased (Figure 1 and Figure 5). That is, the increase in ATP consumption occurred simultaneously with the increase in Fd-CEF activity. Therefore, the ΔpH induced by Fd-CEF did not accumulate, or the total ΔpH induced by the enhanced photosynthetic linear electron flow (the light reaction in photosynthesis) driven by the net CO2 assimilation (the dark reaction in photosynthesis) and the enhanced Fd-CEF (the light reaction in photosynthesis) greatly decreased.
NPQ in pgr5hope1 was lower than that of WT (Figure 3). The induction of NPQ requires acidification of the luminal side of thylakoid membranes [27]. That is, the lower ΔpH in pgr5hope1 could not induce higher NPQ. On the other hand, the behavior of NPQ in WT relative to the increase in both the gross CO2 assimilation rate and the photosynthetic linear electron flow rate was the same as that in pgr5hope1 (Figure 3). NPQ decreased with the increase in both the gross CO2 assimilation rate and the photosynthetic linear electron flow rate, although ΔpH in both WT and pgr5hope1 did not change, as described above. NPQ also depends on the reduction‒oxidation state of PQ and Y(II) [28,29]. That is, NPQ decreases with the increases in both qP and Y(II).
In the present research, we further confirmed the expression model of Fd-CEF activity proposed (Supplemental Figure S2) [1]. The mutant pgr5hope1 showed a higher reduction in Fd than WT (Figure 2). As expected, the electron flux of Fd-CEF in pgr5hope1 was enhanced (Figure 5). Both pgr5 and NDH have been considered mediators of Fd-CEF [11]. However, the present and previous reports clearly show that Fd-CEF is driven by a new mediator [20]. The strongest candidate for the mediator, FQR, is the cytochrome (Cyt) b6/f-complex [30,31,32]. The Cyt b6/f-complex has a possible binding site for Fd, close to the location of heme c, composed of basic amino groups. The acidic region of Fd would bind to the site of the Cyt b6/f complex. The reduced heme c would transfer electrons to the low potential heme b in the Cyt b subunit of the Cyt b6/f-complex [30,32]. The reduced heme b donates electrons to the oxidized PQ and/or the one-electron reduced PQ in the Q-cycle of the Cyt b6/f-complex. The cyclic electron flow accelerates the Q-cycle and contributes to ΔpH formation. Identification of the mediator for Fd-CEF would require further research.
Next, we considered that we obtained the most important information about the physiological function of Fd-CEF in pgr5hope1. The mutant pgr5hope1 has high H+-conductance (Supplemental Figures S3 and S4), which has been reported by many researchers [9,10]. Unless Fd-CEF induces acidification of the luminal space of thylakoid membranes, the proton motive force to produce ATP should not be maintained. The enhanced electron flux in Fd-CEF of pgr5hope1 would compensate for the rapid loss of the proton motive force by promoting ΔpH formation across thylakoid membranes. That is, as shown in Figure 1 and Figure 5, the higher activity of Fd-CEF pgr5hope1 drives CO2 assimilation at the same rate as WT.
Furthermore, the physiological function of Fd-CEF is considered as follows. The electron flux of Fd-CEF is induced by the oxidation of PQ, which is triggered by the increase in the rate of photosynthetic electron flow driven by the dark reactions: CO2 assimilation and photorespiration (Figure 1 and Figure 5) [20]. The electrons for driving the dark reactions are supplied as both NADPH and Fd, and the electrons originate from H2O oxidation in PSII. In vivo, the electron flux in the photosynthetic linear electron flow has a linear relationship with the consumption rate of electrons in dark reactions with the origin [25,33,34,35,36]. This robust relationship between the light and dark reactions has persisted since the origin of photosynthesis. In principle, the linear relationship cannot be accounted for by photosynthetic linear electron transport. The electron flux in the photosynthetic linear electron flow, Je(LEF), is equal to the electron consumption rate in the dark reaction, Jg. Then,
Je(LEF) = Jg
The production rate of H+ in the lumen by the photosynthetic linear electron flow, vP(H+), and the consumption rate of H+ in the dark reaction, vC(H+), are
vP(H+) = 3 × Je(LEF)
vC(H+) = 2.335 × (3 + 3.5ϕ)/(2+2ϕ) × Jg
The coefficient of 3 in Equation (3) shows the H+/e- ratio in the photosynthetic linear electron flow with the Q-cycle [2,37,38]. The coefficient of [2.335 × (3 + 3.5ϕ)/(2+2ϕ)] in Equation (4) shows the H+/e- ratio in the dark reaction [2,37,38]. The value of ϕ is the ratio of the ribulose 1,5-bisphosphate (RuBP) oxygenation reaction rate to the RuBP carboxylation rate catalyzed by RuBP carboxylase/oxygenase (Rubisco). At the CO2 compensation point, ϕ = 2, and at higher CO2, ϕ = 0. From Equation (2),
vP(H+) < vC(H+)
That is, the photosynthetic linear electron flow cannot supply enough ATP to drive the dark reaction, a very dangerous situation for photosynthetic organisms. Here, we imagine the reverse situation but with the same results as described above. On the assumption that the dark reaction turns over with the insufficient supply of ATP, then the dark reaction rate is determined by the supply rate of ATP in the photosynthetic linear electron flow,
vP(H+) = vC(H+)
From Equations (3) and (4),
Je(LEF) > Jg
Equation (7) indicates that the dark reaction cannot consume all the electrons produced in the photosynthetic linear electron flow. As the amounts of both NADP+ and the oxidized Fd are not infinite, as soon as both NADP+ and the oxidized Fd are perfectly reduced, the photosynthetic linear electron transport (PET) system would be filled with electrons. Equation (7) shows that the pressure of electron accumulation in the PET system would be accelerated as the dark reaction rate increases. Once electrons accumulate at the acceptor side of PSI, ROS are produced, and ROS oxidatively degrade PSI via photoinhibition [4,39]. That is, the functioning of the photosynthetic linear electron flow has a potential threat to ROS production in PSI.
On the other hand, Equation (7) does not hold. The robust linear relationship of Je(LEF) against Jg shows that Je(LEF) is equal to Jg [25,33,34,35,36]. This fact shows that the extra ATP supply reaction to the dark reaction functions without electron production. Fd-CEF supplies ATP to accelerate the consumption of NADPH, and this function of Fd-CEF can simultaneously accelerate the dark reaction. As a result, Jg is enhanced, and the linear relationship of Je(LEF) against Jg holds. Fd-CEF has a dual function to suppress ROS production and to enhance the dark reaction. As a higher CO2 assimilation rate is needed, the activity of Fe-CEF increases (Figure 5). This is a reasonable response of Fd-CEF because the threat of ROS production also increases, as described above and shown in Equation (7).
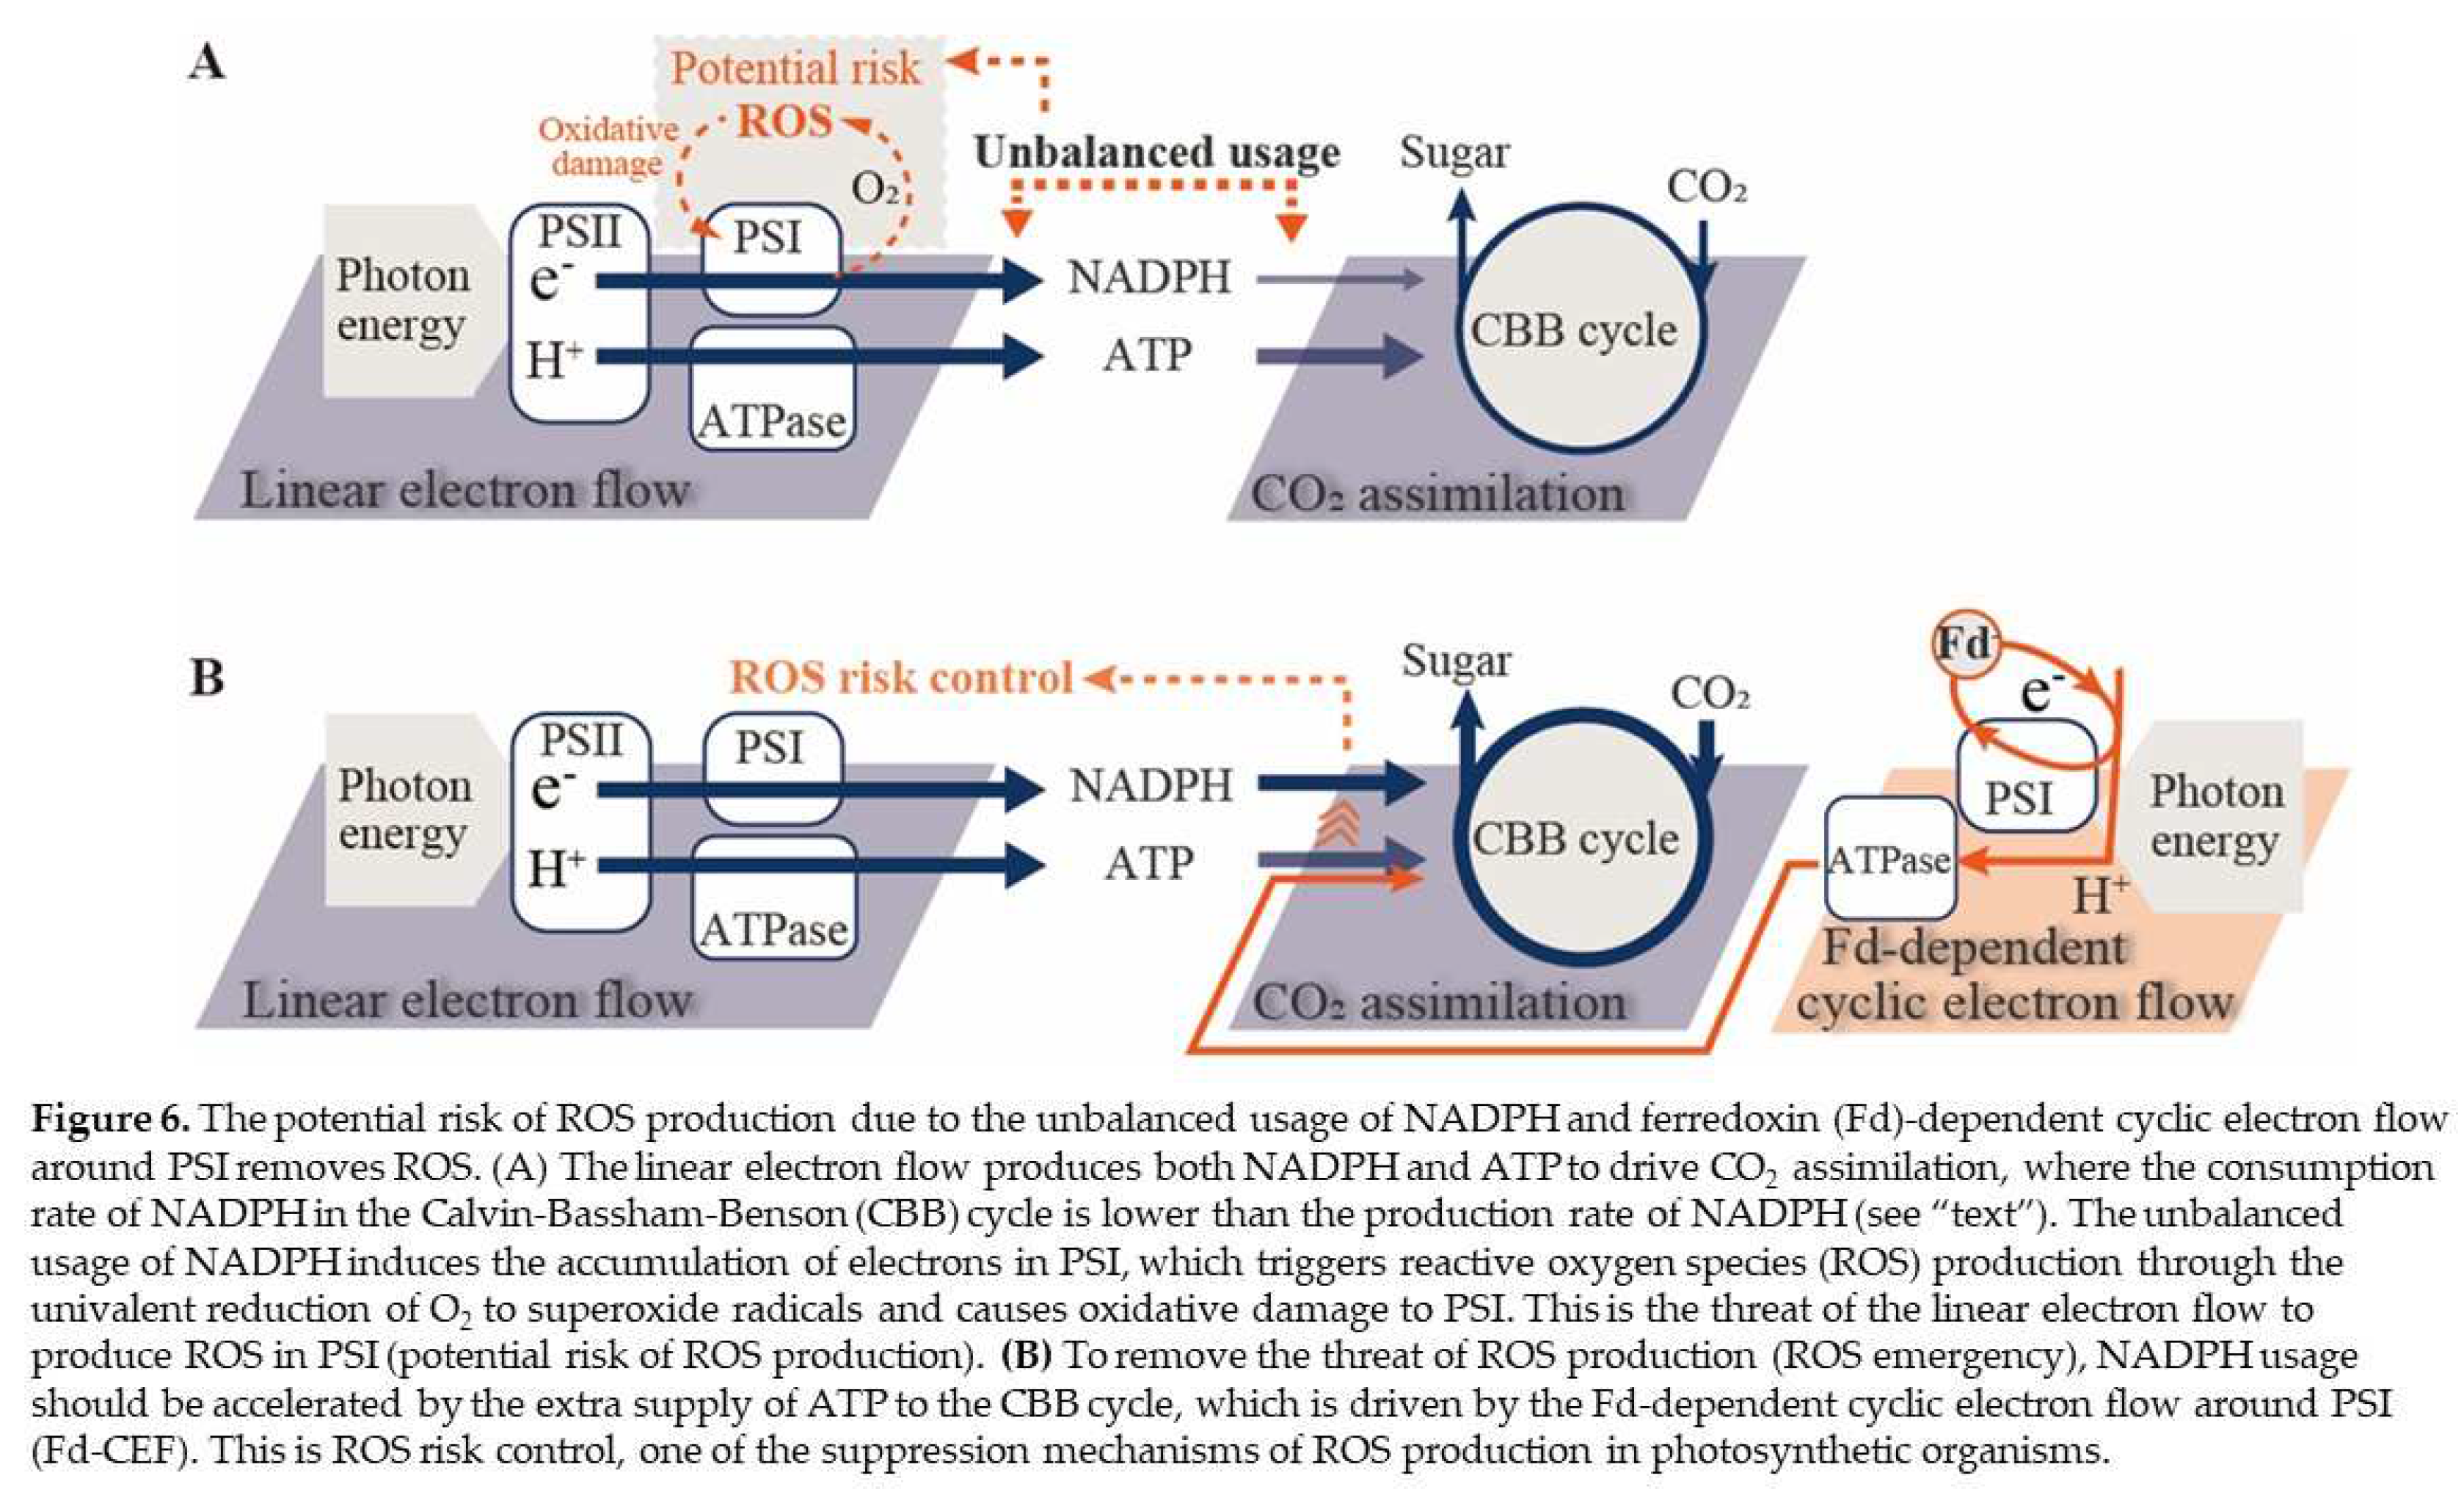
As described above, the threat of ROS production potentially brought by the photosynthetic linear electron flow increases with the stimulation of the dark reaction. In response to the increased threat of ROS production, the oxidation of PQ is enhanced, which activates Fd-CEF. Fd-CEF promotes the consumption of NADPH by supplying ATP to the dark reaction. This is the suppression mechanism of ROS production (Figure 6). On the other hand, the suppression of the dark reaction under environmental stress, e.g., high/low temperatures, water deficits, nutrient deficits, and high salt contents, induce a reduction in PQ, as observed in the suppression of photosynthetic linear electron flow. Under these situations, Fd-CEF cannot function (Figure 5) [20]. However, as observed in the oxidation of P700 in PSI, the electron flow from PSII to PSI is suppressed [25,40,41,42]. This contributes to the alleviation of electron accumulation at the acceptor side of PSI, which inhibits ROS production [4]. On the other hand, the oxidation of P700 is suppressed by the stimulation of the dark reaction (Figure 2). That is, only Fd-CEF can remove the threat of ROS production under higher photosynthetic conditions. Oxygenic photosynthetic organisms have two suppression mechanisms of ROS production in PSI of the photosynthetic electron transport system: P700 oxidation and Fd-CEF. Fd-CEF can function under high CO2 conditions, which enhances CO2 assimilation, and Fd-CEF can remove the threat of ROS production by increasing Jg. The second mechanism, Fd-CEF, would have been needed at the start of the evolution of photosynthetic organisms during the ancient era, where the atmospheric partial pressure of CO2 was much higher than the present CO2 [43]. Now, photosynthetic organisms should activate Fd-CEF in response to the enhanced CO2 assimilation accelerated by the increase in atmospheric CO2 partial pressure, causing global boiling after global warming. The activated Fd-CEF makes safe photosynthesis possible.
4. Materials and Methods
4.1. Plant Materials and Growth Conditions
Arabidopsis plants (Arabidopsis thaliana WT and pgr5hope1) were grown from seeds under standard air-equilibrated conditions with 10 h/14 h day–night cycles at 23 and 20 °C, respectively, and 55–60% relative humidity. The photon flux density was adjusted to 100 μmol photons m−2 s−1, which was measured with a light meter (LI-189, LI-COR, Lincoln, NE, USA) equipped with a quantum sensor. Seeds were planted in the soil after 3 days of vernalization at 4 °C. Seedlings were kept in 0.2 (dm)3 pots containing a 2:1.5 ratio of seeding-culture soil (TAKII Co., Ltd., Kyoto, Japan) to vermiculite and were watered daily. Plants were fertilized with 1000-fold diluted Hyponex fertilizer 8–12–6 (Hyponex Japan, Osaka, Japan) only once in the 3rd week after seeding. The plants at 10 h after the dark duration start of the light/dark cycle of growth conditions were used for all the measurements, which were conducted using rosette leaves of 5- to 6-week-old plants.
4.2. Determination of Chlorophyll and Nitrogen
Leaves after measuring photosynthetic parameters were sampled for the following content analysis and stored at −80 °C until use. Upon sampling, detached leaves were weighed, and electronic images were acquired with a scanner for leaf area measurement by ImageJ (NIH). The Chl and nitrogen (N) contents in the leaves of WT and pgr5hope1 were determined [44] and are shown in Supplemental Table S1. A raw leaf blade was homogenized in 50 mM sodium-phosphate buffer (pH 7.2) containing 120 mM 2-mercaptoethanol, 1 mM iodoacetic acid, and 5% (v/v) glycerol at a leaf:buffer ratio of 1:9 (g/mL) in a chilled mortar and pestle. The total Chl and leaf N contents were measured from a part of this homogenate. The absorbance at 663.6 and 646.6 nm was measured to calculate the Chl content [44]. The Chl content in the leaves is represented on a leaf-area basis [44]. The total leaf N content was determined using Nessler’s reagent in a digestion solution after potassium sodium tartrate was added (Ohnishi et al. 2021). The homogenate was decomposed by 60% (v/v) sulfuric acid and 30% (v/v) H2O2 with heat. The decomposing leaf solution was mixed with distilled water, 10% (w/v) potassium sodium tartrate solution, and 2.5 N NaOH and Nessler’s reagent were immediately added to the mixture. The N content was determined by measuring the change in absorbance at 420 nm.
4.3. Simultaneous Measurements of Chlorophyll Fluorescence, P700, PC, and Fd Signals with Gas Exchange
Chl fluorescence, P700, PC, Fd, and CO2 exchange were simultaneously measured using both Dual/KLAS-NIR (Heinz Walz GmbH, Effeltrich, Germany) and an infrared gas analyzer (IRGA) LI-7000 (Li-COR, Lincoln, NE, USA) measuring system equipped with a 3010-DUAL gas exchange chamber at several ambient partial pressures of CO2 at 21 kPa O2 (Heinz Walz GmbH) [4]. The gases were saturated with water vapor at 16 ± 0.1 °C. The leaf temperature was controlled at 25 ± 0.5 °C (relative humidity: 55–60%). The actinic photon flux density at the upper position on the leaf in the chamber was adjusted to the indicated intensity. The net CO2 assimilation rate (A) and the dark respiration rate (Rd) were measured. The Chl fluorescence parameters were calculated as follows [45]: Fo, minimum fluorescence from a dark-adapted leaf; Fo’, minimum fluorescence from a light-adapted leaf; Fm, maximum fluorescence from a dark-adapted leaf; Fm’, maximum fluorescence from a light-adapted leaf; Fs, fluorescence emission from a light-adapted leaf; the apparent quantum yield of PSII, Y(II) = (Fm’ − Fs)/Fm’ [34]; nonphotochemical quenching, NPQ = (Fm − Fm’)/Fm’ [46]; and PQ oxidized state, (qP) = (Fm’ − Fs)/(Fm’ – Fo’) [47]. To obtain Fm and Fm’, a saturation pulse light (630 nm, 8000 µmol photons m−2 s−1, 300 ms) was applied. Red actinic light (630 nm, 400 µmol photons m−2 s−1) was supplied using a chip-on-board LED array.
The signals for oxidized P700 (P700+), oxidized plastocyanin (PC+), and reduced ferredoxin (Fd−) were calculated based on the deconvolution of four pulse-modulated dual-wavelength difference signals in the near-infrared region (780–820, 820–870, 840–965, and 870–965 nm) [48]. Both P700 and PC were completely reduced, and Fd was fully oxidized in the dark. To determine the total photo-oxidizable P700 (P700max) and PC (PCmax), a saturation pulse light was applied after 10 s of illumination with far-red light (740 nm). The following formulas were used: the apparent quantum yield of PSI, Y(I) = (P700max’ − P700+)/P700max; the quantum yield of oxidized P700 (P700+), Y(ND) = P700+/P700max; and the apparent quantum yield of nonphotochemical energy dissipation of photoexcited P700 (P700*), Y(NA) = (P700max − P700max’)/P700max. In the present research, we showed Y(ND) as P700+ (Figure 2A). The summation of these quantum yields is 1 (Y(I) + Y(ND) + Y(NA) = 1). Total photoreducible Fd (Fdmax) was determined by illumination with red actinic light (450 µmol photons m−2 s−1) after plant leaves were adapted to the dark for 5 min [48]. To obtain P700max’, a saturation pulse light (630 nm, 8000 µmol photons m−2 s−1, 300 ms) was applied. Red actinic light (630 nm, 400 µmol photons m−2 s−1) was supplied using a chip-on-board LED array.
The total photoreducible Fd signal originated from the Fe/S signal (Sétif et al. 2020). The ratio of Fd to P700 in PSI was approximately 5 [49,50]. Furthermore, the leaves of tobacco plants had approximately 5 μmol m-2 leaf area Fd [51] and approximately 1 μmol m-2 leaf area P700 [52]. That is, the ratio of Fd to P700 in PSI was much closer to that of spinach leaves [49]. Then, we hypothesized that the amount of Fd in Arabidopsis thaliana was close to these values. The PSI complex contains Fx and FA/FB, in which Fe/S-clusters are the electron transfer carriers. That is, the Fe/S-signal as Fd occupied less than 60% of the total Fe/S-signal. Furthermore, the electron flux from Fx to NADP+ through Fd is limited by the oxidation of the reduced Fd [53]. That is, if the observed Fe/S-signal was lower than 60%, we monitored the redox reaction of Fd. The redox states of both P700 and PC under actinic light illumination were evaluated as the ratios of P700+ and PC+ to total P700 and total PC, respectively. The redox state of Fd was also determined similarly. The values of P700max, PCmax, and Fdmax in the leaves of WT and pgr5hope1 are shown as relative values in Supplemental Table S1.
For the analysis of dark-interval relaxation kinetics (DIRK analysis) [54], red actinic light (400 µmol photons m−2 s−1) was temporarily turned off for 400 ms at steady-state photosynthesis [20]. The oxidation rate of Fd− was estimated by a Dual/KLAS-NIR spectrophotometer and is expressed as the relative values by estimating the initial decay of Fd−.
4.4. Simultaneous Measurements of Electrochromic shift (ECS)-Signals with Gas Exchange
The electrochromic shift (ECS) signal reflects both the ΔpH and Δψ across the thylakoid membranes [55,56]. The ECS signal was measured simultaneously with the above gas exchange analysis using the DUAL-PAM system (Walz) equipped with a P515 analysis module [57]. The P515 analysis module monitored the formation of the ECS signal due to the carotenoid spectrum shift in response to the membrane potential. The magnitude of the ECS signal was evaluated by DIRK analysis [55,56]. At the steady state of photosynthesis, actinic light illumination was transiently turned off for 400 ms. After the actinic light illumination was turned off, the ECS signal rapidly decayed. The decay rate of the ECS signal reflects the activity of ATP synthase in thylakoid membranes [55,56]. The half time of ECS decay reflects proton conductance (gH+), which in turn reflects the apparent rate constant of ATP synthesis catalyzed by ATP synthase and depends on the concentrations of ADP and inorganic phosphate and the catalytic constant of ATP synthase [55,56].
The magnitude of the ECS signal was normalized as follows [57]. A single turnover flash (10 μs) was used to illuminate the leaf under far-red light. Then, the single turnover flash induced PSII-dependent production of the ECS signal, which corresponds to the membrane potential induced by single charge separation of P680 in PSII. The average value of a single turnover (ST) flash-induced ECS signal (ECSST) was (4.09 ± 0.07) × 10−3 ΔI/Io (n = 4) (WT) and (4.0 ± 0.4) × 10−3 ΔI/Io (n = 4) (pgr5hope1). Then, the measured ECS signal was divided by ECSST and was used as the normalized ECS signal (ECSN) [56] (Equation (1)).
ECSN = ECS/ECSST
The contribution of both ΔpH and Δψ to the total ECS signal was separately evaluated after the AL illumination was turned off over longer periods of darkness [55].
The relative H+ consumption rate vH+ is proportional to both ECSN and gH+, namely (Equation (2)),
vH+ = gH+ × ECSN
4.5. Statistical Analytics
Statistical analysis of the corresponding data in Supplemental Table S1 (CI, confidential interval) were performed using the commercial software JMPS8 (ver. 14.2.0, SAS Institute Inc., Cary, NC, USA).
Supplemental Materials
The following supporting information can be downloaded at the website of this paper posted on Preprints.org. Supplemental Figure S1. DIRK analysis of the decay of the reduced Fd in WT and pgr5hope1 after turning off actinic light illumination. Supplemental Figure S2. Dependence of Fd-CEF activity on the ratio of oxidized PQ to the total PQ pool. Supplemental Figure S3. Effects of the intercellular partial pressure of CO2 on the net CO2 assimilation rate and the parameters of H+ conductance, proton motive force, H+ consumption rate, and proton gradient across thylakoid membranes due to CO2 fixation as a function of the partial pressure of intercellular CO2 in WT and pgr5hope1. Supplemental Figure S4. Relationships between the parameters of H+ conductance, proton motive force, H+ consumption rate, and proton gradient across thylakoid membranes and the apparent quantum yield of PSII in WT and pgr5hope1. Supplemental Table S1. Chl and nitrogen contents, Fv/Fm, P700max, PCmax, and Fdmax in the leaves of WT and pgr5hope1. Supplemental Figure S1. DIRK analysis of the decay of the reduced Fd (Fd-) in WT and pgr5hope1 after turning off actinic light (AL) illumination. AL was turned off at time zero ms. The initial slope of the decrease in Fd- at time zero indicated the oxidation rate of Fd-. The typical data at both 0.45 (A) and 0.27 (B) of Y(II) in both WT and pgr5hope1 are shown from the experiments in Figure 5. Black lines, WT; red lines, pgr5hope1. Supplemental Figure S2. Dependence of Fd-CEF activity (vCEF) on the ratio of the oxidized PQ to total PQ pool (PQt), (PQ/PQt). The vCEF is plotted against PQ/PQt according to the model of Fd-dependent cyclic electron flow around PSI [1]. In the extremely reduced state of PQ, in which the intensity of actinic light is higher and/or the intercellular partial pressure of CO2 is lower, vCEF is greatly suppressed. The stimulation of net CO2 assimilation with photosynthetic linear electron flow enhanced the oxidation of the reduced PQ, with vCEF increasing, as shown in the present research and a previous report [20]. Supplemental Figure S3. Effects of the intercellular partial pressure of CO2 (Ci) on the net CO2 assimilation rate (A) and the parameters of H+ conductance (gH+), proton motive force (pmf), H+ consumption rate (vH+), and proton gradient across thylakoid membranes (ΔpH) due to CO2 fixation as a function of the partial pressure of intercellular CO2 (Ci) in WT and pgr5hope1 of Arabidopsis thaliana. (A) The net CO2 assimilation rates were measured at 400 μmol photons m-2 s-1 and 21 kPa O2, and proton motive force parameters were simultaneously measured. The dark respiration rates (Rd) were measured before starting actinic light illumination. The net CO2 assimilation rates were plotted against Ci. (B) H+ conductance (gH+), (C) proton motive force (pmf), (D) H+ consumption rate (vH+), and (E) proton gradient across thylakoid membranes (ΔpH) were plotted against Ci. The data are from four independent experiments using leaves attached to four plants (N = 4). The ambient partial pressures of CO2 were changed from 400 ppm to 50 through 300, 200, and 100 Pa at 21 kPa O2 for the same leaves. Black symbols, WT; white symbols, pgr5hope1. Supplemental Figure S4. Relationships between the parameters of H+ conductance (gH+), proton motive force (pmf), H+ consumption rate (vH+), and proton gradient across thylakoid membranes (ΔpH) and the apparent quantum yield of PSII (Y(II)) in WT and pgr5hope1 of Arabidopsis thaliana. Each value of the parameters of proton motive force against Y(II) was selected from the same CO2 assimilation rates in Figure 1 and Supplemental Figure 3A. (A) H+ conductance (gH+), (B) proton motive force (pmf), (C) H+ consumption rate (vH+), and (D) proton gradient across thylakoid membranes (ΔpH) were plotted against Y(II). Black symbols, WT; white symbols, pgr5hope1.
Author Contributions
Conceptualization, C.M.; writing-original draft preparation, S.M., M.O., S.W. and C.M.; writing-review and editing, M.O., C.M., S.W., S.M., and K.I.; supervision, C.M.; funding acquisition, C.M.; software, M.O. All authors have read and agreed to the published version of the manuscript.
Funding
This work was supported by Core Research for Evolutional Science and Technology (CREST) of the Japan Science and Technology Agency, Japan (grant number JPMJCR15O3) to C.M.
Institutional Review Board Statement
Not applicable.
Informed Consent Statement
Not applicable.
Data Availability Statement
Data are contained within the article and Supplemental Material.
Conflicts of Interest
The authors declare no conflict of interest.
References
- Allen, J. F. Cyclic, pseudocyclic and noncyclic photophosphorylation: new links in the chain. Trend. Plant Sci. 2003, 8, (1), 15-9. [CrossRef]
- Miyake, C.; Miyata, M.; Shinzaki, Y.; Tomizawa, K. CO2 response of cyclic electron flow around PSI (CEF-PSI) in tobacco leaves--relative electron fluxes through PSI and PSII determine the magnitude of non-photochemical quenching (NPQ) of Chl fluorescence. Plant Cell Physiol. 2005, 46, (4), 629-37. [CrossRef]
- Nawrocki, W. J.; Bailleul, B.; Picot, D.; Cardol, P.; Rappaport, F.; Wollman, F. A.; Joliot, P. The mechanism of cyclic electron flow. Biochim. Biophys. Acta. Bioerg. 2019, 1860, (5), 433-438. [CrossRef] [PubMed]
- Furutani, R.; Wada, S.; Ifuku, K.; Maekawa, S.; Miyake, C. Higher reduced state of Fe/S-signals, with the suppressed oxidation of P700, causes PSI Inactivation in Arabidopsis thaliana. Antioxidants (Basel, Switzerland) 2022, 12, (1). [CrossRef]
- Hashimoto, M.; Endo, T.; Peltier, G.; Tasaka, M.; Shikanai, T. A nucleus-encoded factor, CRR2, is essential for the expression of chloroplast ndhB in Arabidopsis. Plant J. 2003, 36, (4), 541-9. [CrossRef] [PubMed]
- Kono, M.; Noguchi, K.; Terashima, I. Roles of the cyclic electron flow around PSI (CEF-PSI) and O₂-dependent alternative pathways in regulation of the photosynthetic electron flow in short-term fluctuating light in Arabidopsis thaliana. Plant Cell Physiol. 2014, 55, (5), 990-1004. [CrossRef]
- Munekage, Y.; Hojo, M.; Meurer, J.; Endo, T.; Tasaka, M.; Shikanai, T. PGR5 is involved in cyclic electron flow around photosystem I and is essential for photoprotection in Arabidopsis. Cell 2002, 110, (3), 361-71. [CrossRef]
- Shikanai, T.; Endo, T.; Hashimoto, T.; Yamada, Y.; Asada, K.; Yokota, A. Directed disruption of the tobacco ndhB gene impairs cyclic electron flow around photosystem I. Proc. Natl. Acad. Sci. USA 1998, 95, (16), 9705-9. [CrossRef] [PubMed]
- Yamamoto, H.; Shikanai, T. PGR5-dependent cyclic electron flow protects photosystem I under fluctuating light at donor and acceptor sides. Plant Physiol. 2019, 179, (2), 588-600. [CrossRef]
- Yamamoto, H.; Shikanai, T. Does the arabidopsis proton gradient regulation5 mutant leak protons from the thylakoid membrane? Plant Physiol. 2020, 184, (1), 421-427. [CrossRef]
- Yamori, W.; Shikanai, T. Physiological functions of cyclic electron transport around photosystem I in sustaining photosynthesis and plant growth. Annual Recv. Plant Biol. 2016, 67, 81-106. [CrossRef]
- Miyake, C.; Shinzaki, Y.; Miyata, M.; Tomizawa, K. Enhancement of cyclic electron flow around PSI at high light and its contribution to the induction of non-photochemical quenching of chl fluorescence in intact leaves of tobacco plants. Plant Cell Physiol. 2004, 45, (10), 1426-33. [CrossRef] [PubMed]
- Yamamoto, H.; Takahashi, S.; Badger, M. R.; Shikanai, T. Artificial remodelling of alternative electron flow by flavodiiron proteins in Arabidopsis. Nature plants 2016, 2, 16012. [CrossRef]
- Wada, S.; Yamamoto, H.; Suzuki, Y.; Yamori, W.; Shikanai, T.; Makino, A. Flavodiiron protein substitutes for cyclic electron flow without competing CO2 assimilation in rice. Plant Physiol. 2018, 176, (2), 1509-1518. [CrossRef] [PubMed]
- Furutani, R.; Ohnishi, M.; Mori, Y.; Wada, S.; Miyake, C. The difficulty of estimating the electron transport rate at photosystem I. J. Plant Res. 2022, 135, (4), 565-577. [CrossRef]
- Klughammer, C.; Schreiber, U. An improved method, using saturating light pulses, for the determination of photosystem I quantum yield via P700-absorbance changes at 830 nm. Planta 1994, 192, (2), 261-268. [CrossRef]
- Miyake, C.; Schreiber, U.; Asada, K. Ferredoxin-Dependent and Antimycin A-Sensitive Reduction of Cytochrome b-559 by Far-Red Light in Maize Thylakoids; Participation of a Menadiol-Reducible Cytochrome b-559 in Cyclic Electron Flow. Plant Cell Physiol. 1995, 36, (4), 743-748. [CrossRef]
- Peltier, G.; Aro, E. M.; Shikanai, T. NDH-1 and NDH-2 Plastoquinone Reductases in Oxygenic Photosynthesis. Ann. Rev. Plant Biol. 2016, 67, 55-80. [CrossRef]
- Fisher, N.; Kramer, D. M. Non-photochemical reduction of thylakoid photosynthetic redox carriers in vitro: relevance to cyclic electron flow around photosystem I? Biochim. Biophys. Acta Bioenerg. 2014, 1837, (12), 1944-1954. [CrossRef]
- Ohnishi, M.; Maekawa, S.; Wada, S.; Ifuku, K.; Miyake, C. Evaluating the oxidation rate of reduced ferredoxin in Arabidopsis thaliana independent of photosynthetic linear electron flow: Plausible activity of ferredoxin-dependent cyclic electron flow around photosystem I. Int. J. Mol. Sci. 2023, 24, (15). [CrossRef]
- Kadota, K.; Furutani, R.; Makino, A.; Suzuki, Y.; Wada, S.; Miyake, C. Oxidation of P700 induces alternative electron flow in photosystem I in wheat leaves. Plants (Basel, Switzerland) 2019, 8, (6). [CrossRef]
- Shimakawa, G.; Miyake, C. Photosynthetic linear electron flow drives CO2 assimilation in maize leaves. Int. J. Mol. Sci. 2021, 22, (9). [CrossRef]
- Wada, S.; Amako, K.; Miyake, C. Identification of a novel mutation exacerbated the PSI photoinhibition in pgr5/pgrl1 mutants; Caution for overestimation of the phenotypes in Arabidopsis pgr5-1 mutant. Cells 2021, 10, (11). [CrossRef]
- Shimakawa, G.; Miyake, C. Changing frequency of fluctuating light reveals the molecular mechanism for P700 oxidation in plant leaves. Plant Direct 2018, 2, (7), e00073. [CrossRef]
- Miyake, C. Molecular Mechanism of Oxidation of P700 and suppression of ROS production in photosystem I in response to electron-sink limitations in C3 plants. Antioxidants (Basel, Switzerland) 2020, 9, (3). [CrossRef]
- Rantala, S.; Lempiäinen, T.; Gerotto, C.; Tiwari, A.; Aro, E. M.; Tikkanen, M. PGR5 and NDH-1 systems do not function as protective electron acceptors but mitigate the consequences of PSI inhibition. Biochim. Biophys. Acta Bioenerg. 2020, 1861, (3), 148154. [CrossRef]
- Heber, U.; Walker, D. Concerning a dual function of coupled cyclic electron transport in leaves. Plant Physiol. 1992, 100, (4), 1621-6. [CrossRef] [PubMed]
- Miyake, C.; Amako, K.; Shiraishi, N.; Sugimoto, T. Acclimation of tobacco leaves to high light intensity drives the plastoquinone oxidation system-Relationship among the fraction of open PSII centers, non-photochemical quenching of Chl fluorescence and the maximum quantum yield of PSII in the dark. Plant Cell Physiol. 2009, 50, (4), 730-43. [CrossRef] [PubMed]
- Ruban, A. V.; Murchie, E. H. Assessing the photoprotective effectiveness of non-photochemical chlorophyll fluorescence quenching: a new approach. Biochim. Biophys. Acata Bioenerg. 2012, 1817, (7), 977-82. [CrossRef]
- Cramer, W. A.; Zhang, H.; Yan, J.; Kurisu, G.; Smith, J. L. Transmembrane traffic in the cytochrome b6f complex. Ann. Rev. Biochem. 2006, 75, 769-90. [CrossRef] [PubMed]
- Cramer, W. A.; Zhang, H. Consequences of the structure of the cytochrome b6f complex for its charge transfer pathways. Biochim. Biophys. Acta Bioenerg. 2006, 1757, (5-6), 339-45. [CrossRef]
- Sarewicz, M.; Pintscher, S.; Pietras, R.; Borek, A.; Bujnowicz, Ł.; Hanke, G.; Cramer, W. A.; Finazzi, G.; Osyczka, A. Catalytic reactions and energy conservation in the cytochrome bc1 and b6f complexes of energy-transducing membranes. Chem. Rev. 2021, 121, (4), 2020-2108. [CrossRef] [PubMed]
- Driever, S. M.; Baker, N. R. The water-water cycle in leaves is not a major alternative electron sink for dissipation of excess excitation energy when CO2 assimilation is restricted. Plant Cell Env. 2011, 34, (5), 837-46. [CrossRef]
- Genty, B.; Harbinson, J.; Briantais, J. M.; Baker, N. R. The relationship between non-photochemical quenching of chlorophyll fluorescence and the rate of photosystem 2 photochemistry in leaves. Photosyn. Res. 1990, 25, (3), 249-57. [CrossRef]
- Ruuska, S. A.; Badger, M. R.; Andrews, T. J.; von Caemmerer, S. Photosynthetic electron sinks in transgenic tobacco with reduced amounts of Rubisco: Little evidence for significant Mehler reaction. J. Exp. Bot. 2000, 51 Spec No, 357-68. [CrossRef]
- Sejima, T.; Hanawa, H.; Shimakawa, G.; Takagi, D.; Suzuki, Y.; Fukayama, H.; Makino, A.; Miyake, C. Post-illumination transient O2 -uptake is driven by photorespiration in tobacco leaves. Physiol. Plant. 2016, 156, (2), 227-238. [CrossRef]
- Smith, K.; Strand, D. D.; Kramer, D. M.; Walker, B. J. The role of photorespiration in preventing feedback regulation via ATP synthase in Nicotiana tabacum. Plant Cell Env. 2023. [CrossRef]
- von Caemmerer, S.; Farquhar, G. D. Some relationships between the biochemistry of photosynthesis and the gas exchange of leaves. Planta 1981, 153, (4), 376-87. [CrossRef]
- Sejima, T.; Takagi, D.; Fukayama, H.; Makino, A.; Miyake, C. Repetitive short-pulse light mainly inactivates photosystem I in sunflower leaves. Plant Cell Physiol. 2014, 55, (6), 1184-93. [CrossRef]
- Ozaki, H.; Mizokami, Y.; Sugiura, D.; Sohtome, T.; Miyake, C.; Sakai, H.; Noguchi, K. Tight relationship between two photosystems is robust in rice leaves under various nitrogen conditions. J. Plant Res. 2023, 136, (2), 201-210. [CrossRef]
- Wada, S.; Takagi, D.; Miyake, C.; Makino, A.; Suzuki, Y. Responses of the photosynthetic electron transport reactions stimulate the oxidation of the reaction center chlorophyll of photosystem I, P700, under drought and high temperatures in rice. Int. J. Mol. Sci. 2019, 20, (9). [CrossRef]
- Wada, S.; Suzuki, Y.; Miyake, C. Photorespiration enhances acidification of the thylakoid lumen, reduces the plastoquinone pool, and contributes to the oxidation of P700 at a lower partial pressure of CO2 in wheat leaves. Plants (Basel, Switzerland) 2020, 9. [CrossRef]
- Kasting, J. F. Atmospheric science. How was early earth kept warm? Science (New York, N.Y.) 2013, 339, (6115), 44-5. [CrossRef]
- Ohnishi, M.; Furutani, R.; Sohtome, T.; Suzuki, T.; Wada, S.; Tanaka, S.; Ifuku, K.; Ueno, D.; Miyake, C. Photosynthetic parameters show specific responses to essential mineral deficiencies. Antioxidants (Basel, Switzerland) 2021, 10, (7). [CrossRef]
- Baker, N. R. Chlorophyll fluorescence: a probe of photosynthesis in vivo. Ann. Rev. Plant Biol. 2008, 59, 89-113. [CrossRef]
- Bilger, W.; Björkman, O. Relationships among violaxanthin deepoxidation, thylakoid membrane conformation, and nonphotochemical chlorophyll fluorescence quenching in leaves of cotton (Gossypium hirsutum L.). Planta 1994, 193, (2), 238-246. [CrossRef]
- Oxborough, K.; Baker, N. R. An evaluation of the potential triggers of photoinactivation of photosystem II in the context of a Stern-Volmer model for downregulation and the reversible radical pair equilibrium model. Phil. Trans. Royal Soc. Lond. Series B, Biol. Sci. USA 2000, 355, (1402), 1489-98. [CrossRef]
- Klughammer, C.; Schreiber, U. Deconvolution of ferredoxin, plastocyanin, and P700 transmittance changes in intact leaves with a new type of kinetic LED array spectrophotometer. Photosyn. Res. 2016, 128, (2), 195-214. [CrossRef]
- Böhme, H. Quantitative determination of ferredoxin, ferredoxin-NADP+ reductase and plastocyanin in spinach chloroplasts. Eur. J. Biochem. 1978, 83, (1), 137-41. [CrossRef]
- Kozuleva, M.; Goss, T.; Twachtmann, M.; Rudi, K.; Trapka, J.; Selinski, J.; Ivanov, B.; Garapati, P.; Steinhoff, H. J.; Hase, T.; Scheibe, R.; Klare, J. P.; Hanke, G. T. Ferredoxin:NADP(H) oxidoreductase abundance and location influences redox poise and stress tolerance. Plant Physiol. 2016, 172, (3), 1480-1493. [CrossRef] [PubMed]
- Yamamoto, H.; Kato, H.; Shinzaki, Y.; Horiguchi, S.; Shikanai, T.; Hase, T.; Endo, T.; Nishioka, M.; Makino, A.; Tomizawa, K.; Miyake, C. Ferredoxin limits cyclic electron flow around PSI (CEF-PSI) in higher plant-Stimulation of CEF-PSI enhances non-photochemical quenching of Chl fluorescence in transplastomic tobacco. Plant Cell Physiol. 2006, 47, (10), 1355-71. [CrossRef]
- Oja, V.; Eichelmann, H.; Peterson, R. B.; Rasulov, B.; Laisk, A. Deciphering the 820 nm signal: redox state of donor side and quantum yield of Photosystem I in leaves. Photosyn. Res. 2003, 78, (1), 1-15. [CrossRef] [PubMed]
- Cherepanov, D. A.; Milanovsky, G. E.; Petrova, A. A.; Tikhonov, A. N.; Semenov, A. Y. Electron Transfer through the Acceptor Side of Photosystem I: Interaction with Exogenous Acceptors and Molecular Oxygen. Biochem. Biokhim. 2017, 82, (11), 1249-1268. [CrossRef] [PubMed]
- Sacksteder, C. A.; Kramer, D. M. Dark-interval relaxation kinetics (DIRK) of absorbance changes as a quantitative probe of steady-state electron transfer. Photosyn. Res. 2000, 66, (1), 145-158. [CrossRef] [PubMed]
- Avenson, T. J.; Cruz, J. A.; Kramer, D. M. Modulation of energy-dependent quenching of excitons in antennae of higher plants. Proc. Natl. Acad. Sci. USA 2004, 101, (15), 5530-5. [CrossRef] [PubMed]
- Cruz, J. A.; Sacksteder, C. A.; Kanazawa, A.; Kramer, D. M. Contribution of electric field (ΔΨ) to steady-state transthylakoid proton motive force (pmf) in vitro and in vivo. control of pmf parsing into ΔΨ and ΔpH by ionic strength. Biochem. 2001, 40, (5), 1226-37. [CrossRef]
- Klughammer, C.; Siebke, K.; Schreiber, U. Continuous ECS-indicated recording of the proton-motive charge flux in leaves. Photosyn. Res. 2013, 117, (1-3), 471-87. [CrossRef]
Figure 1.
Effects of the intercellular partial pressure of CO2 (Ci) on the gross CO2 assimilation rate (A + Rd) and apparent quantum yield of photosystem II (PSII) [Y(II)] in wild-type (WT) and pgr5hope1 Arabidopsis. (A) The gross CO2 assimilation rates were measured at 400 µmol photons m−2 s−1 and 21 kPa O2, and Y(II) was simultaneously measured. The dark respiration rates (Rd) were measured before starting actinic light illumination. The gross CO2 assimilation rates are expressed as A + Rd and were plotted against Ci. (B) Y(II) was plotted against Ci. The data were obtained from four independent experiments using leaves attached to four plants of both WT and pgr5hope1 (N = 4). The ambient partial pressures of CO2 were changed from 400 ppm to 50 through 300, 200, and 100 Pa at 21 kPa O2 for the same leaves. Black symbols, WT; white symbols, pgr5hope1.
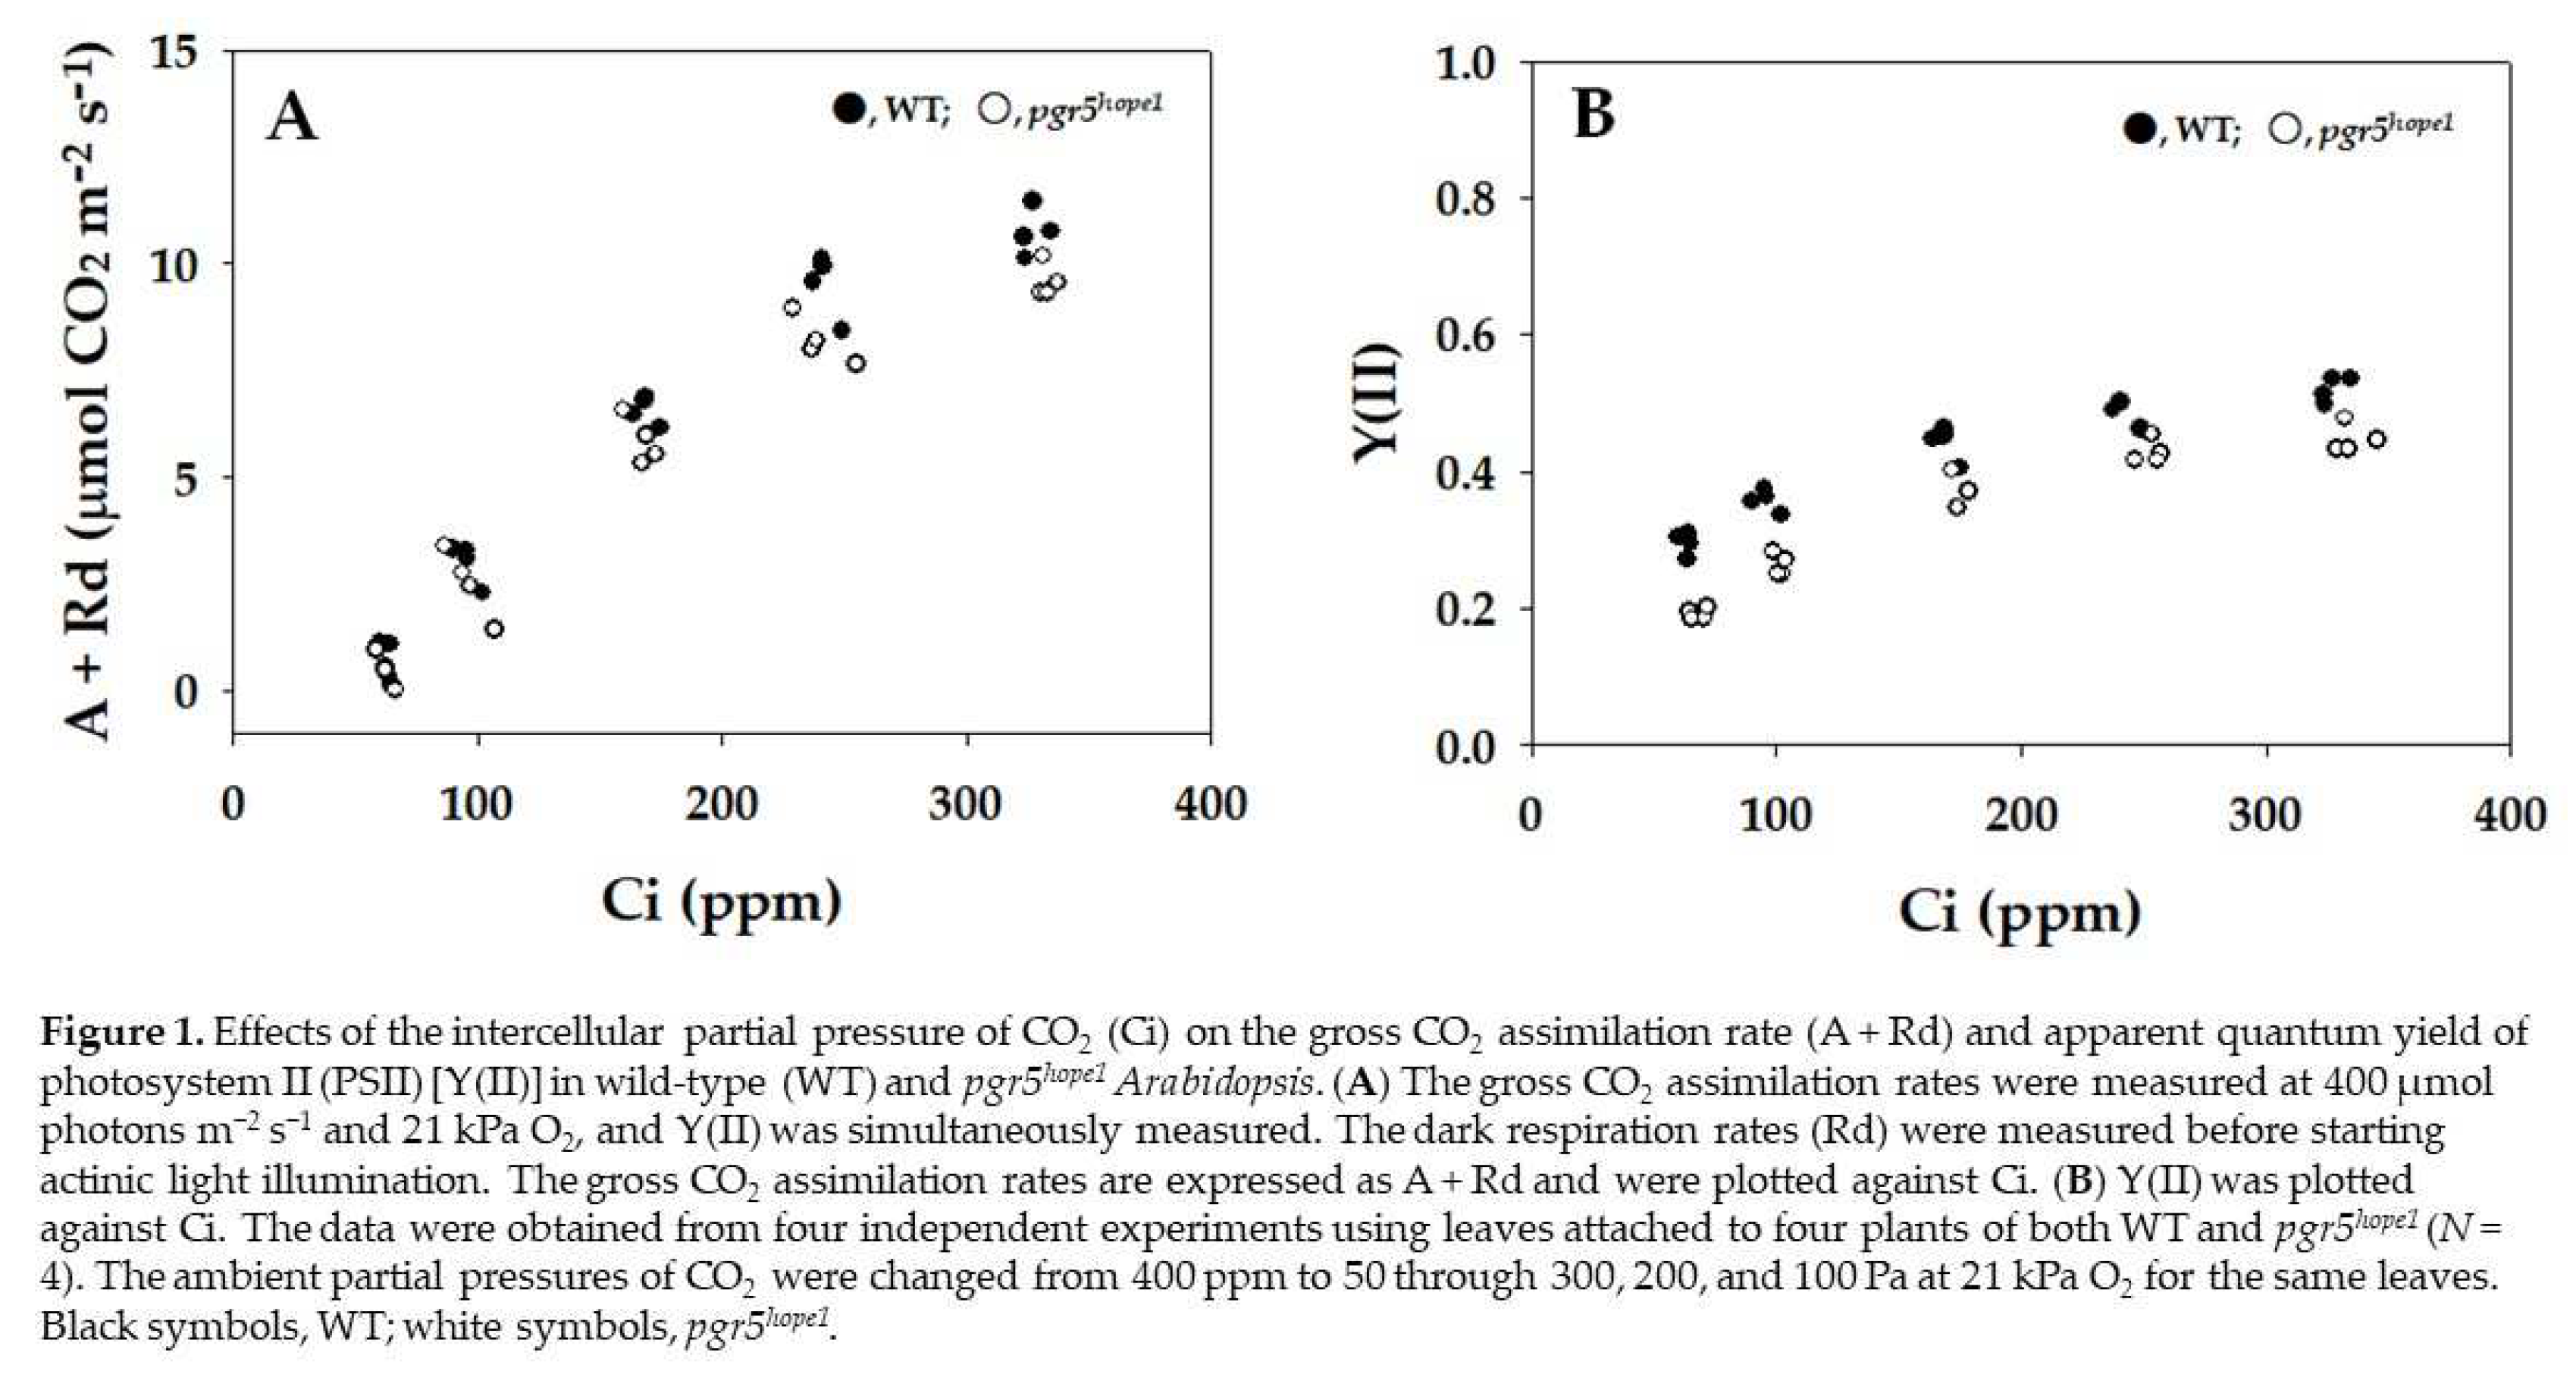
Figure 2.
Relationships between P700+, PC+, Fd−, and apparent quantum yield of photosystem II (PSII) [Y(II)]. The data for each parameter were measured in the experiments depicted in Figure 1, simultaneously with the gross CO2 assimilation rates and Y(II). (A) P700+, (B) PC+, and (C) Fd− were plotted against Y(II). The ratios of P700+, PC+, and Fd− against the total contents are expressed. The data were obtained from four independent experiments using leaves attached to four WT and pgr5hope1 plants (N = 4). Black symbols, WT; white symbols, pgr5hope1.
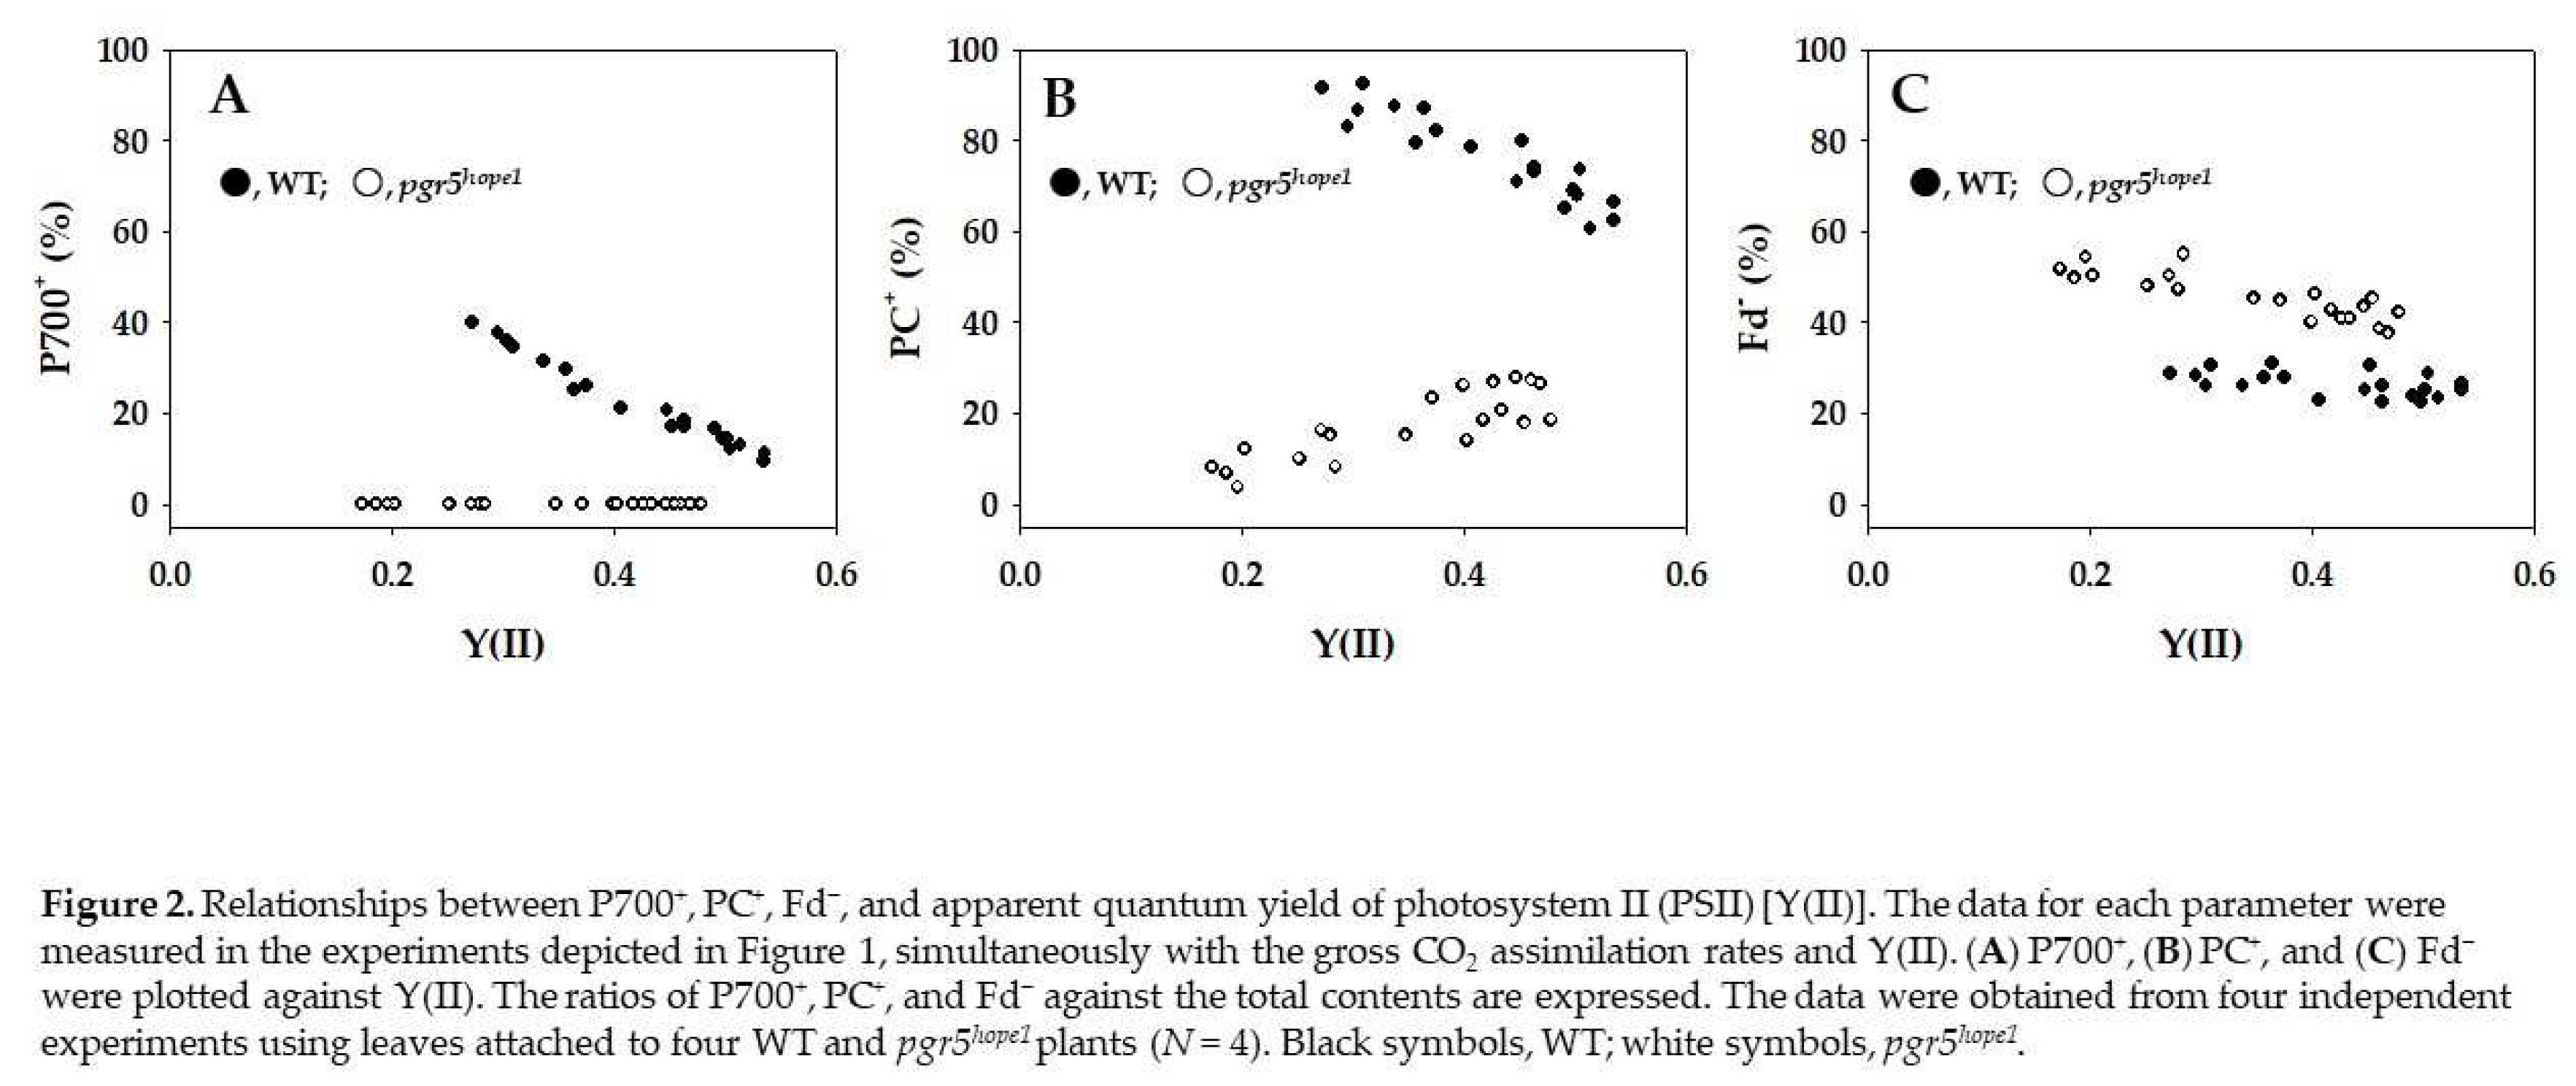
Figure 3.
Relationships between nonphotochemical quenching (NPQ), plastoquinone reduced state (1 − qP), and apparent quantum yield of photosystem II (PSII) [Y(II)]. The data for each parameter were measured in the experiments depicted in Figure 1, simultaneously with the gross CO2 assimilation rates and Y(II). (A) NPQ and (B) 1 − qP were plotted against Y(II). The two vertical lines were drawn at approximately 0.27 and 0.45 of Y(II), where the values of 1 – qP were the same between WT and pgr5hope1. These characteristics were used for the comparison of the oxidation of the reduced Fd in Figure 5. The data were obtained from four independent experiments using leaves attached to four WT and pgr5hope1 plants (N = 4). Black symbols, WT; white symbols, pgr5hope1.
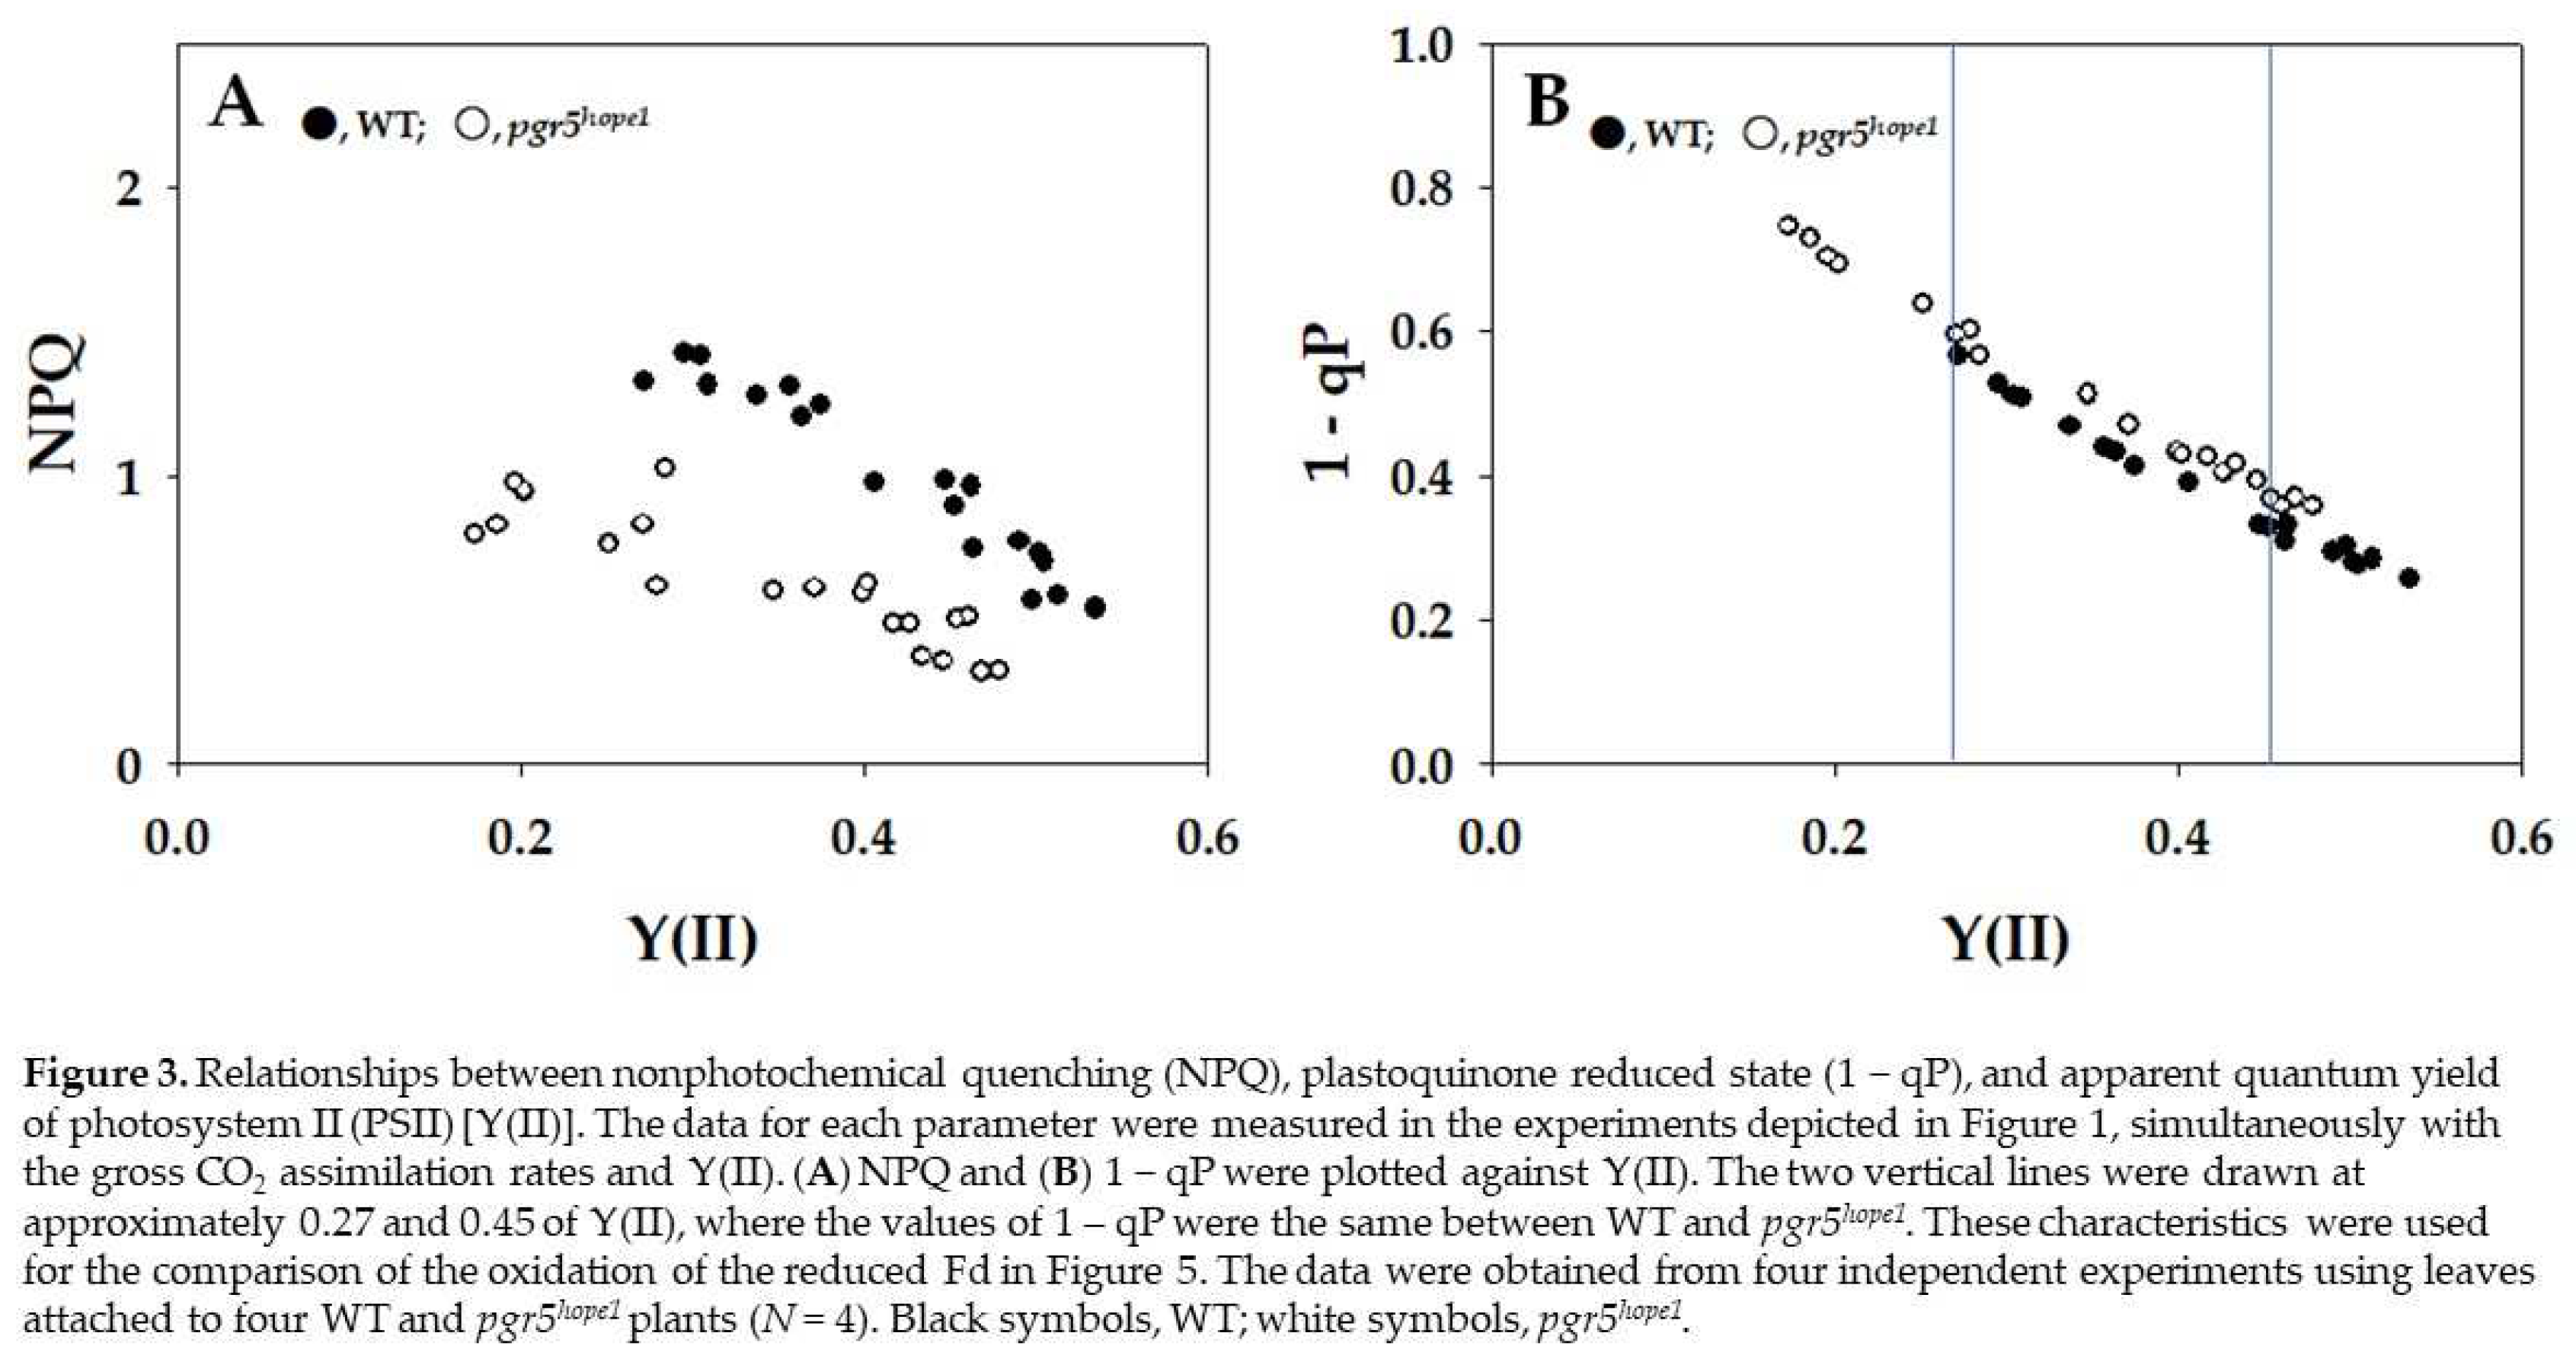
Figure 4.
Relationships between the apparent quantum yield of PSI [Y(I)], apparent quantum yield of nonphotochemical energy dissipation of photoexcited P700 [Y(NA)], and apparent quantum yield of photosystem II (PSII) [Y(II)]. The data for each parameter were measured in the experiments depicted in Figure 1, simultaneously with the gross CO2 assimilation rates and Y(II). (A) Y(I) and (B) Y(NA) were plotted against Y(II). The data were obtained from four independent experiments using leaves attached to four WT and pgr5hope1 plants (N = 4). Black symbols, WT; white symbols, pgr5hope1.
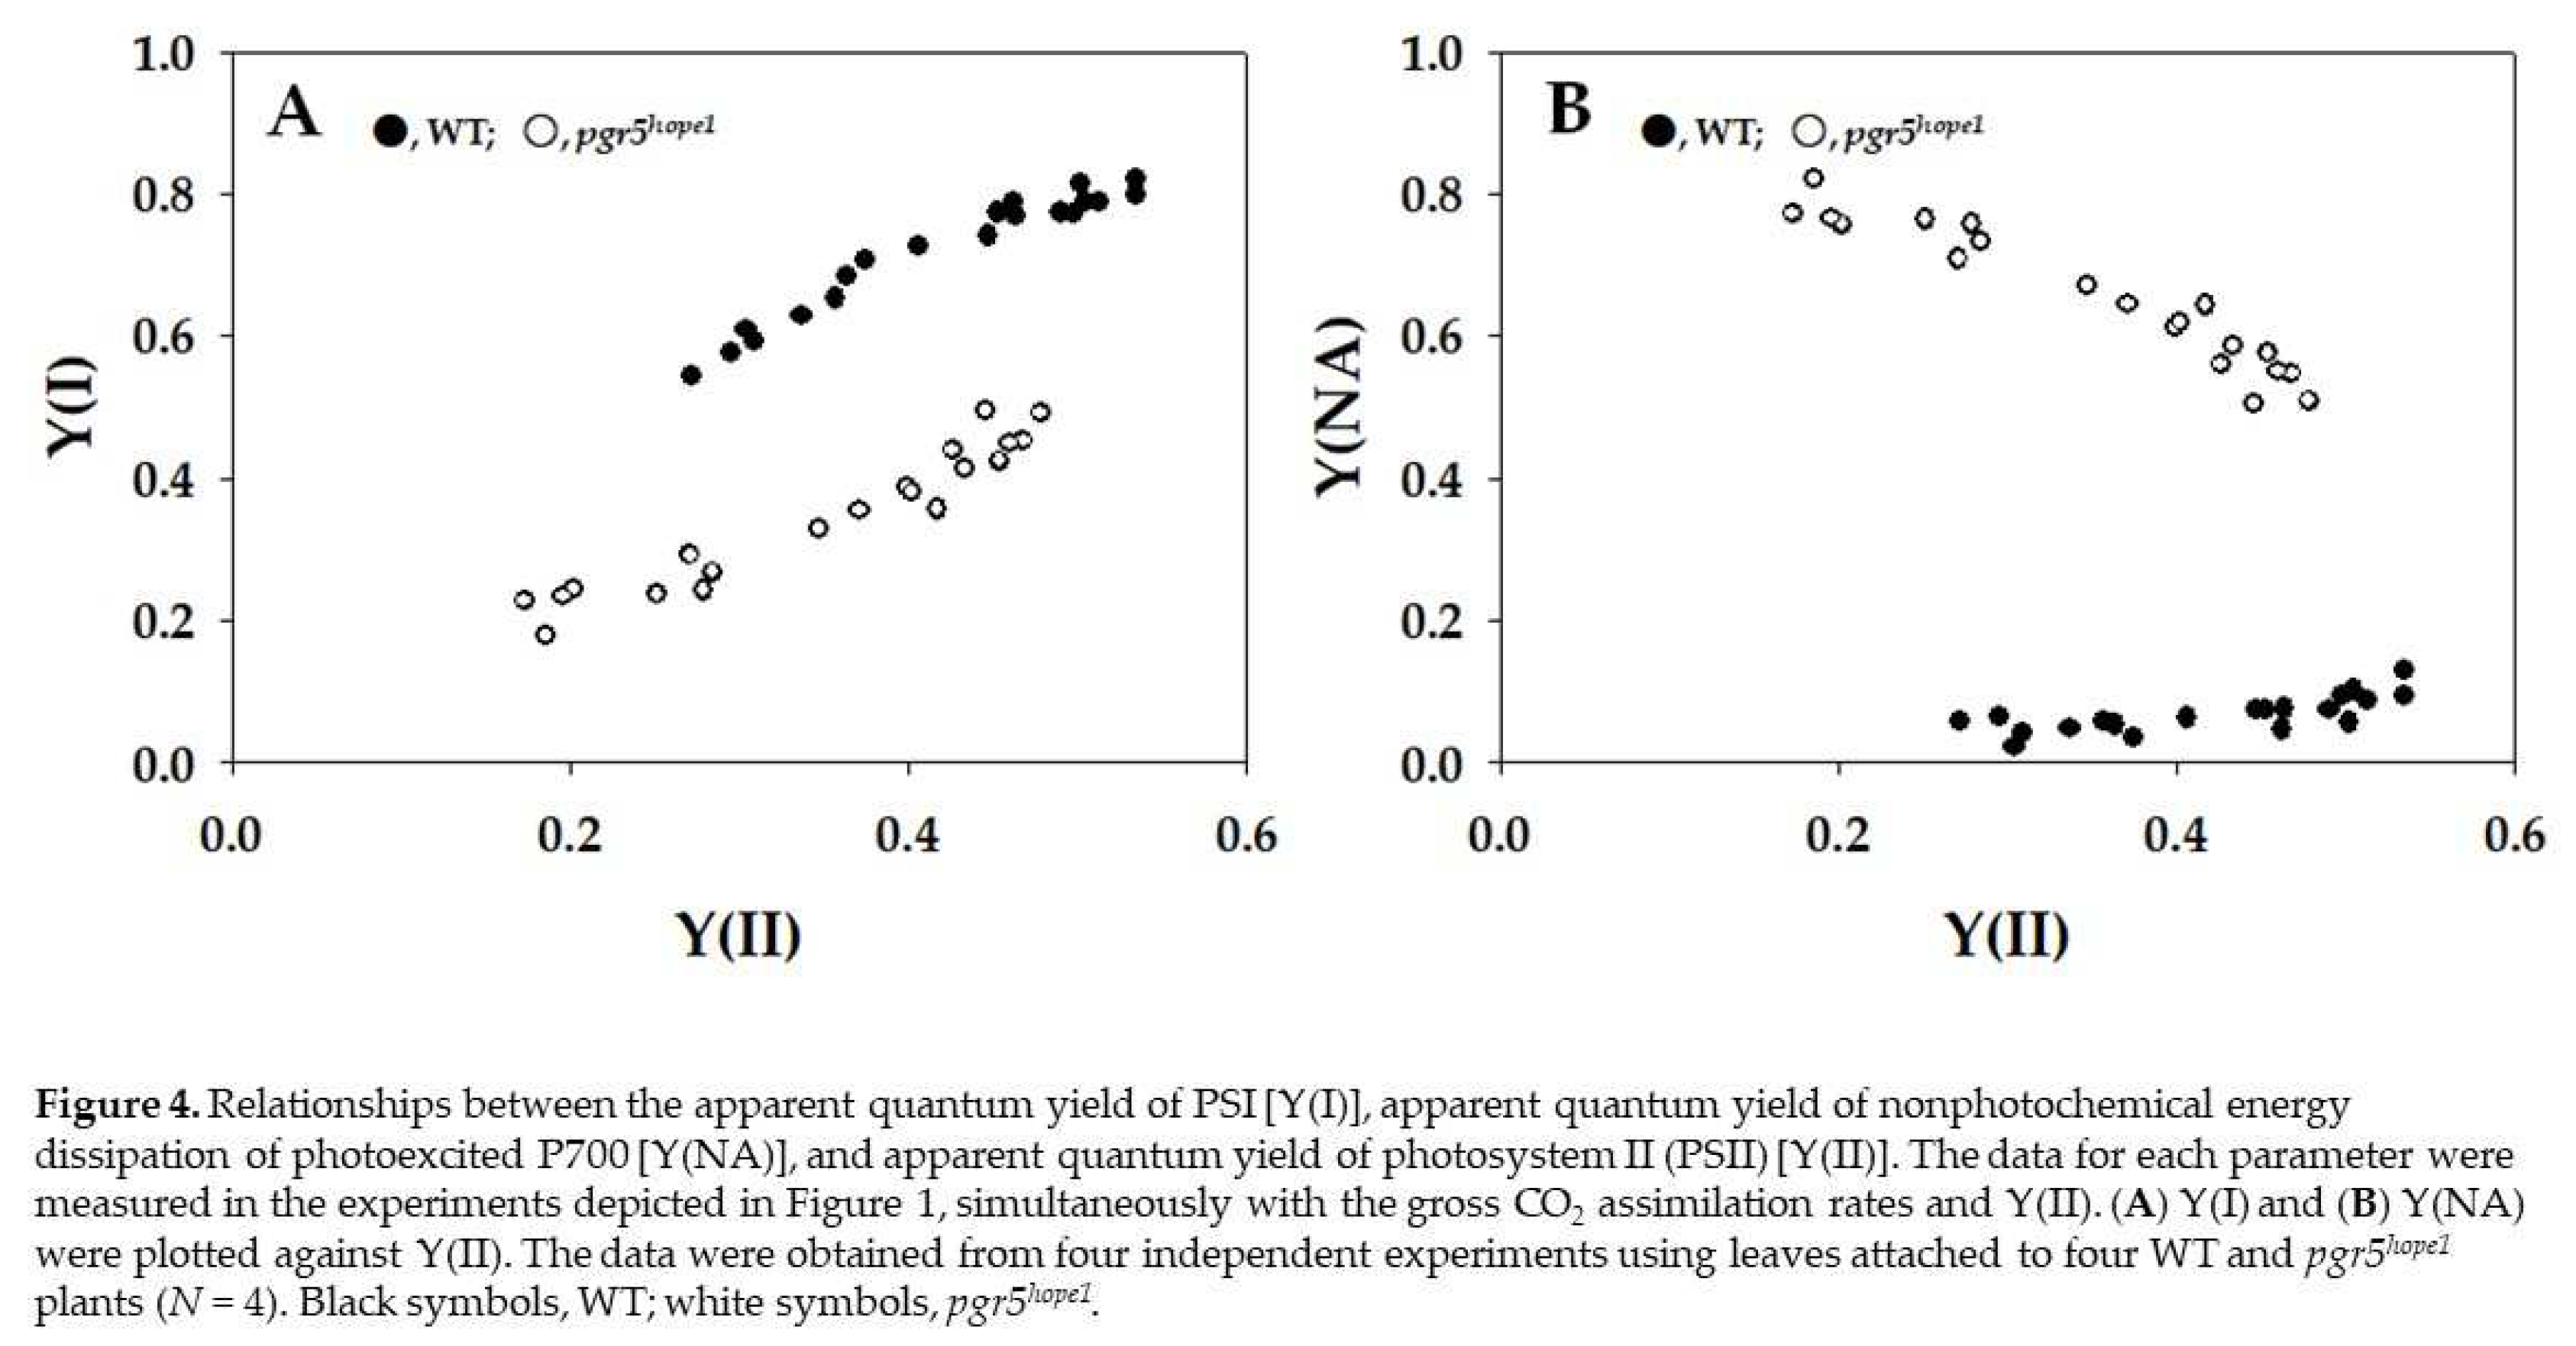
Figure 6.
The potential risk of ROS production due to the unbalanced usage of NADPH and ferredoxin (Fd)-dependent cyclic electron flow around PSI removes ROS. (A) The linear electron flow produces both NADPH and ATP to drive CO2 assimilation, where the consumption rate of NADPH in the Calvin-Bassham-Benson (CBB) cycle is lower than the production rate of NADPH (see “text”). The unbalanced usage of NADPH induces the accumulation of electrons in PSI, which triggers reactive oxygen species (ROS) production through the univalent reduction of O2 to superoxide radicals and causes oxidative damage to PSI. This is the threat of the linear electron flow to produce ROS in PSI (potential risk of ROS production). (B) To remove the threat of ROS production (ROS emergency), NADPH usage should be accelerated by the extra supply of ATP to the CBB cycle, which is driven by the Fd-dependent cyclic electron flow around PSI (Fd-CEF). This is ROS risk control, one of the suppression mechanisms of ROS production in photosynthetic organisms.
Disclaimer/Publisher’s Note: The statements, opinions and data contained in all publications are solely those of the individual author(s) and contributor(s) and not of MDPI and/or the editor(s). MDPI and/or the editor(s) disclaim responsibility for any injury to people or property resulting from any ideas, methods, instructions or products referred to in the content. |
© 2024 by the authors. Licensee MDPI, Basel, Switzerland. This article is an open access article distributed under the terms and conditions of the Creative Commons Attribution (CC BY) license (http://creativecommons.org/licenses/by/4.0/).
Copyright: This open access article is published under a Creative Commons CC BY 4.0 license, which permit the free download, distribution, and reuse, provided that the author and preprint are cited in any reuse.


