1. Introduction
In addition to its central status as research technique, the real-time polymerase chain reaction (qPCR) [
1,
2] has found extensive applied uses in clinical [
3], veterinary [
4] and agricultural [
5] diagnostics as well as public health surveillance [
6,
7]. However, as molecular diagnostic applications continue to expand and evolve, traditional qPCR protocols and assay designs present inherent challenges for rapid results and point-of-care (PoC) applications. One particular limitation is the time it takes for qPCR instruments to ramp up and down the 35°C temperature differential necessitated by the standard 95°C denaturation/60°C polymerisation protocol. There has been a focus on eliminating heating blocks, for example, through the use of microfluidic qPCR chips [
8,
9], continuous Flow PCR [
10,
11] and plasmonic nanoparticles [
12,
13], but there has been a surprising lack of adjustment to the original protocols. This is despite the introduction of improved enzymes, reagents and plasticware. Even extreme PCR protocols [
14,
15,
16] use high denaturation and low annealing temperatures. In practice, this means that in combination with long dwelling times, a typical 40 cycle qPCR assay still takes 45 minutes to complete. This approach is clearly unsuitable for PoC applications, particularly in infectious disease diagnosis, where quick and accurate identification of the causative agent is crucial for effective treatment and containment. Additionally, in fields such as environmental monitoring [
17], food safety [
18], and forensic analysis [
19], reliable and rapid detection is crucial for timely decision-making and intervention. Whilst sample preparation remains a bottleneck within the PCR workflow, this issue is being addressed [
20,
21,
22,
23,
24,
25,
26], making it even more important to address the PCR step itself.
This study addresses limitations in conventional PCR protocols by significantly reducing current PCR run times. This was achieved by developing a protocol that combines a low temperature differential (∆T) with short dwelling times. These modifications are complemented by adjusted primer and probe design parameters, alongside the use of basic yet efficient buffers. These combined innovations streamline qPCR reactions by significantly reducing denaturation and polymerisation times at lower denaturation temperatures (79°C-80°C) and higher polymerisation temperatures (71°C-72°C).
Moreover, the buffers enable effective reverse transcription, simplifying one-step RT-qPCR assays. This comprehensive approach is versatile, applicable across diverse pathogens and cellular mRNA targets, leading to the development of a universally adaptable technique we have called “FlashPCR”. This method completes PCR reactions within 10-15 minutes on standard qPCR cyclers, presenting significant promise for accelerating research and diagnostics applications on the next generation of faster instruments.
2. Results
2.1. Amplification across denaturation and polymerisation gradients.
Following the establishment of optimal probe, primer and Taq polymerase concentrations (
Figure S1), more than 50 component variations in a basic qPCR reaction buffer were evaluated to identify buffers that would enable two modifications to the conventional PCR protocol: (i) lower denaturation and higher annealing/polymerisation temperatures than conventionally considered practical and (ii) minimal ∆T between the two cycling temperatures whilst maintaining the reactions’ specificity, sensitivity and repeatability. This was done using numerous denaturation and polymerisation gradients, a range of Taq polymerases as well as different primer and probe designs. For amplification of SARS-CoV-2 this resulted in a final selection of MyTaq non-hot start polymerase, a choice of buffers (B47 and B50) that recorded essentially the same results targeting the CoV-E assay, which as a G/C content of 44%.
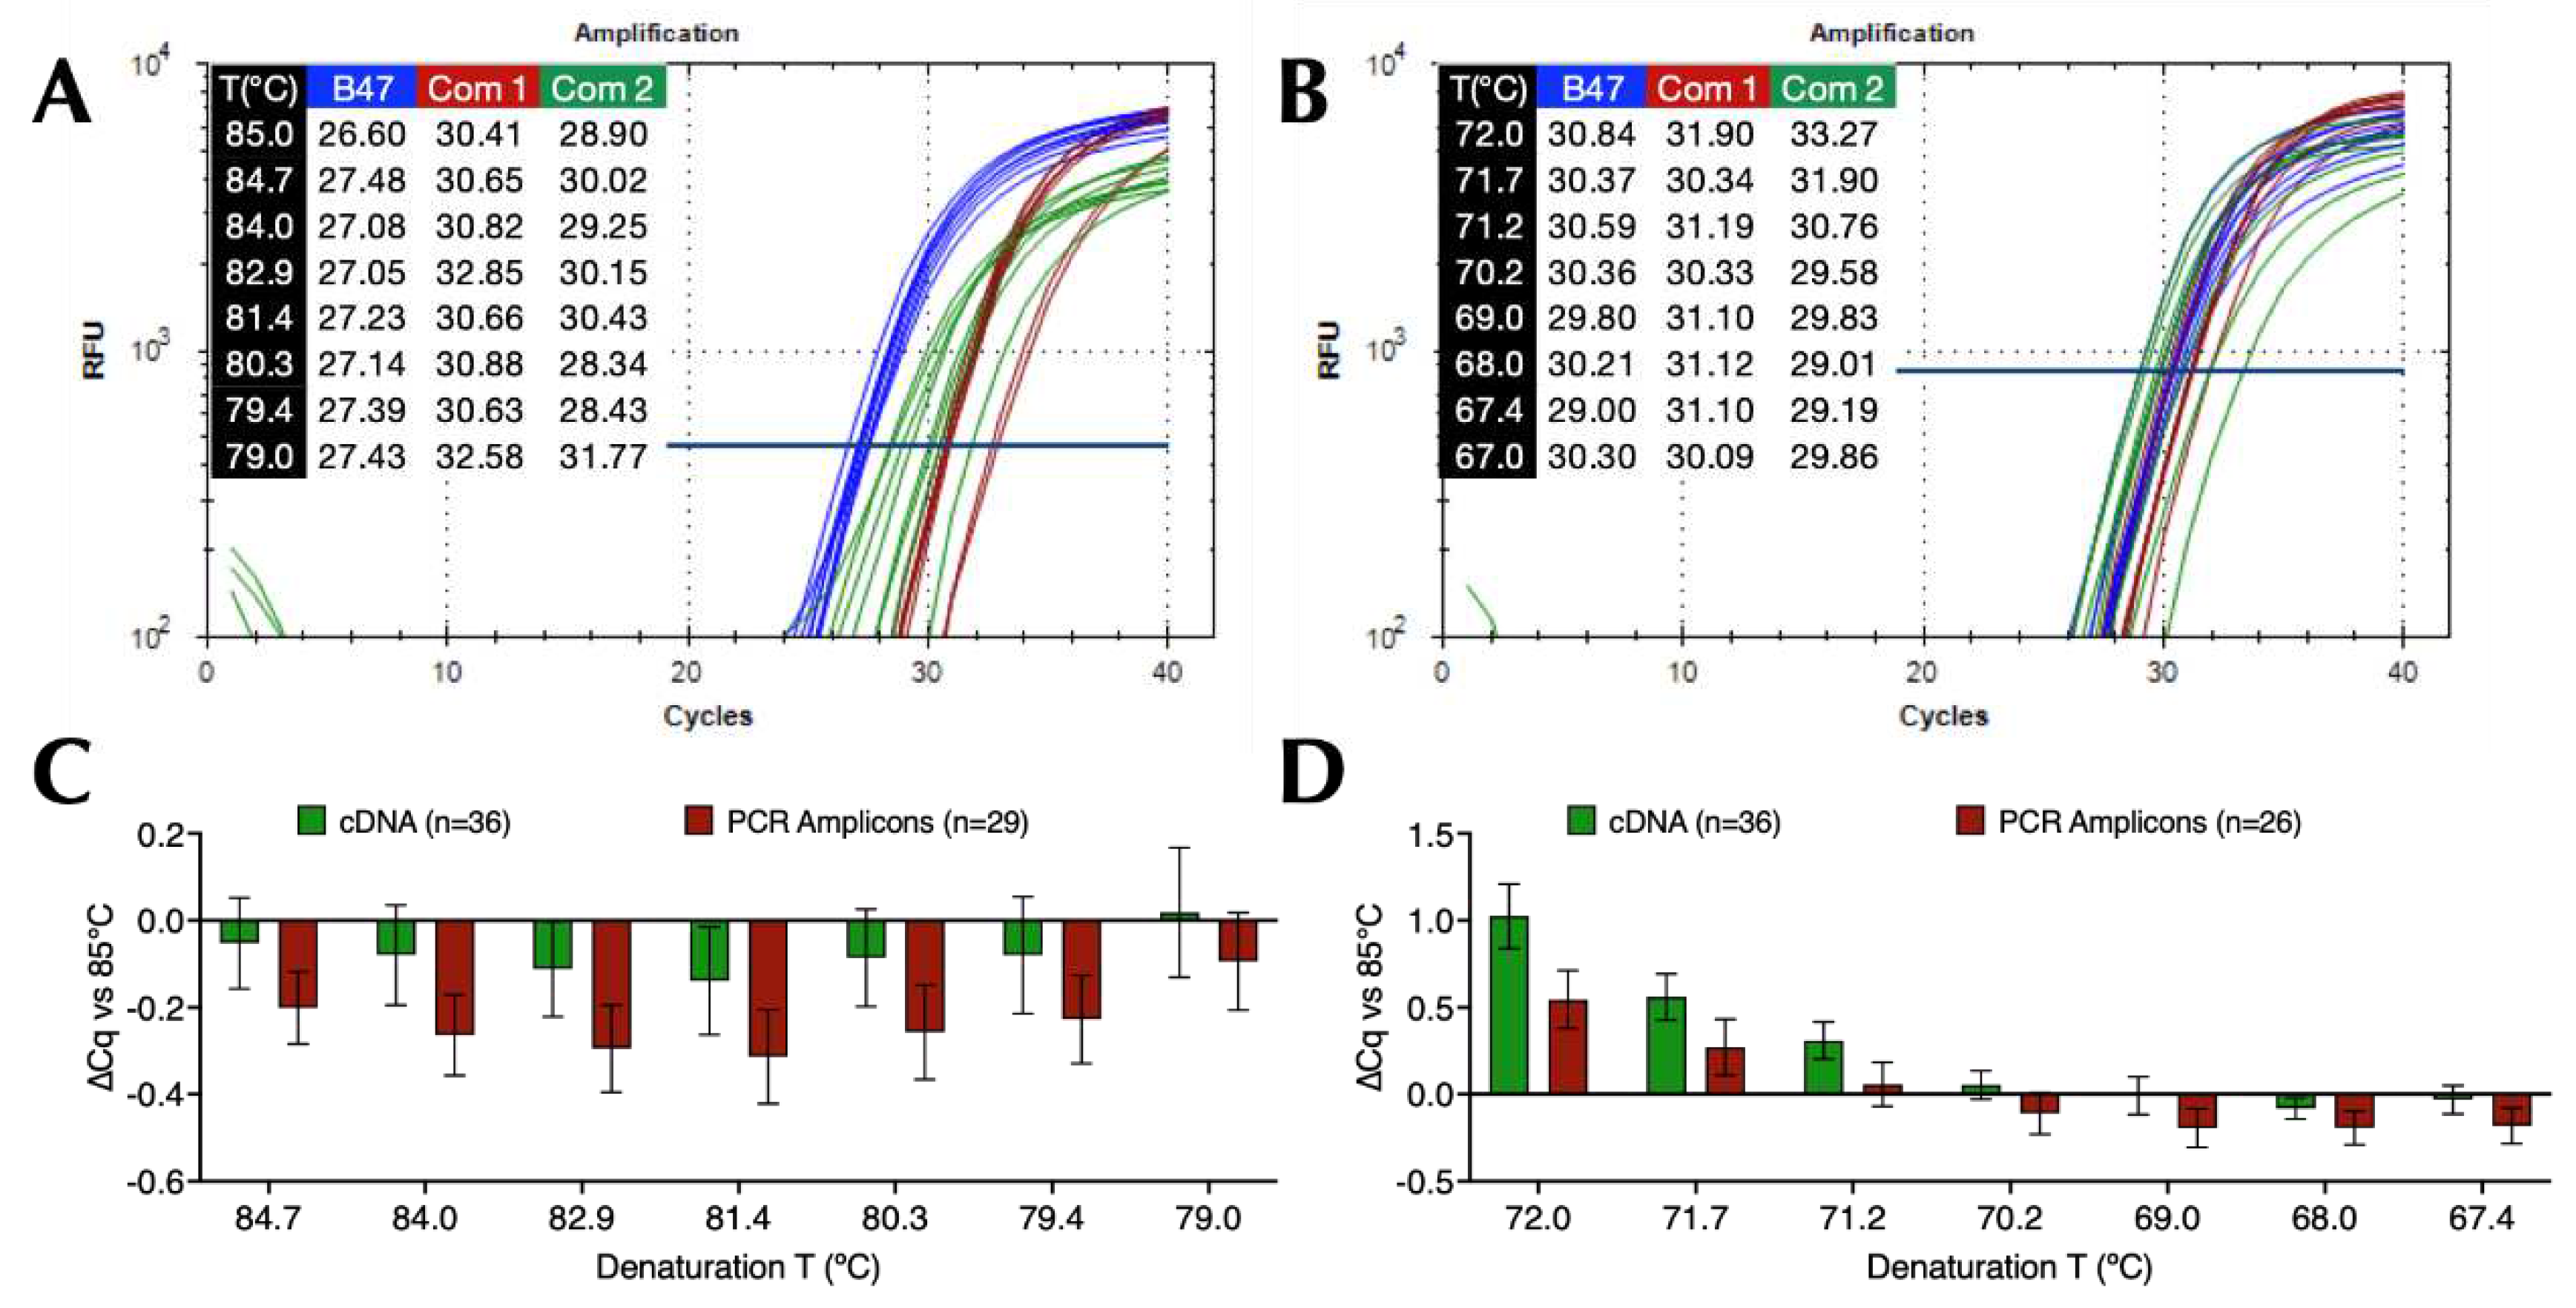
Figure 1A shows representative amplification plots and Cq values with B47 compared to two commercial master mixes (Com 1 and Com 2) on a 79°C to 85°C denaturation gradient (Protocol P2). This resulted in ∆Cqs (79°C vs 85°C) of 0.83, 2.17 and 2.87 for B47, Com 1 and Com 2, respectively.
Figure 1B shows representative amplification plots and Cq values from a 67°C and 72°C polymerisation gradient (Protocol P3) with ∆Cqs (72°C vs 67°C) of 0.54, 1.81 and 3.40, respectively. These results were highly reproducible, regardless of whether cDNA or PCR amplicons were used as target DNA. This is demonstrated by the bar plots in
Figure 1C,D obtained using B47 or B50 that show the ∆Cq values (±95% confidence intervals) from individual denaturation gradients (n=65, of which 29 were PCR amplicons) and polymerisation gradients (n=62, of which 26 were PCR amplicons) against the respective 85°C denaturation or 67°C polymerisation controls. These results indicate that an amplicon size of around 85 bp, primers and a probe with Tms of around 71°C and 75°C, respectively permitted effective amplification using a denaturation temperature of around 79°C to 80°C combined with a polymerisation temperature of around 70°C-71°C.
2.2. Amplification using single denaturation and polymerisation temperatures.
Since a temperature gradient might not accurately reflect an assay’s performance under single qPCR cycling temperatures, four protocols with different ∆T values (P4-P7) were used to amplify SARS-CoV-2 cDNA with B47 and the CoV-E assay. Results were compared to the Cqs recorded using the standard protocol (P1). P1 and P7 were repeated five times, P4 and P5 four times and P6 was run once. Results as assessed by ∆Cq values were comparable across all runs, with the average ∆Cq values (±95% CI) relative to the standard protocol (P1) being -0.03 (-0.44, 0.37) for the ∆T=10°C protocol (P4), -0.19 (-0.49, 0.1) for the ∆T=9°C protocol (P5), 0.49 (-0.13, 1.1) for the ∆T=9°C with a denaturation temperature of 79°C (P6) and 0.56 (0.26, 0.86) for the ∆T=8°C protocol (P7) (
Figure S2A). The reduction in ∆T resulted in a reduction in run times from 31 minutes to 19 minutes.
The experiment was repeated on the BMS Mic qPCR instrument with modified protocols P7 and P8 and buffer 19 to account for instrument-specific variability. Results were similar, although the optimal polymerisation temperature was 69°C and holding times were a little longer (
Figure S2B). On this instrument run times were reduced from 33 minutes with P7 to 16 minutes with P8.
2.3. Amplification with short primers modified with Pentabases
The purpose of these experiments was to determine whether the incorporation of modified bases into primers would allow the use of shorter primers whilst maintaining the ability to anneal at higher polymerisation temperatures. First, the performance of the standard 31-mer DNA CoV-E primers was compared to that of the 24- and 26-mer Pentabase primers PF-F and PB-R on denaturation (P10) and polymerisation (P3) gradients. Cq values across the denaturation gradient were similar for both primers sets, with ∆Cqs between 85°C and 79°C also comparable at 0.03 and 0.09, respectively for DNA and PB primers (Figure 3A). A similar result was obtained across the polymerisation gradient, with ∆Cqs of 0.7 and 0.53, respectively (
Figure S3B).
When the primers were compared using single denaturation and polymerisation temperatures, both sets of primers recorded similar ∆Cq values relative to the control P1 protocol (
Figure S3C). With protocol P5, the DNA and PB primers recorded ∆Cqs against protocol P1 of 0.025 (-0.35, 0.4) and -0.32 (-0.87, 0.22), respectively. With protocol P7, the respective ∆Cq values were 0.84 (0.1, 1.57) and 0.45 (-0.47, 1.36), indicating a marginally better performance of the Pentabase primers.
2.4. Limit of detection (LoD) and PCR efficiency
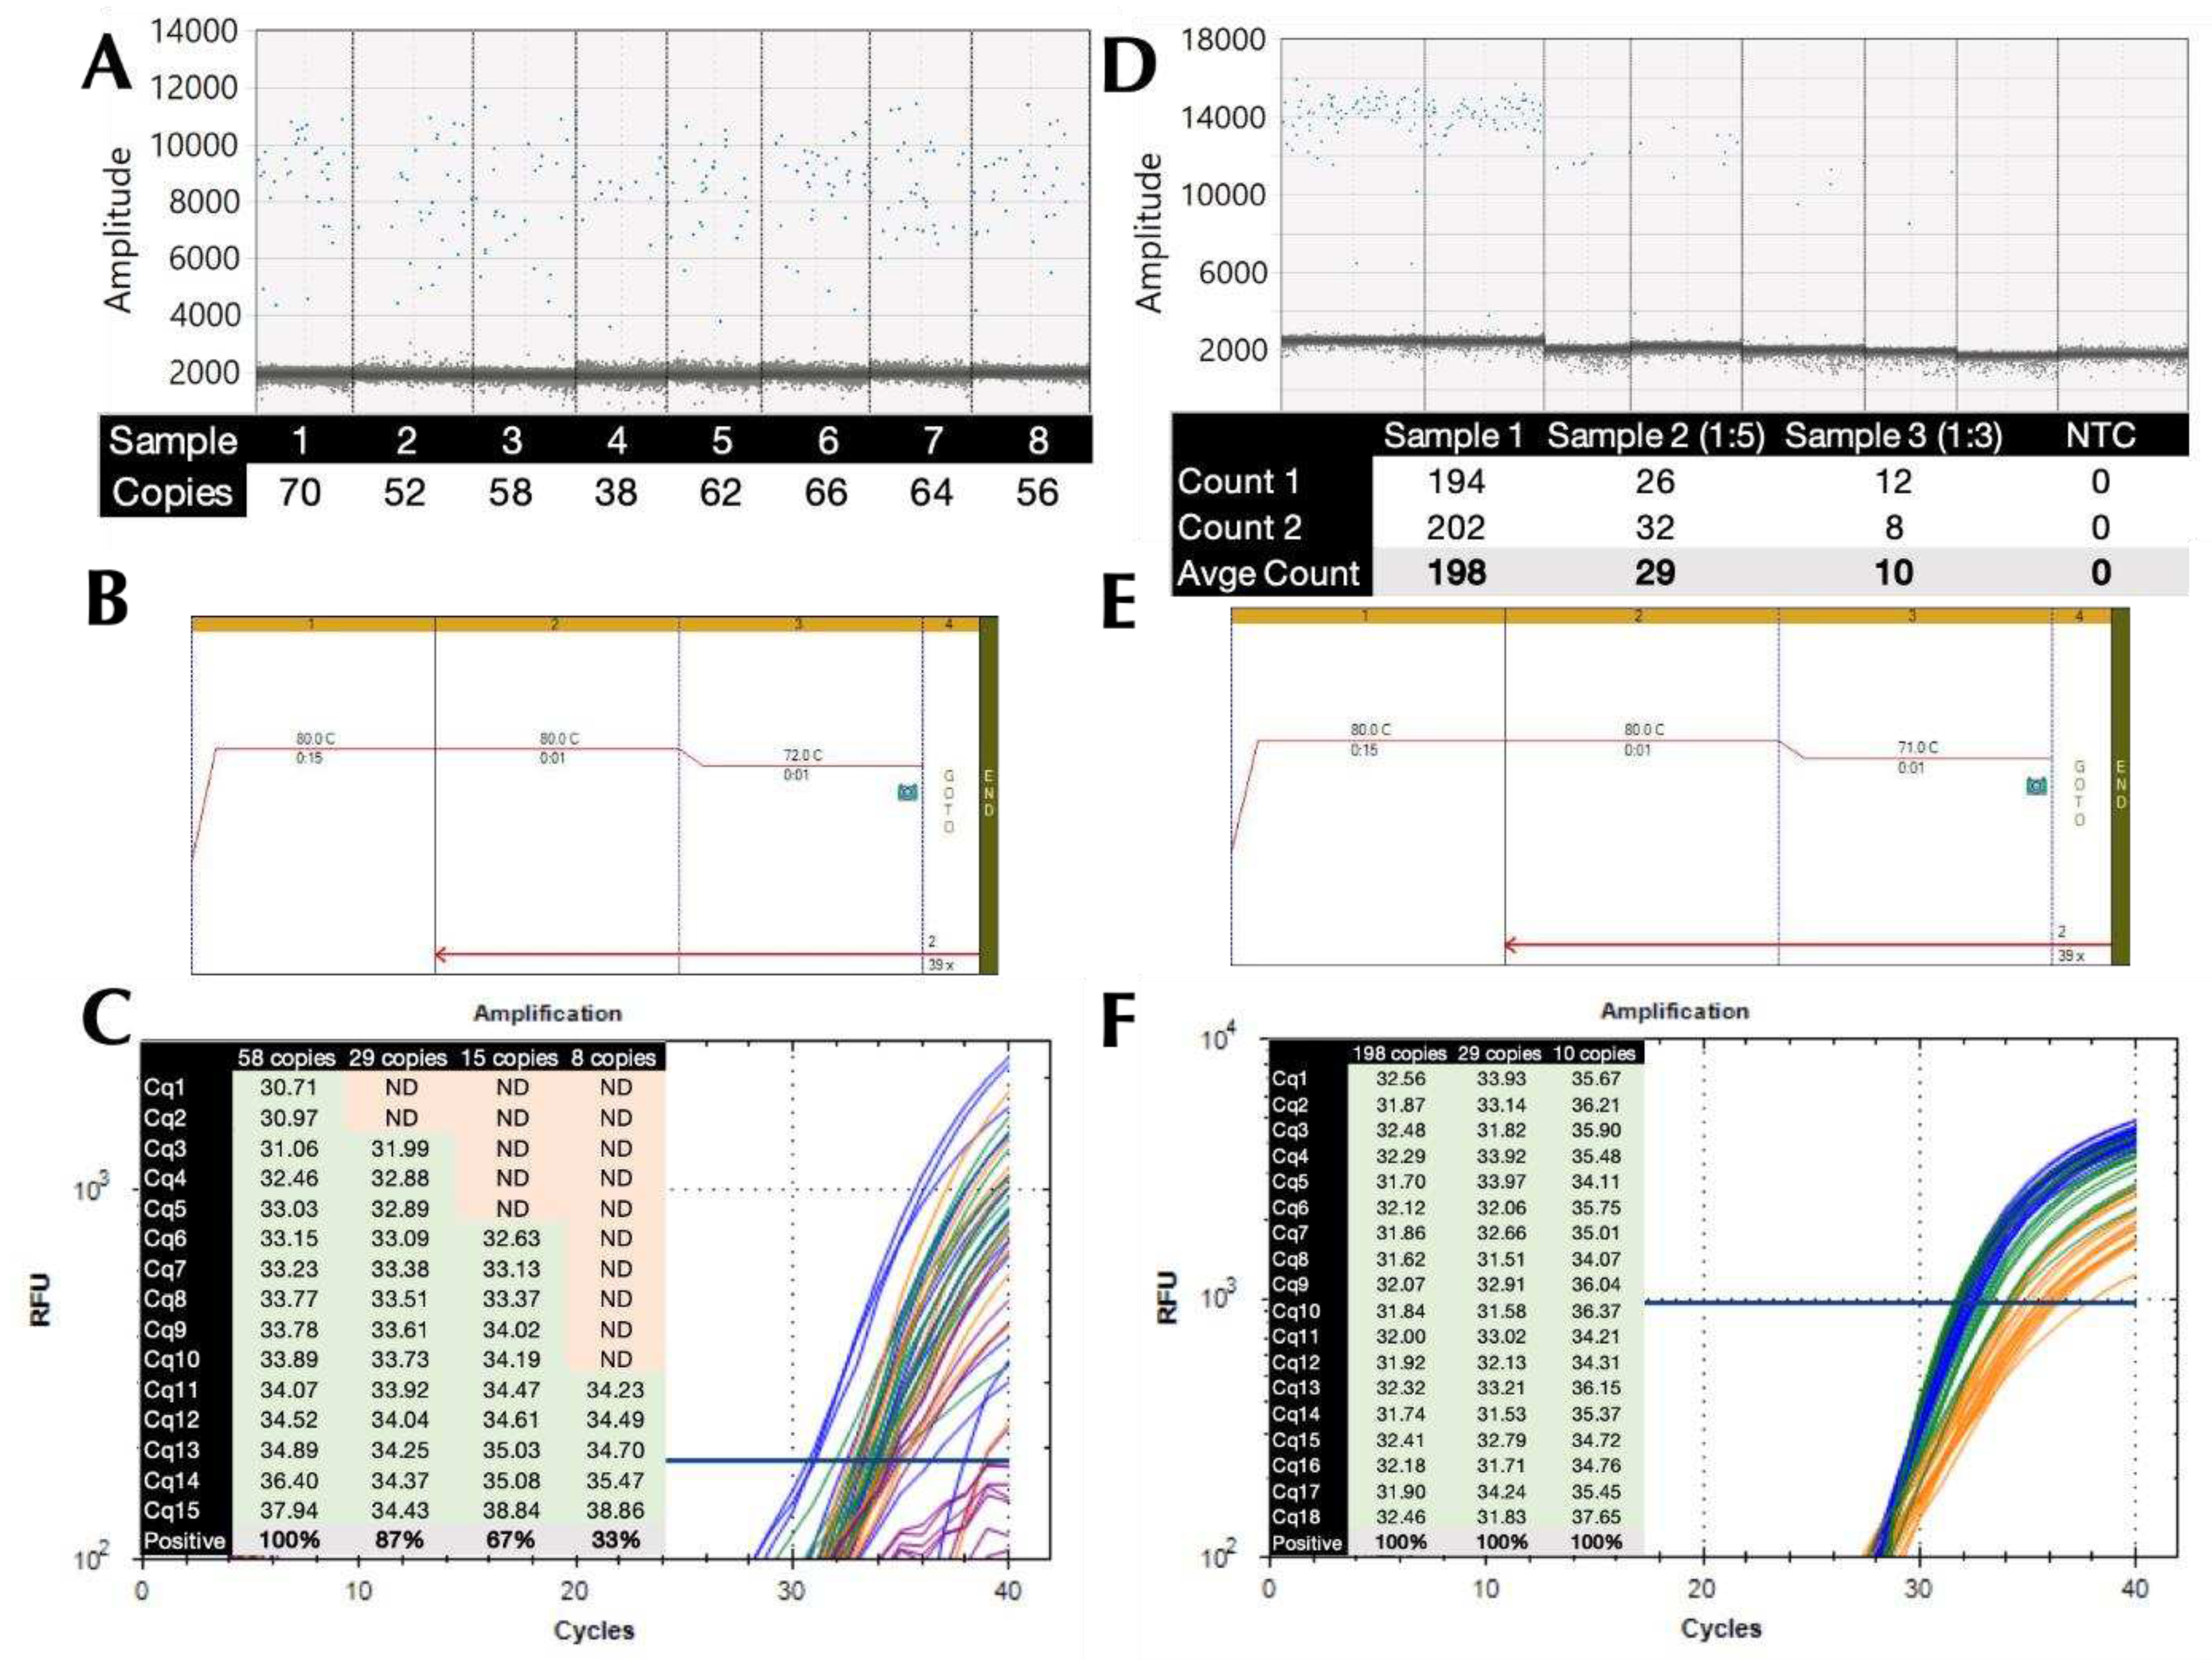
Absolute copy numbers of SARS-CoV-2 cDNA were determined using ddPCR and assay CoV-E, with the highest dilution containing 58 (range 52-70) copies/reaction (
Figure 2A). The LoD was determined on the BioRad CFX by preparing two-fold dilutions of that sample to 29, 15 and 7 copies/reaction and subjecting them to 15 replicate qPCR reactions using B47 and protocol P11 with a 72°C polymerisation temperature (
Figure 2B). All reactions containing 58 copies recorded Cq values, whereas only 87%, 67% and 33%, respectively, of the higher dilutions did so, indicative of a 95% LoD of around 45 copies (
Figure 2C). The experiment was repeated with fresh dilutions of 198, 29 and 10 copies (
Figure 2D), but using protocol P5 with a 71°C polymerisation temperature (
Figure 2E). This time all 18 dilutions of the three dilutions recorded Cq values. Since LoD is the measurand concentration that produces at least 95% positive replicates, the LoD working at 95% confidence is <10 copies.
The linearity and efficiency of the reaction were determined by running serial dilutions of SARS-CoV-2 PCR amplicons with assay CoV-E using protocol P1 with SensiFast master mix (
Figure S4A). A second run used protocol P5 and B47 with MyTaq polymerase (
Figure S4B). The Cqs recorded by the amplification plots resulted in standard curves indicative of a PCR efficiency of around 100% for both buffers (
Figure S4C).
2.5. Other pathogens
The wider application of the low ∆T modified protocols was demonstrated by the successful amplification of the genomic DNA from a range of common pathogens. This required the use of alternative buffers, since B47 worked well on the polymerisation gradient, but performed less well on the denaturation gradient. This was most likely due to the G/C content of the
S. aureus amplicon, which is much higher at 55% than the CoV-E amplicon.
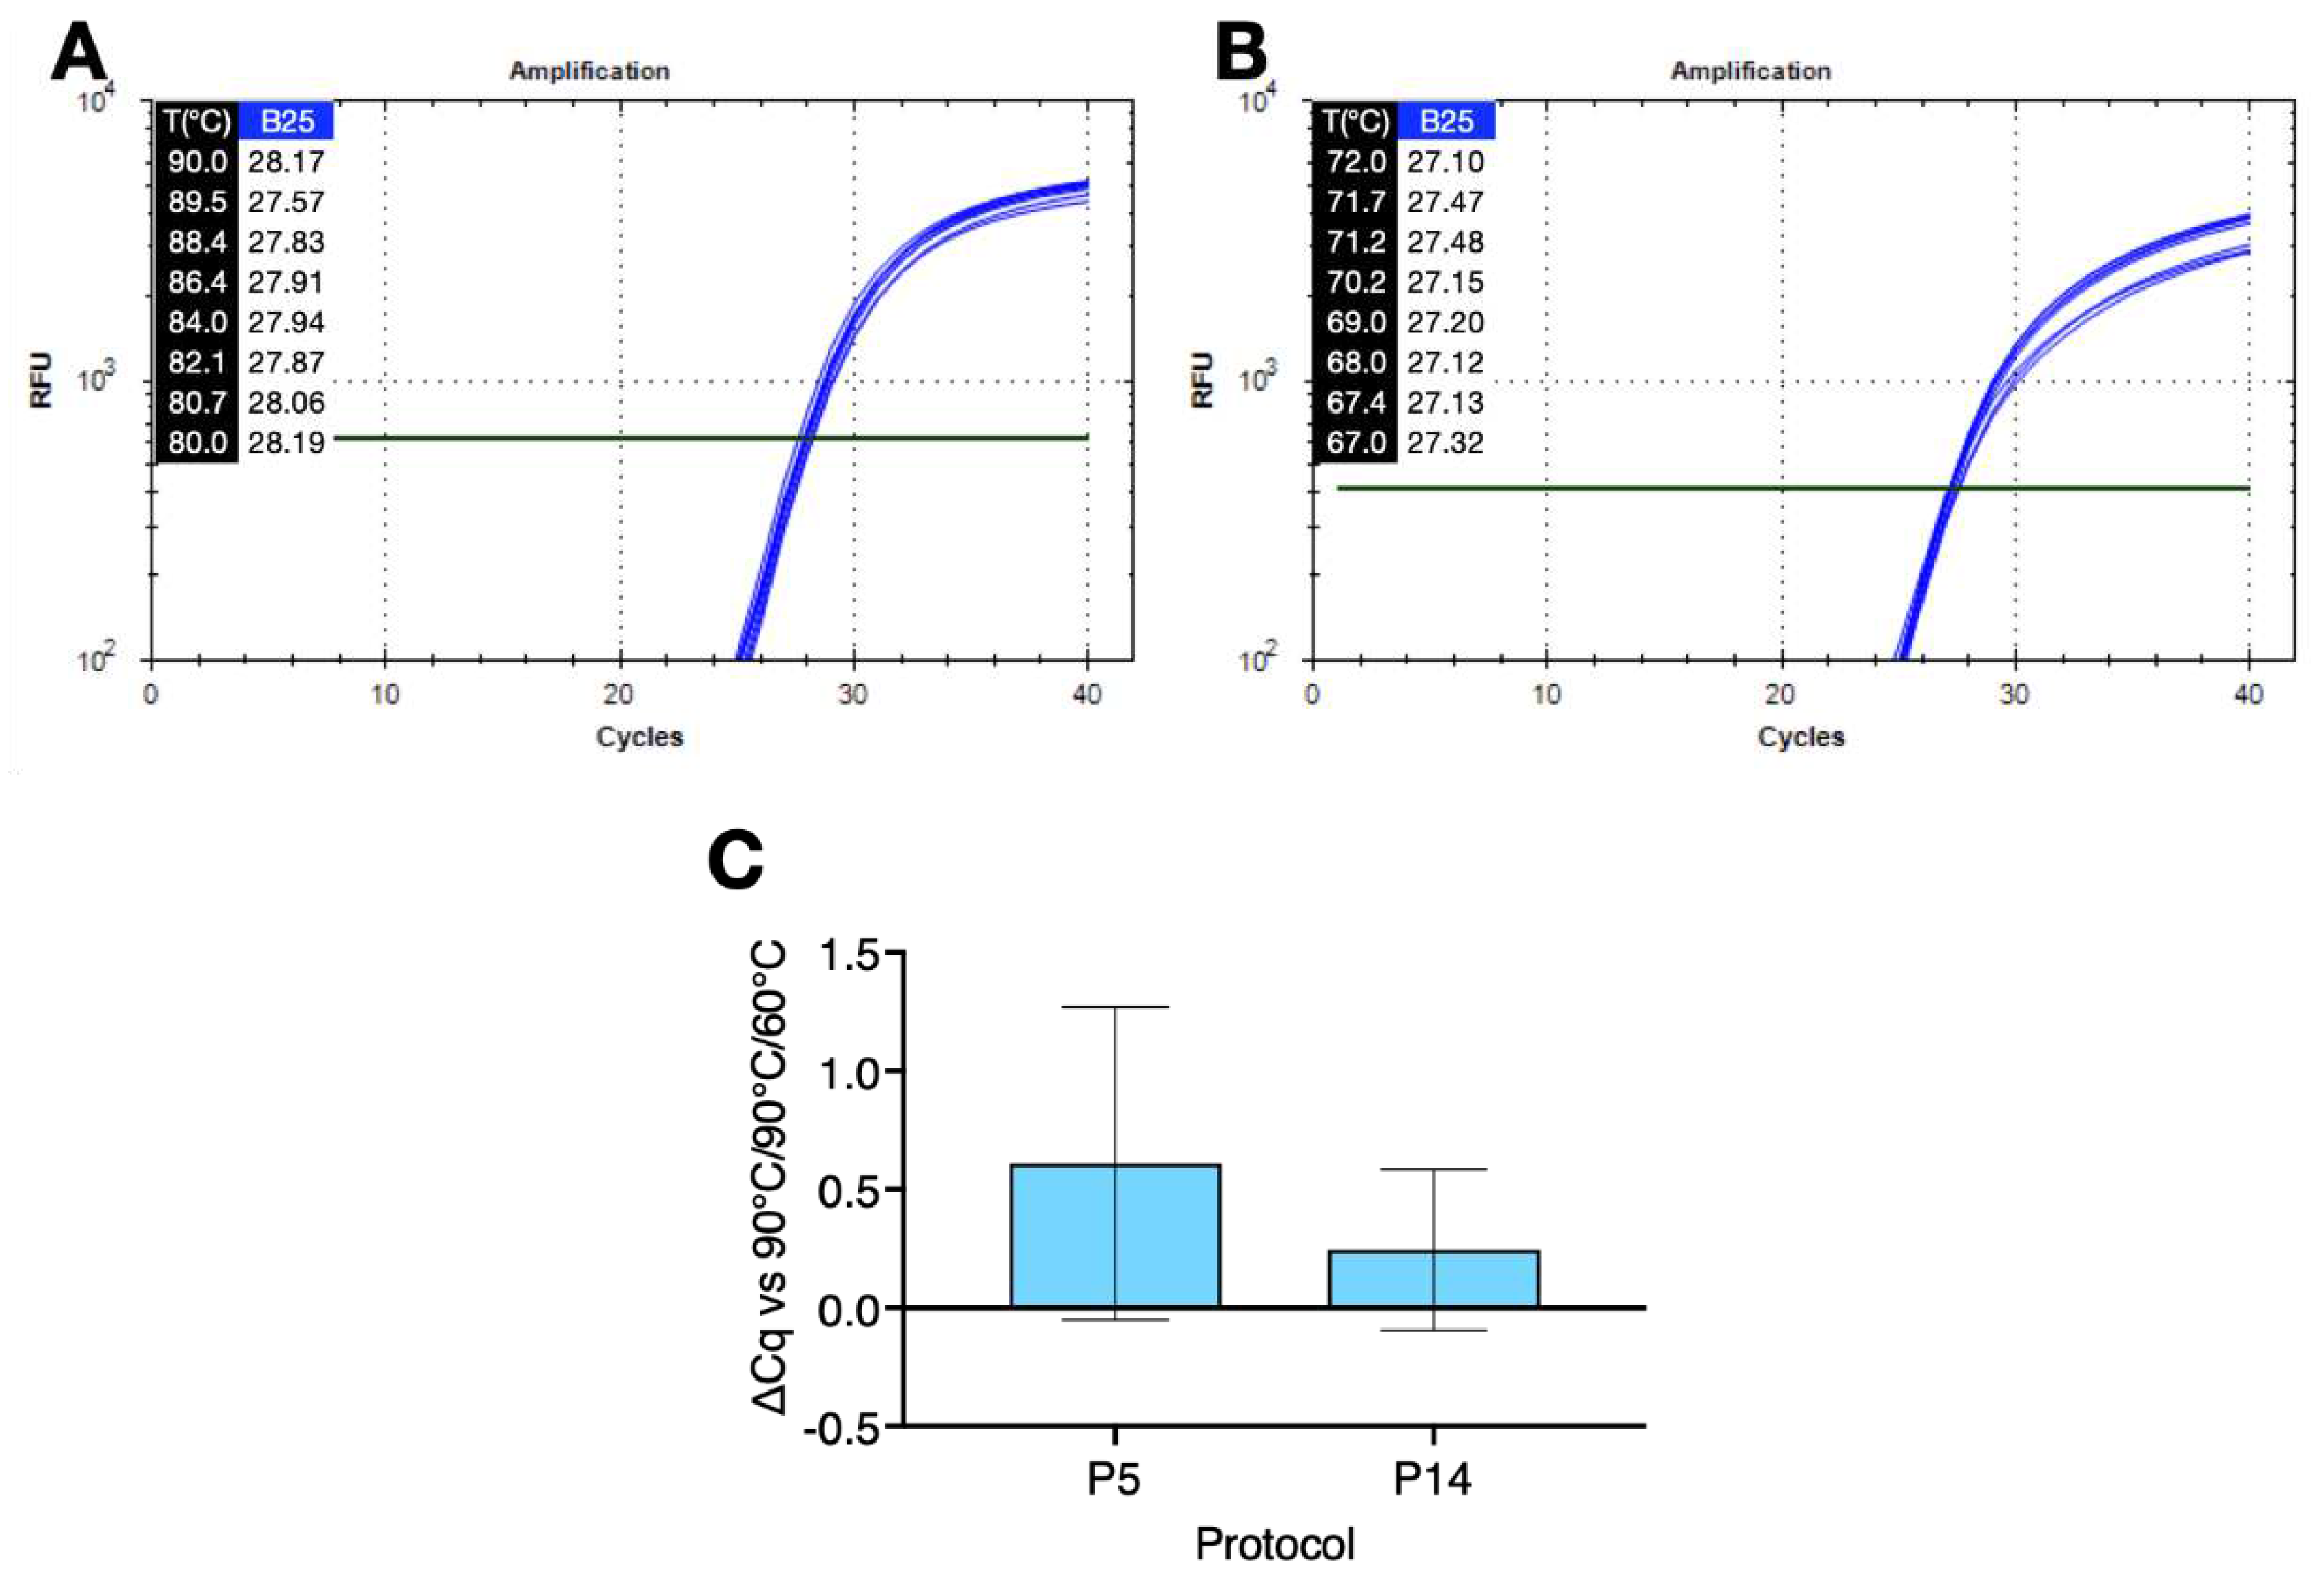
Figure 3 shows amplification plots recorded on denaturation (
Figure 3A) and polymerisation (
Figure 3B) gradients for the S. aureus assay amplified using protocols P12 and P13 and buffer 25 (B25). The ∆Cq between 90°C and the lowest denaturation temperature of 80°C was 0.02. The ∆Cq between 67°C and the highest polymerisation temperature of 72°C was -0.22.
A comparison of amplification results using two single temperature protocols P5 and P14 confirmed that amplification using a low denaturation, high polymerisation temperature and small ∆T protocol was comparable to a conventional qPCR run (
Figure 3C).
gDNA from three further pathogens,
Candida auris (49% G/C),
Aspergillus fumigatus (42% G/C) and
Acanthamoeba castellanii (50% G/C) was amplified with a slightly modified buffer, B27, on denaturation and polymerisation gradients using protocols P12 and P13, respectively. All three DNA samples amplified with approximately equal efficiency across both gradients (
Figure S5).
2.6. RT and PCR
The practicability of using our basic buffers in reverse transcription reactions was assessed by reverse transcribing human breast cancer mRNA with EpiScript (ES), SuperScript IV (SS) or UltraScript (US-2) using either their respective native buffers supplied by the manufacturers or B47. Aliquots of the resulting cDNAs were amplified using protocol R1 with PCRBio SyGreen master mix using primers targeting GAPDH (G/C content 57%). Melt curve analysis showed single, identical melt curves for each of the amplicons and similar Cq values (
Figure S6A). A comparison of the Cq values recorded by each of the RTases in the native buffers supplied by the manufacturers and B47 showed that the RTases performed equally well in B47, with ∆Cqs of -0.05 (-0.81, 0.71) (ES), 0.47 (-0.15, 1.1) (SSIV), and -0.67 (-1.63, 0.3) (US-2) (
Figure S6B).
The same cDNA samples were amplified in a dualplex reaction using assays targeting TSG-6 (49% G/C) and HGF-1 (46% G/C) assays with protocol R1 and NEB Luna probe master mix. Amplification products were detected using FAM and HEX hydrolysis probes, respectively. As with GAPDH, amplification plots and Cq values were similar, regardless of which buffer was used for the RT step (
Figure S6C). There was little buffer-dependent difference in ∆Cq values between samples for either TSG-6 at 0.82 (-0.44, 2.08) (ES), 0.48 (-0.50, 1.47) (SS) and 0.52 (-1.14, 0.11) (US-2) or HGF-1 (0.44 (0.12, 0.76) (ES), 0.49 (-0.31, 1.28) (SS) and 0.61 (-1.21, -0.01) (US-2) (
Figure S6D).
The repeatability of these results was assessed by using EpiScript or UltraScript-2 to reverse transcribe two different samples of SARS-CoV-2 gRNA targeting CoV-E in either native buffer or B47, followed by amplification with SensiFast master mix using protocol R1. The Cqs recorded using EpiScript and run on a Techne PrimePro 48 were the same regardless of whether native buffer (27.55±0.22) or B47 (27.56±0.20) was used for the RT step (
Figure S7A) resulting in a ∆Cq value of 0.015 (95% CI: -0.16, 0.19) (
Figure S7B). A repeat experiment using Ultrascript-2 in its own buffer (32.85±0.39) or B47 (33.24±0.8) and amplified with B47/MyTaq on the BioRad Opus using protocol R2 gave similar results (
Figure S7C) with the ∆C value being 0.4 (0.17, 0.62) (
Figure S7D).
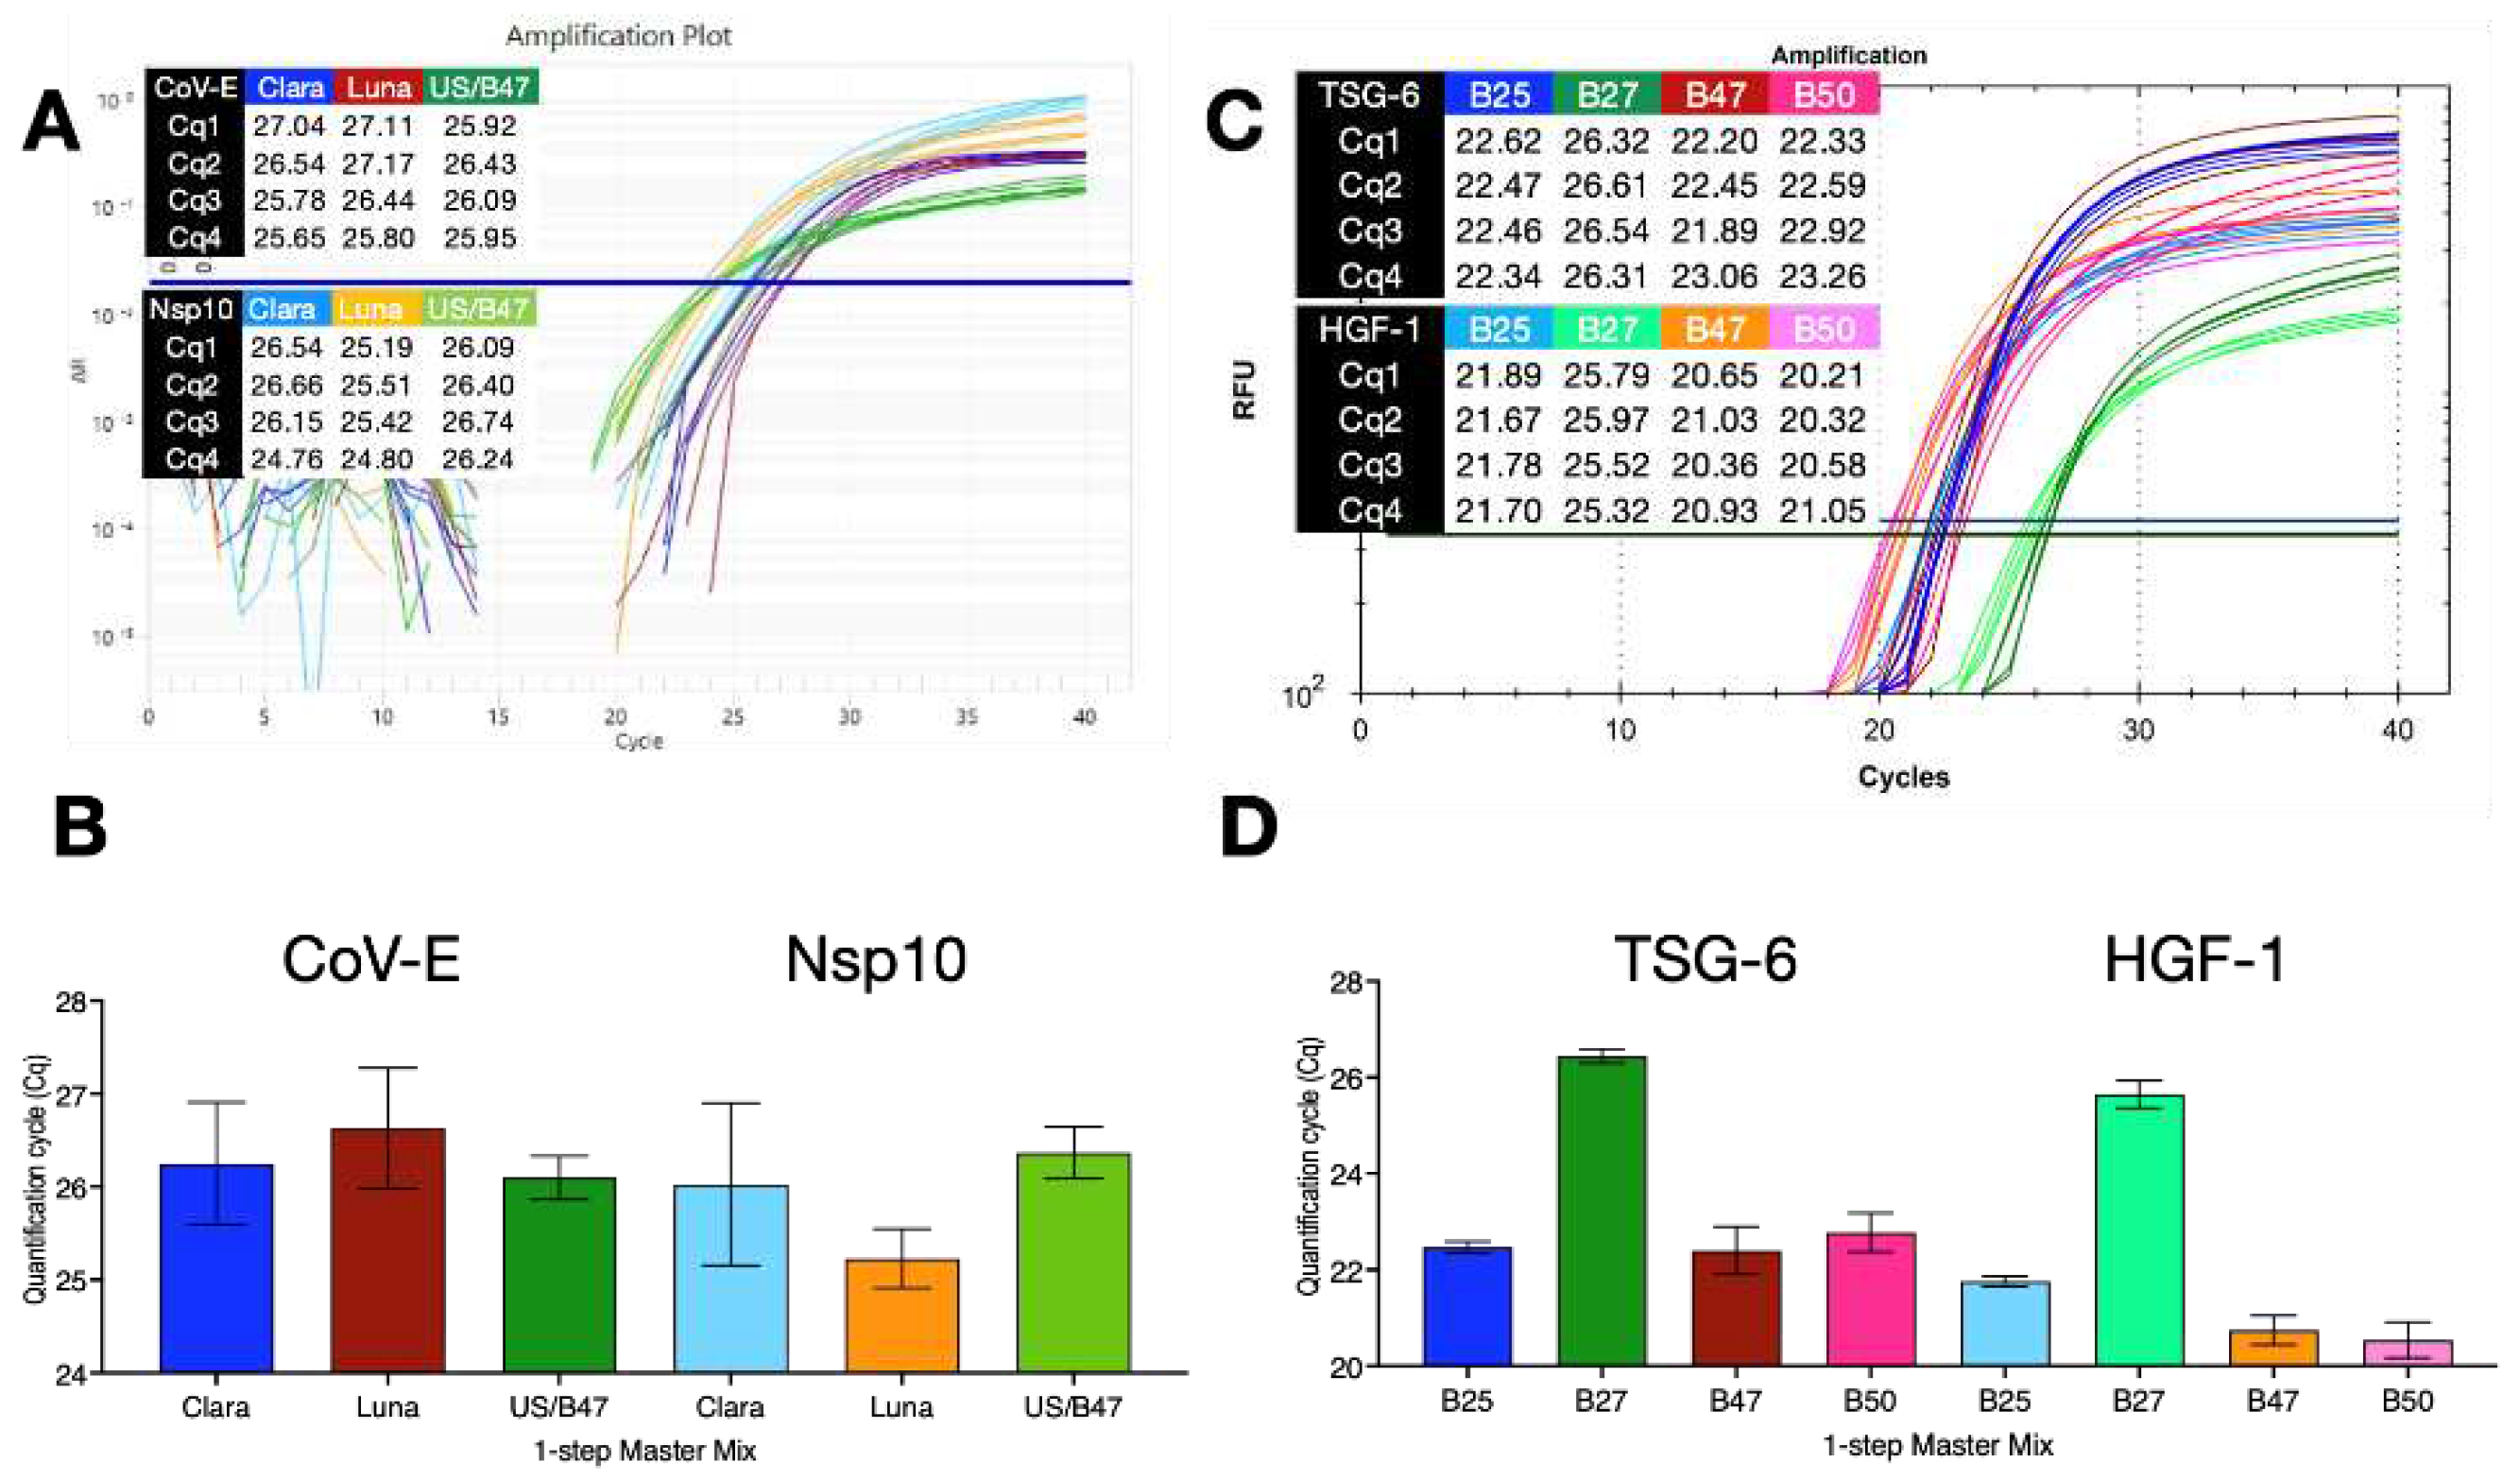
Many RT-qPCR reactions use a one-step format and since B47 was an efficient buffer for RTs, we assessed the ability of B47 to act as a combined RT and qPCR buffer. 1-step RT-qPCR reactions were set up with SARS-CoV-2 gRNA targeting either the CoV-E assay or a previously described assay targeting the Nsp10 gene (45% G/C) [
27]. The reactions were carried out with PCRBio’s Clara, NEB’s Luna or B47/UltraScript (US)/MyTaq master mixes using protocol R1 on the Techne Prime Pro 48 instrument. All 1-step RT-qPCR reactions worked equally well and recorded similar results for either target (
Figure 4A,B). To test the compatibility with other buffers and assays, human breast cancer mRNA samples were reverse transcribed with ES in four buffers, B25, B27, B47 or B50, targeting TSG-6 and HGF-1 in a 1-step RT-qPCR dualplex assay on a BioRad CFX. B47 and B50 recorded the lowest Cq values, with B25 close behind and B27 working less well (
Figure 4C,D).
The experiment was repeated, except that this time ES was also combined with two alternative Taq polymerases, GoTaq (Promega) and ExTaq (Takara). 1-step RT-qPCR assays were carried out on both the PrimePro 48 (
Figure S8A) and the BioRad CFX thermal cyclers (
Figure S8B) using protocol R2. The B47-based master mixes gave broadly similar results for TSG-6 (
Figure S8C,D) and HGF-1 (
Figure S8E,F), regardless of which polymerase or instrument was used. Interestingly, the B47 1-step reagent recorded, if anything, slightly lower Cqs than the two commercial master mixes used for comparison.
We have previously reported that a 1-step RT-qPCR reaction can be carried out without a dedicated RT-step [
28]. This involves setting up the reactions, pipetting the samples into microtitre plates and spinning them at room temperature. The five minutes or so it takes to complete these steps was sufficient to complete the RT reactions. To see whether this approach worked with our B47 1-step reagent, breast cancer-derived mRNA samples were subjected to 1-step RT-qPCR reaction using conventional protocol R2 (
Figure S9A), PCRBio’s Clara, NEB’s Luna or B47 1-step RT-qPCR master mixes and the duplex TSG-6/HGF-1 assay. Reactions were carried out on the BioRad CFX Connect. The B47 master mix recorded lower Cq values than Clara (p<0.002) and Luna (p<0.02) for TSG-6, whereas Cq values were similar for HGF-1 (
Figure S9B). When the experiment was repeated using protocol R3 (
Figure S9), the B47/ES/MyTaq buffer recorded significantly lower Cqs for both TSG-6 and HGF-1 (
Figure S9). A comparison of Cq values between assays carried out without and with a dedicated RT step revealed ∆Cq for TSG-6 and HGF-1 of 1.6 (1.45,1.75) and 3.1 (2.83, 3.41) for PCRBio’s Clara, 1.9 (1.41, 2.36) and 4.2 (3.96,4.33) for NERB’s Luna and 0.3 (0.23, 0.35) and 1.3 (1.13, 1.52) for B47/ES/MyTaq, respectively (
Figure S9E).
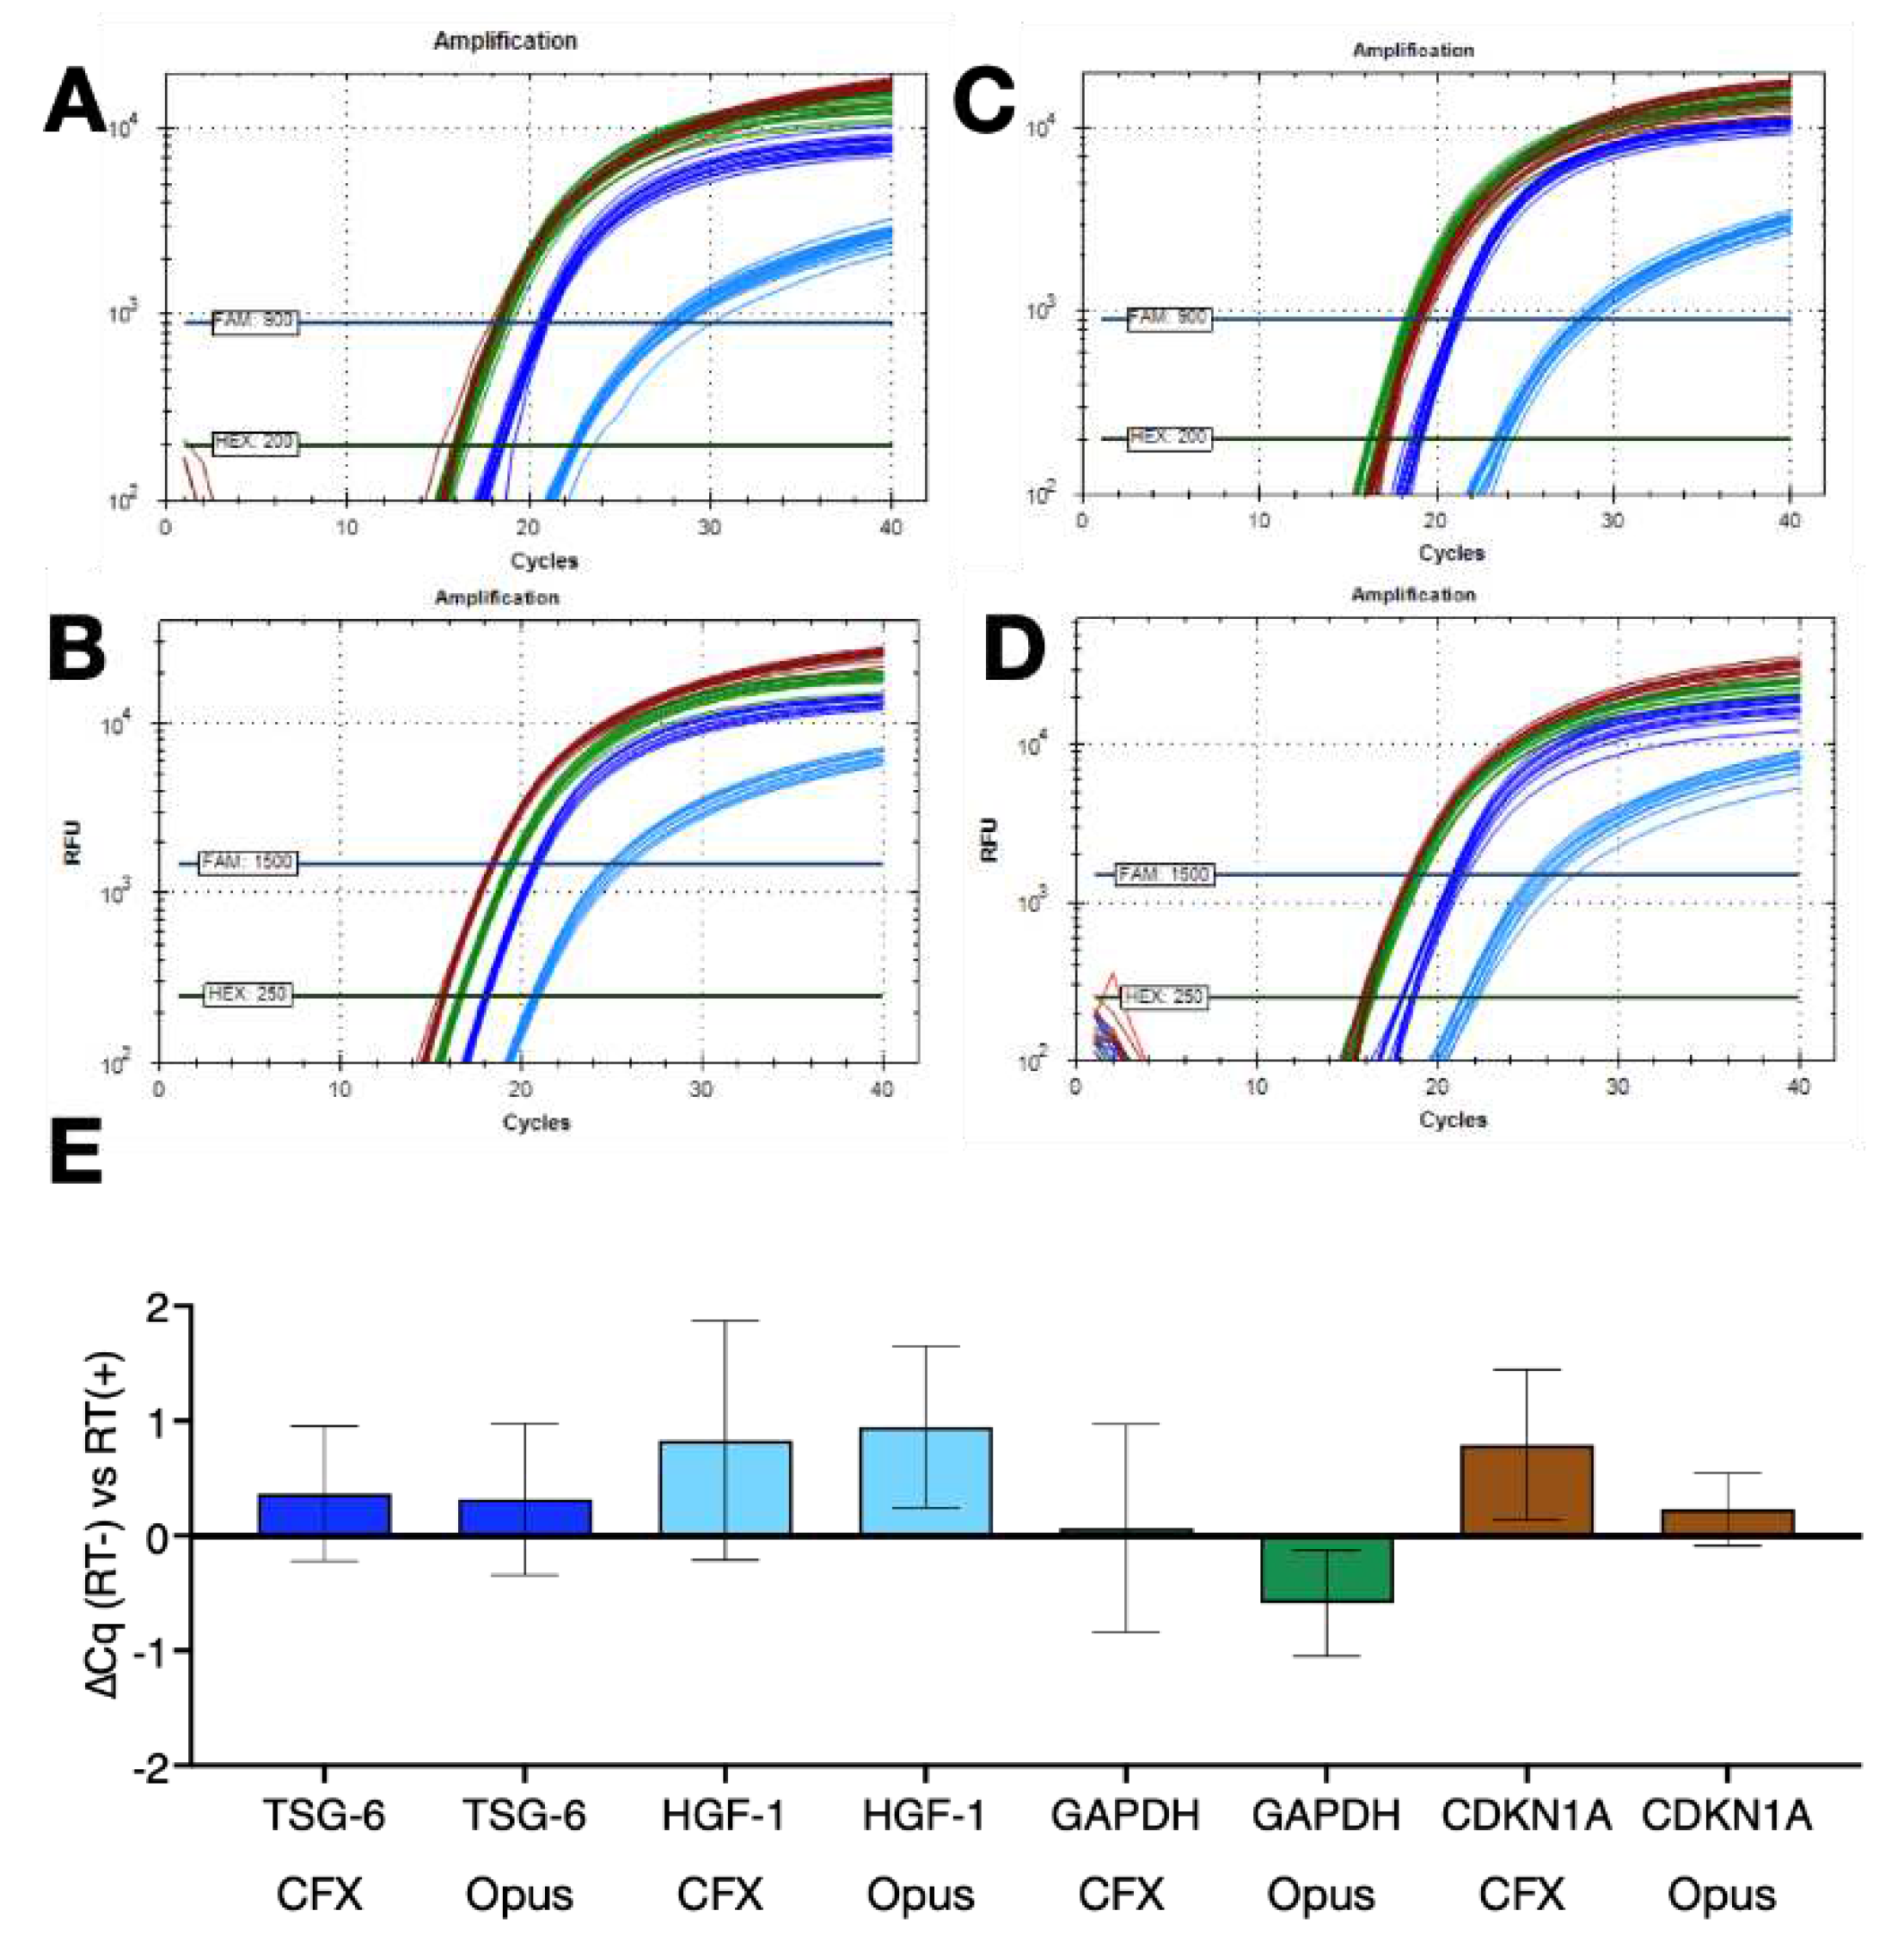
The repeatability of these results was assessed using assays targeting TSG-6, HGF-1, GAPDH or CDKN1A (55% G/C) with human fibroblast mRNA and the B47/ES/MyTaq 1-step master mix. Runs were carried out in parallel using protocols R2 or R3, with 16 replicates on the BioRad CFX and 9 replicates on the Opus instruments. Amplification plots recorded using protocol R2 on the CFX (
Figure 5A) and Opus (
Figure 5B) or protocol R3 on the CFX (
Figure 5C) and Opus (
Figure 5D). The ∆Cq values confirmed that the lack of a dedicated RT step did not affect the performance of the assays (Figure 7E).
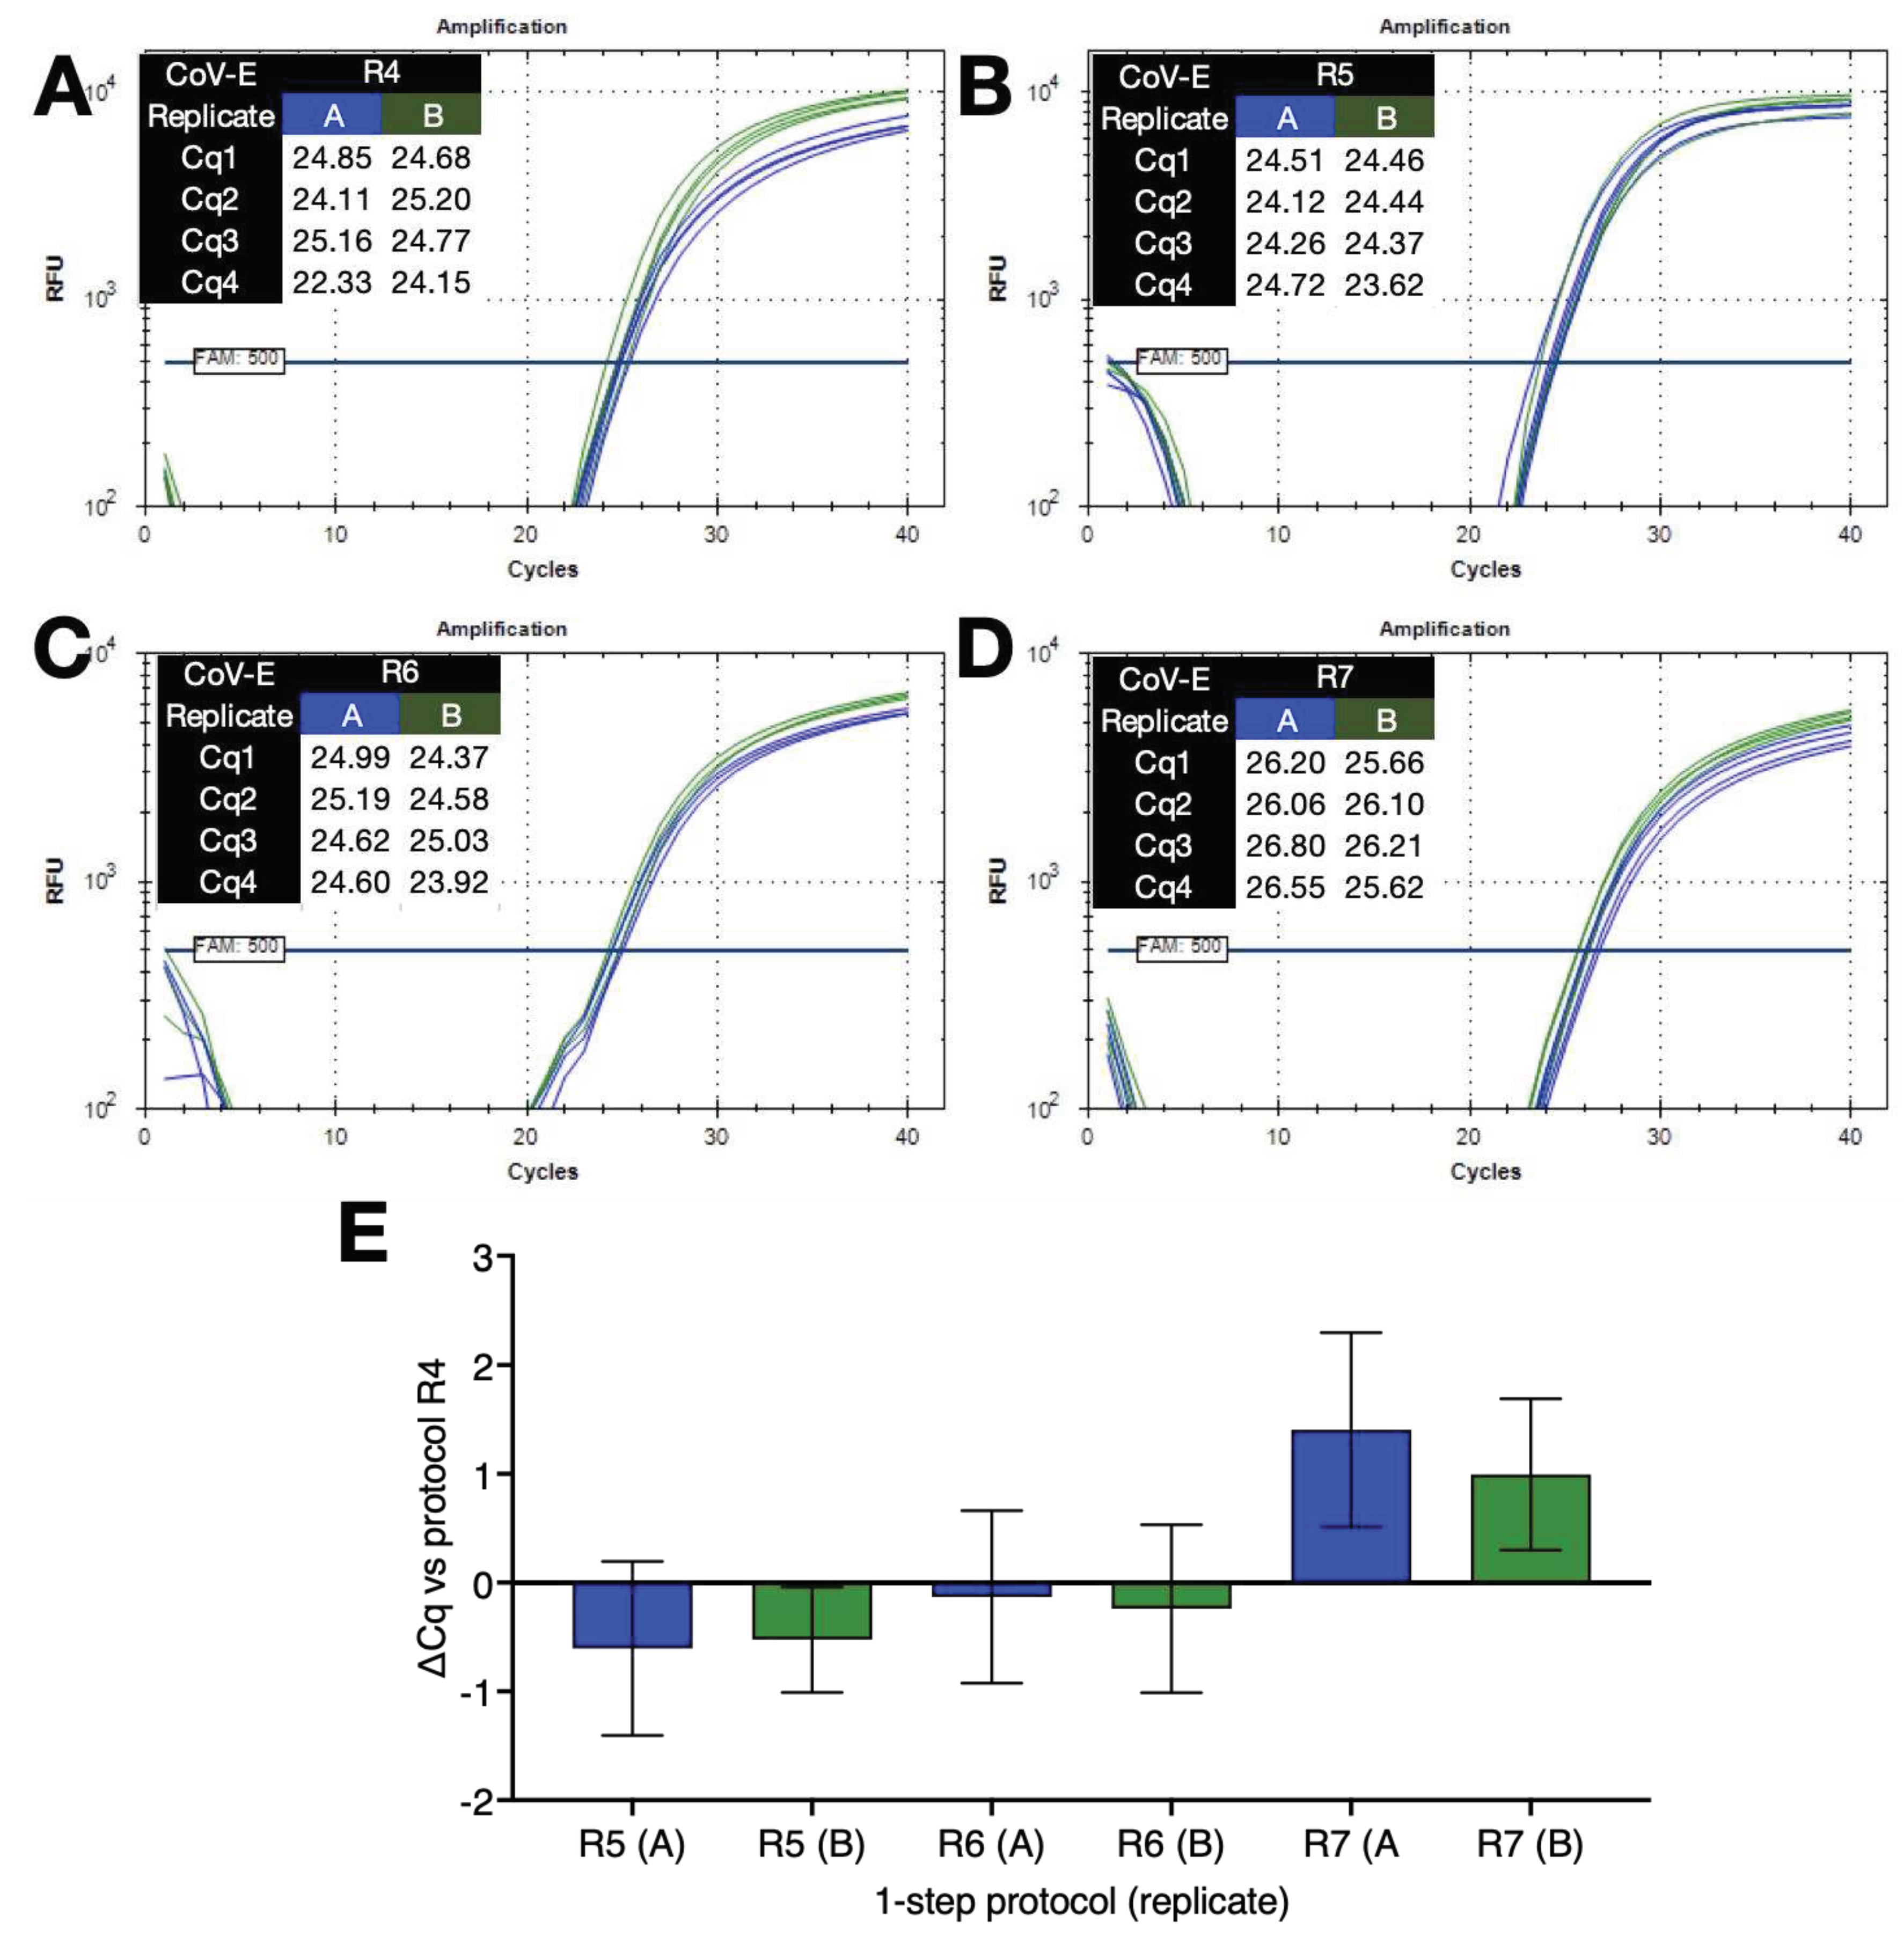
Finally, 1-step RT(-) reactions were set up in duplicate without dedicated RT steps with four replicates run using four different cycling conditions (R4 to R7) on the BioRad CFX Connect. The results shown in
Figure 6 demonstrate that the combination of no dedicated RT step and low ∆T qPCR is a feasible alternative to conventional 1-step RT-qPCR protocols.
3. Discussion
This study streamlines and accelerates qPCR applications by introducing several key changes that extend the potential applications of qPCR-based technologies in molecular diagnostic settings:
Primer designs that incorporate Tms higher than conventionally recommended,
Modifications such as Pentabases that allow the use of short primers whilst maintaining a high Tm,
Flexible probe designs that tolerate overlap of the 3’-ends of probes with 3’-ends of primers binding to opposite strands,
Simple buffers that balance the requirement to denature PCR amplicons with the ability of primers to hybridise and prime polymerisation,
Low ∆T protocols that involve running qPCR reactions at denaturation temperatures of approximately 80°C and polymerization temperatures around 70°C,
Short cycling times that minimise qPCR run times,
Wide applicability demonstrated through the targeting of genomic DNA from various common pathogens,
Efficient one- and two-step RT-qPCR amplification of viral gRNA and cellular mRNA, even in the absence of a dedicated RT step.
These modifications, resulting in a protocol we have called “FlashPCR” are easy to implement, and it is likely that they can be refined even further. One of the assessments that define an assay’s “analytical sensitivity” is the LoD [
29]. It is an important metric that delineates the smallest quantity or concentration of a target that can be detected consistently by a qPCR assay [
30]. The LoD achieved in this study, approximately 10 copies per reaction, positions the technique among the most sensitive detection methods available. This level of sensitivity is important, particularly for early disease detection and for monitoring low-level pathogen presence.
The study's emphasis on maintaining PCR efficiency under the established low ∆T protocol, as compared to standard conditions, underscores the reliability and accuracy of the newly developed approach. The modified protocol provides reassurance that the gains achieved in terms of time and energy efficiency are not attained at the expense of the fundamental performance metrics of the qPCR reaction. A critical aspect of this innovation lies in its compatibility with a diverse array of Taq polymerases. This means that there will be no dearth of reagent companies able to provide modified master mixes, thus helping to keep costs down. The ability to detect a wide spectrum of pathogens, ranging from viruses to protozoa, is imperative in diagnostics, where pathogen diversity demands versatile detection techniques. The demonstrated versatility of the approach lends itself to a broad range of clinical applications, allowing for a unified methodology to detect various diseases. Comparable benefits extend to food safety, veterinary and agricultural diagnostics.
Additionally, this study addresses the reverse transcription (RT) step, widely used to analyse gene expression pattern, screen for RMA biomarkers and pivotal in the detection of RNA-based pathogens [
31]. The compatibility of the optimised buffers with the RT step, facilitating a one-step reaction, streamlines the diagnostic process. This flexibility not only simplifies the workflow but also minimises the chances of contamination and reduces the potential for errors, making the method even more robust and suitable for routine diagnostics.
Tailoring primers and probes to accommodate FlashPCR's more stringent conditions requires deviations from established design conventions. Nevertheless, integrating these modifications into primer and probe design does not present significant challenges and does not demand a more exhaustive assessment of primer-probe combinations than typically undertaken. Consequently, the adaptation of existing assays and the creation of novel ones need not pose substantial hurdles. Notably, despite the higher Tm, crucial for our enhanced PCR conditions, these adjustments haven't hampered the priming process during reverse transcription for cDNA synthesis. This underscores the feasibility of implementing altered design guidelines without compromising primer-probe functionality, facilitating a smooth transition to assays compatible with our optimised PCR parameters.
Our results also indicate that the use of Pentabase primers, which are characterised by their unique five-membered heterocyclic structure, offers distinct advantages. Their enhanced binding affinity to target sequences reduces nonspecific amplification and helps with accurate quantification. It also allows the use of shorter primers, which increases the flexibility of assay location and permits the design of shorter PCR amplicons. This facilitates faster amplification cycles and can also reduce the probability of secondary structures that might hinder primer binding and subsequent amplification.
Whilst our modifications significantly reduce the duration of qPCR runs on standard instruments, an important future advantage will be increased speed coupled with lower specification instrument design requirements will facilitate the implementation of PoC procedures [
32]. This has enormous implications, as it is obvious that there is an increased need for early, quick and decentralised diagnostic testing [
33], especially in resource-limited settings [
34]. The ability to expedite the qPCR process without compromising sensitivity or accuracy makes this approach a prime candidate for integration with emerging rapid diagnostics solutions. The substantial reduction of processing time, whilst maintain the performance characteristics of conventional protocols, will enable timely decision-making by healthcare professionals, facilitate prompt treatment initiation and help implement efficient infection control measures. Moreover, incorporation into PoC procedures will enhance the responsiveness of public health agencies in managing outbreaks and instituting preventive measures, potentially limiting disease transmission.
Our results were achieved using standard qPCR plates running notably smaller volumes than conventionally employed. This deviation from standard volume usage shows that these current tools might be suboptimal for maximizing the potential of these modifications reported here. It stands to reason that employing dedicated thin materials with enhanced thermal properties, precisely tailored to optimal volume sizes for the wells, could generate even more better results. Such modifications would also enhance uniformity across wells, ensuring more consistent temperature profiles during the PCR process. This optimisation in vessel design, coupled with precise volume considerations, holds promise for further improving the performance of the buffers in amplifying PCR amplicons, warranting exploration in future investigations to refine experimental conditions for enhanced assay robustness and reproducibility.
Finally, we evaluated numerous buffers, incorporating various combinations and concentrations of 1,2 propanediol, 1,3 propanediol, ethylene glycol, DTT, trehalose, betaine, DMSO, Triton-X-100, Tween 20, Nonidet P40 and formamide, alongside different concentrations of other components such as (NH4)2SO4, MgCl2 and KCl. This resulted in the selection of five buffers with only slight compositional variations that enabled successful amplification of a range of PCR amplicons characterised by varying G+C content. We observed no discernible pattern dictating the superior performance of one buffer over another. Our findings indicate whilst the efficacy of buffers in supporting PCR amplification is correlated with the G+C content of the amplicons, that may not be the most important determinant. It prompts speculation regarding additional factors influencing the compatibility of individual assays with specific buffer compositions. Among these potential considerations is the variability inherent to different PCR instruments, which might necessitate subtle adjustments in buffer composition for optimal performance. Such instrument-specific variability, including variations in thermal cycling mechanisms or temperature uniformity, could feasibly influence the compatibility of individual assays with specific buffer formulations. Other variables such as secondary structure complexities, primer-template interactions, or even the unique sequence context within the target region likely contribute to a buffer's impact on amplification efficiency. It is clear that our experiments serve as preliminary investigations, laying the groundwork for reagent companies to use their expertise toward refining a universal buffer formulation.
4. Materials and Methods
4.1. Reagents and qPCR instruments
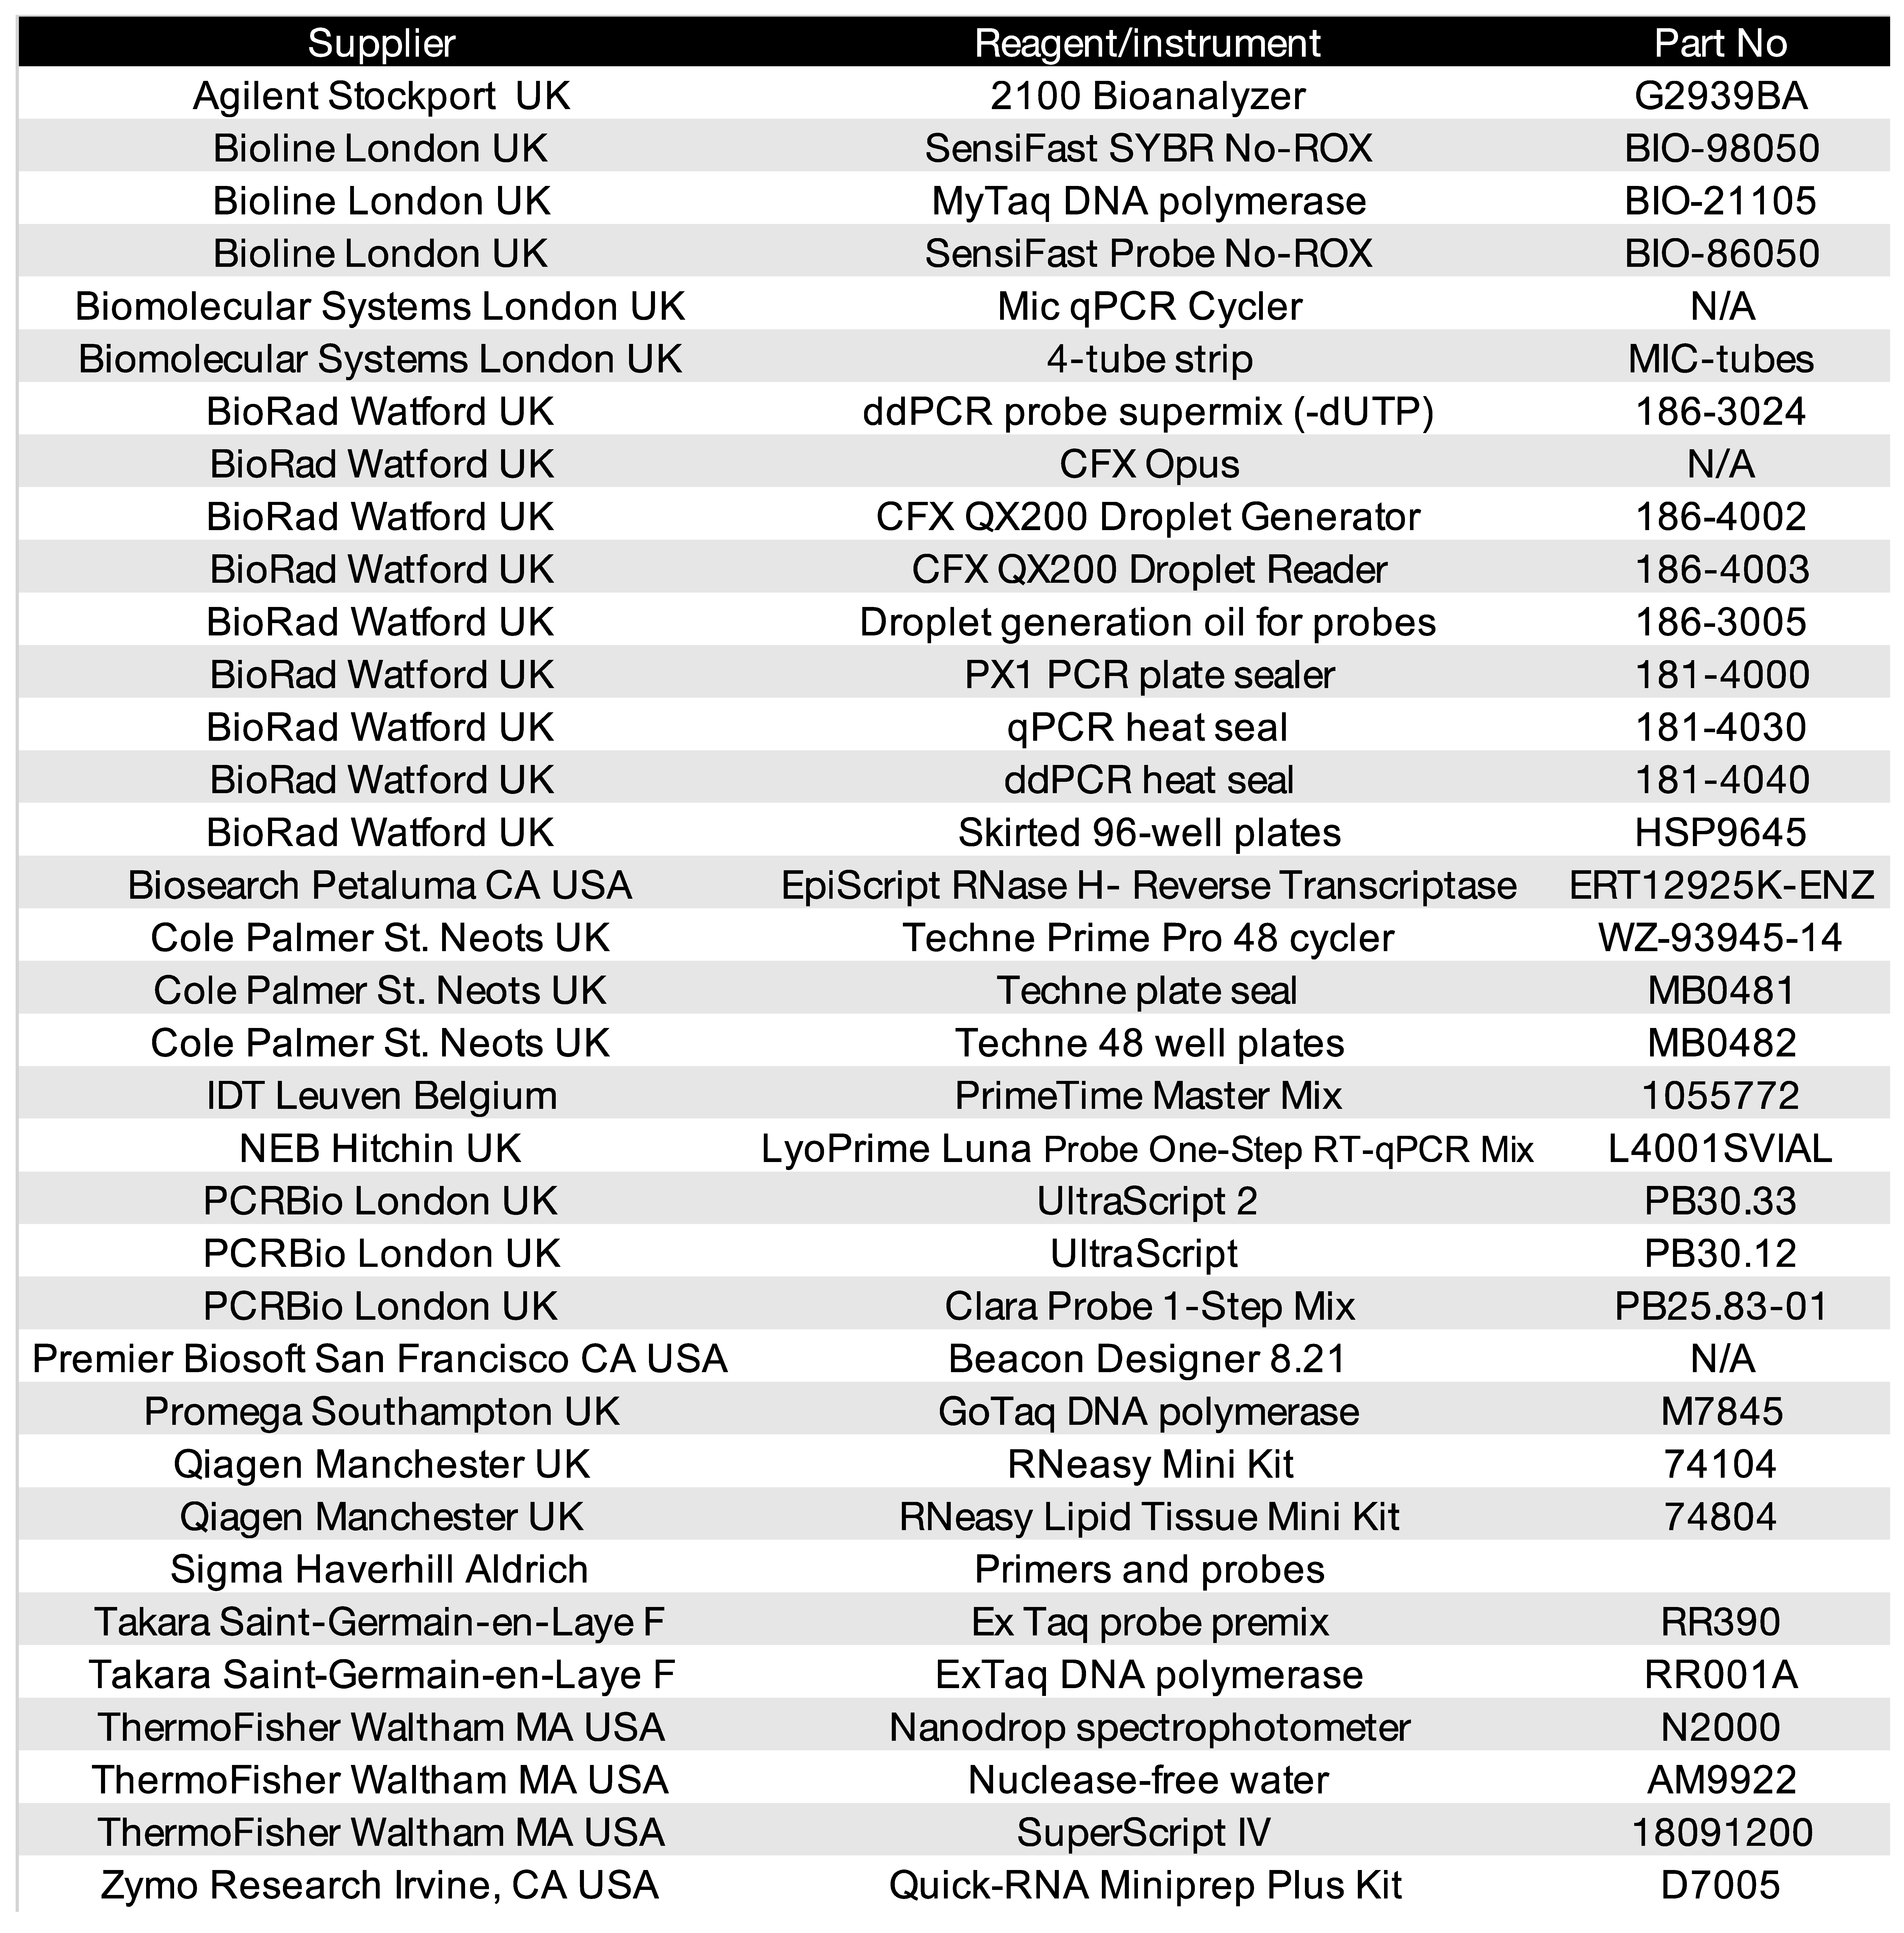
The details of all commercial reagents, plastic ware and instruments are listed in
Table 1.
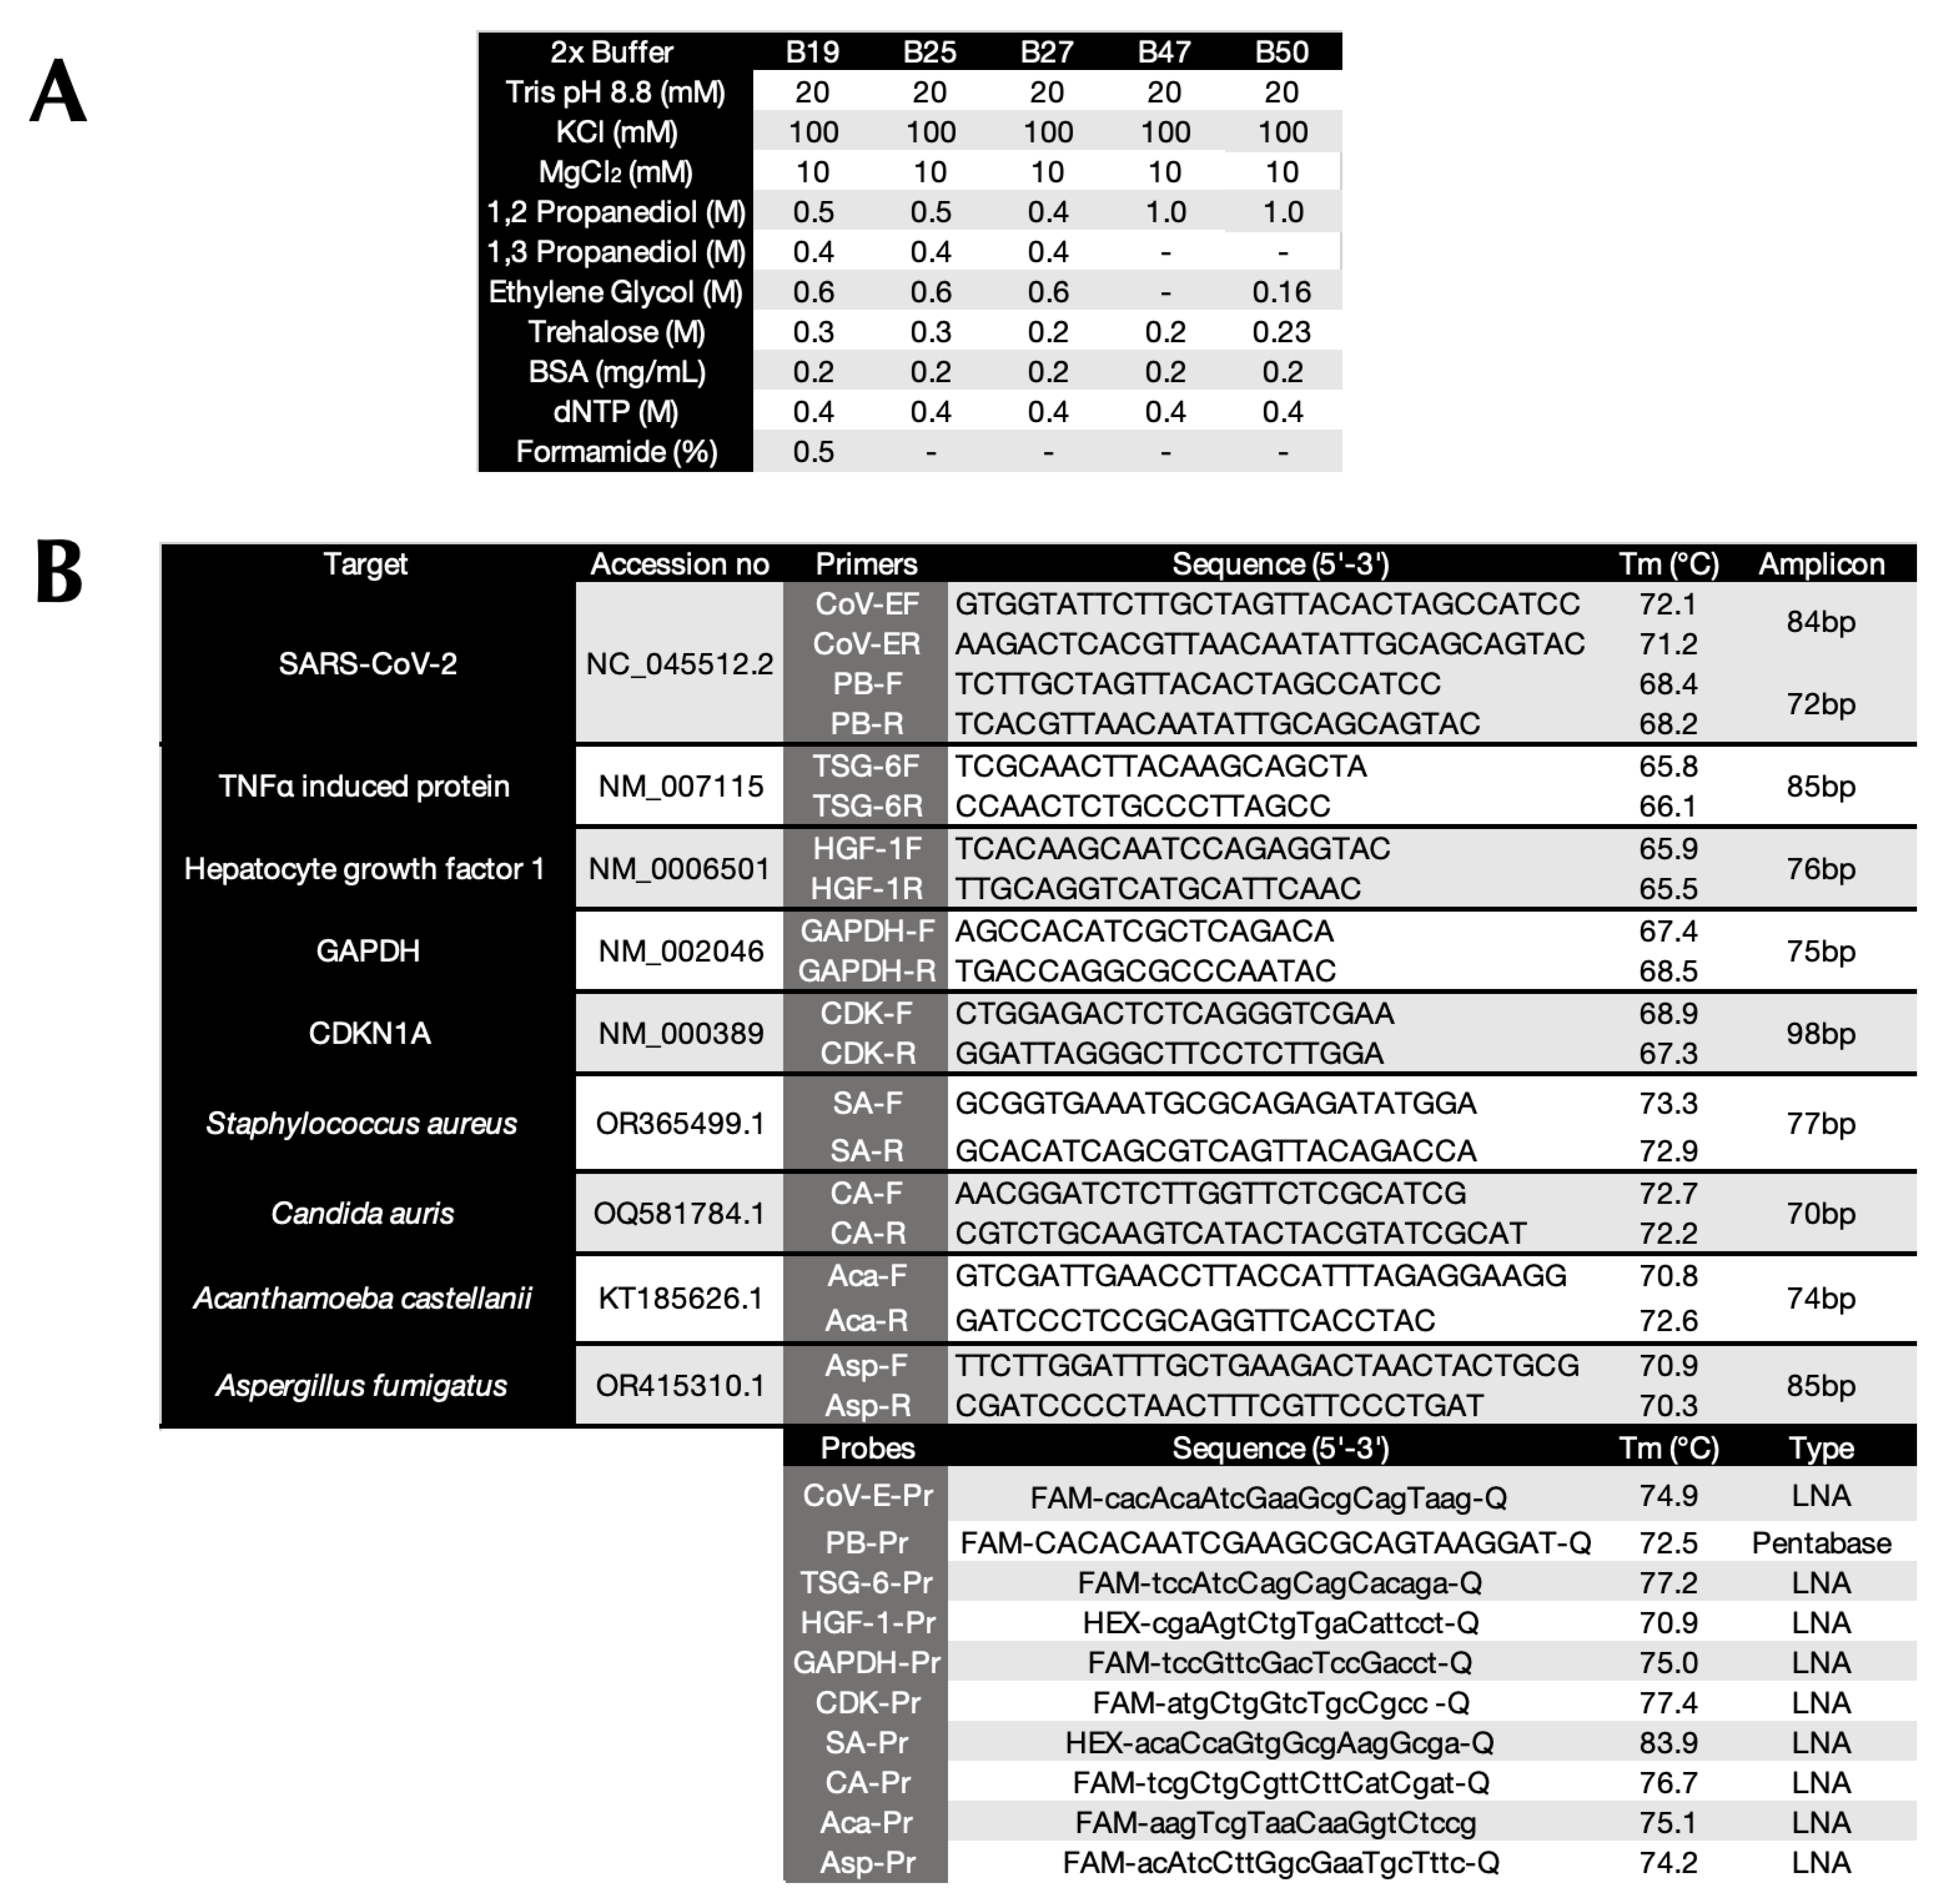
The recipes for buffers 19 (B19), 25 (B25), 27 (B27), 47 (B47) and 50 (B50) are shown in
Table 2A. qPCR reactions were carried out using four different qPCR instruments: 96-well cyclers CFX Connect and a CFX Opus (BioRad), a 48-sample Mic magnetic induction instrument (Bio Molecular Systems) or a 48-well Techne PrimePro 48 cycler (Cole Palmer). The ddPCR runs were carried out on a Biorad QX200 instrument.
4.2. Primers and probes
All assays were designed using the Beacon Designer 8.21 qPCR assay design software package (Premier Biosoft). Sequences specifying the E-gene from SARS-CoV-2, human TNFα induced protein (TSG-6), hepatocyte growth factor 1 (HGF-1), glyceraldehyde 3-phosphate dehydrogenase (GAPDH) and cyclin-dependent kinase inhibitor 1 (CDKN1) as well as rRNA sequences from
Candida auris, Aspergillus fumigatus, Acanthamoeba castellanii and Staphylococcus aureus were downloaded from the NIH National Centre for Biotechnology Information webs site. Primers and probes were designed with manual adjustments aimed at obtaining short amplicons amplified by primers with high melting temperatures (Tm). Overlap of the 3’-end of probes and the 3’-end of primers hybridising to the reverse strand was permitted. The specificity of primers, probes and amplicons was analysed in silico using Primer-BLAST (
https://www.ncbi.nlm.nih.gov/tools/primer-blast/) and BLAST (
https://blast.ncbi.nlm.nih.gov/Blast.cgi). All oligonucleotides were synthesised and lyophilised by Sigma Aldrich and upon receipt resuspended in sterile RNase-free water at 100µM and stored in aliquots at -20°C.
Table 2B lists the details of the primers and probes together with their melting temperatures (Tms) and lengths of the resulting PCR amplicons.
Table 2.
A. Components for buffers 19, 25, 27, 47 and 50. B. Details of targets, primers, probes and amplicons. PB-F and PB-R are Pentabase primers. Capital letters indicate base substitution by an LNA.
Table 2.
A. Components for buffers 19, 25, 27, 47 and 50. B. Details of targets, primers, probes and amplicons. PB-F and PB-R are Pentabase primers. Capital letters indicate base substitution by an LNA.
4.3. RNA extractions
SARS-CoV-2 BA 5.1 genomic RNA (gRNA) was extracted from saliva samples using the Quick-RNA MiniPrep Plus Kit (Zymo Research) using the method described for saliva and buccal cells, except that the RNA was eluted in 50µL of RNase-free water. This RNA was assessed for inhibitors by using a 1-step RT-qPCR assay to compare the quantification cycles (Cqs) recorded by the amplification of neat RNA and a 1:10 dilution, but not for integrity and stored at -80°C.
Total human RNA was prepared from breast cancer biopsies using the RNeasy lipid tissue mini kit (Qiagen) or from primary fibroblast tissue culture cells using the RNeasy tissue mini kit (Qiagen) without any modifications. RNA samples were quantified and quality assessed according to the MIQE guidelines [
29] using a Nanodrop 2000 (Thermo Scientific) and their integrity was assessed using an Agilent Bioanalyser 2100 (Agilent). All RNAs recorded RIN values of above 9 and were stored at -80°C. Whilst it is acknowledged that RIN valuesmay not accurately reflect the integrity of mRNA, it does provide some measure of confidence with regards to RNA quality remains a useful indicator until a better standard is developed
4.4. cDNA synthesis
4.4.1. SARS-CoV-2
cDNA was synthesised from SARS-CoV-2 gRNA using SuperScript IV reverse transcriptase (SSIV, ThermoFisher) and buffer. All reagents were kept on ice prior to carrying out the RT step in 40µL using 100U RT, 100ng random primers and 0.2 mM of each dNTP. Reaction conditions were 5 minutes at 25°C, 5 minutes at 55°C and 5 minutes at 85°C. cDNA samples were diluted with 40µL of RNase-free water and stored at -20°C.
4.4.2. Human RNA
Human breast cancer- or fibroblast-derived total RNA samples were reverse transcribed with UltraScript (US, PCRBio), UltraScript 2 (US2, PCRBio), SuperScript (SS4, ThermoFisher) or EpiScript (ES, Biosearch) either in the RT buffers supplied with the kits or one of the buffers listed in
Table 1A. All reagents were kept on ice prior to carrying out the RT step in 20µL using 100U RT, 100ng random primers and 0.2 mM of each dNTP. Reaction conditions were 25°C for 5 minutes, 50°C (55°C for SSIV) for 5 minutes and 85°C for 5 minutes. cDNA samples were diluted with equal volumes (20µL) of nuclease-free water (ThermoFisher) and stored at -20°C.
4.5. qPCR reactions
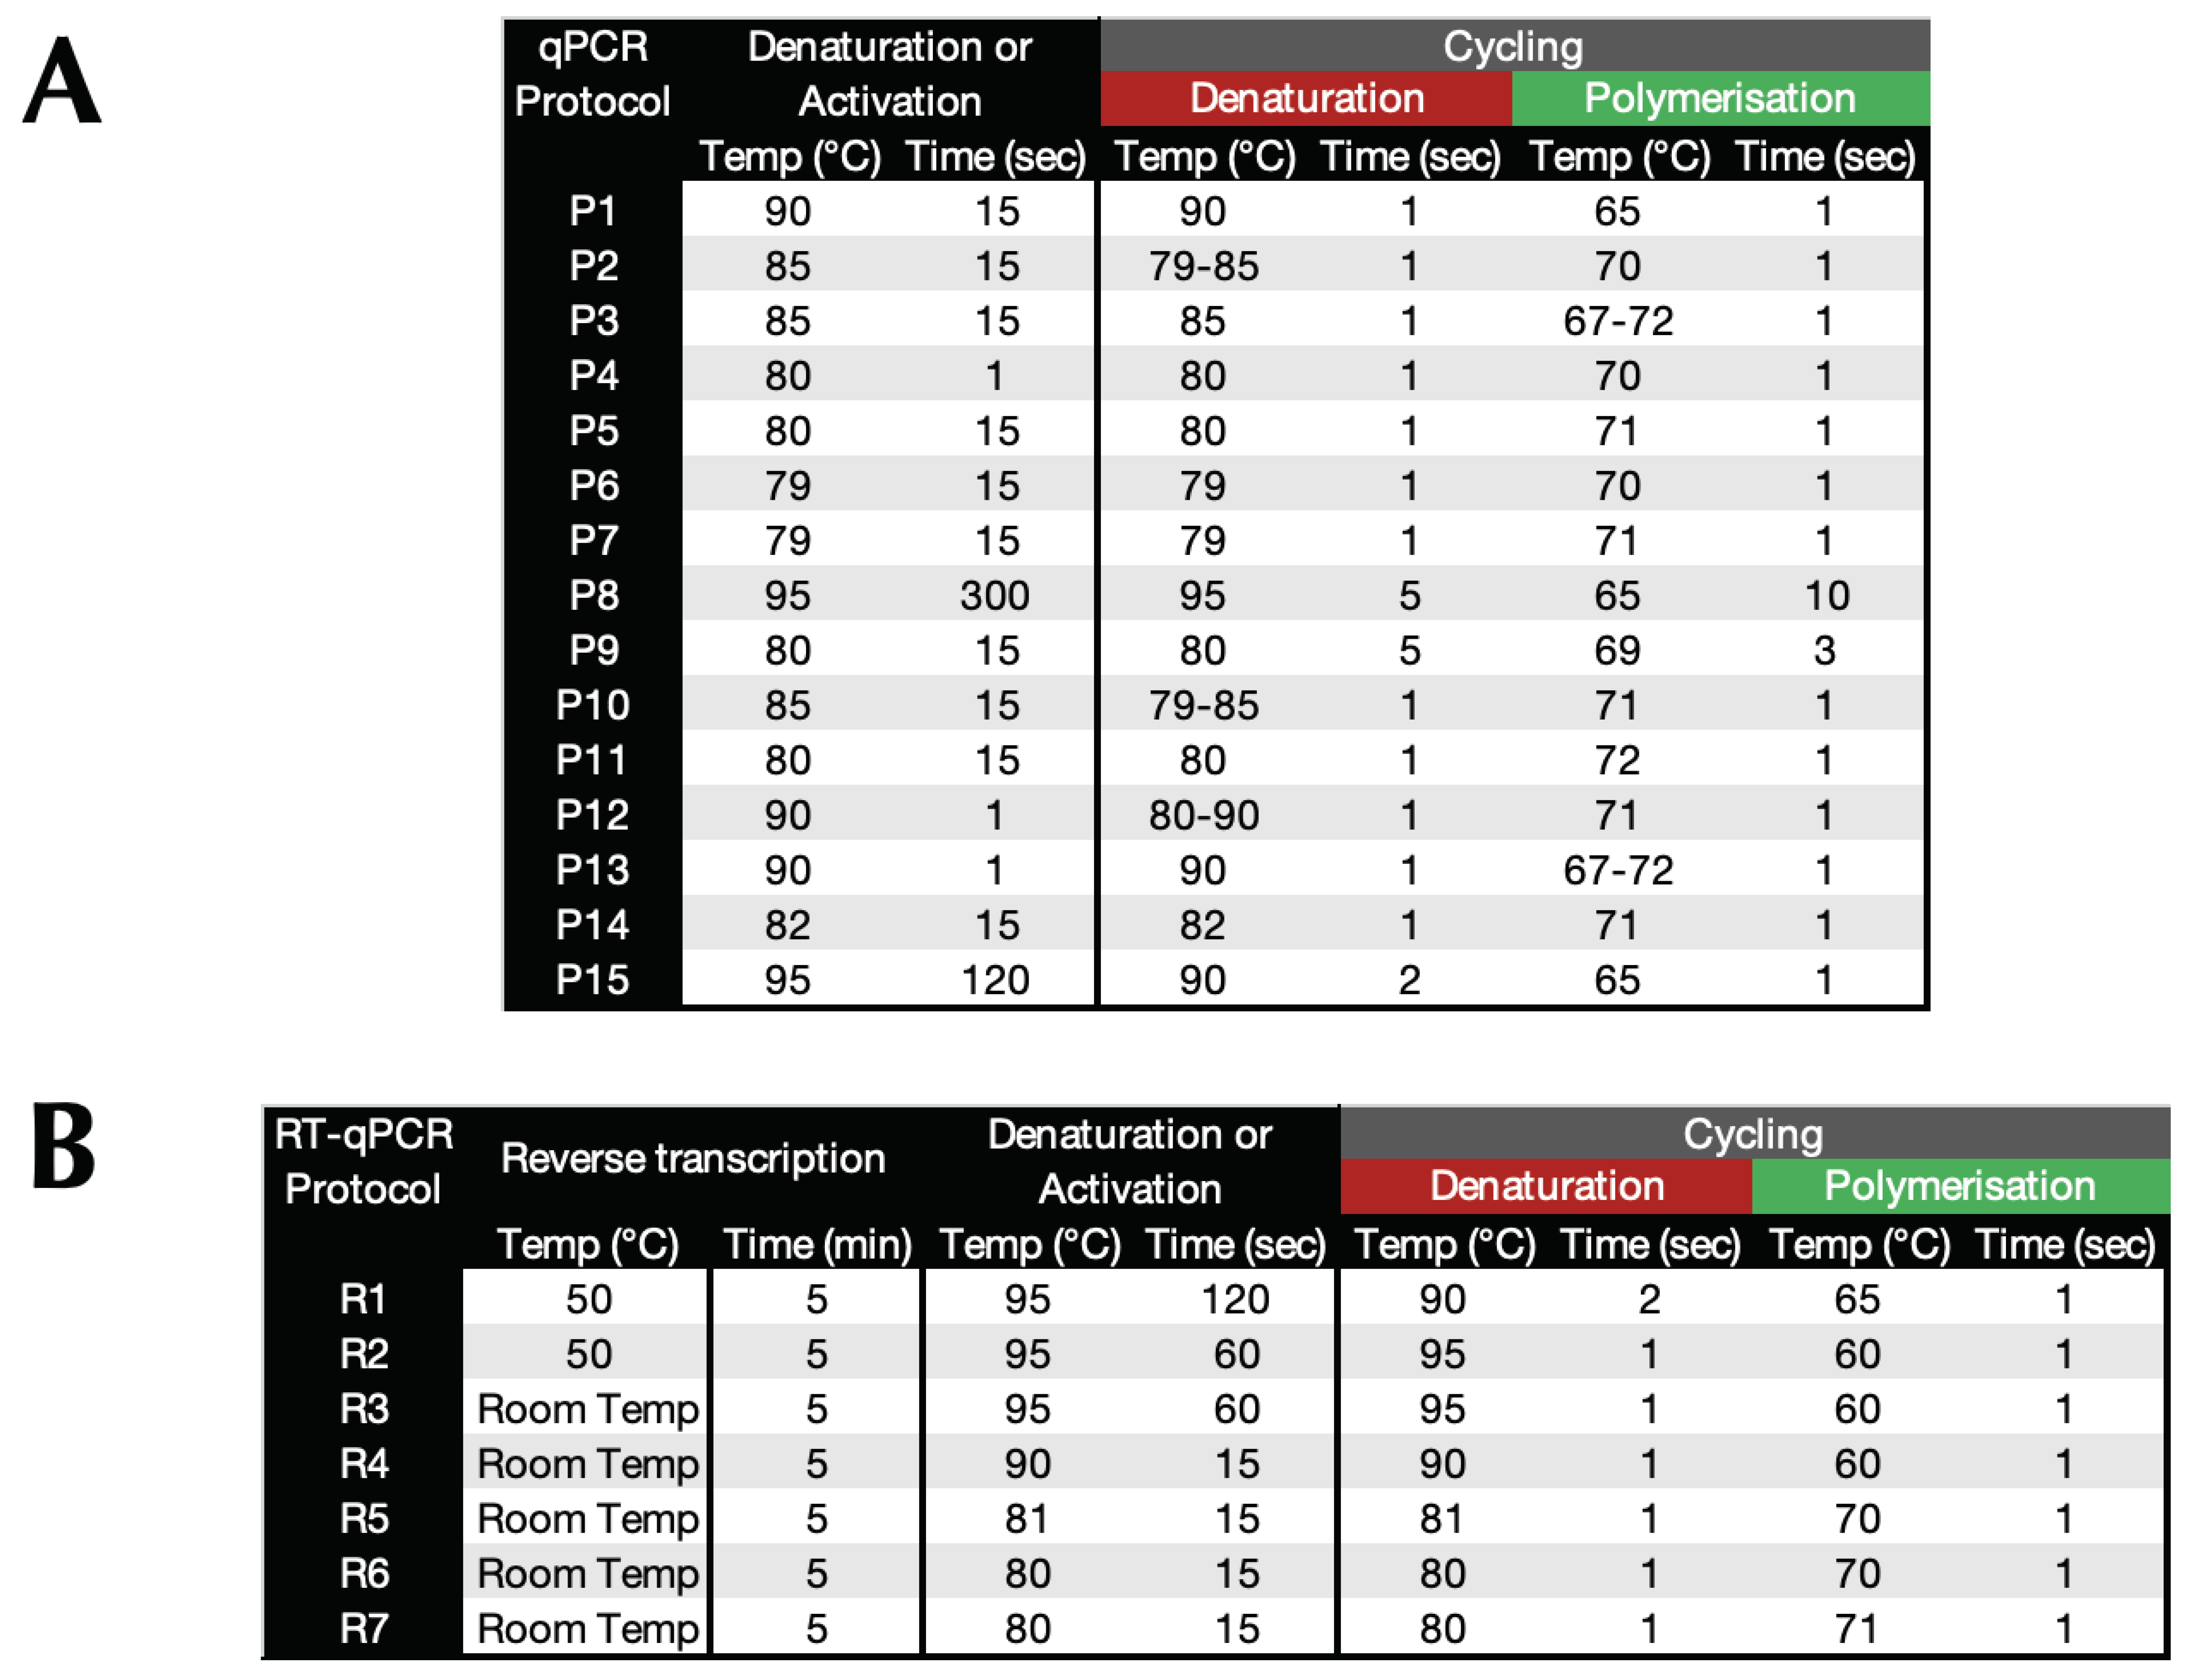
Unless otherwise stated, 2.5µL reaction volumes were used. cDNA (0.25µL per reaction) was used for most experiments except for the standard curves and LoD experiments. These reactions were run using dilutions of PCR amplicons. All reactions were set up at room temperature using pre-cooled reagents using one of the protocols (P1-15) described in
Table 3A. Each experiment was carried out using premixes containing all reagents except the one being tested (ie. enzyme, cDNA, buffer). For reactions carried out using the BioRad or Cole Palmer instruments, concentrations of
Taq polymerase, primers and probes were determined empirically using protocol P1 and used at 0.06U/2.5µL reaction, 0.5 µM and 0.2 µM final concentrations, respectively. On the Mic,
Taq polymerase, primer and probe concentrations were 0.25U/2.5µL, 1µM and 0.4µM, respectively. Depending on the qPCR instrument, assays were carried out in heat-sealed white qPCR 96 well plates (BioRad), adhesive-sealed well plates (Cole Palmer) or 4-tube strips (BMS).
4.6. ddPCR reactions
The BioRad protocol was followed exactly for generating droplets (manual 186-4002) as well as setting up, running and analysing ddPCR runs (manual 1864001/3). Reactions were carried out using ddPCR Supermix for probes (Biorad), with primers and probes at concentrations of 0.9µM and 0.25µM respectively in 20µL volumes. When mixed with the droplet generating oil (BioRad), this resulted in final ddPCR volumes of 40 µl produced on the QX200 droplet generator (BioRad). Thermal cycling was performed on a C1000 thermal cycler (BioRad) with a ramp rate of 2°C using the following thermal cycling protocol recommended by BioRad: 95°C 10min, followed by 40 cycles at 95°C for 15sec and 60°C for 60sec and a final 98°C 10 min step. Droplets were counted using the QX200 droplet reader (BioRad).
4.7. 1-step RT-qPCR reactions
1-step reactions were carried out with SARS-CoV-2 BA 5.1 gRNA as well as human breast cancer or fibroblast derived total RNA. PCRBio’s Clara or NEB’s Luna 1-step master mixes were included as positive reagent controls. B25, B27, B47 or B50 were used with 100U of US or ES RTs, 0.5µM/0.25µM primer/probe mix, and 0.06U/2.5µL of MyTaq, GoTaq (Promega) or ExTaq (Takara). Reactions were carried out using one of two alternative RT steps:
A. All plasticware and reagents were kept on ice whilst dispensing the individual reaction components. Plates were sealed, spun for 5-15 seconds at 4°C in a refrigerated centrifuge, placed in a qPCR thermal cycler and assays were run using protocols R1 or R2 (
Table 3B).
B. All plasticware and reagents except the RTs were kept at room temperature and reactions were set up at room temperature. Plates were sealed and spun for 5-15 seconds at room temperature before being placed in a qPCR thermal cycler. This process took around 5 minutes, depending on the number of samples being analysed. Assays were then run using one of the protocols R3-R7 (
Table 3B).
4.8. Data analysis
All qPCR data were initially analysed using the software supplied with each instrument, then imported and further analysed in Microsoft Excel for Mac v.16.80 and PRISM for Mac v.10. ddPCR results were analysed & exported using Quantasoft v.1.6.6.320 and QX Manager v.2.1 software. ∆Cq values are shown with ±95% Confidence Intervals (CI) rather than ±Standard Deviation (SD). The resulting wider interval acknowledges the level of uncertainty in the measurement and provides a more transparent representation of the potential range of ∆Cq values.
5. Conclusions
This study introduces a ground-breaking advancement in the way PCR is carried out. The optimisation of buffers and assay redesign to enable qPCR under low ∆T conditions offers a host of benefits, from faster reaction times and reduced energy consumption to broader application potential. The compatibility with diverse Taq polymerases, the inclusion of the RT step, and the notable LoD and PCR efficiency collectively highlight is potential for point-of-care diagnostics. Its impact spans diverse fields, including clinical diagnostics, epidemiology, environmental monitoring, and personalised medicine, paving the way for significant advancements in disease detection and patient care.
Supplementary Materials
The following supporting information can be downloaded at the website of this paper posted on
Preprints.org, Supplementary Figures 1-9 and Cq values for Figure.
Author Contributions
Conceptualization, SAB; methodology, SAB; validation, SK.; formal analysis, SAB, SK, TN, GLS; investigation, SAB, SK; writing—original draft preparation, SAB; writing—review and editing, SAB, SK, TN, GLS; funding acquisition, SAB. All authors have read and agreed to the published version of the manuscript.
Funding
This research was funded by National Institute for Health Research, reference 33421/NIHR204688.
Institutional Review Board Statement
Not applicable.
Informed Consent Statement
Not applicable.
Data Availability Statement
Most Figures include the Cq data supporting the conclusions published in this article. The other data are included with the supplementary information.
Conflicts of Interest
The authors declare no conflicts of interest. The funders had no role in the design of the study; in the collection, analyses, or interpretation of data; in the writing of the manuscript; or in the decision to publish the results.
References
- Higuchi, R. et al. Simultaneous amplification and detection of specific DNA sequences. Biotechnology (NY). 10:413-417 (1992). [CrossRef]
- Higuchi, R. et al. Kinetic PCR analysis: real-time monitoring of DNA amplification reactions. Biotechnology (NY). 11:1026-1030 (1993). [CrossRef]
- Bustin, S.A. et al. Real-time reverse transcription PCR (qRT-PCR) and its potential use in clinical diagnosis. Clin Sci (Lond). 109:365-379 (2005). [CrossRef]
- Bustin, S. et al. Improving the analysis of quantitative PCR data in veterinary research. Vet J. 191:279-281 (2012). [CrossRef]
- Lopez, M.M. et al. Are molecular tools solving the challenges posed by detection of plant pathogenic bacteria and viruses? Curr Issues Mol Biol. 11:13-46 (2009). [CrossRef]
- Abramova, A. et al. A global baseline for qPCR-determined antimicrobial resistance gene prevalence across environments. Environ Int. 178:108084 (2023). [CrossRef]
- Khot, P.D. et al. PCR-based diagnosis of human fungal infections. Expert Rev Anti Infect Ther. 7:1201-1221 (2009). [CrossRef]
- Nouwairi, R.L. et al. Ultra-rapid real-time microfluidic RT-PCR instrument for nucleic acid analysis. Lab Chip. 22:3424-3435 (2022). [CrossRef]
- Dahl, A. et al. Quantitative PCR based expression analysis on a nanoliter scale using polymer nano-well chips. Biomed Microdevices. 9:307-314 (2007). [CrossRef]
- Qiu, X. et al. A Low-Cost and Fast Real-Time PCR System Based on Capillary Convection. SLAS Technol. 22:13-17 (2017). [CrossRef]
- Fernández-Carballo, B.L. et al. Low-cost, real-time, continuous flow PCR system for pathogen detection. Biomed Microdevices. 18:34 (2016). [CrossRef]
- Mohammadyousef, P. et al. Plasmonic and label-free real-time quantitative PCR for point-of-care diagnostics. Analyst. 146:5619-5630 (2021). [CrossRef]
- Blumenfeld, N.R. et al. Multiplexed reverse-transcriptase quantitative polymerase chain reaction using plasmonic nanoparticles for point-of-care COVID-19 diagnosis. Nat Nanotechnol. 17:984-992 (2022). [CrossRef]
- Wittwer, C.T. Rapid Cycle and Extreme Polymerase Chain Reaction. Methods Mol Biol. 2621:257-266 (2023). [CrossRef]
- Millington, A.L. et al. The kinetic requirements of extreme qPCR. Biomol Detect Quantif. 17:100081 (2019). [CrossRef]
- Farrar, J.S. et al. Extreme PCR: Efficient and Specific DNA Amplification in 15-60 Seconds. Clin Chem. 61:145-153 (2015). [CrossRef]
- Paruch, L. Molecular Diagnostic Tools Applied for Assessing Microbial Water Quality. Int J Environ Res Public Health. 19:5128 (2022). [CrossRef]
- Foddai, A.C.G. et al. Methods for detection of viable foodborne pathogens: current state-of-art and future prospects. Appl Microbiol Biotechnol. 104:4281-4288 (2020). [CrossRef]
- Lee, S.B. et al. Advances in forensic DNA quantification: A review. Electrophoresis. 35:3044-3052 (2014). [CrossRef]
- Henry, R. et al. Environmental monitoring of waterborne Campylobacter: evaluation of the Australian standard and a hybrid extraction-free MPN-PCR method. Frontiers in microbiology. 6:74 (2015). [CrossRef]
- Tagliavia, M. et al. Development of a fast DNA extraction method for sea food and marine species identification. Food Chem. 203:375-378 (2016). [CrossRef]
- Yang, L. et al. Clinical Validation of DNA Extraction-Free qPCR, Visual LAMP, and Fluorescent LAMP Assays for the Rapid Detection of African Swine Fever Virus. Life (Basel). 12:1067 (2022). [CrossRef]
- Ratti, C. et al. A Rapid Protocol of Crude RNA/DNA Extraction for RT-qPCR Detection and Quantification. Methods Mol Biol. 1875:159-169 (2019). [CrossRef]
- Minguzzi, S. et al. A Rapid Protocol of Crude RNA/DNA Extraction for RT-qPCR Detection and Quantification of ‘Candidatus Phytoplasma prunorum’. PLoS One. 11:e0146515 (2016). [CrossRef]
- Jangra, S. et al. Rapid and zero-cost DNA extraction from soft-bodied insects for routine PCR-based applications. PLoS One. 17:e0271312 (2022). [CrossRef]
- Delgado-Diaz, D.J. et al. Strategies That Facilitate Extraction-Free SARS-CoV-2 Nucleic Acid Amplification Tests. Viruses. 14:1311 (2022). [CrossRef]
- Bustin, S. et al. CoV2-ID, a MIQE-compliant sub-20-min 5-plex RT-PCR assay targeting SARS-CoV-2 for the diagnosis of COVID-19. Sci Rep. 10:22214 (2020). [CrossRef]
- Bustin, S.A. et al. RT-qPCR Detection of SARS-CoV-2: No Need for a Dedicated Reverse Transcription Step. Int J Mol Sci. 23:1303 (2022). [CrossRef]
- Bustin, S.A. et al. The MIQE guidelines: minimum information for publication of quantitative real-time PCR experiments. Clin Chem. 55:611-622 (2009). [CrossRef]
- Forootan, A. et al. Methods to determine limit of detection and limit of quantification in quantitative real-time PCR (qPCR). Biomol Detect Quantif. 12:1-6 (2017). [CrossRef]
- Nolan, T. et al. Quantification of mRNA using real-time RT-PCR. Nature Protocols. 1:1559-1582 (2006). [CrossRef]
- Gavina, K. et al. Molecular point-of-care devices for the diagnosis of infectious diseases in resource-limited settings - A review of the current landscape, technical challenges, and clinical impact. J Clin Virol. 169:105613 (2023). [CrossRef]
- Yadav, S.K. et al. Point-of-Care Devices for Viral Detection: COVID-19 Pandemic and Beyond. Micromachines (Basel). 14:1744 (2023). [CrossRef]
- Heidt, B. et al. Point of Care Diagnostics in Resource-Limited Settings: A Review of the Present and Future of PoC in Its Most Needed Environment. Biosensors (Basel). 10:133 (2020). [CrossRef]
|
Disclaimer/Publisher’s Note: The statements, opinions and data contained in all publications are solely those of the individual author(s) and contributor(s) and not of MDPI and/or the editor(s). MDPI and/or the editor(s) disclaim responsibility for any injury to people or property resulting from any ideas, methods, instructions or products referred to in the content. |
© 2024 by the authors. Licensee MDPI, Basel, Switzerland. This article is an open access article distributed under the terms and conditions of the Creative Commons Attribution (CC BY) license (http://creativecommons.org/licenses/by/4.0/).
