Preprint
Article

Phosphorus Solubilization by Lupines (L. angustifolius and L. albus) in Four Contrasting Soils

Altmetrics

Downloads

91

Views

51

Comments

0

A peer-reviewed article of this preprint also exists.

Submitted:

17 January 2024

Posted:

18 January 2024

You are already at the latest version

Alerts
Abstract
A substantial amount of phosphorus (P) in soil is not readily available for plant uptake. Certain species may enhance P availability from poorly soluble P forms. This research aimed to compare the P solubilization capacity of the soil of two Lupine species, L. albus, and L. angustifolius, with a control crop of oats (Avena strigosa L.). Plants were planted in pots in four soils with varying texture, organic matter content, acidity, and P availability. Phosphorus solubilization capacity was assessed on variations of P availability (PBray1) at four points in time, comparing soils with lupine to oat-containing soils and their baseline values. At harvest, measurements of plant shoot biomass included their shoot dry weight and some nutrient concentrations such as P, nitrogen (N), manganese (Mn), and lupine nitrogen fixation. Compared to soils containing oats, lupine soils significantly increased PBray1 concentrations; increments ranged from 0.9 to 5.4 mg kg-1, depending on species, sampling time, and soil type. Lupine-induced soil acidification did not fully explain this P increase., As a proxy measurement of organic acid exudation, Manganese concentration was high in both lupine species' shoot biomass; however, these legumes had divergent Mn accumulation responses to soil acidity and P availability. Nitrogen fixed quantity varied with Lupine species (105-240 mg pot-1) and soil type (60-240 mg pot-1). Lupinus albus had a higher ability to mobilize non-labile P and provide N through biological N fixation (BNF), positioning it as a suitable crop for diversifying Uruguay's agricultural crop rotation systems.
Keywords: 
Subject: Biology and Life Sciences  -   Agricultural Science and Agronomy

1. Introduction

The adoption of continuous cropping (CC), primarily soybean (Glycine max L. Merr.), has increased in Uruguayan agricultural systems since the early 2000s [1], replacing the traditional crop-pasture rotation [2,3]. While grazing persists in agricultural systems, its duration within the rotation has been significantly reduced. According to the Ministry of Livestock, Agriculture and Fisheries of Uruguay, the 2021 agricultural survey [4], estimated that pastures associated with wheat cropping constituted less than 8% of the total area planted with this winter crop. In the past 15 years, the proportion of pastures associated with winter crops has significantly decreased from 28 % in 2005 to 4 % in 2021. Despite the increase in grain production due to pasture phase exclusion, recent studies have confirmed persistent wheat yield gaps in Uruguay [3], which cannot be explained by nutrient deficiency and remain unaddressed by correcting nutrient deficiencies. The issue is exacerbated because soil quality has been compromised, which affects the sustainability of the system [2,5].
In this scenario, there is significant concern regarding the impact of a permanent negative nitrogen (N) balance in the CC rotation; thus, balancing N within this system becomes necessary [6]. In contrast to crop-pasture rotation, the CC systems have experienced an increase in the quantities of both N and phosphorus (P) fertilizers due to agricultural intensification. However, for P in particular, due to the accumulated yield increased extraction of P from the soil, the amount of P remaining decreased, mainly when crops highly extractive were the main components of the sequences into the rotation, such as soybean and corn [7]. Moreover, applying P fertilizer above crop requirements leads to a slightly positive soil P balance, as P gradually accumulates in the soil over time [7]. This accumulation is affected by the low P-use efficiency in most crops, which typically ranges from 15 to 30% [8].
Although the majority of residual P is scarcely assimilable by plants, certain species may be able to make this P available [9,10]. The lupine genus may be able to mobilize residual P through root exudates, releasing phosphatases, acidifying, and chelating compounds (carboxylates), which can enhance their growth and possibly that of subsequent crops [11,12]. However, this genus has not yet been incorporated into crop rotations in Uruguay, which typically favor winter cereal crops like wheat or barley and summer crops such as soybean or maize. Additionally, further investigation [13] on lupine cultivation and its effects on soil nutrient dynamics must to be conducted.
Accordingly, for competitive crop production, the integration and diversifying of functional groups -such as annual winter legumes like lupine - may be a key strategy to reverse soil deterioration processes [14,15,16]. This lupine genus is recognized for its high potential as a pulse crop in Australia, Chile, and other countries for a variety of production purposes [12,17,18,19]. Integrating crops capable of N fixation from the atmosphere and P solubilization from unavailable forms provides an alternative to excessive or improper fertilizer applications. Moreover, the root activity of this annual winter legume, contributes to soil organic matter (SOM) as a carbon source and enhances soil N content through its N-fixing ability, while also improving physical, chemical, and biological soil properties.
Given the growing interest in diversifying crops within agricultural systems and reducing fertilizer use, there is a timely opportunity to evaluate lupine cultivation. Species such as white lupine (L. albus) and narrow-leaf lupine (L. angustifolius) are renowned in in regions of Australia and Chile as N fixers and P solubilizers, particulary in mildly acidic or neutral soils of light to medium texture [20]. Consequently, we hypothesize that the availability of plant P in contrasting soils (pH, texture, SOM, and soil P concentration) increases by acidification of the soil surrounding roots by those lupines species, enhancing the solubility of P from sparingly available soil P sources. This enhanced plant P availability is expected to improve dry matter (DM) yield and the P and N biomass content of lupine, potentially leaving a residual effect on subsequent crops.
The objectives of this greenhouse study were as follows: i) to evaluate the capacity of two lupine species, L. albus and L. angustifolius, to increase available soil P (PBray1) compared to a reference crop of oats (Avena strigosa). ii) to quantify changes in the available P and examine its association with soil pH variation in four contrasting soils after lupine harvest relative to the oat-containing soil and the initial values of these parameters for each soil. iii) to assess the effect of species and soil type on biomass yield of evaluated species, as well as their potential N and P contribution as predecessor crops.

2. Material and Methods

2.1. Soil Collection and Preparation Prior to Experiment Installation

Soil samples were collected from the topsoil layer (0–20 cm depth) from four Uruguayan agroecological areas under different soil uses with the following geographic coordinates: agricultural- Site 1 (33°59'05.4" S and 57°43'42.7" E); livestock-grassland- Site 2 (32°49'1.20" S and S 54°25'28.27" O); grassland- Site 3 (34°50'15.61" S and 56°13'21.62" O); forestry- Site 4 (31°23’43.44" S and 55°41’39.37" O), with contrasting soil texture, pH values, organic matter (OM), and P concentration (PBray1). Table 1 displays the collection sites and USDA soil classification for each of the four soils analyzed in this study; these references (Site 1 to Site 4) were used throughout the text to identify each soil treatment.
Before planting, each soil was sieved through a one-cm-mesh sieve to homogenize the size of the aggregates and discard coarse plant material. After this screening, for each soil, the granulometric composition (texture) and the chemical characterization were determined.

2.2. Greenhouse Experiment

2.2.1. Experimental Design and Plant Growth Conditions

A pot experiment was conducted under natural light conditions in a greenhouse at the Agronomy College in Montevideo (34° 50' 18.20" S, 56°13 '16.36" W) to evaluate the efficacy of two lupine species in enhancing soil P availability. A total of 48 three-liter pots (15 cm in diameter) were filled with the different soil types. The treatments were arranged in a factorial design with two factors: four soil types and three species, in a completely randomized design (CRD) with four replications.
The species under evaluation comprised of two legumes from the Lupinus genus: Lupinus angustifolius L. var. Lavalle, a non-cluster root-forming lupin (narrow leaf lupin), and L. albus L. var. Blu25, a cluster root-forming legume (white lupin). Additionally, an annual grass, black oats (Avena strigosa L., var. Agroplanalto), was included in the study. The use of black oats served as a comparative measure to assess the increase in soil P induced by lupines and to evaluate BNF. Both lupine species were inoculated with a non-specific commercial inoculant (Bradyrhizobium sp., strains U-612 and U620), known to be effective for these species. The planting date was 10 July 2019, with two or three lupine seeds per pot, leaving only one plant per pot after emergence. There were five oat plants per pot.
Plants were irrigated using potable water, supplemented once a week during the first month of the experiment with a nutrient solution (Hornum solution: MgSO4.7H2O, CaCl2.6H20, FeEDTA + microelements) free of N and P and using an identical volume per pot of this nutrient solution. Pot watering was done at a variable frequency and using variable water volumes according to potential evapotranspiration and the water-holding capacity of each soil type.

2.2.2. Soil and Plant Sampling

Soil samples were collected at four different time points: 48, 76, 87, and 103 days after planting (dap) to assess variations in soil properties. The initial soil samples were obtained on September 9, 2019, two months after the start of the experiment, when the crop was in the vegetative stage. The second sampling took place on October 2, 2019, during flowering stage. The third sampling occurred on October 14, 2019, at the beginning of the lupine grain filling, which was the harvest time. The final sampling was conducted on October 30, 2019. The soil pH was measured on September 9 and October 14, 2019. The soil exchangeable acidity was assessed to confirm any connection between changes in the solubility of inorganic P or Al and soil acidity. A hand drill, 1.9 cm in diameter was used to collect a single soil sample from each pot, reaching a depth of 0 to 10 cm.
The plants were harvested at 87 dap at ground level using pruning shears to remove all aerial biomass per pot. At this sampling time, the oat plants had reached full maturity, while L. angustifolius was in the initial phase of grain-filling, and L. albus exhibited pods in an early stage of development. Compared to L. albus, L. angustifolius had more mature pods, which accounted for around ten percent of the total P absorbed in the aboveground biomass. Consequently, the study separated the analytical determination of L. angustifolius pods from the remaining aerial plant parts. However, except for P concentration, the other analyses on these pod components were not achievable due to the insufficient sample size to accomplish them. The shoot dry weight was expressed per pot (g pot-1), and in some instances, converted to its equivalent per hectare (kg ha-1) based on the pot's surface area.

2.3. Sample Processing and Analytical Determinations

2.3.1. Soil Measurements

The soil samples were dried in a forced-air oven at 40 °C for at least 48 h, and were ground to a 2 mm sieve size. For the initial characterization, the determined parameters were: granulometric composition, organic matter (OM), pH, labile phosphorus (P Bray N°1, henceforth PBray1), mineral nitrogen (ammonium and nitrate), exchangeable cations (Ca, Mg, K, and Na), and exchangeable acidity. OM was determined by the Walkley-Black method [22], while exchangeable cations Ca and Mg were determined by atomic absorption and K and Na by flame spectrophotometry, following extraction with 1M ammonium acetate at pH 7 [23]. Soil pH was measured in deionized water (1: 2.5 soil: deionized water ratio) using a pH probe (Orion Research 701 pH electrode), while exchangeable acidity was using the potassium chloride method [23]. The labile P or available P content was measured using the Bray N° 1 method extraction system [24], which is the most widely used method in Uruguay for evaluating plant P availability in most agricultural soils in the country [25]. Nitrate-N (NO3-N) concentration was determined using the Griess-Ilosvany method [26], and ammonium-N (NH4-N) was determined using the colorimetric method [27]. Phosphorus, ammonium, and nitrate readings were taken in a spectrophotometer at 880, 650, and 540 nm, respectively, using the MRC microplate reader for the first two elements and the UNICAM spectrophotometer for nitrate. The hydrometer method [28] was employed to analyze the granulometric soil composition. During the growing season, soil samples were analyzed for PBray1 and pH using the same techniques described for soil characterization analysis.

2.3.2. Plant Measurements

The harvested plants were oven-dried at 65 °C for a minimum of 48 hours until the mass remained constant. Then, initially, dried plant materials were ground with a stationary and mobile knife mill (Marconi MA-580) until the particulate size was less than 2 mm. Plant samples of this granulometric size were analyzed for total P and K contents. Afterward, subsamples previously ground were newly ground by a rotary mill (SampleTek 200 vial Rotator) to a fine powder (typically a consistency approaching that of the talcum powder), which was necessary for 15N analysis by mass spectrometry. Total C and N concentration and 15N/14N of the samples (at the natural abundance) were determined by mass spectrometry in a US laboratory (https://csi.unm.edu). The next formula of Shearer and Kohl [29] was used to calculate the proportion of N fixed from the air (% Ndfa) for each lupine species:
%   N d f a = ( δ 15 N r e f δ 15 N f i x δ 15 N r e f B ) × 100
Where:
  • % Ndfa, the proportion of plant N derived from BNF
  • δ15Nref, the δ15N value of the reference plant (non-fixing)
  • δ15Nfix, the δ15N value of the fixing plant (lupine)
  • B, the δ15N value of a fixing plant growing in a medium without N
The B value was estimated as the mean δ15N value from pure lupine growing in the sand, with a value of +1.6 ‰ and -0.6 ‰ of δ15N for L. albus and L. angustifolius, respectively. The reference plant used was oat, and all δ15N values were determined under the same conditions as lupine legumes.
The total concentrations of P and potassium (K), calcium (Ca), magnesium (Mg), manganese (Mn) and iron (Fe), were also determined after calcination at 550 °C for 5 h. Phosphorus concentration was determined using the ascorbic acid method [30] after extraction with diluted HCl (20 % v/v) [31]. In the ash extracts, the remaining elements (Ca, Mg, K, Fe, and Mn) were determined by spectrometry as described for soil samples. Shoot P and N contents per pot (mg pot-1) were calculated by P or N concentrations (mg g-1 dw) × shoot dry weight (g pot-1), respectively. In certain instances, the plant nutrient content was also expressed per hectare, considering the pot's surface area.

2.4. Statistics

The availability of soil PBray1 was evaluated by repeated measures analysis of variance using a MIXED procedure of SAS. In this model, the between-subject factors were species and soil type, while the within-subject (repeated) factor was sampling time. The covariance structure among the repeated measures was specified as unstructured. If the three-way interaction effect (species x soil x sampling time) was significant at p < 0.05, the statistical analysis was performed for each time. There, two-way ANOVAs were used to study the main effects of soil, species, and their interaction as fixed effects. This analysis was evaluated in traits such as soil pH, shoot dry weight, plant P and N content, N fixed content, and plant nutrients concentration (P, N, Ca, Mg, K, Mn, and Fe). Ca and Mg concentrations were log-transformed before analysis in order to meet ANOVA’s assumptions. Two additional soil variables were estimated and analyzed from the data collected for PBray1 and pH values. Firstly, the difference between PBray1 (and pH) at a specific sampling time with the corresponding parameter measured at the beginning of the experiment denoted as ∆PBray1-initial and ∆pH-initial, respectively. Secondly, for each soil parameter (PBray1 and pH values), the difference between the soil samples containing lupine and those containing oats (∆PBray1_Lup-Oat and ∆pH_Lup-Oat). Treatment means comparisons were performed using Tukey's test, at 5% of confidence level. Additionally, orthogonal contrasts (C1: Lupine vs. Oat, C2:L. albus vs. L. angustifolius) were performed to identify differences between groups of treatments. Pearson correlation and linear regression analyses were conducted to describe and explain the association between variables. All analyses were conducted with the use of SAS statistical software version 9.04 (SAS Institute) and R software [32].

3. Results

3.1. Soil Characterization

Contrasting the values of texture and organic matter (Table 1), as well as pH and other analytical data (Table 2), distinguished the soils of the experiment. The soils of Site 1 and Site 3 had high natural fertility (higher total sum of exchangeable bases and organic matter content) and a finer texture than those of Site 2 and Site 4, the most acidic soils, but with low exchangeable Al concentrations.

3.2. Species, Soil and Sampling Time Effects on PBray1 Concentration

The main effects of species and soil on soil PBray1 were highly significant (p = 0.001), but their interaction was not. Considering the species effect on PBray1 in lupine treatments revealed that L. albus had the highest mean values (Figure 1), while concerning the soil factor, its effect on PBray1 reflected, on average, the initial P concentrations of each soil, and this was observed as early as 76 dap, after which the concentration tended to stabilize. In this model, the triple interaction effect (species x soil type x time) was statistically significant (p = 0.0133).
The highest concentrations of PBray1 were detected in all evaluated soils at the first sampling time (48 dap). The C1 (Lupine vs. Oat) was significant at 48 dap, but only in the soil of Site 1 (p = 0.0029), whereas C2 (L. albus vs. L. angustifolius) was significant in Site 1 and Site 3 (p = 0.0028 and p = 0.0445, respectively). At 76 dap both contrasts were no longer statistically significant in any of the soils, indicating that differences between species diminished. At harvest (87 dap), C1 was significant in Site 3 (p = 0.0331), Site 4 (p = 0.029), and Site 2 (p = 0.0001), but differences between lupine species were not detected. Fourteen days after harvesting (103 dap), C1 was highly significant in all the soils, while C2 was significant in all soils except Site 4, where no differences in PBray1 between lupine species were observed.
Table 3. Repeated measures analysis of variance model for soil PBray1 concentration.
Treatment effect DF F Value P > F†
Species 2 23.05 <0.0001
Soil type 3 101.56 <0.0001
Species x Soil type 6 1.36 0.2564
Sampling time 3 91.85 <0.0001
Species x sampling time 6 2.29 0.0518
Soil type x sampling time 9 6.66 <0.0001
Species x soil type x sampling time 18 2.17 0.0133
† Significant effects (p < 0.05) are in bold.
Note: The within-subject factor was sampling time. 48, 76, 87, and 103 days after planting and the between-subject factors were species and soil type
At harvest time (87 dap), the ANOVA showed the significant effect of the main factors, species and soil, but not for their interaction. The contrast analysis between lupine vs. oats (C1) was significant, the estimated difference being 2.6 mg kg-1, while the contrast between lupine species (C2) was not significant on this sampling date. Multiple comparisons of means using the Tukey method revealed a significant difference between lupine species, with higher values for L. albus. For this sampling time, the difference in PBray1 compared to the initial values was almost null in the soils with lupine; with oats, meanwhile, there was a mean decrease of 2.8 mg kg-1. At 87 dap, there were also statistically significant differences in the concentrations of PBray1 between soils, primarily reflecting the P analysis values of the tested soils before the installation of the experiment. The concentration of PBray1 did not differ statistically between Site 1 and Site 2. However, the P levels in these soils were substantially higher and statistically different from those of the other soils (p= 0.05). In the heavy-textured soils and Site 4, the ∆PBray1-initial was minimal in this sampling period; however, Site 2 had a mean decrease of 4.0 mg kg-1. Additionally, a significant percentage increase in PBray1 of 57% was observed in the loamy soil containing lupine relative to this soil containing oat, reaching 4.6 mg kg-1.
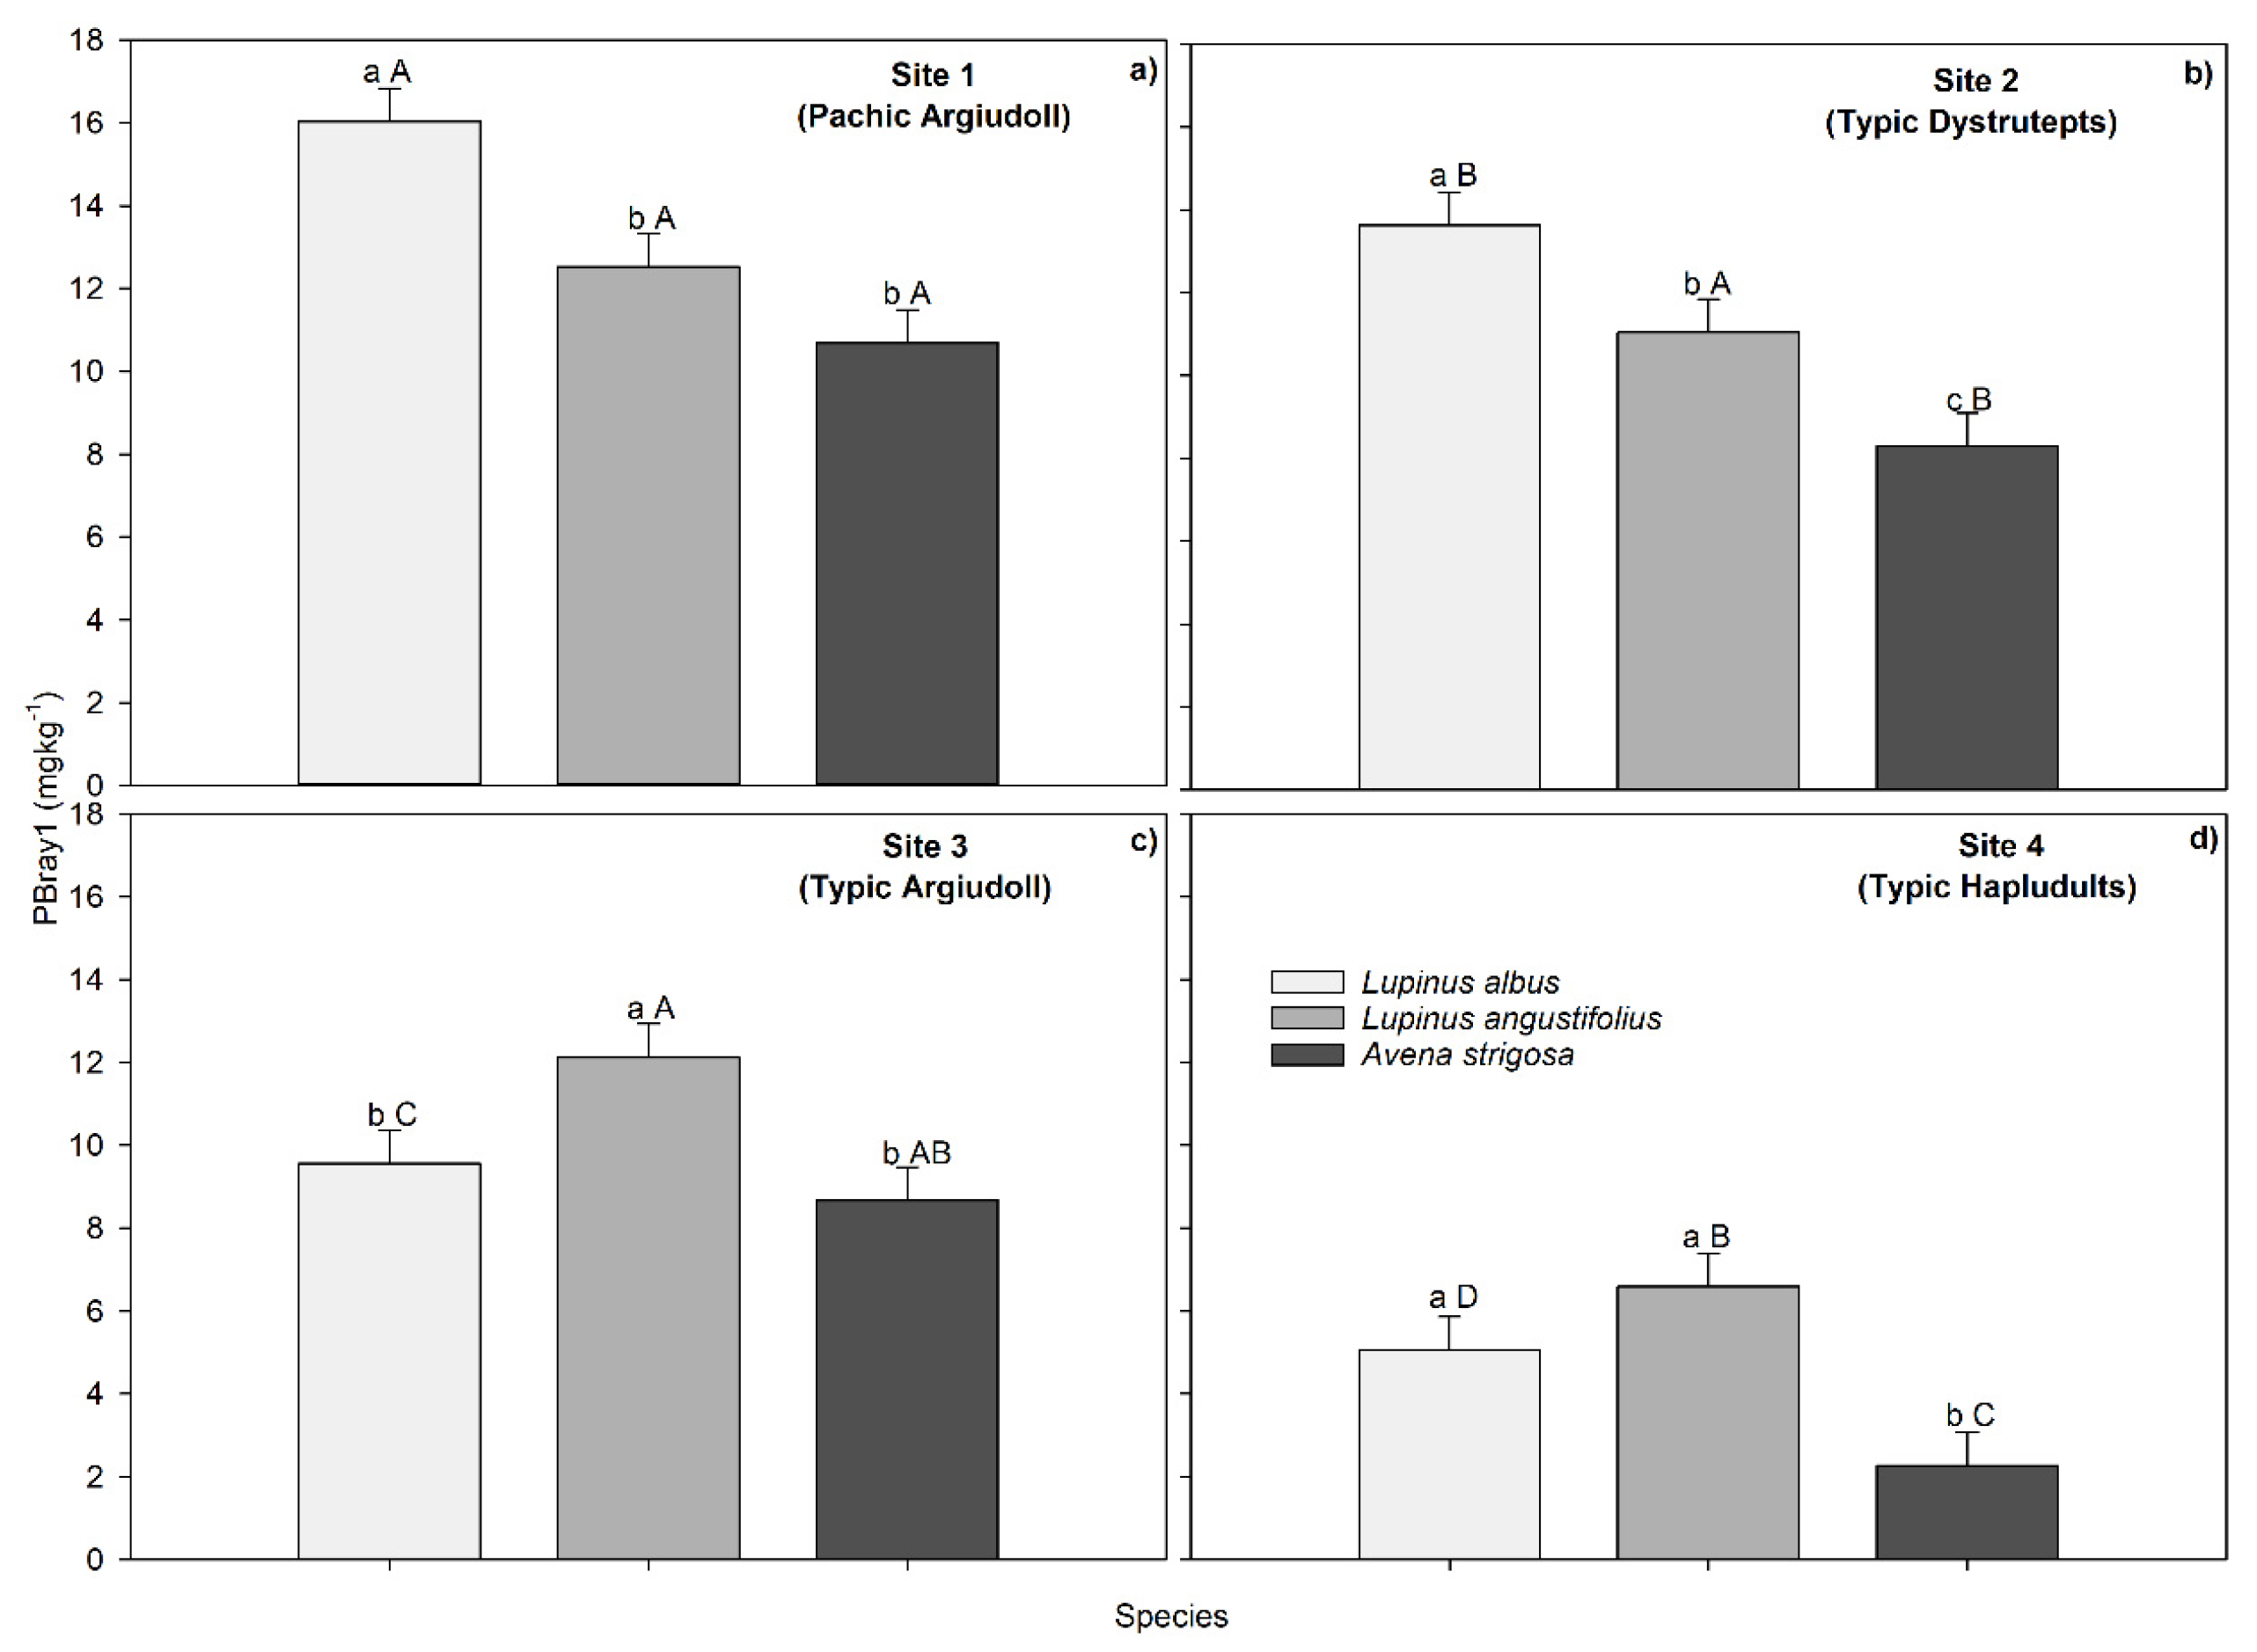
At 103 dap, a significant effect of the main factors (p <0.0001) but also of the species x soil type interaction (p= 0.0048) was detected (Figure 2; Supplementary material: Table S1). The C1 was significant in all the soils, the difference being 4.0; 3.6; 3.6, and 2.2 mg kg-1 in Site 2, Site 1, Site 4, and Site 3, respectively. The C2 was also significant in three soils, standing out L. albus in Site 1 and Site 2, with higher P content. Site 3 was the other soil with a significant difference between lupine species. In this soil, however, L. angustifolius stood out over L. albus, with a difference from the oat at 3.4 mg kg-1; meanwhile, the difference between L. albus and oats was statistically non-significant and estimated at 0.9 mg kg-1. In summary, the ∆PBray1_Lup-Oat, depending on the lupine species and the soil, ranged from 0.9 (non-significant difference) to 5.4 mg kg-1 (p <0.0001). In addition, a significant difference was found between both species of lupine to oats only in light-textured soils (Site 2 and Site 4). In the other soils, meanwhile, that difference was significant only in one species of lupine. This was L. albus in Site 1 and L. angustifolius in Site 3.

3.3. Species and Soil Type Effects on Soil pH

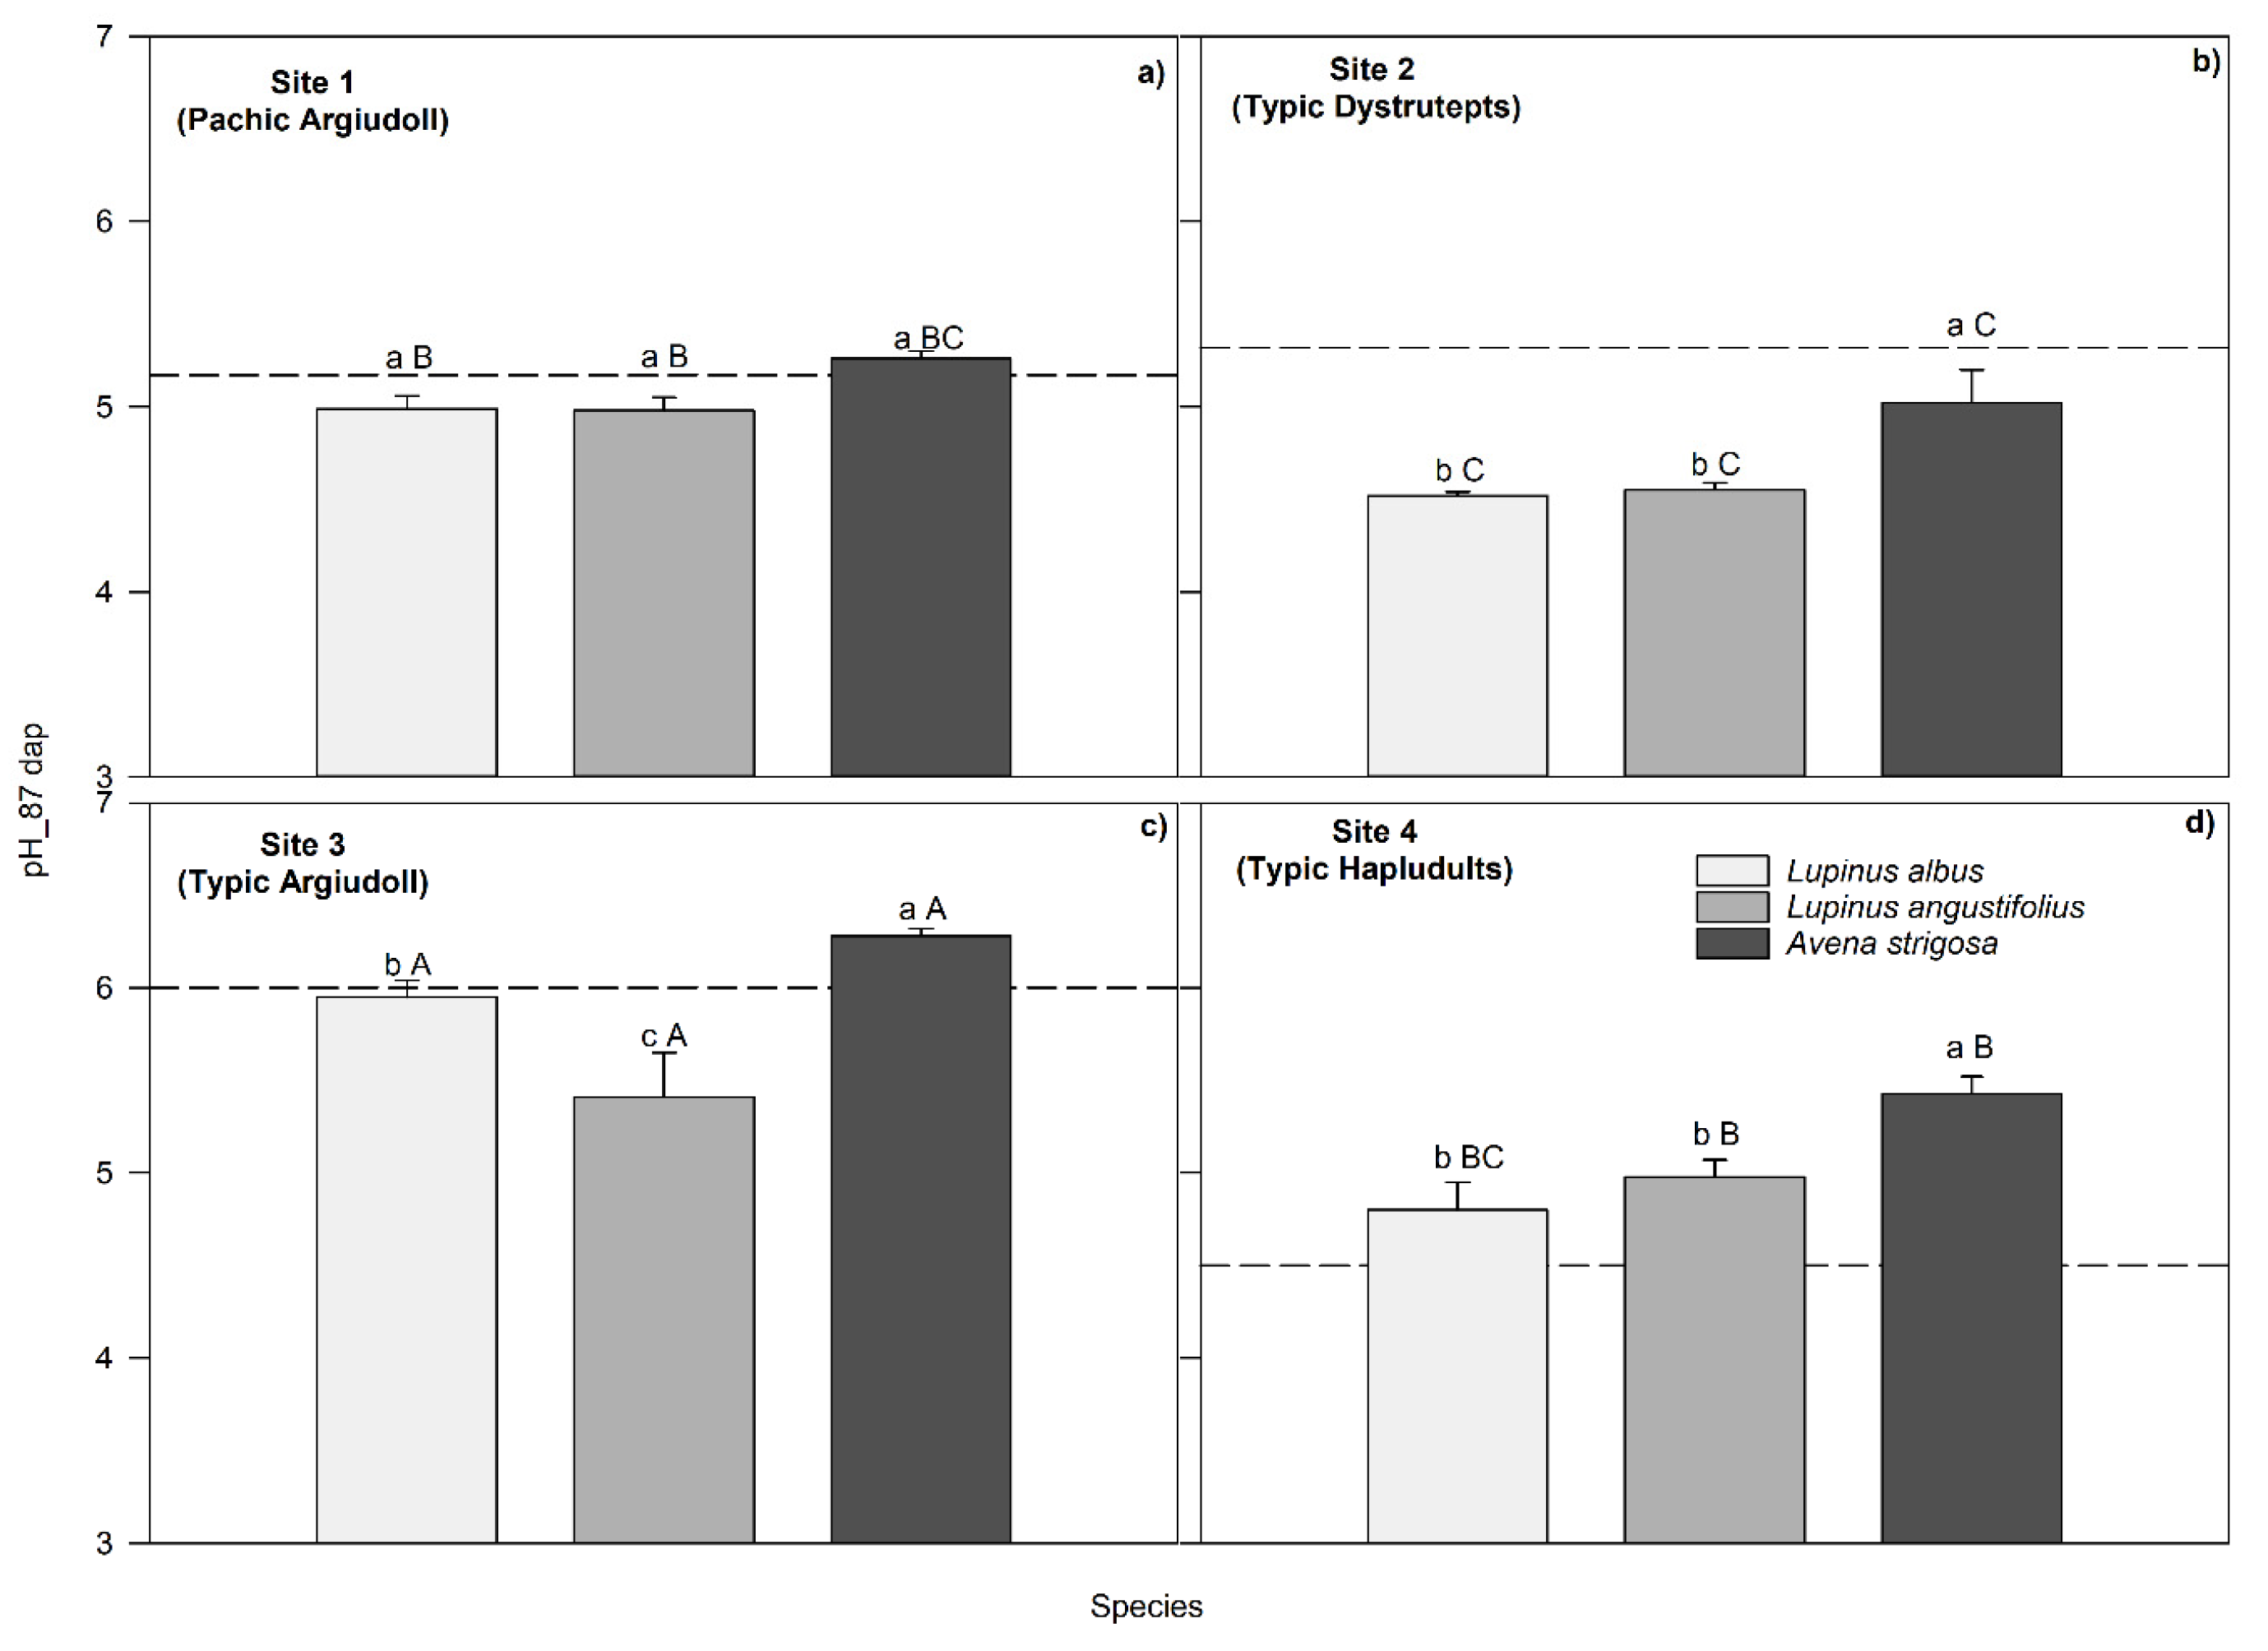
The pH of the soil at harvest differed considerably between soils with lupine and those with oats by 0.5 pH units on average (Figure 3). Compared to the pH values at 48 dap, the values were lower at harvest, although this decrease was only observed in soils with lupine (0.1 pH unit) and not in soils with oat. When the soil pH at harvest was compared with the initial pH of each soil, it was found that oats caused a mean pH increase of 0.25 units, while both species of lupine caused a decrease in pH, but without statistically significant differences. The effect of soil on pH changes was also highly significant, with an average increase of 0.57 units in Site 4 and a decrease of a similar magnitude (-0.62 units) in Site 2. The species x soil type interaction on soil pH measured at harvest was significant (p = 0.0365; Supplementary material: Table S2). As shown in Figure 3, oat-containing soils consistently recorded the lowest acidity levels. In addition, the soil pH of this species differed significantly from that of lupine in all soils except Site 1, where the differences between species were not statistically significant. Based on statistical differences between soils across species, Figure 3 reveals that Site 2 had the lowest soil pH at harvest, while Site 3 had the highest (coincidentally with the highest initial soil pH).
At 87 dap, in Site 3, Site 4, Site 2, and Site 1, the ∆pH_Lup-Oat was 1.2, -1.1, -1.0, and -0.6 units, respectively. According to the contrast analysis, the difference between the pH values of lupine and oat (C1) was statistically significant in all soils. The C2 was only significant in Site 3, with L. angustifolius standing out with a decrease in pH of -0.6 units from the initial value. Figure 3 also shows that the ∆pH-initial fluctuated within a more negative range for soils with lupine (-0.8 to 0.5) and a more positive range for soils with oat (-0.3 to 0.9). Likewise, the exchangeable acidity values corresponded to those of pH; when the pH decreased, the soil acidity increased. However, this increase in acidity was not associated with exchangeable aluminum but rather with an increase in the hydrogen ion concentration. On average, the highest increase of exchangeable aluminum was 0.14 cmolc kg−1 at 87 dap in Site 2; this concentration would not impose production limitations (Table 4).
Additionally, sandy soils at Sites 2 and 4 displayed more significant pH fluctuations. At Site 2, where the ∆pH-initial was the most pronounced, the difference in exchangeable acidity between soil holding lupine and soil holding oats was most noticeable and statistically significant. In contrast, at Site 4, exchangeable acidity with oat-bearing soil was only statistically distinct from soil containing L. albus. On the other hand, exchangeable acidity between species was not statistically significant at Sites 1 and 3 (Table 4).

3.4. Aboveground Biomass and Nutritional Status: Effects of Species and Soil Type

3.4.1. Shoot Dry Weight and P and N Content

As shown in Table 5, the species, soil, and their interaction significantly influenced the shoot dry weight and P content. The maximum shoot dry weight was produced by oat, followed by L. albus and L. angustifolius. Regarding soils, Site 4 had the lowest yield, heavier soils offered an intermediate yield, and Site 2 presented the highest yield, three times that of Site 4. The yield of each species was also differentially affected by the soil type (Soil x Species interaction; p=<0.0001). Except for Site 3, oats outyielded lupines, while L. albus produced roughly twice as much as L. angustifolius across all soil types.
The plant P content in oats and L. albus was not statistically different, except in Site 3, where L. albus absorbed more P than oats (Table 5). The absorption of P and the yield of aboveground biomass varied substantially between lupine species, with the lowest values detected in L. angustifolius. In terms of P concentrations, there were fewer differences within each species across sites because they were already similar in all soils except for Site 4, where the concentrations were, on average, half of those registered in the other sites, whatever the species considered. Oats displayed the most noticeable variation in terms of P content between sites. In soils with lupine, such differences between soils diminished, although in site 4, the P content of lupine was substantially lower than in the other sites. The contrast analysis between lupine and oat (C1) was significant only in Site 1 and Site 2, where plant P content in oats was markedly higher than that of lupines (Supplementary material: Table S3). Contrast 2 was not significant only in Site 4; the remaining soils had higher P content in L. albus than in L. angustifolius. All data displayed in Table 4 excluded pod components of L. angustifolius. However, upon their inclusion, the effect of species became not significant, eliminating the difference between P content reached by both lupine species in sites 1, 2, and 4. In contrast, L. albus continued to attain a higher plant P content than L. angustifolius in Site 3. On average, the P concentration of L. angustifolius plants in sites 1, 2, and 3, both with and without pods, was 1.6 and 1.4 mg g-1 dry weight, respectively.
Smilar to the shoot dry weight, the content of N in biomass significantly differed between species and soils, with the lowest values in Site 4 for both lupines and in Sites 1 and 3 for oats. In contrast to lupine P content, values of N content differ less between sites as the soil type effect was not statistically significant on N concentration (Table 5). The ANOVA results revealed no significant difference between lupine species in the proportion of N fixed from the air (Supplementary material: Table S4). However, there were statistically significant differences in N biomass and the amount of N fixed, with average values of 347 and 237 mg N pot-1, respectively, registering the highest values in L. albus. These variables were expressed as total N and N fixed content in shoot dry weight per hectare to determine their agronomic significance in N entering the soil system, representing approximately 190 kg N ha-1 and 130 kg N ha-1, respectively.

3.4.2. Plant Ca, Mg, K and Micronutrients (Fe and Mn) Concentrations in Aboveground Biomass

The ANOVA of plant nutrient concentration revealed that only K concentration was similar between species. Potassium concentration in L. albus showed differences between soils, with the highest concentration values in Site 3 and the lowest in Site 4. On the other hand, there were significant variations in Ca and Mg levels among species, with L. angustifolius consistently exhibiting the highest concentrations across all soil types (Table 6).
The impact of different species on the concentration of micronutrients in plants varied depending on the soil type (notably, a significant interaction effect between soil type x species). Across most soils, L. angustifolius exhibited the highest concentrations of Mn and Fe, with two exceptions. Specifically, L. albus had statistically higher Mn content at Site 3 compared to oats, and oats displayed the highest concentrations of Fe at Site 4 compared to lupines (Table 6). In all soils, Mn concentration was substantially higher in lupines than in oats. Concentrations of Mn and Fe in the aboveground biomass also differed among soils within each species, with oats showing no significant differences in Mn concentration across soils. Similarly, L. angustifolius did not show significant differences in Fe concentration. When examining the Fe concentrations of each species across soils, both lupine species consistently exhibited higher values than oats in all soils except Site 4 as previously mentioned.

3.5. Relationships between Soil and Plant Parameters

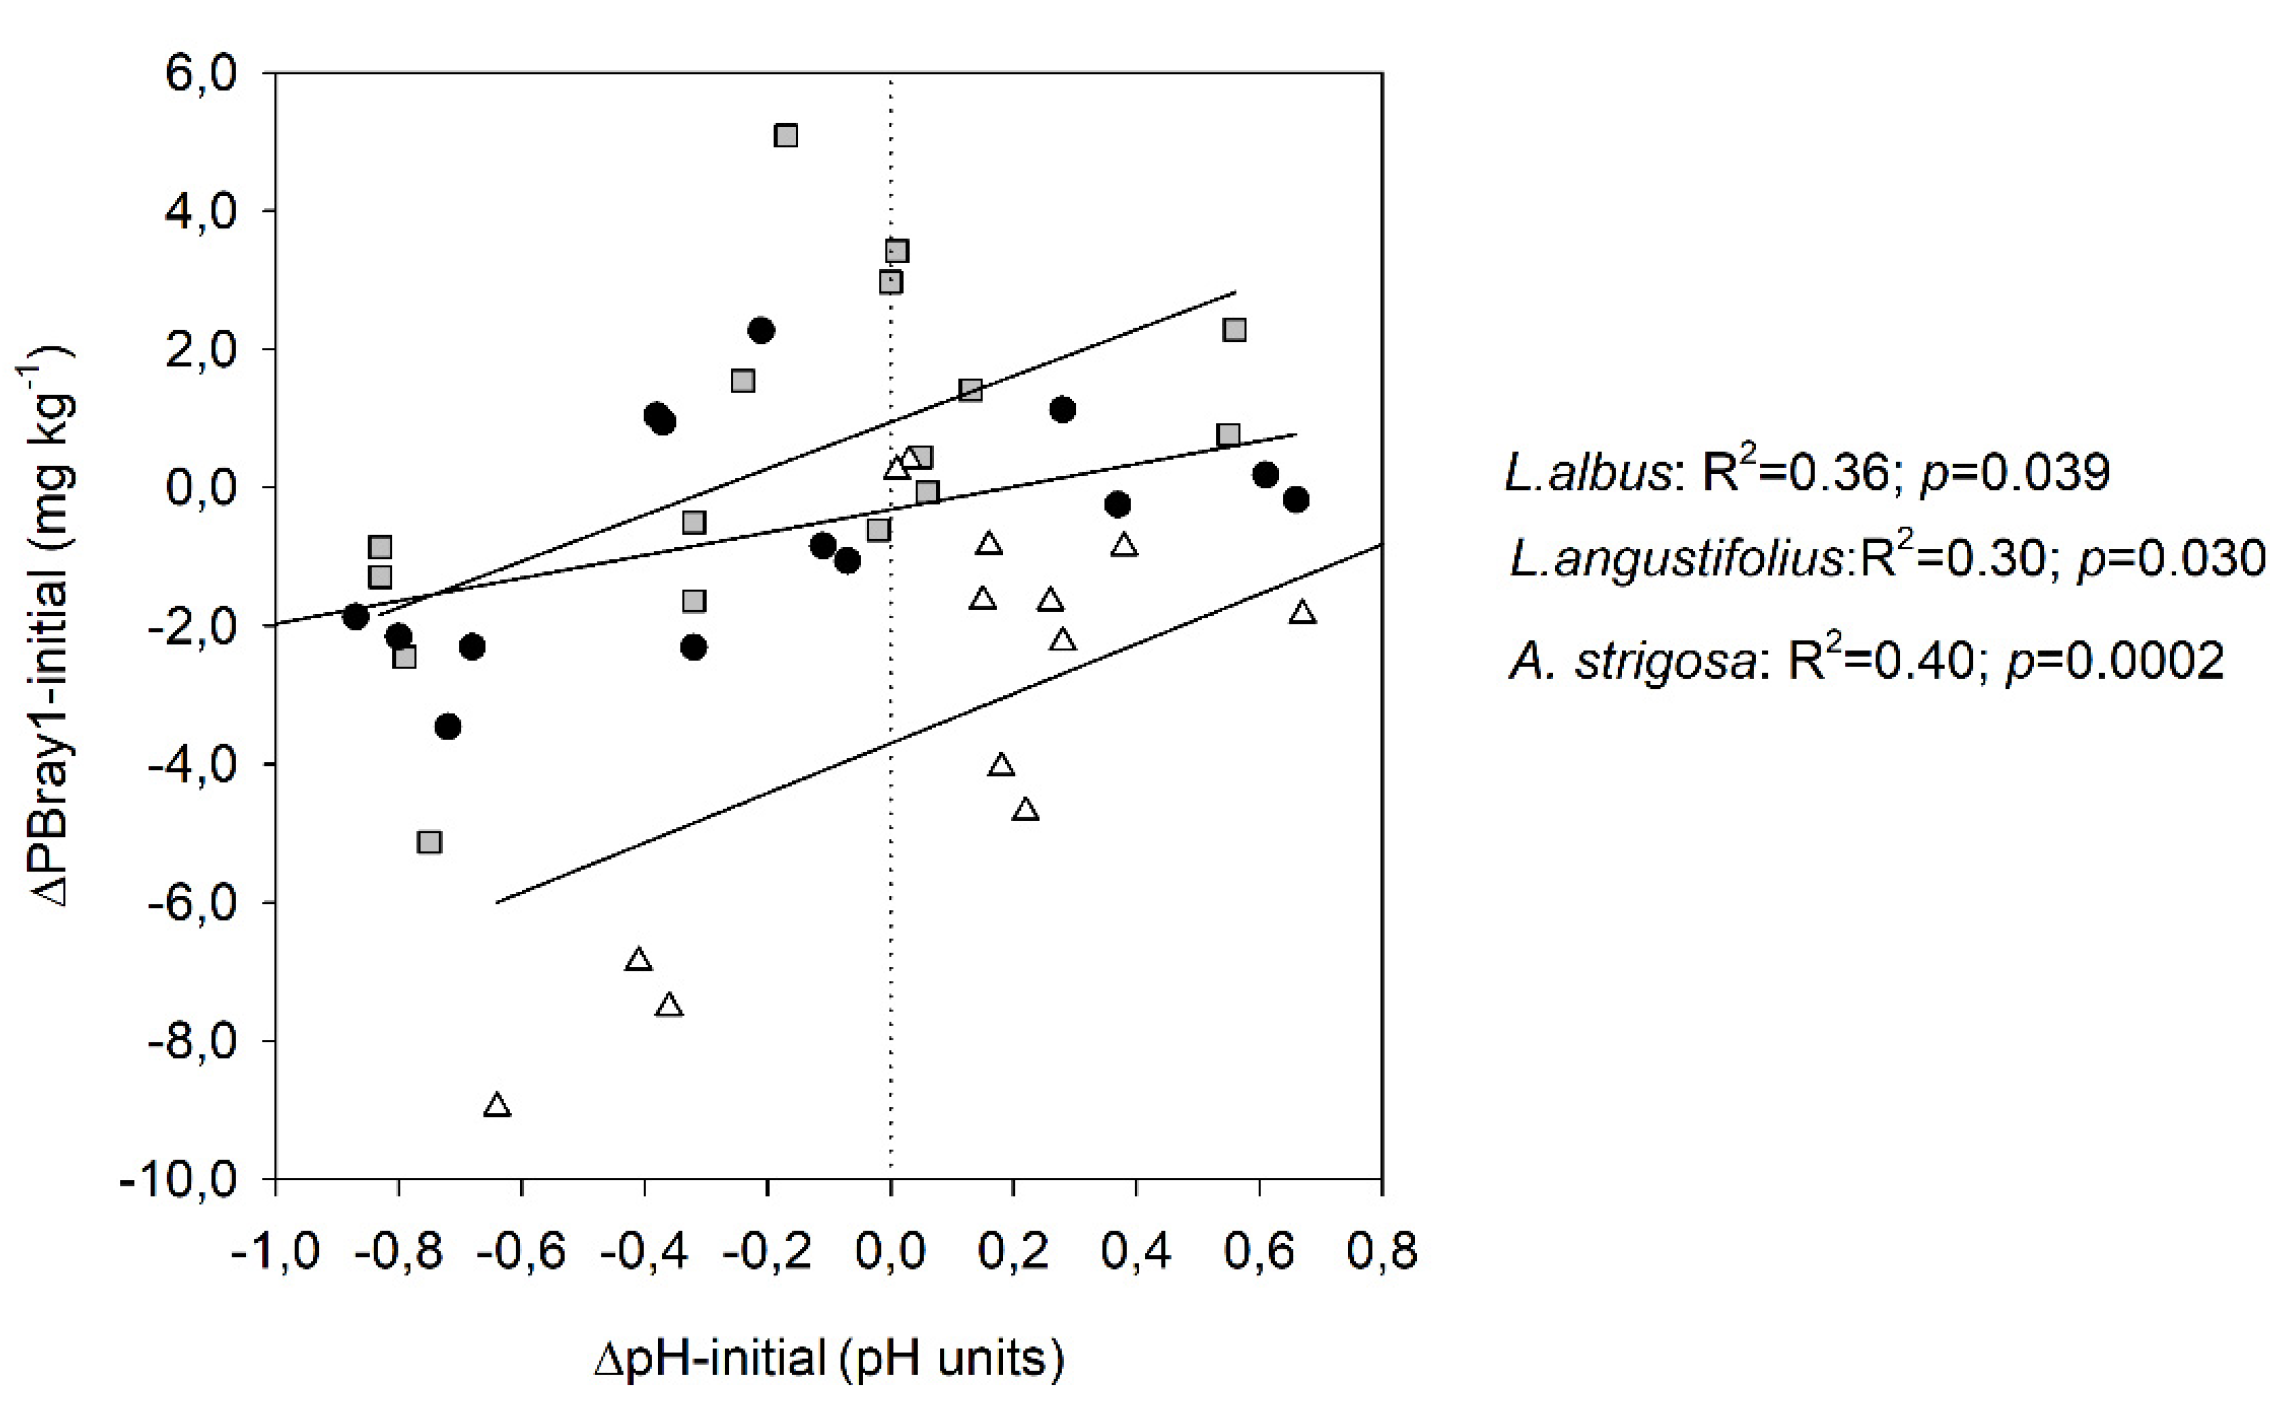
The correlations between several soil and plant variables revealed a moderate, yet significant (p= 0.0001) positive relationship between plant N and P content (Table 7). This correlation increased to 0.90 (p= 0.0001) and 0.65 (p= 0.0068) when the legumes and oats data sets were separated. Shoot dry weight and shoot P and N contents were also positively related to the soil PBray1 availability at 48 dap and negatively related to the ∆pH-initial (Table 7). This last finding suggests that a pH drop, relative to its initial value, increased P and N uptake. In addition, the relationships between ∆pH-initial and ∆PBray1-initial depicted in Figure 4 displayed a positive association at each species, showing that when the pH decreased (soil acidification), PBray1 availability at harvest diminished, compared to its initial value. This outcome can be linked to the significant negative correlation (-0.59, p <0.001) between plant P content and ∆pH-initial (Table 7).
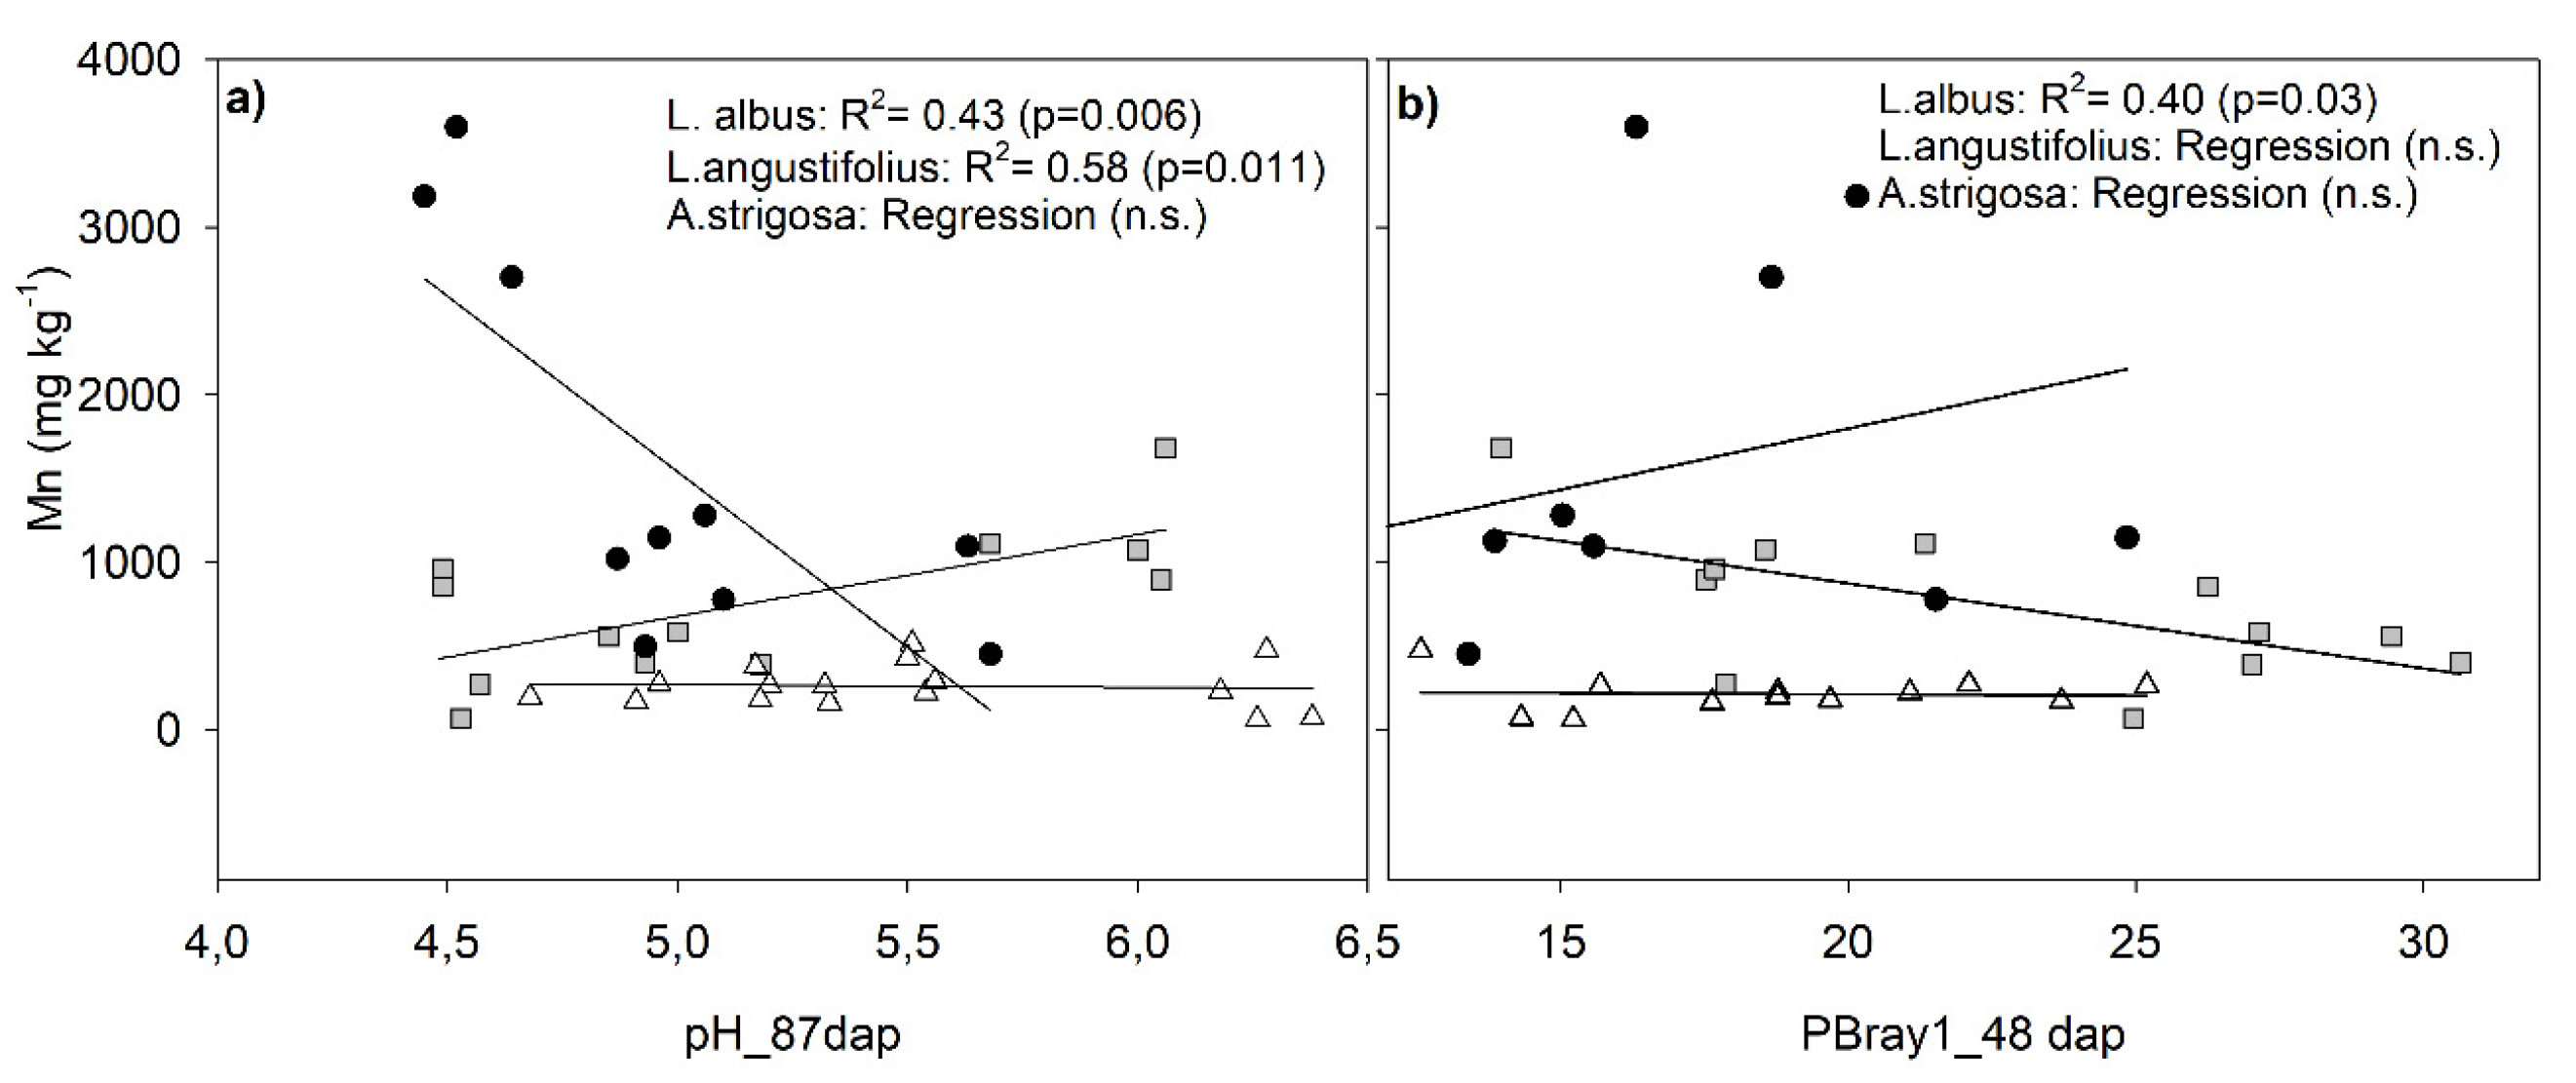
The study also revealed a notable inverse relationship between plant Fe concentration and PBray1, and a direct relationship between PBray1 and plant P content. Additionally, a significant positive association was detected between plant Fe concentration and the soil ∆pH-initial. The first two associations establish a positive relationship between soil P availability and plant P content while indicating a negative relationship between plant Fe concentration and soil P availability. Conversely, the final association suggests that an increase soil pH was associated with an increase in plant Fe concentration. The concentration of Mn in plants, on the other hand, exhibited a weak and inverse correlation with the soil ∆pH-initial, suggesting that as the soil becomes more acidic within the range of pH values examined (4.5-6.4 units), the soil Mn solubility would increase (Table 7). Nevertheless, when analizyng by species, the correlation was statistically significant for both lupines but positive (r=0.66, p= 0.006) for L. albus and negative (-0.76, p=0.011) for L. angustifolius (Figure 5a and Supplementary material: Table S5). In contrast, no significant correlation was observed between these factors in the case of oats due to the consistent manganese (Mn) concentration across sites (Figure 5 a and b).

4. Discussion

4.1. Variations in Soil PBray1 Concentration throughout the Plant Growth Cycle

Considering the potential for soil disturbance during the initial stages of the experiment, the observed increase in PBray1 48 days after planting (dap) may be primarily attributed to the mineralization of organic P. The amount of OM present in each soil would explain the extent of this increase in the soil available P levels (Figure 1, Table 2), with the most significant increase detected in Site 1 and Site 2, which presented higher OM contents than the other two sites. Interestingly, by 76 dap, the available P in the soil began to stabilize, i.e., returning to pre-experimental levels. This suggests that the mineralized organic P was either absorbed by the plants or retrograded in the soil.
The P mineralization processes in each soil, as well as the species’ability in to meet their P requirements relative to the availability of inorganic P, might partially explain the variations in soil PBray1 at different stages throughout the experiment. Biological factors, including soil biological activity, significantly influence the solubility (accessibility) of organic P forms. Addiotionally, biochemical factors, such as the hydrolysis rates of extracellular phosphatase enzymes, play a role in controlling P demand relative to its availability in the soil [33]. Other physical factors which may have changed at the beginning of the experiment, such as variations in soil moisture, drying conditions, and aggregate stability, may have facilitated the mineralization of organic P [33]. This could partially account for the increase in PBray1 at 48 dap, particularly in soils with higher organic matter content, like those at Site 1 and Site 2 (Figure 1, Table 2).
At 87 dap, both species and soil type had a highly significant effect on the availability of PBray1, although there was no interaction between these factors. At this stage, Lupine-growing soils had a significantly higher mean value of PBray1 (p=0.0001) compared to oat-growing soils (10.7 mg kg-1 vs. 8.1 mg kg-1, respectively). For soils planted with lupine, the change in soil PBray1 relative to its initial concentration was agronomically negligible. In contrast, in the oat-planted soils, the decrease reached 2.8 mg kg-1, a reduction similar to the difference between lupine and oats described above. These results suggest that the lupine species were able to solubilize plant-unavailable residual P forms, consequently maintaining an equilibrium level and were not depleted by plant absorption, whereas the absorption by oats reduced the amount of available P.
When comparing soils, ∆PBray1-initial was similar across most soils, except Site 2, which diminished by 4.0 mg kg-1 (Figure 1). The higher soil buffering capacity in Site 1 and Site 3 (higher clay content, OM, and cation exchange capacity) may account for the lower PBray1 variation. Conversely, the minimal change in Site 4 could be due the generally poor performance of the crops, particularly L. angustifolius, which exhibited the lowest shoot dry weight and P uptake (Table 4).
Site 2 and Site 4 demonstrated the most remarkable differences in ∆PBray_Lup-Oat, which could be attributed to the higher P biomass attained by oats at Site 2 (Table 5). The loamy texture, moderate clay and OM content of Site 2, suggests a lower P adsorption capacity, leading to a higher equilibrium concentration of P in this soil compared to Site 1 and Site 3. Moreover, this site had the highest PBray1 concentration at the start of the experiment (Table 2), which can be partially attributed to organic P sources, ensuring a more consistent and substantial P supply for plants.
At 103 dap, PBray1 concentration in the fine-textured soils with lupine, compared with those oat, was only significant for one species of lupine: L. albus in Site 1 and L. angustifolius in Site 3 (Figure 2). In the loamy textured soils (Site 2), however, a significant difference was observed with both lupine species, indicating the greater capacity of these species to modulate P availability in soils with lower buffer capacity for this nutrient. Depending on species and soil, the ∆PBray_Lup-Oat ranged from 0.9 (not a significant difference) to 5.4 mg kg-1. Assuming an equivalent fertilizer value of 10 kg ha-1 of P2O5 (average value used as equivalent fertilizer for Uruguayan soils according to Hernández and Zamalvide, 1998), the highest increase in P availability due to lupine, which occurred in Site 2, would be equivalent to 54 kg ha-1 of P2O5 [34]. This increase in soil PBray1 availability would significantly contribute to systems with a high proportion of P-extractive crops, leading to a considerable reduction in the application of P fertilizers. However, the species effect was also affected by soil type, as lupine plants grew better in sites with higher PBray1 availability (Sites 1, 2, and 3) and greater soil fertility (high OM and high exchangeable cations). Although PBray1 availability varied between Sites 1, 2, and 3, there were no significant differences in shoot biomass within each lupine species across these soils. However, for oats, these sites exhibited significant differences in aboveground biomass and plant N and P content, indicating that an additional factor (N availability) impacted differently in the performance of these species across soil types.

4.2. Changes in Soil pH and Acidity and Their Relationship with Plant Available P

The negative correlation (r= -0.61) between the concentration of PBray1 at harvest and the difference in pH from the initial pH would indicate that the availability of PBray1 in the soil increases with the degree of acidification within the pH range of soil samples (4.5 to 6.4 units). This result was unexpected in acidic soils, given that it has been reported that the P-adsorption capacity of Fe and Al oxides increases with decreasing pH [35]. However, other studies have shown that lowering the pH of acidic soils can also increase the solubility of soil P [36]. The proposed explanation is that competitive adsorption of sulfate ions would significantly increase with decreasing pH, leading to a higher equilibrium P concentration at an acidic pH of approximately 4-5 compared to a pH of 6-7 [35]. When the data were analyzed, the magnitude and direction of pH change varied according to soil type (Figure 3).
Even though lupine increased the PBray1 availability in all soils, the species effect alone could not entirely explain such an increase in P by soil acidification, suggesting that another factor associated with the species, and not the change in soil pH, could account for the differences in PBray1 availability among species [37]. In this regard, it is crucial to recognize that variations in a species' capacity to obtain P can be attributed to the inherent traits of each species. For example, during the exudation process of organic acid anions into the rhizosphere, the efflux of these anions may be accompanied by the concomitant release of H+ or K+ ions as counter ions, as previously addressed by Hinsinger (2001). Consequently, concomitant soil acidification might occur if H+ rather than K+ accompanies the exudation of organic acid anions to balance charges [35]. Additionally, the variation in P acquisition ability may also be influenced by changes in the oxidation-reduction conditions of the rhizosphere [38]. Furthermore, morphological modifications in root architecture and the development of specialized structures such as proteoid or cluster roots can also contribute to these differences [39,40]. While our study did not directly measure the contribution and composition of root exudates of organic acids, we consider this trait indirectly based on the Mn concentration, proposed as an index of carboxylate concentration in the rhizosphere under low soil P availability conditions [16]. The subsequent section of this paper will delve further into this subject matter.
Another aspect contributing to variations in soil pH during the experiment is the process of biological nitrogen fixation. This process might explain the lupine-induced acidification of the soil. Consequently, plants that rely on N2 fixation can access poorly soluble sources of P and micronutrients, as demonstrated in our study, with higher levels of plant Mn concentrations in lupine species compared to oats. Legumes also absorb more cations than anions, resulting in the rhizosphere's exudation of protons and acidification [35]. For instance, P deficiency in L. albus stimulates proton release and citrate root exudation by the proteoid roots of this species, along with the inhibition of nitrate uptake [41,42]. The lower pH values of the soil with lupine compared to oats were consistent with the findings of other studies indicating that legumes have a greater acidification capacity of the soil rhizosphere than grasses (Figure 4). Both lupine species contributed to pH fluctuations in different soil types showing comparable trends in acidification levels, except for Site 3. At Site 3, L. albus had a minimal influence on soil pH. This discrepancy could be attributed to differences in the inherent characteristics of the species, as mentioned above (L. albus is a cluster root-forming legume and grows well in strongly acidic soils and mildly acid to neutral soils). Lupinus angustifolius, on the contrary, does not form cluster roots and is sensitive to calcareous soil, displaying a preference for acidic soil conditions. Additionally, lupines' exudation of organic acid anions may or may not be linked to soil acidification, as these processes self-regulate independently [43]. Consequently, the growth of L. angustifolius in the soil of Site 3 may have induced changes in their rhizosphere that resulted in a decrease of soil pH by an average of 0.6 units compared to the initial soil pH. This decline in pH, caused by a net release of protons, may have occurred as a compensatory mechanism to counterbalance the elevated uptake of cations, particularly pronounced in this lupine species (Table 6). The high concentration of cations in the aboveground biomass of L. angustifolius in this study was consistent with previous studies [44,45].
When oats were cultivated, all soils (except Site 2 in three of four replications) experienced an increase in pH compared to the initial values, with the Site 4 soil experiencing an increase of nearly one pH unit (Figure 3). Wang et al. (2016), in a rhizotrons study with Avena sativa, also found that the soil pH increased compared to the control soil (without plants). In their study, despite having the lowest acid phosphatase activity, oats absorbed the same amount of P as species with high phosphatase activity and decreased rhizosphere pH. They attributed this result to the extensive root mass and high arbuscular mycorrhizal colonization, which contributed to the high P absorption of oats [46]. We did not investigate the morphology or other aspects of the roots in our study, but this explanation would be valid for our experiment. Additionally, we can partially explain the pH change trends in oats-bearing soils based on an imbalance of cation-anion uptake (mainly influenced by the N source, Table 2). In Site 2, ammonium was the predominant form of N, and its absorption by oats would account for soil acidification in this case [47]. However, the increased uptake of N in the form of nitrate would increase the absorption of H+, consequently promoting soil alkalinization [47]; this would explain the increase in soil pH with oats in the acidic soil of Site 4.

4.3. Plant Growth and Nutrition in Relation to the Soil Chemical Properties

4.3.1. Shoot Dry Weight and P and N in Shoot Biomass

The soil by species significant interaction for shoot dry weight and plant P and N content indicated that the performance of the species varied with soil type. The proportion and amount of N measured in aerial biomass derived from the air for lupine fall within the reported ranges of 44 to 95% and 147 to 400 kg ha-1, respectively [48]. Furthermore, studies indicate that the amount of N fixed by L. albus is, in most cases, higher than that of L. angustifolius, as evidenced by our research [18,49]. The wide variation between soils in the quantity of fixed N (60-240 mg pot-1, or approximately 30-140 kg N ha-1) reflects the varying levels of natural fertility among soils. The N fixed in biomass also varied between species (105 - 240 mg pot-1, approximately 60-130 kg N ha-1; p= 0.0001), indicating that lupines have different soil requirements that mainly affect the shoot dry weight. In addition to solubilizing non-labile forms of P, the N from the BNF capacity is an additional benefit of the lupine genus; this contribution of N to the system would facilitate the balancing of N losses that occur during agricultural cycles.
Regarding P concentrations, whatever the species considered, there were significant differences across sites, particularly with Site 4 where the concentrations were, on average, half of those registered in the other sites. Lupinus angustifolius plants were examined for P content in the grain-filling initial stage (87 dap). In our study, the P concentrations measured in shoots neared the critical P concentration, 1.75 mg g-1, needed to achieve 90% of the optimum yield potential [50]. Previous studies found that L. albus and L. angustifolius required 2.2 and 2.3 mg g-1 of P, respectively [39,45]. However, these critical P values were determined in plants taken before flowering, an earlier growth state than the one established in our investigation. According to Bolland and Brennan (2008), L. albus plants had P concentrations below the critical threshold for optimum development. However, the shoot P concentration of this lupine species was below 2.0 mg g-1 a level that typically stimulates cluster root development [51]. Concerning oats, plant P concentration would be adequate for their mature stage, which oscillates between 1.0- 1.5 mg g-1 [52]. Furthermore, it was observed that all concentrations of P, regardless of the species, were lower than 2.0 mg P g-1 dry weight. This finding also implies that the shoot biomass decay will probably lead to limited soil P availability from an agronomic perspective due to P immobilization in microbial biomass, as Hallama et al., (2019) noted [16]. The lowest plant growth, P uptake and BNF values were observed at Site 4, particularly with lupine species. Even though lupine species have adapted to acidic soils, Site 4 had several growth-limiting factors that prevented this genus from thriving as well as it did at the other sites. Lupinus angustifolius exhibited reduced growth and accelerated senescence of leaves, and both lupine species showed lower plant P and K concentrations in Site 4 compared to other sites with higher soil PBray1, OM, and K concentration. The poor performance of lupines in the soil of Site 4, which experienced severe P deficiency, can be linked to the disruption in their ability to balance the carbon costs involved with cluster root development and nodulation [53,54].
The high soil PBray1 availability at harvest in soil containing L. albus might suggest a P-sparing effect of this species. However, during the growing phase, the amounts of P taken up by L. albus were, in most cases, comparable to and even higher than those taken up by oats. Although significantly higher amounts of PBray1 were present at harvest in soils containing L. albus than in soils under oats, we can conclude that the differences are not due to variations in P uptake but instead to the "rhizosphere effect" induced or driven by specifically L. albus. The highest effect of L. albus on the increase in PBray1 availability detected in our research is consistent with the literature. Neumann et al. (1999) stated that this species employs diverse mechanisms to fulfill its P requirements in nutrient-deficient environments [55]. This species exudes a high concentration of organic acids (citric and malic) sufficient to mobilize significant amounts of scarcely available P sources (Ca, Al, and Fe phosphates), primarily via chelation of the bound cations to P or by competition for P adsorption sites in the soil matrix [56]. Another mechanism involved in efficiently mobilizing inorganic P from organic P forms would be the activity of acid phosphatases secreted by the roots of L. albus [33].
The negative relationship between the amount of P biomass and the ∆pH-initial indicated that the P absorption increased with the degree of acidification consistent with other studies [36,37,57]. On average, plant P content was higher in L. albus and oats (14 mg pot-1) than in L. angustifolius (7.9 mg pot-1), mainly due to the low biomass yield of the latter species. Additionally, the accumulated N and P amounts were positively associated with the availability of PBray1 (r=0.50 and 0.45, respectively) at harvest (87 dap) and negatively associated with the ∆pH-initial (r= -0.56 and -0.59, respectively), suggesting that N and P absorption increased with available soil P and with soil acidification (Table 7). This last association explains the negative correlation between the ∆pH-initial and the PBray1 available in the soil (r= -0.61); that is, the lower ∆pH-initial values were associated with higher concentrations of available P at harvest, although this correlation was more pronounced in soils containing oats.

4.3.2. Base Cation and Mn Concentration in Shoot Biomass

Lupinus angustifolius reached higher levels of base cation than L. albus, as observed by other researchers [45], although, for K, there were no statistically significant differences between species at each site. Plant total cation concentrations within each species also differ across soils. However, such differences were exclusively detected with L. albus, with the lowest concentration in plants cultivated in sites 2 and 4, whose soils corresponded to strongly desaturated base cations. Nevertheless, these last two soils differed widely in pH and OM content. For the plant cation concentration in the lupine genus in our experiment and based on previous research[45,58], it would indicate that plant nutrition was adequate in sites 1, 2, and 3, and insufficient to cover lupine’s requirements in Site 4.
The effect of lupine on pH-induced changes had a remarkable impact on plant micronutrient concentrations such as Mn and Fe. Mn concentrations were significantly higher in both lupine species than in oats (Table 6), with L. albus and L. angustifolius registering mean values of 710 and 1510 mg kg-1, respectively, which represent approximately three and seven times the concentration in oats (228 mg kg-1). Previous studies have also documented significant accumulations of Mn in the lupine species [38,40]. These high concentrations of foliar Mn may be deleterious to other organisms or species, but the lupine genus tolerates them. Other studies have also suggested that plants using a P mobilization strategy based on the release of carboxylates tend to have elevated Mn concentrations in their leaves [38] because carboxylates mobilize both inorganic and organic P from the soil as well as micronutrients [59]. Modifications in soil acidity or the oxidation/reduction conditions of the rhizosphere can also enhance the increased uptake of Mn [38]. Previous research has established a negative correlation between citrate exudation and plant P status, which was perceived clearly with L. albus species [60]. In that regard, in our study and excluding the soil with several growth limitation factors (Site 4), the highest Mn concentration of plants of L. albus was associated with those plants that had the lower P concentration and that grew in the soil of Site 3 (Table 6), which had lower PBray1 availability and higher pH than sites 1 and 2 (Table 2). In contrast, L. angustifolius plants that were found to have the highest concentration of Mn were those growing in the soil of Site 2, which exhibited the highest initial PBray1 concentration (Table 2). The findings presented in this study are consistent with the results reported by Monei et al. (2022), who also noted a divergent response between the two lupine species [61]. Specifically, those authors found that L. albus exhibited a high release of carboxylates in conditions of P deficiency, whereas L. angustifolius responded with the highest release of carboxylates when the soil had a high P-level supply. Although there was no clear relationship between Mn concentrations and plant P content or soil P availability in all species across all sites in the current study (Figure 5), there was a significant association between soil acidity measured at harvest and Mn concentration; however, it was noticeably opposing between lupine species (Figure 5a). The correlation between these last variables was statistically significant but positive (r=0.66) for L. albus and negative (-0.76) for L. angustifolius (Figure 5a and Supplementary material: Table S5), indicating that exudation of organic acid anions was concomitant with soil acidification solely in soils containing L. angustifolius . Previous research confirmed that lupines' exudation of organic acid anions may or may not be linked to soil acidification, as these processes self-regulate independently [43]. These findings suggest that the exudation of carboxylates by L. angustifolius in the soil is constitutive, similar to what was reported by Pang et al. (2018) for chickpea species (Cicer arietinum L.), a non-cluster root-forming crop [62]. In contrast, the exudation of carboxylates by L. albus would be inducible as Mn concentration changed in response to PBray1 availability (clearly seen with L. albus across sites 1, 2, and 3 in Figure 5b).

5. Conclusions

Lupine species increased PBray1 availability in all soils compared to those with oats; with increments ranged from 0.9 to 5.4 mg kg-1 depending on species, sampling time, and soil type. However, the increase in PBray1 attributed to lupine-induced soil acidification was insufficient to fully explain the observed rise in P, as there was no consistent association between the increase in labile P and a decrease in soil pH due to the divergent strategy in the acquisition of P by lupine species. Another potential mechanism that may account for the rise in soil P availability could be explained by lupine species' excretion of organic acids. In the present study, lupines exhibited a higher uptake of Mn than oats, indirectly substantiating the exudation process of organic acid anions into the rhizosphere. The high Mn concentration for plants of L. albus was linked to soils with high pH and low P availability, whereas L.angustifolius was linked to light-textured soils with high P content and low pH. The soils under oats tended to maintain or even increase pH compared to the original values, and there were no differences in Mn uptake by oats across soils. Although the results of this work are coincident with previous studies, it highlights an exciting finding: it confirms the divergent mechanism in P-acquisition strategies of two lupine species utilizing the plant Mn concentration as a proxy for carboxylate concentration in the rhizosphere.
This research contributes to understanding how species and soil type affect P mobilization and nutrient uptake and helped us inquire about plant-soil interactions. It also emphasizes that plants significantly affect rhizosphere P availability. Considering the lower P requirements of lupine compared with other crops, such as canola or wheat, using this species would also alleviate the pressure of phosphate fertilizers, reducing the potential risk of P losses and subsequent contamination of water courses. Comparing these results with those obtained with this species in the field would be necessary to determine the robustness of patterns identified in the soil P cycling by the presence of lupine in contrasting soil types under pot experiment conditions. The knowledge generated regarding two lupine species is a central aspect for enhancing the diversification of agricultural farm systems with new crop functional types beyond wheat and barley. This aligns with Uruguayan governmental policies addressing soil deterioration and water contamination concerns that weaken the ecosystem services and, hence, agricultural systems sustainability.

Supplementary Materials

The following supporting information can be downloaded at the website of this paper posted on Preprints.org, Table S1: ANOVA for soil PBray1 concentration at 103 days after planting; Table S2: ANOVA for soil pH at 87 days after planting; Table S3: Orthogonal contrasts for Biomass measurements; Table S4: Mean values of BNF proportion (% BNF) and N fixed content of lupines as affected by species and soil type; Table S5: Pearson correlation coefficients (r) within each species across all four soil types.

Author Contributions

Conceptualization, C.M.A. and C.P.V..; methodology, C.M.A., and A.B.G.; formal analysis, C.M.A., C.P.V., P.G.B., and A.dP.M.; investigation, C.M.A., and A.B.G.; resources, C.M.A.; data curation, C.M.A., C.P.V., P.G.B., and A.dP.M.; writing—original draft preparation, C.M.A., C.P.V., P.G.B., A.B.G., and A.dP.M.; writing—review and editing, C.M.A., C.P.V., P.G.B., and A.dP.M.; visualization, C.M.A., and A.dP.M.; supervision, A.dP.M., and C.P.V.; project administration, C.M.A.; funding acquisition, C.M.A., C.P.V, and A.dP.M.. All authors have read and agreed to the published version of the manuscript.

Funding

This research was funded by National Research and Innovation Agency of Uurguay, Funds: María Viñas, grant number ANII: FMV_1_2017_1 135487. The APC was funded by the National Research of our Institution University of the Republic (UdelaR, Uruguay).

Acknowledgments

The authors express their gratitude to N. Di Muro, and B. Romano for their assistance in conducting the greenhouse experiment and laboratory work.

Conflicts of Interest

The authors declare no conflict of interest.

References

  1. Vassallo, M. Dinámica y competencia intrasectorial en la agricultura uruguaya: los cambios en la última década. Agrociencia 2013, 17(2), 170–179. [CrossRef]
  2. Ernst, O. R.; Dogliotti, S.; Cadenazzi, M.; Kemanian, A. R. Shifting crop-pasture rotations to no-till annual cropping reduces soil quality and wheat yield. Field Crops Research 2018, 217, 180–187. [CrossRef]
  3. Ernst, O. R.; Kemanian, A. R.; Mazzilli, S. R.; Cadenazzi, M.; Dogliotti, S. Depressed attainable wheat yields under continuous annual no-till agriculture suggest declining soil productivity. Field Crops Research 2016, 186, 107–116. [CrossRef]
  4. 4. Ministerio de Agricultura y Pesca (MGAP). DIEA presenta los resultados de la Encuesta Agrícola “Invierno 2021”. Available online: https://www.gub.uy/ministerio-ganaderia-agricultura-pesca/datos-y-estadisticas/estadisticas/diea-presenta-resultados-encuesta-agricola-invierno-2021.
  5. Beretta-Blanco, A.; Pérez, O.; Carrasco-Letelier, L. Soil quality decrease over 13 years of agricultural production. Nutrient Cycling in Agroecosystems 2019, 114(1), 45–55. [CrossRef]
  6. 6. Ernst O, Siri-Prieto G (2009) Impact of perennial pasture and tillage systems on carbon input and soil quality indicators. Soil Tillage Res 105:260–268. [CrossRef]
  7. Cano, J. D.; Ernst, O. Balance aparente de fósforo en rotaciones agrícolas del litoral oeste del Uruguay 1. Informaciones Agronómicas 2005, 32, 8–11.
  8. Syers, J. K.; Johnston, A. E.; Curtin, D. Efficiency of soil and fertilizer phosphorus use: reconciling changing concepts of soil phosphorus behaviour with agronomic information. FAO fertilizer and plant nutrition bulletin. 2008, p 128.
  9. Menezes-Blackburn, D.; Giles, C.; Darch, T.; George, T. S.; Blackwell, M.; Stutter, M.; et al. Opportunities for mobilizing recalcitrant phosphorus from agricultural soils: a review. Plant and Soil 2018, 427(1–2), 5–16. [CrossRef]
  10. Richardson, A. E.; Barea, J. M.; McNeill, A. M.; Prigent-Combaret, C. Acquisition of phosphorus and nitrogen in the rhizosphere and plant growth promotion by microorganisms. Plant and Soil 2009, 321(1–2), 305–339. [CrossRef]
  11. Kamh, M.; Abdou, M.; Chude, V.; Wiesler, F.; Horst, W. J. Mobilization of phosphorus contributes to positive rotational effects of leguminous cover crops on maize grown on soils from northern Nigeria. Journal of Plant Nutrition and Soil Science 2002, 165(5), 566–572. [CrossRef]
  12. Lambers, H.; Clements, J. C.; Nelson, M. N. How aphosphorus-acquisition strategy based on carboxylate exudation powers the success and agronomic potential of lupines (Lupinus,Fabaceae). American Journal of Botany 2013, 100(2), 263–288. [CrossRef]
  13. AyaIa, W.; Barrios, E.; Macedo, I.; Sawchik, J.; Terra, J. Scouting benefits and developing innovations in temperate grassland to sustainable agriculture production. In Sustainable use ofgrassland resources for forage production, biodiversity and environmental protection: Proceedings of23,d International Grassland. Vijay, D., Srivastava, M. K, Gupta, C. K, Malaviya, D. R., Roy, M. M., Mahanta, S. K, S., J. B., Maity, A. and P. K. G. (Eds)., Eds.; 2015; pp 208–214.
  14. Fontaine, S.; Abbadie, L.; Aubert, M.; Barot, S.; Bloor, J. M. G.; Derrien, D.; et al. Plant–soil synchrony in nutrient cycles: Learning from ecosystems to design sustainable agrosystems. Global Change Biology 2023, 30(1). [CrossRef]
  15. Kirkegaard, J.; Christen, O.; Krupinsky, J.; Layzell, D. Break crop benefits in temperate wheat production. Field Crops Research. June 3, 2008, pp 185–195. [CrossRef]
  16. Hallama, M.; Pekrun, C.; Lambers, H.; Kandeler, E. Hidden miners – the roles of cover crops and soil microorganisms in phosphorus cycling through agroecosystems. Plant and Soil 2019, 434(1–2), 7–45. [CrossRef]
  17. Mera, M.; Lizana, X. C.; Calderini, D. F. Cropping systems in environments with high yield potential of southern Chile. In Crop Physiology: Applications for Genetic Improvement and Agronomy: Second Edition; 2015; pp 111–140. [CrossRef]
  18. Espinoza, S.; Ovalle, C.; Zagal, E.; Matus, I.; Tay, J.; Peoples, M. B.; et al. Contribution of legumes to wheat productivity in Mediterranean environments of central Chile. Field Crops Research 2012, 133, 150–159. [CrossRef]
  19. Nuruzzaman, M.; Lambers, H.; Bolland, M. D. A.; Veneklaas, E. J. Phosphorus uptake by grain legumes and subsequently grown wheat at different levels of residual phosphorus fertiliser. Australian Journal of Agricultural Research 2005, 56(10), 1041–1047. [CrossRef]
  20. Wolko, B.; Clements, J. C.; Naganowska, B.; Nelson, M. N.; Yang, H. Lupinus; Kole, C., Ed.; Springer Berlin Heidelberg: Berlin, Heidelberg, 2011. [CrossRef]
  21. 21. Soil Survey Staff. Keys to soil taxonomy. Soil Conservation Service. 2014, p 410. <http://www.nrcs.usda.gov/Internet/FSE_DOCUMENTS/nrcs142p2_051546.pdf>.
  22. Nelson, D. W., & Sommers, L. E. Total Carbon, Organic Carbon, and Organic Matter. In Methods of Soil Analysis. D.L. Sparks, A.L. Page, P.A. Helmke, R.H. Loeppert, P.N. Soltanpour, M.A. Tabatabai, C. T. J. and M. E. S., Ed.; 1996. [CrossRef]
  23. Thomas, G. W. Exchangeable Cations. In Methods of Soil Analysis. Page, A., Ed.; 1983; pp 159–165. [CrossRef]
  24. Lajtha, K.; Driscoll, C. T.; Jarrell, W. M.; Elliott, E. T. Soil phosphorus: characterization and total element analysis. Standard Soil Methods for Long Term Ecological Research 1999, 115–143.
  25. Rabuffetti, A. La fertilidad del suelo y su manejo. Montevideo: Hemisferio Sur 2017.
  26. Keeney, D. R.; Nelson, D. W. Nitrogen-Inorganic Forms. In Methods of Soil Analysis, Agronomy Monograph 9, Part 2. Page, A., Ed.; wiley, 1983; pp 643–698. [CrossRef]
  27. Weatherburn, M. W. Phenol-Hypochlorite Reaction for Determination of Ammonia. Analytical Chemistry 1967, 39(8), 971–974. [CrossRef]
  28. Gee, G. W.; Bauder, J. W. Particle Size Analysis by Hydrometer: A Simplified Method for Routine Textural Analysis and a Sensitivity Test of Measurement Parameters. Soil Science Society of America Journal 1979, 43(5), 1004–1007. [CrossRef]
  29. Shearer, G.; Kohl, D. H. N2-fixation in field settings: estimations based on natural 15N abundance. Australian Journal of Plant Physiology 1987, 13(6), 699–756. [CrossRef]
  30. Murphy, J.; Riley, J. P. A modified single solution method for the determination of phosphate in natural waters. Analytica Chimica Acta 1962, 27(C), 31–36. [CrossRef]
  31. Jones, J. B.; Case, V. W. Sampling, handling, and analyzing plant tissue samples. In Soil Testing and Plant Analysis; wiley, 2018; pp 389–427. [CrossRef]
  32. Team, R. C. A Language and Environment for Statistical Computing. R: A Language and Environment for Statistical Computing. 2017, p https://www.R-project.org. <http://www.r-project.org>.
  33. Condron, L. M.; Turner, B. L.; Cade-Menun, B. J. Chemistry and dynamics of soil organic phosphorus. Phosphorus: Agriculture and the Environment 2015, 87–121. [CrossRef]
  34. Hernández, J.; Zamalvide, J. Procesos de retención de fosforo por los suelos evaluados a través de parámetros de suelo y planta. Agrociencia 1998, 2, 48–63.
  35. Hinsinger, P. Bioavailability of soil inorganic P in the rhizosphere as affected by root-induced chemical changes: A review. In Plant and Soil; 2001; Vol. 237, pp 173–195. [CrossRef]
  36. Barrow, N. J. The effects of pH on phosphate uptake from the soil. Plant and Soil 2017, 410(1–2), 401–410. [CrossRef]
  37. Barrow, N. J.; Hartemink, A. E. The effects of pH on nutrient availability depend on both soils and plants. Plant and Soil 2023, 487(1–2), 21–37. [CrossRef]
  38. Lambers, H.; Hayes, P. E.; Laliberté, E.; Oliveira, R. S.; Turner, B. L. Leaf manganese accumulation and phosphorus-acquisition efficiency. Trends in Plant Science. Elsevier Ltd February 1, 2015, pp 83–90. [CrossRef]
  39. Pearse, S. J.; Veneklaas, E. J.; Cawthray, G. R.; Bolland, M. D. A.; Lambers, H. Carboxylate release of wheat, canola and 11 grain legume species as affected by phosphorus status. Plant and Soil 2006, 288(1–2), 127–139. [CrossRef]
  40. Watt, M.; Evans, J. R. Phosphorus acquisition from soil by white lupin (Lupinus albus L.) and soybean (Glycine max L.), species with contrasting root development. Plant and Soil 2003, 248(1–2), 271–283. [CrossRef]
  41. Neumann, G.; Römheld, V. Root excretion of carboxylic acids and protons in phosphorus-deficient plants. Plant and Soil 1999, 211(1), 121–130. [CrossRef]
  42. Shen, J.; Li, H.; Neumann, G.; Zhang, F. Nutrient uptake, cluster root formation and exudation of protons and citrate in Lupinus albus as affected by localized supply of phosphorus in a split-root system. Plant Science 2005, 168(3), 837–845. [CrossRef]
  43. Lambers, H.; Shane, M. W.; Cramer, M. D.; Pearse, S. J.; Veneklaas, E. J. Root structure and functioning for efficient acquisition of phosphorus: Matching morphological and physiological traits. Annals of Botany. October 2006, pp 693–713. [CrossRef]
  44. Brand, J. D.; Tang, C.; Rathjen, A. J. Adaptation of Lupinus angustifolius L. and L. pilosus Murr. to calcareous soils. Australian Journal of Agricultural Research 1999, 50(6), 1027–1033. [CrossRef]
  45. Kerley, S. J.; Shield, I. F.; Huyghe, C. Specific and genotypic variation in the nutrient content of lupin species in soils of neutral and alkaline pH. Australian Journal of Agricultural Research 2001, 52(1), 93–102. [CrossRef]
  46. Wang, Y.; Krogstad, T.; Clarke, J. L.; Hallama, M.; Øgaard, A. F.; Eich-Greatorex, S.; et al. Rhizosphere organic anions play a minor role in improving crop species’ ability to take up residual phosphorus (P) in agricultural soils low in P availability. Frontiers in Plant Science 2016, 7(November 2016). [CrossRef]
  47. Kirkby, E. A.; Le Bot, J.; Adamowicz, S.; Römheld, V. Nitrogen in physiology - An agronomic perspective and implications for the use of different nitrogen forms. Proceedings International Fertiliser Society 2009, 653, York, 1–48.
  48. Unkovich, M. J.; Baldock, J.; Peoples, M. B. Prospects and problems of simple linear models for estimating symbiotic N2 fixation by crop and pasture legumes. Plant and Soil 2010, 329(1), 75–89. [CrossRef]
  49. Unkovich, M. J.; Pate, J. S. An appraisal of recent field measurements of symbiotic N2 fixation by annual legumes. Field Crops Research 2000, 65(2–3), 211–228. [CrossRef]
  50. Bolland, M. D. A.; Brennan, R. F. Comparing the phosphorus requirements of wheat, lupin, and canola. Australian Journal of Agricultural Research 2008, 59(11), 983–998. [CrossRef]
  51. Li, H.; Shen, J.; Zhang, F.; Tang, C.; Lambers, H. Is there a critical level of shoot phosphorus concentration for cluster-root formation in Lupinus albus? Functional Plant Biology 2008, 35(4), 328–336. [CrossRef]
  52. Mengel, K.; Kirkby, E. A.; Kosegarten, H.; Appel, T. Principles of Plant Nutrition; Mengel, K., Kirkby, E. A., Kosegarten, H., Appel, T., Eds.; Springer Netherlands: Dordrecht, 2001. [CrossRef]
  53. Sulieman, S.; Tran, L. S. P. Legume Nitrogen Fixation in Soils with Low Phosphorus Availability: Adaptation and Regulatory Implication; 2017. [CrossRef]
  54. Pueyo, J. J.; Quiñones, M. A.; Coba de la Peña, T.; Fedorova, E. E.; Lucas, M. M. Nitrogen and Phosphorus Interplay in Lupin Root Nodules and Cluster Roots. Frontiers in Plant Science 2021, 12. [CrossRef]
  55. Neumann, G.; Massonneau, A.; Martinoia, E.; Römheld, V. Physiological adaptations to phosphorus deficiency during proteoid root development in white lupin. Planta 1999, 208(3), 373–382. [CrossRef]
  56. Fink, J. R.; Inda, A. V.; Bavaresco, J.; Barrón, V.; Torrent, J.; Bayer, C. Adsorption and desorption of phosphorus in subtropical soils as affected by management system and mineralogy. Soil and Tillage Research 2016, 155, 62–68. [CrossRef]
  57. Bouray, M.; Moir, J. L.; Lehto, N. J.; Condron, L. M.; Touhami, D.; Hummel, C. Soil pH effects on phosphorus mobilization in the rhizosphere of Lupinus angustifolius. Plant and Soil 2021, 469(1–2), 387–407. [CrossRef]
  58. Martínez-Alcalá, I.; Clemente, R.; Bernal, M. P. Metal availability and chemical properties in the rhizosphere of lupinus albus l. growing in a high-metal calcareous soil. Water, Air, and Soil Pollution 2009, 201(1–4), 283–293. [CrossRef]
  59. Ding, W.; Cong, W. F.; Lambers, H. Plant phosphorus-acquisition and -use strategies affect soil carbon cycling. Trends in Ecology and Evolution. 2021, pp 899–906. [CrossRef]
  60. Dessureault-Rompré, J.; Nowack, B.; Schulin, R.; Luster, J. Spatial and temporal variation in organic acid anion exudation and nutrient anion uptake in the rhizosphere of Lupinus albus L. Plant and Soil 2007, 301(1–2), 123–134. [CrossRef]
  61. Monei, N.; Hitch, M.; Heim, J.; Pourret, O.; Heilmeier, H.; Wiche, O. Effect of substrate properties and phosphorus supply on facilitating the uptake of rare earth elements (REE) in mixed culture cropping systems of Hordeum vulgare, Lupinus albus and Lupinus angustifolius. Environmental Science and Pollution Research 2022, 29(38), 57172–57189. [CrossRef]
  62. Pang, J.; Bansal, R.; Zhao, H.; Bohuon, E.; Lambers, H.; Ryan, M. H.; et al. The carboxylate-releasing phosphorus-mobilizing strategy can be proxied by foliar manganese concentration in a large set of chickpea germplasm under low phosphorus supply. New Phytologist 2018, 219(2), 518–529. [CrossRef]
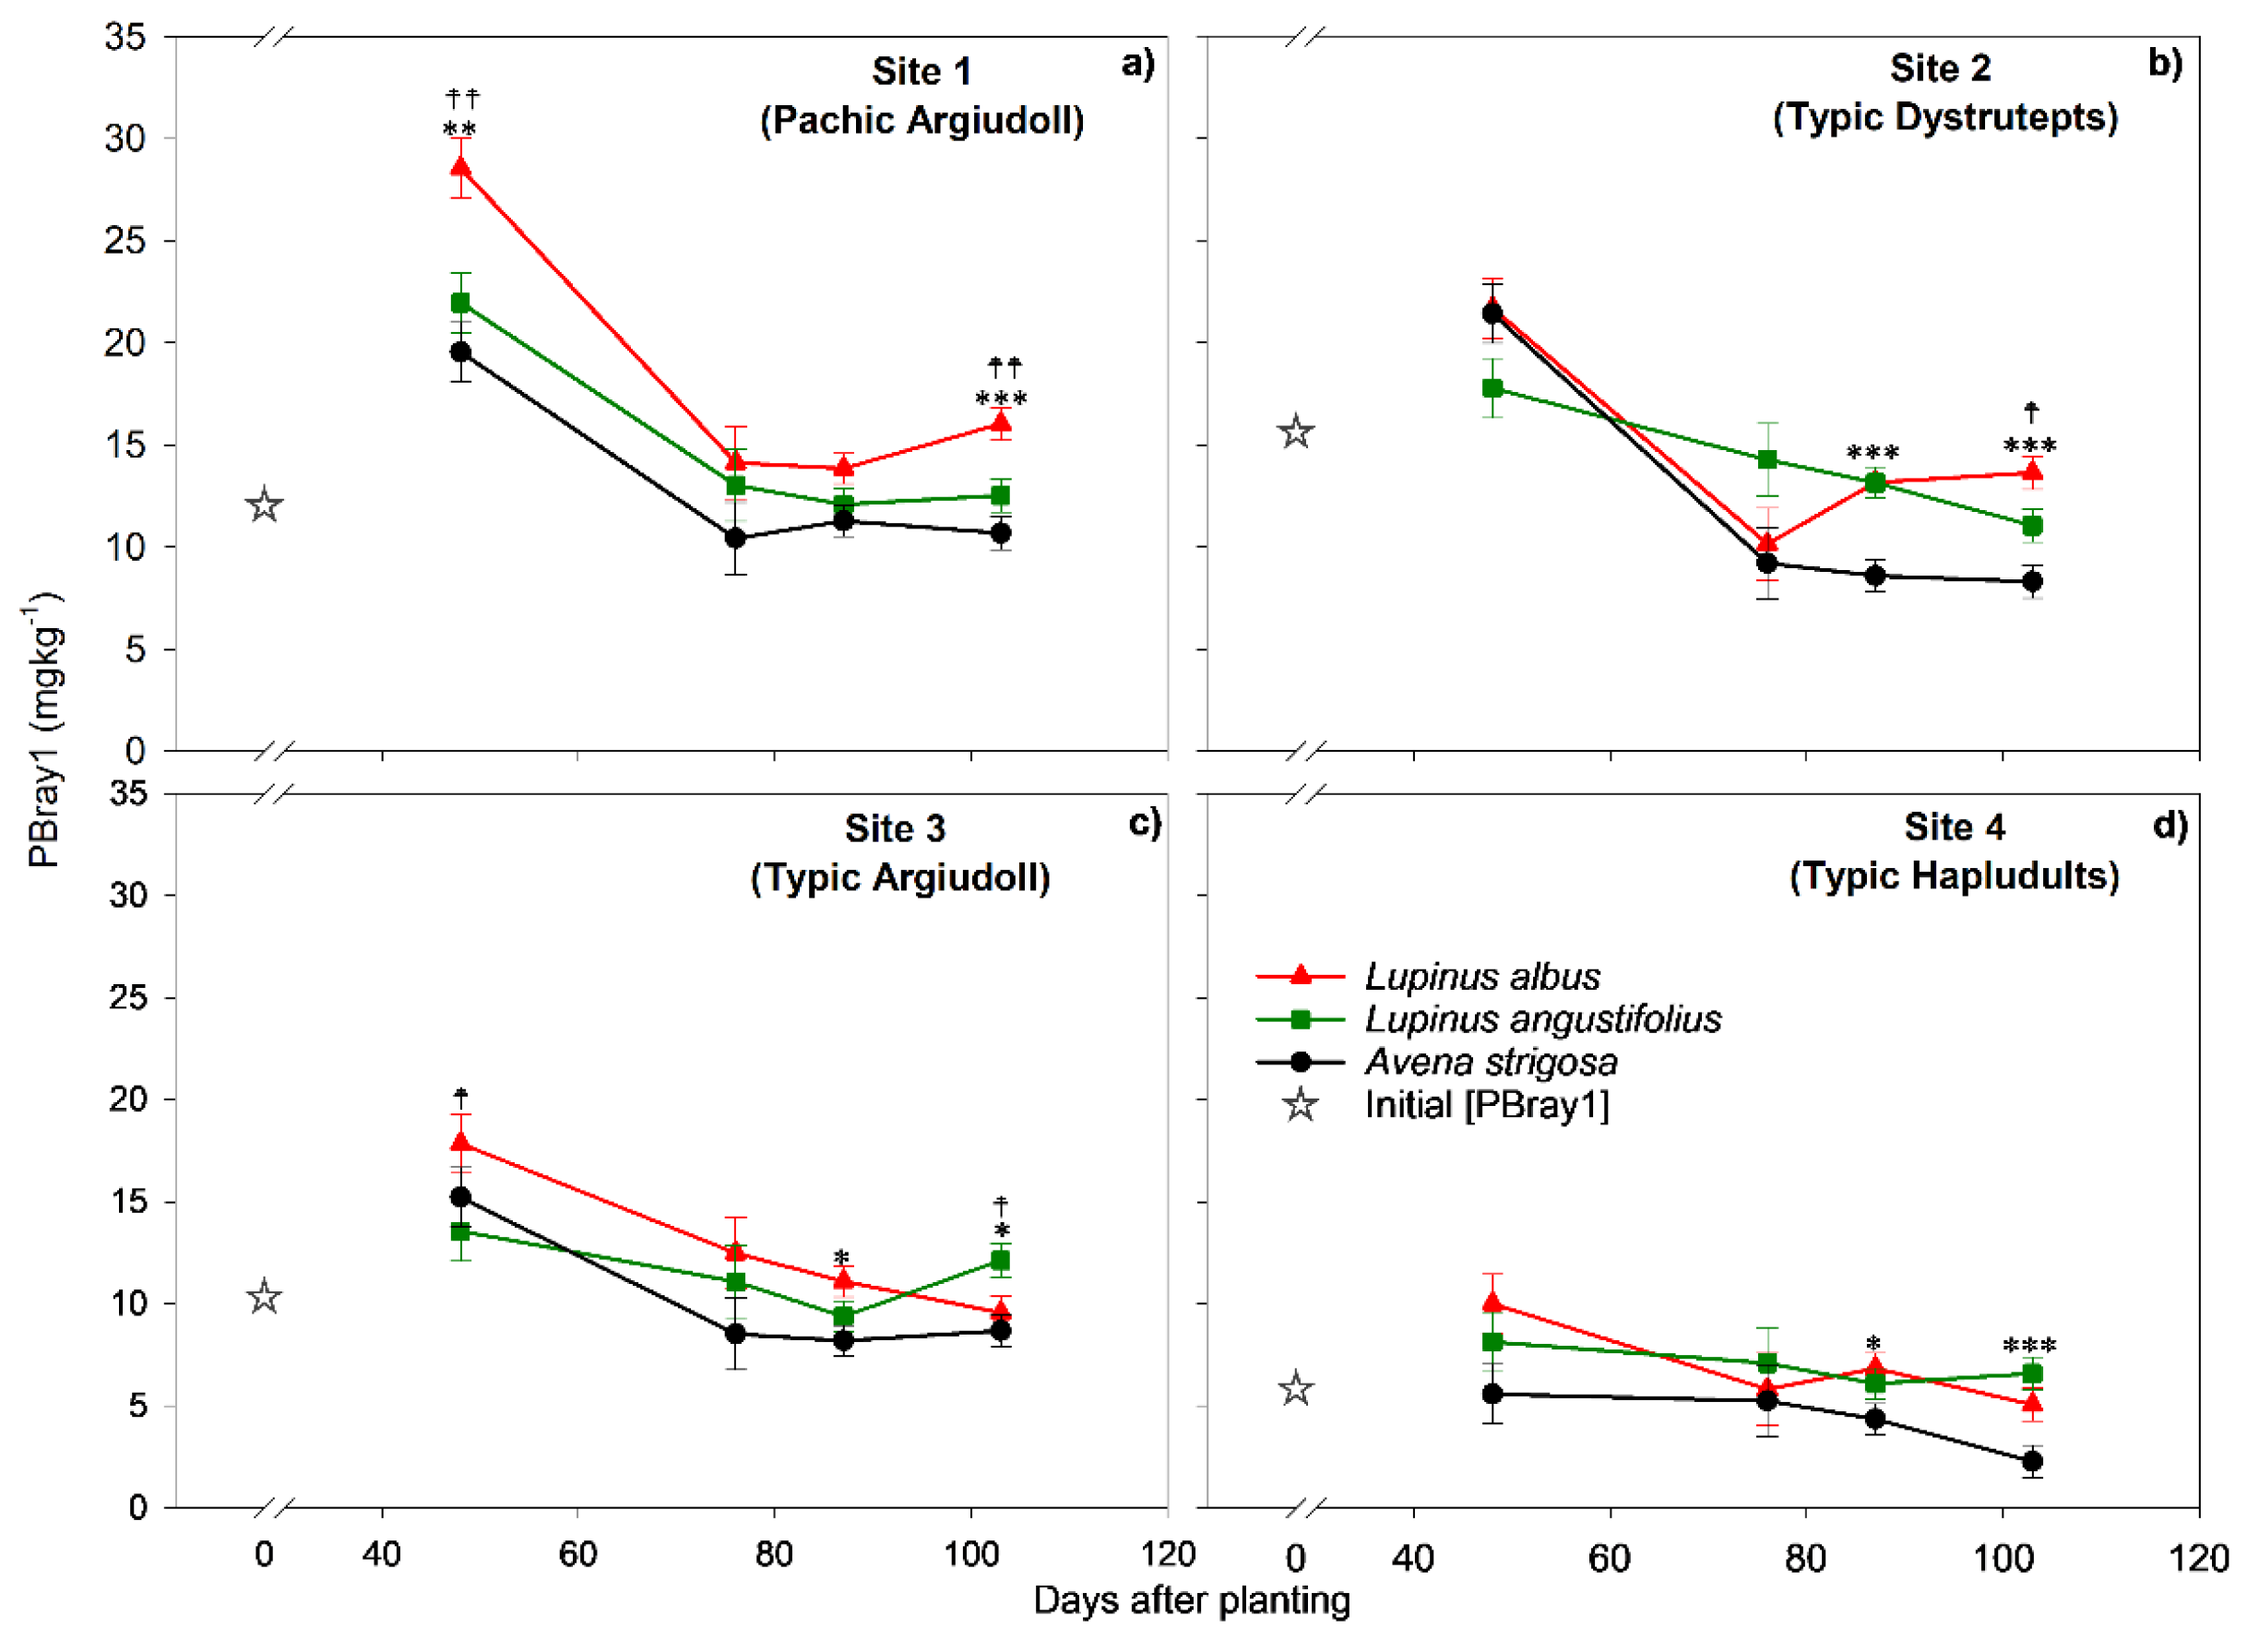
Figure 1. Soil PBray1 concentration under two legumes (L. albus and L. angustifolius) and one grass (Avena strigosa) across Sites (soil types) 1 (a), 2 (b), 3 (c), and 4 (d). The vertical bars indicate the standard error, and the symbols “ ” and “☨” indicate the sampling time in which Contrast 1 (Lupine vs. oat) and Contrast 2 (L. albus vs. L. angustifolius) were significant (∗☨ p < 0.05; ∗∗☨☨ p < 0.01; ∗∗∗☨☨☨ p < 0.001), respectively.
Preprints 96658 g001
Figure 2. PBray1 concentration according to species across Sites (soil types) 1 (a), 2 (b), 3 (c), and 4 (d) at 103 days after planting. The vertical bars indicate the standard error. Different lowercase letters indicate significant differences between species within each soil type, and different capital letters indicate differences between sites across species, according to Tukey's test with a p≤ 0.05.
Preprints 96658 g002
Figure 3. Soil pH measured 87 days after planting of the two legumes (L. albus and L. angustifolius) and the grass (Avena strigosa) across Sites (soil types) 1 (a), 2 (b), 3 (c), and 4 (d). The dotted line represents the soil pH value at the beginning of the experiment. Different lowercase letters indicate significant differences between species within each soil type, and different capital letters indicate differences between sites across species, according to Tukey's test with a p ≤ 0.05.
Preprints 96658 g003
Figure 4. Relationships between ∆pH-initial (difference between soil pH at harvest and soil pH at the beginning of the experiment) and ∆PBray1-initial (difference between soil PBray1 at harvest and soil PBray1 at the beginning of the experiment). The dotted line splits the data from soil acidification to alkalinization relative to the initial pH. Gray squares, black circles and white triangles represent Lupinus albus, Lupinus angustifolius and Avena strigosa species, respectively.
Preprints 96658 g004
Figure 5. Relationships between plant Mn concentration and pH-87dap (a) and soil PBray1-48 dap (b) segregated by species and including all sites, except Site 4 in panel b). Gray squares, black circles and white triangles represent Lupinus albus, Lupinus angustifolius and Avena strigosa species, respectively.
Preprints 96658 g005
Table 1. Site location, soil type, dominant geological material, physical characterization, and soil texture of the soil samples collected from four sites in Uruguay.
Site (Location) Soil type (USDA Classification system) † Geological material OM Sand Silt Clay Texture‡
%
Site 1 (Colonia) Pachic Argiudoll Clay silt sediment/ Crystalline basement 4.8 16.3 38.8 44.9 C
Site 2(T. & Tres) Typic Dystrutepts Crystalline basement 3.7 23.5 44.2 32.3 CL
Site 3 (Montevideo) Typic Argiudolls Libertad clayey silt sediment 1.7 19.3 52.3 28.4 SiCL
Site 4(Rivera) Typic Hapludults Colluvial material (Sandy soils)/ Tacuarembó sandstones 1.4 84.7 1.4 13.9 SL
†USDA: source: [21].
‡Texture: C= clay; SiCL= silty clay loam; SL= sandy loam; CL= clay loam.
Table 2. Initial soil properties before the establishment of the experiment.
Site (soil type†) PBray1 NH+4-N NO-3-N Ca2+ Mg2+ K+ Na+ Al3+exch. pH
mg kg-1 cmolc kg-1
Site 1 (Pachic Argiudoll) 12.0 16.4 21.9 14.5 3.0 1.0 0.2 0.05 5.17
Site 2 (Typic Dystrutepts) 15.6 25.7 0.3 4.6 1.2 0.3 0.1 0.05 5.32
Site 3 (Typic Argiudoll) 10.3 7.8 0.9 17.7 2.8 1.4 0.2 0.02 6.00
Site 4 (Typic Hapludults) 5.8 10.9 12.1 1.4 0.5 0.1 0.1 0.16 4.50
†USDA: source: [21].
Table 4. Soil exchangeable acidity and exchangeable aluminum according to species and soil type. Values are means ± standard error.
Site Species Exchangeable Acidity Exchangeable Aluminum
cmolc kg-1
1 Lupinus albus 0.07 ± 0.01 ns C 0.01 ± 0.03 ns C
Lupinus angustifolius 0.08 ± 0.02 ns C 0.04 ± 0.03 ns ns
Avena strigosa 0.07 ± 0.01 ns BC 0.04 ± 0.01 ns AB
2 Lupinus albus 0.69 ± 0.04 a A 0.18 ± 0.03 ns A
Lupinus angustifolius 0.56 ± 0.09 a A 0.10 ± 0.03 ns ns
Avena strigosa 0.33 ± 0.04 b A 0.13 ± 0.03 ns A
3 Lupinus albus 0.08 ± 0.03 ns C 0.06 ± 0.02 ns BC
Lupinus angustifolius 0.05 ± 0.00 ns C 0.06 ± 0.02 ns ns
Avena strigosa 0.03 ± 0.01 ns C 0.03 ± 0.03 ns B
4 Lupinus albus 0.32 ± 0.08 a B 0.11 ± 0.03 ns AB
Lupinus angustifolius 0.23 ± 0.04 ab B 0.10 ± 0.03 ns ns
Avena strigosa 0.17 ± 0.07 b B 0.08 ± 0.03 ns AB
Significance of treatment effect
Species 0.0008 0.6089
Soil type <.0001 0.0008
Species*soil type 0.0179 0.6339
Significant effects (p < 0.05) are in bold. Different lowercase letters within a column indicate differences between species within each soil type, and different capital letters within a column indicate differences between soils across species being significant at a p-level of 0.05.; ns: means no significant difference.
Table 5. Shoot dry weight, plant P and N concentration, plant P and N content of species as affected by soil type. Values are means ± standard error.
Site Species Shoot Dry Weight Plant P Concentration Plant N Concentration Plant PContent Plant NContent
g pot-1 mg g-1 dry weight mg pot-1
1 Lupinus albus 12.5 ± 1.5 a A 1.3 ± 0.1 a AB 29.3 ± 1.0 a ns 15.5 ± 1.7 a A 366.5 ± 46.5 a A
Lupinus angustifolius 6.7 ± 0.3 b A 1.4 ± 0.1 a A 26.1 ± 1.6 a ns 9.0 ± 0.6 b A 174.4 ± 15.3 b A
Avena strigosa 14.5 ± 1.1 a B 1.2 ± 0.1 b A 5.7 ± 0.2 b B 16.8 ± 1.3 a B 81.9 ± 4.8 c B
2 Lupinus albus 13.9 ± 1.3 b A 1.4 ± 0.1 a A 31.9 ± 1.3 a ns 19.5 ± 1.3 a A 436.9 ± 24.7 a A
Lupinus angustifolius 7.8 ± 1.1 c A 1.4 ± 0.1 a A 24.5 ± 0.4 b ns 10.6 ± 1.6 b A 189.8 ± 25.8 b A
Avena strigosa 27.0 ± 2.7 a A 0.9 ± 0.0 b B 8.4 ± 1.0 c AB 23.5 ± 1.4 a A 222.1 ± 19.1 b A
3 Lupinus albus 14.0 ± 1.3 a A 1.1 ± 0.1 c B 28.8 ± 1.9 a ns 15.4 ± 2.1 a A 402.4 ± 37.0 a A
Lupinus angustifolius 7.0 ± 1.9 b A 1.5 ± 0.1 a A 29.4 ± 1.4 a ns 10.8 ± 2.9 b A 203.6 ± 52.9 b A
Avena strigosa 8.1 ± 0.4 b C 1.3 ± 0.1 b A 6.5 ± 0.3 b B 10.2 ± 0.9 b C 52.9 ± 3.01 c B
4 Lupinus albus 6.5 ± 1.1 b B 0.9 ± 0.1 a C 27.5 ± 2.4 a ns 5.6±1.2 ns B 180.7 ± 38.6 a B
Lupinus angustifolius 1.7 ± 0.4 c B 0.6 ± 0.2 b B 30.2 ± 0.0 a ns 1.1±0.6 ns B 38.1 ± 0.0 b B
Avena strigosa 11.0 ± 0.4 a BC 0.5 ± 0.0 b C 10.2 ± 0.6 b A 5.3±0.3 ns D 111.8 ± 2.8 ab B
Significance of treatment effect
Species <.0001 0.0004 <.0001 <.0001 <.0001
Soil type <.0001 <.0001 0.3286 <.0001 <.0001
Species*soil type <.0001 0.0017 0.0088 0.0062 0.0009
Significant effects (p <0.05) are in bold. Different lowercase letters within a column indicate differences between species within each soil type, and different capital letters within a column indicate differences between sites across species being significant at a p-level of 0.05; ns: means no significant difference.
Table 6. Plant Ca, Mg, K, Mn and Fe concentration of species as affected by soil type. Values are means ± standard error.
Site Species Plant Ca Concentration Plant Mg Concentration Plant K Concentration Plant Mn Concentration Plant Fe Concentration
mg g-1 mg kg-1
1 Lupinus albus 5.6 ± 0.4 b A 1.4 ± 0.1 b A 14.3 ± 1.7 ns B 482.6 ± 51.2 b B 97.2 ± 12.7 b BC
Lupinus angustifolius 26.5 ± 1.6 a ns 4.7 ± 0.3 a ns 16.2 ± 0.2 ns ns 1067.0 ± 150.2 a B 214.2 ± 23.5 a ns
Avena strigosa 3.1 ± 0.2 c B 1.2 ± 0.1 c B 15.5 ± 0.6 ns ns 216.7 ± 27.6 b ns 36.9 ± 8.6 b B
2 Lupinus albus 3.9±0.4 b B ± 0.1 b B 13.7 ± 1.1 ns B 537.6 ± 218.2 b B 54.0 ± 5.5 ab C
Lupinus angustifolius 22.5±1.1 a ns 4.4 ± 0.2 a ns 14.7 ± 1.9 ns ns 3161.0 ± 259.1 a A 142.1 ± 4.8 a ns
Avena strigosa 2.9±0.3 b B 1.5 ± 0.1 b B 13.0 ± 0.9 ns ns 214.9 ± 21.66 b ns 28.7 ± 2.6 b B
3 Lupinus albus 7.2±0.1 b AB 2.0 ± 0.3 b AB 17.1 ± 0.7 ns A 1191.2 ± 21.51 a A 165.3 ± 21.5 a AB
Lupinus angustifolius 26.7±1.3 a ns 4.5 ± 0.2 a ns 17.4 ± 1.1 ns ns 791.9 ± 184.0 a B 214.6 ± 36.6 a ns
Avena strigosa 4.4±0.6 b AB 1.0 ± 0.2 b B 15.1 ± 0.2 ns ns 209.8 ± 96.0 b ns 47.7 ± 18.7 b B
4 Lupinus albus 4.3 ± 0.1 b B 1.2 ± 0.2 b B 13.2 ± 1.3 ns B 628.6 ± 210.0 ab B 189.0 ± 28.5 b A
Lupinus angustifolius 12.0 ± 0.0 a ns 3.1 ± 0.0 a ns 10.8 ± 0.0 ns ns 1021.5 ± 0.0 a B 218.6 ± 0.0 b ns
Avena strigosa 4.1 ± 0.2 a A 2.9 ± 0.2 a A 14.7 ± 0.2 ns ns 403.0 ± 47.3 b ns 440.1 ± 88.7 a A
Significance of treatment effect
Species <.0001 <.0001 0.7014 <.0001 0.0342
Soil type 0.1651 0.4564 0.0453 <.0001 <.0001
Species*soil type 0.0237 0.0026 0.4818 <.0001 <.0001
Significant effects (p <0.05) are in bold. Different lowercase letters within a column indicate differences between species within each soil type, and different capital letters within a column indicate differences between sites across species being significant at a p-level of 0.05. ns: means no significant difference.
Table 7. Matrix of Pearson correlation coefficients (r) for the relationships between soil (PBray1 and pH) and plant variables (P and N content, Fe and Mn concentration) for all combinations of species (Lupines and oats) and soils at the harvest time of the experiment (87dap).
∆pH-Initial † PBray1-48dap PBray1-87dap Shoot Dry Weight Plant N Content Plant P Content Plant Fe Concentration
PBray1-48dap -0.56 ***
PBray1-87dap -0.61 *** 0.76 ***
Shoot dry weight -0.24 0.39 ** 0.06
Plant N content -0.56 *** 0.49 *** 0.50 *** 0.32 *
Plant P content -0.59 *** 0.66 *** 0.45 ** 0.83 *** 0.54 ***
Plant Fe concentration 0.53 *** -0.57 *** -0.42 ** -0.36 * -0.17 -0.61 ***
Plant Mn concentration -0.36 * 0.02 0.36 * -0.28 0.14 -0.13 0.15
† ∆pH-initial: Difference between soil pH at harvest and soil pH at the beginning of the experiment. Significant at * p <0.05; ** p <0.01; *** p <0.001.
Disclaimer/Publisher’s Note: The statements, opinions and data contained in all publications are solely those of the individual author(s) and contributor(s) and not of MDPI and/or the editor(s). MDPI and/or the editor(s) disclaim responsibility for any injury to people or property resulting from any ideas, methods, instructions or products referred to in the content.
Copyright: This open access article is published under a Creative Commons CC BY 4.0 license, which permit the free download, distribution, and reuse, provided that the author and preprint are cited in any reuse.
Prerpints.org logo

Preprints.org is a free preprint server supported by MDPI in Basel, Switzerland.

Subscribe

© 2024 MDPI (Basel, Switzerland) unless otherwise stated