1. Introduction
With increasing global warming, heat stress has become one of the most important abiotic stresses affecting tomato yield and quality [
1]. Heat stress inhibits the growth and development of tomato, resulting in dwarf plants, smaller leaves, and poor root development [
2,
3]. High temperatures also cause damage to the chloroplast structure of tomato leaves, thereby reducing the efficiency of photosynthesis [
4]. Photosynthesis is a key process in plant growth and yield formation, so inhibition of photosynthesis can negatively affect tomato growth and yield. With the rapid development of bioelectron microscopy technology, changes in the internal structure of chloroplasts can be directly observed by high-resolution transmission electron microscopy (TEM, resolution at the micron to nanometre scale).
Nitrogen is one of the essential nutrients for plant growth and has an important effect on growth and development, photosynthesis and stress resistance [
5,
6]. Chloroplasts are the site of photosynthesis and an important organ for nitrogen metabolism in plants. In chloroplasts, nitrogen is involved in the synthesis of chlorophyll, proteins, nucleic acids and other important substances [
7,
8,
9,
10]. Chlorophyll is the key pigment for photosynthesis in plants, and its synthesis requires the participation of nitrogen. Proteins are the components of various enzymes, receptors and other important molecules in chloroplasts, and nitrogen is the main component of proteins. Chloroplasts are organelles that content their own genomes ,which encode key genes for carbon dioxide fixation. Nucleic acids, which are carriers of genetic information, also play an important role in chloroplasts, and nitrogen is also one of the important constituent elements of nucleic acids. Therefore, nitrogen levels are critical to the structure and function of chloroplasts.
Many physiological and horticultural studies have shown that proper application of nitrogen fertiliser at high temperatures can alleviate the damage caused by high temperatures to plants. Under heat stress, moderate nitrogen supply can promote the growth and development of tomato, and improve the indicators of plant height, stem thickness, number of leaves and leaf area [
11,
12]. Appropriate supply of nitrogen can increase the photosynthetic rate and the accumulation of photosynthetic products in tomato [
13]. Under heat stress, either too high or too low a nitrogen level reduces tomato's stress tolerance, making it more susceptible to heat injury and pest and disease attack. Additionally, Nitrogen is related to the synthesis of chlorophyll. When nitrogen is sufficient, plants synthesize more proteins, which promotes cell division and growth, so the plant's leaf area grows faster and more leaf area can be used for photosynthesis [
14]. Therefore, in order to improve the adaptability and yield of tomato under heat stress, the level of nitrogen supply needs to be rationally controlled. The specific nitrogen supply level needs to be considered and adjusted according to soil fertility, climatic conditions, variety characteristics and cultivation management.
Photosynthesis is one of the most sensitive biological processes to heat stress in plant. The photosynthesis system in chloroplasts is contained in an extended thylakoid (cyst-like) membrane system. In young leaves, developing chloroplasts also contain numerous plastid spheres and thylakoid-associated liposomes [
15]. The electron transport chain in the thylakoid membrane system in chloroplasts captures light energy and produces NADPH, as well as a transmembrane proton gradient that drives ATP synthesis. In turn, NADPH and ATP provide energy for photosynthetic fixation in the chloroplast stroma. Chloroplasts contain two distinct endomembrane regions-stacked thylakoids [stroma (grana); singular granum] and unstacked stroma thylakoids (stroma thylakoid), which form a continuous network enclosing a single associative (branching and reconnecting) chamber-the thylakoid lumen [
16,
17,
18]. The number of thylakoids in a mature chloroplast stroma is variable, ranging from a few to more than 40, depending on the plant species and environment. Typically, plants grown in the shade contain more numerous and thicker basidia than individuals of the same species grown in the light. Non-stacked basidiomycetes differ from stacked basidiomycetes in many important ways. For example, photosystem I and the ATP synthase complex are present only in the unstacked regions of the matrix vesicles and the stacked basal granules. Photosystem II and light-trapping complex II, on the other hand, are found primarily in the adherent regions of the stacked vesicles [
19]. This segregation of protein complexes between membranes on the adherent side of the stacked region and membranes on the unfastened side of the unstacked region is called lateral heterogeneity of the photosynthetic membrane system [
20,
21,
22]. The vesicle-like stacking structure is common in green plants and is thought to be involved in regulating the partitioning of absorbed light energy between photosystem I and photosystem II in photosynthesis. plastoglobuli are lipoproteasomes formed by a single layer of polar lipids surrounded and attached to the stromal side of the cystoid membrane. The lipid cores contain various types of isoprenylbenzoquinones [α-tocopherol (vitamin E), chlorophyll quinone (vitamin K1), plastoquinone, and methylnaphthoquinone], as well as the degradation products of carotenoids, neutral lipids, and chlorophyll. The boundary layer is composed of a monolayer of galectin glycerol, structural proteins called plastoglobulins, and enzymes involved in the synthesis and metabolism of core lipids. The size and number of plastoglobulins change during plastid development and differentiation; the number of plastoglobulins becomes larger in response to environmental stresses (e.g., intense light, drought, high salt and high ozone environments) and during senescence [
23]. Morphological changes in chloroplasts under high temperature stress can be an important indicator for evaluating heat tolerance in tomato at the cellular level. The microstructure of chloroplasts changes under heat stress, and understanding these changes can help to understand the response and adaptation mechanisms of plants to heat stress, as well as to screen and breed heat-tolerant varieties.
Green plants are the only multicellular autotrophic organisms that can take up inorganic elements from the environment without relying on energetic compounds synthesized by other organisms. Chloroplasts are composed of a variety of elements and compounds. Either quantitatively or qualitatively resolving the elemental composition of chloroplasts is important for analysing the molecular structure, transport mechanisms and processes of various substances in chloroplasts [
24,
25,
26]. Currently, physiology can resolve the mechanisms of transport and utilization of mineral ion nutrition at the plant tissue level, but it cannot deeply resolve individual transport mechanisms. With the application of molecular techniques, whole genome sequencing, the development of model plant systems, high-resolution electrophysiological methods [
27], and other sophisticated means of studying plant physiology, it has become possible to reveal the mechanisms of mineral nutrient transport and utilization at the molecular level.
The main objective of this study was to determine the ultramicrostructure and mapping elements of tomato leaves chloroplast to provide basic data and methods for further research on photosystem activity and molecular regulatory mechanisms under heat stress. Meanwhile, based on the physiological studies of tomato under different heat stresses by nitrogen application levels, this study attempted to explain the response mechanism of the differences in photosystem activity and photosynthetic capacity of tomato leaves to nitrogen levels under high temperature stress, based on the analysis of the quantitative localization of various submicroscopic structural parameters and constituent elements of chloroplasts. Therefore, this study provides support for nitrogen application under high temperature environment in tomato production.
3. Discussion
Chloroplasts are the site of photosynthesis in plants. Maintaining the structural stability of chloroplasts is both expensive and complex because photosynthetic chemistry itself produces photo-oxidative damage. Under abiotic stresses such as heat stress, chloroplast degradation and cell death are mechanisms by which plants adapt to such stresses with a dual purpose: to protect cells and organs by removing reactive oxygen species-producing chloroplasts, and to redistribute nutrients to other tissues. However, the molecular mechanisms that initiate and promote this degradation are complex and involve multiple pathways. These pathways are all related to photosynthesis and nitrogen metabolism, so there is great potential to manipulate these pathways to improve crop yield and quality under heat stress environments. Little research has been done on nitrogen levels regulating the degradation of molecular structures within chloroplasts under heat stress.
3.1. Nitrogen levels changed the ultrastructure of tomato chloroplasts under heat stress
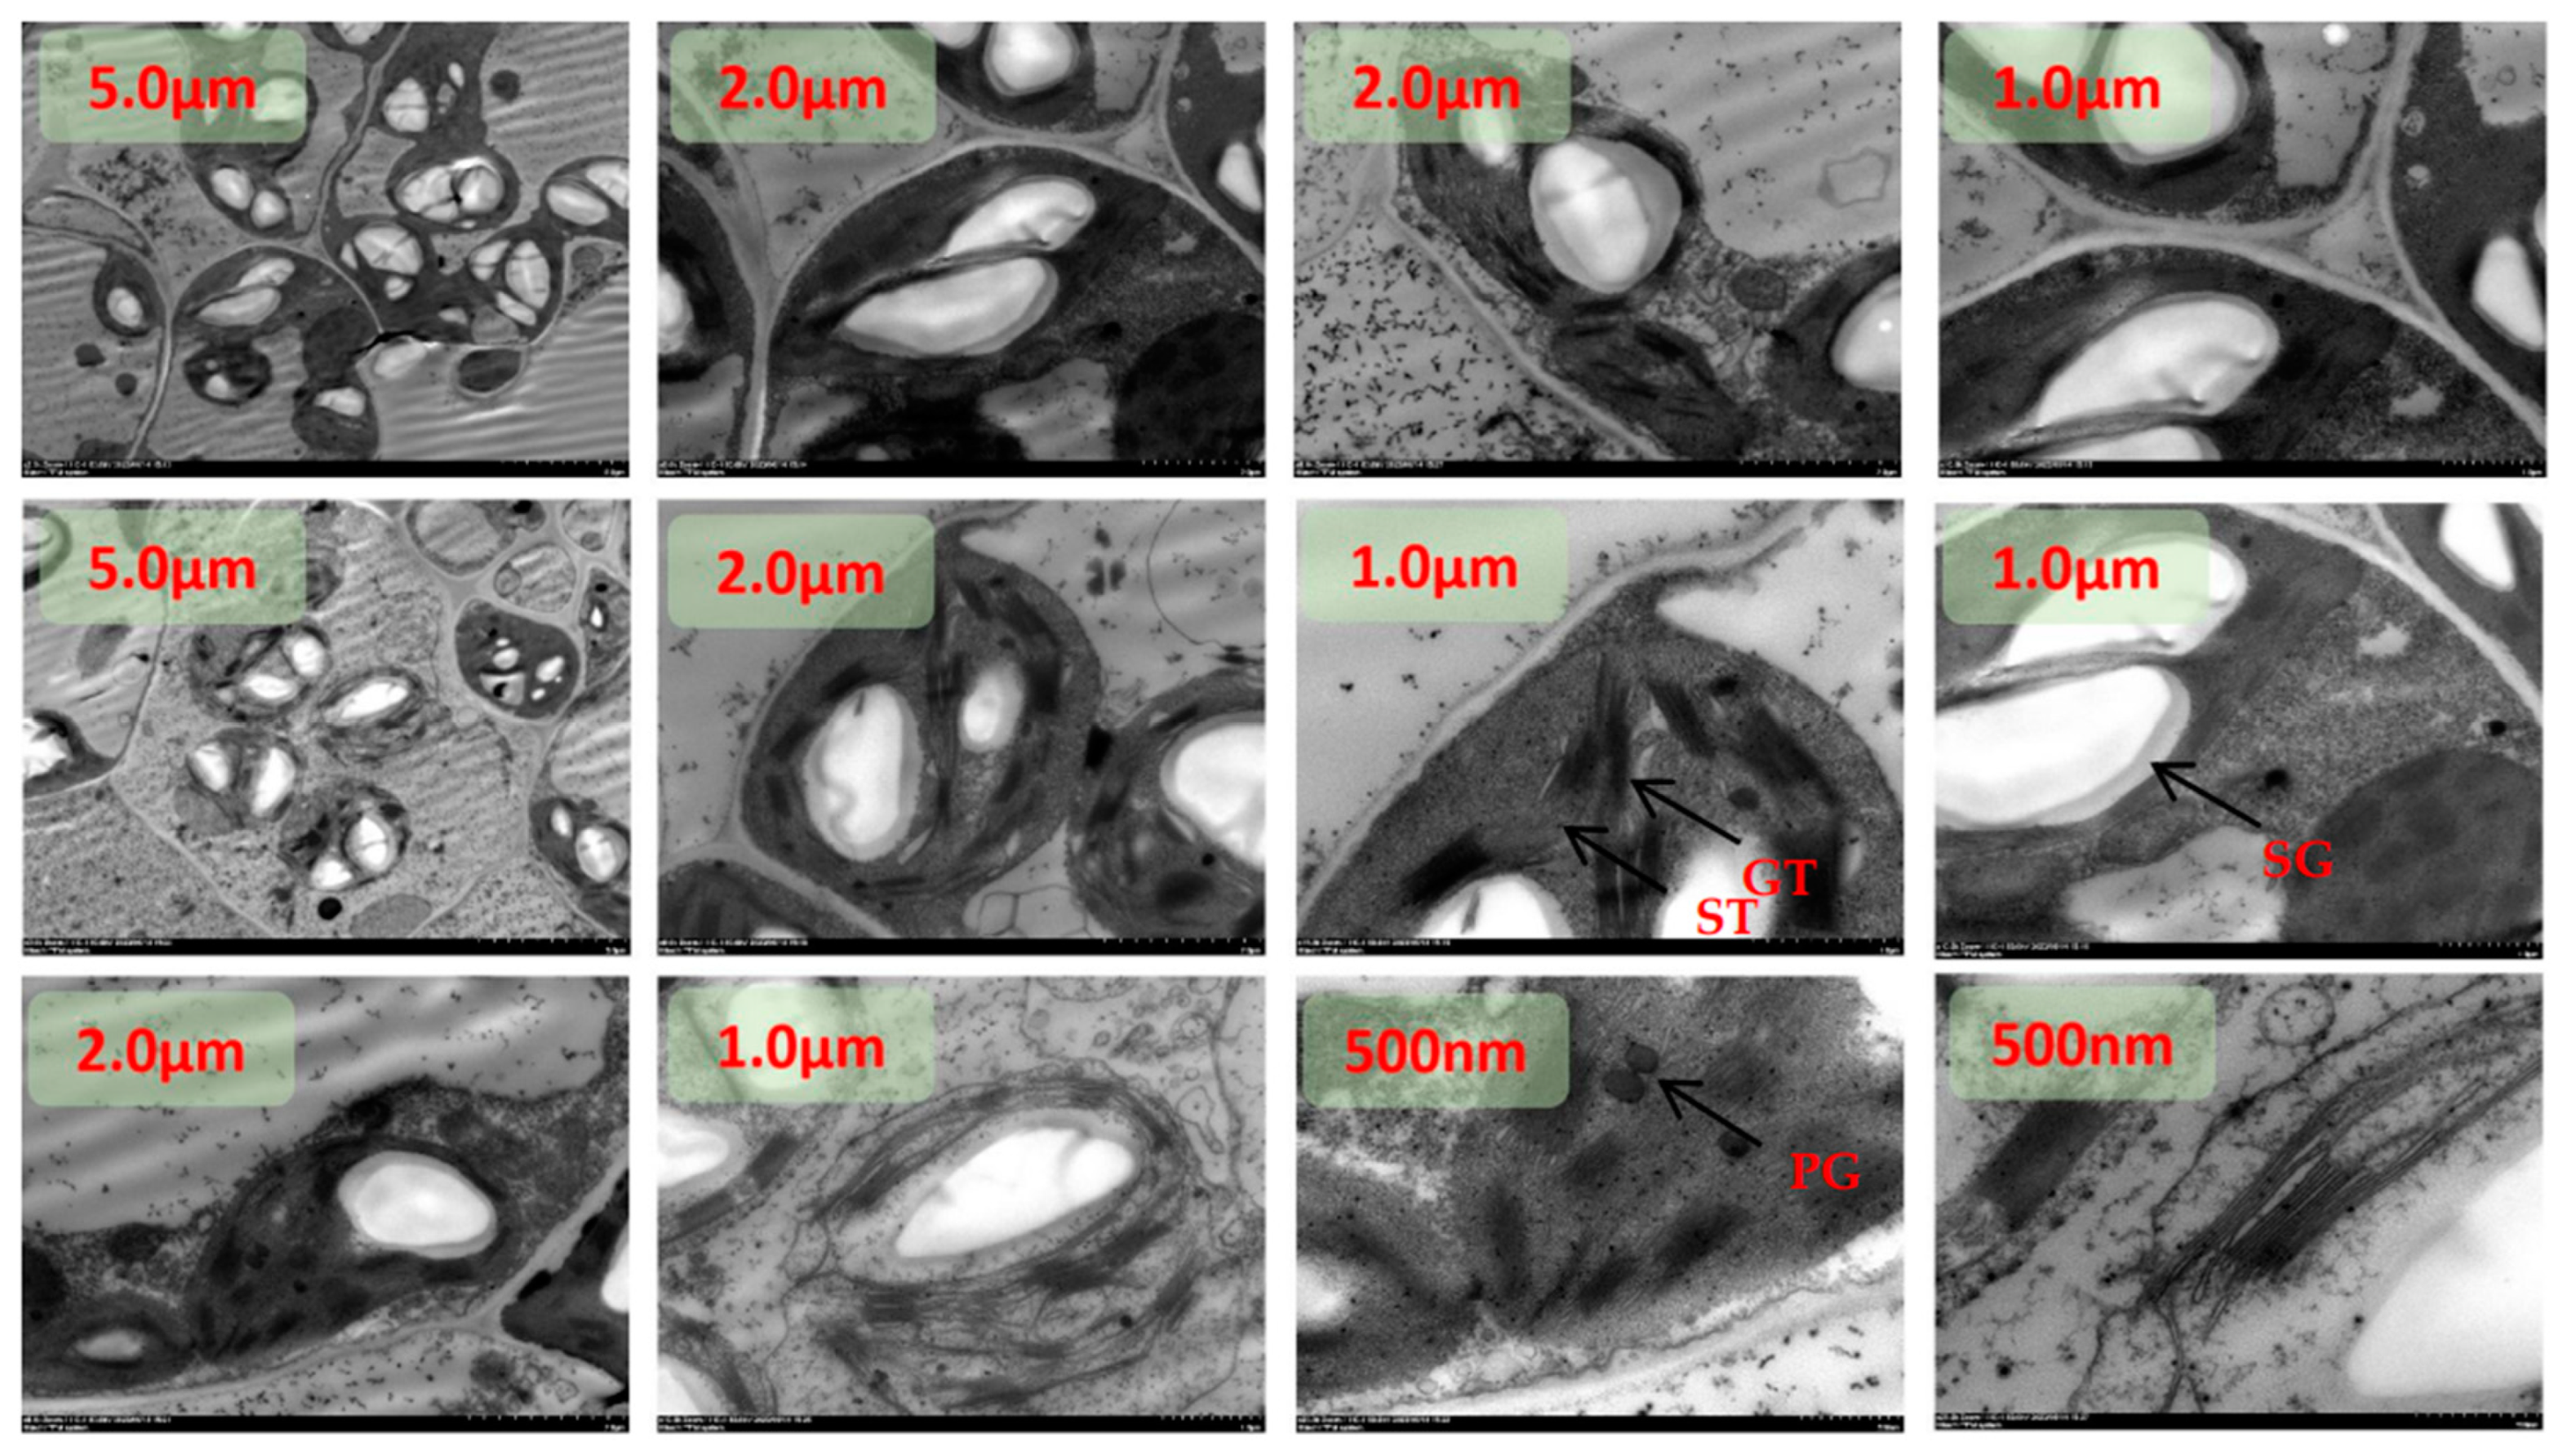
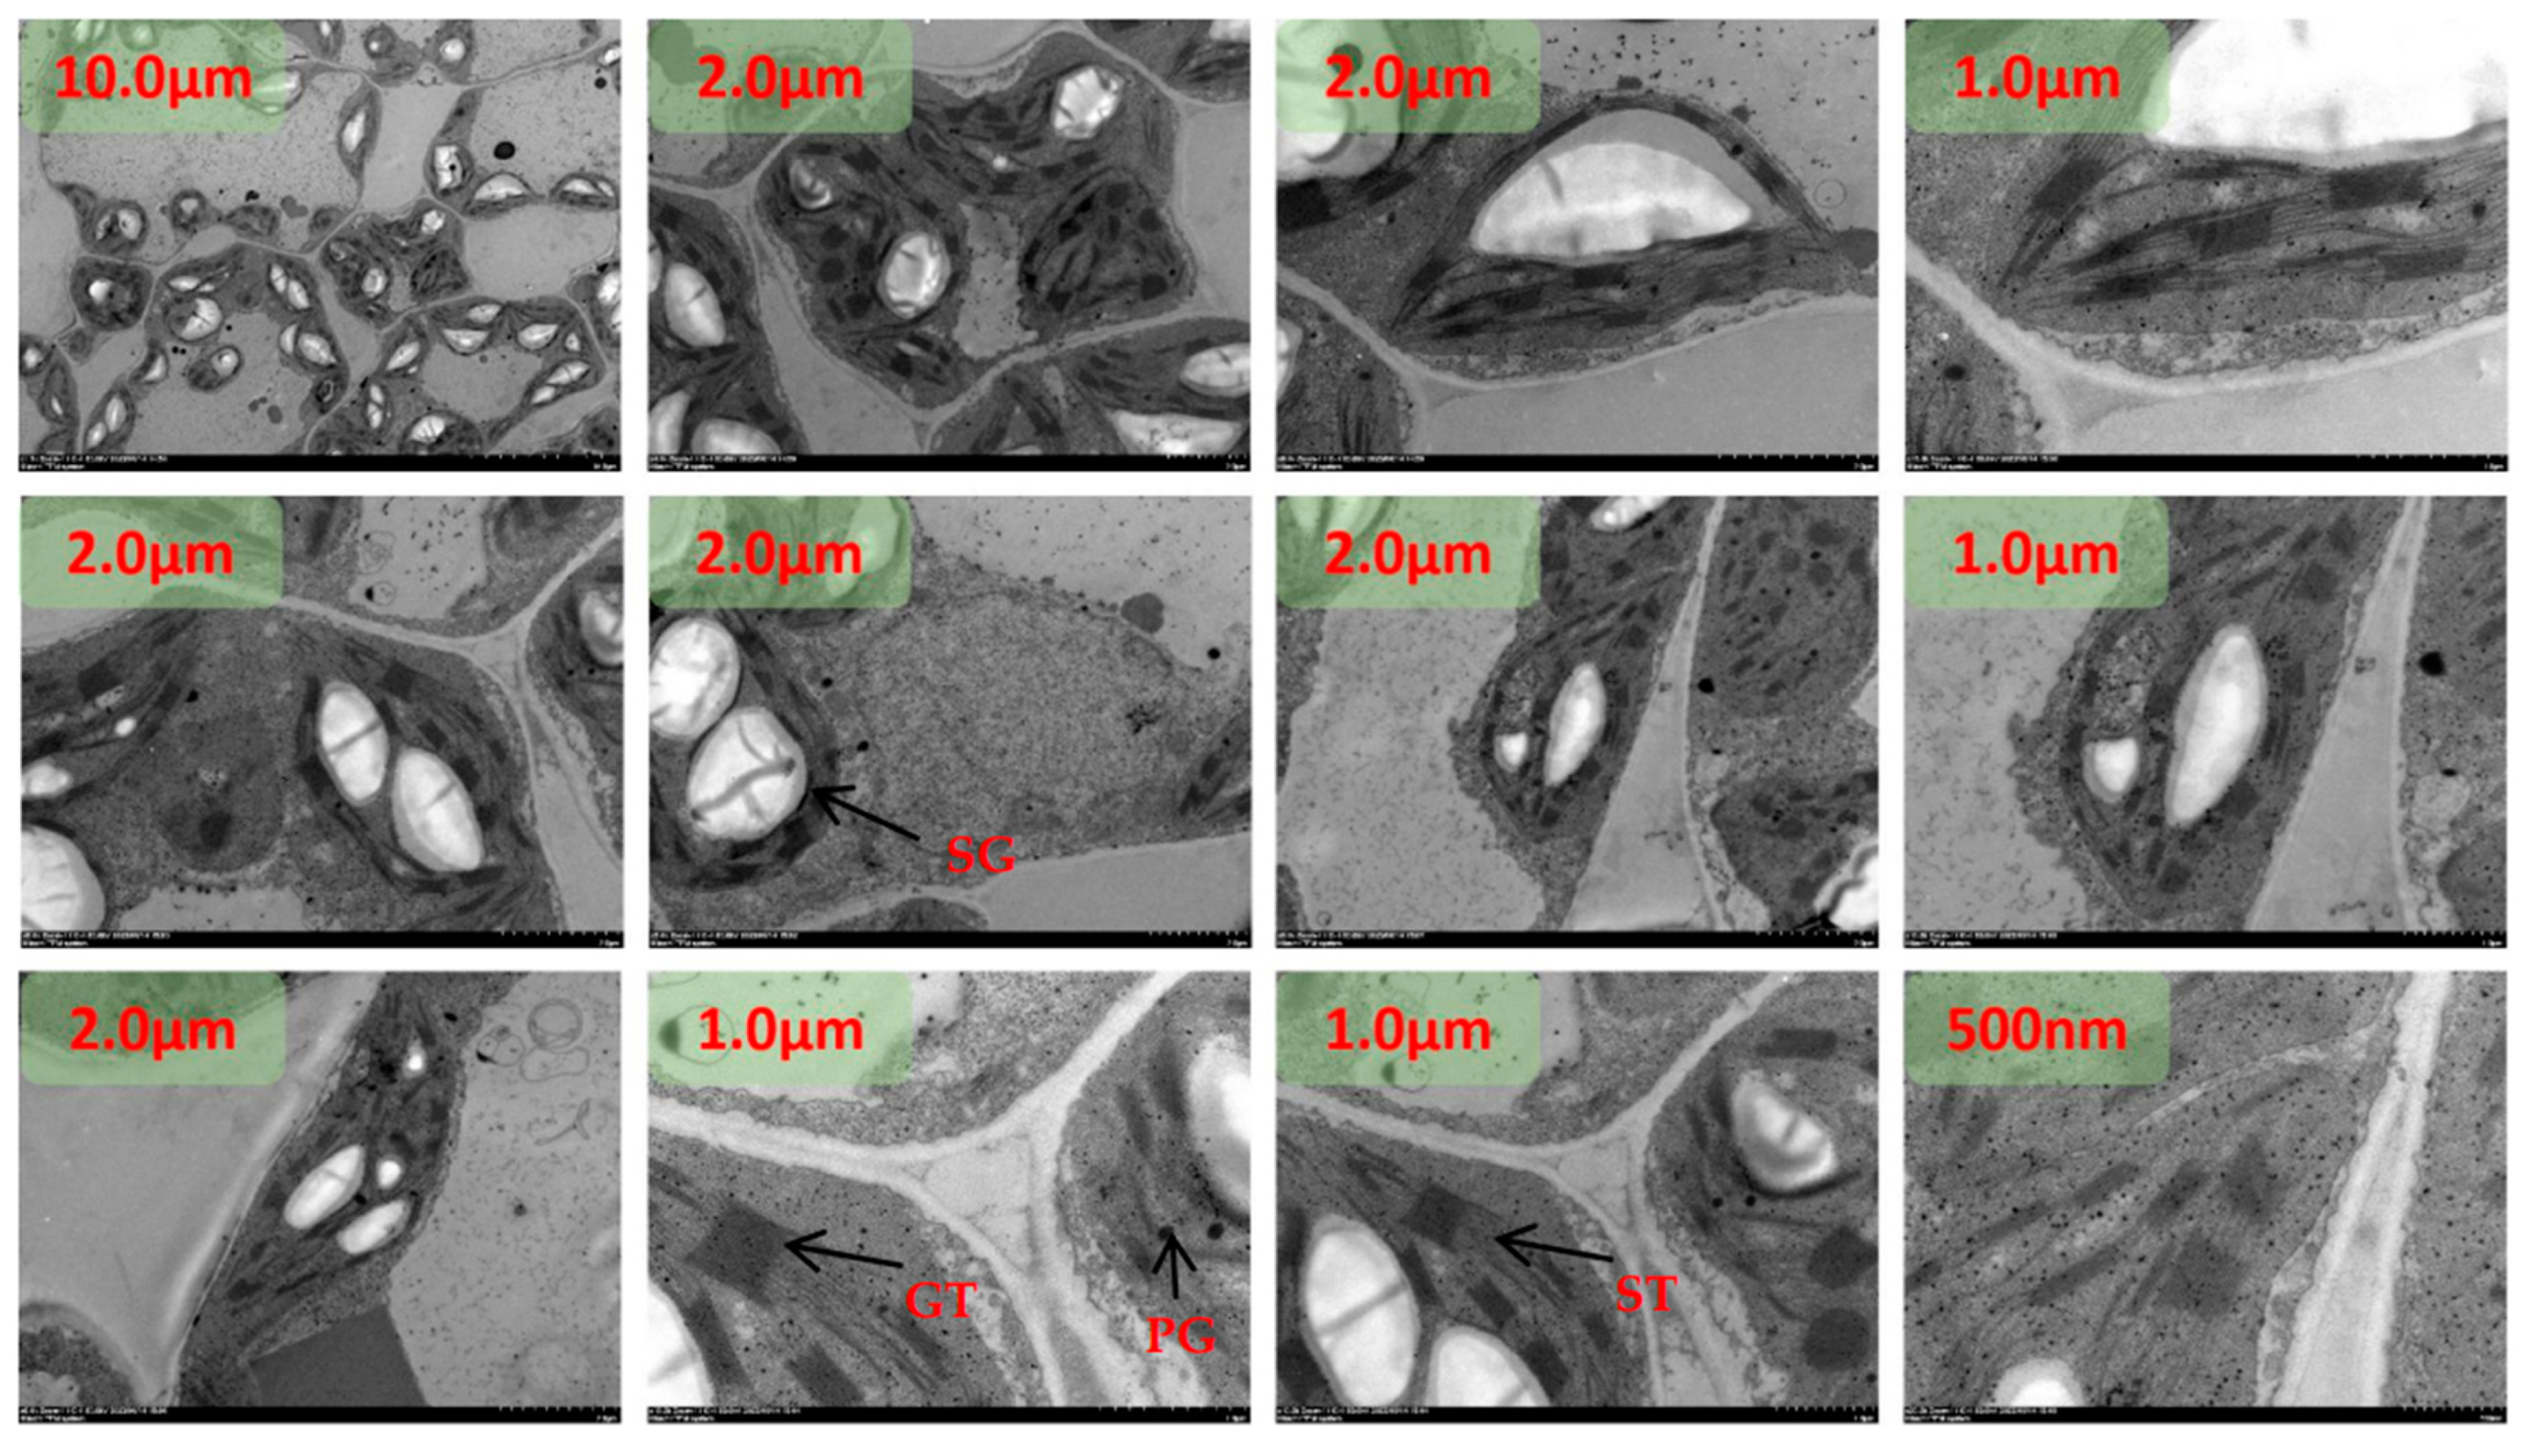
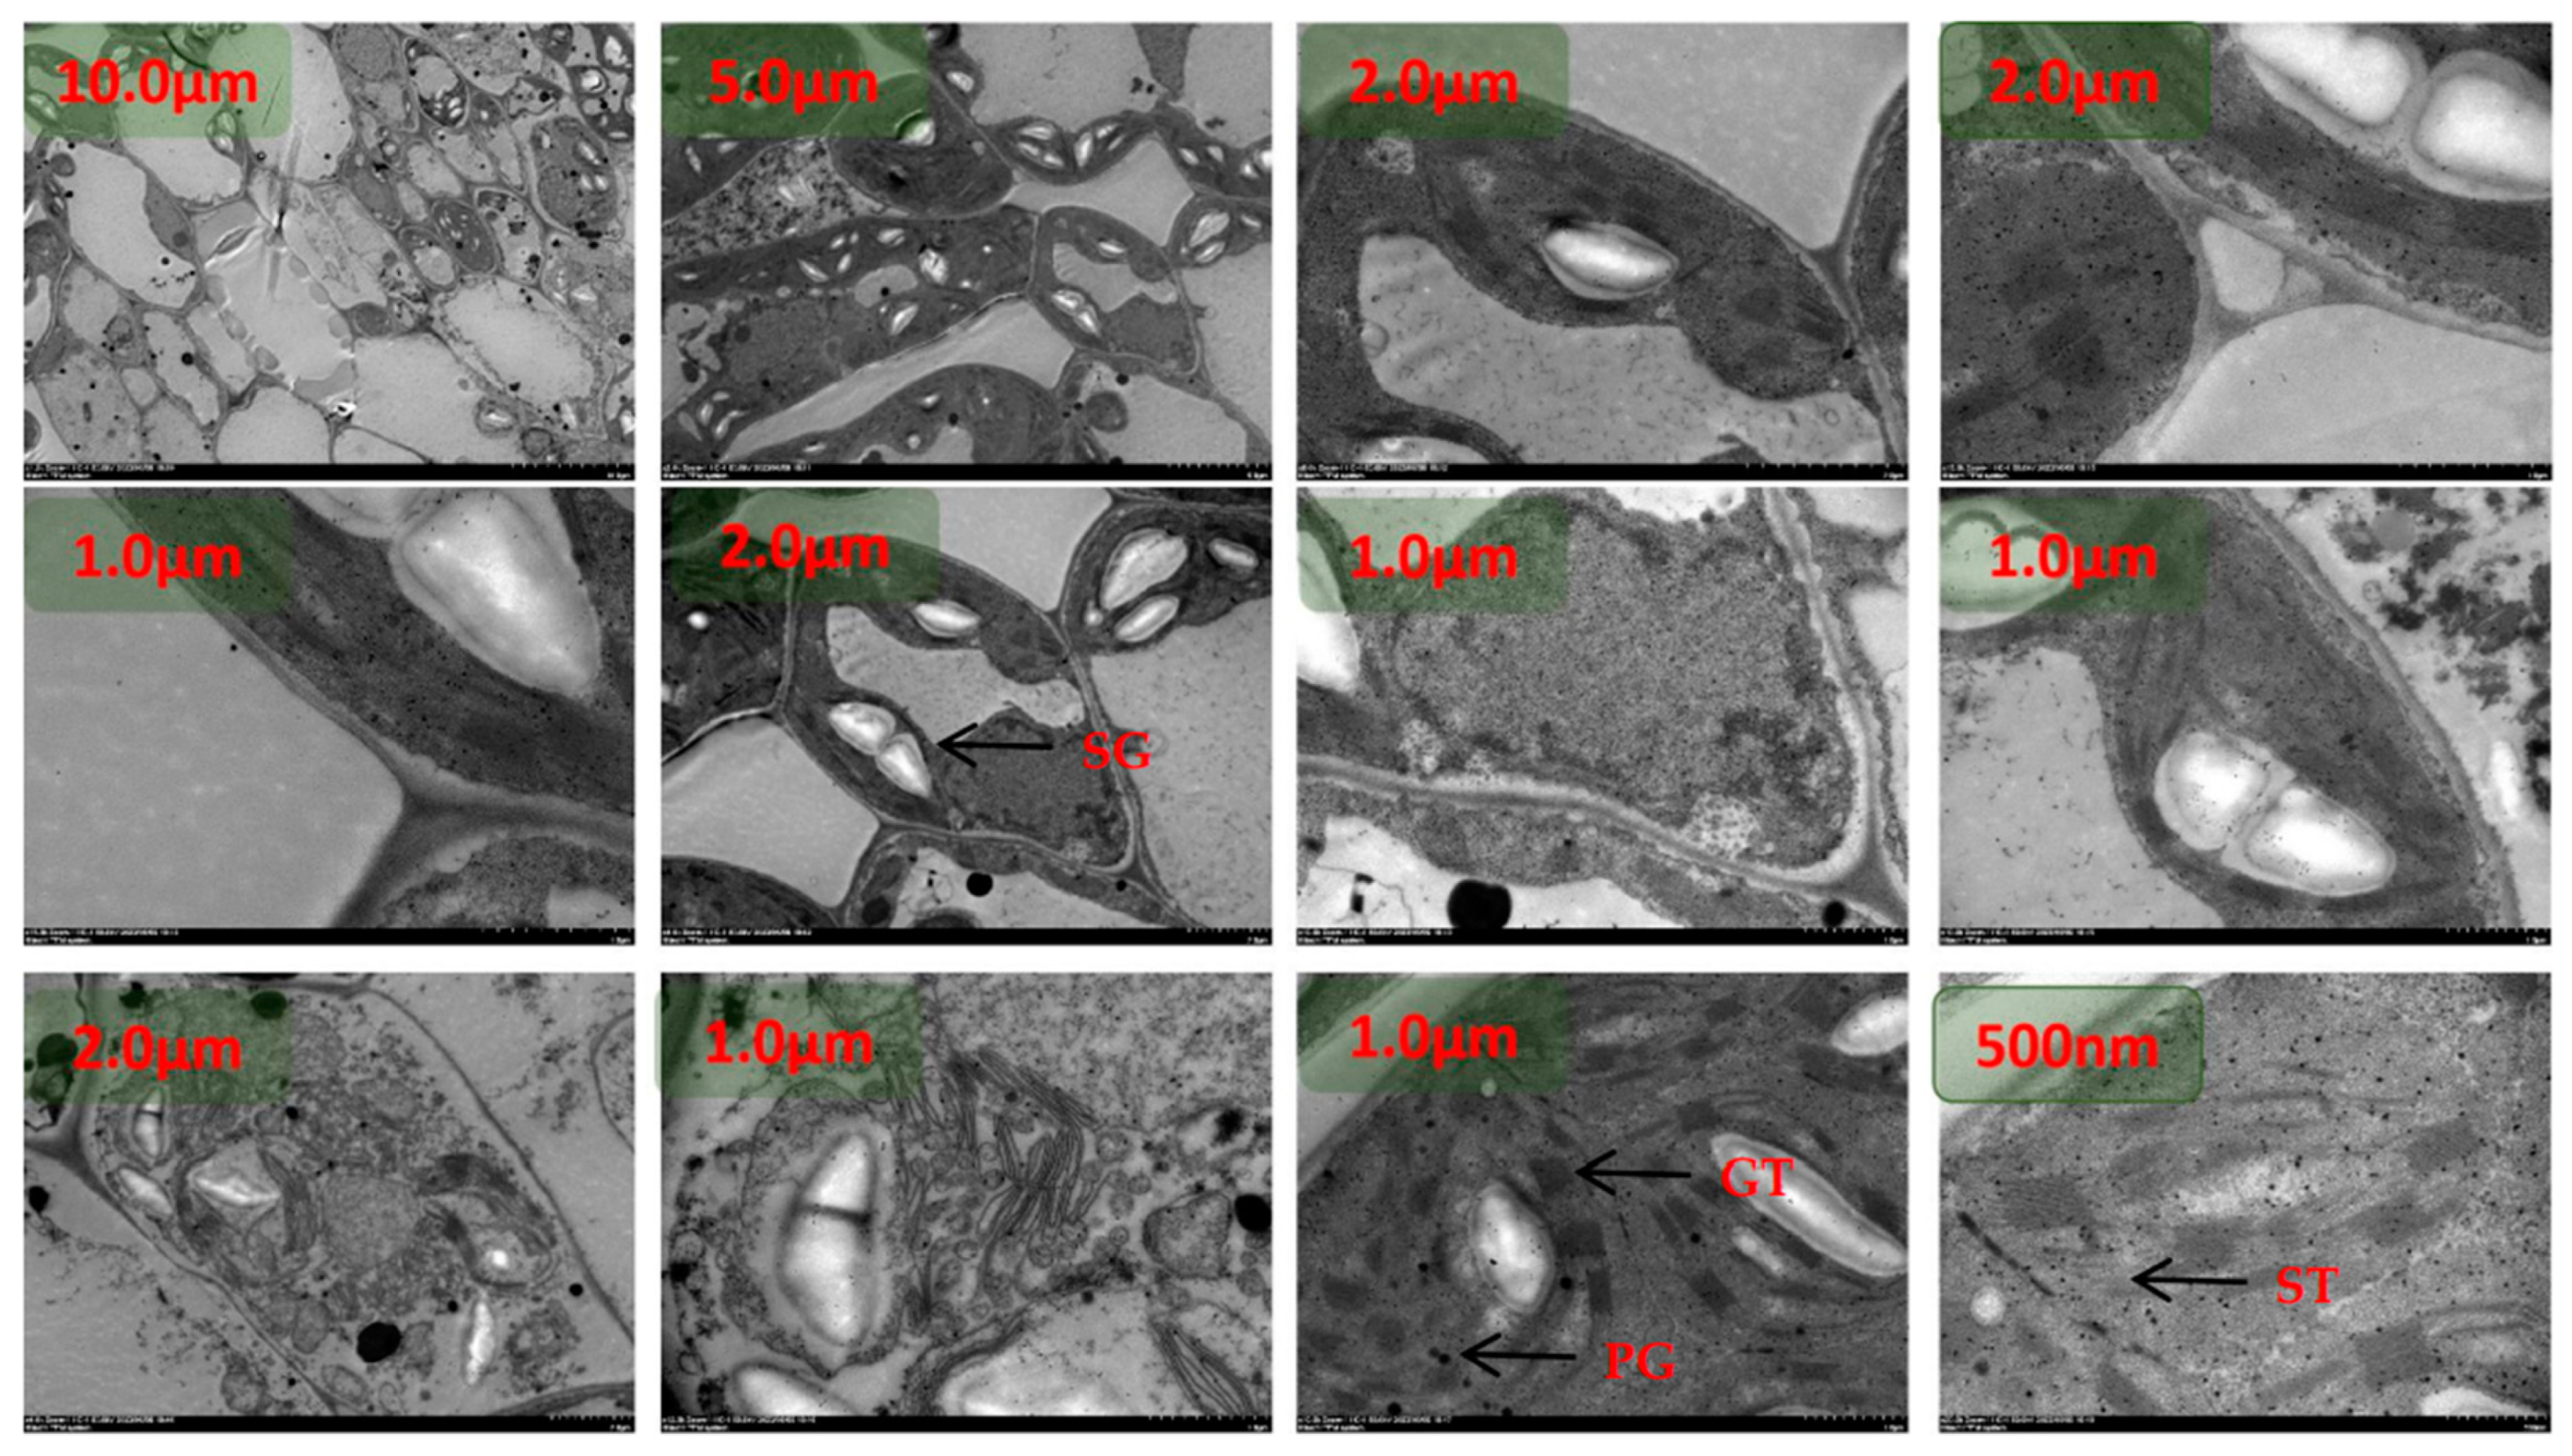
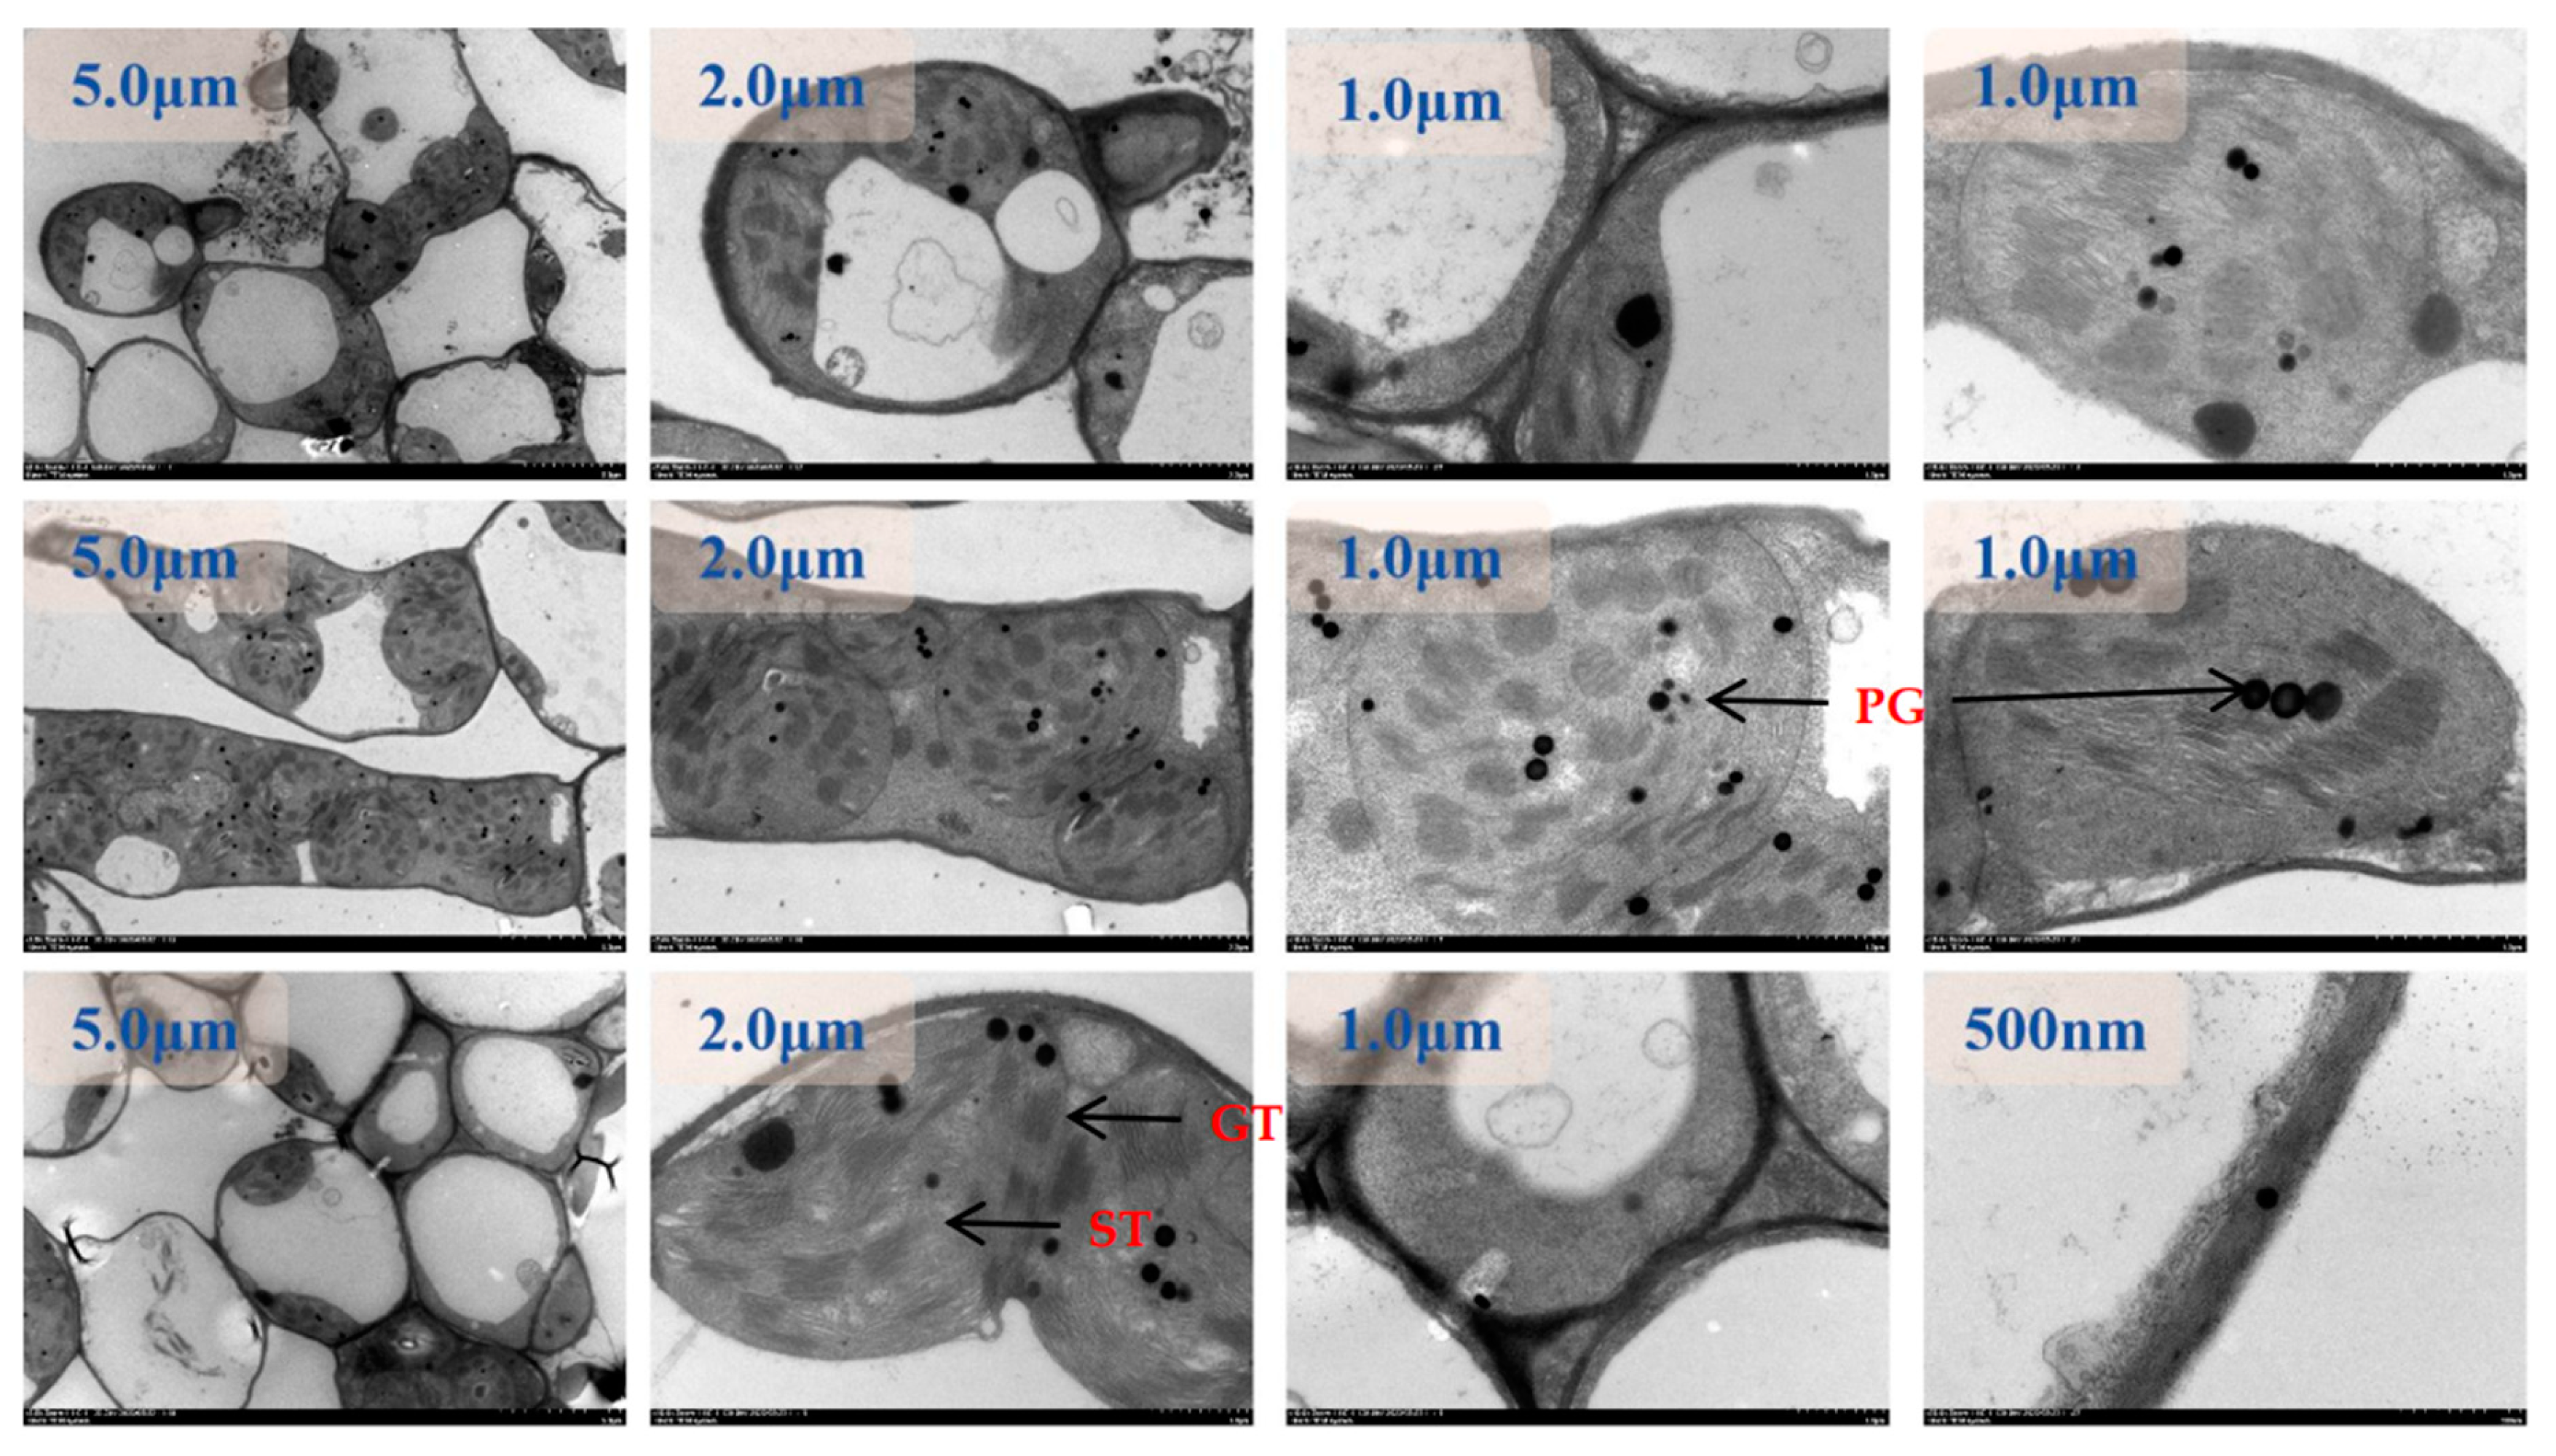
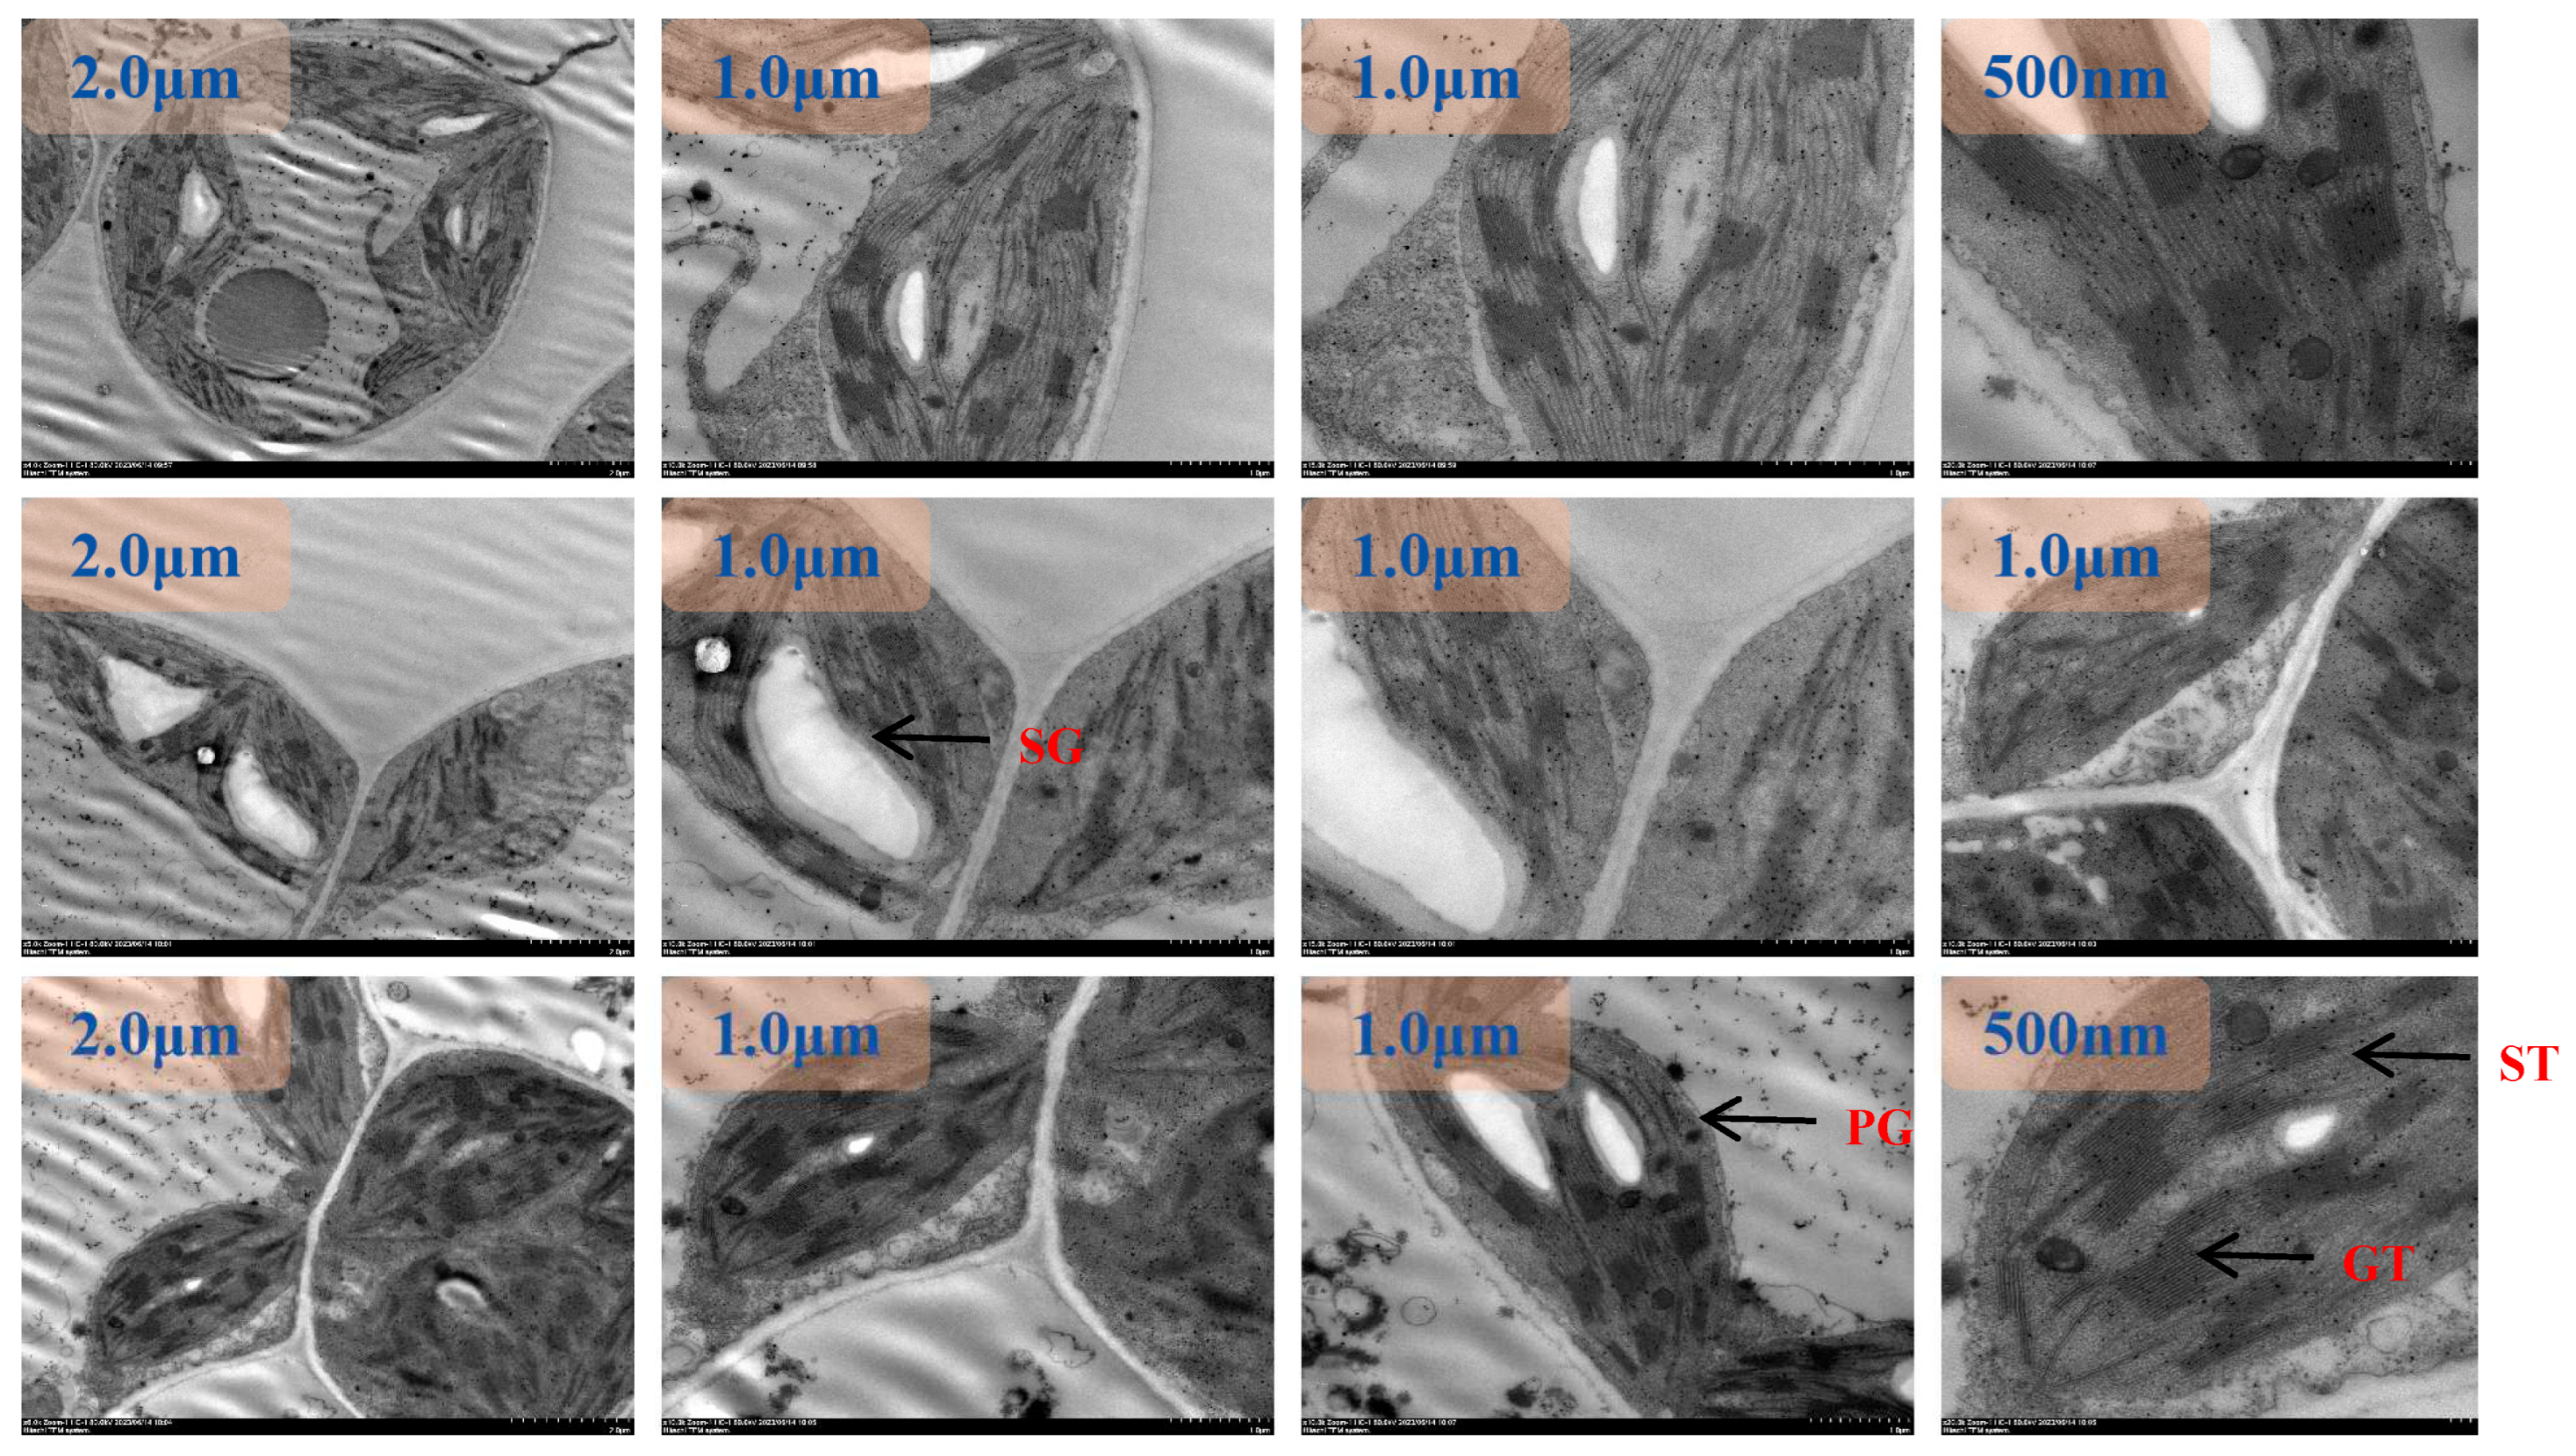
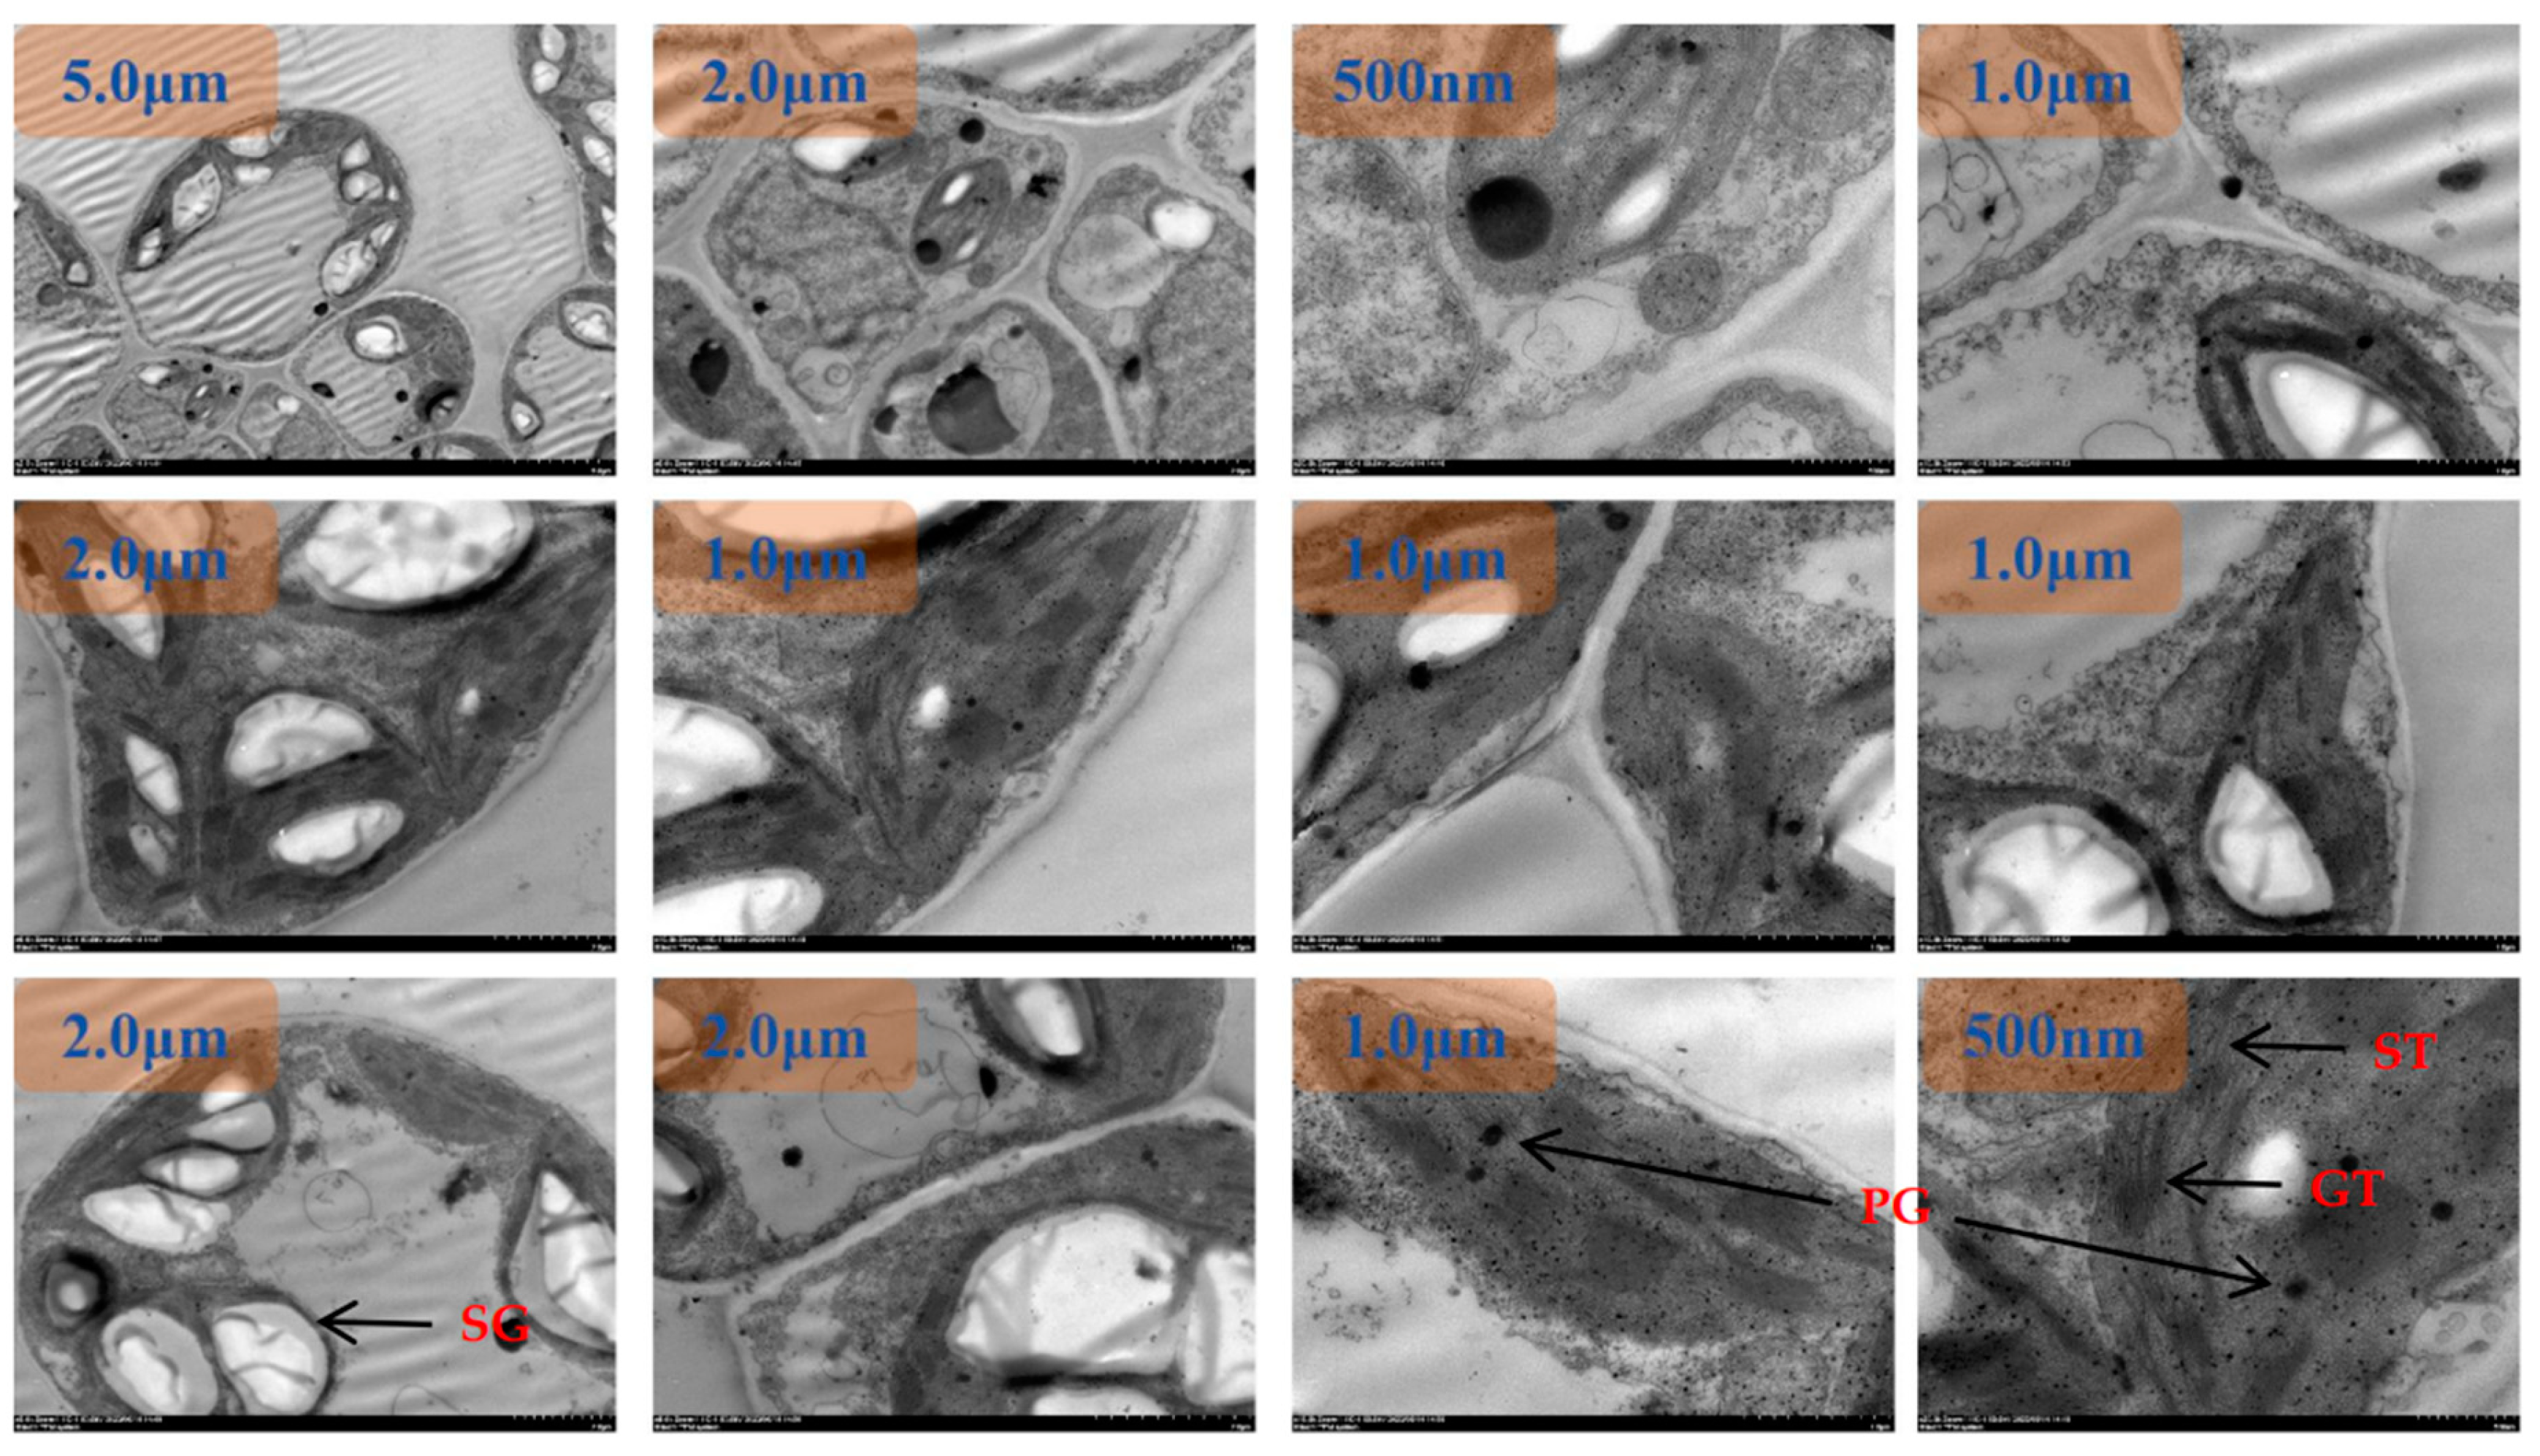
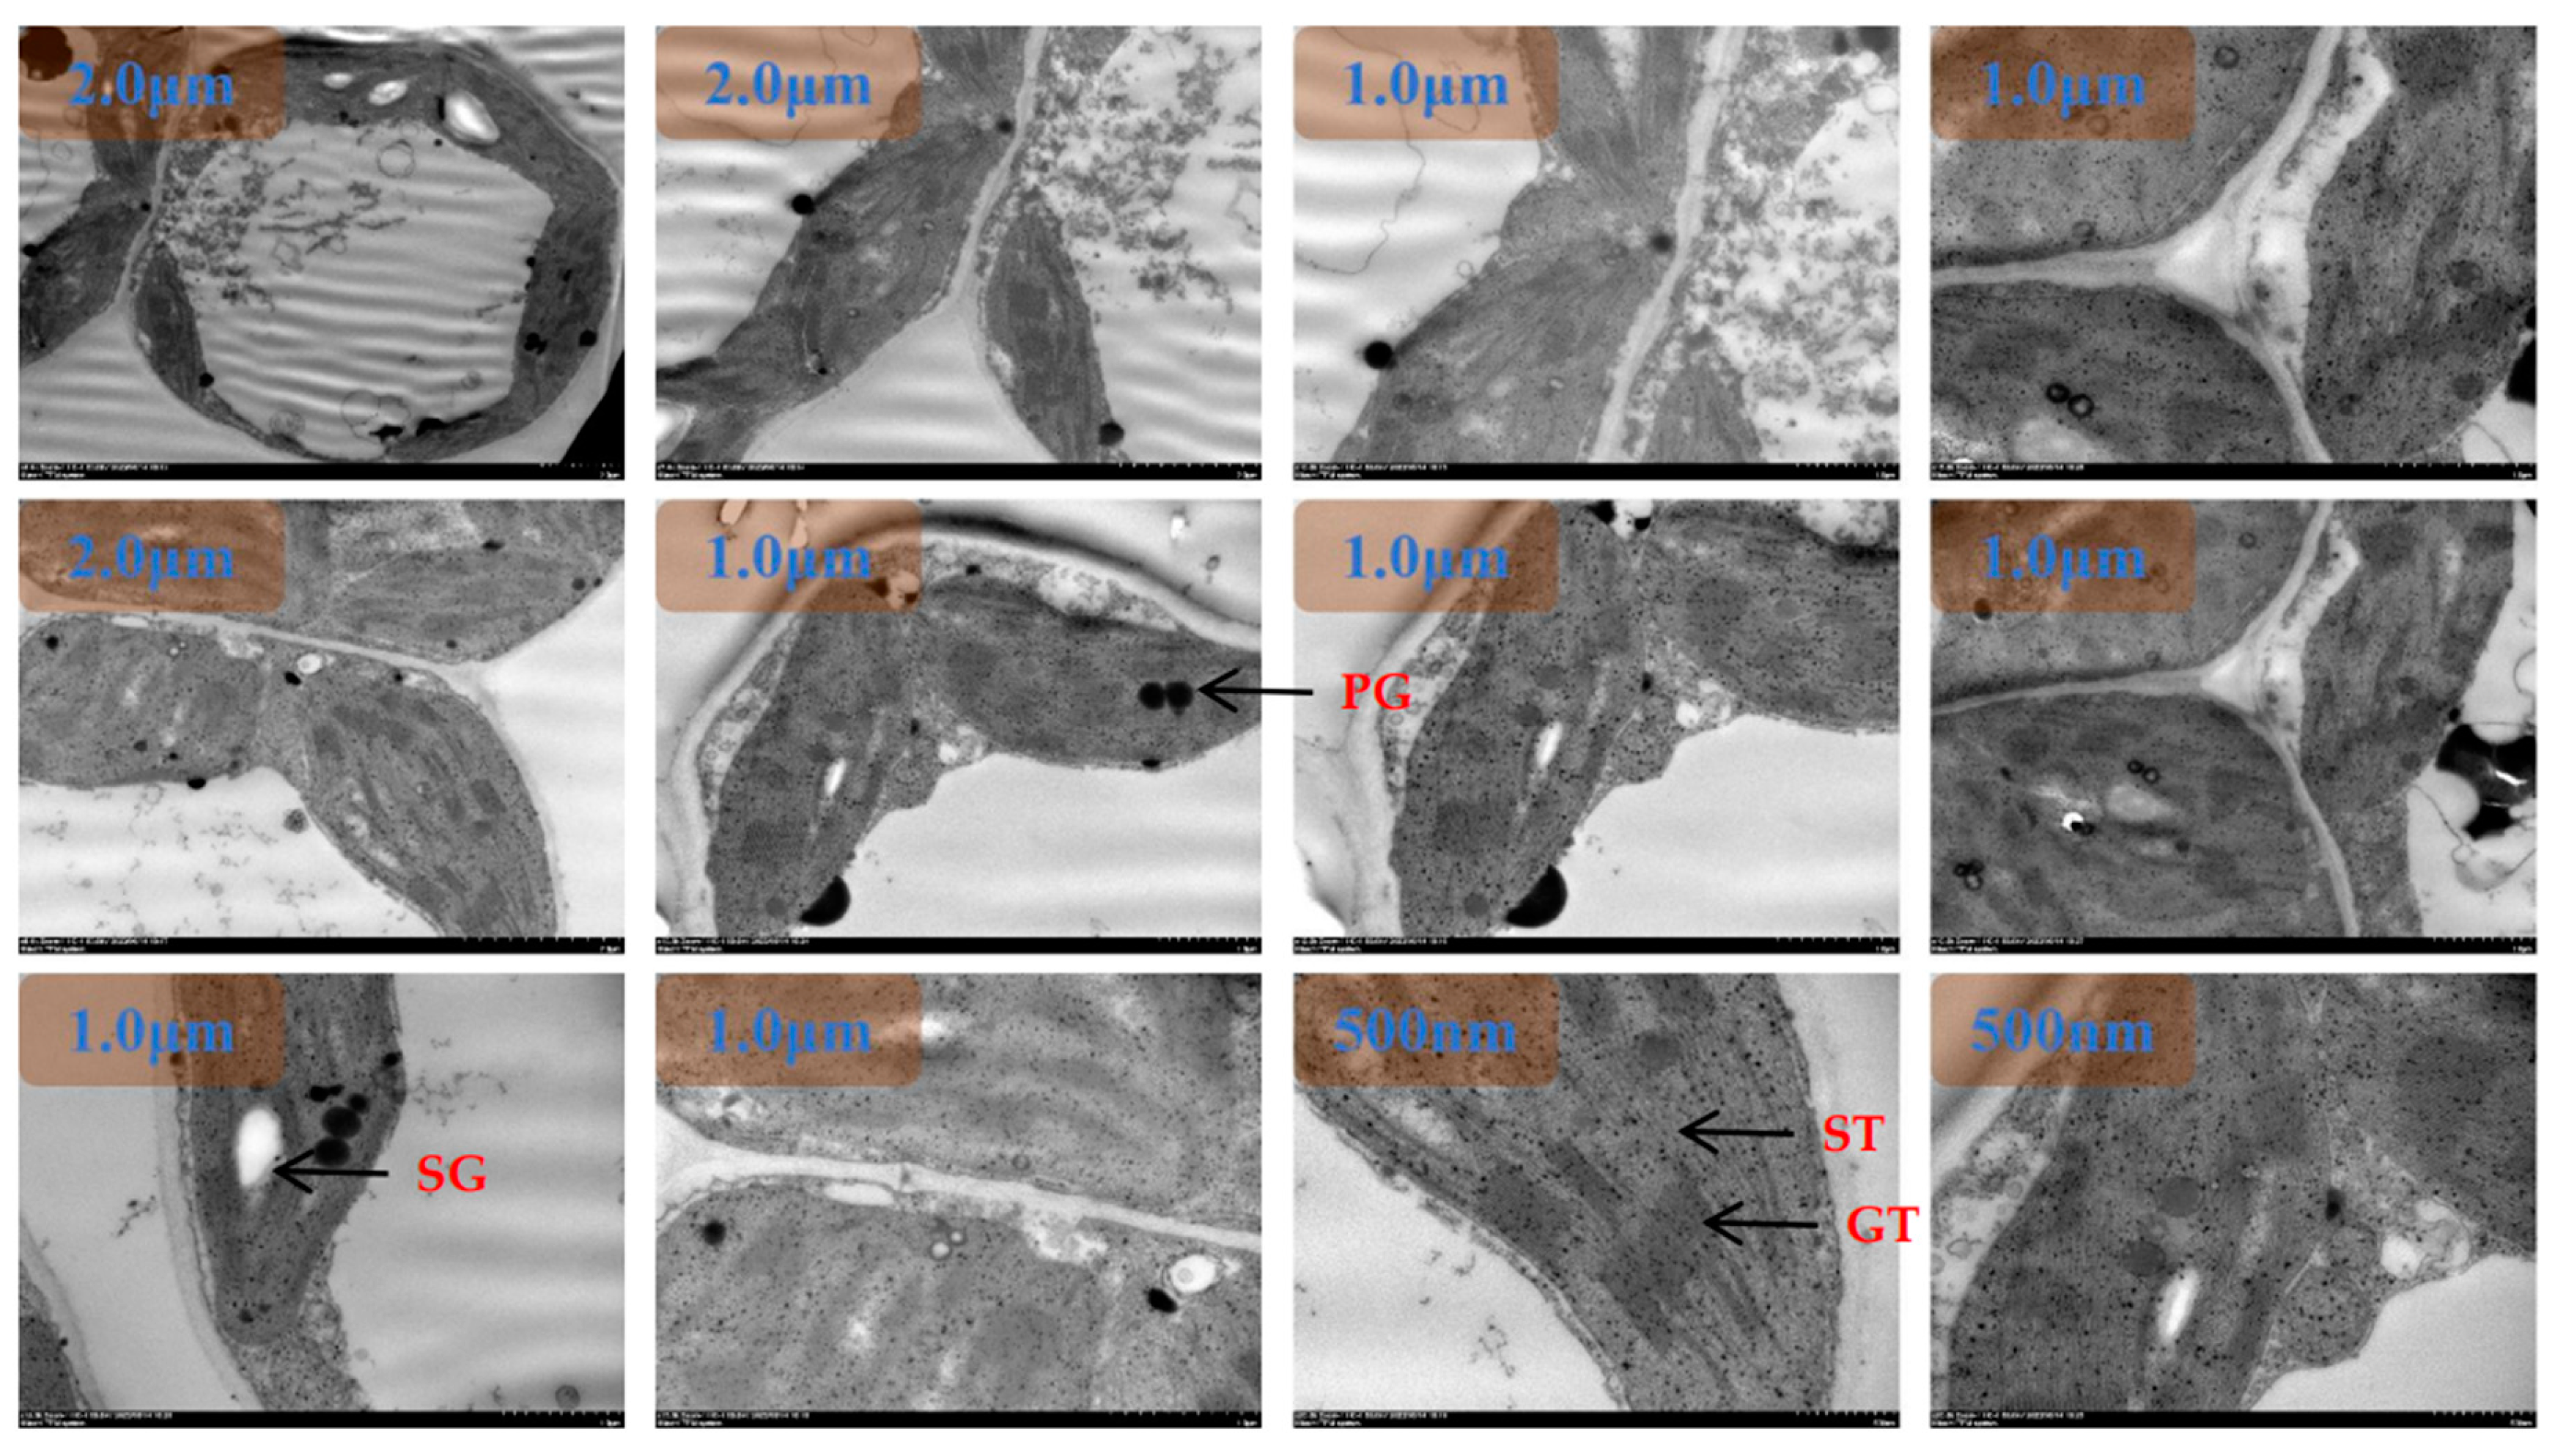
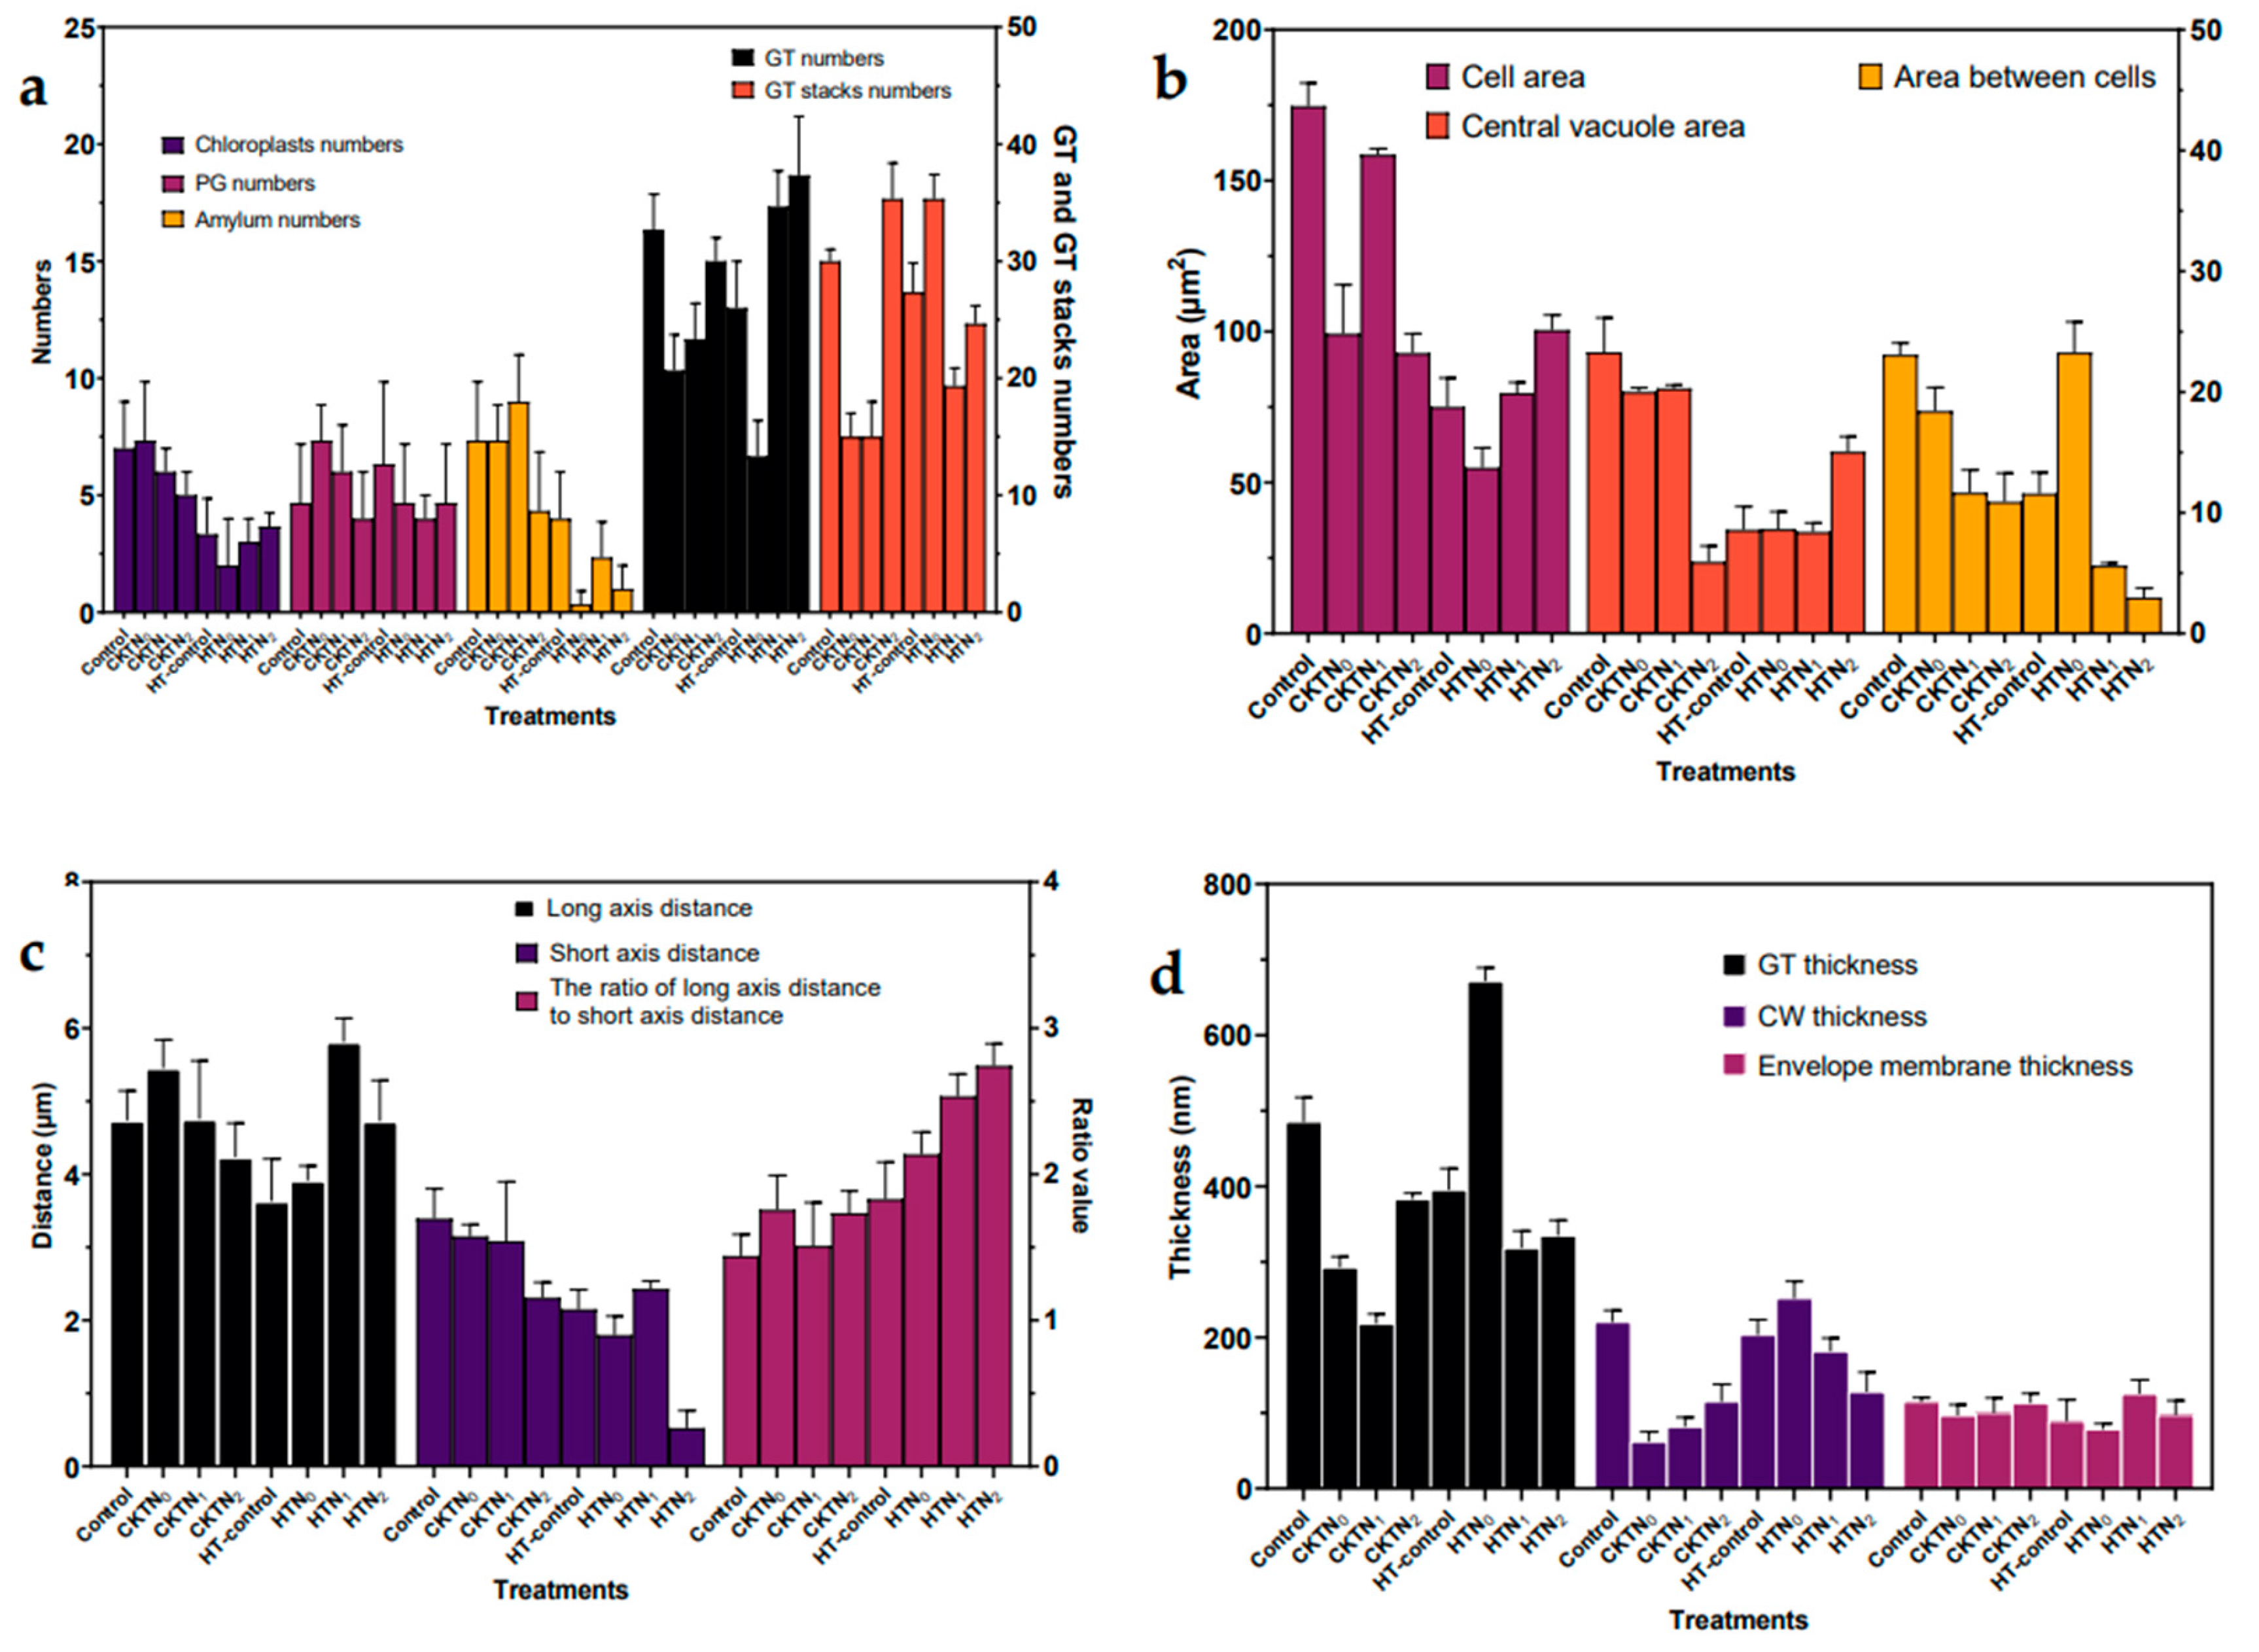
First, the degree of chloroplast differentiation increased at the onset of heat stress, which was higher in the low-nitrogen treatment than in the high-nitrogen treatment. The division of plastids started with the constriction in the middle of the plastid. As seen in
Figure 13a-d, the dichotomy of chloroplasts was seen in the middle. The constriction becomes deeper and tighter, forming a very narrow isthmus before the two daughter cells are completely separated. The division mechanism consists of two constriction ring systems: an inner ring located on the matrix side of the inner pericycle and an outer ring formed on the cytoplasmic side of the outer pericycle. The inner ring subunit is thought to be a homolog of the FtsZ protein, which plays a role in cell division in cyanobacteria (thought to be endosymbiotic precursors of chloroplasts). The outer ring contains a polysaccharide ring composed of polyglucose chains and an associated dynamin. The dynamin proteins are composed of a mechanical protein, and they are also involved in the contractile ring of the lattice protein-encapsulated vesicle outgrowth, as well as in the formation of dumbbell-shaped vesicles assembled by the cell plate. Chloroplast division begins with the formation of the FtsZ ring, which recruits cytoplasmic glycosidyltransferases to the contractile site, producing polyglucose molecules that eventually form the polysaccharide ring; in turn, the polysaccharide ring serves as a template for the kinesin molecules that produce the contractile force.
The number of chloroplasts in the spongy tissue chloroplasts of tomato leaves observed by transmission electron microscopy at control temperature increased and then decreased with the increase of nitrogen application. The number of chloroplasts in cell of the leaf spongy tissue was the highest under the optimum nitrogen application rate N4. Under the high temperature treatment at 40°C, the number of chloroplasts increased more slowly with the increase of nitrogen application, and both were significantly smaller than the control temperature treatment.
Second, the addition of N changes the morphology and distribution of certain genomes in the chloroplast. Many of the genes in the plastid genome form polycistronic transcriptional units, that is, two or more genes form a cluster and are transcribed by RNA polymerase from a single promoter. This is somewhat similar to prokaryotic manipulators; however, unlike prokaryotic manipulators, the plastid genome also contains polycistronic transcriptional units composed of functionally distinct genes. Typically, mRNAs for genes encoding photosynthetic proteins tend to be present in nonphotosynthetic plastids as well, such as pollen-forming bodies in roots and chloroplasts in tomato fruits. Apparently, these mRNAs are not translated into functional proteins. These findings illustrate the important role of posttranscriptional regulation in the regulation of plastid gene expression.
Third, the addition of nitrogen affected the structure of chloroplast-like vesicles. Photosystem I and the ATP synthase complex are present only in the unfastened regions of the stroma and stroma stacks. Photosystem II and light-trapping complex II are found mainly in the adherent regions of the stacked oocysts. This segregation of protein complexes between membranes on the adherent side of the stacked region and membranes on the unfastened side of the unstacked region is called lateral heterogeneity of the photosynthetic membrane system. The vesicle-like stacking structure is common in green plants and is thought to be involved in regulating the partitioning of absorbed light energy between photosystem I and photosystem II in photosynthesis. plastoglobuli are lipoproteasomes formed by a single layer of polar lipids surrounded and attached to the stromal side of the cystoid membrane. The lipid cores contain various types of isoprenylbenzoquinones [α-tocopherol (vitamin E), chlorophyll quinone (vitamin K1), plastoquinone, and methylnaphthoquinone], as well as the degradation products of carotenoids, neutral lipids, and chlorophyll. The boundary layer is composed of a monolayer of galectin glycerol, structural proteins called plastoglobulins, and enzymes involved in the synthesis and metabolism of core lipids. The size and number of plastoglobulins change during plastid development and differentiation; the number of plastoglobulins becomes larger in response to environmental stresses (e.g., intense light, drought, high salt and high ozone environments) and during senescence.
3.2. Nitrogen levels correlate with changes in the spatial distribution and amounts of some elements in chloroplasts
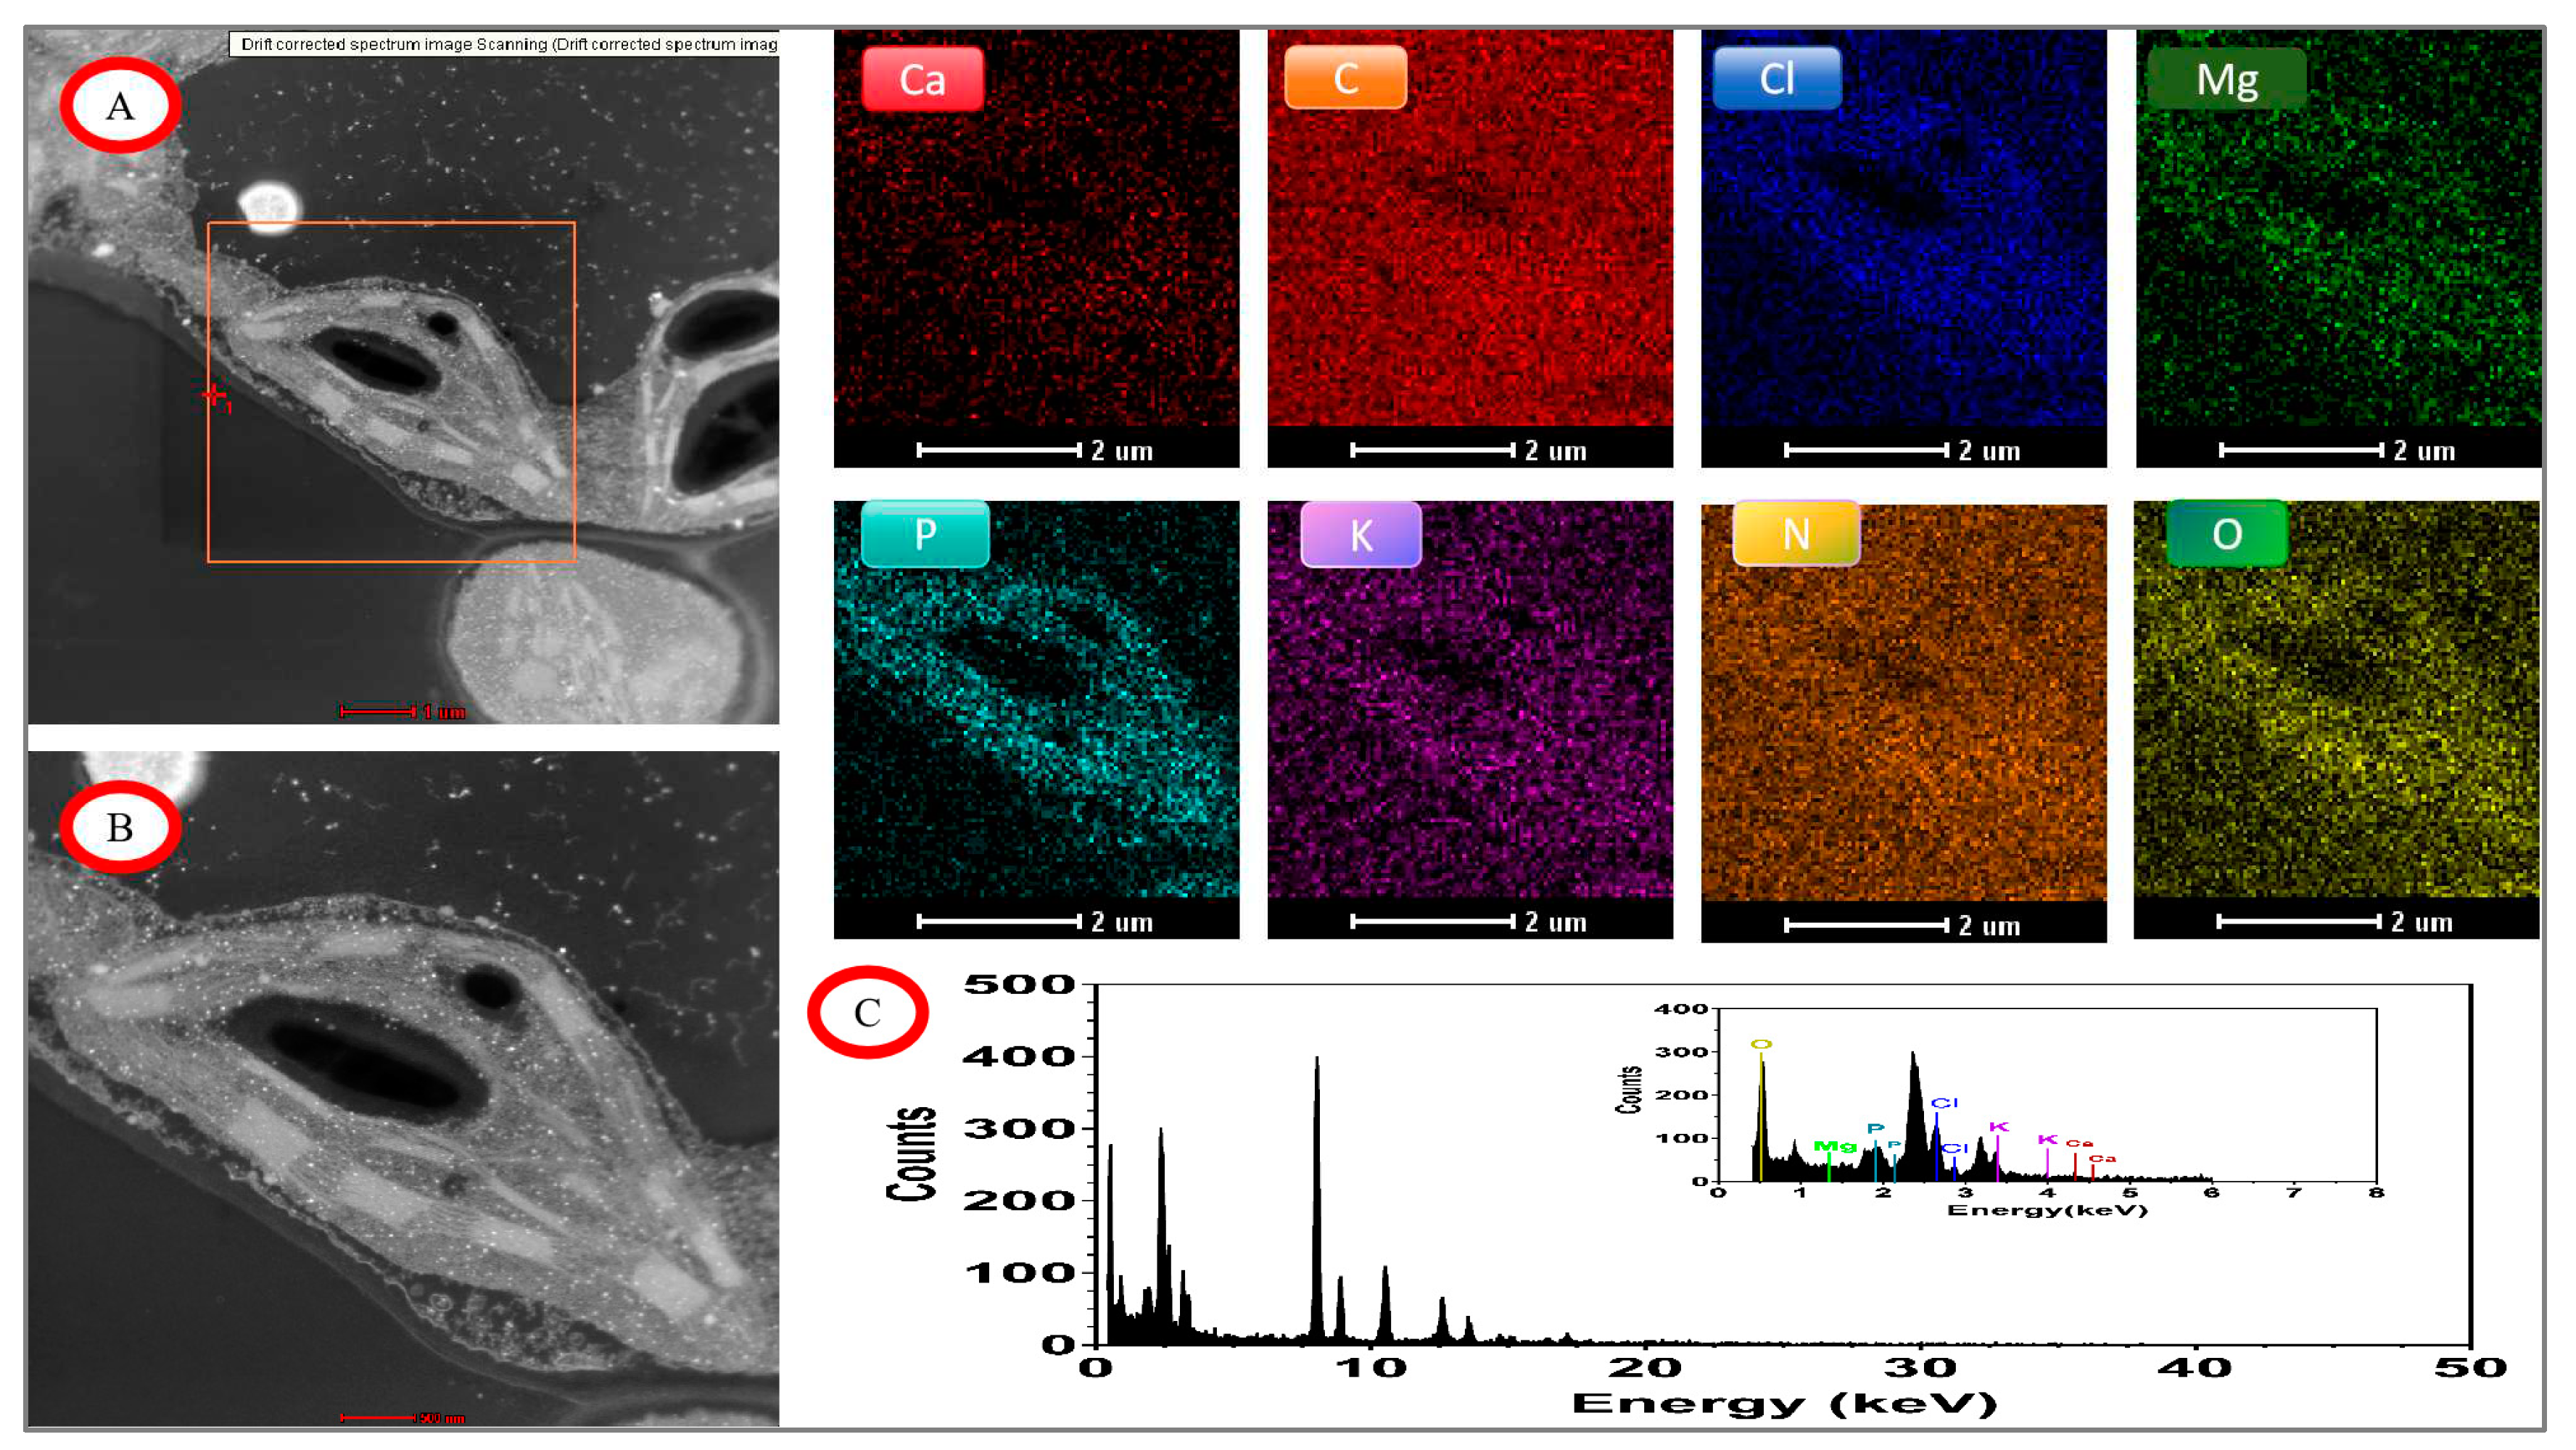
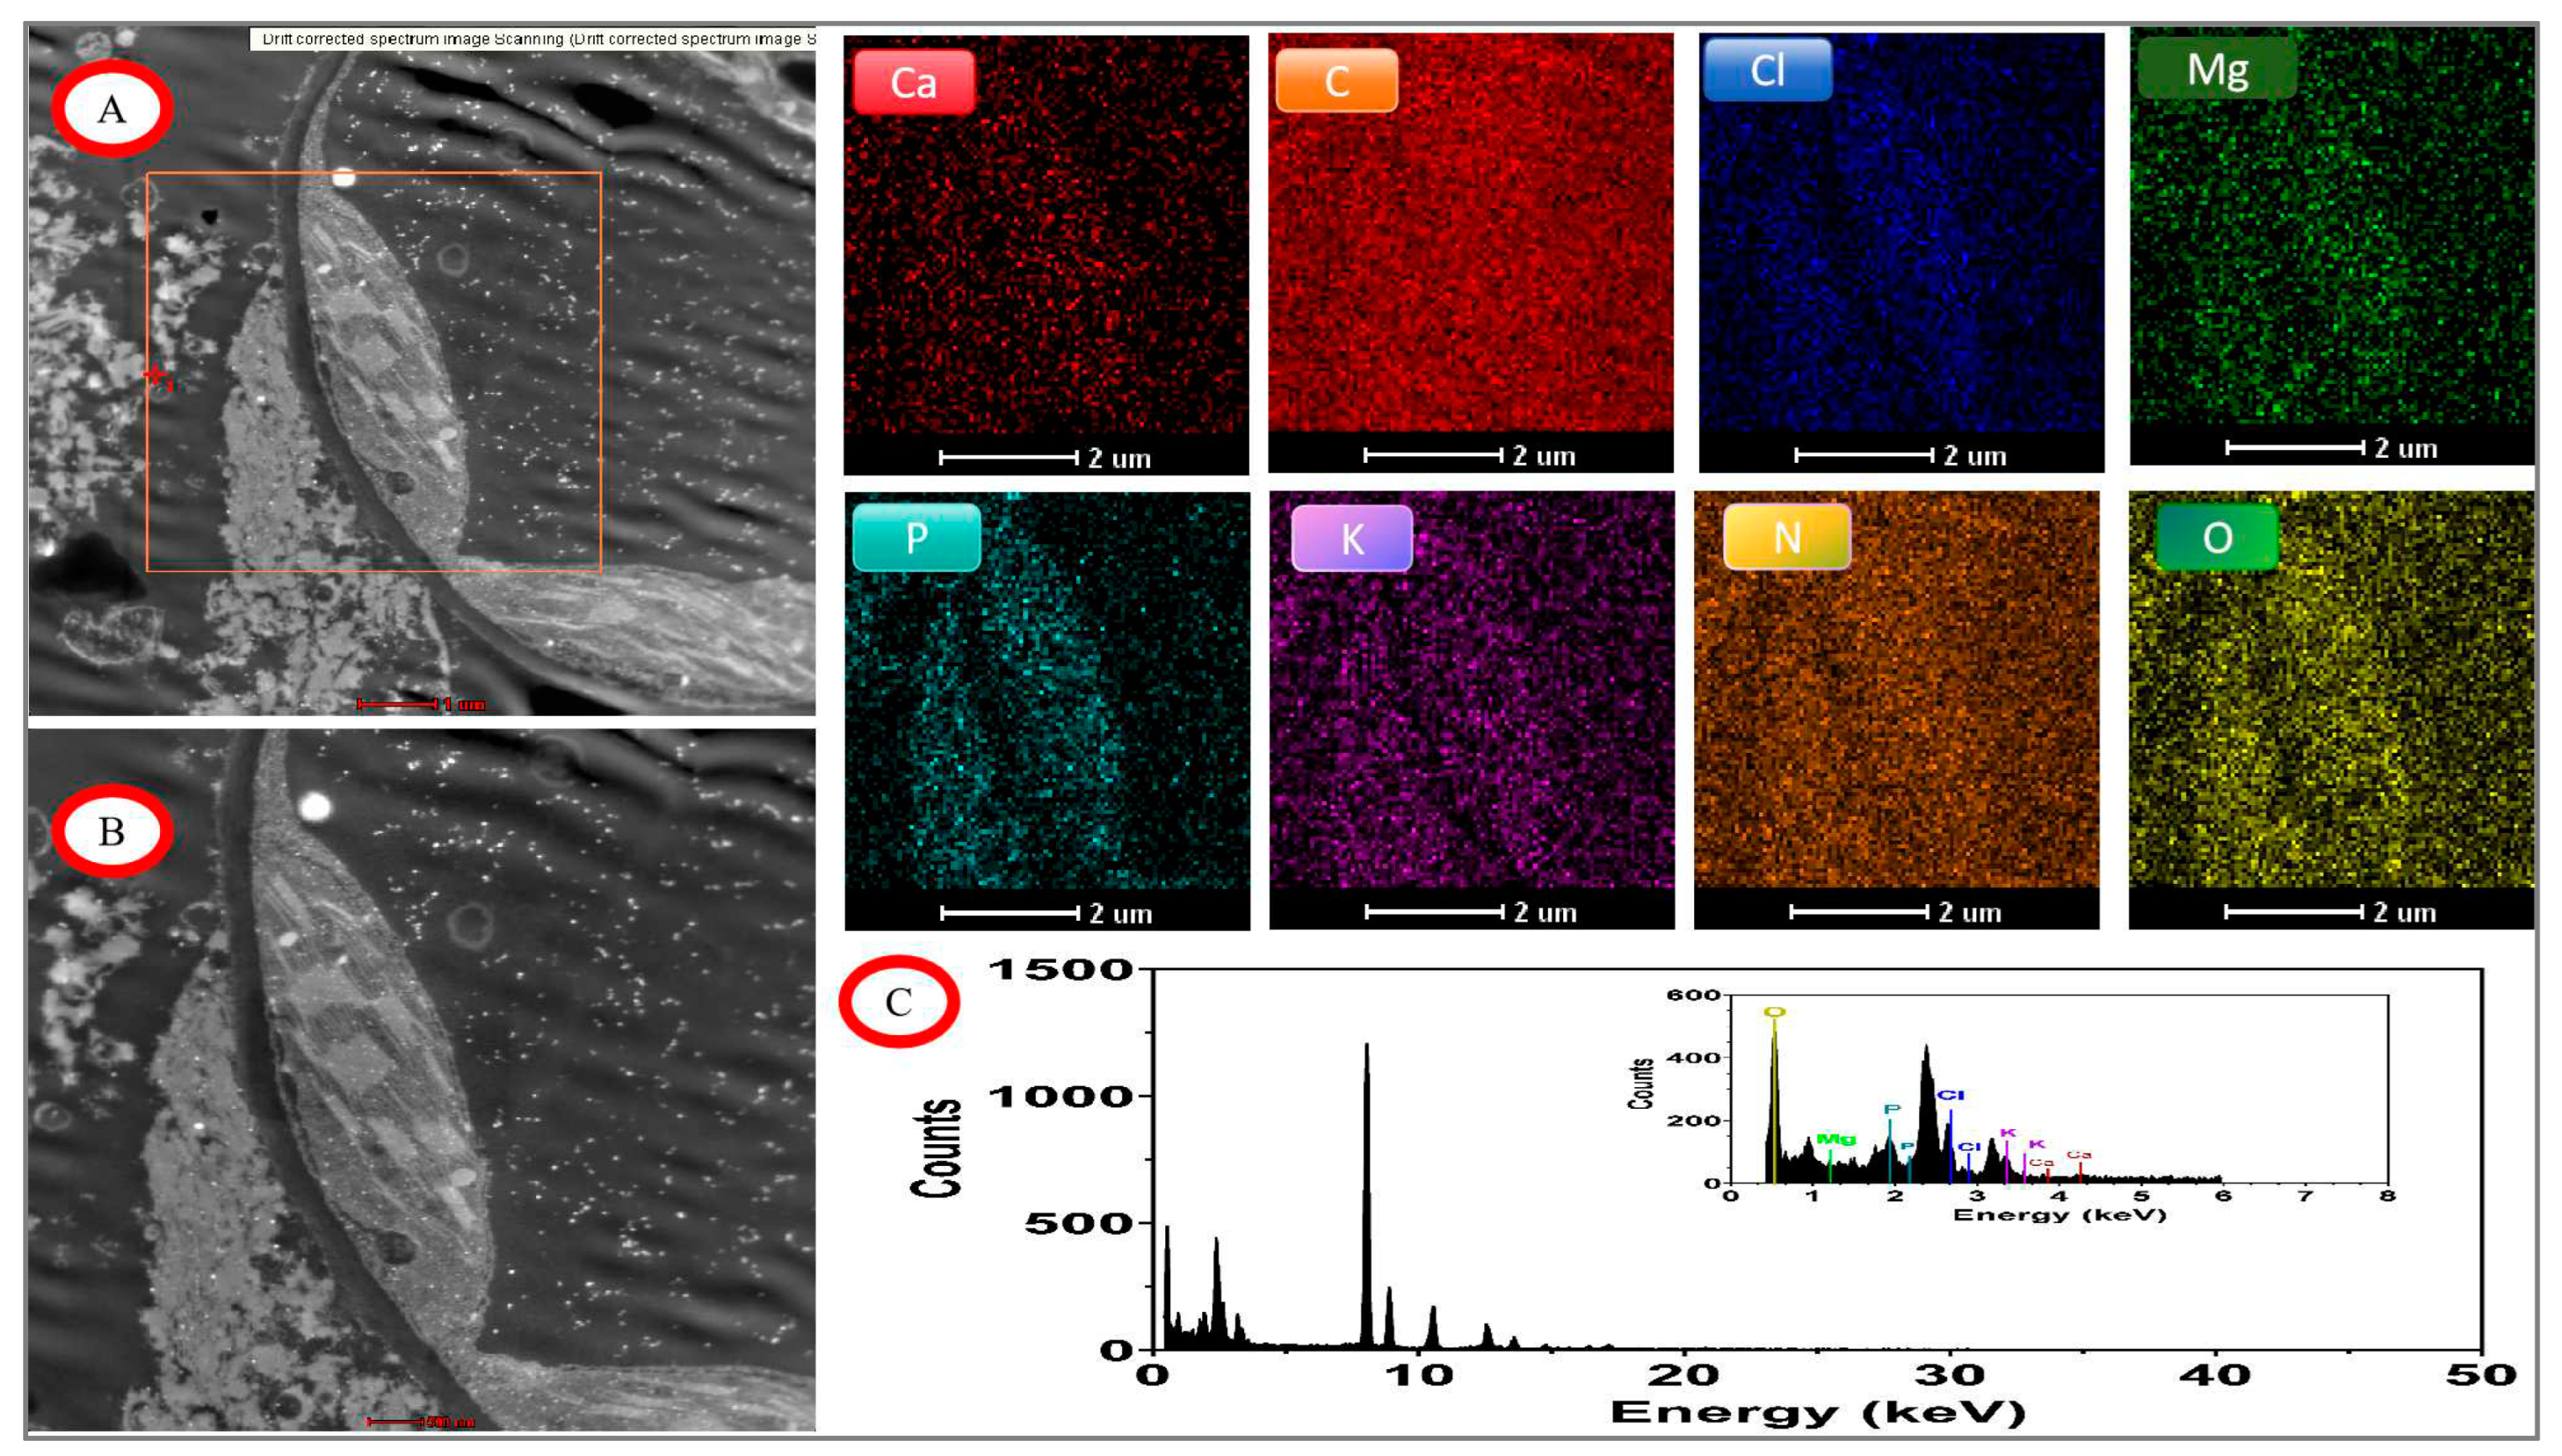
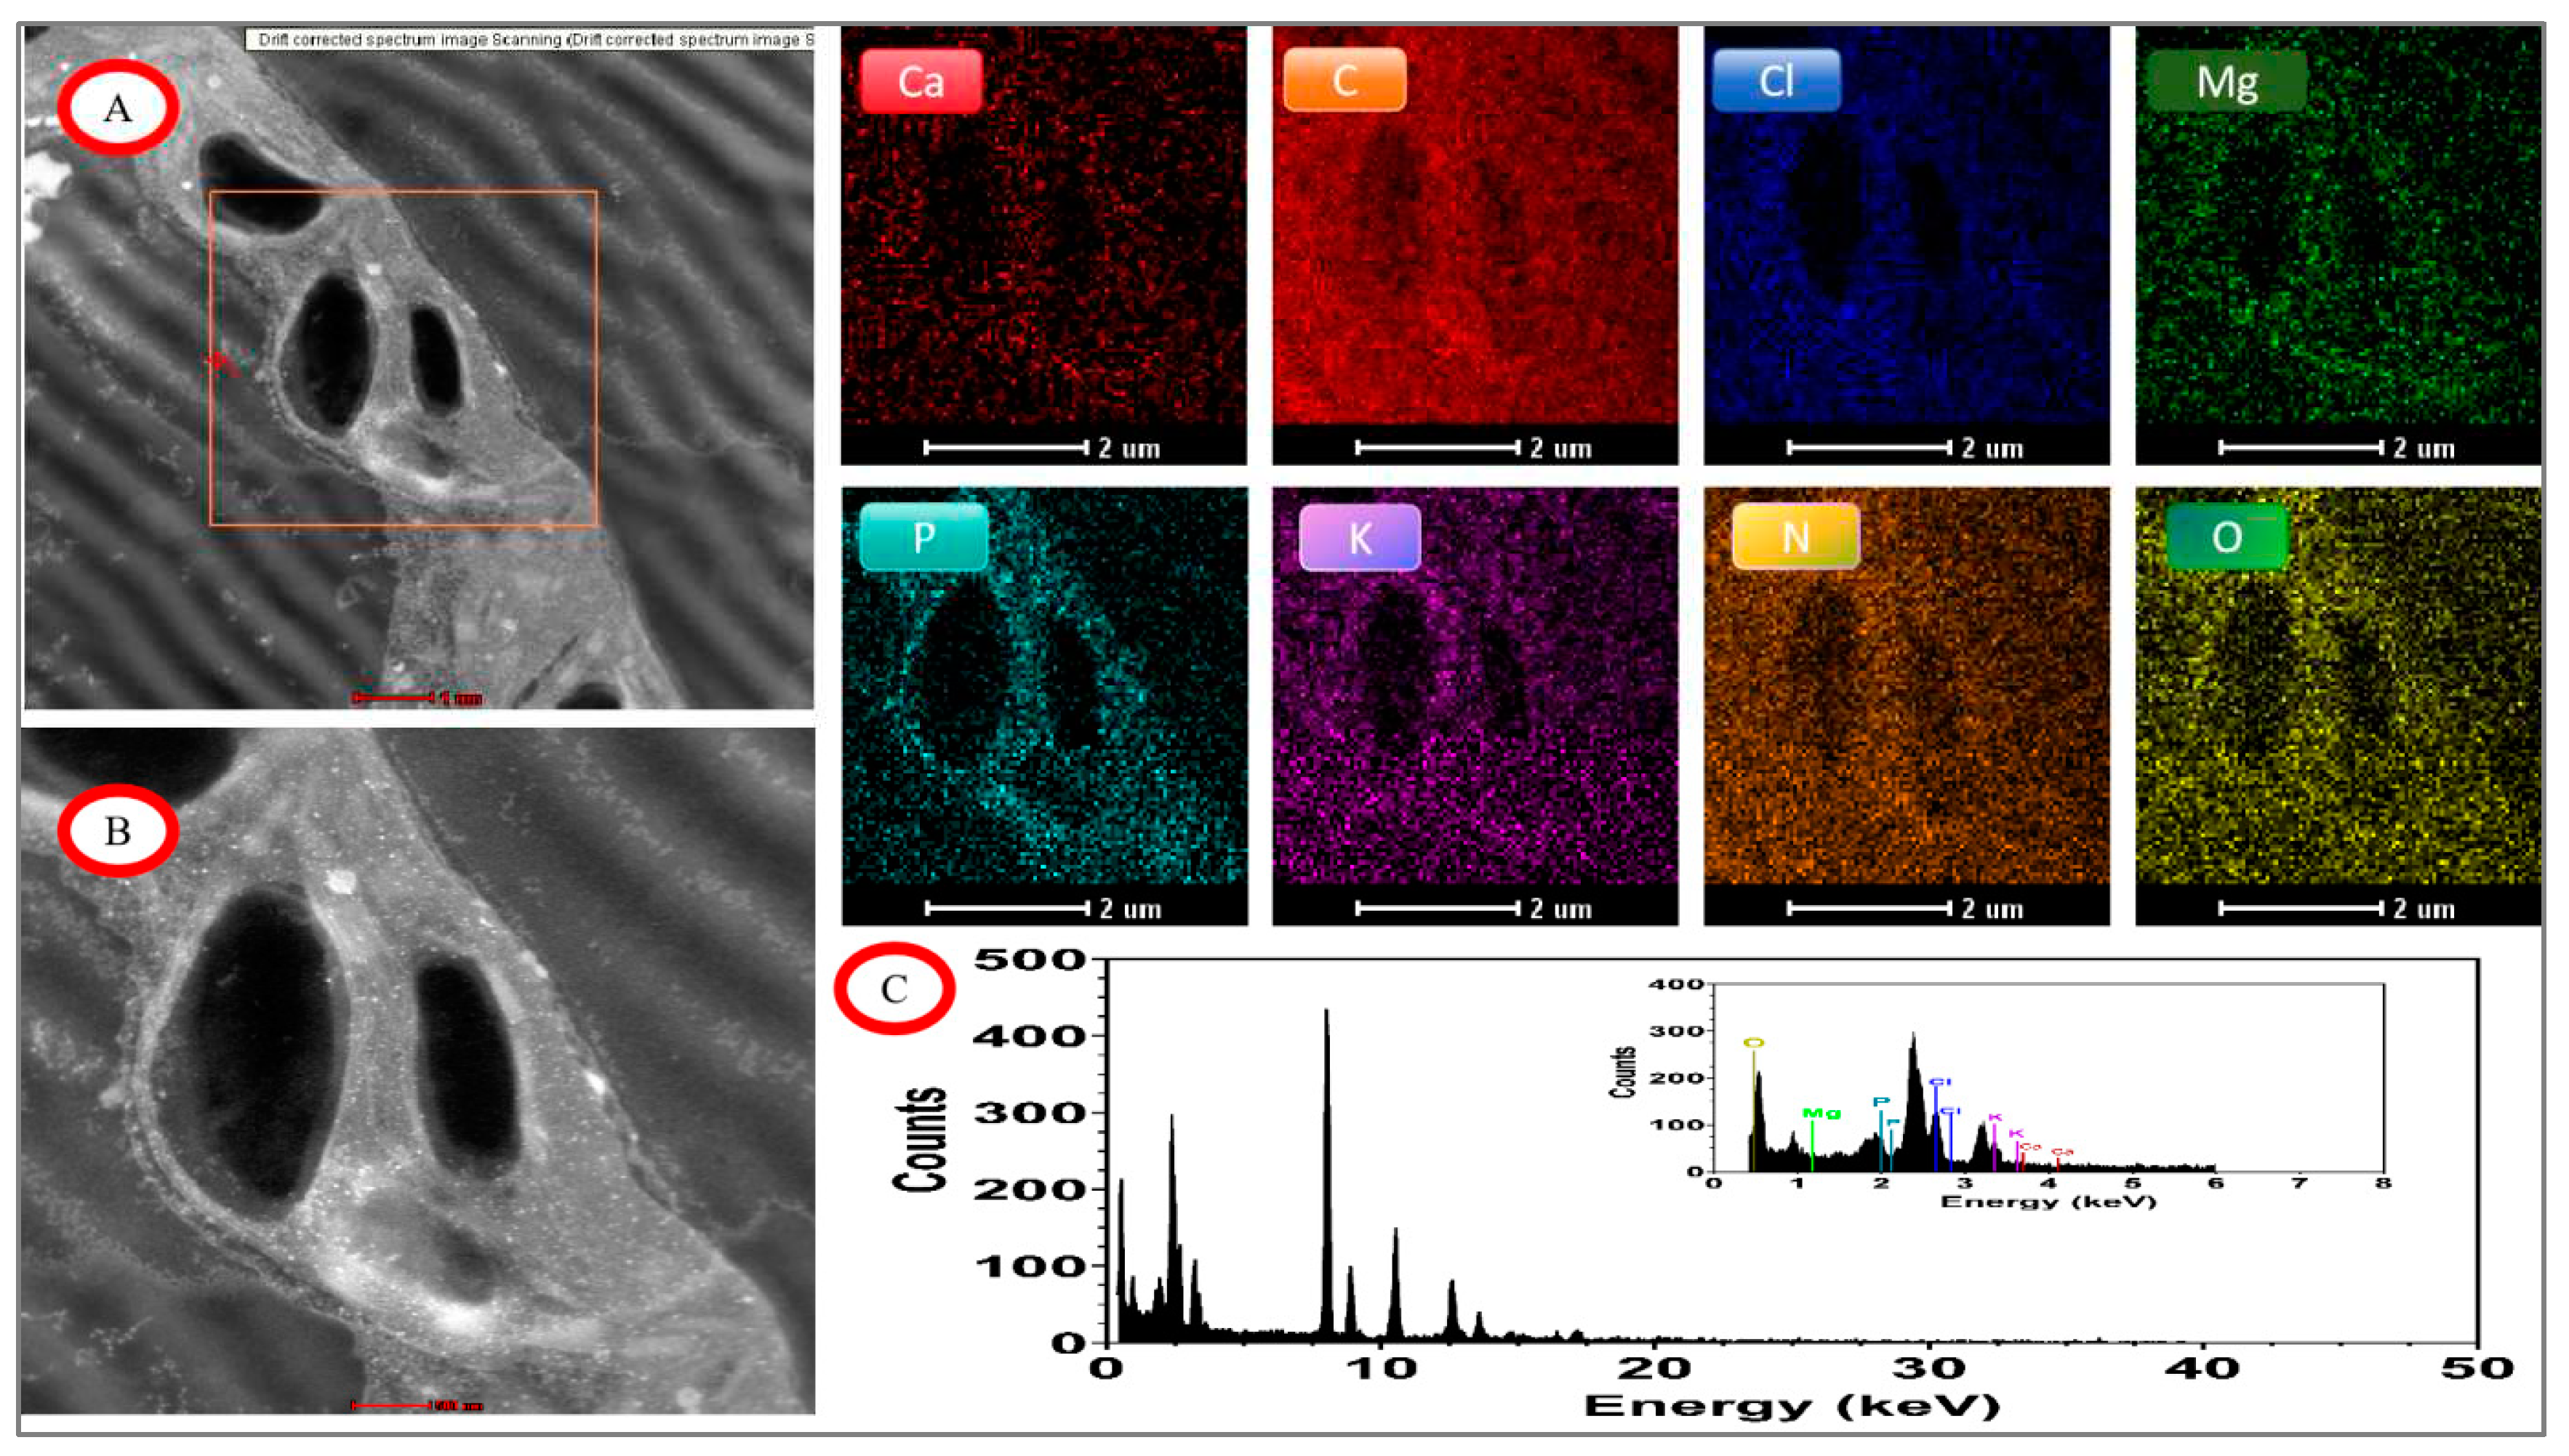
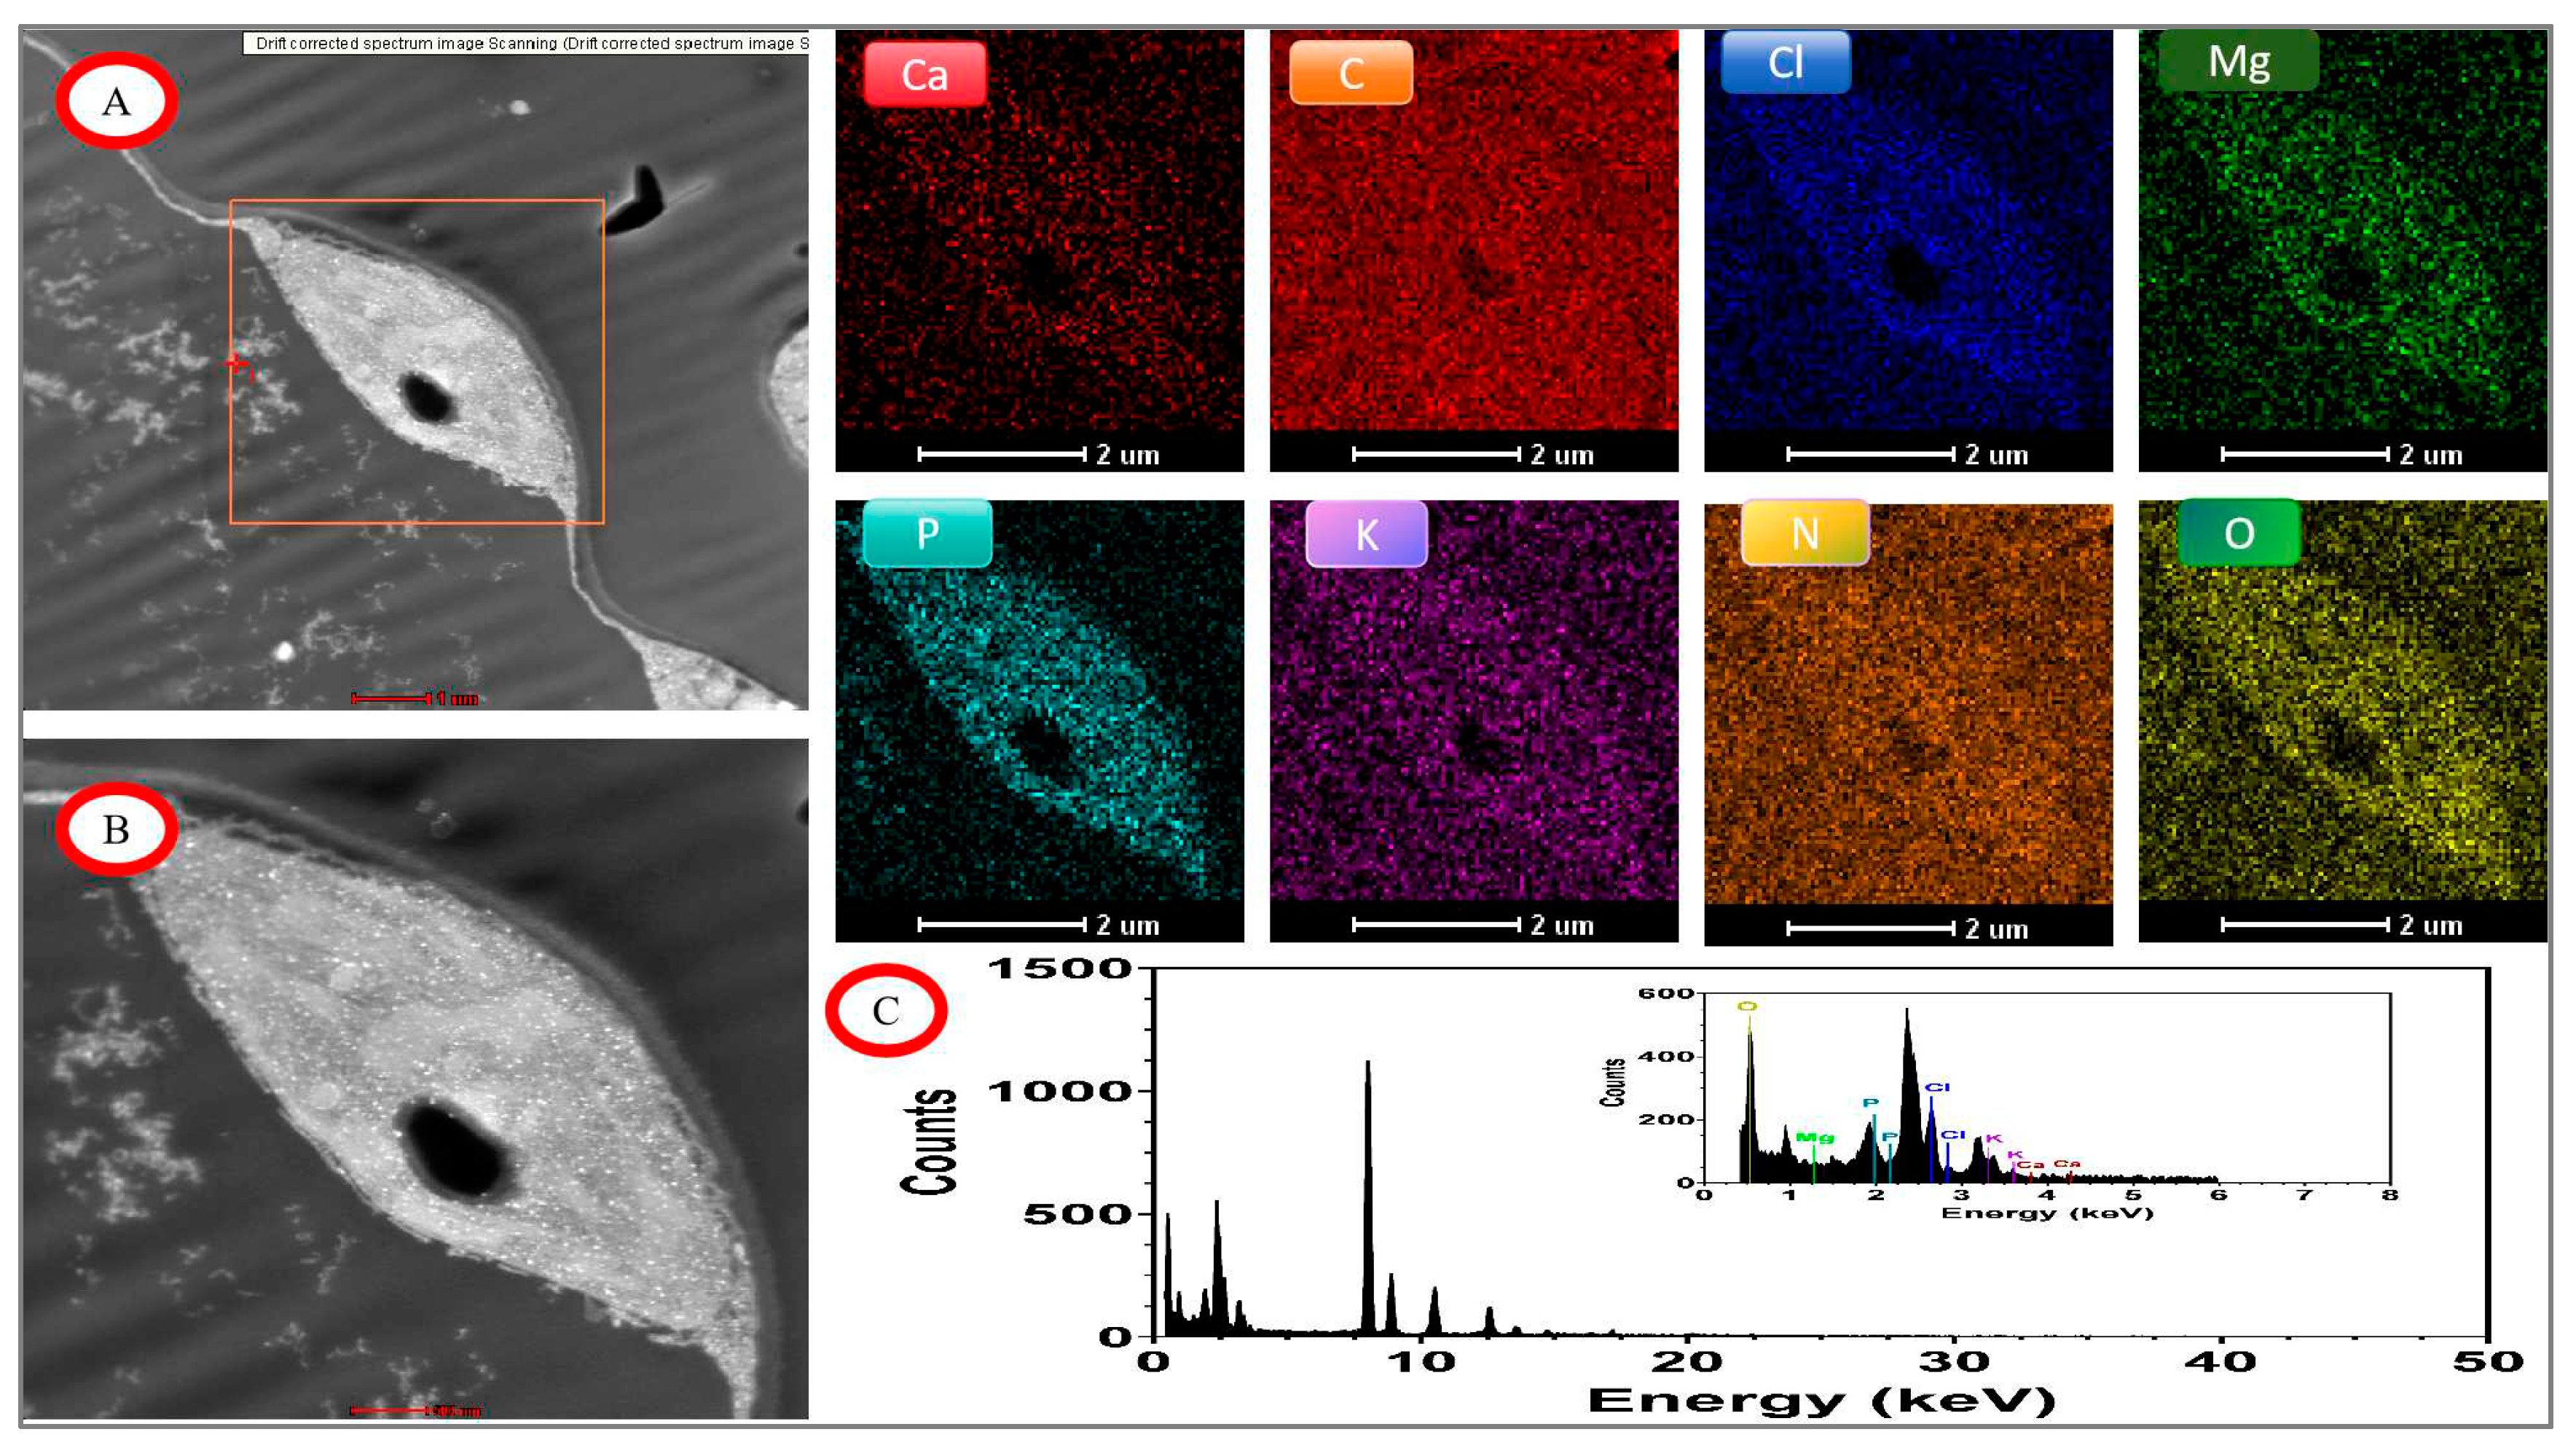
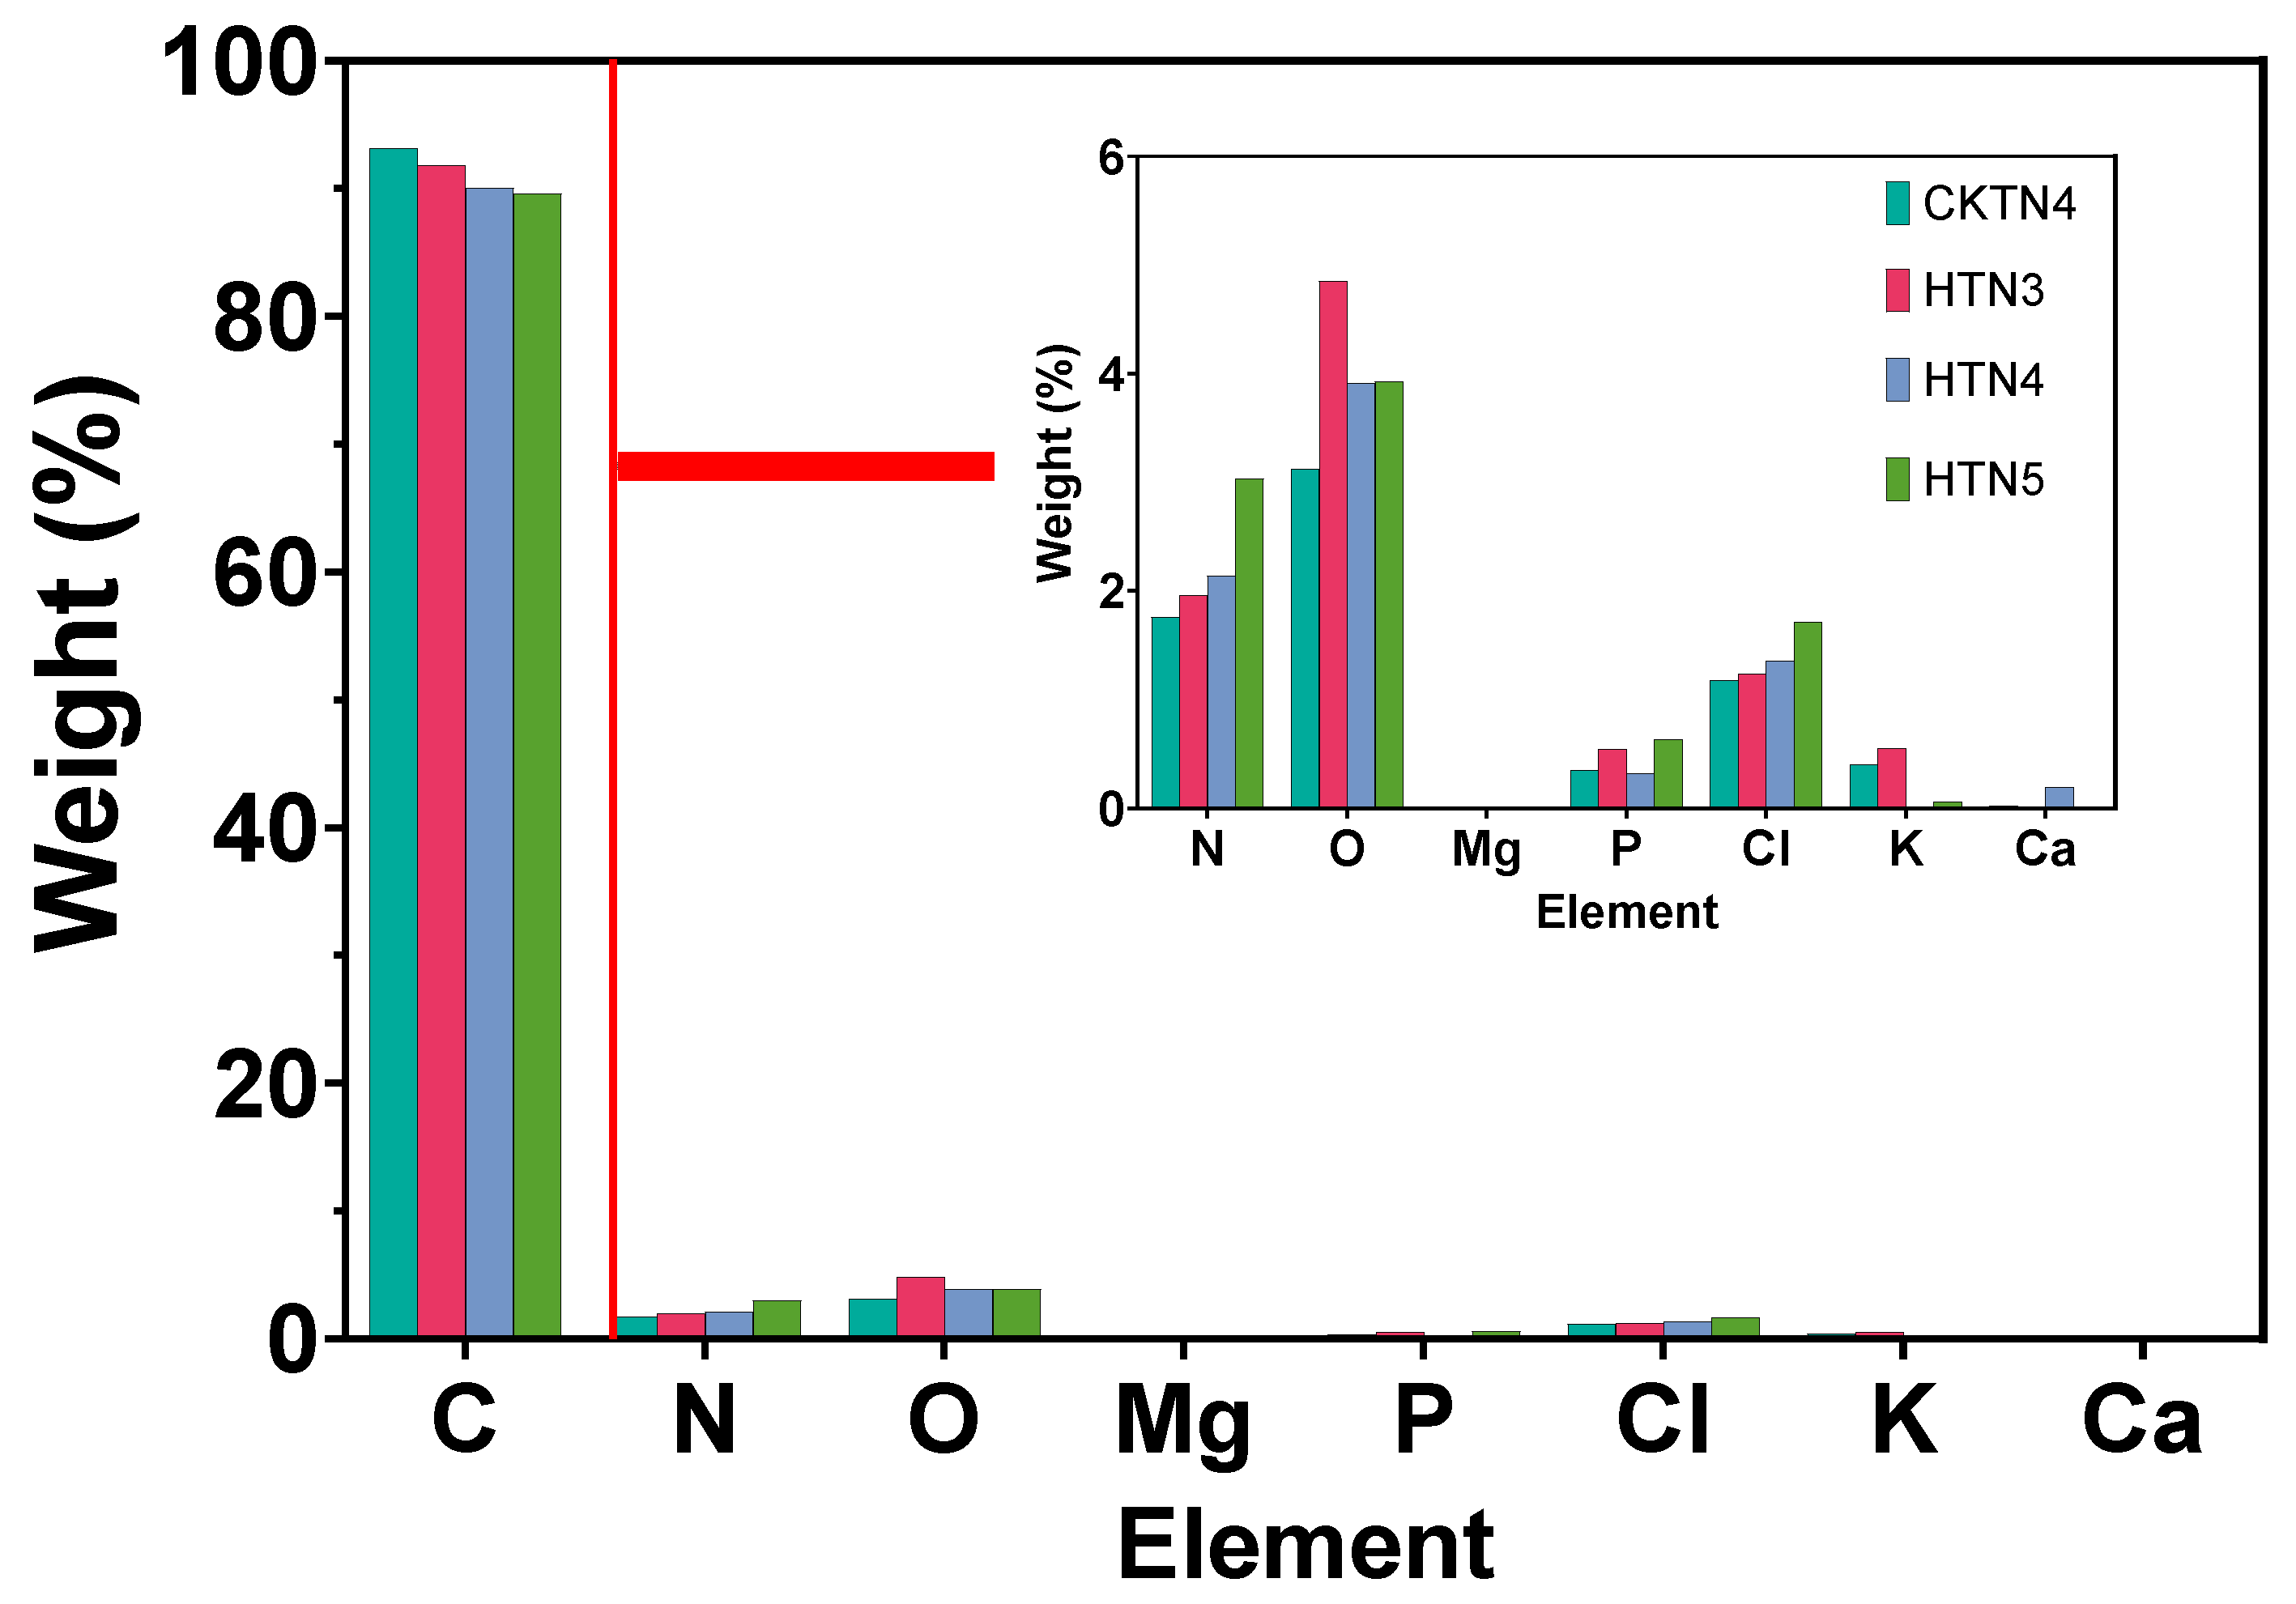
Further analysis of EDX-mapping elements showed that nitrogen translocation to chloroplasts increased with increasing N application under high temperature stress, but carbon content decreased with increasing N application(
Figure 14). The chloroplasts under low nitrogen treatment N2 had the highest amount of elemental oxygen and presumably the highest amount of carbon oxides (e.g., sugars such as starch). Oxygen elements in chloroplasts under the recommended nitrogen application N3 and high nitrogen N4 treatments, on the other hand, did not change significantly. This result suggests that excess nitrogen did not produce more sugars even though it was transported into the chloroplasts. Meanwhile, the content of P element in chloroplasts was higher under N2 treatment, and it was speculated that the excess nitrogen might be combined with P element to form phosphate-like compounds. Specific analyses are discussed below.
First, nitrogen levels correlate with P elements and alter the extent of starch breakdown and storage in chloroplasts under heat stress. Previours study showed that N level had no substantial effects on the deposition of starch, but altered the accumulation of protein, and the responses of protein accumulation to the effects of temperatur [
28,
29]. In contrast, we found that nitrogen levels affected the number, area, and morphological structure of starch grains in chloroplasts under 40 °C/30 °C high-temperature treatment. This may be related to the phosphorylation degradation process of starch. Elemental P, widely present on chloroplast-like vesicles and distinguishes the boundary between chloroplasts and other structures such as the cytoplasm and cell wall. The distribution on the stroma is significantly redundant with that of the stroma-like vesicles. The most obvious feature is that under heat stress, elemental P surrounds the starch granules in an encircling ring. Starch is the most prevalent form of carbohydrate storage in plants, and it accumulates in many different tissues and organs, including chloroplasts in leaf cells. The semi-crystalline lamellar structure of starch granules, which originates from the extrusion of adjacent double helical branched starch chains, creates a structure that is less likely to be attacked by starch-degrading enzymes [
30]. The first step in starch degradation in chloroplasts is the phosphorylation of a small proportion of the glucose residues of branched-chain starch in the presence of two enzymes, including glucan, water dikinase (GWD) and phosphoglucan, water dikinase (PWD).GWD binds to the surface of the starch granule and introduces a phosphoryl group at the C-6 position of the glucose residue (reaction 1). PWD then binds to the phosphorylated starch and introduces another phosphorylated group at the C-3 position of the glucose residue (Reaction 2).
Phosphorylation changes the nature of the particle surface, with the hydrophilic phosphate group interrupting the arrangement of the double helix and destabilizing the double helix itself. This makes the exposed dextran chains more sensitive to a range of enzymes that can degrade glycosidic bonds. Carbon assimilation, which depends on ribulose-1, 5-bisphosphate carboxylase/oxygenase (Rusbiso), is one of the major place sensitive to heat stress in photosynthesis [
31]. During heat stress, the degree of phosphorylation on the surface of starch granules in chloroplasts at different levels of nitrogen application could be obtained based on the quantitative analysis of phosphorus, HTN4>HTN2>control>HTN3. further quantitative analysis of C element could be obtained to show the change of starch content in chloroplasts, control>HTN3>HTN2>HTN4. both low nitrogen N2 treatment and high nitrogen N4 treatment changed the degree of phosphorylation on the surface of starch granules in chloroplasts, making the chloroplasts more sensitive to a range of enzymes that can degrade glycosidic bonds. The degree of phosphorylation on the surface led to an increase in the content of P element in chloroplasts. The increase in starch phosphate content and accelerated starch degradation can be indicated, leading to a low level of starch accumulation in the leaves, which ultimately led to a decrease in the dry matter accumulation of the leaves.
Second, nitrogen levels affect the spatial distribution and content of elemental Cl in chloroplasts. Elemental chlorine is absorbed by plants in the form of Cl- and is mainly involved in photosynthesis in plants. In photosynthesis, chlorine participates in the photolytic water-oxygenation reaction of photosynthesis system II as a cofactor of the manganese-containing oxygen-excreting system. It helps to stabilize manganese ions in a higher oxidation state, and it also promotes photosynthetic phosphorylation. At the same time, chlorine accumulates preferentially in chloroplasts and plays a protective role in the stabilization of chlorophyll.
Multiple signaling pathways are present in the heat stress response, along with cross-linking in the oxidative stress response. Cytoplasmic H2O2 production is induced during heat stress and leads to cellular damage. Oxygen burst is associated with the expression of genes that cause heat stress induction, possibly as a result of direct perception of H2O2 by HSF. Other signaling molecules such as calcium ions are also involved. In the present study, calcium levels were found to be significantly elevated in passing. A great deal of research work still needs to be done on the perception, signaling process, regulatory network and how HSP recognizes target proteins for folding and degradation during heat stress. It is hoped that by combining the knowledge of crystallography with material science, the EDX mapping system equipped with transmission electron microscope can be used to further analyze the structural changes of molecules and constituent elements related to heat stress in chloroplasts at the nanometer scale.
Third, nitrogen levels affect the spatial distribution and content of elemental Ca in chloroplasts. Heat stress can lead to an imbalance in calcium ion homeostasis in plants, affecting plant growth and development. During photosynthesis, calcium ions can improve plant photosynthesis by maintaining the stability of its photochemical stages. It was found that under heat stress, the activity of the cystoid protein complex, which comprises the cystoid membrane structure, can be protected by calcium ions, resulting in enhanced activity of the membrane ATPase.
Therefore, under heat stress, calcium ions in chloroplasts may be involved in the plant's anti-stress response and have an effect on plant growth and photosynthesis.
Besides, nitrogen levels affect the spatial distribution and content of elemental Mg in chloroplasts. Under heat stress, chloroplast magnesium ions may act through several mechanisms: 1. Stabilizing chloroplast structure: Magnesium ions are a component of chlorophyll in chloroplasts, and they may help maintain the structure and function of chloroplasts. Under heat stress, chloroplasts may be damaged, and the presence of magnesium ions can reduce this damage, thereby protecting the integrity of the chloroplasts. 2. Participation in photosynthesis: Photosynthesis is an important process in plant growth and development, and magnesium ion is one of the key elements in photosynthesis. Under heat stress, photosynthesis may be inhibited, and the presence of magnesium ions can help to maintain normal photosynthesis. 3. Regulation of ionic balance: Under heat stress, the ionic balance in plants may be disrupted, leading to changes in ion concentrations. Magnesium ions can interact with other ions to regulate the ionic balance, thus helping plants to adapt to the heat stress environment. 4. Antioxidant effect: Heat stress can lead to the production of large amounts of reactive oxygen species in plants, which can cause damage to plants. Magnesium ions can act as an antioxidant, scavenging reactive oxygen species from the body, thereby reducing damage to the plant. It is important to note that these mechanisms may not be independent of each other, but interact and influence each other. In addition, the mechanism of magnesium ion's action under heat stress needs to be confirmed by further studies.
The study of the regulatory role of nitrogen in combination with heat stress proteins and leaf senescence-regulated gene expression might be a future research direction. Many features of the plant response to chronic heat stress are conserved in all organisms. A typical response to acute heat stress is a rapid and transient reprogramming of gene expression, including a reduction in protein synthesis and an acceleration of transcription and translation of the heat shock protein (HSP), which functions primarily as a molecular chaperone and is involved in various aspects of birth protein folding and refolding of heat-denatured proteins. Based on their approximate molecular mass, HSP can be classified into five major groups: HSP100/Clp, whose main functions are protein depolymerisation, defolding, and degradation (Clp protease); HSP90, which promotes the maturation of signalling molecules, and genetic cushioning; HSP70, which prevents polymerisation, aids in refolding, protein trafficking, signalling, and transcriptional activation; and HSP60/Companion, which is an essential component of the HSP family of proteins, and is involved in all aspects of protein folding and heat-damaged protein refolding. The main functions of proteins are protein folding and helping refolding; the main functions of sHSP are preventing aggregation and stabilising proteins in their unnatural state. All five classes of HSP proteins are distributed in chloroplasts. Therefore, further analyses of the localisation of HSP proteins in chloroplasts are necessary in the future. Also , Some reports show that tomato SP1 and SPL2 regulate leaf senescence, revealing conserved functions of CHLORAD in plants [
32].
In the future, the use of TEM-EDX mapping to analyse the ultrastructures and constituent elements of chloroplasts at the nanometer level, in combination with crystallographic theories in materials science and physical research methods [
33,
34], will further advance the analysis of molecular structures, including genome sequencing. However, quantification of energy-dispersive X-ray (EDX) spectra collected with a scanning transmission electron microscope (STEM) or transmission electron microscope (TEM) is usually performed using the Cliff-Lorimer or ζ-factor algorithms. Both algorithms depend upon the comparison of the measured spectra with spectra collected from thin-film standards. Furthermore, the availability of thin-film standards is very limited due to the many challenges in their fabrication and characterization [
35].
4. Materials and Methods
2.1. The Plant materials and growth conditions
The experiment was conducted in the Venlo-type greenhouse (roof height × shoulder height × width × length, 5.0 × 4.5 × 9.6 × 30.0 m) of Jiangsu Key Laboratory of Agricultural Meteorology of Nanjing University of Information Science and Technology from March 2022 to August 2022. Tomato seedlings (Lycopersicon esculentum Mill., Caesar) were planted into flowerpots of size 30 cm (height) × 30 cm (upper diameter) × 25 cm (bottom diameter) filled with peat soil: perlite: vermiculite = 2:1:1(v/v/v). The tested soil was medium loam, with uniform soil fertility, pH value of 7.4.
Experiments design temperature and nitrogen two factors for a duration of 5 days. The temperature is set at two levels, with day/night temperatures of 25°C/15°C(CKT) and 40°C/30°C (HT). The four levels of nitrogen (urea, 46% N) were 0.0 kg hm-2(N1), 187.5 kg hm-2(N2), 250 kg hm-2(N3, as recommended nitrogen-application), and 312.5kg hm-2 (N4). The proportion of nitrogen applied at seedling, flowering and fruiting, green ripening and color change stages was 30%: 30%: 20%: 20%, respectively. All seedlings were divided into 8 groups of 9 pots each. Plants that absorbed nitrogen after 5 days were moved into an artificial climate chamber (BDW 40, Conviron, Canada). During the treatments, relative humidity was set at 50 to 80%, light hours were from 6:00 to 18:00 (daytime), and photosynthetically active radiation ranged from 0 to 1000 μmol m-2 s-1.
During the treatment period, three pots of tomatoes were selected and sampled on the 2nd to 3rd functional leaf from the top of the tomato. A total of 24 samples were taken in three replications. Water was supplied twice daily during the treatment period. All plants were irrigated up to 80% of field capacity (monitored by soil moisture content tester) to avoid water deficit. At the end of the treatment, all plants were moved to a Venlo-type greenhouse for recovery.
2.2. Transmission electron microscopy of tomato leaves
The tomato leaf transmission electron microscopy sample preparation was referred to the observation method of Zhou et al. [
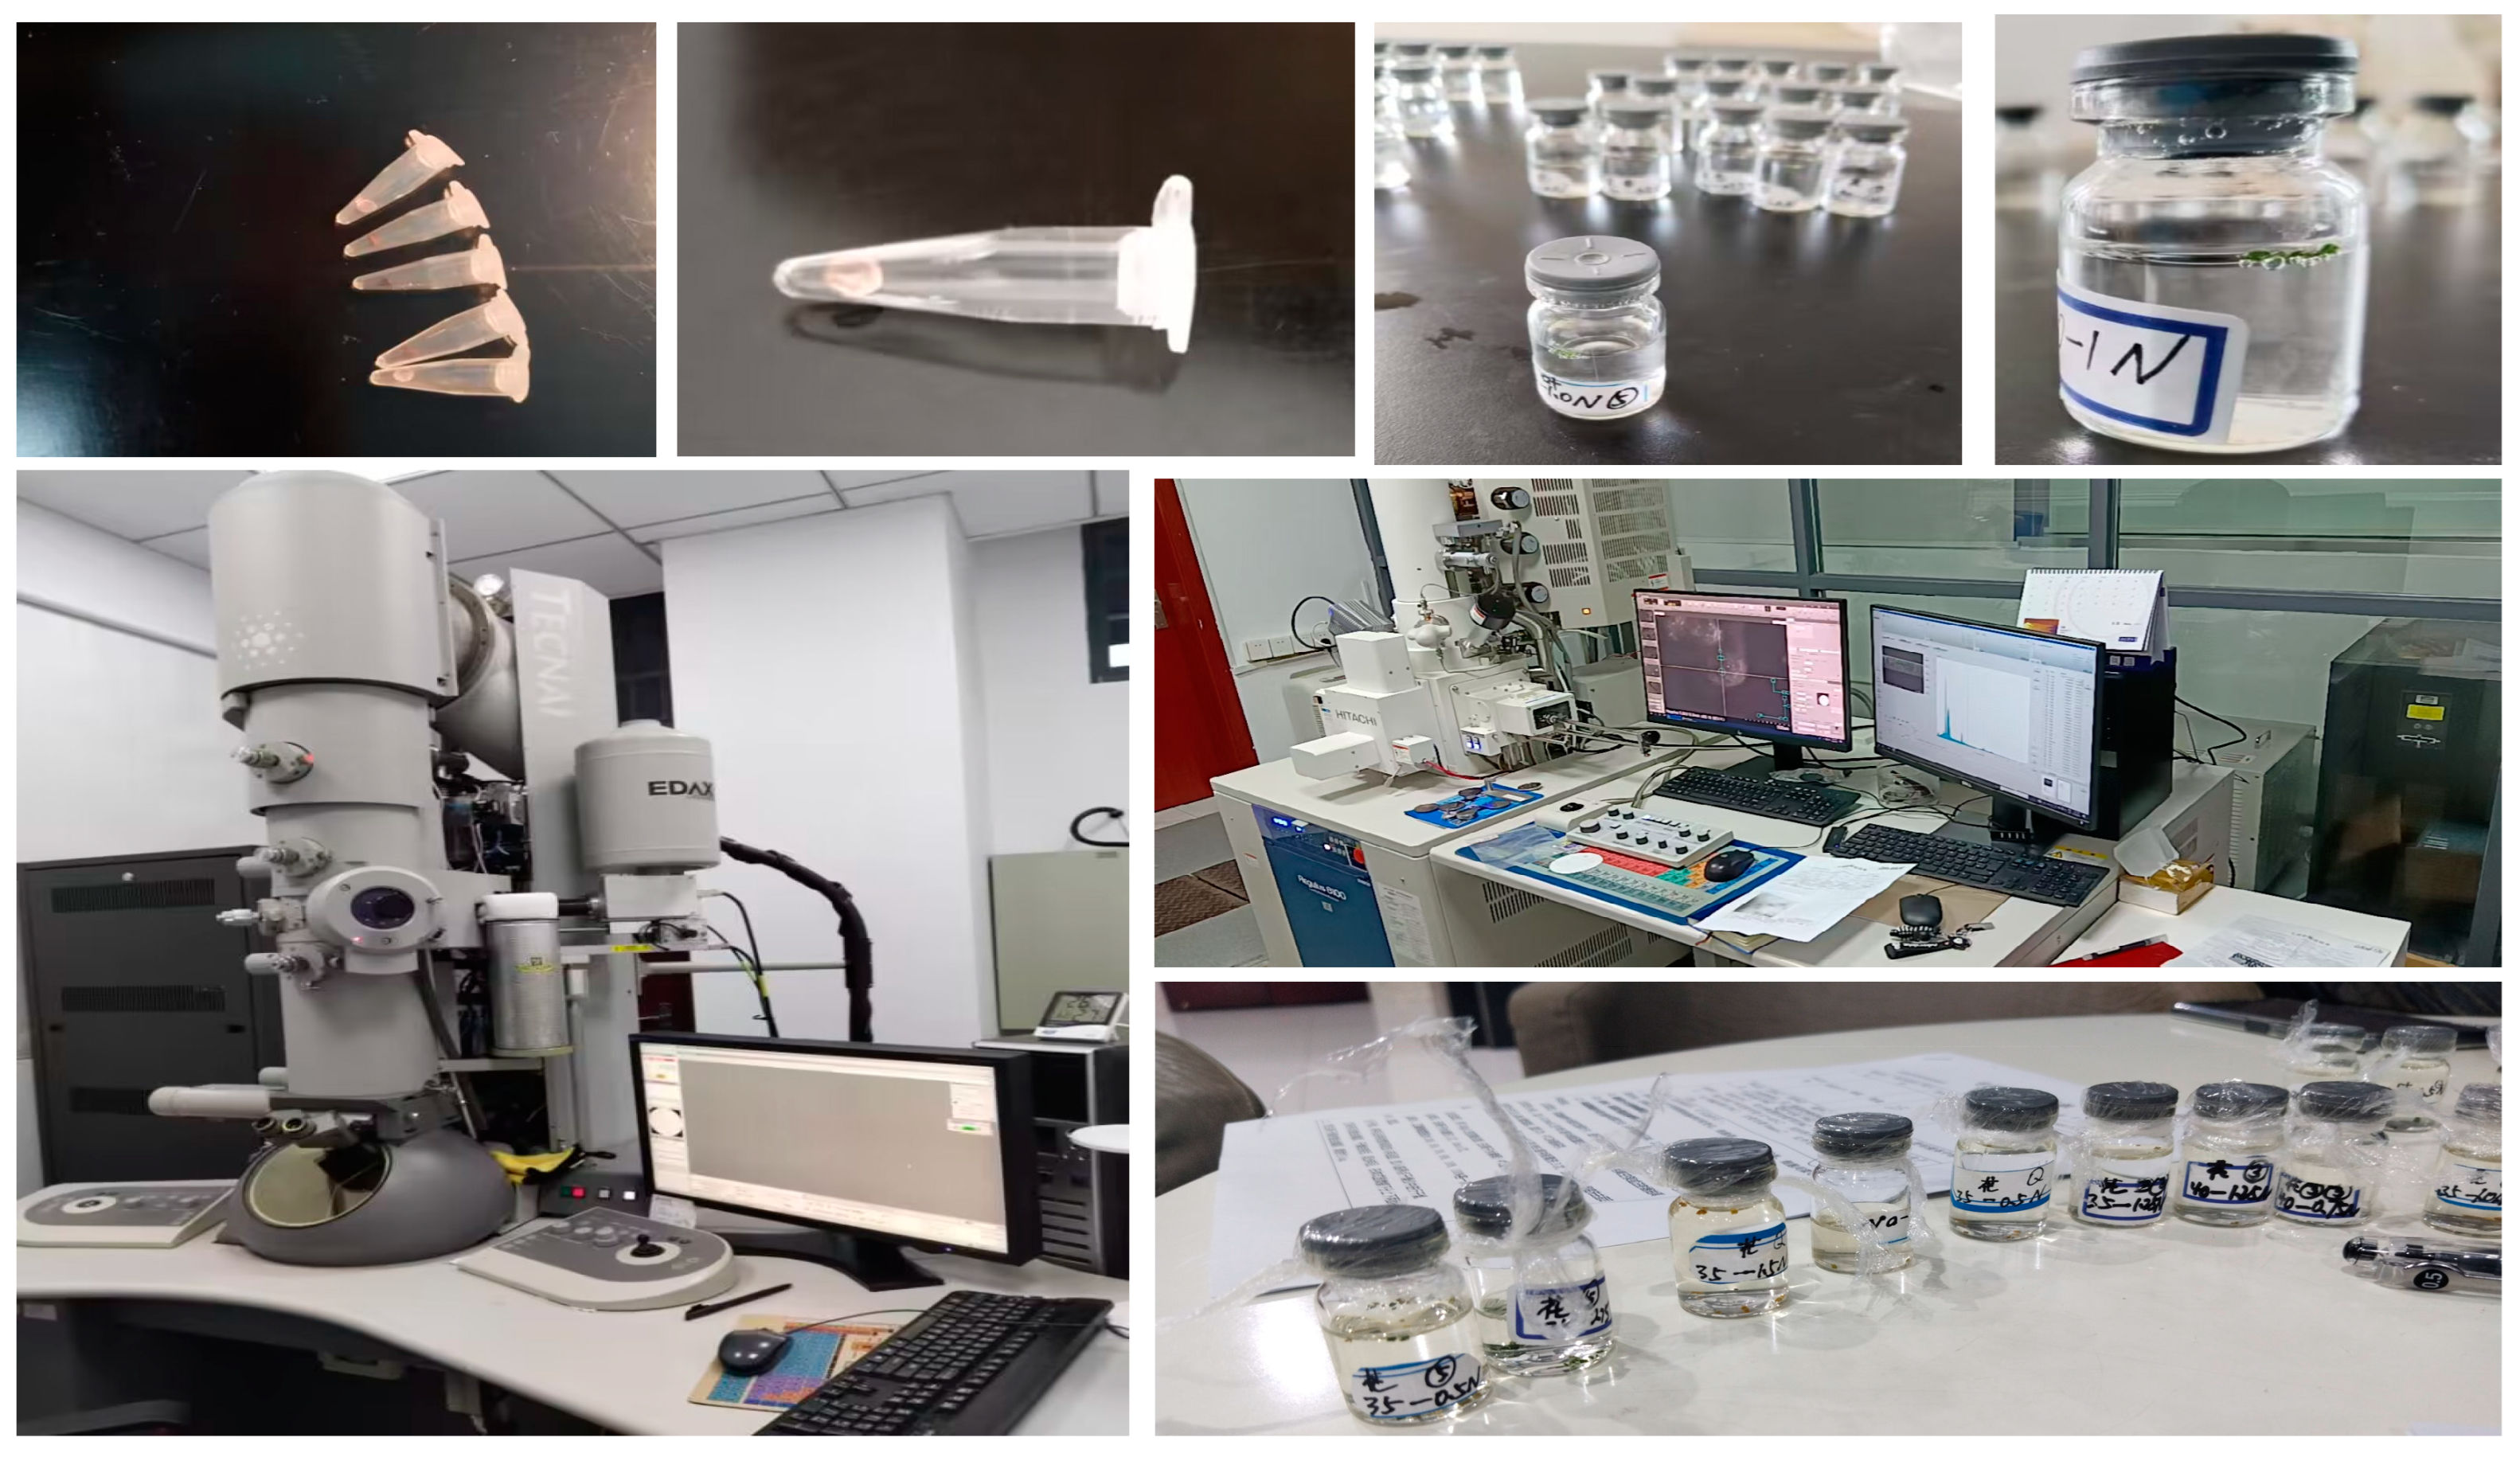
36], combined with my previous experience in scanning electron microscopy sample preparation (
Figure 15). Sample preparation for ultrathin sectioning and transmission electron microscopy photography were entrusted to Zhenjiang Zhuanbo Inc(Danyang, China). The specific process is summarized as follows:
(1) Sampling. Wash the leaf surface spoils with water before sampling. Avoiding the main leaf veins, use a surgical scalpel to cut a leaf tissue block of less than 3 mm. Then quickly put into 2.5% glutaraldehyde fixative.
(2) Fixation. Plant samples were immersed in 3% glutaraldehyde fixative configured with 0.1 mol/L PBS buffer (pH 6.8~7.2) for 1~2h at room temperature, and pumped to make the samples sink to the bottom of the tube. Vigorous oscillation during the period caused the air bubbles to detach from the sample and ensured that the sample was always in the fixative. Replace the 2.5% glutaraldehyde fixative configured with 0.1 mol/L PBS buffer (pH 6.8~7.2), and fix overnight at 4℃.
(3) Rinsing. Fill the centrifuge tube with 0.1 mol/L PBS buffer (pH 6.8~7.2) and rinse 3 times for 15 min each time. shake continuously during the period to make the rinsing sufficient.
(4) Post-fixation. The samples were immersed in 10g/L osmium tetroxide fixative configured in 0.1 mol/L PBS buffer (pH 6.8~7.2) for 2h at room temperature until the samples turned black.
(5) Rinsing. Fill the centrifuge tube with 0.1 mol/L PBS buffer (pH 6.8~7.2) and rinse 3 times for 15 min each time.Shake continuously during the period to make the rinsing sufficient.
(6) Gradient dehydration. Dehydrate with 50%, 70%, 80%, 90%, 95% ethanol, respectively, each time 15min. 100% ethanol dehydration 2 times, each time 20min. finally, replace with 100% acetone 2 times, each time 20min.
(7) Permeabilization and embedding. Pure acetone: Spurr embedding agent 3:1:1 mixture were infiltrated for 1h, pure acetone: Spurr embedding agent 1:3 mixture infiltrated for 3h, and then the sample with a toothpick to pick out, on filter paper to absorb the dryness of the sample into a clean centrifugal tube, add pure Spurr embedding agent infiltration for more than 12h. Then pure embedding agent was added to a 0.5mL sharp-bottomed centrifuge tube, and air bubbles were driven out with a toothpick. The sample was picked into the mold and adjusted to the proper orientation. Place a piece of label paper with the name of the sample into the mold together and cover with a lid to isolate the adverse effects of oxygen on the polymerization of the Spurr embedding agent. Put into the 70 ℃ oven polymerization more than 8h.
(8) Half package slice positioning. Polymerization completed embedded block with a toothpick poke to see if there are traces, if not, it means that the hardness to meet the requirements. Embedded block will be removed from the mold, clamped with a fixture to repair the block. Trim off the excess resin around the perimeter of the sample with a double-sided blade and correct the cut surface flush with a glass cutter (until it reflects the reflection). A water trough was made in the newly made glass knife, and semi-thin sections were made with this knife, fished onto slides, and heated and baked to dry the water so that the sections were flat against the slide. Stained with 20 g/L toluidine blue for a few minutes, washed and dried and observed under a light microscope to find where the study object was located and to determine the orientation of the section.
(9) Ultrathin section. The sample block was then trimmed again based on this location information, cutting the excess sample and trimming the cut surface until it was flat and smooth, leaving only a small area where the study object was located to reduce the difficulty of ultra-thin sectioning. Ultrathin sectioning was performed with a diamond knife or glass knife, and the thickness was controlled at 70~100 nm. The ultrathin sections were sliced on a coated copper mesh, and the excess water was drained off and set aside.
(10)Electronic staining. Ultrathin sections were stained with uranyl acetate for 10~15min, and the staining was carried out in an air-insulated apparatus to eliminate the interference of moisture and carbon dioxide, and an appropriate amount of sodium hydroxide could be added to the side of the block to absorb the moisture and carbon dioxide from the environment of the apparatus to ensure that the samples were free from lead contamination; the samples were washed with double-distilled water for three times, and then dried naturally before being subjected to transmission electron microscopy observation.
(11)The samples were observed and photographed with an HT7800 transmission electron microscope (Hitachi, Japan).
2.3. X-ray energy spectroscopy of thin samples of chloroplasts from tomato leaves
(1) Quantitative analysis principle of X-ray energy spectrometry analysis
According to the continuous spectroscopy method developed by Hall et al. The main principle of this method is that the concentration C
x of an element X within the sample is directly proportional to the count rate of the characteristic peaks of that element, which is calculated by the formula:
where is the concentration of an element within the sample; k is the coefficient value of each element, determined by analyzing the specimen; p is the back-bottom count rate of the element; is the total count rate of the continuous spectrum; and is the count rate emitted from the external source (supporting membrane, grid, etc.) within the continuous spectrum.
This leads to the formula for the quantification of the element in biological thin-labeled samples:
where is the concentration of the element under test in the sample; is the concentration of the element in the specimen; is the measured intensity of the characteristic X-rays of the element in the sample; is the measured intensity of the continuous X-rays of the element in the sample; and is the measured intensity of the characteristic X-rays and continuous X-rays of the element in the specimen; and is the elemental factor of the chemical composition of the sample and the specimen, respectively, (also known as the G-factor).The G-factor can be calculated by the following equation The G-factor can be calculated by the following equation:
where is the percentage of element i in the chemical composition of the thin sample or thin specimen; is the atomic number of element i; is the atomic weight of element i; and n is the constituent element of the sample.. The specific energy fluxes were calculated by following equations.
2.4. Statistical Analysis
Data were plotted and analyzed using Graphpad Prism version 9.5.0 for Windows, Graphpad Software, San Diego, California USA,. Cell statistics and analysis were performed using Fiji ImageJ software(
https://imagej.net/imagej-wiki-static/Fiji/Downloads). SPSS Statistics 26(SPSS, Chicago, IL, USA) was used to analyse the differences in the data, and Duncan’s test was performed for multiple comparisons (α = 0.05).
Figure 1.
Chloroplast ultrastructure of tomato leaves under day/night temperature 25 °C/15 °C with N1 treatment . SG, starch grains; PG, plastoglobuli; GT, grana thylakoid; ST,stroma thylakoid.
Figure 1.
Chloroplast ultrastructure of tomato leaves under day/night temperature 25 °C/15 °C with N1 treatment . SG, starch grains; PG, plastoglobuli; GT, grana thylakoid; ST,stroma thylakoid.
Figure 2.
Chloroplast ultrastructure of tomato leaves under day/night temperature 25 °C/15 °C with N2 treatment. SG, starch grains; PG, plastoglobuli; GT, grana thylakoid; ST,stroma thylakoid.
Figure 2.
Chloroplast ultrastructure of tomato leaves under day/night temperature 25 °C/15 °C with N2 treatment. SG, starch grains; PG, plastoglobuli; GT, grana thylakoid; ST,stroma thylakoid.
Figure 3.
TEM images of tomato chloroplasts under day/night temperature 25 °C/15 °C with N3 treatment. SG, starch grains; PG, plastoglobuli; GT, grana thylakoid; ST,stroma thylakoid.
Figure 3.
TEM images of tomato chloroplasts under day/night temperature 25 °C/15 °C with N3 treatment. SG, starch grains; PG, plastoglobuli; GT, grana thylakoid; ST,stroma thylakoid.
Figure 4.
TEM images of tomato chloroplasts under day/night temperature 25 °C/15 °C with N4 treatment. SG, starch grains; PG, plastoglobuli; GT, grana thylakoid; ST,stroma thylakoid.
Figure 4.
TEM images of tomato chloroplasts under day/night temperature 25 °C/15 °C with N4 treatment. SG, starch grains; PG, plastoglobuli; GT, grana thylakoid; ST,stroma thylakoid.
Figure 5.
TEM images of tomato chloroplasts under day/night temperature 40 °C/30 °C with N1 treatment. SG, starch grains; PG, plastoglobuli; GT, grana thylakoid; ST,stroma thylakoid.
Figure 5.
TEM images of tomato chloroplasts under day/night temperature 40 °C/30 °C with N1 treatment. SG, starch grains; PG, plastoglobuli; GT, grana thylakoid; ST,stroma thylakoid.
Figure 6.
TEM images of tomato chloroplasts under day/night temperature 40 °C/30 °C with N2 treatment. SG, starch grains; PG, plastoglobuli; GT, grana thylakoid; ST,stroma thylakoid .
Figure 6.
TEM images of tomato chloroplasts under day/night temperature 40 °C/30 °C with N2 treatment. SG, starch grains; PG, plastoglobuli; GT, grana thylakoid; ST,stroma thylakoid .
Figure 7.
TEM images of tomato chloroplasts under day/night temperature 40 °C/30 °C with N3 treatment. SG, starch grains; PG, plastoglobuli; GT, grana thylakoid; ST,stroma thylakoid.
Figure 7.
TEM images of tomato chloroplasts under day/night temperature 40 °C/30 °C with N3 treatment. SG, starch grains; PG, plastoglobuli; GT, grana thylakoid; ST,stroma thylakoid.
Figure 8.
TEM images of tomato chloroplasts under day/night temperature 40 °C/30 °C with N4 treatment. SG, starch grains; PG, plastoglobuli; GT, grana thylakoid; ST,stroma thylakoid.
Figure 8.
TEM images of tomato chloroplasts under day/night temperature 40 °C/30 °C with N4 treatment. SG, starch grains; PG, plastoglobuli; GT, grana thylakoid; ST,stroma thylakoid.
Figure 9.
EDX mapping images of tomato chloroplasts under day/night temperature treatments of 25°C/15°C(CKT) with N3 treatment. A, drift corrected spectrum image Scanning; B, acquire high angle annular dark field image (HAADF); C, energy dispersive X-ray spectroscopy (EDX) of tomato chloroplasts; other image of Ca. C, Cl, Mg, P, K, N, O mapping area, scale bar, 2.0 μm.
Figure 10.
TEM-EDX mapping images of tomato chloroplasts under day/night temperature treatments of 40°C/30°C(HT) with N2 treatment. A, drift corrected spectrum image Scanning; B, acquire high angle annular dark field image (HAADF); C, energy dispersive X-ray spectroscopy (EDX) of tomato chloroplasts; other image of Ca. C, Cl, Mg, P, K, N, O mapping area, scale bar, 2.0 μm.
Figure 11.
EDX mapping images of tomato chloroplasts under day/night temperature treatments of 40°C/30°C(HT) with N3 treatment. A, drift corrected spectrum image Scanning; B, acquire high angle annular dark field image (HAADF); C, energy dispersive X-ray spectroscopy (EDX) of tomato chloroplasts; other image of Ca. C, Cl, Mg, P, K, N, O mapping area, scale bar, 2.0 μm.
Figure 12.
EDX mapping images of tomato chloroplasts under day/night temperature treatments of 40°C/30°C(HT) with N4 treatment.. A, drift corrected spectrum image Scanning; B, acquire high angle annular dark field image (HAADF); C, energy dispersive X-ray spectroscopy (EDX) of tomato chloroplasts; other image of Ca. C, Cl, Mg, P, K, N, O mapping area, scale bar, 2.0 μm.
Figure 13.
Ultrastructural parameters of tomato chloroplasts. a, numbers of chloroplasts, PG, GT, GT stack and amylum; b, area of cell, between cells and central vacuole; c, distance of chloroplast long axis and short axis, and the ratio of long axis distance to short axis distance; d, thickness of GT, CW and envelop membrane. PG, plastoglobuli; CW, cell wall; GT, grana thylakoid; ST,stroma thylakoid .
Figure 14.
Quantitative data from EDX mapping elemental scans of tomato chloroplasts.
Figure 14.
Quantitative data from EDX mapping elemental scans of tomato chloroplasts.
Figure 15.
Transmission electron microscopy and photographs of experimental procedure.
Figure 15.
Transmission electron microscopy and photographs of experimental procedure.

