Submitted:
18 January 2024
Posted:
19 January 2024
You are already at the latest version
Abstract
Keywords:
1. Introduction
2. Materials and Methods
2.1. Materials and reagents
2.2. Characterization of materials
3. Results and discussion
3.1. XRD analysis
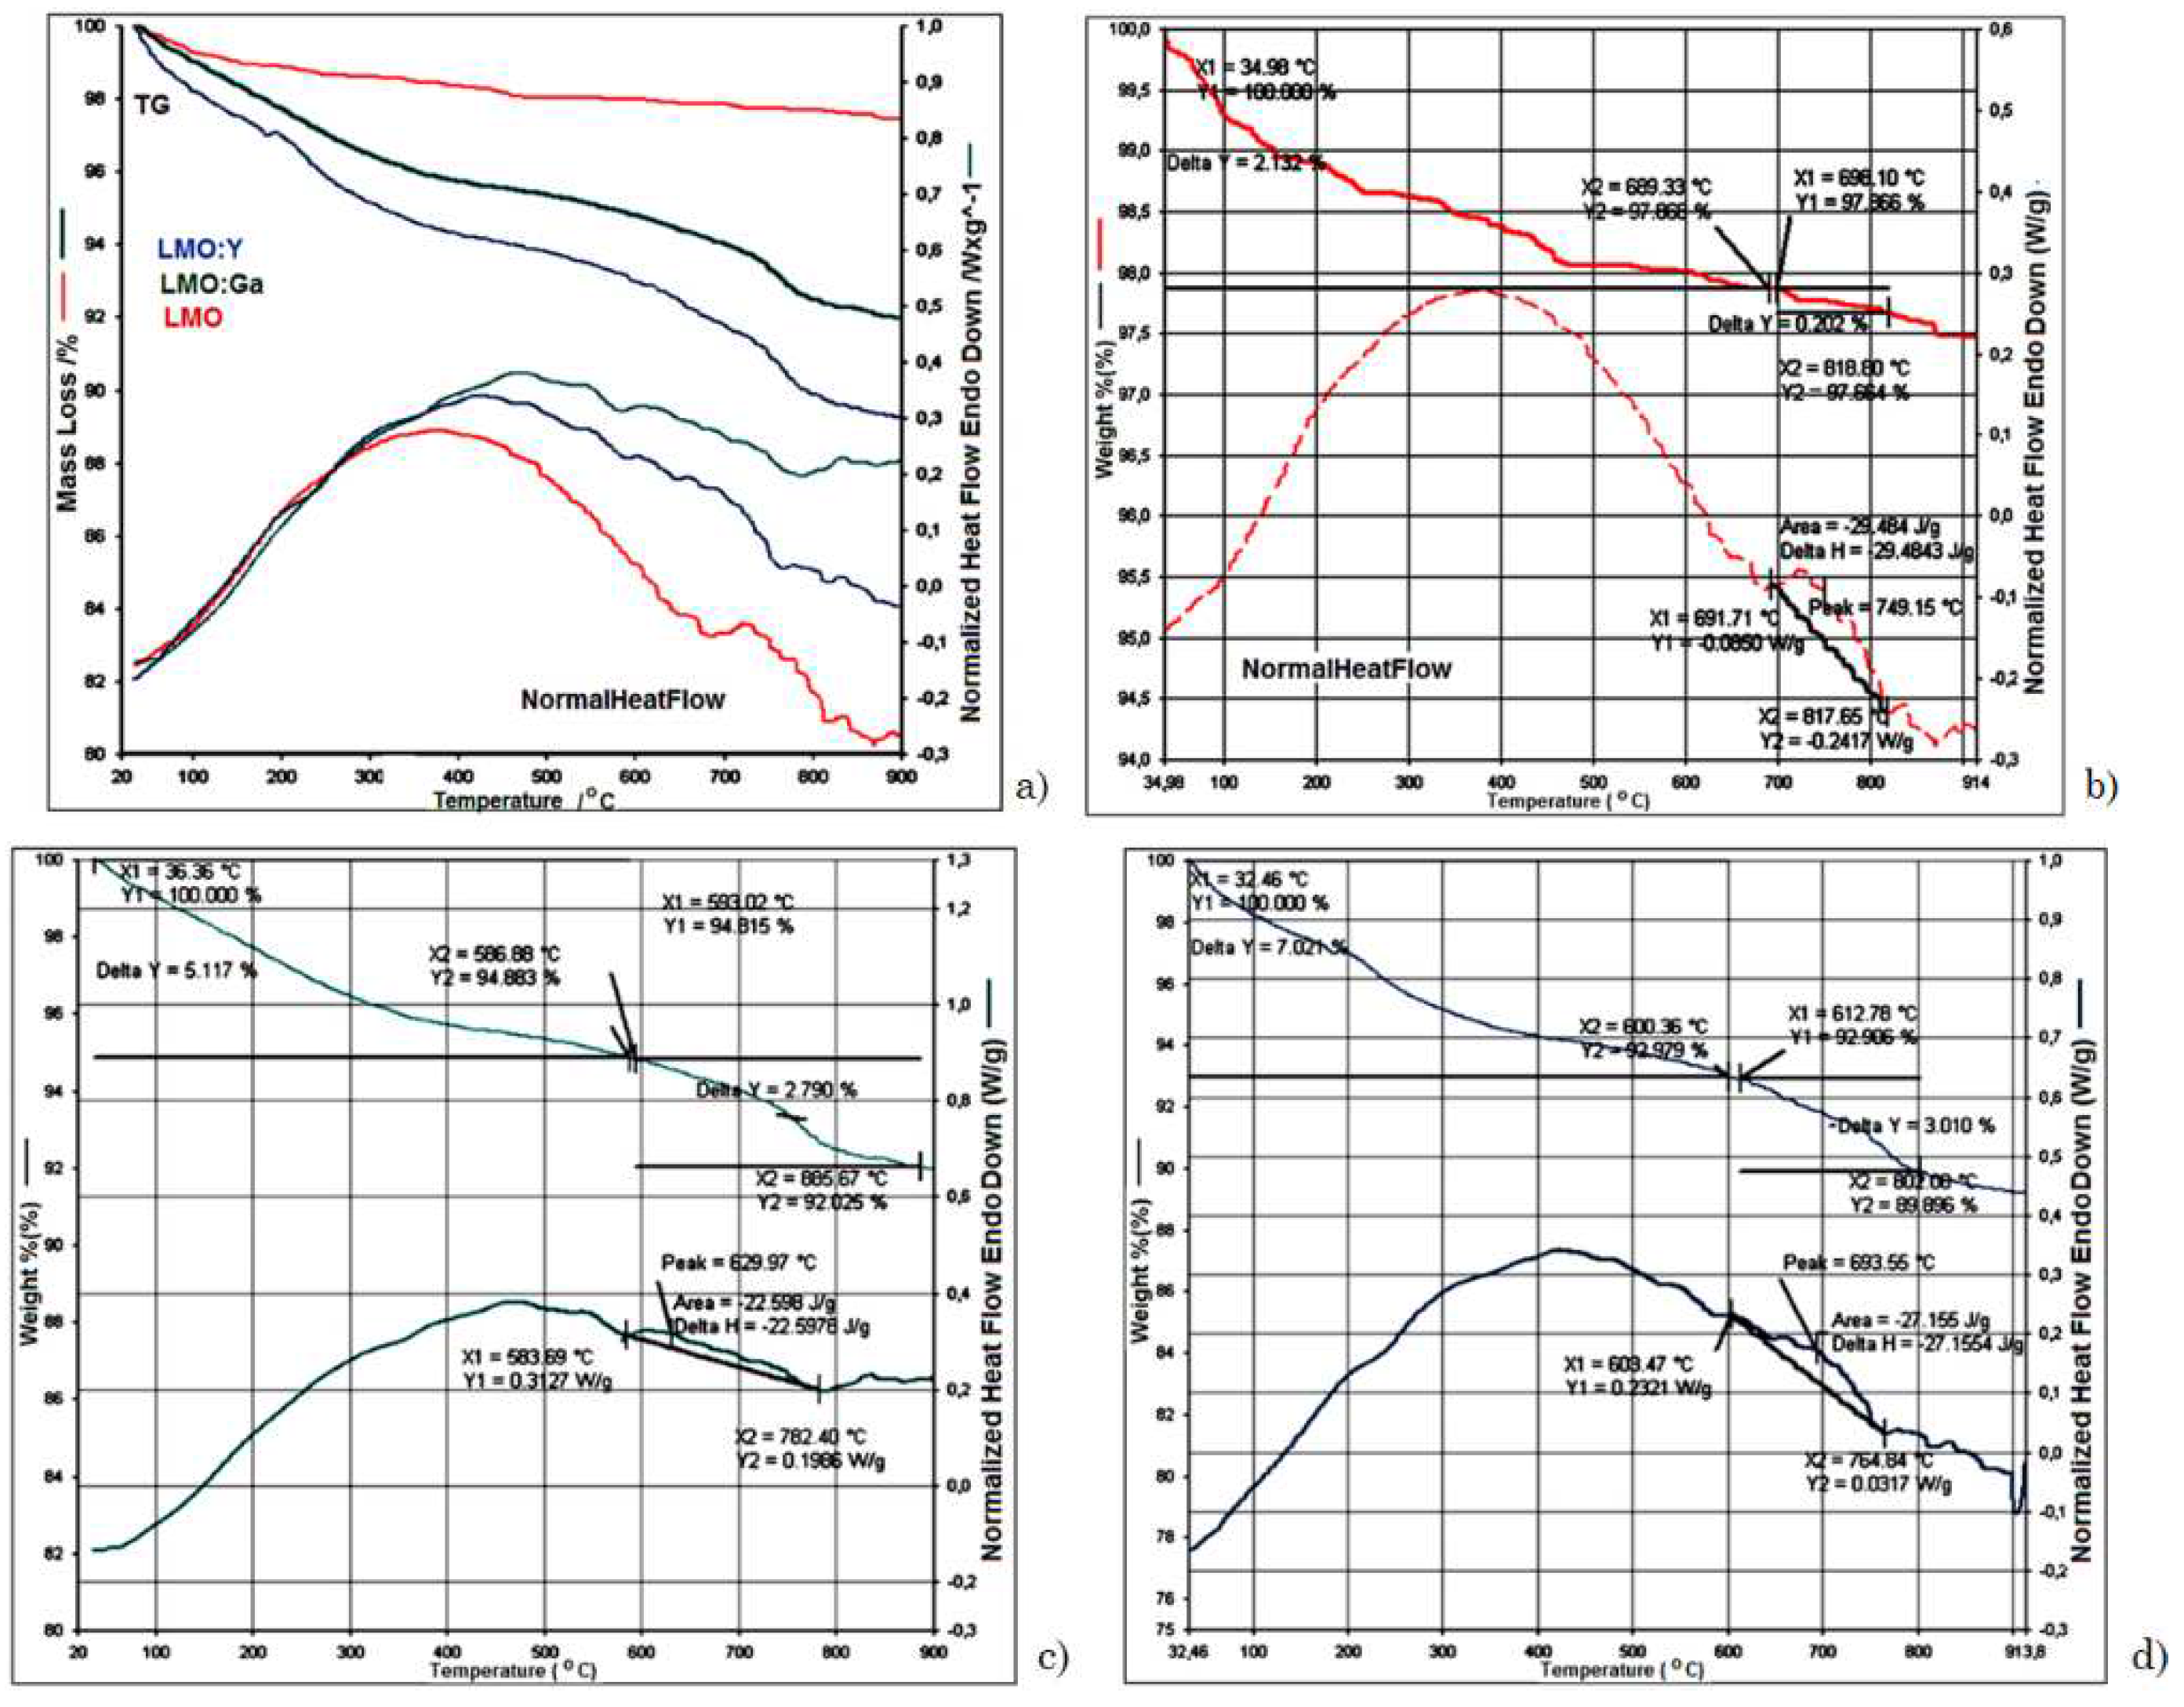
3.2. Thermal analysis
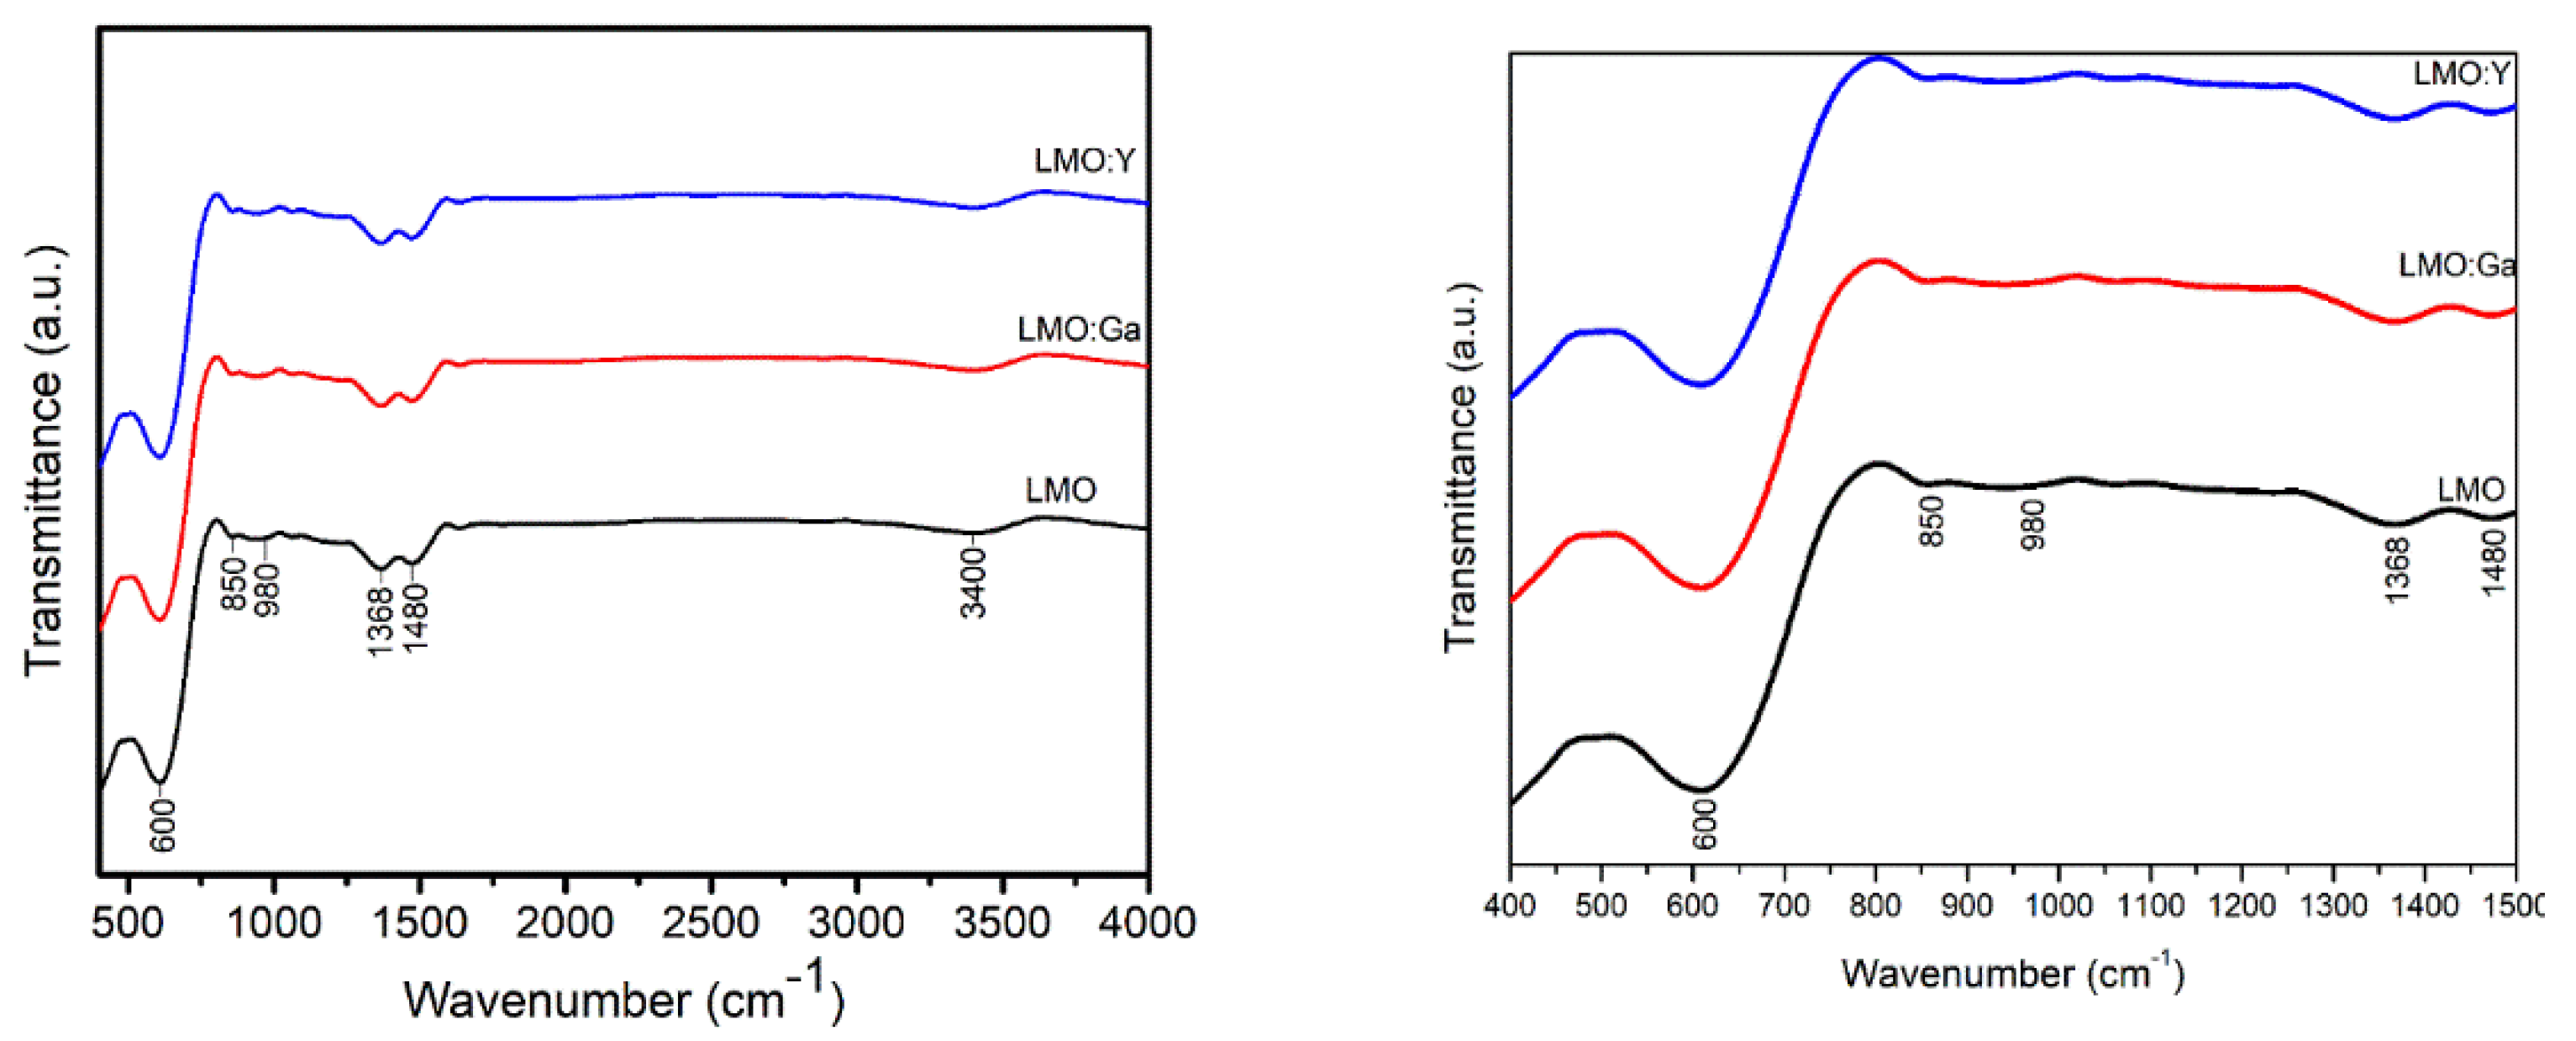
3.3. FT-IR spectroscopy
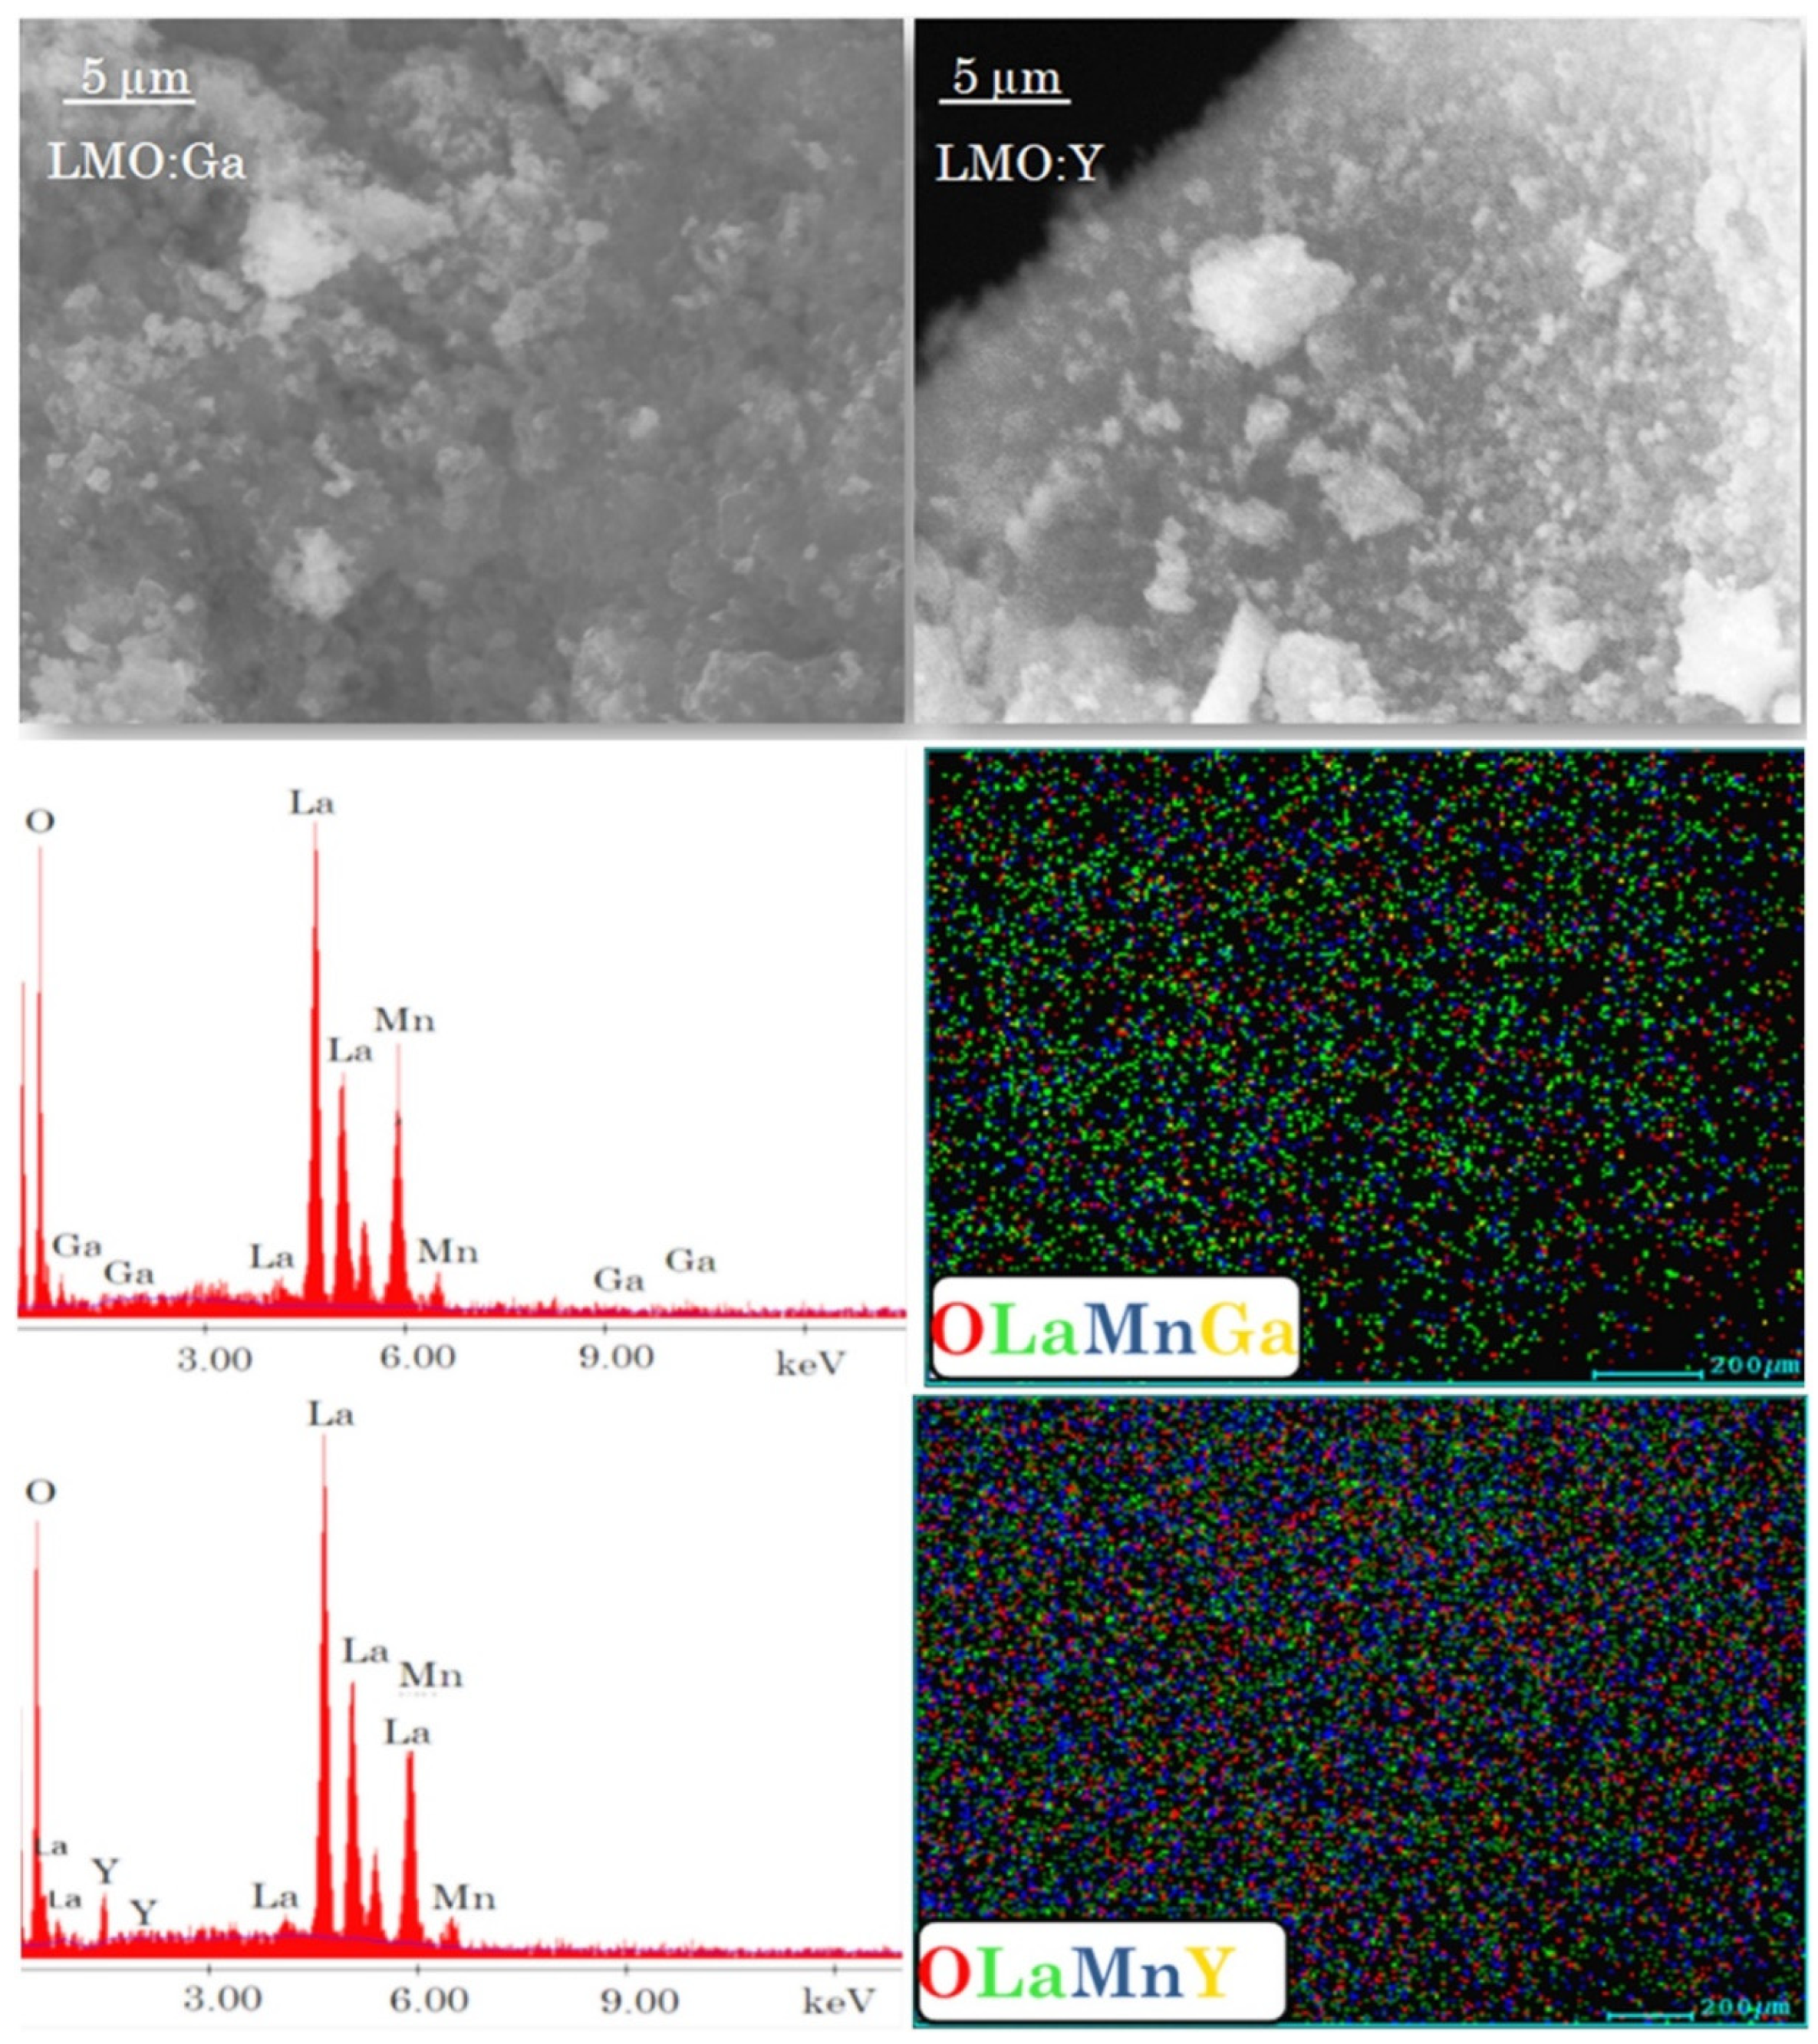
3.4. Scanning electron microscopy
3.5. Electrical properties
4. Conclusions
Author Contributions
Funding
Data Availability Statement
Acknowledgments
Conflicts of Interest
References
- G. Jonker, J. Van Santen, Physica 16, 337(1950).
- I. Koriba, B. Lagoun, A. Guibadj, S. Belhadj, A. Ameur, A. Cheriet, Comput. Condens. Matter 29 592 (2021).
- S. Punna Rao, K. Suresh Babu, Mater. Chem. Phys. 272 125021(2021).
- P. Sfirloaga, M. Poienar, I. Malaescu, A. Lungu, C.V. Mihali, P. Vlazan, Ceram. Int. 44 5823(2018).
- P. Sfirloaga, M.Poienar, I. Malaescu, A. Lungu, P.Vlazan, J. Rare Earth 36 499-504(2018).
- P. Sfirloaga, G.Vlase, T. Vlase, I. Malaescu, C. N.Marin,P.Vlazan, J. Therm. Anal. Calorim. [CrossRef]
- T. H. Tran, T. C. Bach, N. H. Pham, Q. H.Nguyen, C. D. Sai,H. N. Nguyen, V. T. Nguyen, T. T. Nguyen, K. H. Ho,Q. K. Doan, Mat. Sci. Semicon. Proc. 89121 (2019).
- A.G. Merzhanov, Int. J. Self-Propag. High. -Temp. Synth. 2 113 (1993).
- V.A. Shcherbakov, A.S. Shteinberg, Combust. Sci. Technol. 107 21 (1995).
- P. Sfirloaga, M. Poienar, I. Malaescu, A. Lungu, C.V. Mihali, P. Vlazan, Ceram. Int. 44 5823 (2018).
- P. Sfirloaga, I. Sebarchievici, B.Taranu, M.Poienar, G. Vlase, T. Vlase, P. Vlazan, J. Alloys Compd.843 155854 (2020).
- P. Sfirloaga, C.N. Marinb, I. Malaescu, P. Vlazan, Ceram. Internat. 42 16 18960 (2016).
- L. Malavasi, M. Baldini, D. di Castro, A. Nucara, W. Crichton, M. Mezouar, J. Blasco and P. Postorino, J . Mater. Chem. 20 1304 (2010).
- S. Hui and A. Petric, J. Electrochem. Soc. 149 J1 (2002).
- A. Lungu, I. Malaescu, C. N. Marin, P. Vlazan, P. Sfirloaga, Phys. B: Condens. Matter 462 80 (2015).
- ASTMD 150-98 – Standard Test Methods for AC Loss Characteristics and Permittivity (Dielectric Constant) of Solid Electrical Insulation.
- E. Hernandez, V. Sagredo and G.E. Delgado, Synthesis and magnetic characterization of LaMnO3 nanoparticles, Rev. Mex. de Fis61 166 (2015).
- A.Ansari, N. Ahmad, M. Alam, S. F.Adil, S. M. Ramay,A. Albadri, A. Ahmad, A. M.Al-Enizi, B. F. Alrayes,M. E.Assal and A. A.Alwarthan, Sci. Rep. 9 7747(2019).
- S. Daengsakul, C. Mongkolkachit, C. Thomas, I. Thomas, S. Siri,V.Amornkitbamrung, S. Maensiri, J. Optoelectron. Adv. Mat. -Rapid Commun.3 106 (2009).
- A.A. Aal, T.R. Hammad, M. Zawrah, I.K.Battisha and A.B. A. Hammad, Acta Phys. Pol. A 126 1318 (2014).
- A. K. Jonscher, Universal Relaxation Law, 1st edn. (Chelsea Dielectrics Press, London, 1996) 198–200.
- S. Lafuerza, G. Subias, J. Garcıa, S. Di Matteo, J. Blasco, V. Cuartero, C. R. Natoli, J. Phys.: Condens. Matter 23 325601 (8pp) (2011).
- M. C. Sanchez et al., Phys. Rev. B 73 094416 (2006).
- J. S. Zhou and J. B. Goodenough, Phys. Rev. B 68 144406 (2003).
- A. Fondado, J. Mira, J. Rivas, C. Rey, M. P. Breijo, and M. A. Señarı́s-Rodrı́guez, J. Appl. Phys. 87 5612 (2000).
- S. Taran, et al., J. Alloys Compd. 644 363–370 (2015).
- M. Sangeetha, V. Hari Babu, J. Magn. Magn. Mater. 389 5–9 (2015).
- N.F. Mott, E.A. Davis, Electronic Process in Non-Crystalline Materials, 2nd edn. (Clarendon Press, Oxford, 1979) 32–37.
- D. Malaescu, I. Grozescu, P. Sfirloaga, P. Vlazan, C. N. Marin, Acta Phys. Pol. A 129133 (2016).
- P. Sfirloaga, I. Miron, I. Malaescu, C. N. Marin, C. Ianasi, P. Vlazan, Mat. Sci. Semicon. Proc. 39 721 (2015).
- P. Sfirloaga, I.Malaescu, M. Poienar, M. C. Nicolae, D. Malaescu, P. Vlazan, J. Mater. Sci: Mater. Electron.27 11640 (2016).
- R.M. Hill, Philos. Mag. 241307 (1971).
- E.A. Davis, N.F. Mott, Philos. Mag. 220903 (1970).
- S. Brindusoiu, M. Poienar, C. N. Marin, P. Sfirloaga, P. Vlazan, I. Malaescu, J. Mater. Sci. Mater. Electron. 30 15693 (2019).
- I. Malaescu, A. Lungu, C.N. Marin, P. Sfirloaga, P. Vlazan, S. Brindusoiu, M. Poienar, Ceram. Int. 411610 (2018).
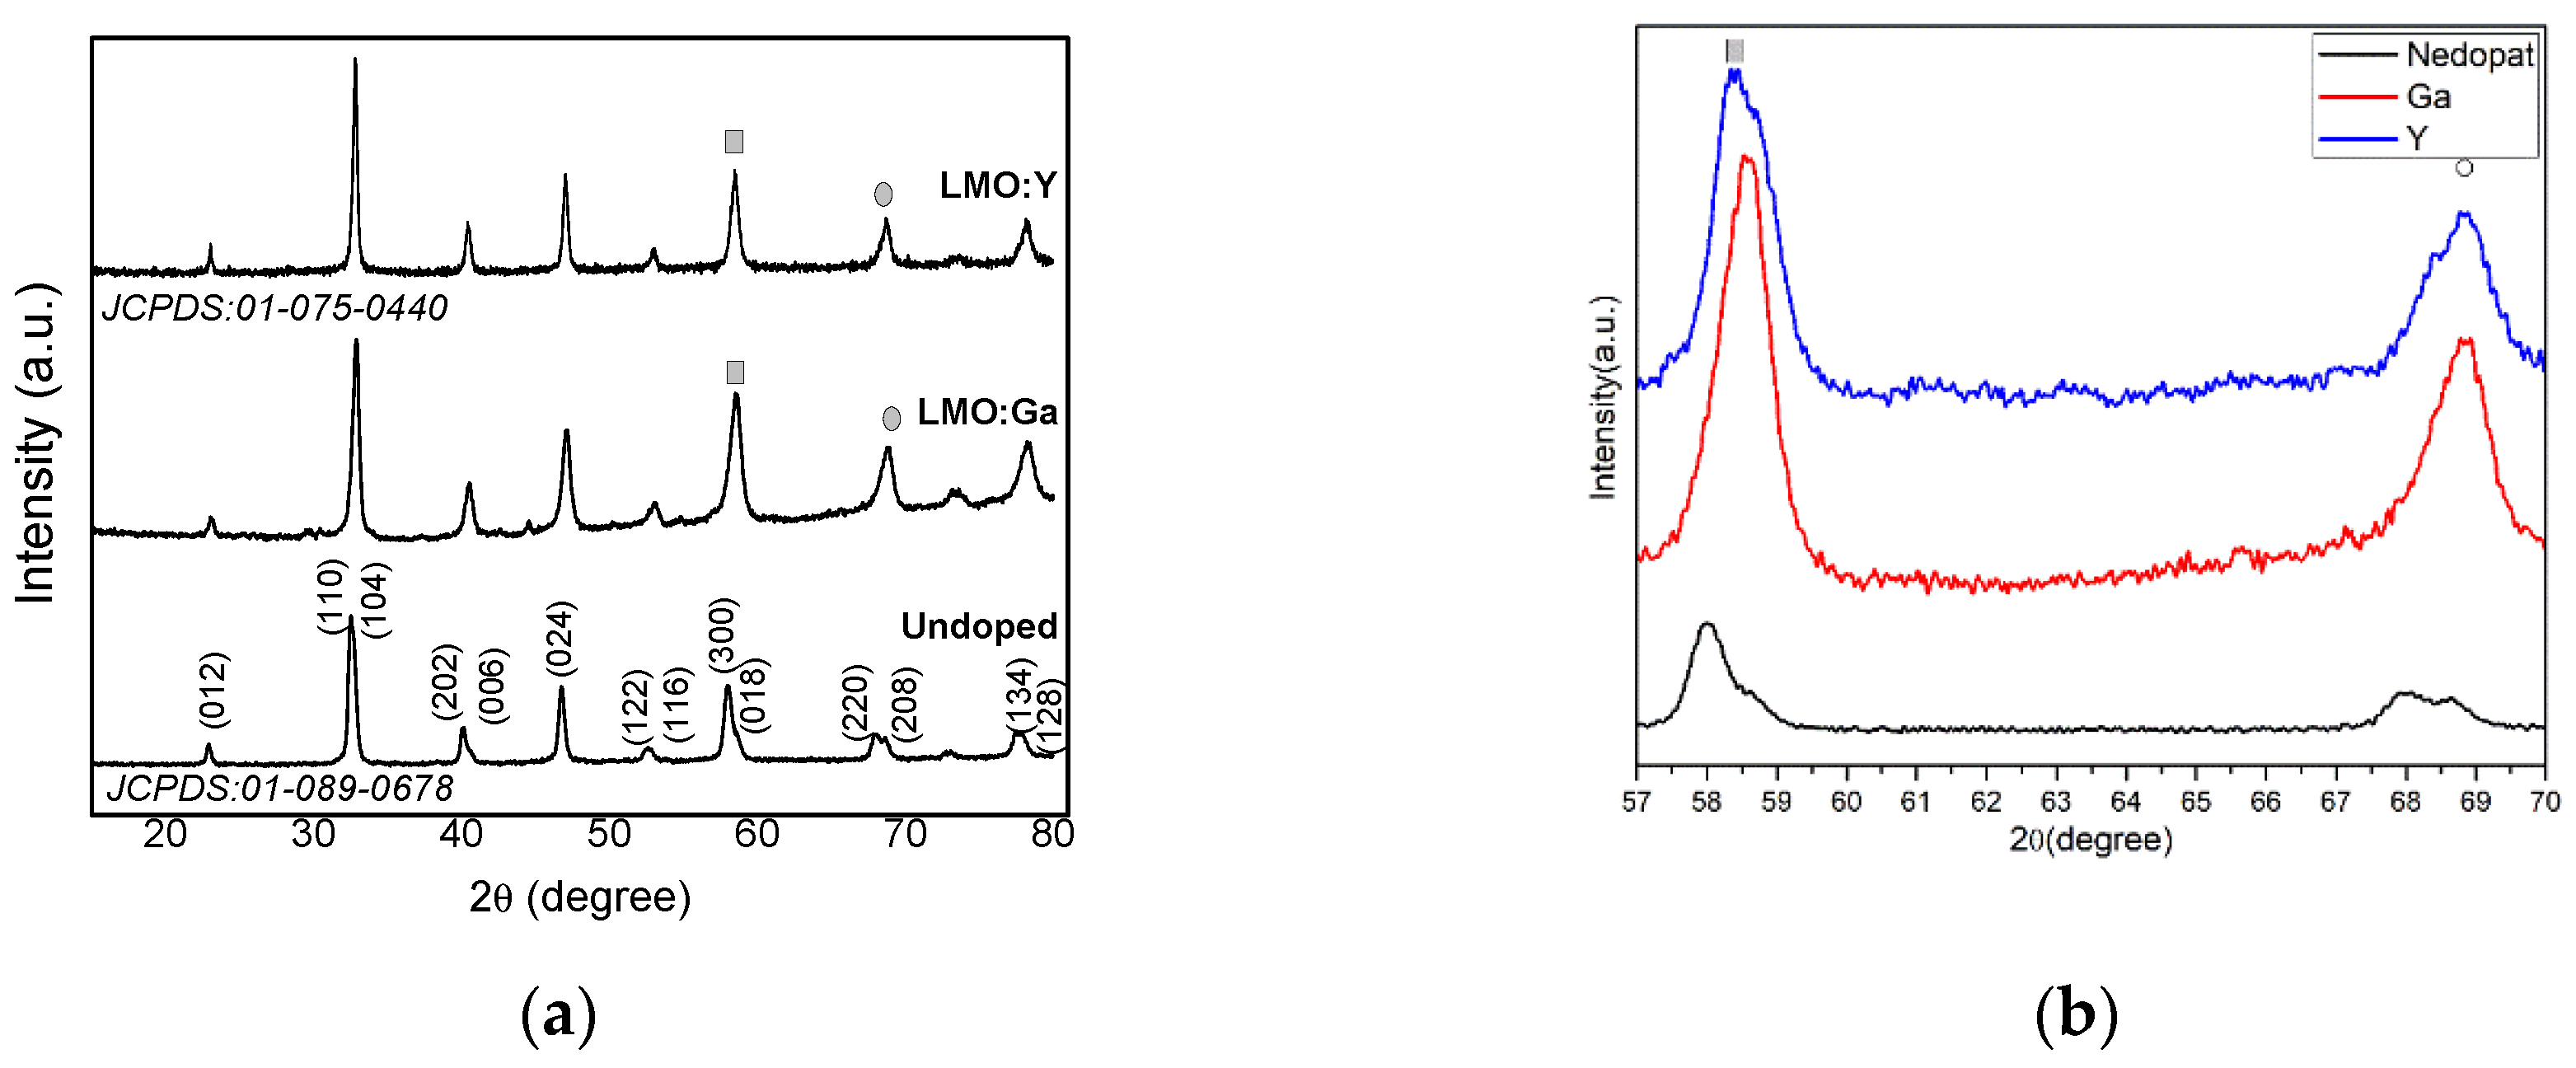
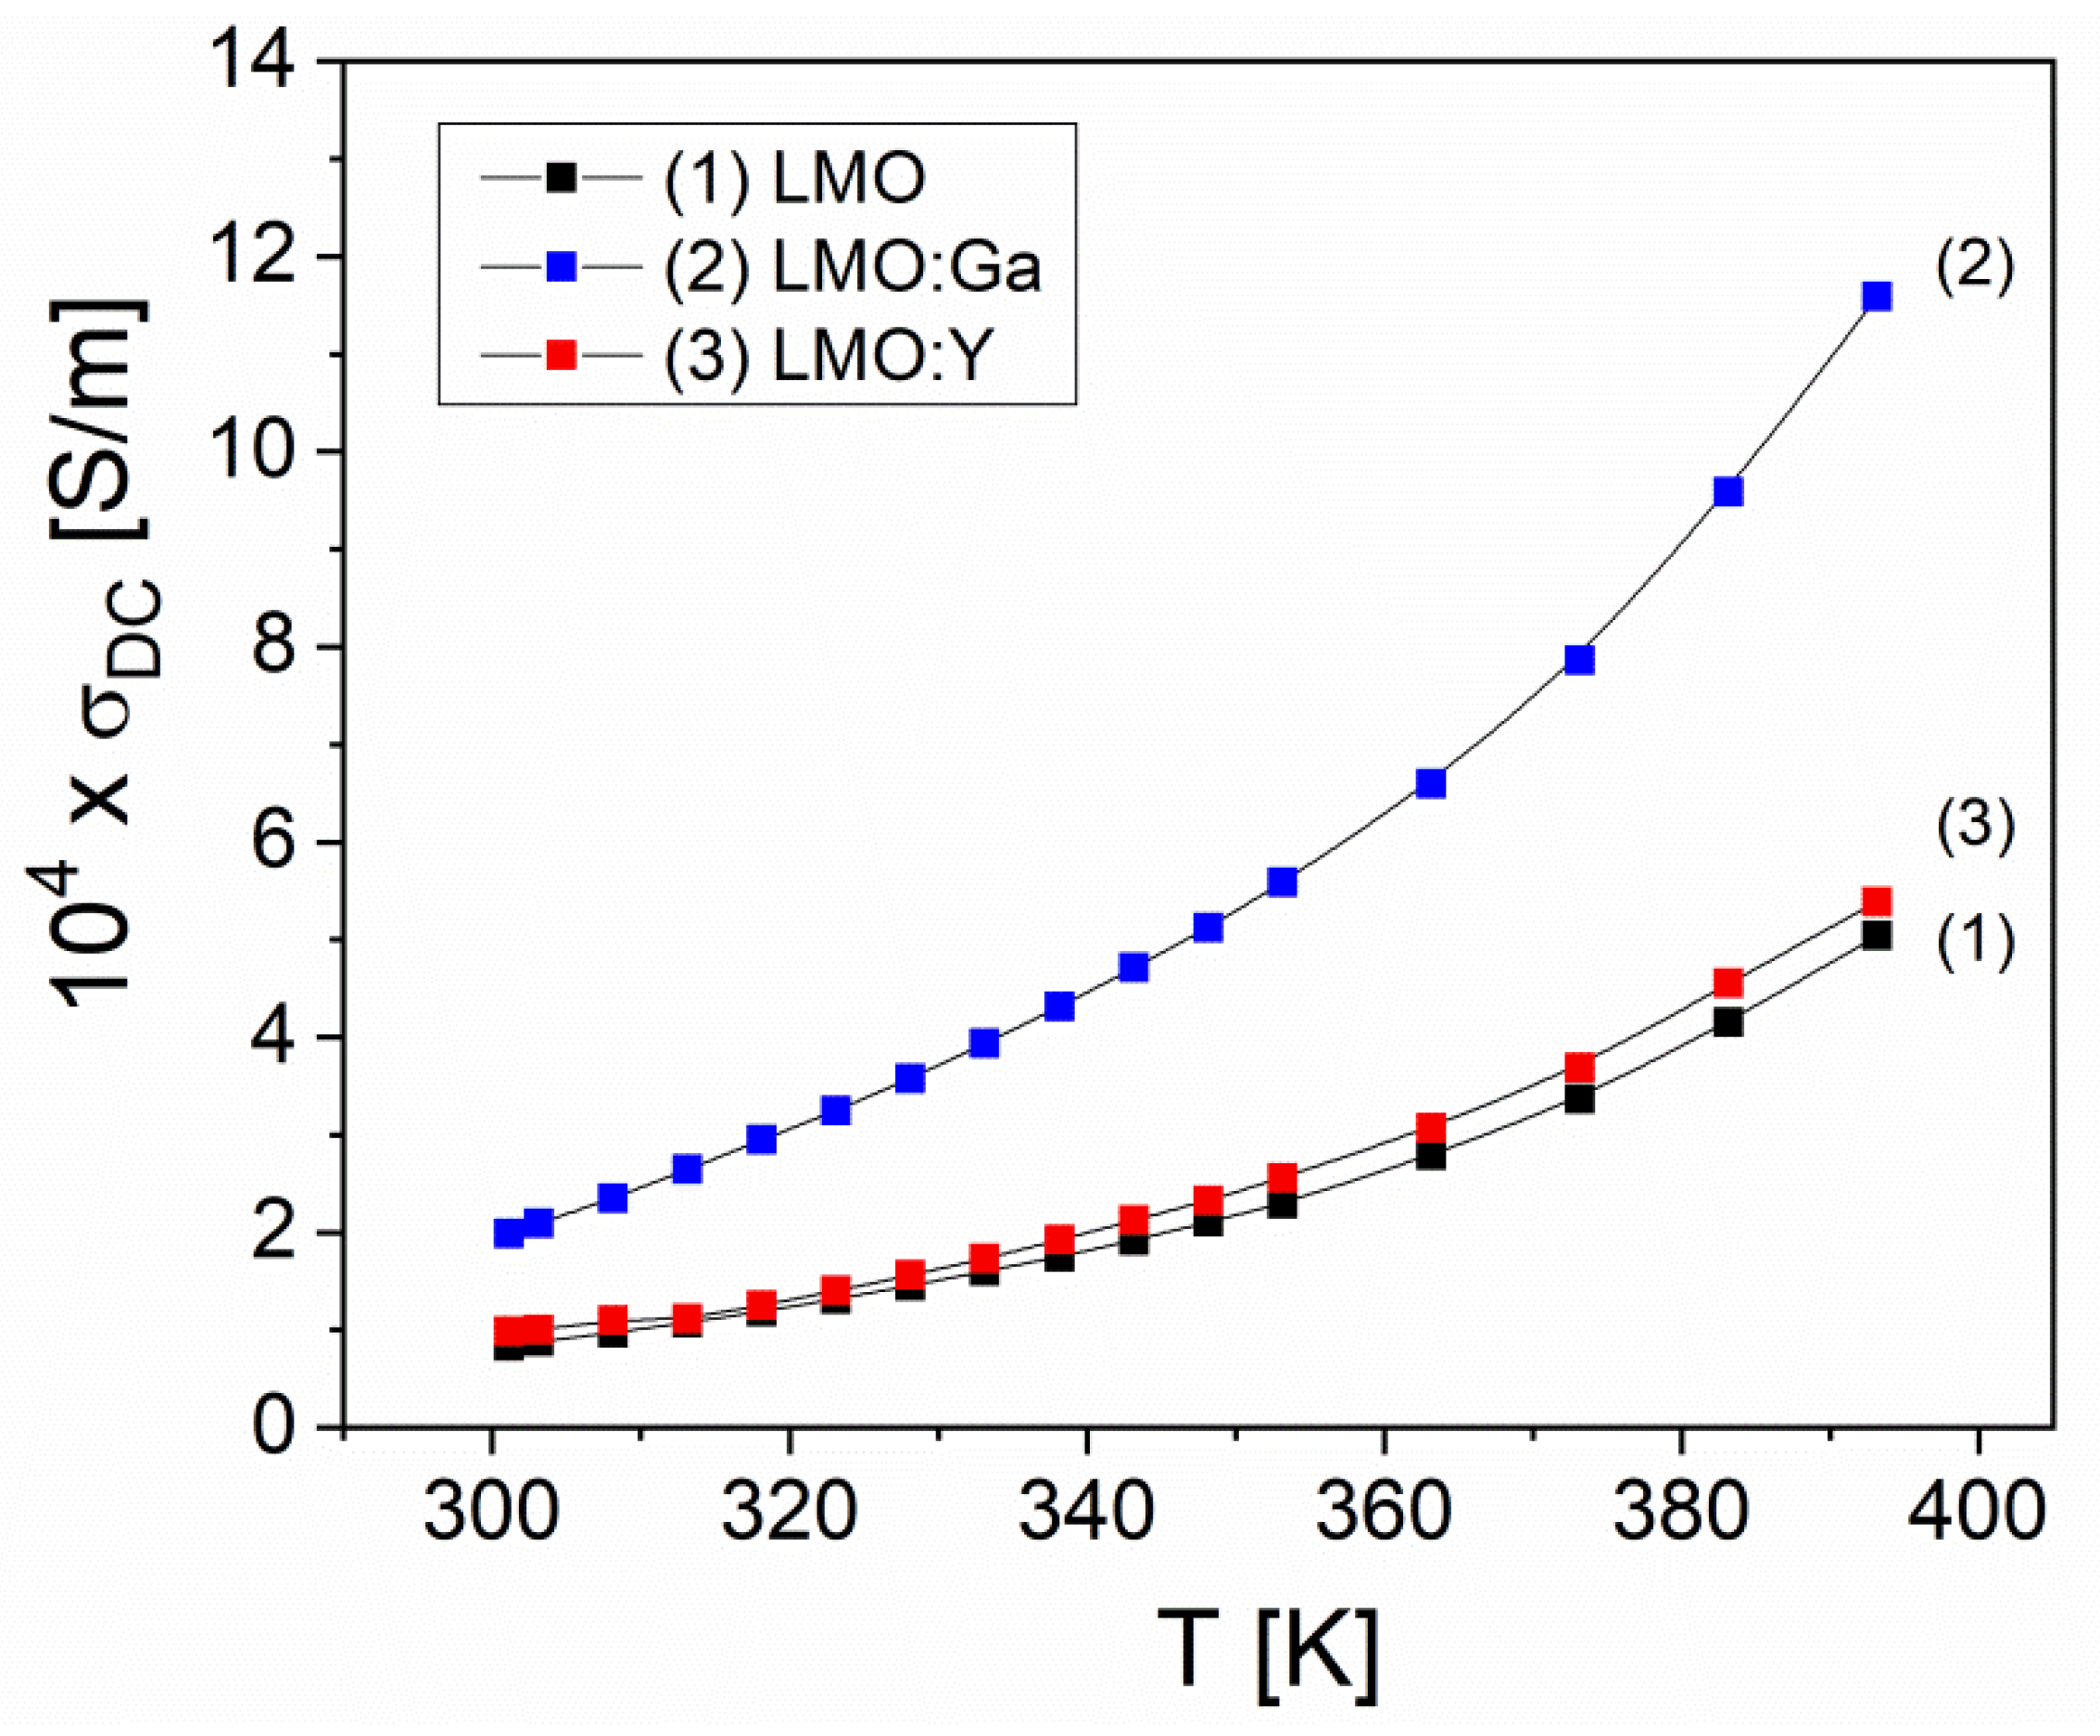

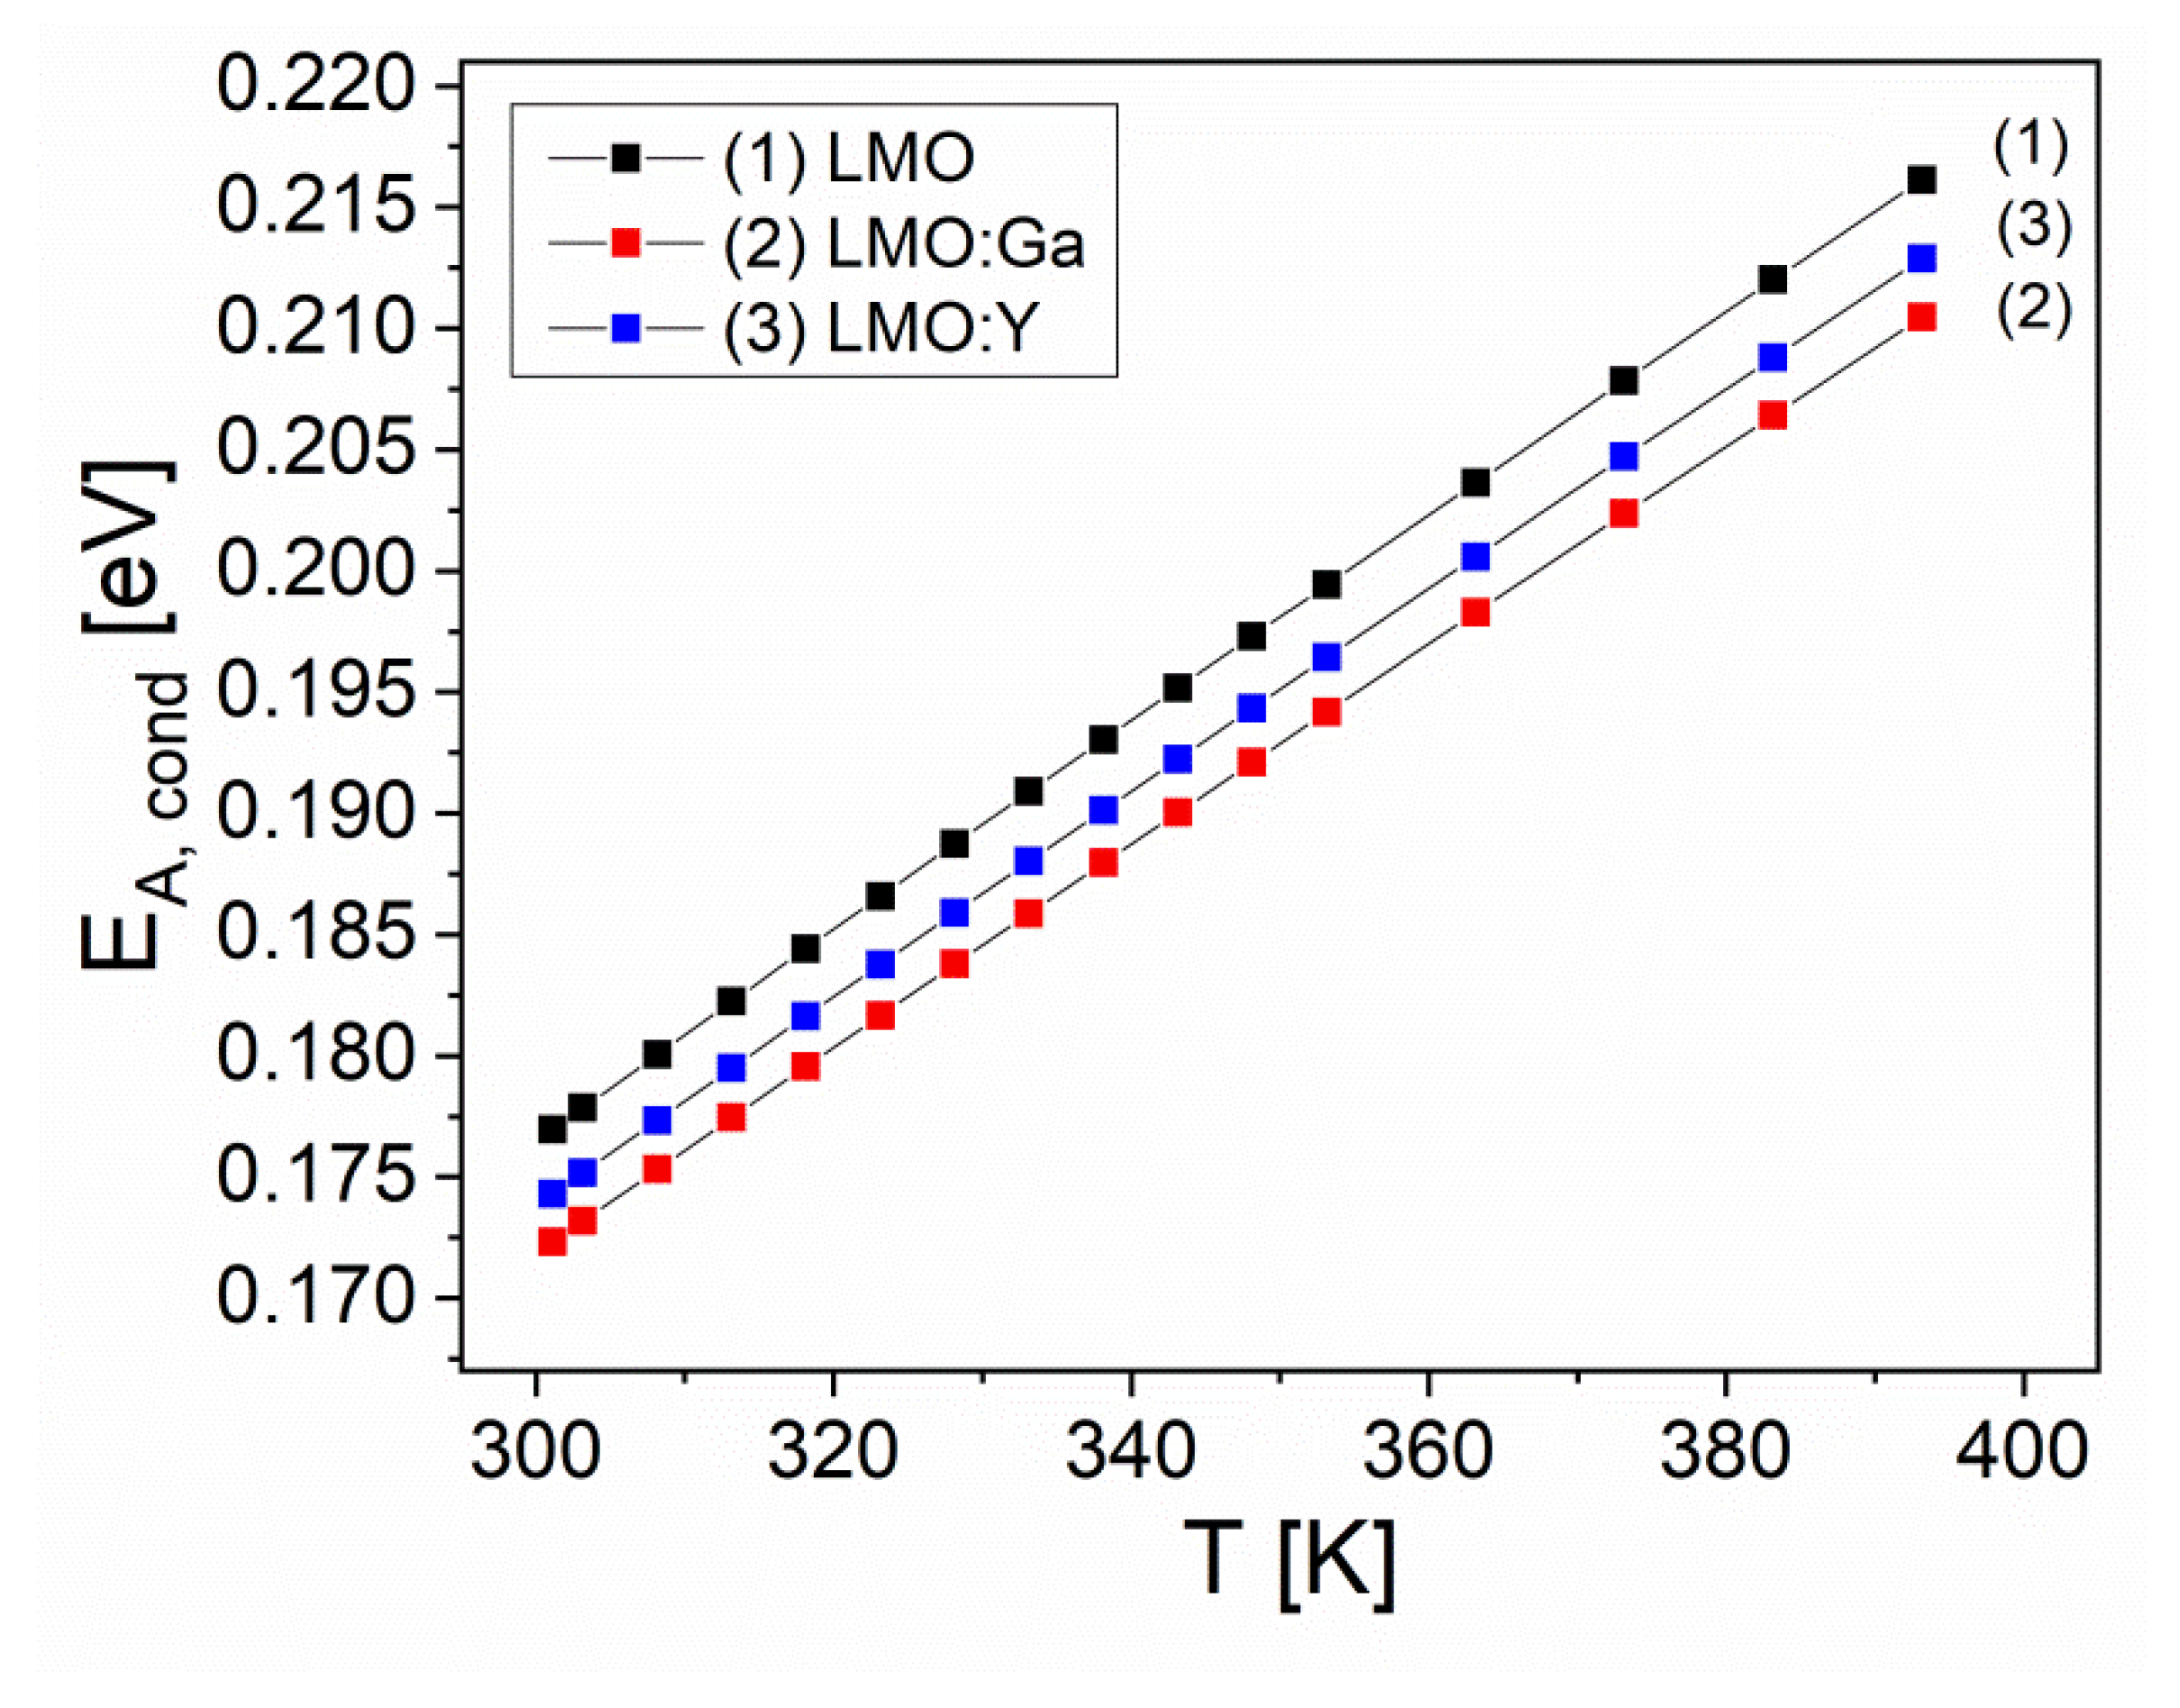
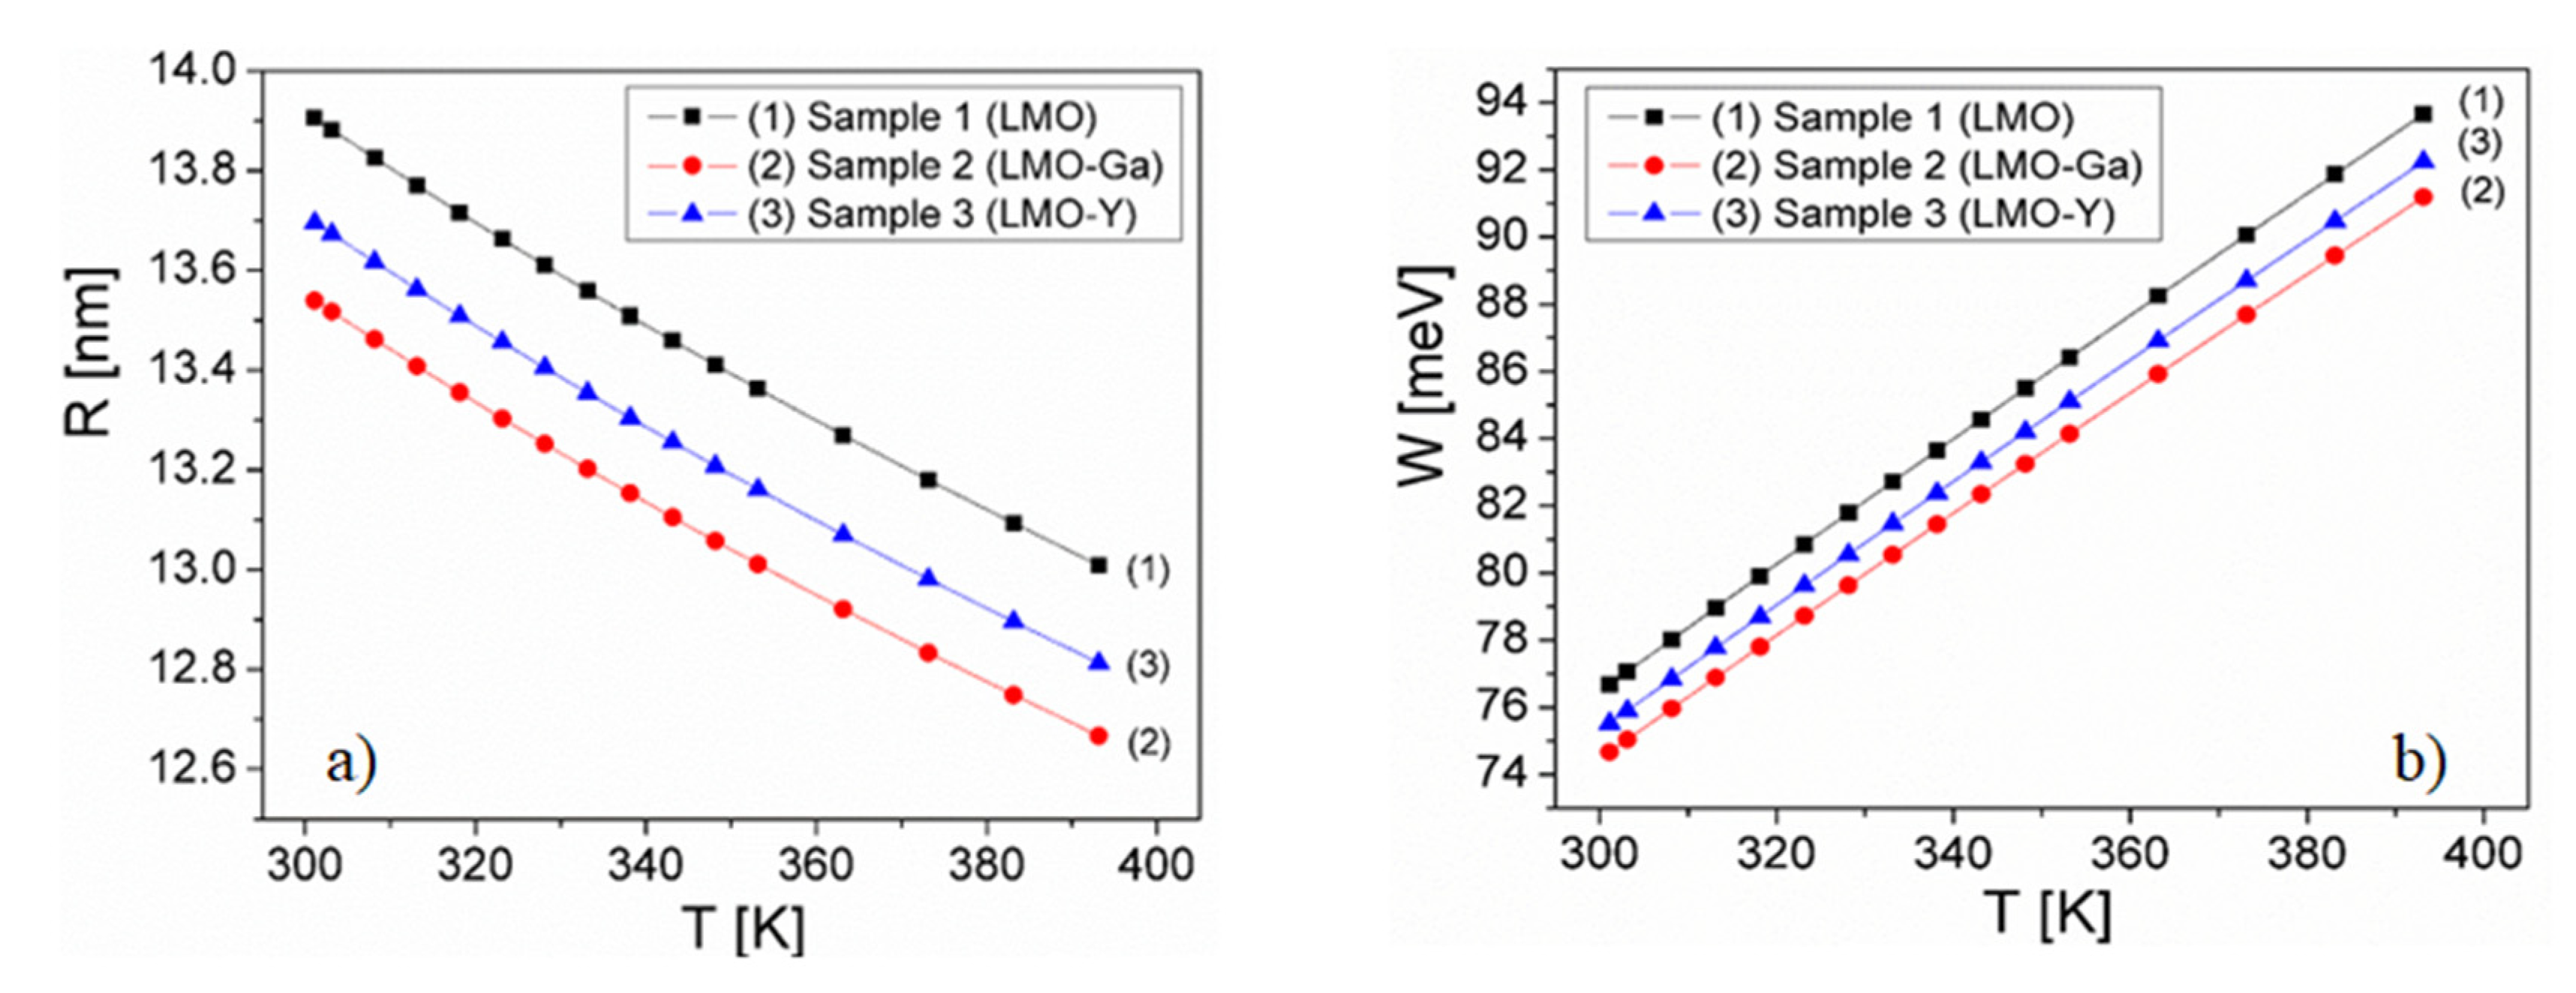
| Sample | Space group | Lattice parameter | Unit Cell Volume | Crystallite size |
| [Å] | [Å3] | [nm] | ||
| LaMnO3 | R-3c | a= b= 5.4749(5) c = 13.327 |
345.9341 | 25.8 |
| LaMnO3ːGa | Pm-3m | a=b=c=3.8677(7) | 57.8584 | 17.3 |
| LaMnO3ːY | Pm-3m | a=b=c=3.8687(4) | 57.9007 | 26.8 |
Disclaimer/Publisher’s Note: The statements, opinions and data contained in all publications are solely those of the individual author(s) and contributor(s) and not of MDPI and/or the editor(s). MDPI and/or the editor(s) disclaim responsibility for any injury to people or property resulting from any ideas, methods, instructions or products referred to in the content. |
© 2024 by the authors. Licensee MDPI, Basel, Switzerland. This article is an open access article distributed under the terms and conditions of the Creative Commons Attribution (CC BY) license (http://creativecommons.org/licenses/by/4.0/).


