Submitted:
19 January 2024
Posted:
19 January 2024
You are already at the latest version
Abstract
Effects of plastic deformation on the indentation feature of hot-rolled commercial pure titanium alloy were detected using microindentation. It was found that the most deformed sample experienced the largest indentation resistance and had the maximum dislocation density and the indentation size influenced the CP-Ti indentation feature. The Vicker hardness and energy dissipated demonstrated the significant influence of the dislocation motion and size effects on the indentation in the indentation deformation. The linear relation of the energy ratio which is related to the microstructures and the indentation depth ratio was obtained for hcp materials Titanium alloys.
Keywords:
Titanium
; hot-rolled
; plastic deformation
; indentation
; hardness.
1. Introduction
The plastic deformation method is a commonly applied method to improve the material’s mechanical property by grain refining in metallic alloys. By changing the materials scale to fine grain sizes, a multitude of studies have been shown significantly to analyze plasticity properties [1,2,3,4,5,6,7]. The severely deformed alloys have unique behaviors including high strength with superplasticity and ductility because of their high internal strain [8]. Among the existing various plastic deformation processes, rolling has been found as a controllable and easy technique to make alloys have ultrafine structures in a large quantity.
Titanium alloy is widely applied in automotive, aerospace, sports, chemical industry and other fields for the advantage of excellent strength, high-temperature resistance, low density, corrosion resistance and other excellent properties [9,10,11,12,13]. However, the pure titanium alloys have limited applications because of its low strength. To enhance its comprehensive mechanical performance, hot rolling method combined with heat treatment is applied to refine grain sizes of commercial pure titanium (CP-Ti) [14,15,16].
As a new testing method, indentation technology is widely applied to evaluate the local mechanical feature of samples, including metals, coatings, polymers, composites etc., with micro and nano scale. Recently, it has gained great attention as a fast way without disrupting the materials structures and other properties [17,18]. The load-displacement curve measured by micro indentation experiment can not only obtain the relevant performance parameters of the elastic-plastic properties for the material quantitatively, but also reveal the microscopic deformation mechanism inside the material [19,20,21]. Yapici et al [22] analyzed the anisotropic characters of material after ECAP and cold rolling processing and found that treatment caused stronger crystallographic texture. Li et al [23] studied the mechanical property of the forged Ti-1023 material using micro indentation experiments with different indentation loads and various loading speeds, and observed that the indentation Young’s modulus nearly kept same and H decreased at higher load level. However, it is very difficult to correlate the indentation feature and plastic history. Rolling can be easily determined by changing the thickness of sample. As a result, the rolling process is very benefit to evaluate the influence of plastic deformation history quantitatively on relevant indentation feature of samples [24].
Based on the above backgrounds, the present article aimed to deeply research the impact of the plastic deformation history on the indentation behaviors of the CP-Ti after hot-rolling using micro indentation measurement methods. Also, the effects of the harness and energy dissipated on indentation load and strain are discussed. Some of the conclusions can also be used for all the crystalline ductile materials.
2. Experimental
2.1. Materials and Processing Methods
The commercially pure titanium (CP-Ti) sheets purchased in Regal light metal company in Guangzhou, China were applied in present research and the composition is given in . The samples were obtained by cutting using diamond saw and prepared by the hot rolling technology. Its original size is 50 mm × 50 mm × 5 mm. Prior to the hot rolling, all the CP-Ti sheets were pre-heated to 460 ℃ in a furnace in the air. Then the heat-treated Ti sheets were hot-rolled quickly with the temperature of 200 ℃ for the machine rollers on a rolling machine (CX210, NY, USA). In this work, four different specimen thickness (Dt) —4.00, 3.00, 2.00, and 1.00mm—were achieved by hot rolling with about 5% reduction per rolling pass, corresponding to the thickness reductions of 20%, 40%, 60% and 80%, respectively. After hot rolling, all the CP-Ti samples with the size of 5mm*5mm*Dt were obtained in the square shape for further experimental analysis. At the same time, the original thickness sample (0% thickness reduction) without rolling was also prepared for comparison. All the samples were mechanical polished using the SiC sand paper starting from 100# to 2000#, followed by the final polish with colloidal silica suspension to mirror-like surface. Then cleaned with acetone, ethyl alcohol and deionized water by order carefully and dried by hair dryer for subsequent microindentation tests.

Table 1.
Composition of commercially pure titanium (wt.%).
| C | Fe | H | N | O | Ti |
| 0.08 | 0.3 | 0.0015 | 0.05 | 0.3 | Bal. |
2.2. Microindentation Tests
Microindentation tests were performed on the ND-RD plane mirror-like surface after polishing, which is parallel to the rolling direction for all the five hot-rolled specimens by using Microhardness Tester (Hysitron TI 980 TriboIndenter, Bruker, USA). The diamond Vickers indenter was applied instead of spherical indenter in this work. Five different indentation loads of 100, 200, 300, 400 and 500 mN were used for each sample, and at least three indentations were repeated for each indentation load. The preload of 10mN was used to the indenter prior to the indentation to avoid the impact effect. Both the loading time and unloading time were 5 seconds with an intermediate maintain pause for 2 seconds for each- indentation cycle.
3. Results and discussion
3.1. Indentation Deformation of the Hot-Rolled CP-Ti
Figure 1 exhibits the original indentation load-displacement curves of the hot-rolled CP-Ti with various maximum indentation loads for the sample with 60% thickness reduction. The lager indentation load, as expected, the deeper indentation depth. It can also be seen that the five loading curves overlap with various indentation loads, which means the different loading rate has a negligible effect on the microindentation behavior for the hot-rolled CP-Ti under the various loading conditions. There exists a mild increase in unloading curve slope with the increasing of the maximum load, which can be explained by the elastoplastic recovery of sample. There exists strong interaction among the dislocations and the pile-up of dislocations in plastic deformation zones during the loading-unloading progress. During the unloading process, the mobile dislocations continuously move to other slip planes under the influence of plastic deformation. After reaching a certain state, these slip planes will combine with each other and annihilate, which can reduce strain energy and improve material stability. At the same time, dimensional deformation is also significantly reduced, which will have a certain impact on material properties [25].
Figure 2 exhibits the typical indentation loading-unloading curves of the hot-rolled CP-Ti sheets with different thickness reductions under the maximum load of 100 mN. The five samples have a similar indentation curve. The 0% thickness reduction specimen without rolling has the largest indentation depth, and the 80% thickness reduction one has the least indentation depth. The reason is that there appears strain hardening related to the plastic deformation of CP-Ti sheets in hot rolling process which will be discussed later. The strain hardening enhanced with the increasing of the thickness reduction which is positive related to plastic deformation. This suggests that the specimen with maximum deformation (80%) experienced the largest resistance to indentation deformation and has the highest dislocation density.
Generally speaking, the relation between micro indentation load and depth for a homogeneous material can be expressed as follows [26]
In which F represents indentation load, Hm and Hr are maximum indentation depth and residual indentation depth, respectively. Km and Kr is a constant related to the material elastoplastic feature, and n is a constant index. From Figure 1, the maximum depth can be obtained for the corresponding maximum micro indentation load. As a result, the relation of maximum micro indentation depth and maximum indentation load for CP-Ti sheets can be obtained in Figure 3. As expected, the indentation displacement enlarged with the increase of the load. Otherwise, the much severer plastic deformation (the larger thickness reduction), the shallower of the indentation depth. Based on Equation (1) to curve-fit the data in Figure 3, the power index can be acquired, n = 1/k ≈1.8, which is different from 1.5 for the microindentation results of CP-Ti treated via ECAP using the same diamond Vickers indenter [25]. This means there is a little surface microstructure difference between the hot-rolling and the ECAP process after plastic deformation for the same Ti sheets.
Similarly, Figure 4 exhibits the relation between the residual depth and the maximum micro indentation load for CP-Ti sheets. The larger micro indentation load, the much severer the plastic deformation and the deeper residual indentation depth, as expected. The hot-rolled CP-Ti samples of thickness reduction of 80% exhibits minimum residual depth and the 0% ones have the largest residual depth under the same micro indentation load, suggesting the influence of plastic deformation after hot rolling. The exponential indices, m =1/k ≈1.8, in Equation (1) can also be obtained, which represents the association of the indentation load and the residual indentation depth. Here, m is compatible with n for power relation. Both these two exponential indexes are less than 2 as obtained Chen et al. [25,27], suggesting that the micro indentation size influences the indentation behaviors for the CP-Ti sheets. Specially, the reasons of indentation size effect are complex. The deviation of power index from 2 or the indentation size effect can be attributed to the influence of surface interaction, the blunting of the indenter tip, and the local residual stress gradient [28].
3.2. Vicker Hardness of the Hot-Rolled CP-Ti
As everyone knowns that there exists strain hardening which is related to the dislocation multiplication after hot rolling, leading to the enhanced resistance to dislocation motion. From the previous work [29], the relationship between the Vickers hardness, H, and strain, εeff, can be expressed as
In which H0 represents the Vicker hardness at εeff =0, α corresponds to a constant, μ refers to the sear modulus, b refers to Burger’s vector, t corresponds to the thickness of the hot-rolled CP-Ti plate, ∆t/t0 is the thickness reduction, and n equals to the strain exponent. Figure 5 exhibits the relation between the Vickers hardness and the effective strain for CP-Ti samples with indentation load of 200 mN. Through the Equation (2) to fit the data in Figure 5, it can be obtained that n=0.5 which is the same value of dislocation movement mechanisms during the plastic deformation, confirming the dominant role of the dislocation motion in the indentation deformation for the hot-rolled CP-Ti sample.
To explore the influence of the micro indentation load on indentation Vickers hardness, which was defined as the micro indentation load divided by the projected area of the indentation. Figure 6 shows the dependence of the average indentation Vickers hardness on the maximum micro indentation load. It can be seen that the average Vickers hardness decreases with the increase of the micro indentation load. The value of indentation Vickers hardness reduced drops slightly from 1.92 to 1.52 GPa for the specimen without hot rolling with the maximum load in range of 100 to 500 mN. Similar trend appeared for the other four hot-rolled samples demonstrate the indentation size effect [30]. From the curve-fitted spot lines in the Figure 6, the slope of the line representing for the relationship exponential index between average Vickers harness and indentation load can be obtained from 1.83 to the maximum value 2.0, which is the same range as the results by Chen et al. [27], determining the close relation between the indentation Vickers hardness and indentation load for CP-Ti alloys.
Figure 7 displays the dependence of average Vickers hardness on the residual micro indentation depth. With the increase of the residual micro indentation depth, the average indentation Vickers hardness decreases slightly for all the hot-rolled CP-Ti sheets, indicating indentation size effect, which is as expected from the exponential index of m in Equation (1). Also, combined with the results from Figure 4 and Figure 6, the hot-rolled CP-Ti sheets with 80% thickness reduction which owns the shallowest indentation depth exhibited maximum hardness, and the CP-Ti sheets for 0% thickness without hot-rolling has the smallest indentation hardness. This demonstrated that, the average Vickers harness enhanced with the increase extent of plastic deformation due to the work hardening caused by dislocation motion.
3.3. Energy Dissipation of the Hot-Rolled CP-Ti
For the indentation loading-unloading curves, the plastic energy was determined by using the total energy (Eloading) stored and the elastic energy dissipated (Eunloading) in the sample as:
Figure 8 shows the Eplastic (plastic energy dissipated) in the indentation of all the hot-rolled CP-Ti samples with indentation load of 100 mN. It can be observed clearly that the plastic energy dissipated can be expressed as a nonlinear function of the thickness reduction after the hot-rolling treatment. The 0% thickness reduction specimen has the highest energy dissipation and maximum ductility, and the hot-rolled sample with 80% thickness reduction exhibits lowest energy dissipation. Such a result can be explained that more thickness reduction causes the increased dislocation density during the plastic deformation processing. The larger the thickness reduction, the higher the dislocation density for the severe distorted CP-Ti sheets. The Eplastic in the micro indetation deformation of crystallized metals is a function of material microstructure, it should be addressed in the analysis.
To analyze the relationship between plastic energy dissipated and micro indentation depth, Figure 9 displays the influence of residual indentation depth on plastic energy dissipated for different hot-rolled samples. Combined with Figure 8, it can be seen that the higher plastic energy dissipated, the lower indentation residual depth, corresponding the smaller effective strain for the CP-Ti sheets. Through the data points fitting, straight line with a slope, k, of 0.8127 is obtained, which suggest that the plastic energy dissipated is proportional to the third power of indentation residual depth.
The ratio of plastic energy dissipated to the total energy, Eplastic/Etotal, can be determined via the typical indentation load-displacement curves. The effect of the plastic strain on the hot-rolled CP-Ti sheets on energy ratio can be seen from Figure 10. The error bars in the figure represent the different results for various indentation loads. It can be indicated that the energy ratio is independent with micro indentation load for both the as-annealed and hot-rolled Ti alloys, which is consistent with Malzender’s work [31]. Obviously, the ratio is nonlinear relationship of the plastic strain after hot-rolling treatment, which is inversely related to the plastic strain. The 0% thickness reduction sample without hot rolling exhibits the maximum energy ratio. This can be explained by the higher dislocation density for the hot-rolled CP-Ti sheets after plastic deformation, which increases nominal hardness. The result indicated that the energy ratio is related to material microstructures. We should conduct in-depth research on this relationship and clarify its mechanism to provide support for improving the performance of materials, which is also one of the main research hotspots in this field.
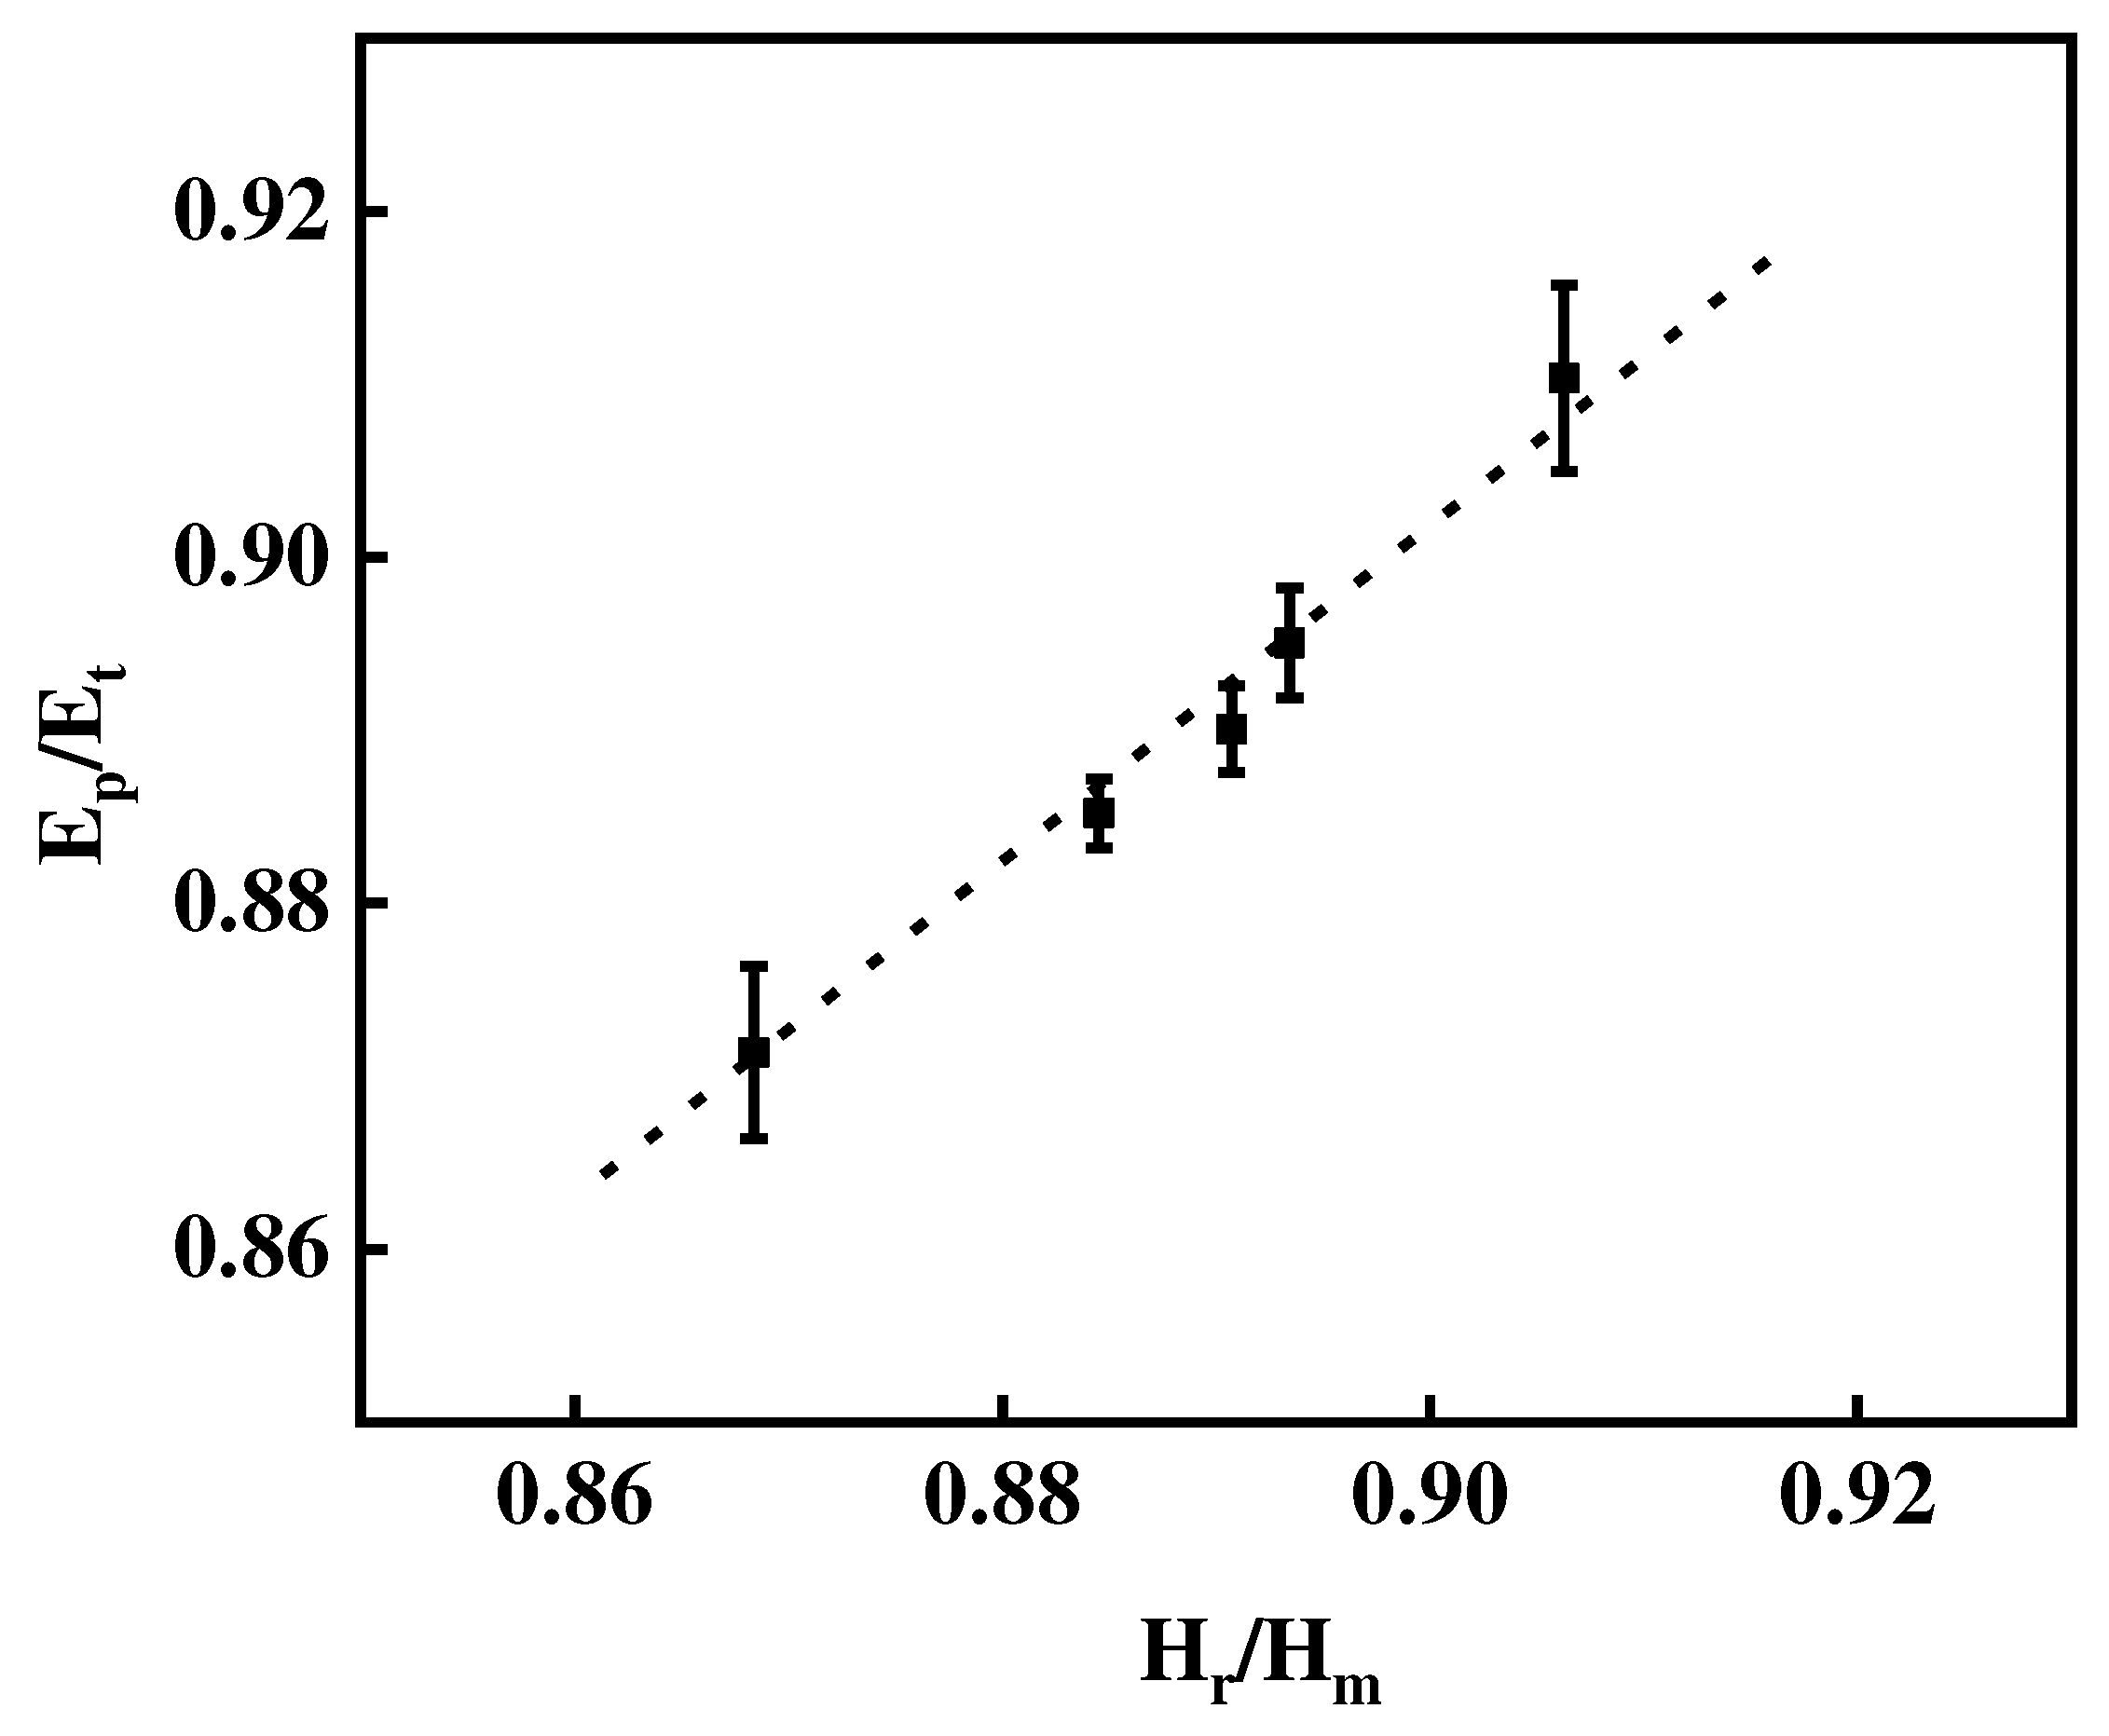
Several works [31,32] have proposed a linear relationship between the micro indentation energy ratio, Eplastic/Etotal, and the micro indentation depth retio, Hr/Hm, for Hr/Hm > 0.4. Figure 11 exhibits the variation of Eplastic/Etotal, as a function of Hr/Hm, for different CP-Ti samples at the indentation load of 100 mN. The value of Eplastic/Etotal increase with the increase of Hr/Hm. The results indicated that the linear relation can also be used for hcp Titanium alloys materials (seen the dotted line in Figure 11), which is independent of the deformation history. Thus, a reasonable conclusion can be drawn that the linear association between the Eplastic/Etotal and Hr/Hm is suitable for all undeformed and deformed crystalline ductile materials.
4. Conclusion
The commercial pure Titanium alloys with various plastic deformation were fabricated using traditional hot rolling manufacturing process. The dependence of the indentation behaviors of hot-rolled CP-Ti on the plastic deformation was analyzed with different indentation load in this work. The original indentation load-displacement curves showed the lager indentation load, the deeper indentation depth. The sample with maximum deformation experienced the largest indentation resistance and had the highest dislocation density. The exponential association between the micro indentation load and the indentation depth suggested that indentation size influenced the indentation results of CP-Ti sheets. The effect of effective strain on Vickers hardness demonstrated the dominant role of dislocation motion in the indentation deformation of hot-rolled CP-Ti alloy. The average indentation Vickers hardness is negative related to both the maximum load and the indentation residual depth, suggesting there exists size effect in indentation deformation process. The largest thickness reduction specimen exhibits maximum Ep, which suggested the energy dissipation in the deformation of crystallized metals is related to its microstructure. Also, the plastic energy dissipated is closely related to residual depth with slope of 0.8127. The influence of the plastic strain on the calculated Ep/Et suggested the energy ratio is related to the microstructure in materials. At last, the linear relation between the energy ratio, Ep/Et, and the indentation depth ratio, Hr/Hm, was obtained for hcp structured Ti materials, which can also be used to all undeformed and deformed hcp crystalline ductile materials in the future discussion.
Funding
The research was sponsored by t the Research Project Supported by Shanxi Scholarship Council of China (2023-145).
Declarations Conflict of interest
The authors have no relevant financial or non-financial interests to disclose.
References
- V. George and Y. Mohammadreza, "Review of Nanoindentation Size Effect: Experiments and Atomistic Simulation," Crystals, vol. 7, no. 10, p. 321, 2017. [CrossRef]
- T. Bond et al., "Indentation size effects in aluminum and titanium alloys," Materials Science and Engineering: A, vol. 839, p. 142542, 2022. [CrossRef]
- N. A. Fleck, G. M. Muller, M. F. Ashby, and J. W. Hutchinson, "Strain gradient plasticity: Theory and experiment," Acta Metal Mater, vol. 42, no. 2, pp. 475-487, 1994. [CrossRef]
- D. E. Stegall, M. A. Mamun, B. Crawford, and A. Elmustafa, "Indentation size effect in FCC metals: An examination of experimental techniques and the bilinear behavior," Journal of Materials Research, vol. 27, no. 12, pp. 1543-1552, 2012. [CrossRef]
- Z. Zong and W. Soboyejo, "Indentation size effects in face centered cubic single crystal thin films," Materials Science & Engineering A, vol. 404, no. 1-2, pp. 281-290, 2005. [CrossRef]
- J. W. et al., "Micro-hardness of annealed and work-hardened copper polycrystals," Scripta Materialia, vol. 34, no. 4, pp. 559-564, 1996.
- G. M. Pharr, E. G. Herbert, and Y. Gao, "The Indentation Size Effect: A Critical Examination of Experimental Observations and Mechanistic Interpretations," Annual Review of Materials Research, vol. 40, no. 1, pp. 271-292, 2010. [CrossRef]
- J. Hayes, R. Keyte, and P. Prangnell, "Effect of grain size on tensile behaviour of a submicron grained Al–3 wt-%Mg alloy produced by severe deformation," Materials Science and Technology, vol. 16, pp. 1259 - 1263, 2000. [CrossRef]
- W. Chen, H. Xie, K. Qian, and H. Gu, "Microstructure evaluation during plastic deformation in a centrifugal spray deposition (CSD) Ti-48Al-2Mn-2Nb alloy," Materials Science and Engineering A, vol. 234, no. none, pp. 245-248, 1997. [CrossRef]
- Zuogui et al., "Grain refining performance for Al and Al–Si alloy casts by addition of equal-channel angular pressed Al–5 mass% Ti alloy," Materials Science & Engineering A, 2006. [CrossRef]
- T. S. Jun et al., "Local deformation mechanisms of two-phase Ti alloy," Materials Science & Engineering: A, 2016. [CrossRef]
- M. B. S. J. Khan et al., "Effect of Alloying Elements on the Compressive Mechanical Properties of Biomedical Titanium Alloys: A Systematic Review.". [CrossRef]
- Qinggang, Meng, Chunguang, Bai, Dongsheng, and Xu, "Flow behavior and processing map for hot deformation of ATI425 titanium alloy," Journal of Materials Science & Technology, vol. v.34, no. 04, pp. 105-114, 2018.
- "<1.pdf>.".
- S. K. Thakur, L. Harish, A. K. Das, S. Rath, and B. K. Jha, "Hot deformation behavior and processing map of Nb-V-Ti micro-alloyed steel," Materials Today: Proceedings, vol. 28, 2020. [CrossRef]
- B. Li, W. He, Z. Chen, H. Huang, and Q. Liu, "Evolution of interface and collaborative deformation between Ti and steel during hot roll bonding," Materials Characterization, vol. 164, p. 110354, 2020. [CrossRef]
- H. et al., "Nanoindentation and wear properties of Ti and Ti-TiB composite materials produced by selective laser melting," Materials Science & Engineering A, 2017.
- Behera, R. Gupta, G. Yasin, T. A. Nguyen, and E. Al, "Mechanical and Tribological Properties Evaluation of Plasma-Sprayed Shape Memory Alloy Coating," Journal of Alloys and Compounds, 2021. [CrossRef]
- A.W. Eberhardt, R. Pandey, J. M. Williams, J. J. Weimer, D. Ila, and R. L. Zimmerman, "The roles of residual stress and surface topography on hardness of Ti implanted Ti[sbnd]6Al[sbnd]4V," Materials Science & Engineering A, vol. 229, no. 1-2, pp. 147-155, 1997.
- J. G. Swadener, B. Taljat, and G. M. Pharr, "Measurement of residual stress by load and depth sensing indentation with spherical indenters," Journal of Materials Research, vol. 16, no. 7, pp. 2091-2102, 2001. [CrossRef]
- A. Rominiyi and P. M. Mashinini, "Nanoindentation study of mechanical and wear properties of spark plasma sintered Ti-6Ni-xTiCN composites," Ceramics International, 2022.
- G. G. Yapici, I. Karaman, and H. J. Maier, "Mechanical flow anisotropy in severely deformed pure titanium," Materials Science and Engineering: A, vol. 434, no. 1/2, pp. 294-302, 2006. [CrossRef]
- L. Jiang, L. F. Guo, M. X. Kai, Z. M. Jie, and Y. Z. Wei, "Micromechanical Study of the Forged Ti-1023 Titanium Alloy by Micro-Indentation," Key Engineering Materials, vol. 765, pp. 160-165, 2018. [CrossRef]
- F. Yang, W. Du, and K. Okazaki, "Effect of cold rolling on the indentation deformation of AA6061 aluminum alloy," Journal of Materials Research, vol. 20, no. 5, pp. 1172-1179, 2011. [CrossRef]
- R. Chen, F. Yang, K. Okazaki, M. A. Imam, C. R. Feng, and P. Pao, "Indentation of titanium processed by equal channel angular pressing," Journal of Physics D: Applied Physics, vol. 41, no. 10, 2008. [CrossRef]
- F. Yang, L. Peng, and K. Okazaki, "Microindentation of aluminum," Metallurgical and Materials Transactions A, vol. 35, no. 10, pp. 3323-3328, 2004. [CrossRef]
- R. Chen, F. Yang, M. A. Imam, C. R. Feng, and P. Pao, "Microindentation of titanium: Dependence of plastic energy on the indentation depth and time-dependent plastic deformation," Journal of Materials Research, vol. 23, no. 4, pp. 1068-1075, 2011. [CrossRef]
- J. Alcalá, L. M. Pike, and J. J. Giovannoni, "Identification of Plastome Variants useful for Cytoplasmic Selection and Cultivar Identification in Onion," Journal of the American Society for Horticultural Science, 1999. [CrossRef]
- D. Zhou, W. Du, X. Wen, J. Qiao, W. Liang, and F. Yang, "Local Deformation and Texture of Cold-Rolled AA6061 Aluminum Alloy," Materials, vol. 11, no. 10, Oct 1 2018. [CrossRef]
- N. M. Pugno, "A general shape/size-effect law for nanoindentation," Acta Materialia, vol. 55, no. 6, pp. 1947-1953, 2007. [CrossRef]
- J. Mencik and M. V. Swain, "Micro-indentation Test with Pointed Indenters," Metals Forum, vol. 18, pp. 277-288, 1994.
- Y. Cheng and C. Cheng, "Scaling, Dimensional Analysis, and Indentation Measurements," Materials Science & Engineering R, vol. 44, no. 4-5, pp. 91-149, 2004. [CrossRef]
Figure 1.
Typical indentation load-displacement curves of hot-rolled CP-Ti sheets under the different maximum indentation loads (thickness reduction=60%).
Figure 1.
Typical indentation load-displacement curves of hot-rolled CP-Ti sheets under the different maximum indentation loads (thickness reduction=60%).
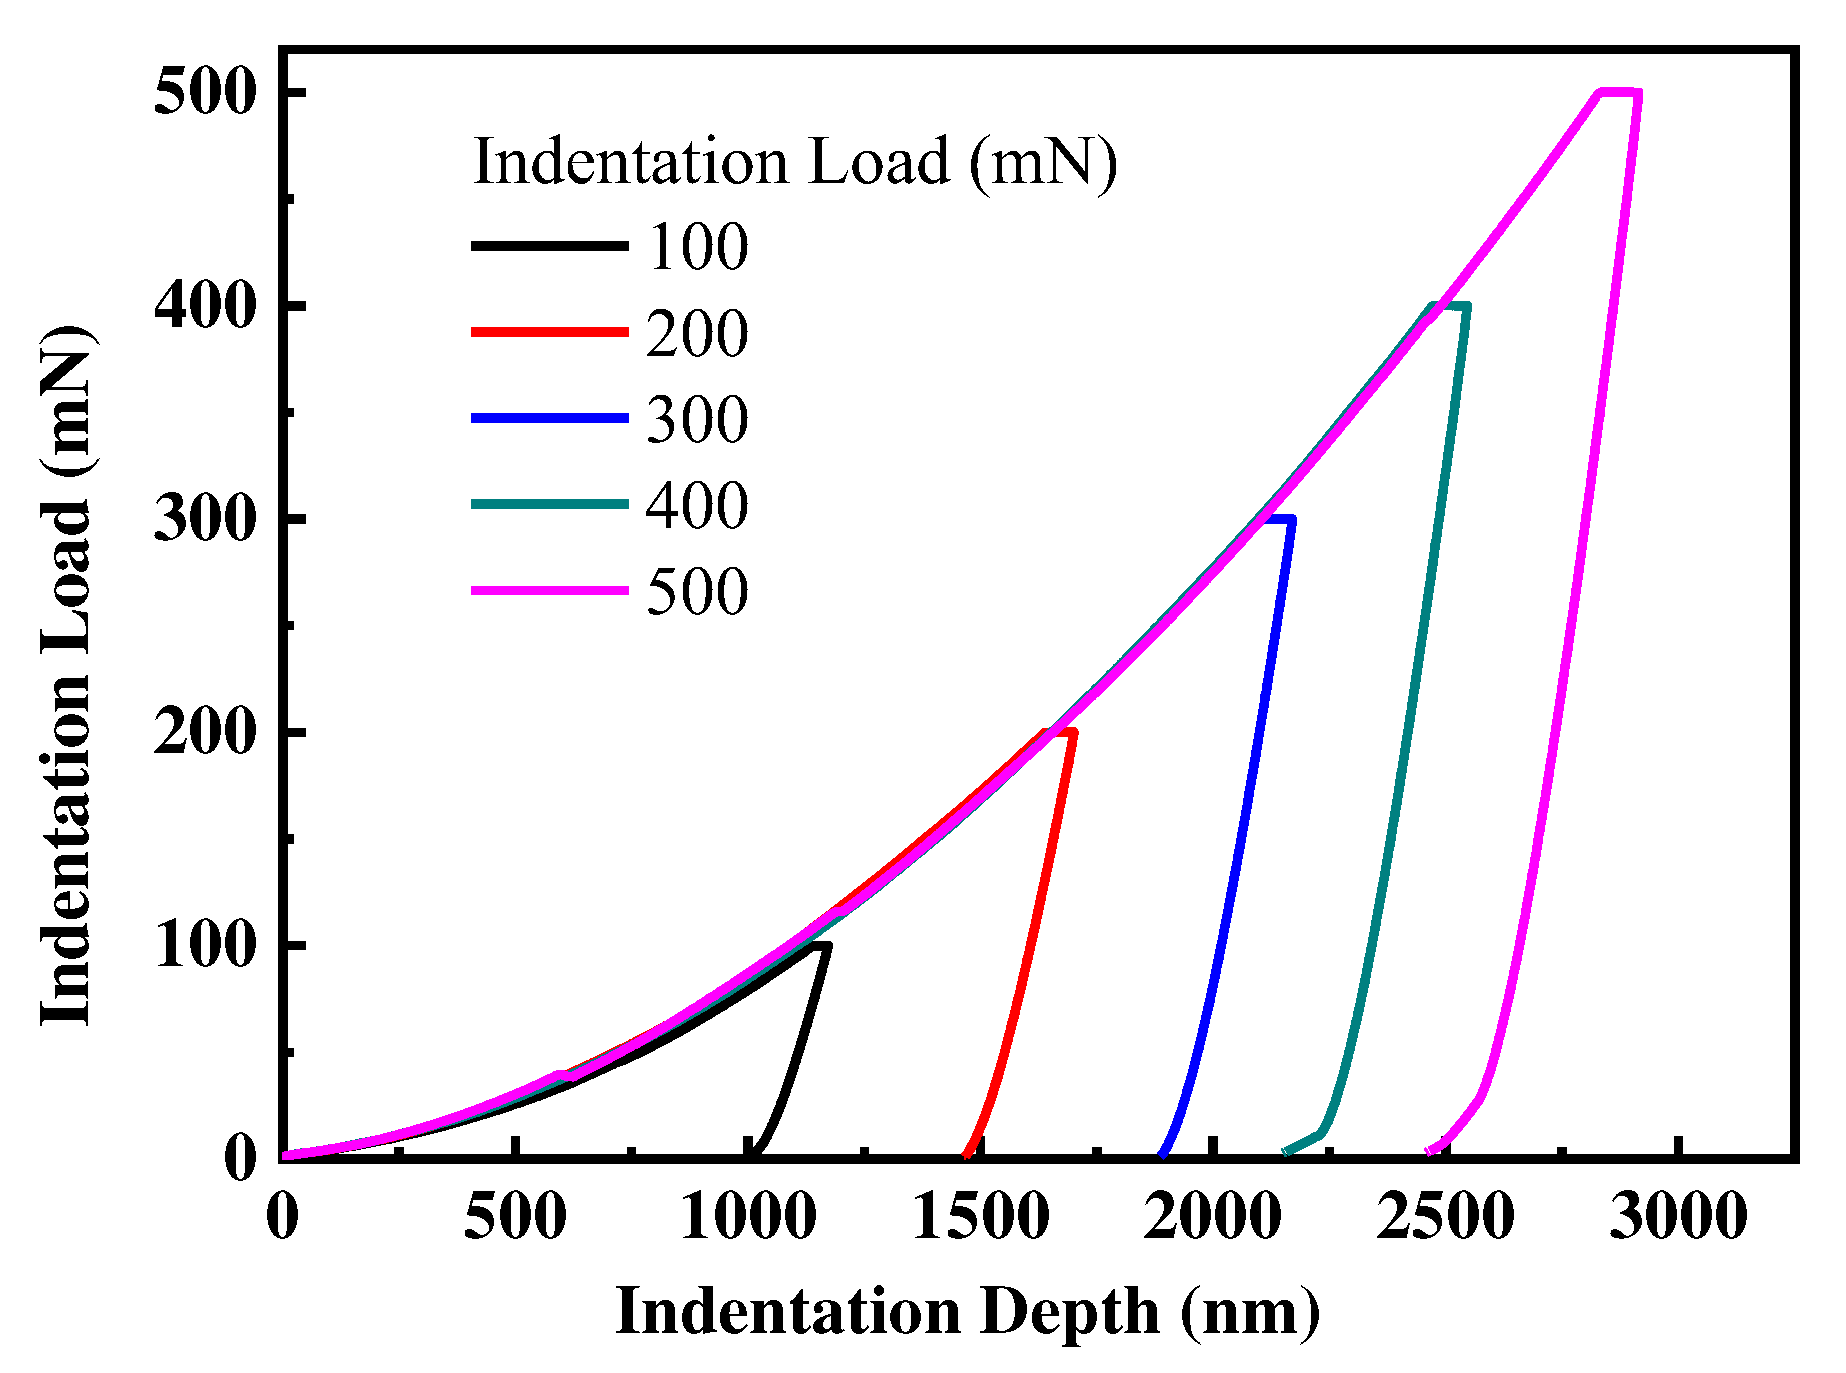
Figure 2.
Typical indentation load-displacement curves of hot-rolled CP-Ti sheets with different thickness reductions (Fmax =100 mN).
Figure 2.
Typical indentation load-displacement curves of hot-rolled CP-Ti sheets with different thickness reductions (Fmax =100 mN).
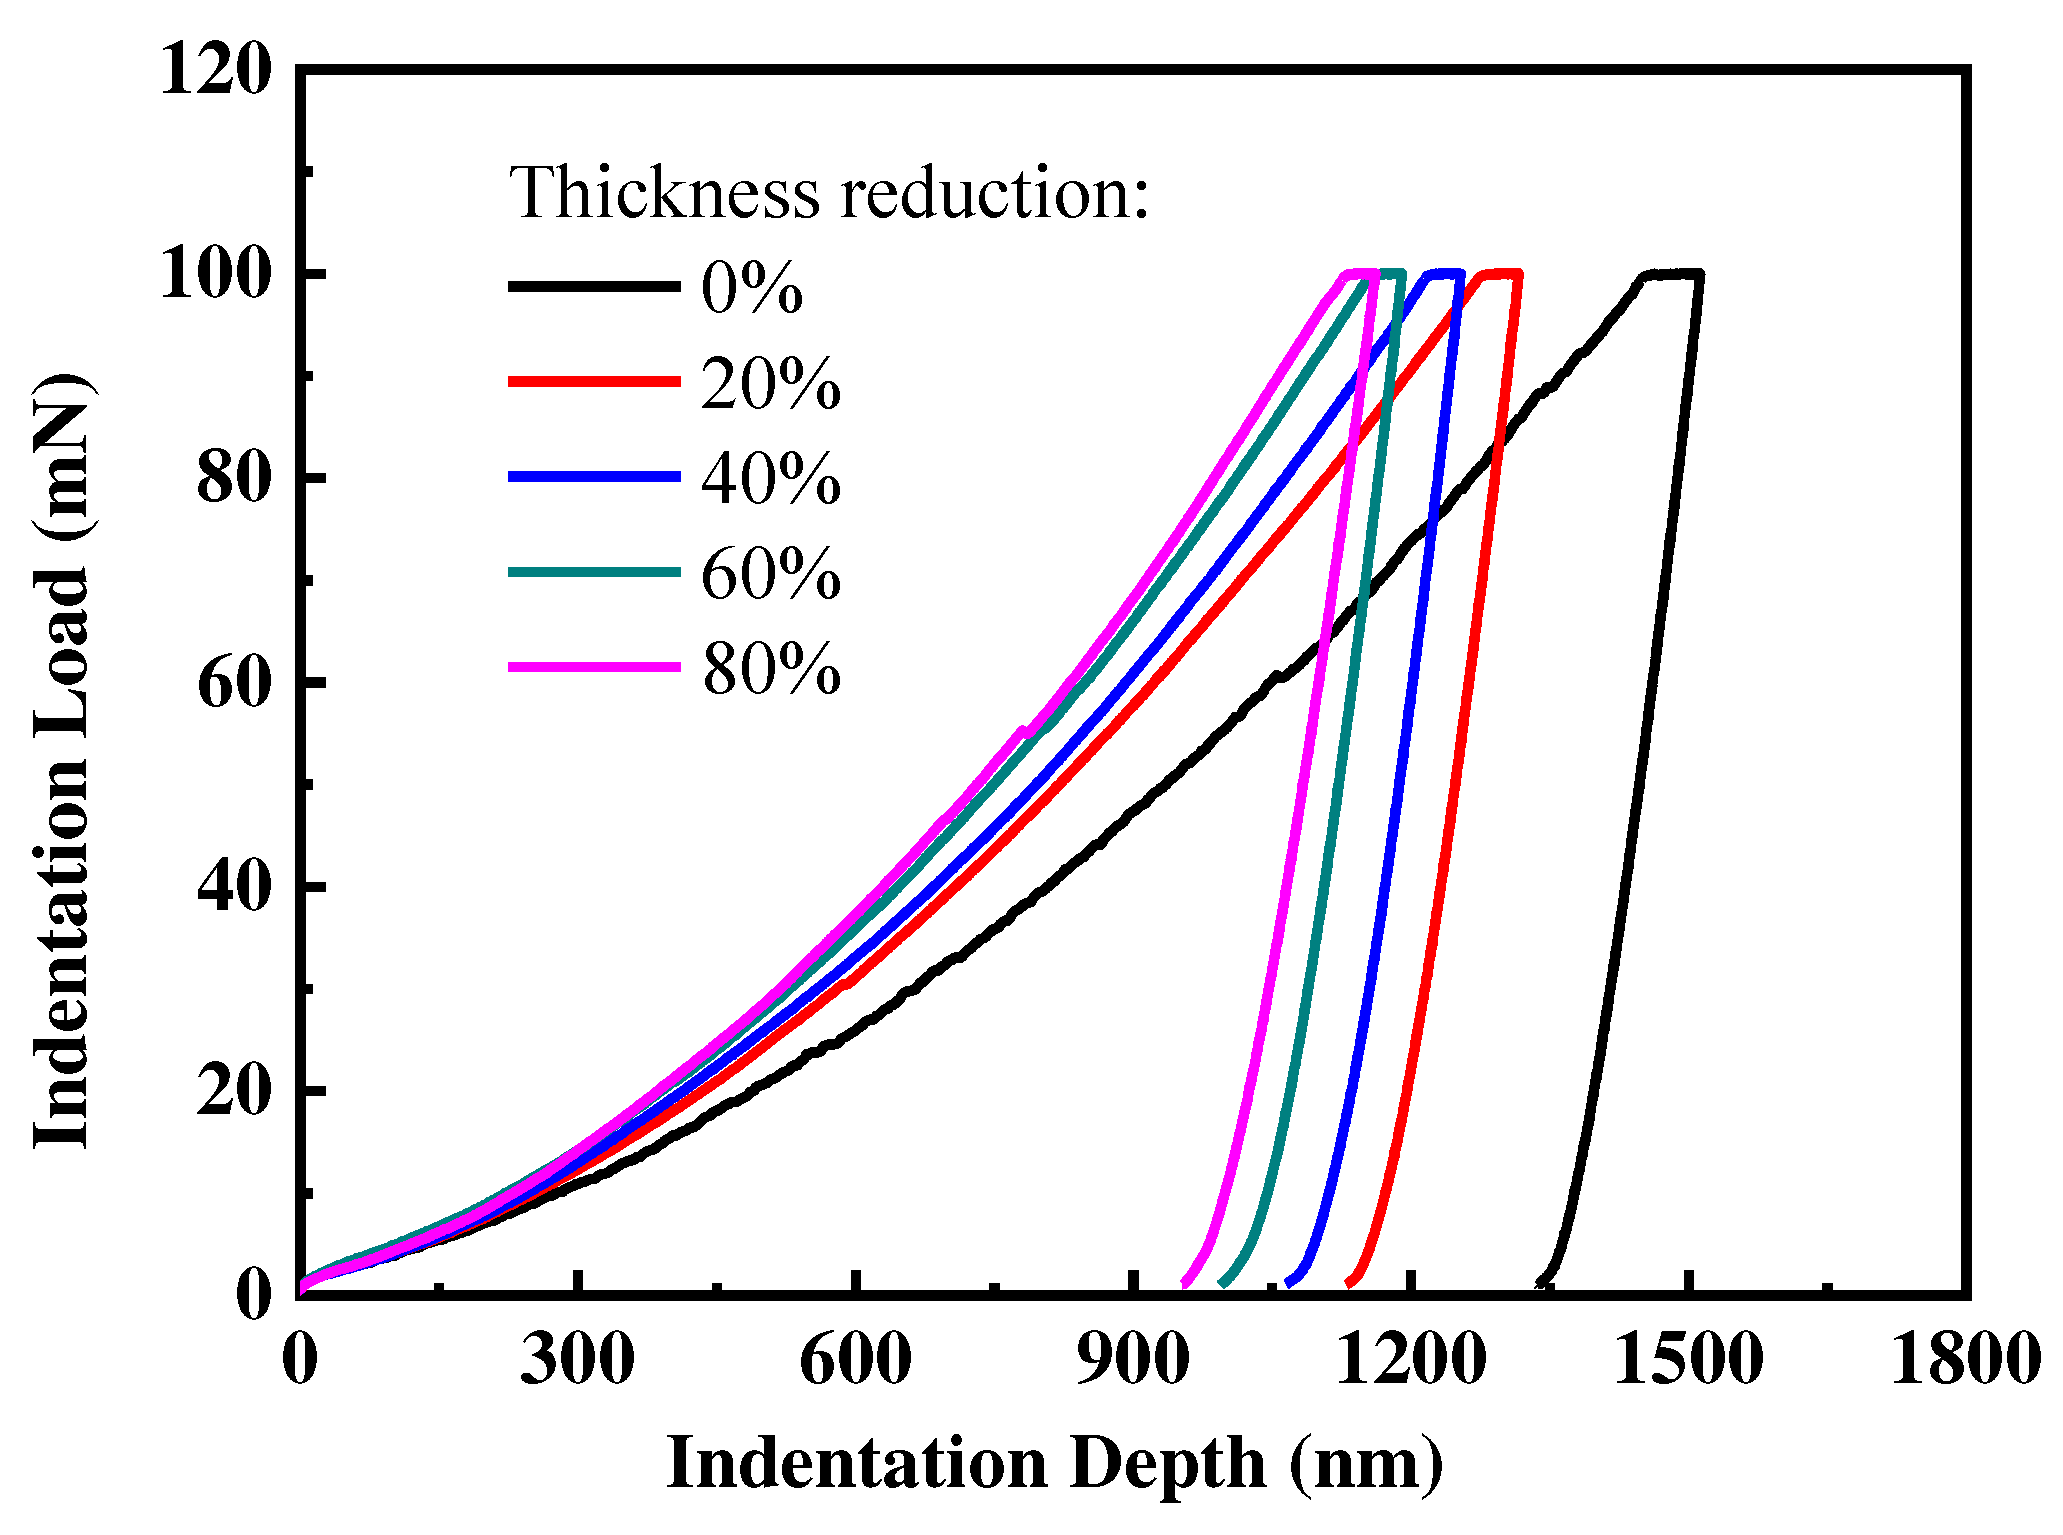
Figure 3.
Dependence of maximum indentation depth on maximum micro indentation load for the CP-Ti sheets.
Figure 3.
Dependence of maximum indentation depth on maximum micro indentation load for the CP-Ti sheets.
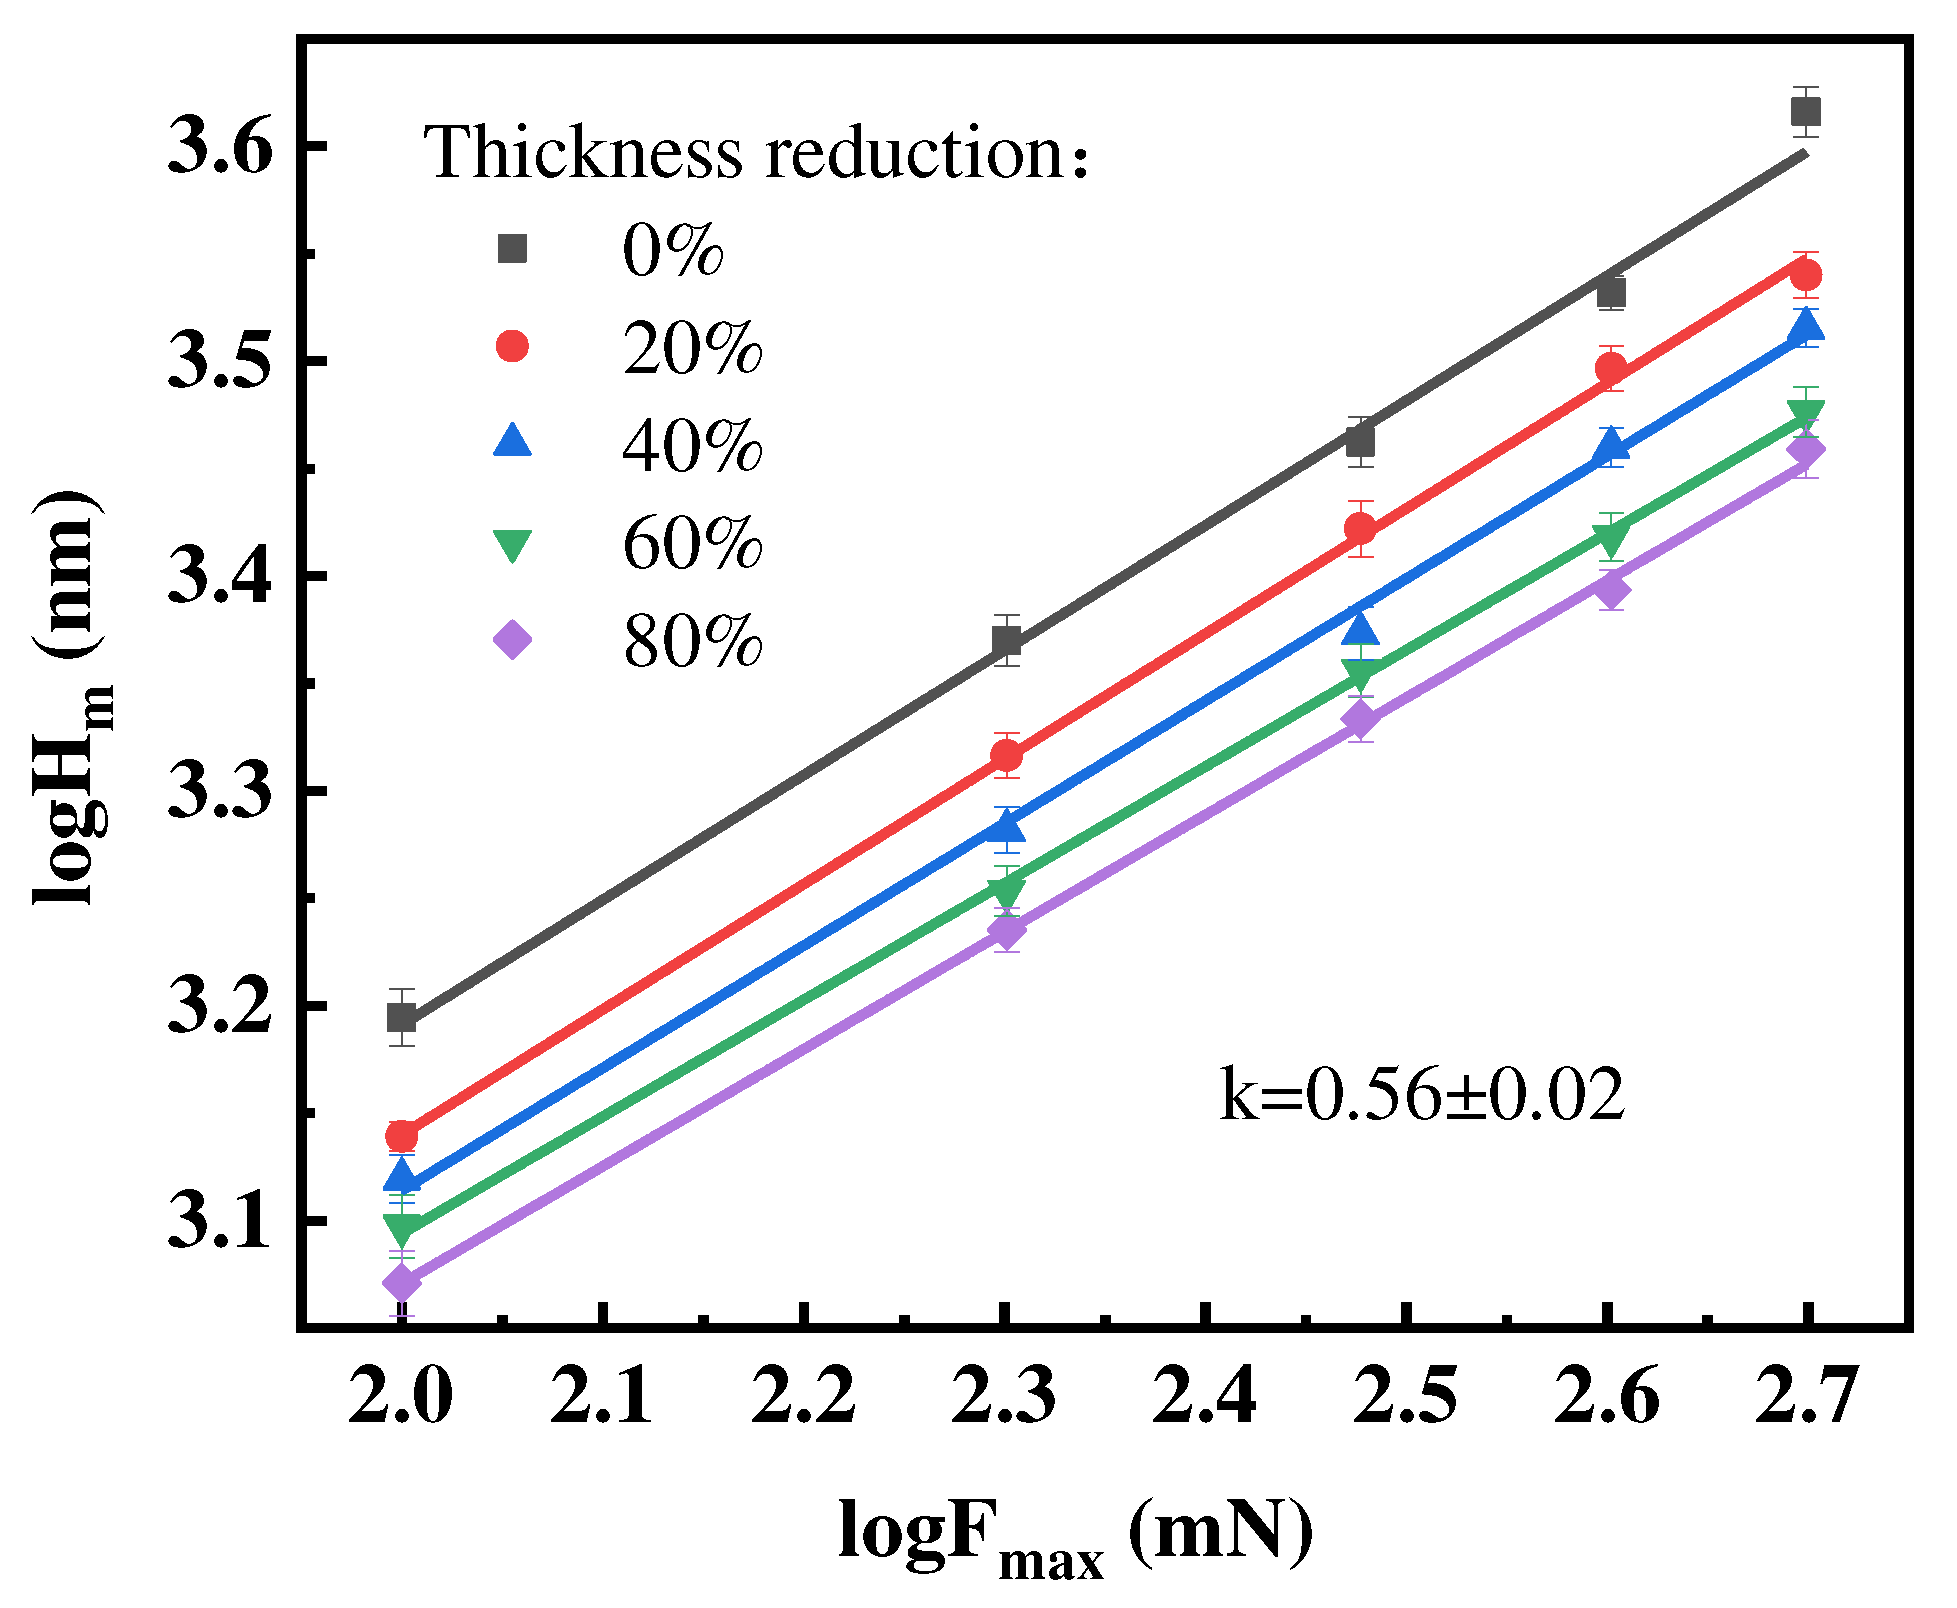
Figure 4.
Dependence of residual indentation depth on maximum micro indentation load for the CP-Ti sheets.
Figure 4.
Dependence of residual indentation depth on maximum micro indentation load for the CP-Ti sheets.
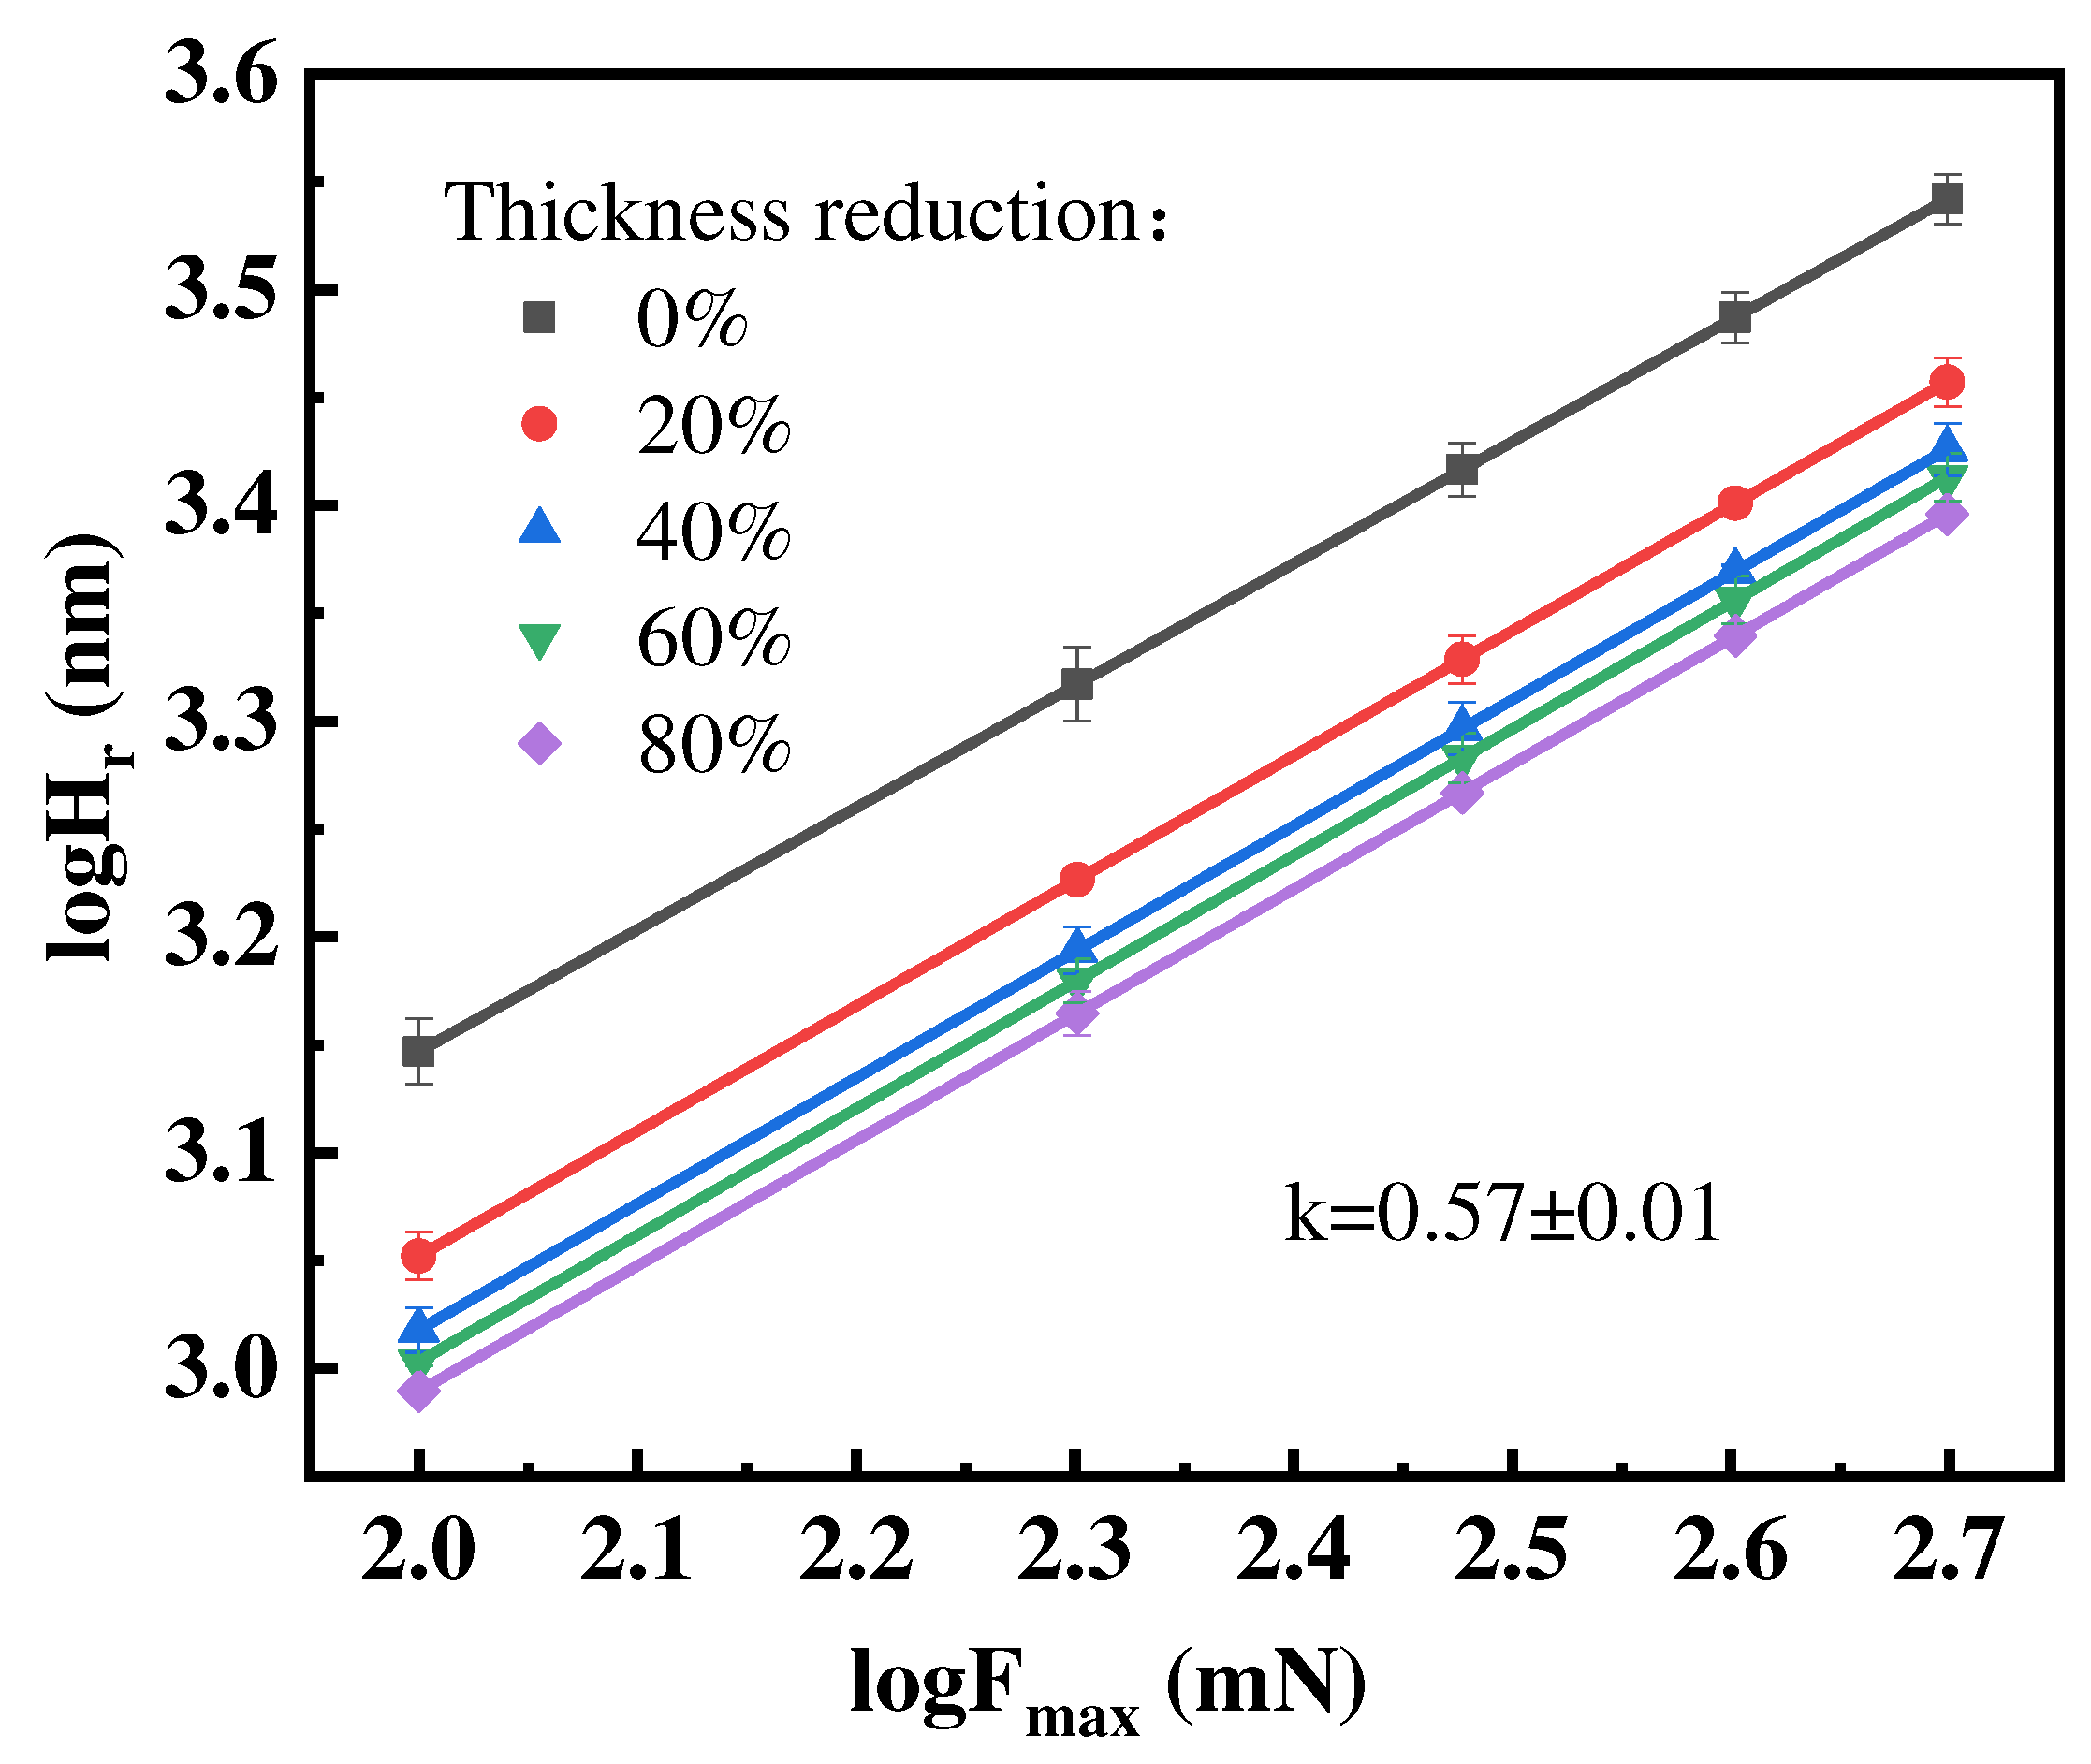
Figure 5.
Dependence of the Vickers hardness on the effective strain for CP-Ti samples with the indentation load of 200 mN.
Figure 5.
Dependence of the Vickers hardness on the effective strain for CP-Ti samples with the indentation load of 200 mN.

Figure 6.
Dependence of the average indentation Vickers hardness on the maximum micro indentation load.
Figure 6.
Dependence of the average indentation Vickers hardness on the maximum micro indentation load.
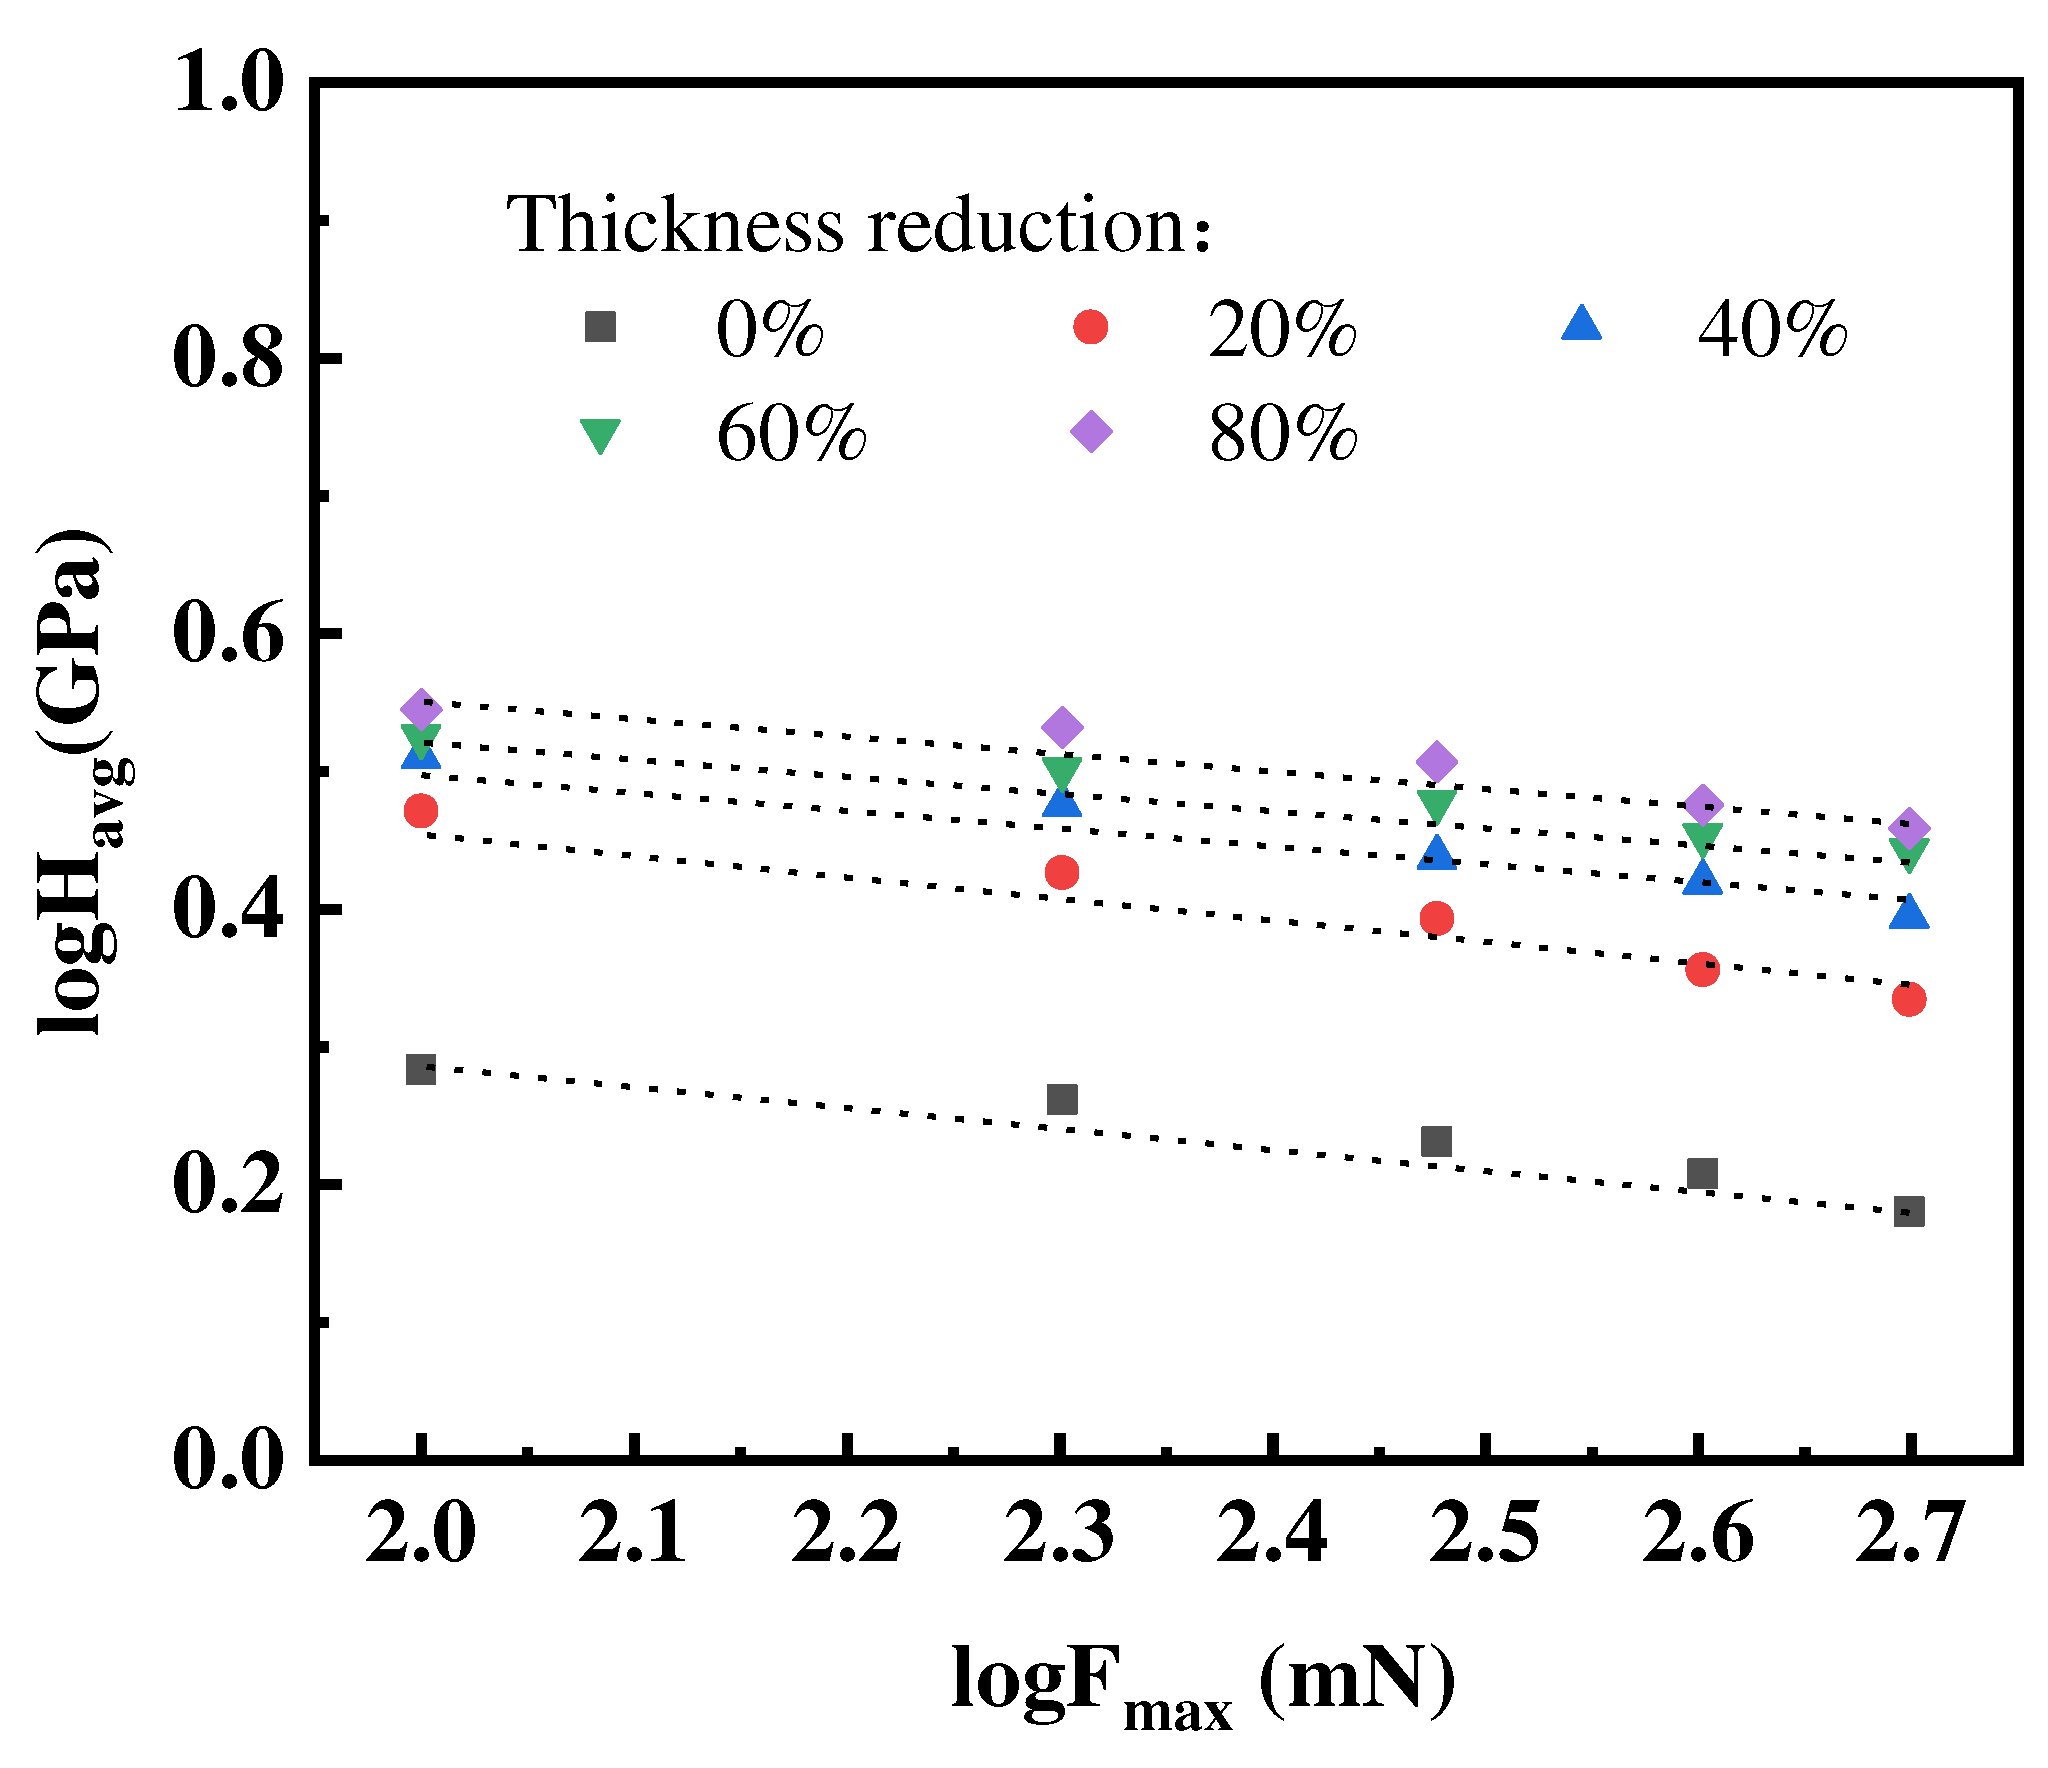
Figure 7.
Relation of the average indentation hardness and the indentation residual depth.
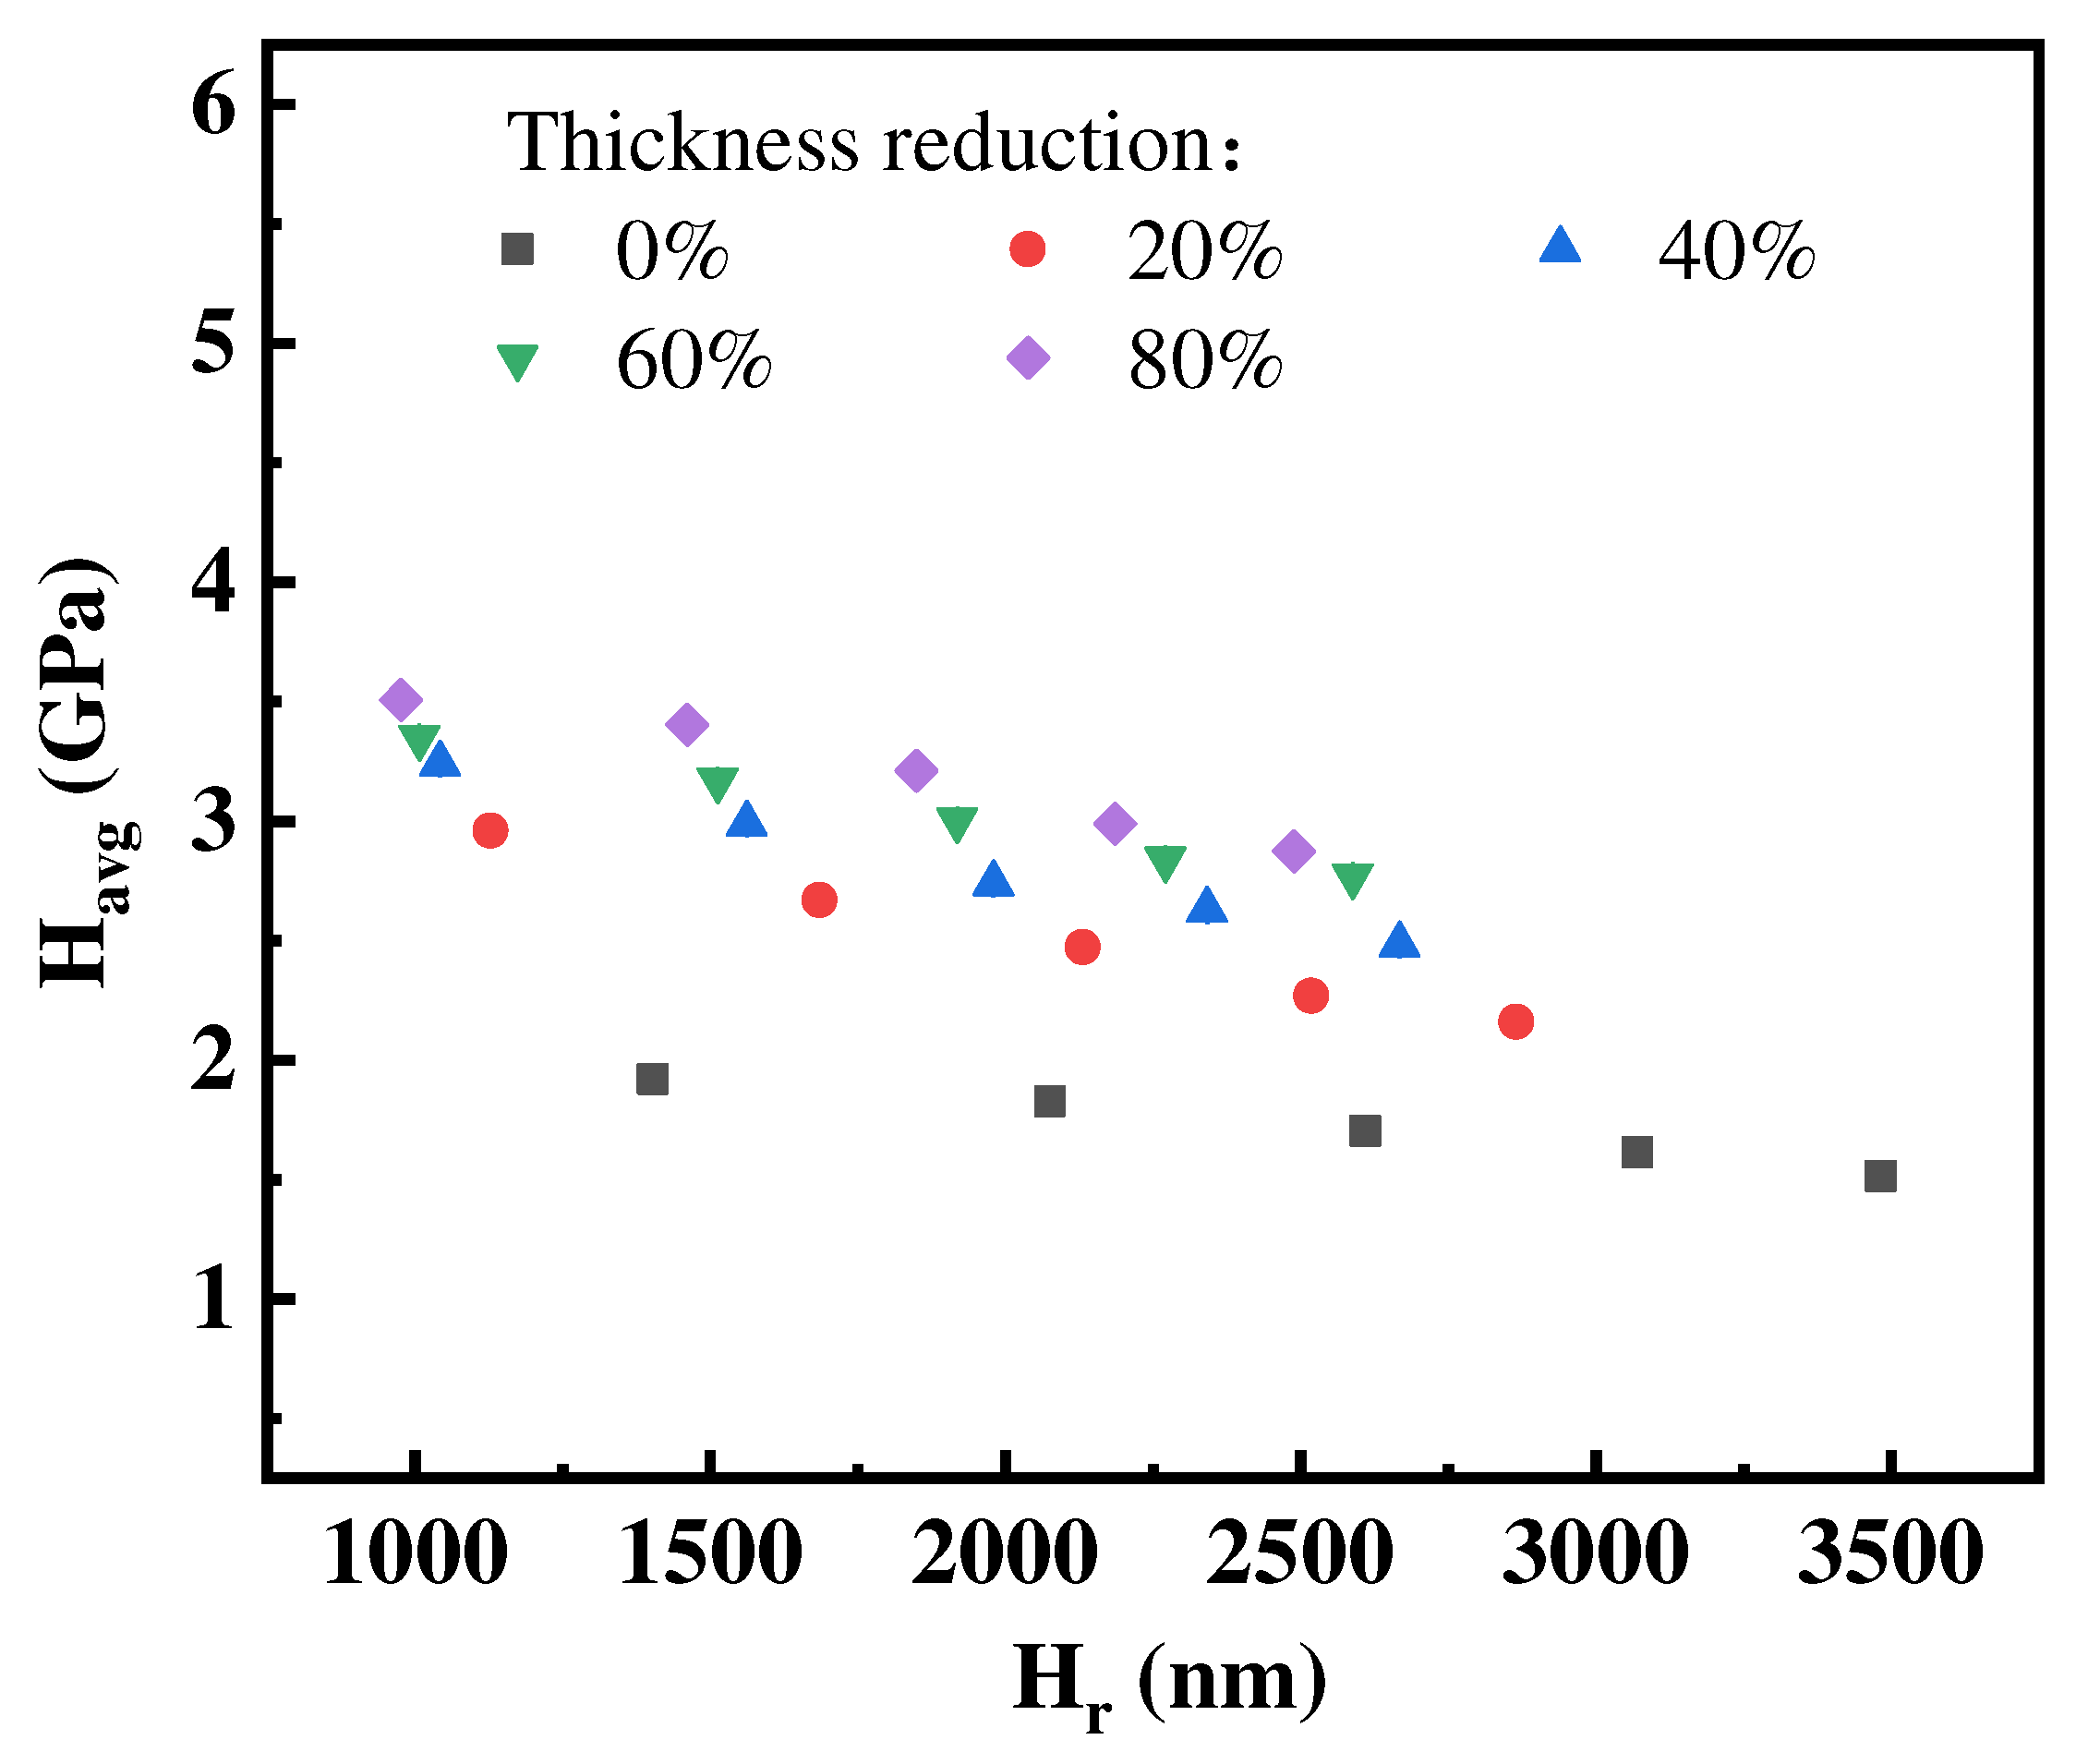
Figure 8.
Eplastic in the indentation with load of 100 mN.
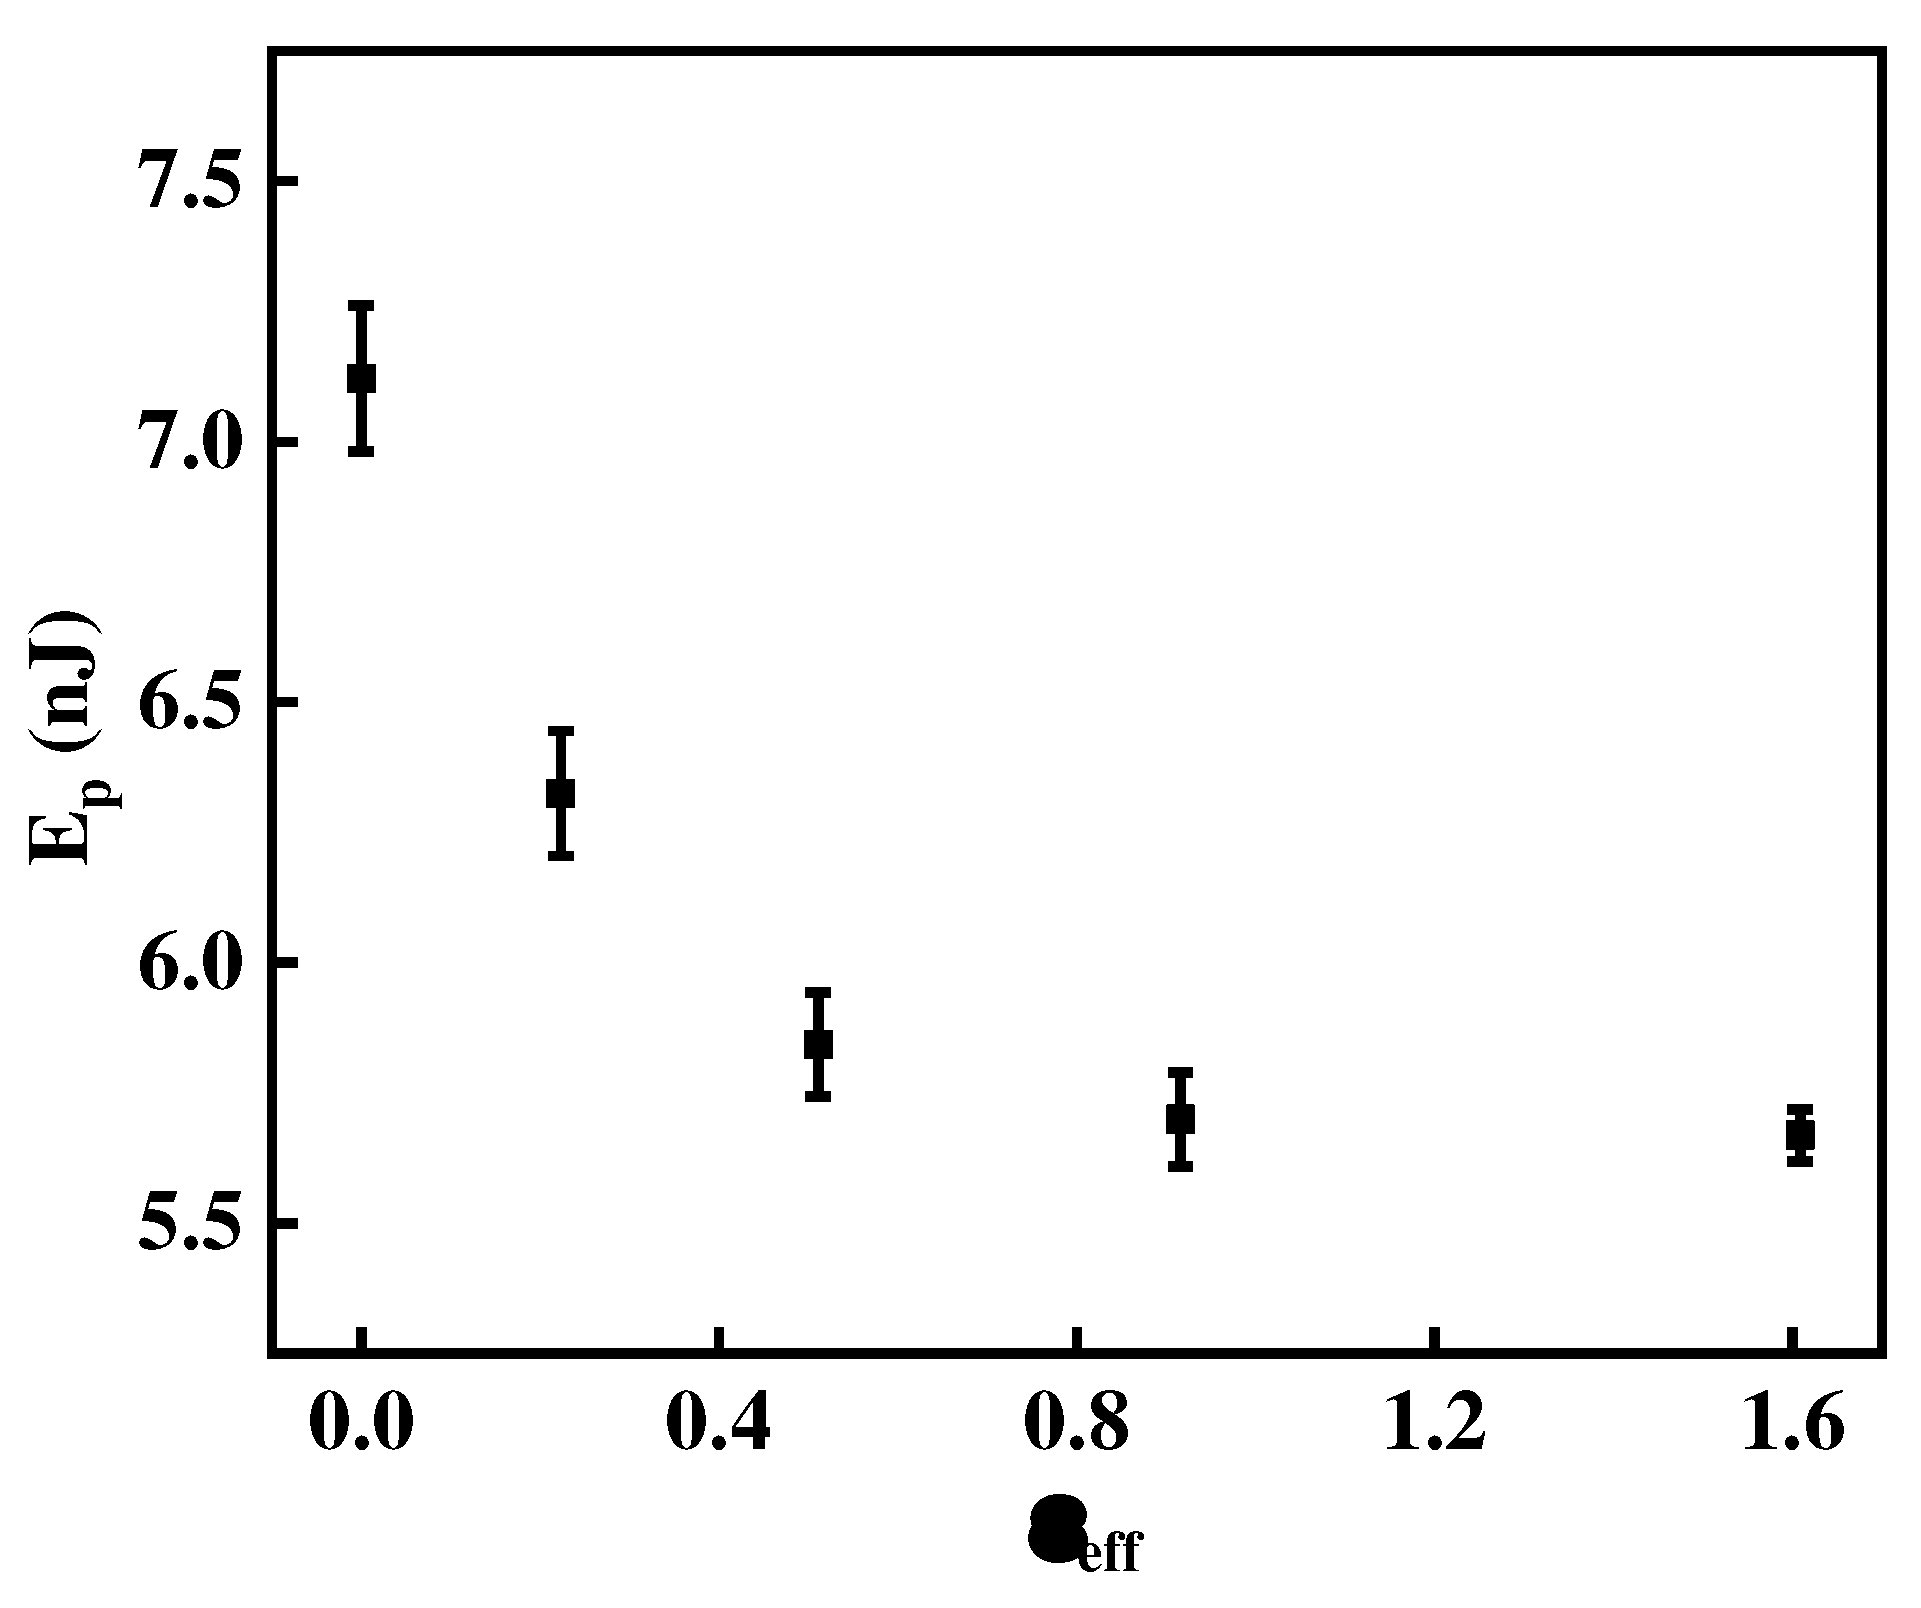
Figure 9.
Plastic energy dissipated as a function of the residual depth with load of 100 mN for the different thickness reductions CP-Ti sheets.
Figure 9.
Plastic energy dissipated as a function of the residual depth with load of 100 mN for the different thickness reductions CP-Ti sheets.
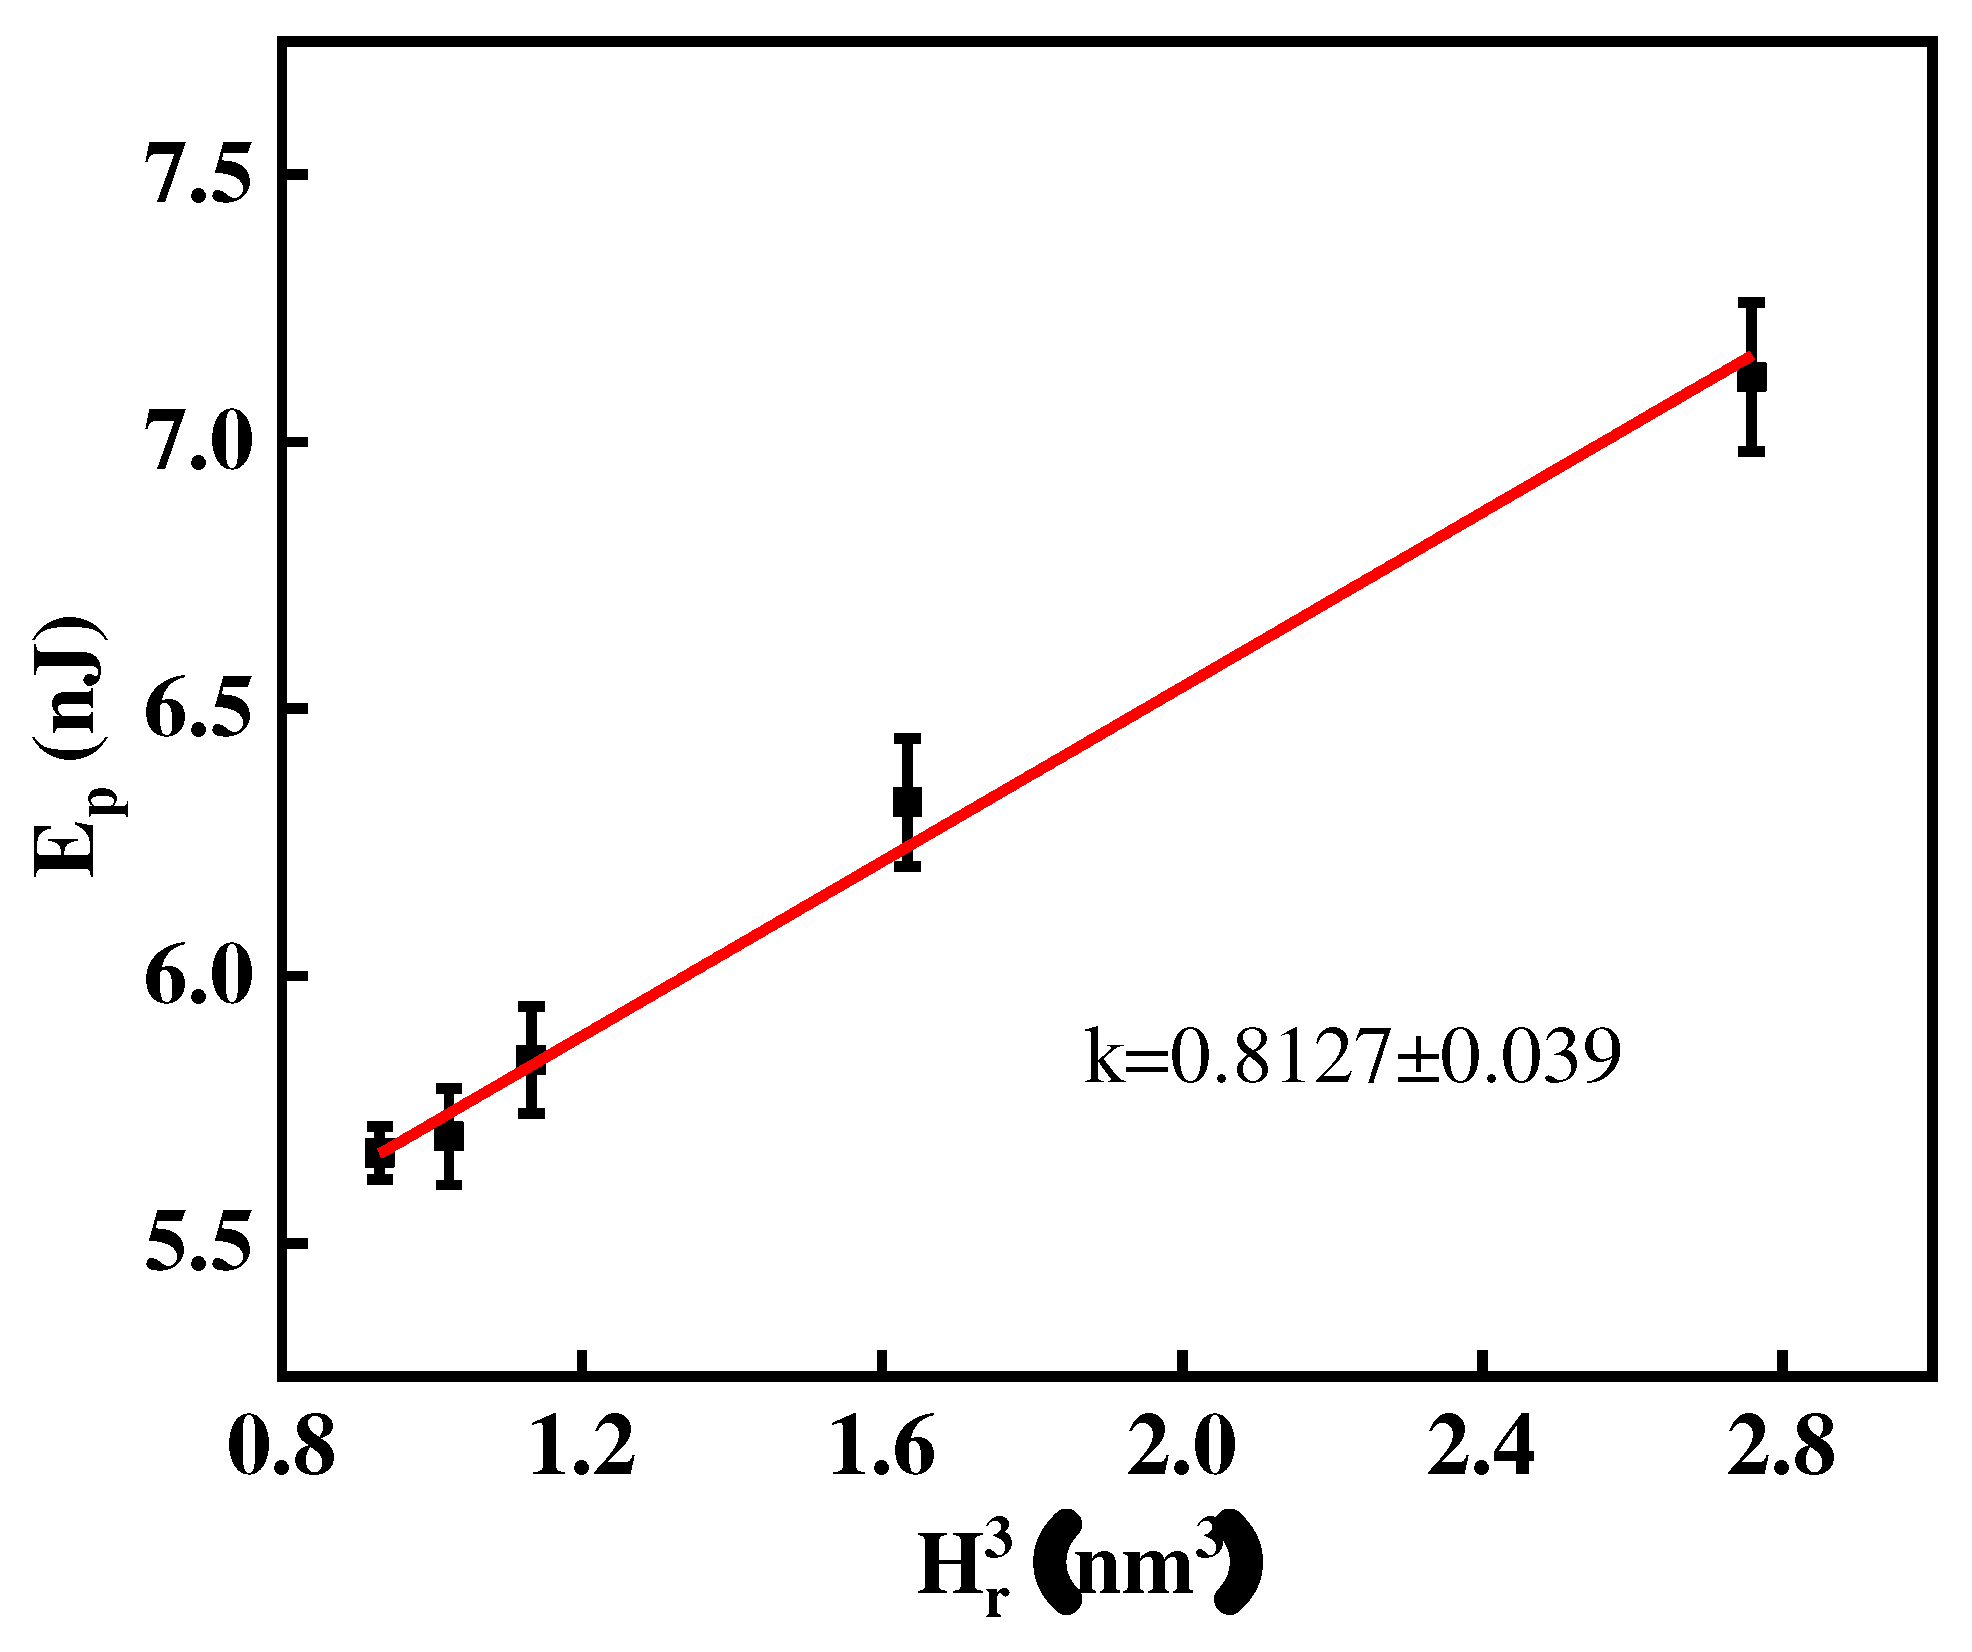
Figure 10.
Effect of the plastic strain on the energy ratio for the different thickness reductions CP-Ti sheets.
Figure 10.
Effect of the plastic strain on the energy ratio for the different thickness reductions CP-Ti sheets.
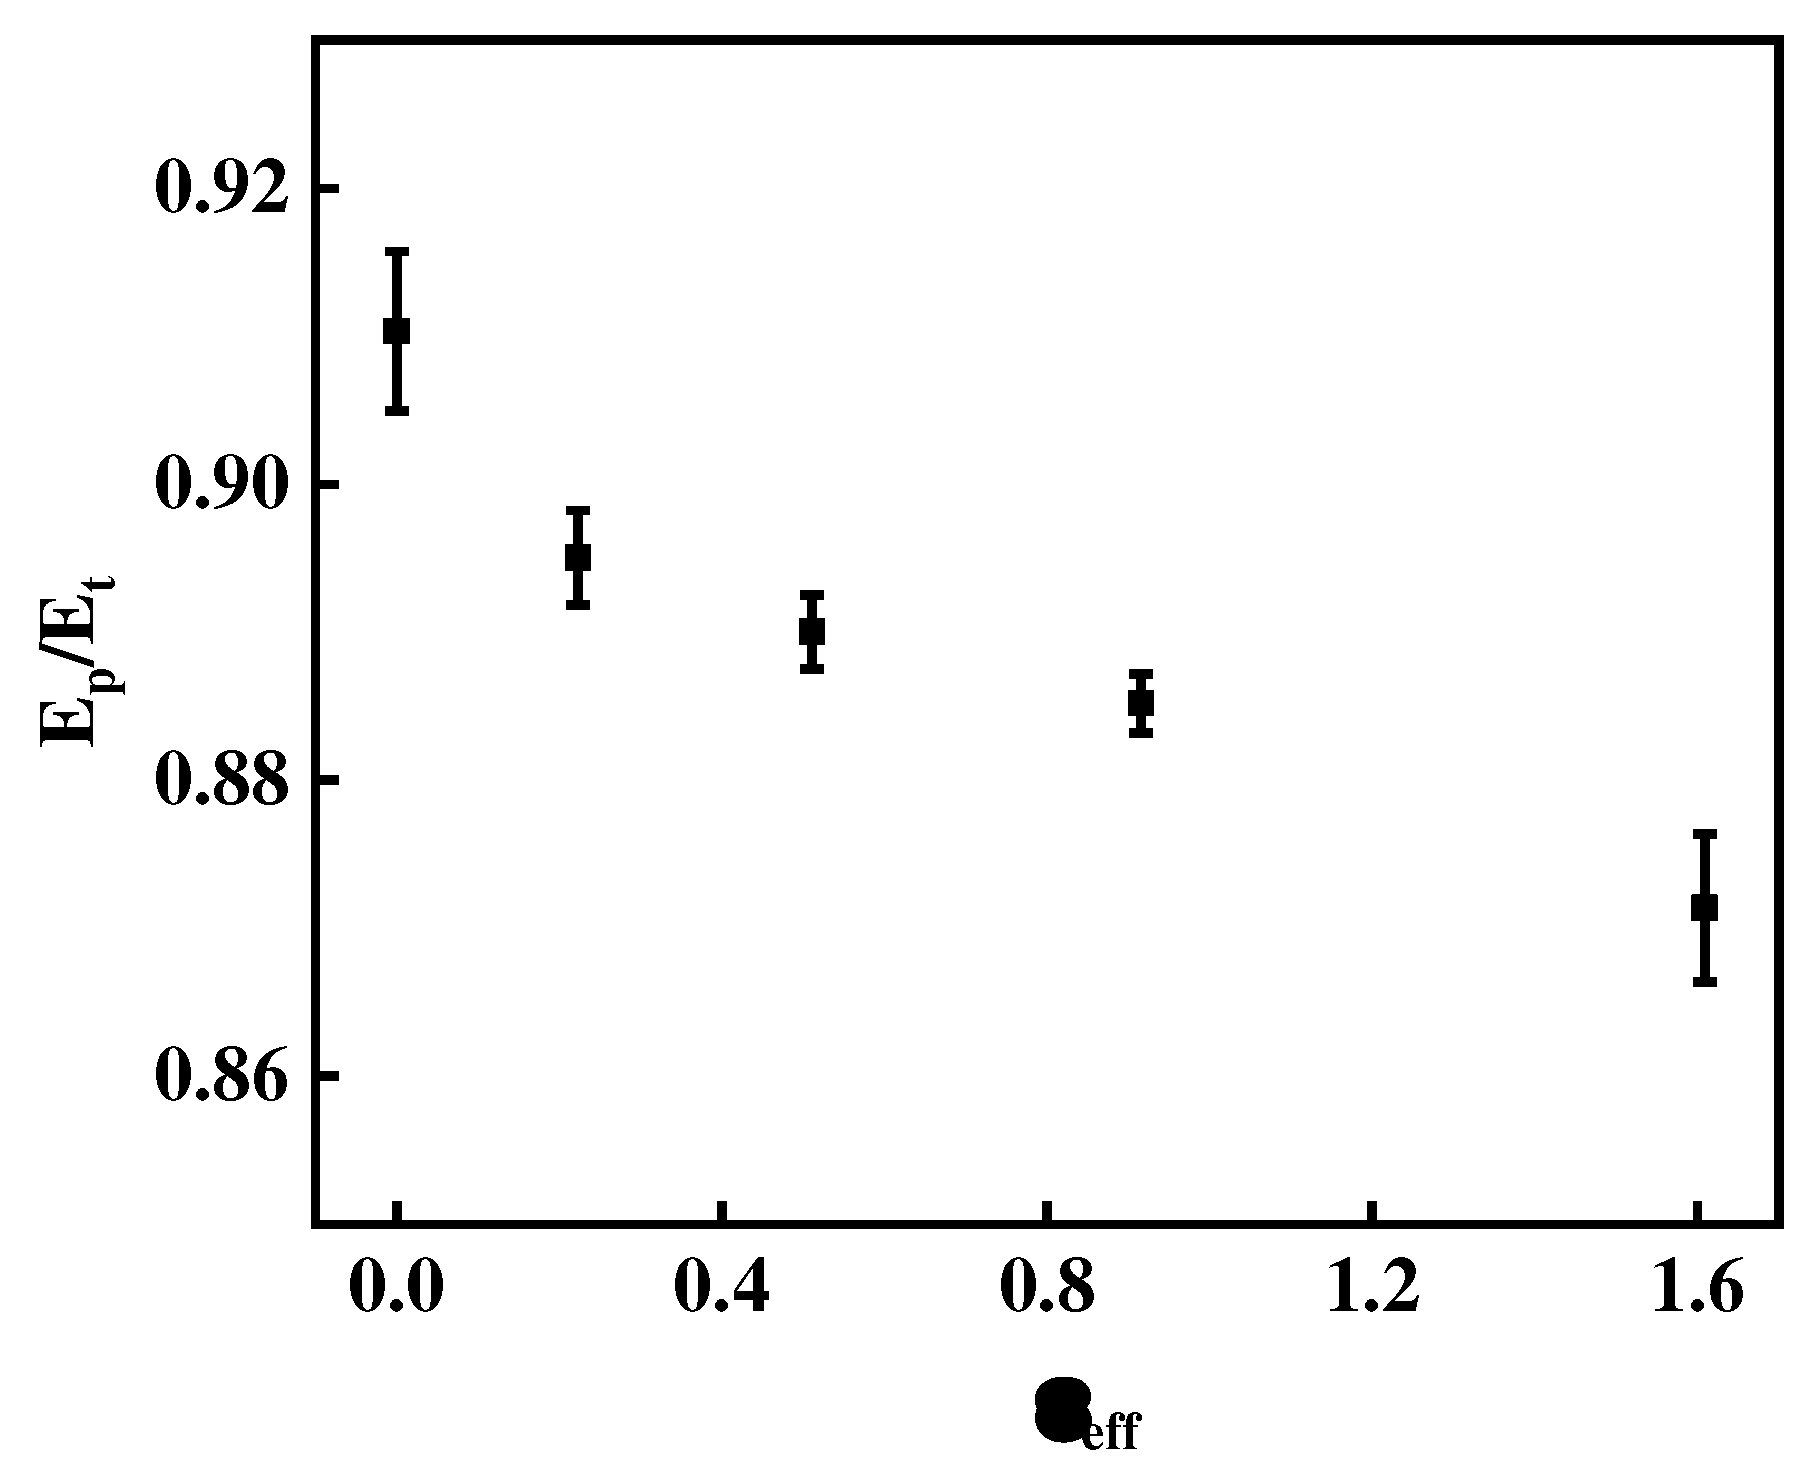
Figure 11.
Effect of the indentation depth ratio, Hr/Hm, on the energy ratio, Eplastic/Etotal, at the indentation load of 100 mN for the different thickness reductions CP-Ti sheets.
Figure 11.
Effect of the indentation depth ratio, Hr/Hm, on the energy ratio, Eplastic/Etotal, at the indentation load of 100 mN for the different thickness reductions CP-Ti sheets.
Disclaimer/Publisher’s Note: The statements, opinions and data contained in all publications are solely those of the individual author(s) and contributor(s) and not of MDPI and/or the editor(s). MDPI and/or the editor(s) disclaim responsibility for any injury to people or property resulting from any ideas, methods, instructions or products referred to in the content. |
© 2024 by the authors. Licensee MDPI, Basel, Switzerland. This article is an open access article distributed under the terms and conditions of the Creative Commons Attribution (CC BY) license (http://creativecommons.org/licenses/by/4.0/).
Copyright: This open access article is published under a Creative Commons CC BY 4.0 license, which permit the free download, distribution, and reuse, provided that the author and preprint are cited in any reuse.


