1. Introduction
Chloroplasts are the main site of photosynthesis, which not only convert light energy into chemical energy, but also synthesize biologically essential compounds such as fatty acids, vitamins, amino acids, and tetrapyridine [
1]. However defects of chloroplast development will affect leaf color, seeding survival or crop yield [
2,
3]. Therefore, the new rice leaf color mutants provide not only ideal materials for studying chloroplast development, but also important germplasm resources for high photosynthetic efficiency breeding in rice.
In general, chloroplasts develop from a proplastid to mature chloroplast is a complicated physiological process, which requires plastid DNA replication, build-up of chloroplast translation system, assembly of the photosynthetic apparatus and involves different regulatory genes [
4]. So far, many of genes associated with albino phenotype in rice have been identified. The genes of
OsPPR1,
ASL2,
OsDjA7/8,
AL1,
OsPPR6,
TCD5,
OsCAF2,
OsHMBPP,
OsPPR9,
ALS1[
5,
6,
7,
8,
9,
10,
11,
12,
13,
14] were necessary for chloroplast development. Additionally, chloroplasts genes are transcribed by two distinct polymerases: nucleus-encoded polymerase (NEP) and plastid-encoded polymerase (PEP) [
15]. Currently, at least 215 transcription start sites of PEP and NEP have been determined in mature chloroplasts of Arabidopsis using Terminome-seq [
16].
Mutant of leaf color can be derived from a wide range of sources, including spontaneous, artificially induced, insertion, and gene silencing mutations [
17,
18,
19]. Li et al. [
20] classified typical leaf color mutant phenotypes include albino, green, light green, striped, white, yellow, green and yellow types. Yoo et al. [
21] divided rice leaf phenotypes into types, including green leaf, albino, stripe, retarded green, zebra stripe, yellow, and variegated color. Li et al. [
22] classified rice leaf color mutations into light green, yellow, albino, and reversible green albino. According to the characteristics of the generation and development of albinism, the albino phenotypes can be further divided into lethal albino, temperature-sensitive regreening albino, reproductive regreening albino, etc. When the leaf becomes colored, the levels of growth-promoting phytohormones, such as auxin, cytokinin and gibberellin are reduced [
23]. Abnormal chloroplast development in cells also leads to abnormal cell division. In Arabidopsis Atcls8 mutants, inhibition of chloroplast DNA replication leads to abnormal growth: leaf albinism and curling and reduced root length [
24].
In this study, a rice albino mutant osal13 was screened from a T-DNA insertion mutant library, and its genetic characteristics were analyzed by genetic population construction. The data showed that the albino trait was controlled by a single recessive nuclear gene. The target gene and its promoter were cloned and its function was predicted using bioinformatics. The spatiotemporal expression pattern and genetic function of the target gene were studied by constructing four different expression vectors, and β-glucuronidase (GUS) staining and quantitative real-time PCR (qRT-PCR) were used to reveal the expression pattern of the target gene. The number and ultrastructure of chloroplasts in mutant and RNAi were analyzed using fluorescence microscopy and transmission electron microscopy (TEM). The hormone contents in wild-type (WT), osal13 mutants, and transgenic plants were determined by enzyme-linked immunosorbent assay to explore the regulation effect of OsAL13 on hormones. Multiple chloroplast-associated genes were investigated. Overall, this study improved our understanding of OsAL13 protein and revealed the molecular mechanism of OsAL13 action in rice chloroplast development.
3. Discussion
Using a DNA-walking cloning method, we isolated the gene
OsAL13, which encodes a novel protein. We found that
OsAL13 is a novel gene in rice that has not been cloned or studied. The protein sequence encoded by
OsAL13 is shown in (
Figure S3). Searching for the conserved domain of the protein encoded by
OsAL13 in the NCBI was not successful (
Figure S4). Homologous genes and homologous proteins were found, but no homologous proteins (genes) with known functions were found (
Figure S5).
In the
OsAL13 mutations, the most obvious phenotypic feature was albino lethality. In previous studies, the gene that caused the albino lethality phenotype basically affected chloroplast development and chlorophyll metabolism abnormality [
25,
26,
27]. The rice albinism seedling mutants
Oslas1,
Osasl4[
28],
Osra1 [
29] and
OsCpn60β1 [
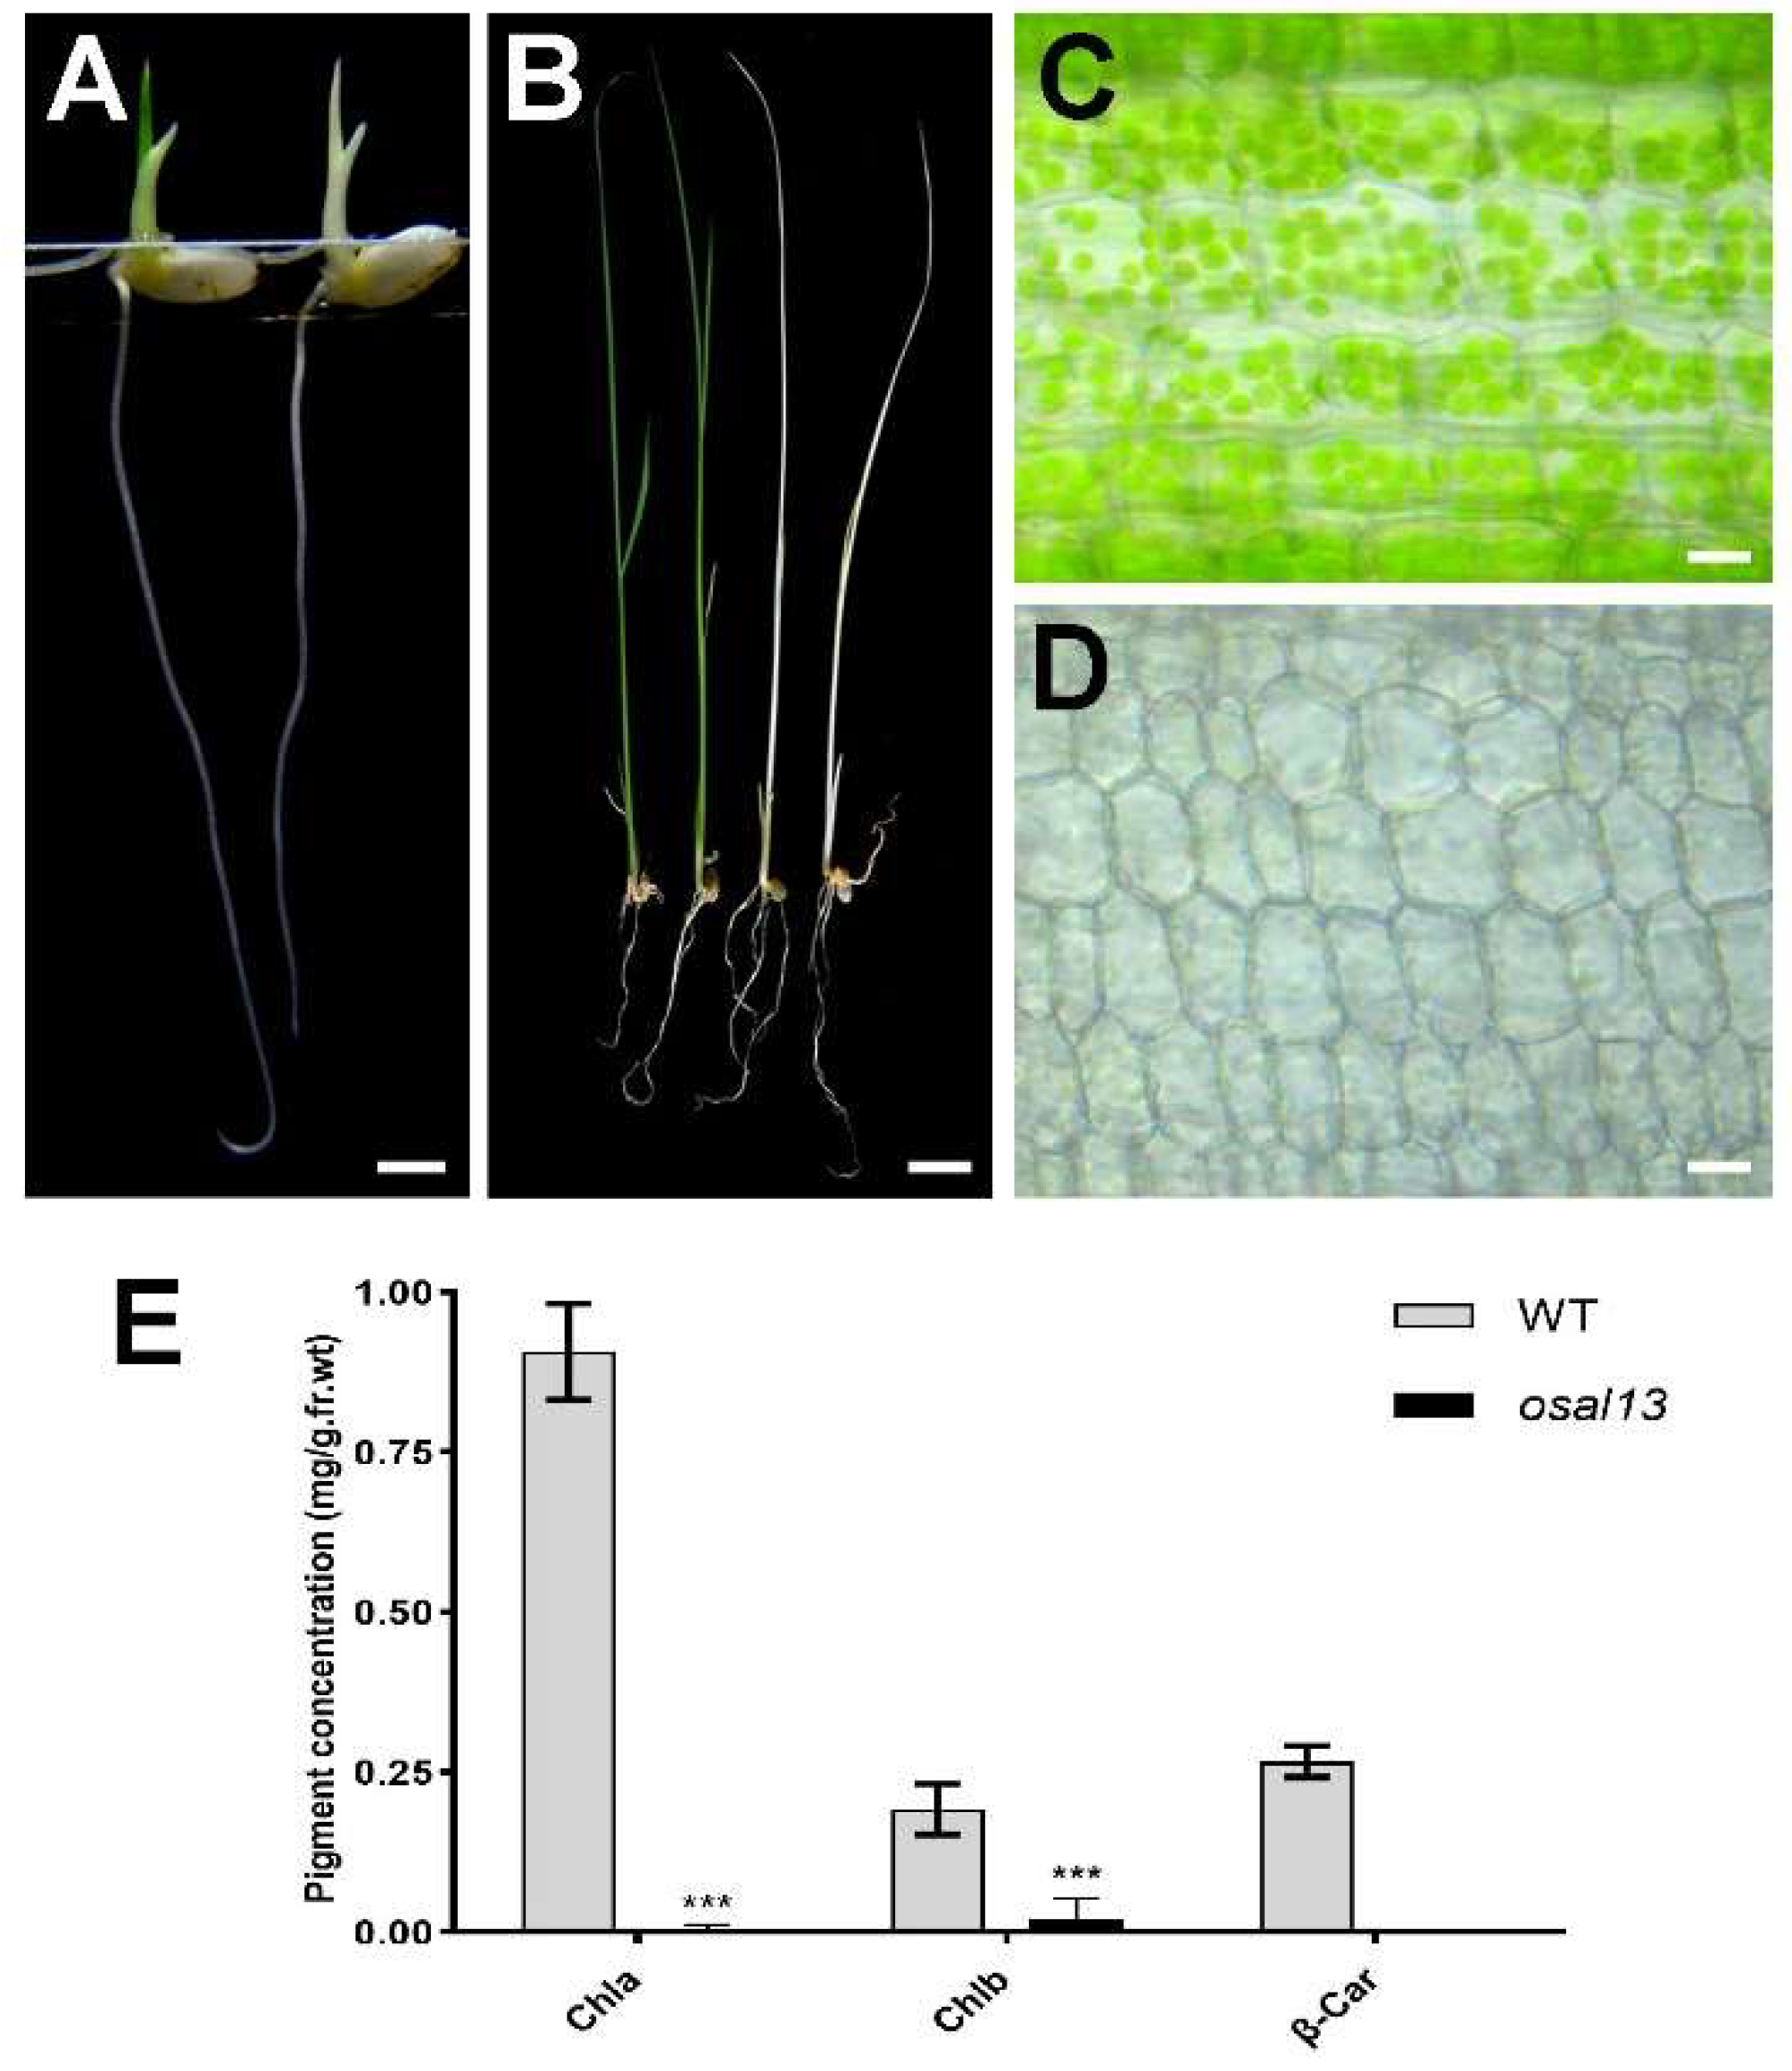
30] also showed albino phenotype and eventually died, and chlorophyll contents were significantly reduced. Similarly, chlorophyll a and chlorophyll b of
osal13 mutants were significantly lower than those of WT. The RNAi tests verified that
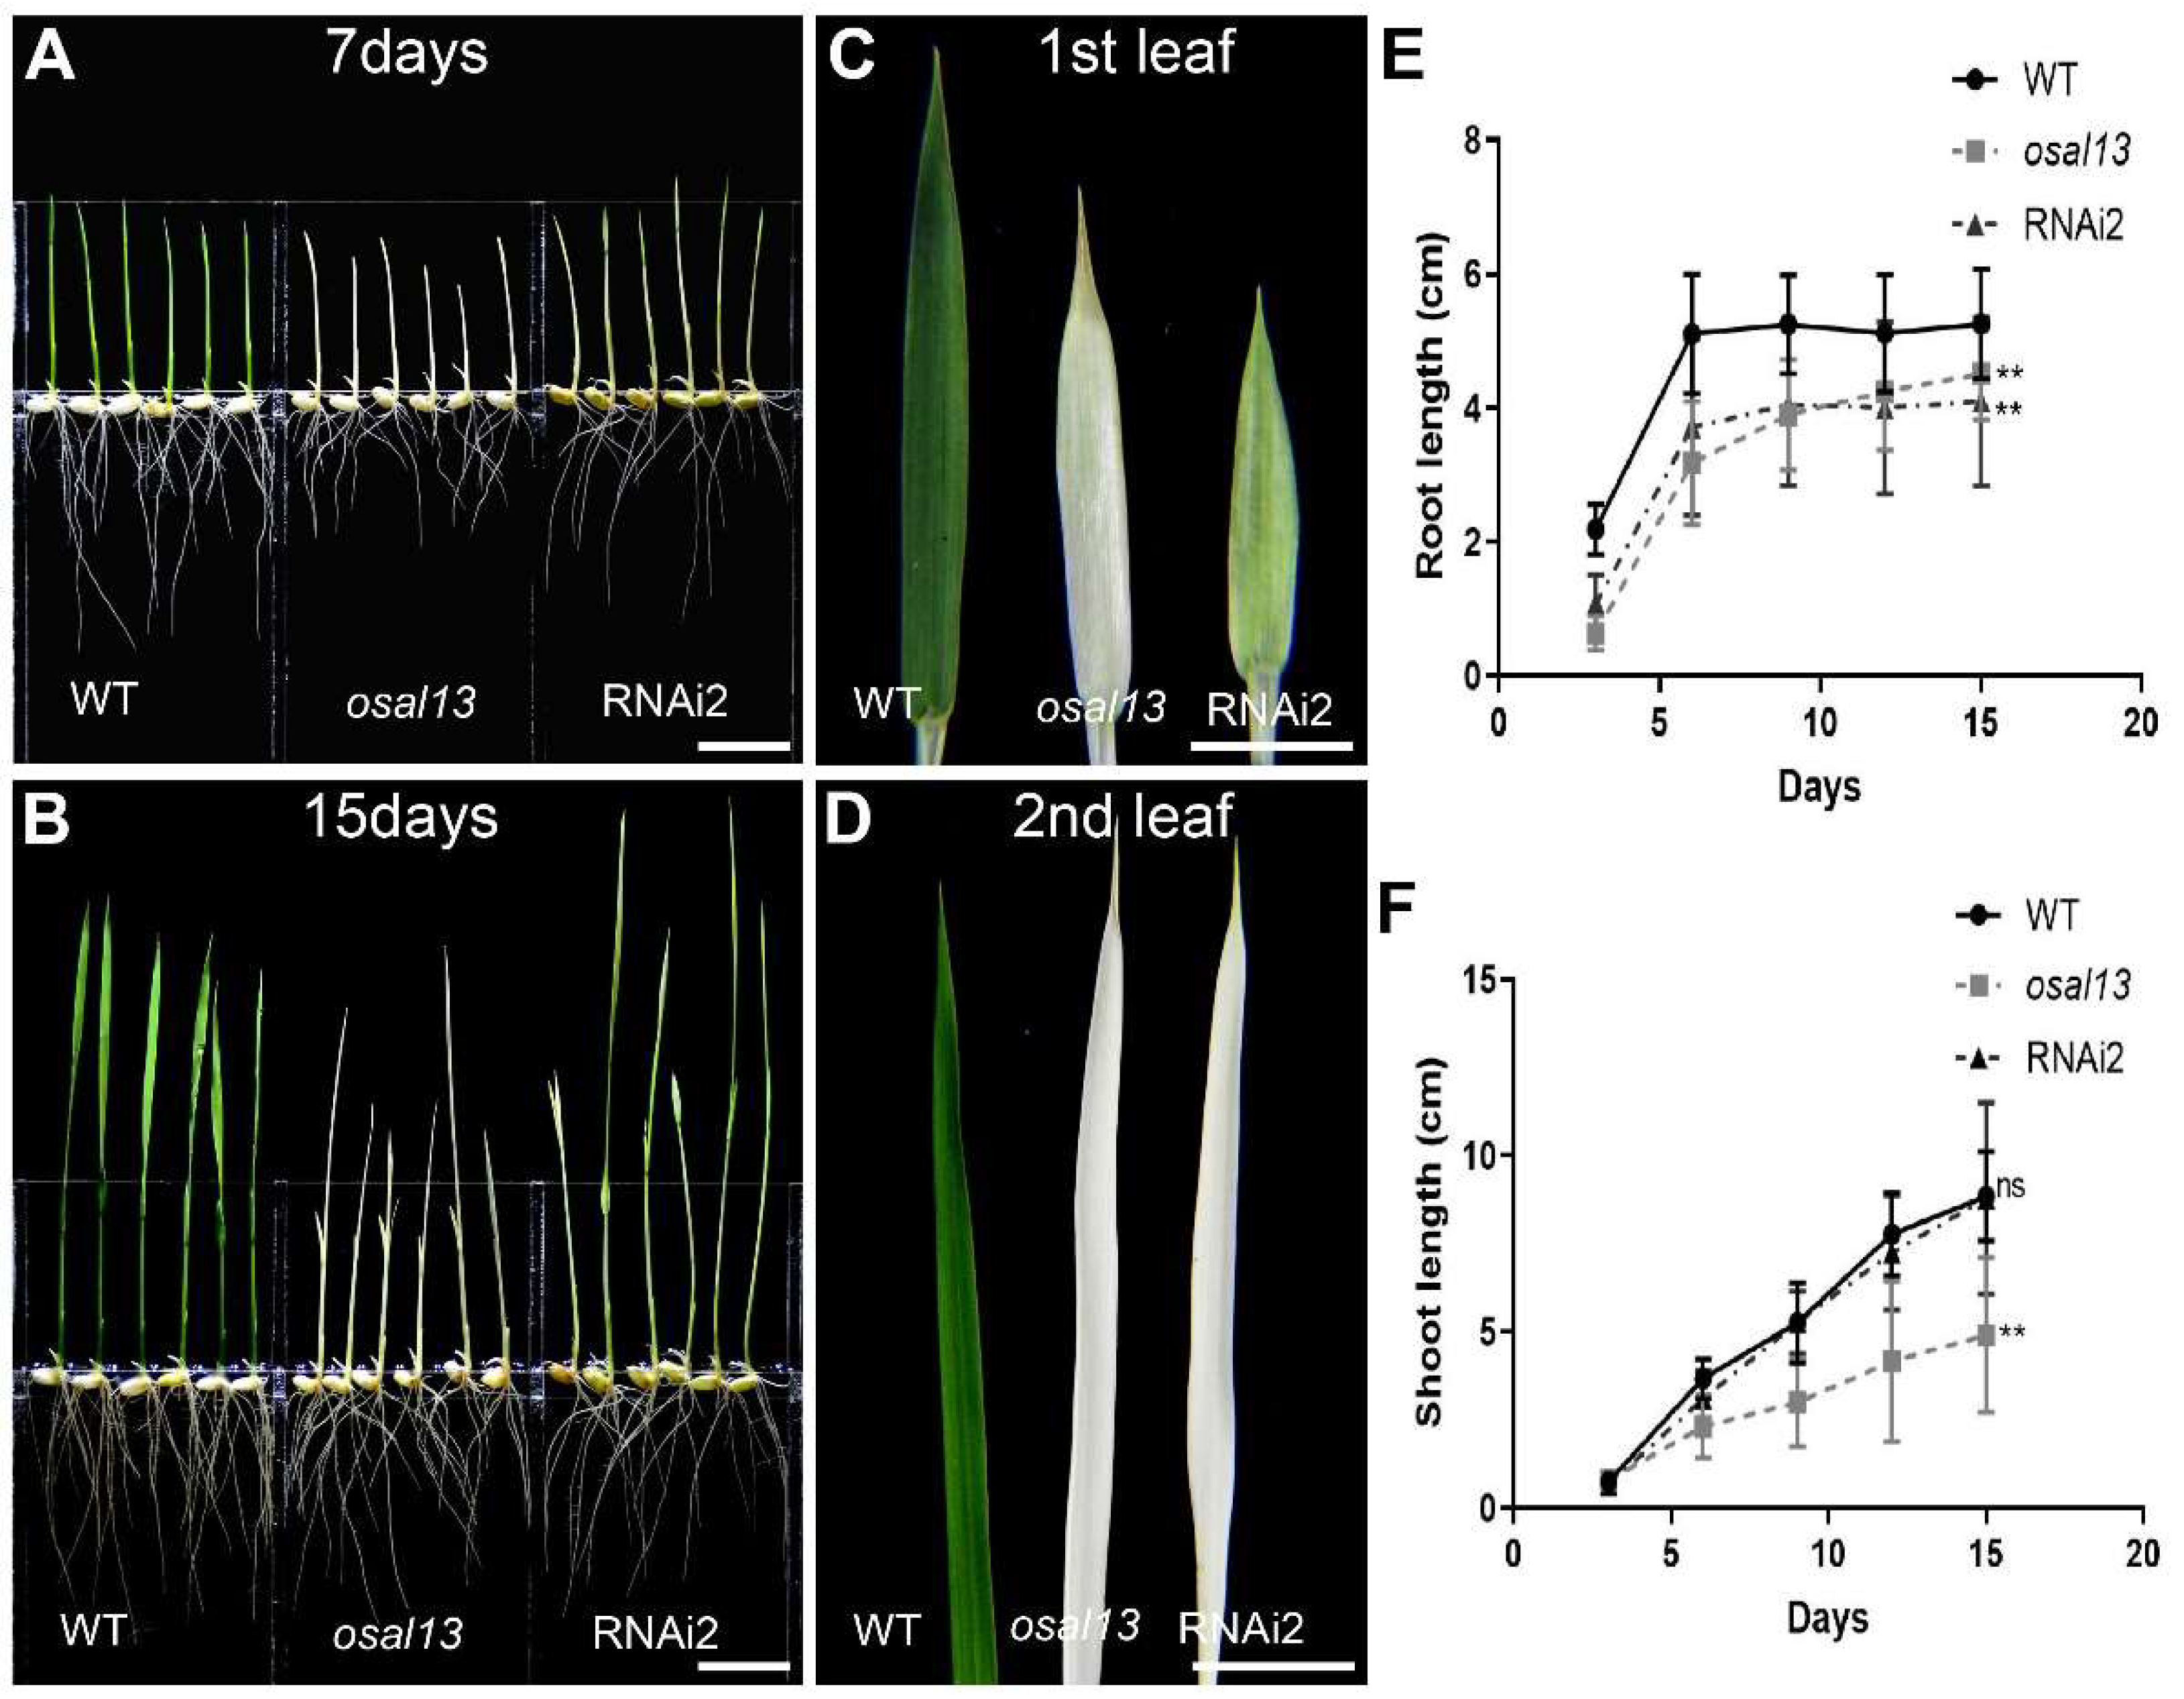
OsAL13 was responsible for the albino phenotype (
Figure 3A, B). Hence
OsAL13 is essential for chloroplast development.
Our results suggest that
OsAL13 was constitutively expressed and had a high level of transcription in leaves, suggesting that
OsAL13 may play an important role in leaf development. Subcellular localization in rice protoplasts showed that OsAL13 protein was located in chloroplasts (
Figure 4A). Further research showed that the pigment concentration of RNAi plants was decreased significantly (
Figure 5B,C) and the chloroplast structure was not complete, especially there was a lack of neatly stowed thylakoid structure (
Figure 5E). The thylakoid is important for the synthesis of photosynthetic pigment and fixation of light energy by photosynthesis. Functional chloroplasts are the main sites of photosynthesis, providing both a relatively independent space environment and key proteins for their successful operation, thus establishing the photosynthetic autotrophic conditions of plants [
31]. Meanwhile the photosynthetic rate of OVE plant was highest, so the total grain number per panicle of OVE plant would be significantly increase. Therefore,
OsAL13 is a necessary gene for chloroplast development.
It is well known that a chloroplast develops from a simple and undeveloped proplastid during light-dependent differentiation [
32]. The chloroplast is a semi-autonomous organelle containing about 100 genes, although more than 3000 proteins function within it [
33]. Thus, nuclear-encoded factors play essential roles in regulating chloroplast development, which requires the coordinated expression of both nucleus and chloroplast-encoded genes. The
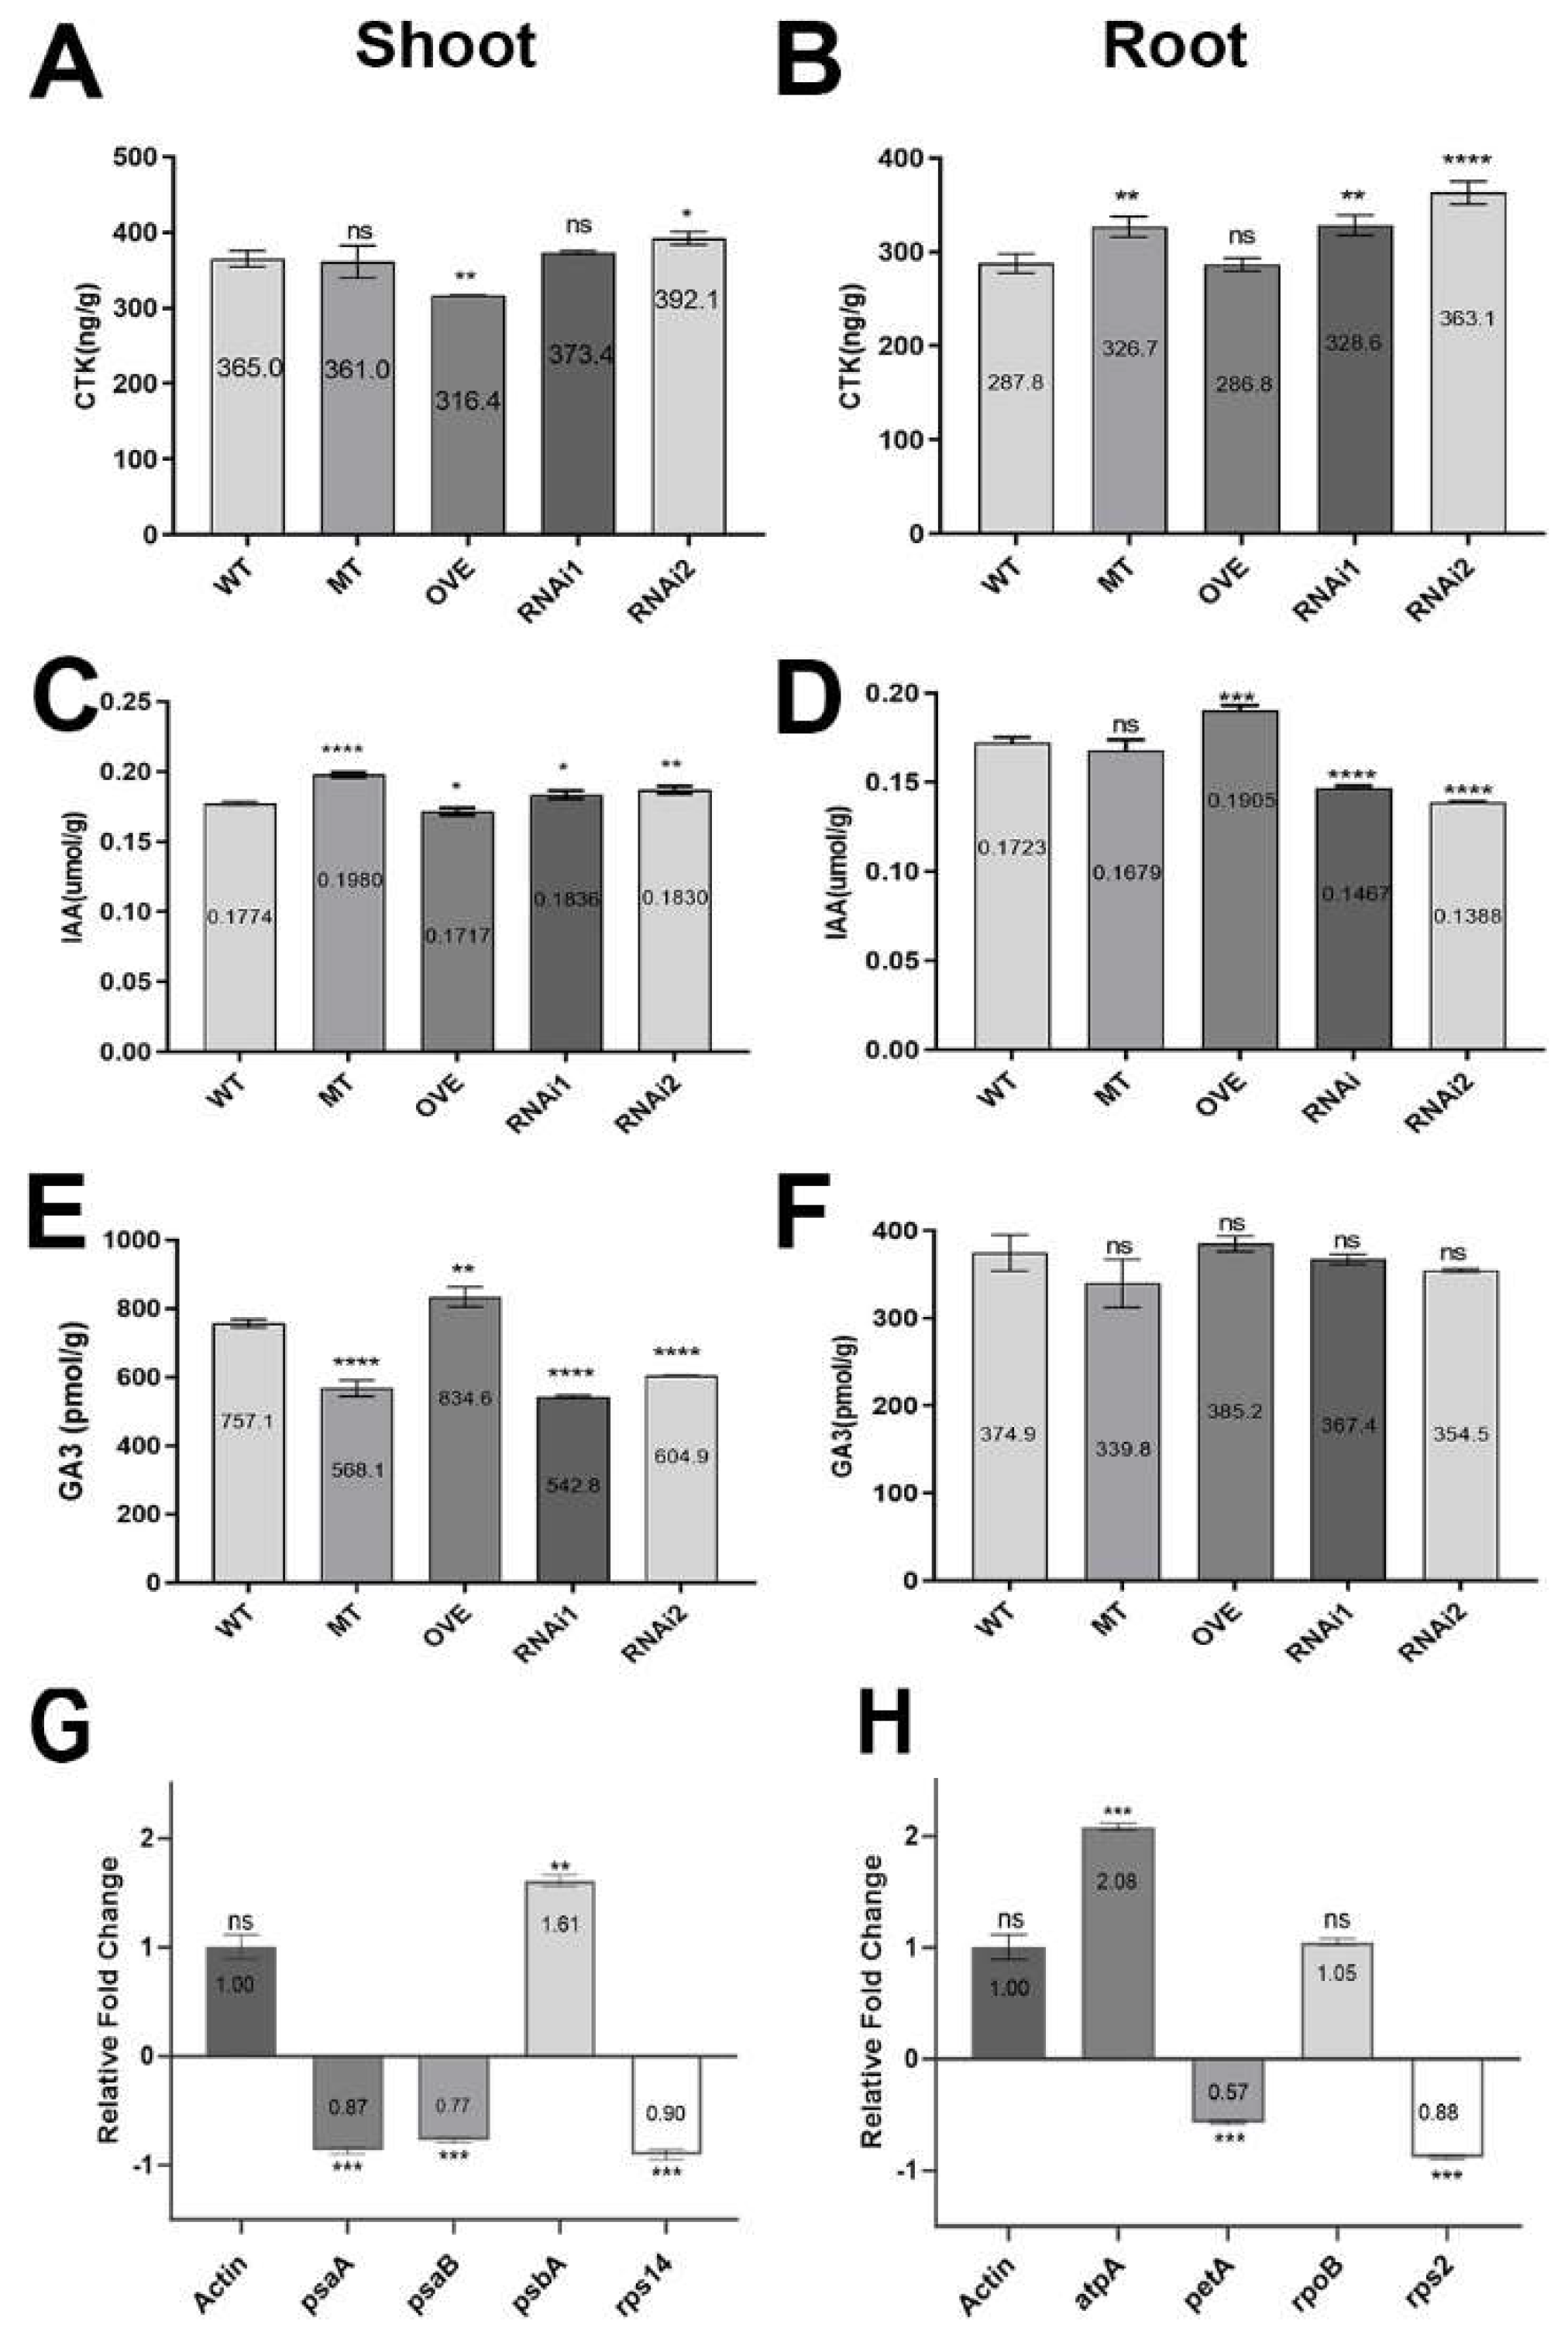
osal13 mutants disrupts the transcripts of plastid and nuclear genes associated with chloroplast development (
Figure 6). The transcript accumulation of both PEP- and NEP-dependent genes (
PetA and
rps2) and PEP-transcribed plastid genes (
psaA and
psaB) was severely suppressed (
Figure 6G and H), suggesting that accumulation of transcripts for PEP components did not result in the formation of functional PEP due to the disruption of transcription/translation apparatus.
Carotenoids are a class of isoprene compounds synthesized in collaboration with chlorophyll and play many important roles in all photosynthetic organisms [
34]. For example, in addition to stabilizing membranes (including thylakoid membranes) and promoting photomorphogenesis, many carotenoid molecules also act as auxiliary pigments, assisting chlorophyll to capture light energy and transfer it to the photosystem, from which excess energy can be transferred, reducing oxidative stress in the photosystem [
35]. Therefore, lack of carotenoid protection during chloroplast development may cause metabolic disorders, such as accumulation of reactive oxygen species and abnormal energy metabolism. In this paper, carotenoids were nearly undetectable in
Osal13, and whether this will lead to plant metabolic disorders, accumulation of reactive oxygen species, and abnormal energy metabolism requires further exploration.
In this study, expression of endogenous hormones showed that, compared with WT, GA3 content significantly rose in shoots of OVE plants, but significantly declined for
osal13 mutants and RNAi shoots. Previous studies indicated that GA3 in Arabidopsis promote chloroplast cell division and cell expansion of chloroplast [
36]. The CTK has a positive effect on chloroplast development. In Arabidopsis, bud removal activates CTK signaling mediated by Arabidopsis respons39e modulator B, induces chlorophyll accumulation and photosynthetic remodeling, and promotes chloroplast formation in isolated root cells [
37]. In rice, GA3 controls cell division by stimulating the expression of some cyclins and CDK genes to activate G1/S and G2/M transitions [
38]. Therefore, we speculate that
OsAL13 may regulate chloroplast proliferation through endogenous plant hormones.
In summary, OsAL13 was essential for chloroplast development. Additionally, OsAL13 had preferentially expressed in leaves blade and was localized in the chloroplast, and involved in rice hormone regulation. Disruption of OsAL13 resulted in altered expression of plastid-encoded polymerases and nuclear-encoded essential genes for chloroplast development. Consequently. the OsAL13 clearly functioned in the molecular mechanism of chloroplast development, and this lays a foundation for further excavation and utilization of chloroplast development genes and albino mutants in hybrid breeding and high light efficiency breeding.
4. Materials and Methods
4.1. Plant materials and growth conditions
The O. sativa japonica cv LiyuB was used as the WT. The T-DNA insertion library with LiyuB background was obtained from the Rice Research Institute of Yunnan Agricultural University. Because the albino mutants die at the four-leaf seedling stage, individual plants were harvested to preserve seeds of the heterozygote. All rice seeds were propagated under natural growing conditions in a tightly controlled greenhouse at the Rice Research Institute of Yunnan Agricultural University (Kunming, China).
4.2. Analysis of the T-DNA insertion locus in osal13 mutant
Genomic DNA of
osal13 albino mutant (MT) was extracted by the CTAB method at 1 week after germination. DNA-walking was performed using DNA Walking Speedup TM Premix Kit (
http://www.seegene.com). The target region was obtained by the first round of PCR amplification with the highly specific renaturation control primers (DW-ACP2) and the target specific primers (Bar_TSP1). The first round of PCR products was used as the template, and the second round of amplification was carried out by the DW-ACPN and the target specific primer (Bar_TSP2) to narrow the target area. Finally, the second round of PCR products was used as the template, and the third round of amplification was carried out by the universal primer (Unip2) and the new target specific primer (Bar_TSP3) to obtain the different fragments. Primers for testing of the T-DNA inserting locus were Unip2 for the left site and Bar_TSP3 for the right. Primers sequences are listed in
Table 1.
4.3. Gene cloning, characterization, and bioinformatic analysis
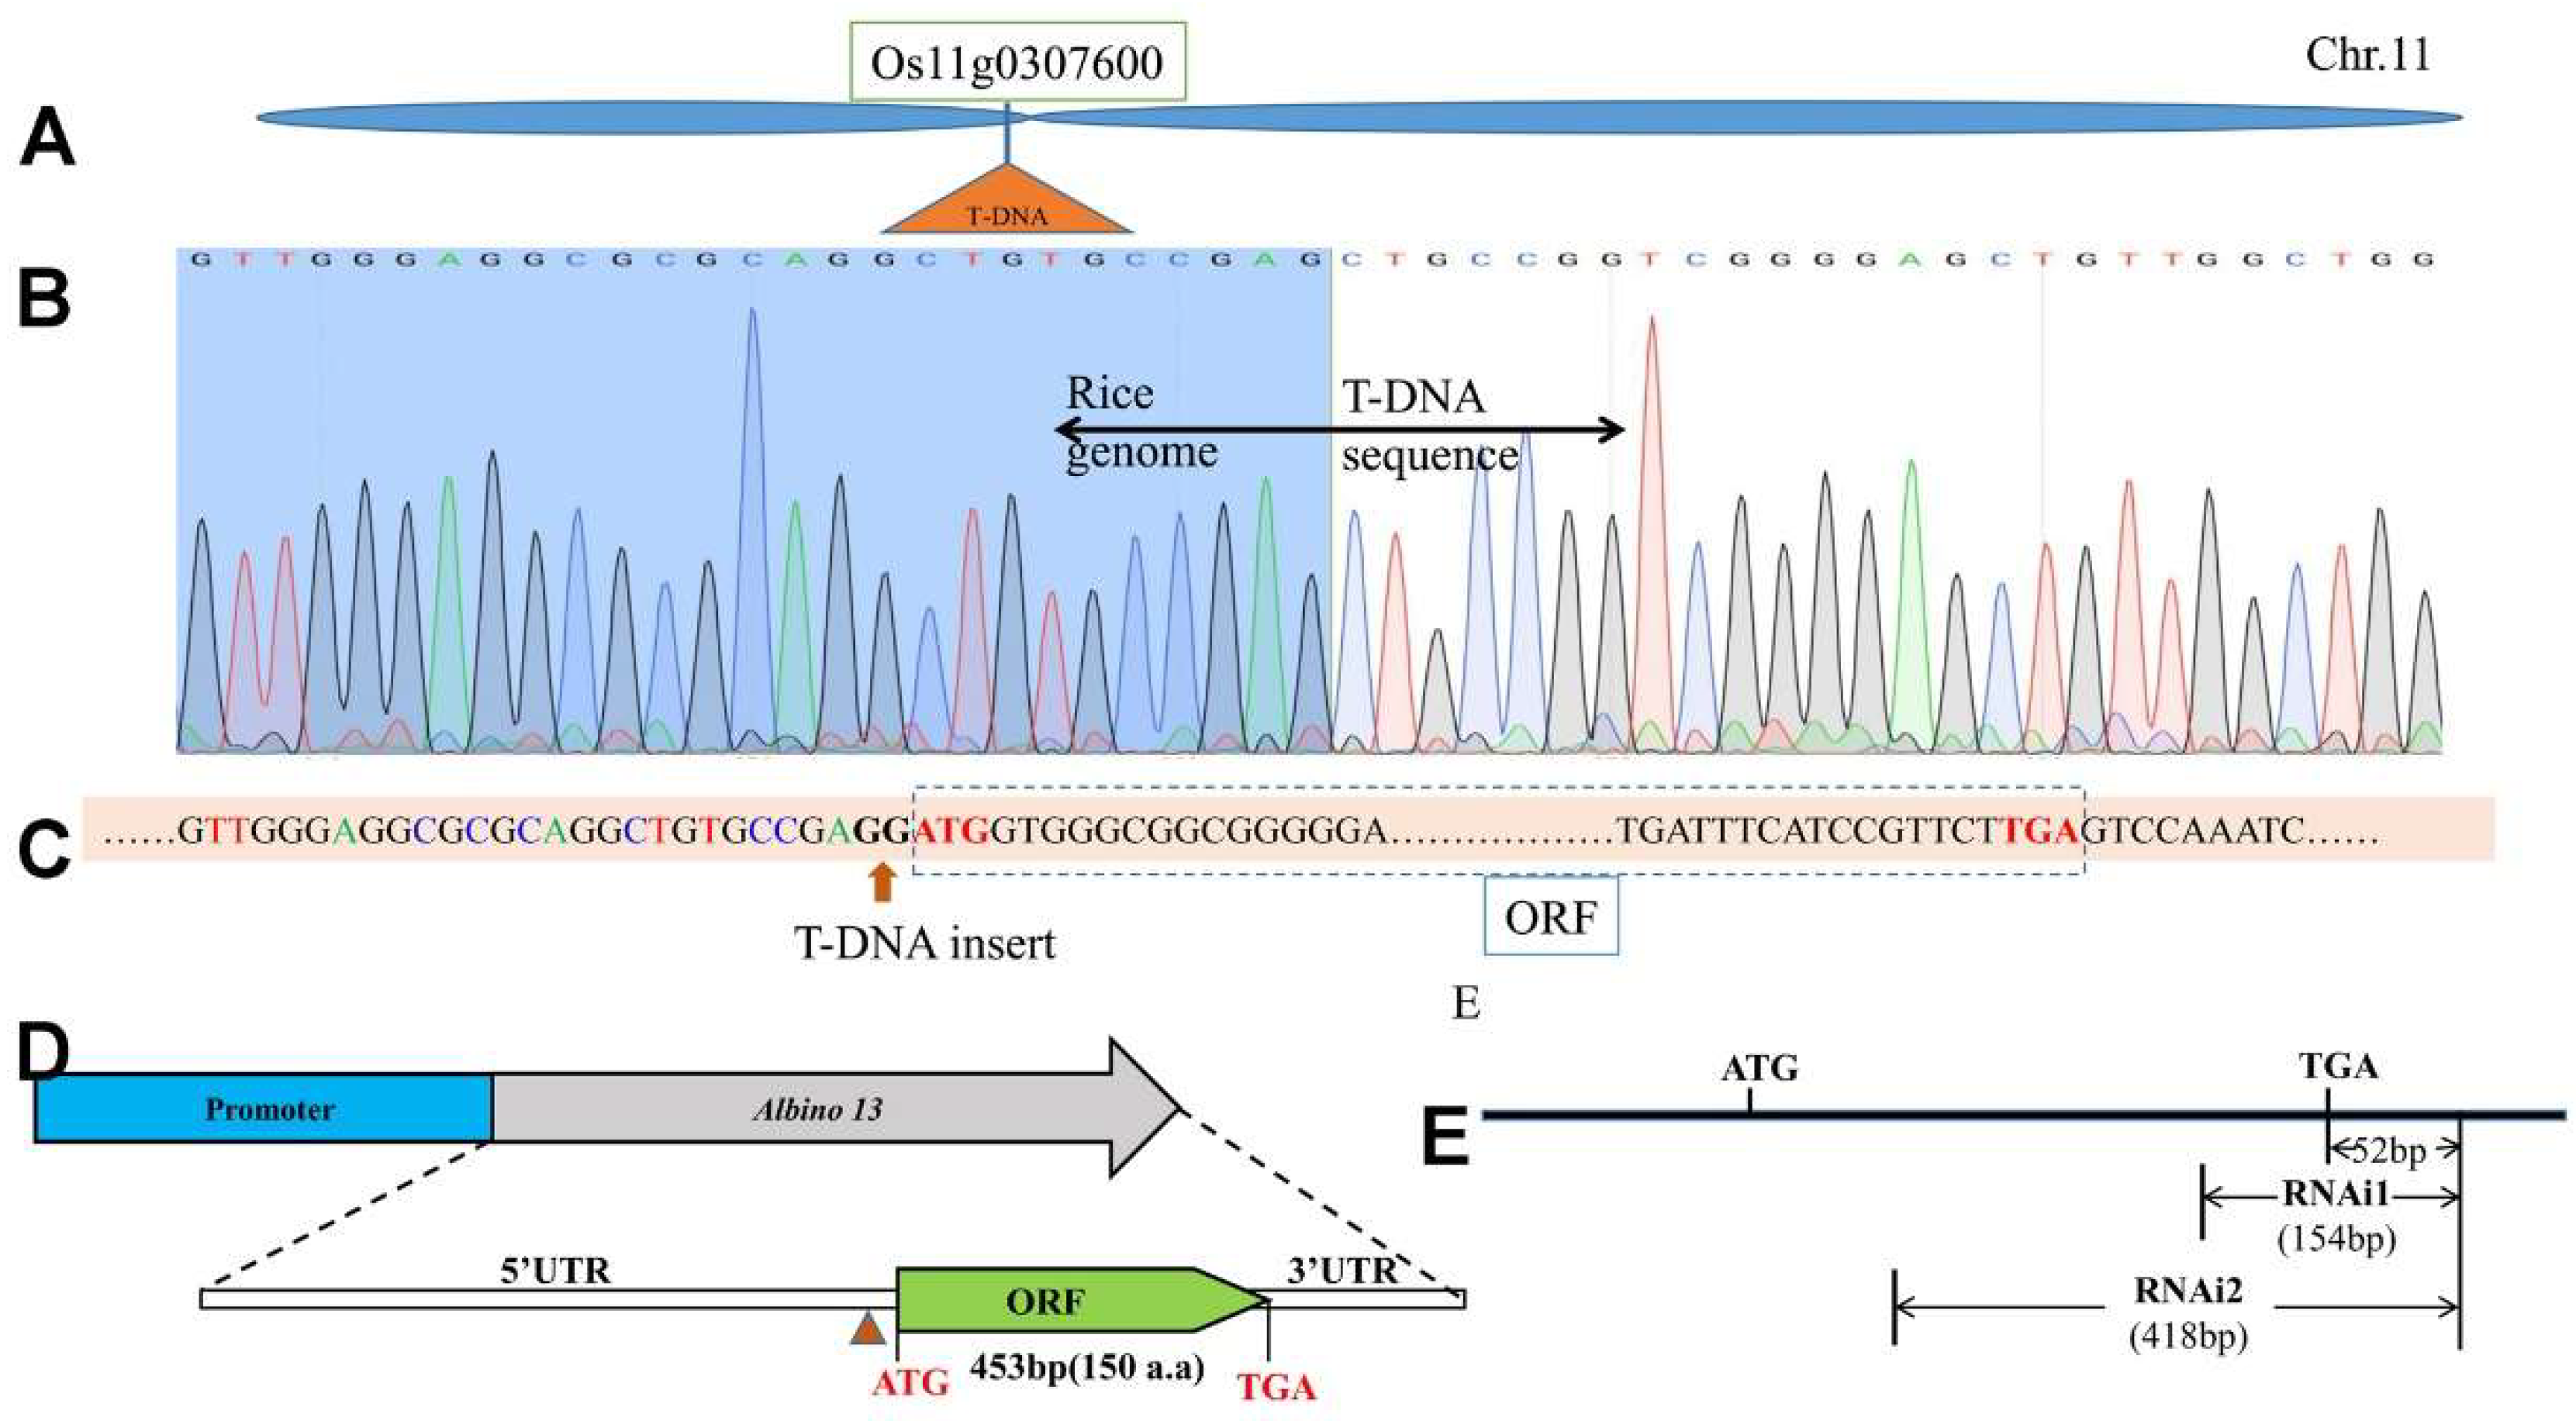
Sequence alignment analysis showed that the T-DNA was inserted into the Os11g0307600 gene. Two different transcripts, Os11t0307600-01 and Os11t0307600-02 encoding 128 and 522 amino acids, respectively, were found at this gene site by RAP-BD database retrieval. Primer5 software was used to design primers OsAL13-1F/-1Ra and OsAL13-1F/-2Rb on both sides of the predicted gene region, and PCR amplification was performed using LiyuB cDNA as the template.
The
OsAL13 gene was annotated according to the full-length cDNA sequence on the National Center for Biotechnology Information (NCBI) database. Sequence similarity was determined using the BLAST program (
http://www.ncbi.nlm.nih. Gov/
4.4. Vector construction and transformation
The corresponding primers (
Table 1) were amplified with the genomic DNA of LiyuB as the template to obtain the 2.3-kb DNA fragment of the promoter region of
OsAL13, which was confirmed by DNA sequencing and then ligated into the binary vector HPE193-2. In order to obtain the over-expressing (OVE) plants, the corresponding primers were used to amplify a 610-bp DNA fragment including the full open reading frame (ORF) of
OsAL13 with LiyuB cDNA as the template, which was confirmed by DNA sequencing and then ligated into the binary vector HPE192-1. To construct the
OsAL13 RNAi vector (
p35S×2::OsAL13-RNAi), a 117-bp intron fragment was used as a linker between a 154-bp gene specific fragment (a 418-bp gene specific fragment was generated synchronously) in the antisense and sense orientations. These recombined fragments were inserted into the HPE203-1 binary vector containing a double 35S promoter.
The final constructs were transferred into Agrobacterium tumefaciens strain EHA105 using the freeze-thaw method for rice genetic transformation. The rice transformations were conducted as described by Toki et al.,[
39]. Eight OVE plants (
p35S::OsAL13:EGFP), 12 GUS stained plants (
pAL13::GUS), 11 RNAi1 plants (
p35S×2::OsAL13:RNAi1), and 11 RNAi2 plants (
p35S×2::OsAL13:RNAi2) were obtained in the T
0 generation.
4.5. Histological GUS assay
The GUS activity analysis was performed following a standard protocol (Jefferson et al., 1987). Tissues of rice at different periods were taken, cut into appropriate sizes, and immediately immersed in 90% acetone at -20°C for 15-20 min. Acetone was removed and the sample rinsed with rinse solution: 0.1 M K3Fe (CN)6, 0.1 M K4Fe (CN)6, and 0.5 M NAPO4 at pH 7.2. The rinse solution was removed and X-GluC staining solution (10% Triton X-100, 20 mM X-GluC, 0.1 M K3Fe (CN)6, 0.1 M K4Fe (CN)6, and 0.5 M NAPO4 at pH 7.2) was added in a test tube to ensure that the sample was completely immersed in the dye solution. At room temperature, the sample was vacuumed for 10-20 min to sink below the liquid level. The samples were treated overnight at 37℃. The samples were rinsed with 70% ethanol to remove the chlorophyll in leaves. The cleaned samples were observed under an anatomical lens and stained samples were photographed using a Nikon digital camera and further sliced using frozen sections (Leica CM1950, Leica Biosystems Nussloch GmbH, Nussloch, Germany) and analyzed under a dissecting microscope.
4.6. Total RNA extraction and qRT-PCR Analysis of Gene Expression
To explore the
OsAL13 expression pattern and level, total RNA was extracted from plant tissues at different developmental stages using a RNeasy Plant Mini Kit 50T (Cat. No. 74904; Qiagen; Germany) according to the manufacturer’s instructions. The concentration of RNA samples was estimated using a spectrophotometer (NanoDrop 1000; Thermo Scientific Inc., Massachusetts, USA), and the quality of the RNA samples was examined using a 1.2% denatured agarose gel (Cat. No.111860; XHLY Co. Ltd., Beijing, China). The first strand of cDNA was synthesized using FastKing RT Kit (Cat. No. FP205-02; Tiangen Co.Ltd., Beijing, China) according to the manufacturer’s protocol for qRT-PCR. All primers were designed using Primer 5 software (
Table 1). The
β-actin gene was used as an internal control. qRT-PCR was performed using a CFX96 Real Time System (Bio-Rad, Hercules Co. Ltd., New York, USA) and Super Real Premix Plus (SYBR Green) (Cat. No. FP205-01; Tiangen Co., Ltd., Beijing, China) according to the instructions. The relative quantification values were calculated using the 2
−∆∆Ct method [
40], and three independent biological replicates were analyzed.
4.7. Confocal Microscopy
To identify the subcellular localization of
OsAL13, the ORF of the target gene and the 610-bp fragment in the 5′UTR region of the target gene were successfully transferred into the EGFP vector HPE192-1 (preserved in our laboratory), and the corresponding transgenic plants were obtained by Agrobacterium-mediated genetic transformation method into the embryogenic callus of rice LiyuB. The protoplasts of the transgenic
p35S::OsAL13: EGFP and
p35S: EGFP were extracted as described by Poddar in previous studies[
41].
4.8. Endogenous hormone assay
In order to clarify whether
OsAL13 gene is involved in endogenous hormone regulation for plant. So we measured the auxin (IAA), gibberellin (GA3), and cytokinin (CTK) contents of the WT,
osal13 mutants (MT), OVE, RNAi1, and RNAi2 plants at 10 days after germination (DAG). Endogenous contents of IAA, GA3, and CTK were determined as described in previous studies [
42].
4.9. Chlorophyll detection
During the seedling stage, fresh leaves were collected and sliced into small pieces. Of these, about 0.05 g was placed in a 15-mL tube, and 10 mL of 80% acetone was added. These were mixed in darkness for about 48 h (chlorophyll degrades under light). The extract was transferred to a 25-mL volumetric flask, diluted with 80% acetone to volume, and thoroughly mixed. Then, chlorophyll content was determined using absorbance (A: 663, 646, and 470 nm). The chlorophyll concentrations were calculated as follows (use 80% acetone as a blank control):
where V is volume of extract (mL) and W is weight of fresh leaves (g).
4.10. Phenotype characterization
To explore the effect of target genes on the biological characteristics of rice, we measured the plant height, effective tiller, panicle length, seed setting rate, and primary and secondary branches of the WT and RNAi plants. Among them, plant height and effective tillers of each line were determined on eight plants, with plant height measured from the soil surface to the highest panicle top.
4.11. Statistical Analysis
The original data were compiled using MS Excel 2019. All primers were designed using Primer Premier 5 software. All data were analyzed using GraphPad Prism 8.0 for one-way ANOVA and Dunnett’s multiple comparison test (*p < 0.05, **p < 0.01, ***p < 0.001).
Figure 1.
Mutations in the OsAL13 gene affect the growth of rice and chloroplast development. (A-B): Phenotype analysis of the wild type (WT) and osal13 mutants at 4 DAG and 20 DAG. Bars = 1 cm. (C-D): The sheath of wild type (WT) and osal13 mutants visualized using bright-field microscopy. Scale is 25 μm. (E): Determination of pigment content in leaves of wild-type (WT) and osal13 mutants. Leaf samples were collected from 20-day-old WT and osal13 mutants grown in a tank containing nutrient solution. Chla, chlorophyll a; Chlb, chlorophyll b; and β-Car, β-carotenoid. Error bars are the standard deviation (SD) for three biological duplicates. Significant differences are indicated by asterisks ***p < 0.001.
Figure 2.
Positional cloning of the OsAL13 gene. T-DNA was inserted into Os11g0307600 at the short arm of chromosome 11 in rice. (A): The OsAL13 locus was narrowed to a 21-kb region on Os11g0307600. (B): The sequence peak chart of T-DNA insertion, the vertical division line indicates the point of T-DNA insertion. (C): T-DNA inserts before the base G of promoter ATG. (D): Structure of OsAL13, with ATG and TGA representing the start and stop codons, respectively. Blue boxes indicate the promoter and green boxes indicate the open reading frame (ORF). (E): Two different fragments for RNAi construction are shown as sketch maps.
Figure 3.
The different phenotypes of the wild-type, osal13 mutants and RNAi2. At 7 DAG (A) and 15 DAG (B). Bars = 1 cm. The comparison of the first (C) and second leaf (D) of the wild-type, osal13 mutants, and RNAi2. Bars = 1 cm. Seedling growth determination as root length (E) and shoot length (F), with data points representing the mean ± SD.
Figure 4.
Subcellular location and expression pattern of OsAL13. (A): Analysis of the subcellular localization of the OsAL13 protein in rice protoplasts. Green fluorescence shows GFP. Chloroplast autofluorescence is shown in red. Scale bars are 50 µm. (B): qRT-PCR analysis of OsAL13 in comparison with the rice β-actin gene. OsAL13 expression was detected in the panicle (PA), stem (ST), leaf blade (LB), leaf sheath (LS) and root (RT) of the rice plant in seedling stage (SS), tiller stage (TS), panicle initiation stage (PIS), meiotic division phase of the rice panicle (flower) development (MS), before the flowering stage (BFS), flowering stage (FS), 5 days after pollination (5 D), and 15 days after pollination (15 D) of the rice plant. (C): GUS staining of seeds at 2 DAG. (D): GUS staining of seeds at 5 DAG. Histochemical staining showing OsAL13 expression in the cell division zone (DZ), endosperm (EN), shoot (SH), root hair zone (HZ), and coleoptile (COL). (E): GUS staining of stem tip at the tillering stage; SAM, shoot apical meristem. (F): GUS staining of the leaf at meiotic phase of flag leaf. (G-H): GUS staining of the cross-sections from 5 DAG in the leaf primordia, as well as root tip (I) and (J). Abbreviations: VC, vascular cylinder; EPI, epidermis; EXO, exodermis; SCL, sclerenchyma; COR, cortex; END, endodermis; and PER, pericycle.
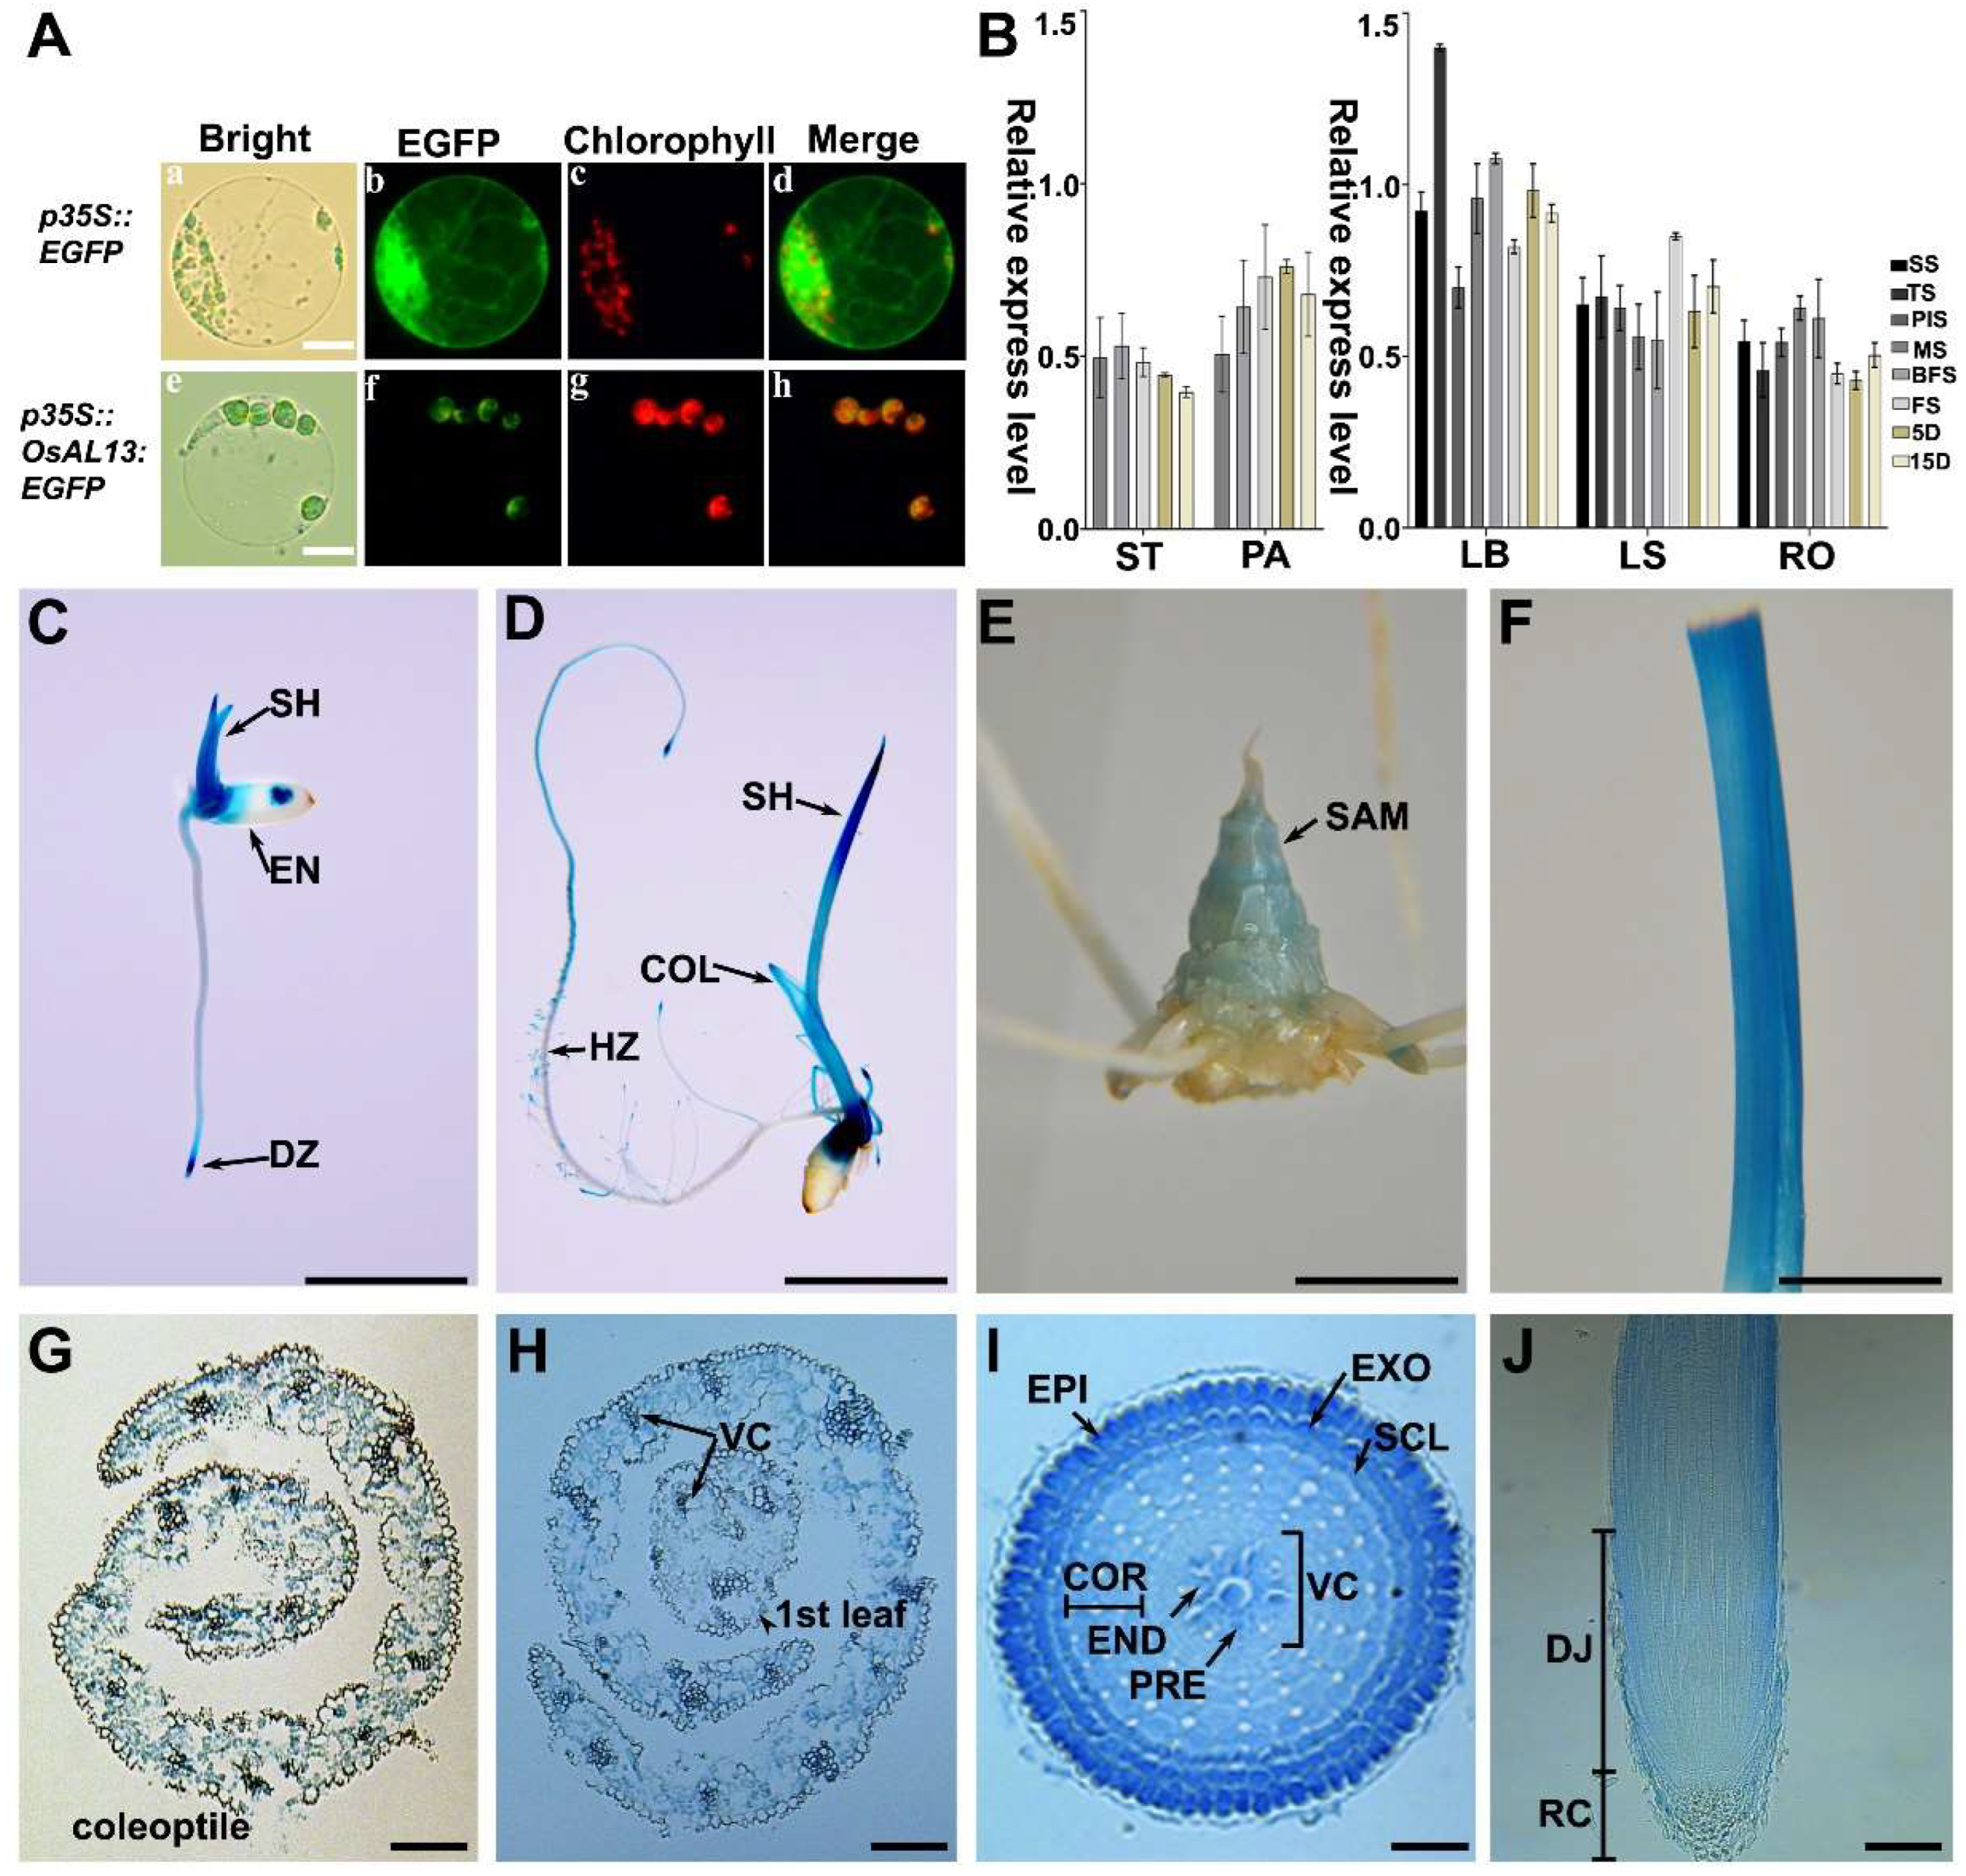
Figure 5.
Comparison of the morphology and internal structure of WT, OVE, and RNAi lines. (A): Expression analysis of OsAL13 in seedings at 7 DAG of the WT, OsAL13 overexpressing (OVE), RNAi1, and RNAi2 lines by qRT-PCR. (B): Photosynthetic rate of WT, OVE, RNAi1, and RNAi2. (C): Determination of pigment contents in leaves of WT, RNAi1, and RNAi2. Leaf samples were collected from 20-day-old WT, RNAi1, and RNAi2 plants grown in a tank containing nutrient solution. Chla, chlorophyll a; Chlb, chlorophyll b; Car, carotenoid. Transmission electron microscopy observations of the third-leaf sections of WT and RNAi2. The ultrastructure of chloroplasts of WT is typical. The chloroplast structure is complete, the matrix is dense, and the grana lamellae are arranged along the long axis of the chloroplast. (D): The thylakoid structure of WT is clear, whereas the shape of chloroplast of the RNAi2 became irregular and the whole chloroplast shows a vesicle structure. Scale bars are 10 µm. (E): Pollen viability assay by I2-KI in WT and RNAi2 lines. Scale bars are 200 µm. Analysis of total grain number per panicle (G) and seed setting rate(H) of WT, OVE, and RNAi lines. Significant differences are indicated by asterisks ***p < 0.001.
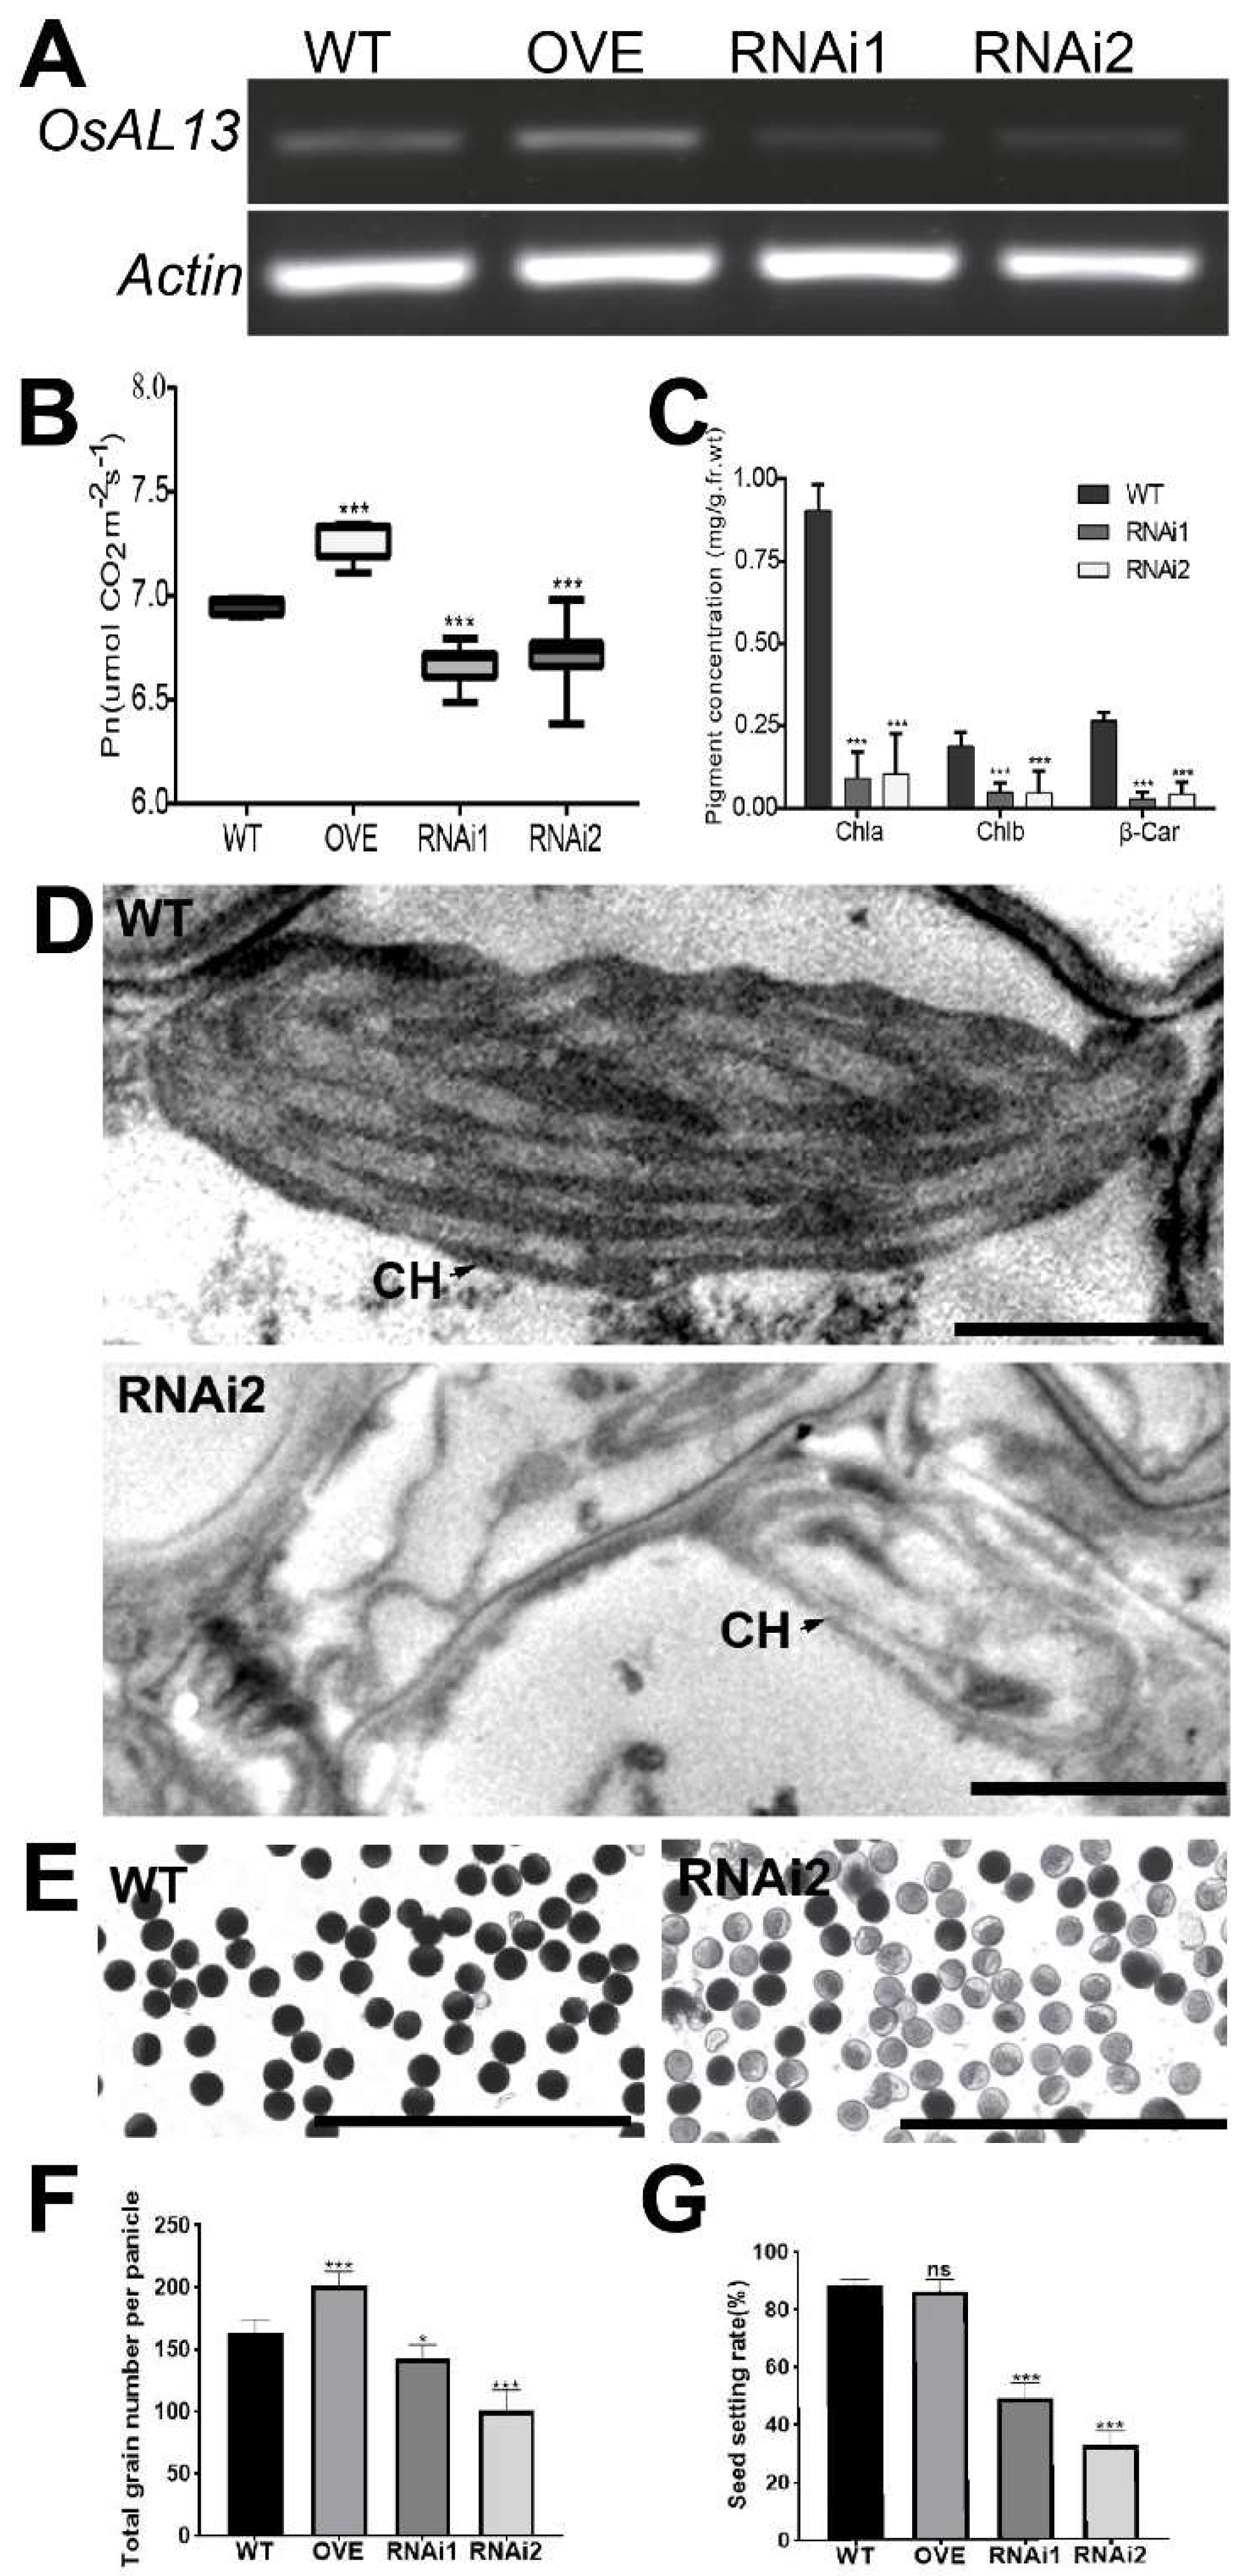
Figure 6.
OsAL13 control of hormone distribution and expression of chloroplast-associated genes. Hormone content comparison among WT, osal13 mutants, OVE, and OsAL13-RNAi plants at seedling stage. Contents of CTK, IAA, and GA3 in shoot (A, C, E) and root (B, D, F). Values are mean ± SD. Asterisks indicate significant differences: *p < 0.05, **p < 0.01, and ***p < 0.001. The relative fold change of the chloroplast-associated genes including plastid-encoded polymerases (G) and nucleus-encoded polymerases (H) by qRT-PCR.
Table 2.
Analysis of yield-related characters (per plant) among wild-type and OsAL13-RNAi plants.
Table 2.
Analysis of yield-related characters (per plant) among wild-type and OsAL13-RNAi plants.
| Traits |
Wild-type |
AL13-RNAi1 |
AL13-RNAi2 |
| Plant height (cm) |
87.40 ± 3.10 |
80.20 ± 1.70* |
68.50 ± 3.50*** |
| Tillering numbers |
4.40 ± 1.10 |
4.60 ± 1.50 |
5.80 ± 1.80 |
| Panicle length (cm) |
20.10 ± 1.60 |
16.10 ± 1.60*** |
18.80 ± 2.00 |
| No. of primary branches |
10.00 ± 2.30 |
8.90 ± 2.30 |
9.90 ± 1.50 |
| No. of secondary branches |
21.20 ± 6.50 |
13.10 ± 7.00 |
20.40 ± 5.70 |
| Grain length (mm) |
7.03 ± 0.25 |
7.09 ± 0.09 |
7.00 ± 0.07 |
| Grain width (mm) |
3.16 ± 0.15 |
2.97 ± 0.13*** |
2.96 ± 0.11*** |
| Grain thickness (mm) |
2.25 ± 0.07 |
2.11 ± 0.07*** |
2.07 ± 0.07*** |
Table 1.
List of primer sequences used in in this study.
Table 1.
List of primer sequences used in in this study.
| Primer name |
Primer Sequence (5′-3′) |
Tm |
Primer function |
| Bar_TSP1 |
ATGCACGAGGCGCTCGGATA |
|
Test al13 flanking of T-DNA |
| Bar_TSP2 |
TCAAGCACGGGAACTGGCAT |
|
| DW3ACP1 |
GAGGAGTGGCAGTGGGAACGGG |
60℃ |
| DW3ACP2 |
GAGGAGTGGCAGTGGGCTCGA |
60℃ |
| DW3ACP3 |
GAGGAGTGGCAGTGGGCTACG |
60℃ |
| DW3ACP4 |
GAGGAGTGGCAGTGGGAACGG |
60℃ |
| T-DNA right border |
TGTTTACACCACAATATATCCTGCCA |
|
| T-DNA left border |
TGGCAGGATATATTGTGGTGTAAACA |
| UniP2 |
GAGTTTAGGTCCAGCGTCCGT |
|
| Bar_TSP3 |
TGCCCGTCACCGAGATCTGA |
| OsAL13p-F |
GAATTCGGATTCGTCCGTTGCCATGA |
61℃ |
Promoter cloning |
| OsAL13p-R |
CTGCAGGAGGCCAAGGTGGAGTTGG |
| OsAL13-1Fa |
CTGCAGGACGGCCAAGGCGTGCAG |
64℃ |
OsAL13 full length ORF amplification |
| OsAL13-1Ra |
ACGCGTAGGGCGGATACCAAGTTCAACACGA |
| OsAL13Ri-1F |
CATCCCCCGAAATCAGGTTGG |
57℃ |
RNAi1 short fragment amplification |
| OsAL13Ri-1R |
GGGCGGATACCAAGTTCAACAC |
| OsAL13Ri-2F |
ATCCGGCGTCTTAGTTCTAGCC |
58℃ |
RNAi2 short fragment amplification |
| OsAL13Ri-2R |
GTGTTGAGGGAGCCAGGAAATC |
| OsAL13RT-F |
CTCATGGTTTGTCGCCTTCGTC |
58℃ |
qRT-PCR |
| OsAL13RT-R |
GGCGGATACCAAGTTCAACACG |
| HmMAS-F |
AGACCTGCCTGAAACCGAACTG |
60℃ |
Transgenic plant screening |
| HmMAS-R |
TGTTGGCGACCTCGTATTGGGA |
| β-Actin-F |
CCGAGCGGGAAATTGTGAGGGA |
62℃ |
qRT-PCR housekeeping gene |
| β-Actin-R |
TTTCAGGAGGGGCGACCACCTT |
| psaA-F |
TTAGAAATCCGCCAATCCA |
53℃ |
qRT-PCR Plastid-encoded polymerases (PEPs) |
| psaA-R |
TGCTAGGCTCTACAACCATT |
| psaB-F |
GAGCAATATCGGTCAGCCACA |
56℃ |
| psaB-R |
ACCACTCAAGGAGCGGGAAC |
| psbA-F |
ACCCTCATTAGCAGATTCGT |
57℃ |
| psbA-R |
GATTGTATTCCAGGCAGAGC |
| rps14-F |
TCACTCAAACTCAAAGGGTA |
53℃ |
| rps14-R |
AAGCGGCAGAAATTAGAAC |
| atpA-F |
TATCGGTCAAAGAGCATC |
58℃ |
qRT-PCR Nucleus-encoded polymerases (NEPs) |
| atpA-R |
CGTATAAGGAGCGAGGTA |
| petA-F |
TGCCATTTAGCGAATAAGCC |
57℃ |
| petA-R |
CCACATTCAACCCTCCCTTT |
| rpoB-F |
TGGTACATATCCCTTATCTCAA |
53℃ |
| rpoB-R |
CTCCAGGACCCAAACAACTC |
| rps2-F |
GAGATGATAGAAGCGGGAGTT |
55℃ |
| rps2-R |
TAACATAATGACAACGAGCC |
