
Submitted:
19 January 2024
Posted:
19 January 2024
You are already at the latest version
Abstract
In an agricultural system, finding suitable watering, pesticide, and soil content to provide the right nutrients for the right plant is a mystery so far. Plants cannot speak and cannot ask which food they require. These problems can be addressed by applying intelligent (fuzzy logic) controllers to IoT devices in order to enhance communication between crops, ground mobile robots, aerial robots, and the entire farm system. The application of fuzzy logic in agriculture is a promising technology that can be used to optimize crop yields and reduce water usage. It was developed based on language and the air properties in the agricultural fields were formulated. The entire system was simulated in the MATLAB/SIMULINK environment with Cisco Packet Tracer integration. The inputs for the system were soil moisture sensors, temperature sensors, humidity sensors, and outputs were pump flow, valve opening, water level, and moisture in sounding. The obtained results were the output of opening valve, moisture in sound, pump flow rate, outflows, water level, and ADH values, which are 10.00000013 rad/sec, 34.72%, 4.494%, 0.025 m^3/sec, 73.31 cm^3, and 750 values respectively. The outflow rate increase indicates that the water is released from the tanks, and the control signal fluctuates, indicating that the valve is opening.
Keywords:
multi robot system
; IOT device
; smart agriculture system
; intelligent controller
1. Introduction
Farmers need to adapt to the shifting demands of the environment as well as those of regulators, consumers, food processors, and retailers. The effects of soil erosion, biodiversity loss, and climate change are all becoming more and more of a burden, as are consumer preferences for food and worries about its production. Furthermore, the natural world that farming interacts with plants, pests, and diseases continues to provide difficulties. Even if there are many solutions available in modern agriculture, the results vary because every farm is different in terms of the amount of water needed, the kind of soil, the temperature, and the humidity [1]. For these reasons, farmers are looking for technology that can solve the issues facing agriculture today. For farmers, a highly promising solution is to integrate internet-of-things devices with intelligent controller algorithms in agricultural systems. The Internet of Things (IoT) has revolutionized the agricultural sector by providing farmers with real-time data on crop health, soil moisture, and nutrient levels. This data can be used to optimize crop yield, reduce water usage, and minimize the use of pesticides and fertilizers. IoT sensors can be used to monitor the health and well-being of livestock, optimize feeding schedules, detect illness, and improve breeding programs. Automated irrigation systems can be used to monitor soil moisture levels and weather patterns to optimize irrigation schedules, which can help reduce water usage and improve crop yield [2].
Many researchers have spent their time on the application of IoT devices in agriculture without considering the application of different controller in agriculture to date. Furthermore, to sustain the health of the farm and maintain mass productivity, it is necessary to implement intelligent controller algorithm such as fuzzy logic, adaptive, model predictive and so on controller into an agriculture system in order to enhancement the communication between faming system. The nature of agriculture structure requires flexibility, ease of implementation, robustness, and interpretability. Among the intelligent controllers a fuzzy logic controller is best fit to address nature of agriculture structure requirements. The reason is that it works with imprecise inputs, does not require an accurate mathematical model, and can handle nonlinearity. Enables advanced fuzzy logic to control a pump’s switching time according to user-defined variables, whereby sensors are the main aspect of and contributor to the system[3]. Introduces an innovative irrigation time control system for smart farming that leverages fuzzy logic to regulate the timing of irrigation in crop fields, effectively curbing water wastage while ensuring that crops receive neither too little nor too much water. A smart greenhouse system based on IoT and fuzzy inference system that creates an automatic microclimatic condition that optimizes the conditions of plant growth through the use of IoT sensors and actuators that automate the controlling of weather factors to enhance the plant growing process. A smart farm system that optimizes water usage for agriculture. The system implements an open loop fuzzy logic control system using Mamdani control system. The inputs to the fuzzy logic control system are adapted from a humidity sensor, temperature sensor, and the flux sensor in the field [4,5].
The purpose of this research is to improve automation systems in the agricultural industries by integrating intelligent controllers with Cisco packet tracers. As a result of the internet of things devices being integrated into the system, farmers can now easily determine their current farming situation. The rest of this paper is organized as follows: Section 2 carries out a literature review, whereas Section 3 presents mathematical models of the system. Results and discussions are presented in Section 4, and conclusions are drawn in Section 5.
2. Literature reviews
Smart agriculture systems can be traced back to the mid-1980s, when research into automated fruit harvesting systems began in Japan, Europe, and the United States. Impressive advances have been made since then in developing systems for use in modern agriculture. To date, agriculture systems have utilized different technologies such as precision farming, hydroponics, aquaponics, robots, temperature and moisture sensors, aerial images, GPS technology, and vertical farming [6]. The most popular applications of Artificial Intelligence in the agriculture industry are three major categories: Agricultural Robots, Predictive Analytics, and Crop & Soil Monitoring. Computer vision and deep-learning algorithms are used to process data captured by drones and/or software-based technology to monitor crops. Farmers use technology daily. Automated drones already monitor fields and collect data on crops. Agricultural robots are being developed to do the fieldwork. Robots have successfully planted, tended, and harvested crops. In order to realize the full potential of IoT, there is a need to integrate ubiquitous smart devices and cloud-based applications. [7,8], a combined IoT framework with a cloud at the center gives the flexibility of dividing associated costs in the most logical manner and is also highly scalable. In the combined framework, sensing service providers can join the network and offer their data using a storage cloud; analytic tool developers can provide their software tools; artificial intelligence experts can provide their data mining and machine learning tools useful in converting information to knowledge, and computer graphics designers can offer a variety of visualization tools [9,10,11,12]. An agricultural management method supported by technology monitors, assesses, and evaluates the requirements of specific fields and crops. The focus of these efforts is on robotics, which includes sensors, aerial images, and sophisticated local weather forecasts, as well as big data and advanced analytics capabilities. This results in reduced environmental impact, financial savings, and optimized fertilizer utilization. Using data and information technologies to optimize intricate farming systems is known as smart farming. Smart farming does not place as much emphasis on exact measuring or differentiating between or within individual animals as it does with PA. The emphasis is more on data application and access—that is, how to make intelligent use of the information gathered. Farmers can obtain real-time data regarding the state of the soil and plants, the terrain, the climate, the weather, the utilization of resources, labor, and funding [13,14]. By using mobile devices like smartphones and tablets, farmers now possess the knowledge necessary to base their judgments on factual information rather than gut feeling. Regular use of web-based data platforms in conjunction with Big Data analysis, internal and external farm networking, and precision and smart farming techniques is common. Products for IoT-enabled smart agriculture are made to automate irrigation systems and use sensors to monitor crop areas. Consequently, farmers and related brands may conveniently and remotely check agricultural conditions. Agriculture currently uses a variety of technologies. Therefore, to determine the degree of technology employed in the system, it is necessary to identify and compare the various technologies. For simplicity, this was compared in Table 1.
Researchers are using a variety of technologies in agriculture systems, including machine learning, remote sensing, image processing, sensor networks, and so on, to boost agricultural productivity. In order to gain insight, it is necessary to compare the controller algorithm used in agricultural systems. The comparison is based on how easily it can be automatically tuned during operation, as demonstrated in Table 2.
3. Mathematical models of the system
Figure 1 demonstrates how the overview of the present works would begin with the collection of related works and the identification of issues. Following accurate problem acquisition, mathematical models of the agricultural tanks would be created. Appropriate control algorithms would be developed based on the mathematical models. The complete system would then be tested and simulated. After integrating models with Cisco packet tracer and simulating again, if the test result validates the requirements, the findings are received and discussed. The procedure is repeated until the intended outcome is achieved. If the tested results are not validated by the requirements, which are checked against the mathematical model, the procedure is repeated.
3.1. Working principles of the smart agriculture
From the Figure 2, it can be understood that agriculture can be a field as favorable as industry for the application of automation. Addressing the issues in the agricultural sector is challenging because crops are unable to communicate their emotions. Furthermore, humans are unaware of all the requirements that plants have. The farmers' extensive and protracted experience would be partially, but not entirely, comprehended. The use of the internet of everything in smart agriculture would help with issues like industry 4.0 agriculture using artificial intelligence and machine learning concepts, and IOT smart farming [18]. It aids in issue solving, goal keeping, improvement, categorization, and disease prediction in agricultural systems. The intelligent controllers (fuzzy logic controllers) would receive reference parameters (input) such as temperature, humidity, and soil moisture. The controller would then estimate the necessary specification and send it to the agricultural system. The internet of things is integrated into the agricultural system, allowing farmers to receive messages and quickly understand any issues. The reference settings would be modified for the farmer based on the need. [19,20], Fuzzy logic controller algorithms would be used to make the decision and carry out the action itself if the farmers were not given the proper system parameters. On the other hand, industrial processes can be designed by modules to apply specific robots to specific tasks, whereas the complex tasks of agriculture sometimes cannot be split into simple actions.
3.2. Mathematical models of the water reservoir tank level, and its opening valve
Figure 3, consider a tank which has fluid flowing in (input) and fluid flowing out, define the output as depth in the tank. Now the research question could be:
How does the depth depend upon flow in and flow out?
How does flow out depend upon the depth?
In order to answer the questions, the flow out will depend upon the pressure in the tank (which depends upon the depth and density) and a constant linked to pipe shape [21].
Equation (1) represents the out-flow models, then the rate of the change of the depth will depend on the cross-sectional area, the difference between flow in and out.
Observations from inflow equation (3) show that the time constant depends on the resistance (pipe opening) of the outlet pipe and the cross-sectional area.
Gain depends on resistance (pipe opening) outlet pipe;
It was noted that the resistance to flow is actually If the cross-sectional area is increased, the time constant increases. If the resistance to flow K is increased, the time constant and steady-state gain also increase. We ignore the impact of density and gravity. This marks the end of the mathematical models for inflow and outflow models. To adjust the system automatically and fulfill the objective, it is necessary to look at the control strategy.
This model works with inaccurate and hazy data. This is based on degrees of truth and is a glaring oversimplification of the real-world issues. as all that's in it are water tanks, which are a component of an agricultural system. For the time being, fuzzy logic control works well because some parameters are unknown.
3.3. Fuzzy logic control design
Fuzzy logic is a mathematical method for representing vagueness and uncertainty in decision-making. It allows for partial truths, where a statement can be partially true or false, rather than fully true or false. Fuzzy membership is a concept in fuzzy logic that assigns a degree of membership to an element in a set. The degree of membership is a value between 0 and 1, where 0 indicates that the element is not a member of the set, and 1 indicates that the element is a full member of the set [15]. There are different types of membership functions that can be used to model fuzzy sets as represented in Table 3. While fuzzy logic has many advantages, there are also some disadvantages to using it. One of the main disadvantages is that it can be difficult to design a fuzzy system that accurately models a complex system. Fuzzy systems can also be computationally expensive to run, especially if they involve a large number of rules or membership functions. Additionally, fuzzy systems can be difficult to interpret, especially if they involve a large number of rules or membership functions [22].
Based on the comparison hits, a Gaussian membership function was selected for this work [23].
Figure 4, depicts the conventional layout of a fuzzy logic controller. Before going into the main control block, the inputs which were crisp values produced by the feedback error and change of error were conditioned by multiplying by constant gains using a preprocessor. The fuzzification block matches data with criteria of rules and transforms input data into degrees of membership functions. The Mamdani-type inference engine took the rule-based commands as input, calculated the degree of capability of the used rules, and produced a fuzzy set for the defuzzification block, which took the fuzzy output data and produced crisp values. Through the use of the centroid defuzzification approach, the outputs of the fuzzy sets were transformed into crisp values [24,25].
3.3.1. Membership function assignments.
The membership assignment for temperature was displayed in Figure 5. Temperature regulation would be based on function. Low which is represented in black color, normal is presented in red color, and high is represented by blue color values have been assigned to the values. The Gaussian function is used to represent the function. While probability was represented by the vertical axis, the horizontal axis was expressed in degrees Celsius.
Figure 6 showed the membership assignment for humidity. Function would be the basis for controlling humidity. The values have been given low which is represented in black color, normal is presented in red color, and high is represented by blue color values. The function is represented by the Gaussian function. The horizontal axis was given in mass per cubic metric, whilst the vertical axis denoted probability.
The membership assignment for humidity was displayed in Figure 7. The foundation for regulating soil moisture would be function. Three values have been assigned to the values: low which is represented in black color, normal is presented in red color, and high is represented by blue color. The Gaussian function is used to represent the function. The vertical axis represented probability, and the horizontal axis was expressed in mass per cubic metric.
Figure 8 showed the membership assignment for opening the valve. Function would be the cornerstone for controlling the valve's opening. Wet represented by blue color, cold shown by red color, moderate which is presented by black color, hot demonstrated in purple color, and dry which is presented in green color are the three values that have been attributed to the values. The function is represented by the Gaussian function. Probability was represented by the vertical axis, while degrees were shown by the horizontal axis.
As shown in Table 4, the fuzzy logic designs were determined by the language rules. Z stands for zero response, P1 shows positive small, which means the valve would be open slightly, N2 signifies negative large, which means the valve is completely closed, and P2 indicates positive large, which means the valve is fully opened and the water is discharging.
Figure 9a,b demonstrated how these rules base their control efforts on a number of if-then statements regarding (e) and (De). Specifically, if the error is equivalent to the values for temperature (TV), humidity (HV), and soil moisture, then control (c) is changed to open the valve (OV). The system was tuned and experiments were conducted to identify the number of these if-then statements. It is simple to repeat the procedure by adjusting the input numbers with the aid of the vertically positioned red line. It adjusts itself prudently. The yellow color in Figure 9a indicated the face of the input parameters, where blue color in Figure 9b showed that the output parameters.
Plotting the first output variable against the first two input variables, the fuzzy logic rule surface provides the output surface for the fuzzy inference system. The midpoints of each input variable's corresponding range are used as reference values for the other input variables in fuzzy systems with three inputs. As a result, Figure 10 shows the smoothness of the control signal change and offers the rule surface that corresponds to the rules. Figure 10 shows the fuzzy numbers with the lightness change caption and colors representing the least and greatest uncertainty levels. and was greatly impacted by the work, which offered approaches for visualizing data with uncertainty based on variations in saturation, brightness, and/or intensity. The hue of the map indicating the degree of uncertainty with respect to lower values. The color-coded map illustrating the degree of uncertainty towards higher numbers.
The aim of this controller design is to enhance communication between ground mobile robots, aerial vehicles (quadcopters), and farming fields. In order to achieve the goals of this work, this section provides a case study for the intelligent fuzzy logic controller and formulations of air properties in agricultural fields. Figure 11 shows that the components consist of three inputs: soil moisture sensors, temperature sensors, and humidity sensors. The fuzzy logic controller then receives signals from the three inputs in order to control the pumps and valve opening conditions. As the valve opens, an input fills the water tank. Filled water levels are measured by water level sensors and flow rate sensors, which send feedback to the fuzzy logic controller. Based on the feedback signals, the fuzzy logic controller automatically adjusts the input signals and then sends them to the respective outputs.
Figure 12 shows the working principles of the IoT implementation in the agriculture system. The system starts up and initializes, then collects data from the agriculture fields. It then prints whether the soil moisture (SM) is less than 27%, in which case the sprinkler turns on, or if the soil moisture (SM) is greater than 27%, in which case the sprinkler turns off.
3.3.2. Case study for the intelligent fuzzy logic model
These rules can be used to create a fuzzy logic-based system that can control a pump’s switching time according to user-defined variables, whereby sensors are the main aspect of and contributor to the system . The proposed system can help automate irrigation and reduce water consumption and watering time [15,16,17,18,19] . Here are some fuzzy rules for temperature, humidity, soil moisture, and soil acidity as input and output in a smart agriculture system:
- ●
- Temperature:
- ○
- If the temperature is low, then the output is cold.
- ○
- If the temperature is normal, then the output is moderate.
- ○
- If the temperature is high, then the output is hot.
- ●
- Humidity:
- ○
- If the humidity is low, then the output is dry.
- ○
- If the humidity is normal, then the output is moderate.
- ○
- If the humidity is high, then the output is wet.
- ●
- Soil Moisture:
- ○
- If the soil moisture is low, then the output is dry.
- ○
- If the soil moisture is normal, then the output is moderate.
- ○
- If the soil moisture is high, then the output is wet.
- ●
- Soil Acidity:
- ○
- If the soil acidity is low, then the output is basic.
- ○
- If the soil acidity is normal, then the output is neutral.
- ○
- If the soil acidity is high, then the output is acidic.
These rules can be used to create a fuzzy logic-based system that can control a pump’s switching time according to user-defined variables, whereby sensors are the main aspect of and contributor to the system . The proposed system can help automate farm and reduce water consumption and watering time.
3.3.3. Formulation of the air properties in the agriculture field
It was assumed that the opening of the valve, moisture in sounding, pump flow rate, and water levels during the valve’s operation would be taken into account. However, other factors were not considered in the work. Based on this assumption, the following parameters would be formulated as follows[20]:
Where is constant ideal ratio, p is pressure sound in the system, specific density of air.
Where D is diameter of the reservoirs, n is number of moles, H is head of the of the water at the field.
GPM Gallons per Minute (GPM) flow rate.
Where is pressure drops across the valve.
4. Results and discussions
The purpose of this research article was to create an Internet of Things (IoT) weather station that also incorporated a soil moisture-monitoring component. The device is intended to notify the user when the moisture content of the soil drops below a certain value. To notify the user that the moisture content of the soil is too low, sprinklers, which correspond to the three soil moisture sensors, will turn on. The initial idea was to feed all of this data onto a server designed to handle IoT projects and then plot the data continuously. From Table 5, it was understood that IoT devices (temperature sensors, ADH sensors, and water vapor per Kg) are used as inputs for the fuzzy logic control. The outputs are rotations of the pumps, moisture in sounding, water level sensors, outflow, and valve opening. Of these output parameters, valve opening is constant throughout the process, while the input parameters vary.
Figure 13 demonstrates the water levels in the fields. The vertical axis indicated that water level in mega metric cube (Mm3), whereas the horizontal axis showed that time in hours. At the beginning, it slowly increases since the amount of water required by the field was not much. It increases slowly until about 9.8hours, after which it dramatically increases, indicating that the field requires more water. Too much water in agricultural areas can affect how the soil functions, hinder plant growth, and increase the risk of nutrient runoff. Too little water, on the other hand, can have devastating effects on crops and their ability to take up nutrients from the soil. Intensive groundwater pumping for irrigation depletes aquifers and can lead to negative environmental externalities, causing significant economic impact on the sector and beyond.
From Figure 14, Valve opening is a term used in irrigation to describe the degree to which a valve is open or closed. It is typically expressed as a percentage, with 0% indicating that the valve is completely closed and 100% indicating that the valve is completely open. The valve opening determines the amount of water that flows through the valve and into the irrigation system. By adjusting the valve opening, controller can control the amount of water that is delivered to their crops. For this case its open slowly increases, because of the amount of water discharge flow rate is direct proportional to the product area, and dropped pressure. The water level has a minimum of 10m3, meaning that when the valve is opened, the water level will likewise gradually rise from 10m3.
As shown in the Figure 15, in IoT, a controller effort is a term used to describe the amount of torque or force that is applied to a pump and valves in order to achieve a desired performance. Controllers are defined by the type of control input and the type of output they use to drive the pump and valves. For example, a flow rate controller accepts flow rate commands as input and produces torque (effort) commands as output.
Figure 16 represents the discharge of water in the agricultural fields. It means that flow rate discharge is the volume of water that flows through a pipe or channel per unit time. In the agriculture sector, flow rate discharge is an important parameter for irrigation systems. It is used to determine the amount of water that is delivered to crops automatically, and to ensure that the farm system is operating properly.
As shown in Figure 17, errors related to water level grow proportionately. An inaccuracy characterized as a proportional error depends on how much a water level variable changes. Thus, the relationship between the change in water levels and the change in time (hours) is straightforward. Time (hours) divided by water levels always equals the same constant since this change is always of an equally quantifiable quantity. A statistic that shows how much a water levels sample percentage is expected to deviate from the proportion in the overall proportion constitutes the standard error of a proportion.
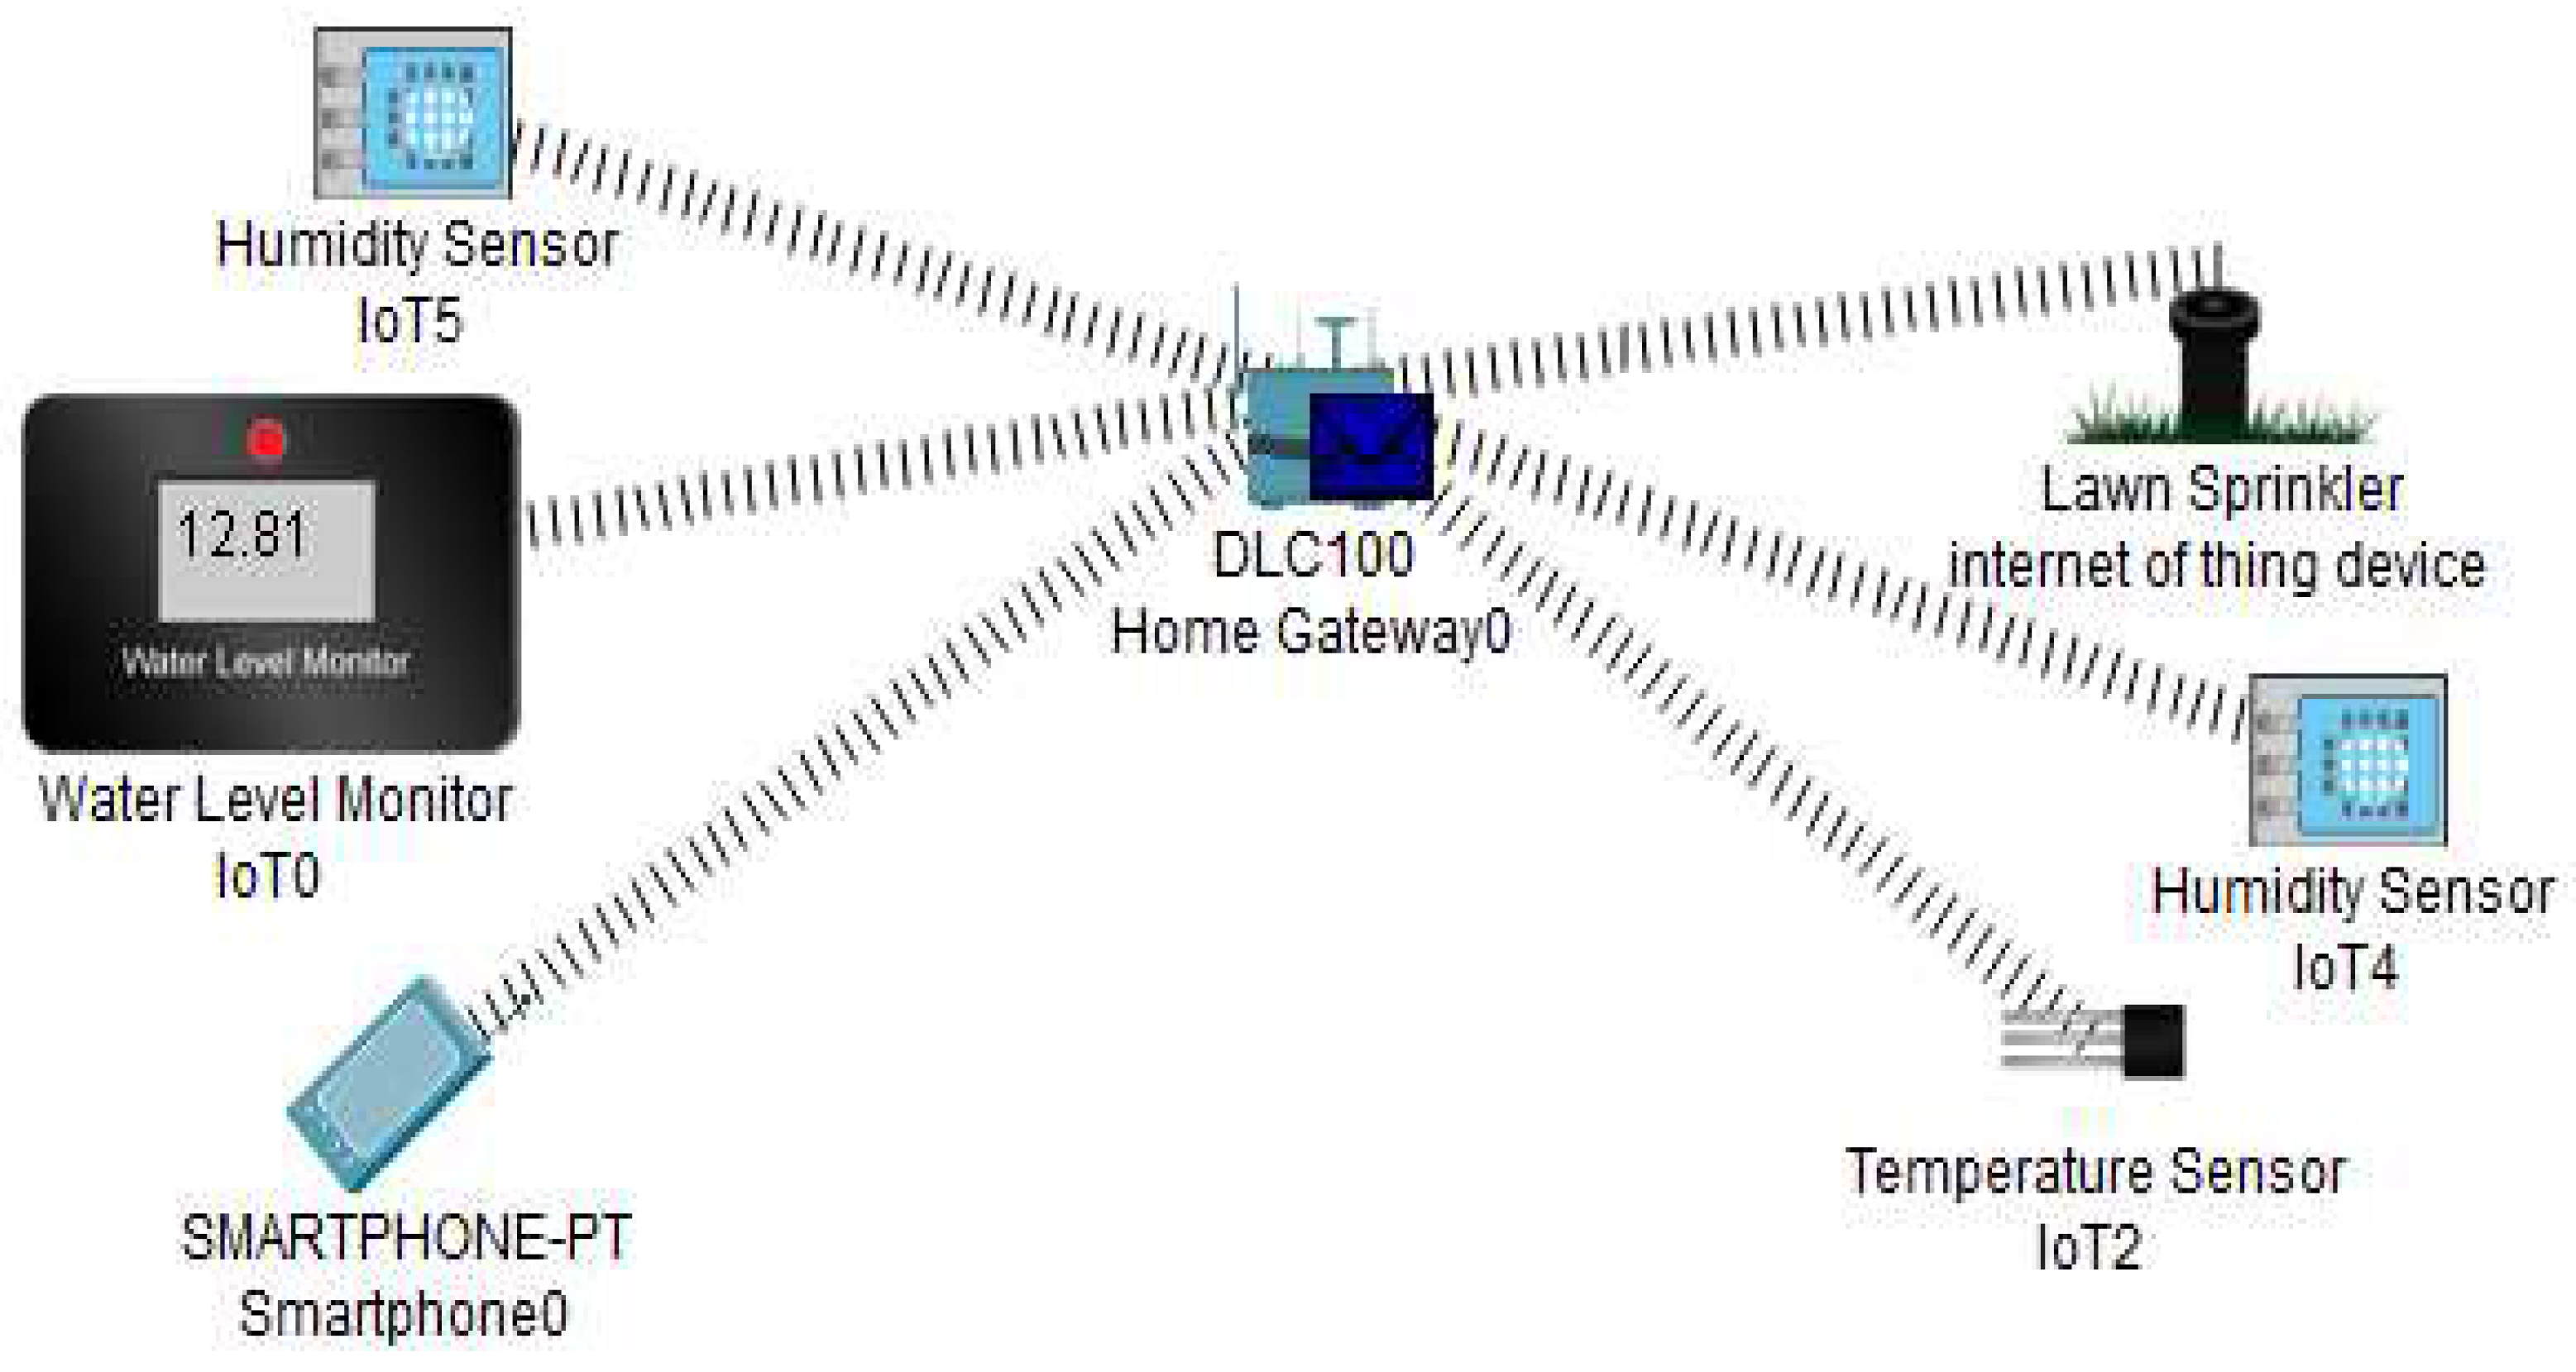
After the controller design was finished, it was implemented in Cisco Packet Tracer with integrated MATLAB/SIMULINK environments. Figure 18 shows the real-time flow of data packets during the simulation. The fuzzy logic intelligent controller is home gate connected to the IoT backend server. The IoT connection enables users to check the status of the IoT parameters such as temperature, humidity, and soil moisture from an IoT browser homepage. The IoT browser homepage shows a list of the smart devices, allows visualization of their status, and permits remote interaction with the devices. Logical interaction between smart devices can be set while connected to the IoT main homepage. Interactions between devices are based on set conditions, such as starting the chiller when the temperature of a particular unit needs to be lowered or reducing oxygen supply to the boiler in order to reduce the fire tube temperatures. The central control PC, manager smartphones, and tablets, which are connected to the local central office wireless LAN (WLAN), can connect to the dedicated IoT homepage via a browser in order to monitor all connected IoT devices. Cisco Packet Tracer has a feature with the possibility to switch from real-time to simulation mode. The first mode enables the possibility to create the underlying network, connect IoT devices, and define IoT backend logic. However, only in the simulation mode, it was possible to validate that the network communication layer really happened between the devices. In the simulation mode, it was possible to simulate packet traffic between nodes and devices in order to check the connectivity, routing protocols, and other network logic. This mode helped to physically visualize and troubleshoot any kind of network, for example, setting up pings or more complex packages between nodes.
5. Conclusion
This study aimed to incorporate an Internet of Things (IoT) agricultural system that monitors soil moisture, temperature, and humidity as input parameters and automatically opens the valve as an output. In order to achieve these goals, a wide range of pertinent research papers were looked into to determine the current problems. One of the problems was the difficulty of having the valves in agricultural fields open automatically. Based on well-founded concerns, mathematical models of agricultural tanks were created. Fuzzy logic controllers were designed using the mathematical models that were provided. It was determined to create fuzzy logic controllers by utilizing the language-based membership function. Fuzzification of fuzzy language started next, and was followed by rule evaluation and defuzzification. Next, a fuzzy logic surface and fuzzy logic rules were created. When the fuzzy logic system was complete, it was all transferred to a mathematical model of a water tank to watch how the controller functioned. After that, Cisco packet tracers were used to integrate the entire system within the MATLAB environment. Sprinklers that correspond to the three soil moisture sensors activate, and the gadget notifies the user when the soil moisture content falls below a predetermined threshold. After being loaded onto a server built to handle IoT devices, the data is continually plotted. The field’s water requirement rises gradually for approximately 9.8 hours before sharply increasing, suggesting that the field needs more water. In agricultural settings, an excess of water can disrupt soil structure, impede plant development, and raise the possibility of nutrient runoff. Crops and their capacity to absorb nutrients from the soil can suffer greatly from inadequate watering. Aquifers are depleted, and adverse environmental externalities may result from intensive groundwater pumping for agriculture, which has a substantial financial impact on the industry and beyond. In agriculture, “valve opening” refers to the extent to which a valve is open or closed. A percentage is usually used to represent it, where 0% denotes a fully closed valve, and 100% denotes a fully opened valve. The amount of water that passes through the valve and enters the agricultural system is determined by the valve opening. Farmers can regulate how much water is applied to their crops by changing the opening of the valve. The amount of torque or force supplied to a pump and valves to accomplish a specified performance is referred to as the controller effort in the Internet of Things. The kind of control input and output that a controller uses to operate the pump and valves characterizes the controller. For instance, a flow rate controller generates torque (effort) commands as an output after receiving flow rate commands as input. Flow rate discharge is a crucial agricultural system element in the agriculture industry. It is used to figure out how much water is automatically applied to crops and to make sure the farm system is running smoothly. Smart gadgets are linked to the IoT backend server through a house gate. Through the IoT connection, users can remotely interact with the devices and check their status from the homepage of an IoT browser. While linked into the IoT main portal, smart device interactions can be configured logically. Device interactions are dependent on predetermined parameters. For example, the chiller may be started when a certain unit needs its temperature dropped, or the oxygen supply to the boiler may be reduced to lower the fire tube temperatures. All linked IoT devices may be monitored by the central control PC, management cellphones, and tablets by connecting them via a browser to the specific IoT site. One characteristic that makes integrating MATLAB/Simulink with Cisco Packet Tracer possible is the ability to transition between simulation and real-time mode. It is feasible to confirm that the network communication layer between the devices actually occurred in the simulation mode. To examine network logic, routing protocols, and connectivity between nodes and devices, a packet tracer simulation can be performed. This mode facilitates the physical visualization and troubleshooting of any type of network, including the configuration of more intricate packages or pings between nodes. It was discovered that the optimal outcome came from combining the Cisco packet tracer with the MATLAB environment. If agricultural temperature, humidity, and soil moisture content were all effectively controlled, as well as if water tanks could open on their own, these outcomes would occur. Farmers and crops would be in communication at the same time. Consequently, in comparison to earlier research studies, the suggested intelligent control system is the most appropriate with IoT gadget for the implementation of smart farm systems.
References
- F. FAO, “The future of food and agriculture: alternative pathways to 2050,” Food Agric. Organ. U. N. Rome, 2018.
- J. von Braun, K. Afsana, L. O. Fresco, and M. H. A. Hassan, “Science for transformation of food systems: opportunities for the UN Food Systems Summit,” Sci. Innov. Food Syst. Transform., p. 921, 2023.
- Hopkins, A. Farahnaky, H. Gill, J. Danaher, and L. P. Newman, “Food neophobia and its association with dietary choices and willingness to eat insects,” Front. Nutr., vol. 10, 2023, Accessed: Nov. 26, 2023. [Online]. Available online: https://www.ncbi.nlm.nih.gov/pmc/articles/PMC10369065/.
- S. Tambo Tene et al., “Application of the response surface methodology (RSM) in the optimization of the fluidizing and sweetening capacities of sprouted flours of two maize varieties ( Atp-Y and Coca-sr ),” Cogent Food Agric., vol. 9, no. 2, p. 2279724, Dec. 2023. [CrossRef]
- T. Y. Lee, M. N. Reza, S.-O. Chung, D. U. Kim, S. Y. Lee, and D. H. Choi, “Application of fuzzy logics for smart agriculture: A review,” Precis. Agric., vol. 5, no. 1, p. 1, 2023. [CrossRef]
- Amertet, Sairoel, Girma Gebresenbet, Hassan Mohammed Alwan, and Kochneva Olga Vladmirovna. "Assessment of Smart Mechatronics Applications in Agriculture: A Review." Applied Sciences 13, no. 12 (2023): 7315. [CrossRef]
- R. Vijay Anand, “Energy efficient cluster head using modified fuzzy logic with WOA and path selection using Enhanced CSO in IoT-enabled smart agriculture systems”, Accessed: Nov. 26, 2023. [Online]. Available online: https://www.researchsquare.com/article/rs-2946945/latest.
- H. Benyezza, M. Bouhedda, R. Kara, and S. Rebouh, “Smart platform based on IoT and WSN for monitoring and control of a greenhouse in the context of precision agriculture,” Internet Things, vol. 23, p. 100830, 2023. [CrossRef]
- F. G. P. Pradana, R. Sarno, and S. Triarjo, “Development of Smart Farming Control System based on Tsukamoto Fuzzy Algorithm,” in 2023 International Conference on Computer Science, Information Technology and Engineering (ICCoSITE), IEEE, 2023, pp. 348–353. Accessed: Nov. 26, 2023. [Online]. 1012. Available online: https://ieeexplore.ieee.org/abstract/document/10127754/.
- H. K. Adli et al., “Recent Advancements and Challenges of AIoT Application in Smart Agriculture: A Review,” Sensors, vol. 23, no. 7, p. 3752, 2023. [CrossRef]
- F. Masood, W. U. Khan, S. U. Jan, and J. Ahmad, “AI-enabled traffic control prioritization in software-defined IoT networks for smart agriculture,” Sensors, vol. 23, no. 19, p. 8218, 2023. [CrossRef]
- G. P. Obi Reddy, B. S. G. P. Obi Reddy, B. S. Dwivedi, and G. Ravindra Chary, “Applications of Geospatial and Big Data Technologies in Smart Farming,” in Smart Agriculture for Developing Nations, K. Pakeerathan, Ed., in Advanced Technologies and Societal Change. Singapore: Springer Nature Singapore, 2023, pp. 15–31. [CrossRef]
- R. P. Sharma, R. Dharavath, and D. R. Edla, “IoFT-FIS: Internet of farm things based prediction for crop pest infestation using optimized fuzzy inference system,” Internet Things, vol. 21, p. 100658, 2023. [CrossRef]
- A. Atheeswaran, K. V. Raghavender, B. L. Chaganti, A. Maram, and N. Herencsar, “Expert system for smart farming for diagnosis of sugarcane diseases using machine learning,” Comput. Electr. Eng., vol. 109, p. 108739, 2023. [CrossRef]
- Shamshiri, Redmond R., Muhammad Razif Mahadi, Desa Ahmad, Siti Khairunniza Bejo, S. A. Aziz, Wan Ishak Wan Ismail, and H. Che Man. "Controller design for an osprey drone to support precision agriculture research in oil palm plantations." In 2017 ASABE Annual International Meeting, pp. 2-13. 2017. [CrossRef]
- Cambra Baseca, Carlos, Sandra Sendra, Jaime Lloret, and Jesus Tomas. "A smart decision system for digital farming." Agronomy 9, no. 5 (2019): 216. [CrossRef]
- R. K. PATI and H. PAIKRAY, “APPLICATION OF ARTIFICIAL IN℡LIGENCE IN FUZZY LOGIC FOR CROP MANAGEMENT IN AGRICULTURE”, Accessed: Nov. 26, 2023. [Online]. Available online: https://www.journal-dogorangsang.in/no_4_Book_21/191.pdf.
- J. T. Purwoko, T. O. Wingardi, and B. Soewito, “Smart Agriculture Water System Using Crop Water Stress Index and Weather Prediction,” CommIT Commun. Inf. Technol. J., vol. 17, no. 1, pp. 61–70, 2023. [CrossRef]
- F. Umam, A. Dafid, and A. D. Cahyani, “Implementation of Fuzzy Logic Control Method on Chilli Cultivation Technology Based Smart Drip Irrigation System,” J. Ilm. Tek. Elektro Komput. Dan Inform., vol. 9, no. 1, pp. 132–141, 2023. [CrossRef]
- N. Alex, C. C. Sobin, and J. Ali, “A Comprehensive Study on Smart Agriculture Applications in India,” Wirel. Pers. Commun., vol. 129, no. 4, pp. 2345–2385, Apr. 2023. [CrossRef]
- R. Manikandan, G. Ranganathan, and V. Bindhu, “Deep Learning Based IoT Module for Smart Farming in Different Environmental Conditions,” Wirel. Pers. Commun., vol. 128, no. 3, pp. 1715–1732, Feb. 2023. [CrossRef]
- E. Karunathilake, A. T. Le, S. Heo, Y. S. Chung, and S. Mansoor, “The path to smart farming: Innovations and opportunities in precision agriculture,” Agriculture, vol. 13, no. 8, p. 1593, 2023. [CrossRef]
- Mitra, Alakananda, Sukrutha LT Vangipuram, Anand K. Bapatla, Venkata KVV Bathalapalli, Saraju P. Mohanty, Elias Kougianos, and Chittaranjan Ray. "Everything you wanted to know about smart agriculture." arXiv preprint arXiv:2201.04754 (2022). [CrossRef]
- Zhao, Junfang, Dongsheng Liu, and Ruixi Huang. "A Review of Climate-Smart Agriculture: Recent Advancements, Challenges, and Future Directions." Sustainability 15, no. 4 (2023): 3404. [CrossRef]
- Gupta and P. Nahar, “Sandpiper optimization algorithm with cosine similarity based cross-layer routing protocol for smart agriculture in wireless sensor network assisted internet of things systems,” Int. J. Commun. Syst., vol. 36, no. 11, p. e5514, Jul. 2023. [CrossRef]
Figure 1.
Flow charts of the current work.
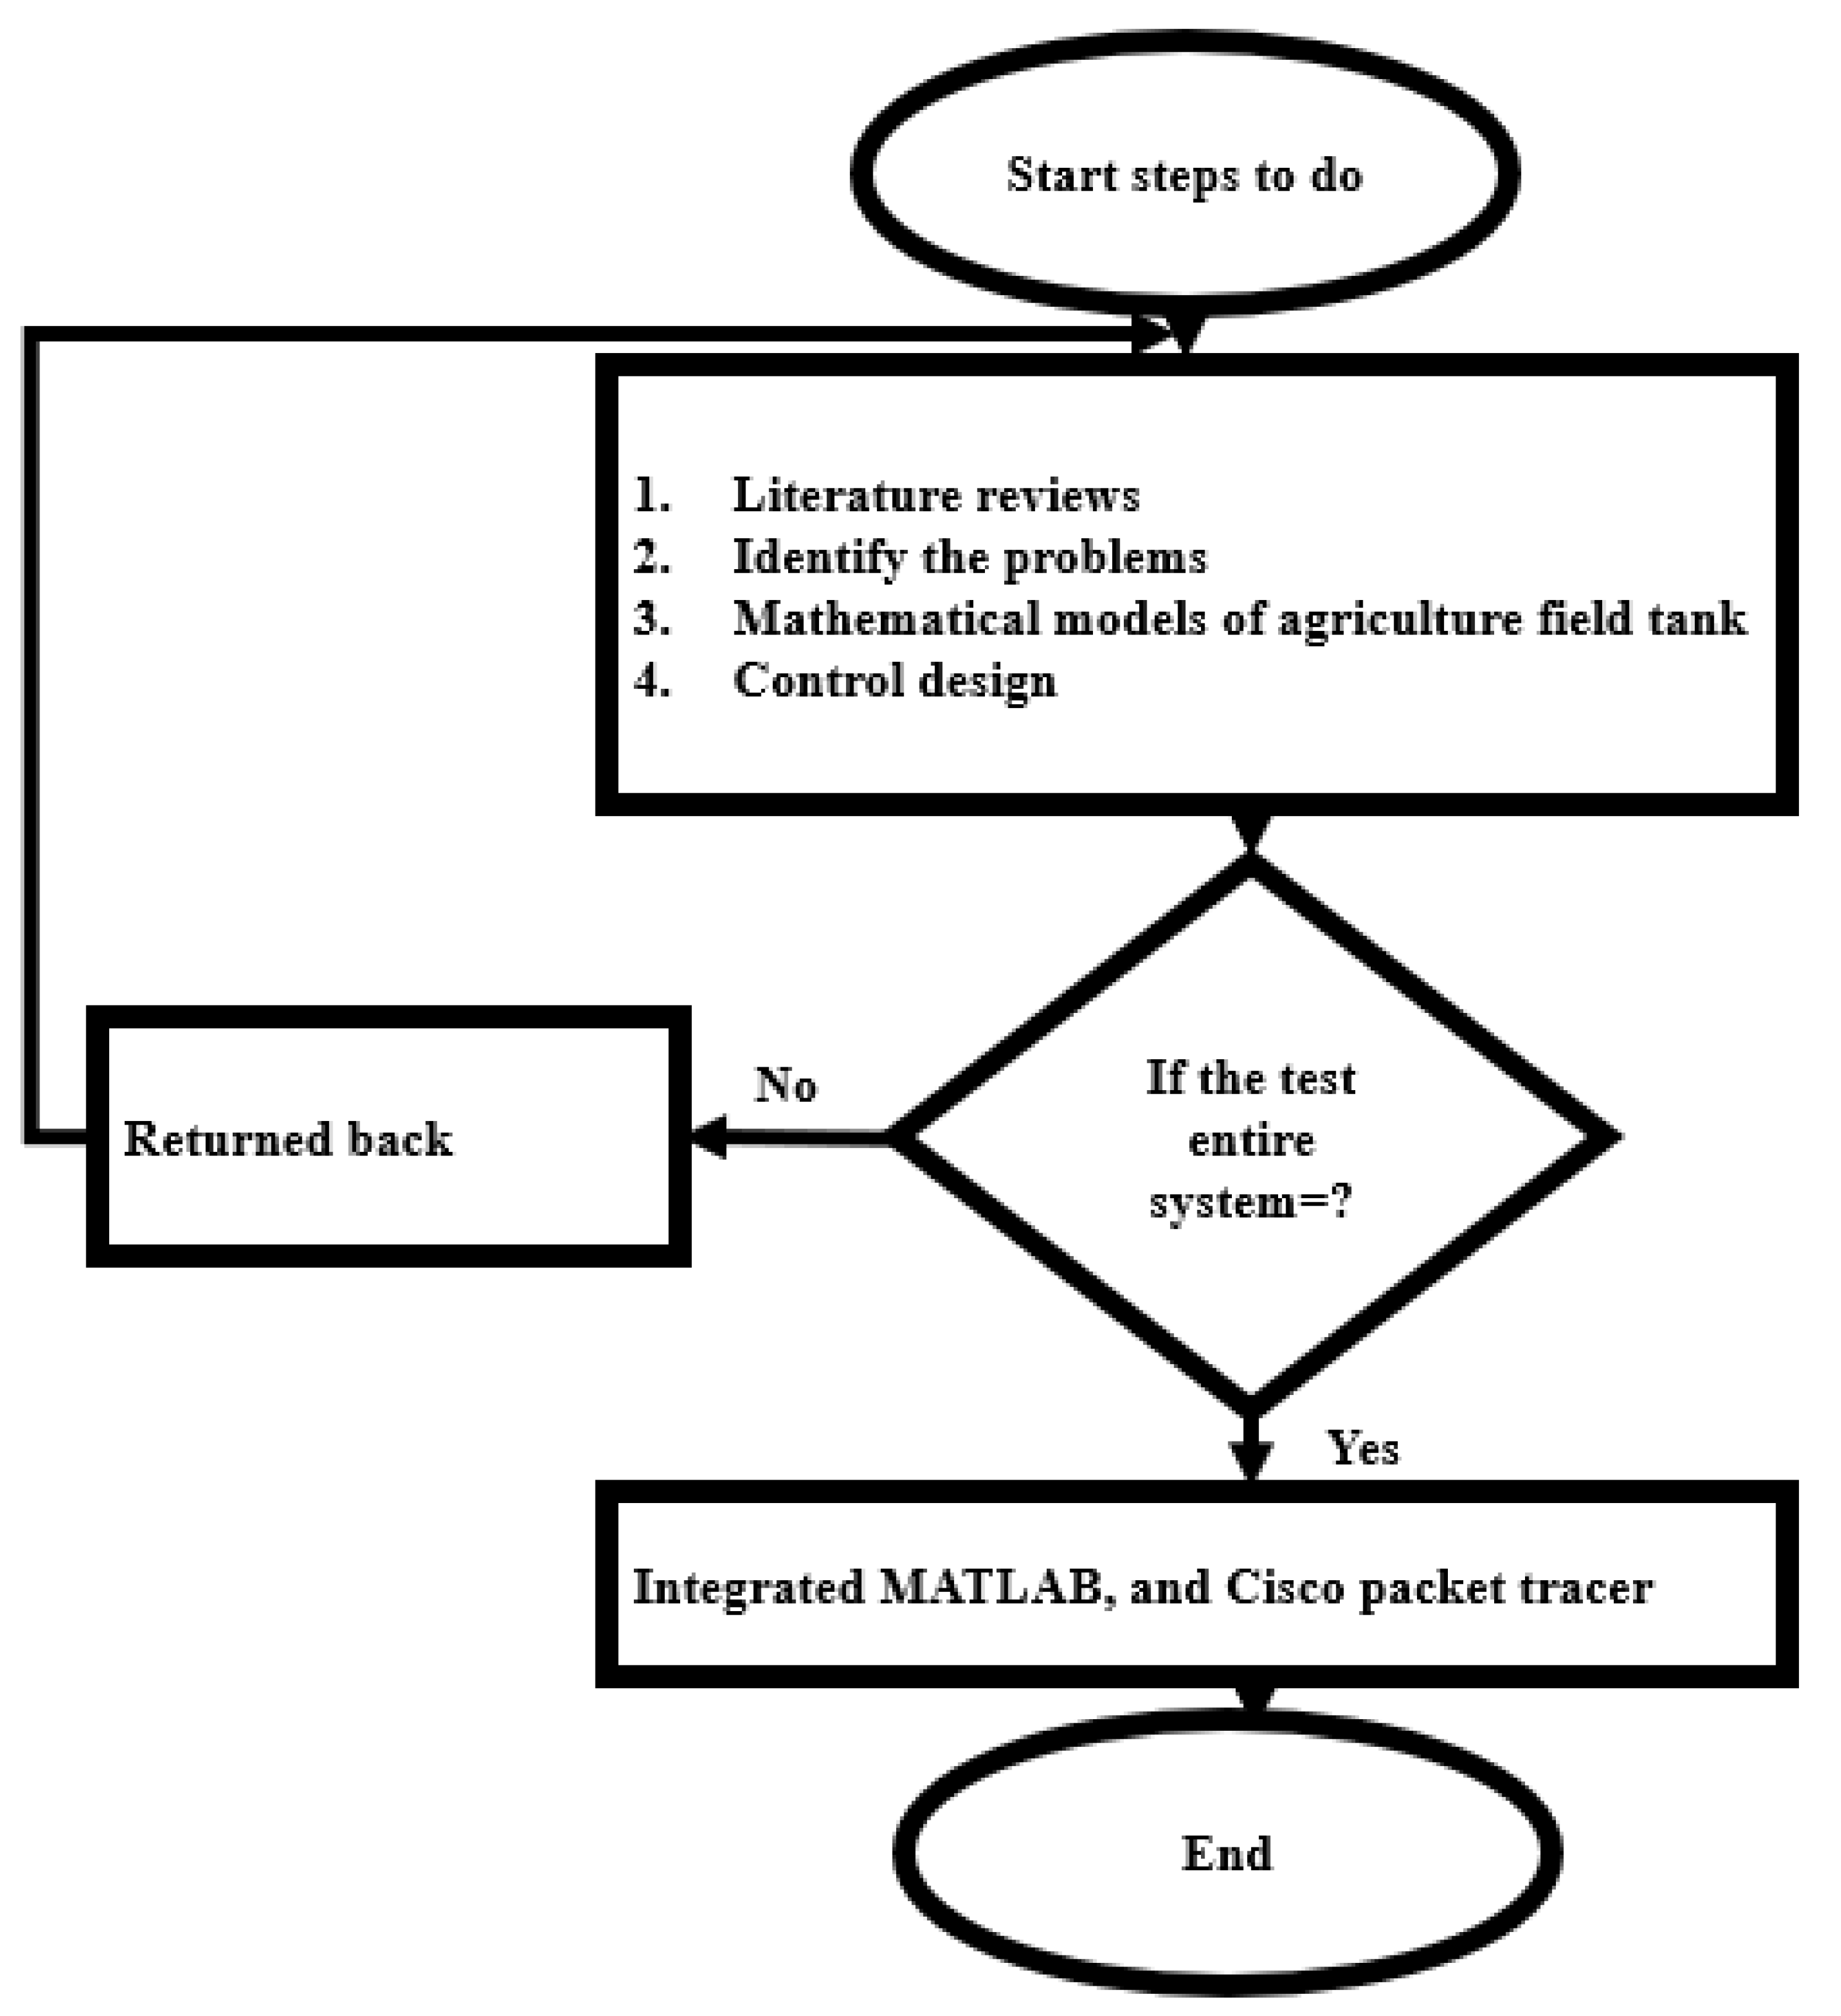
Figure 2.
Smart agriculture system.
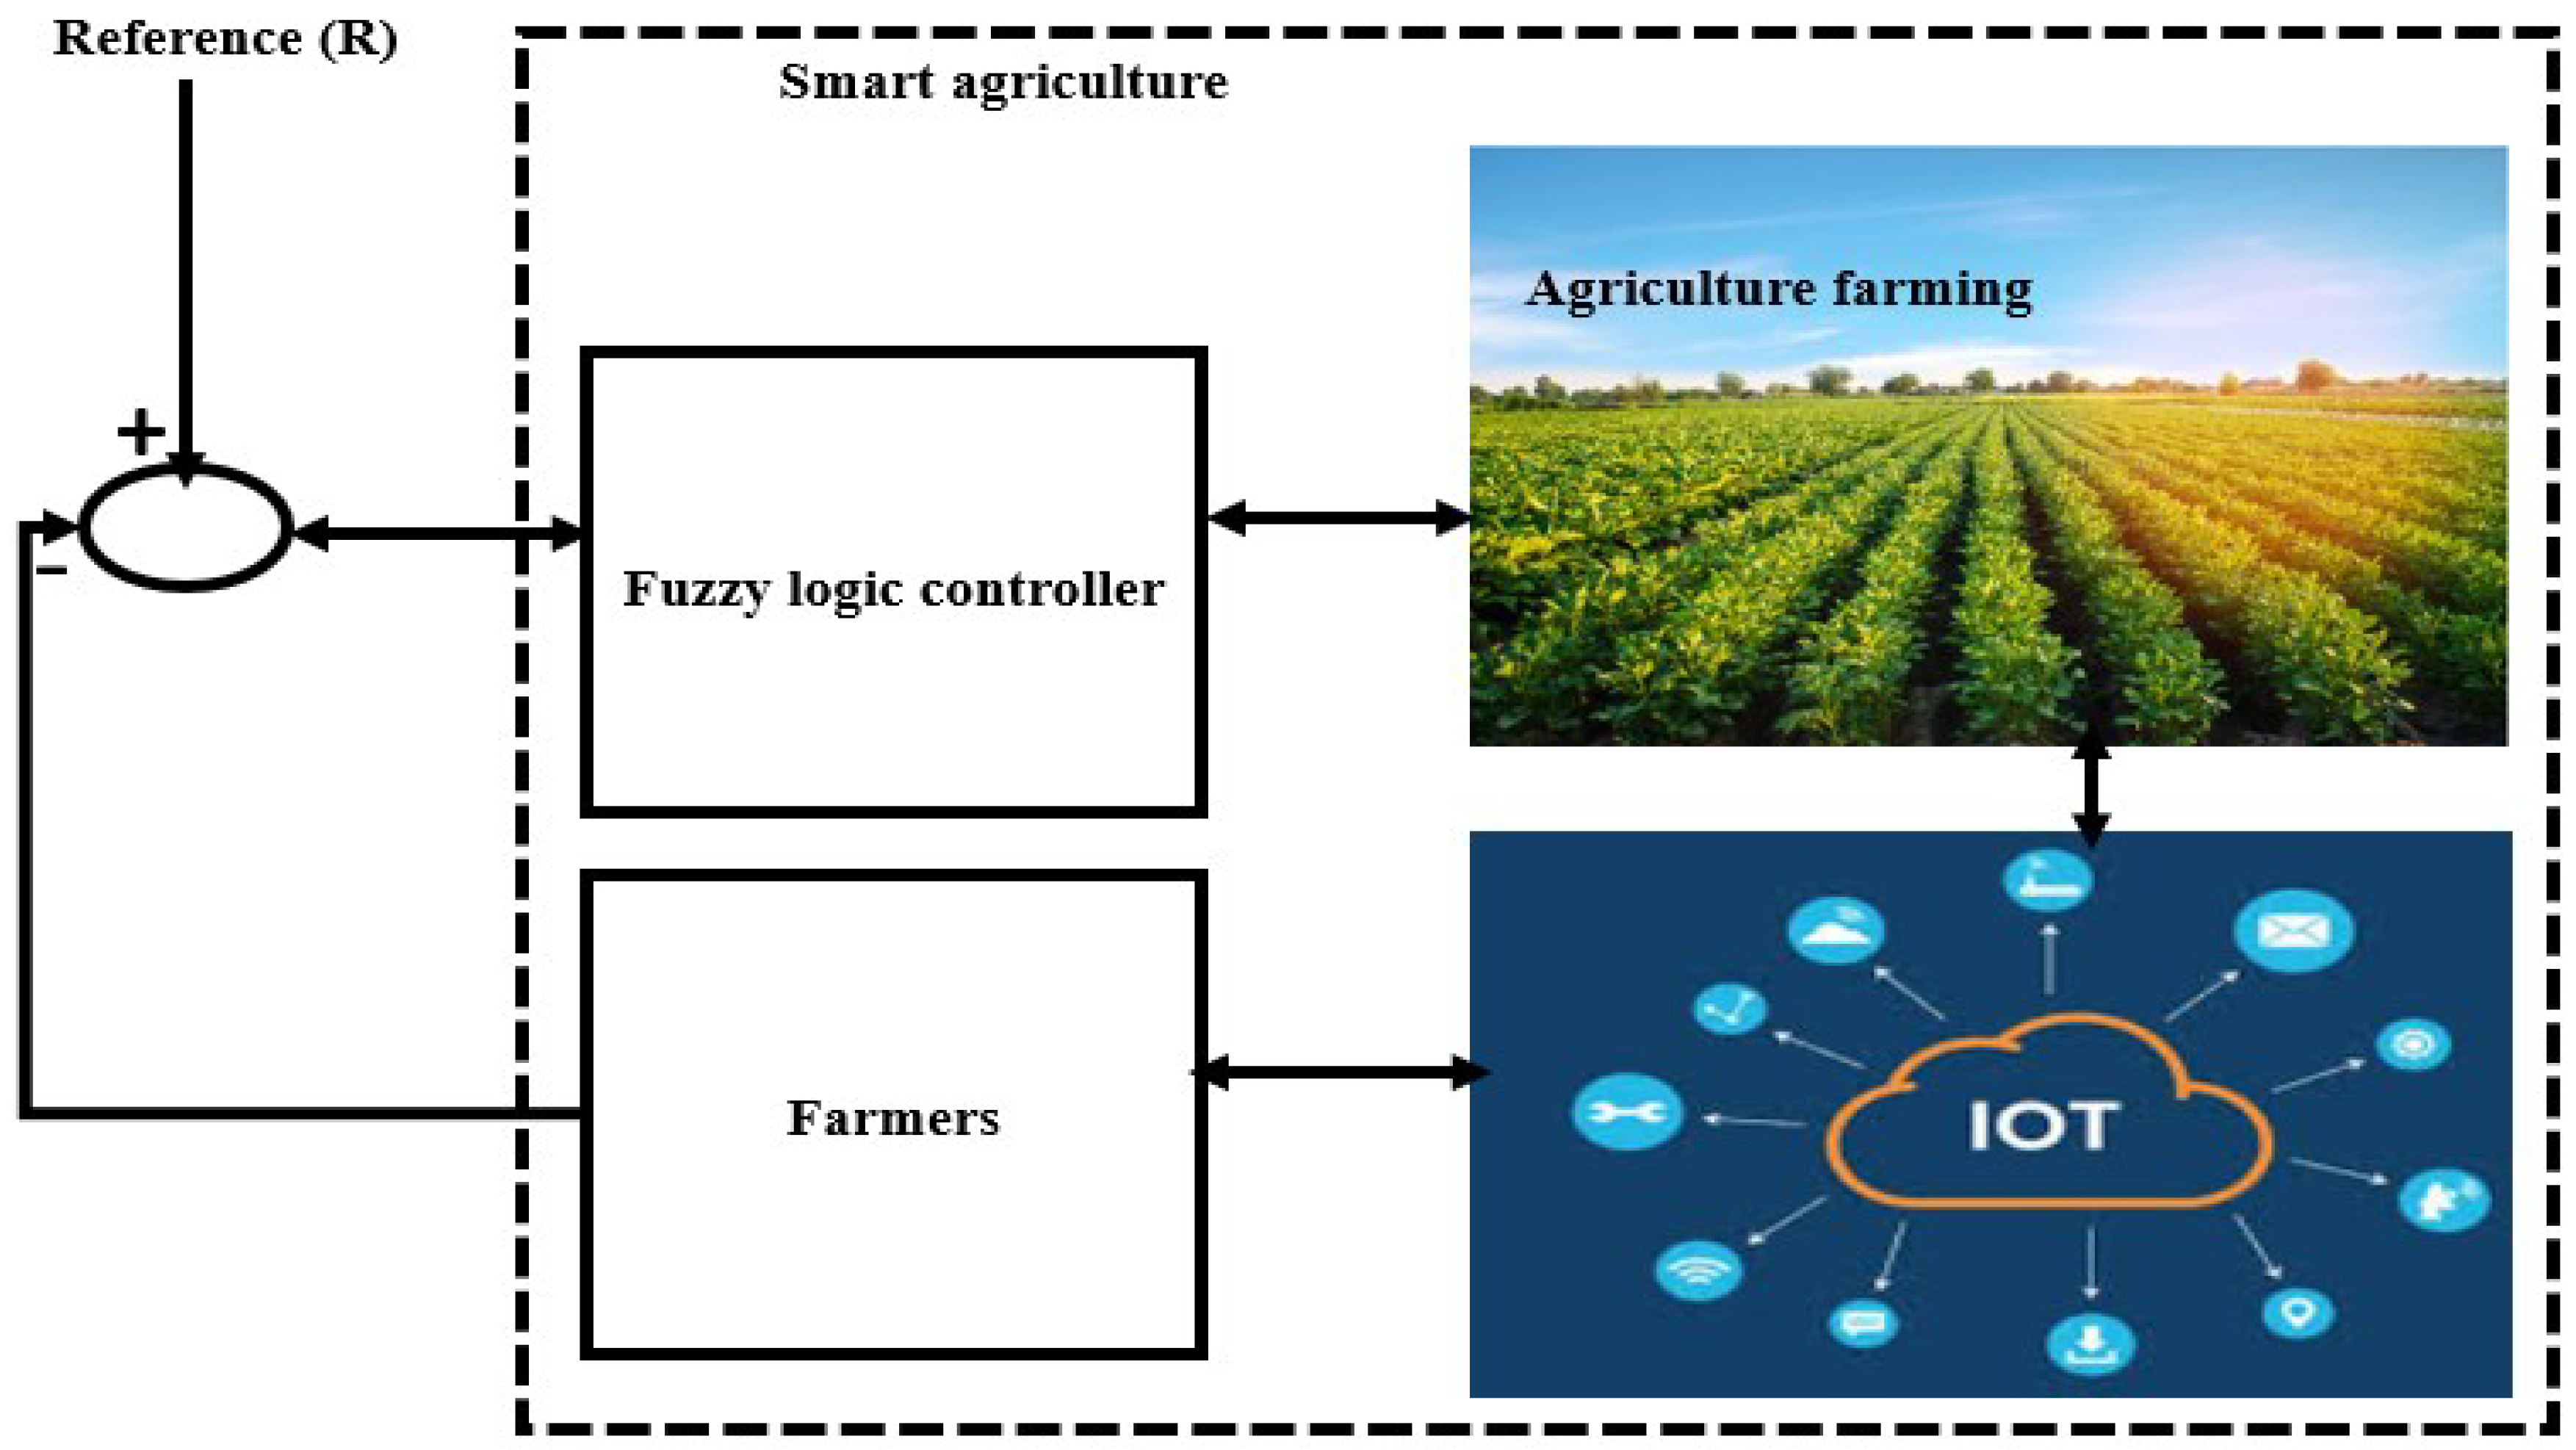
Figure 3.
Water tank level for smart agriculture system.
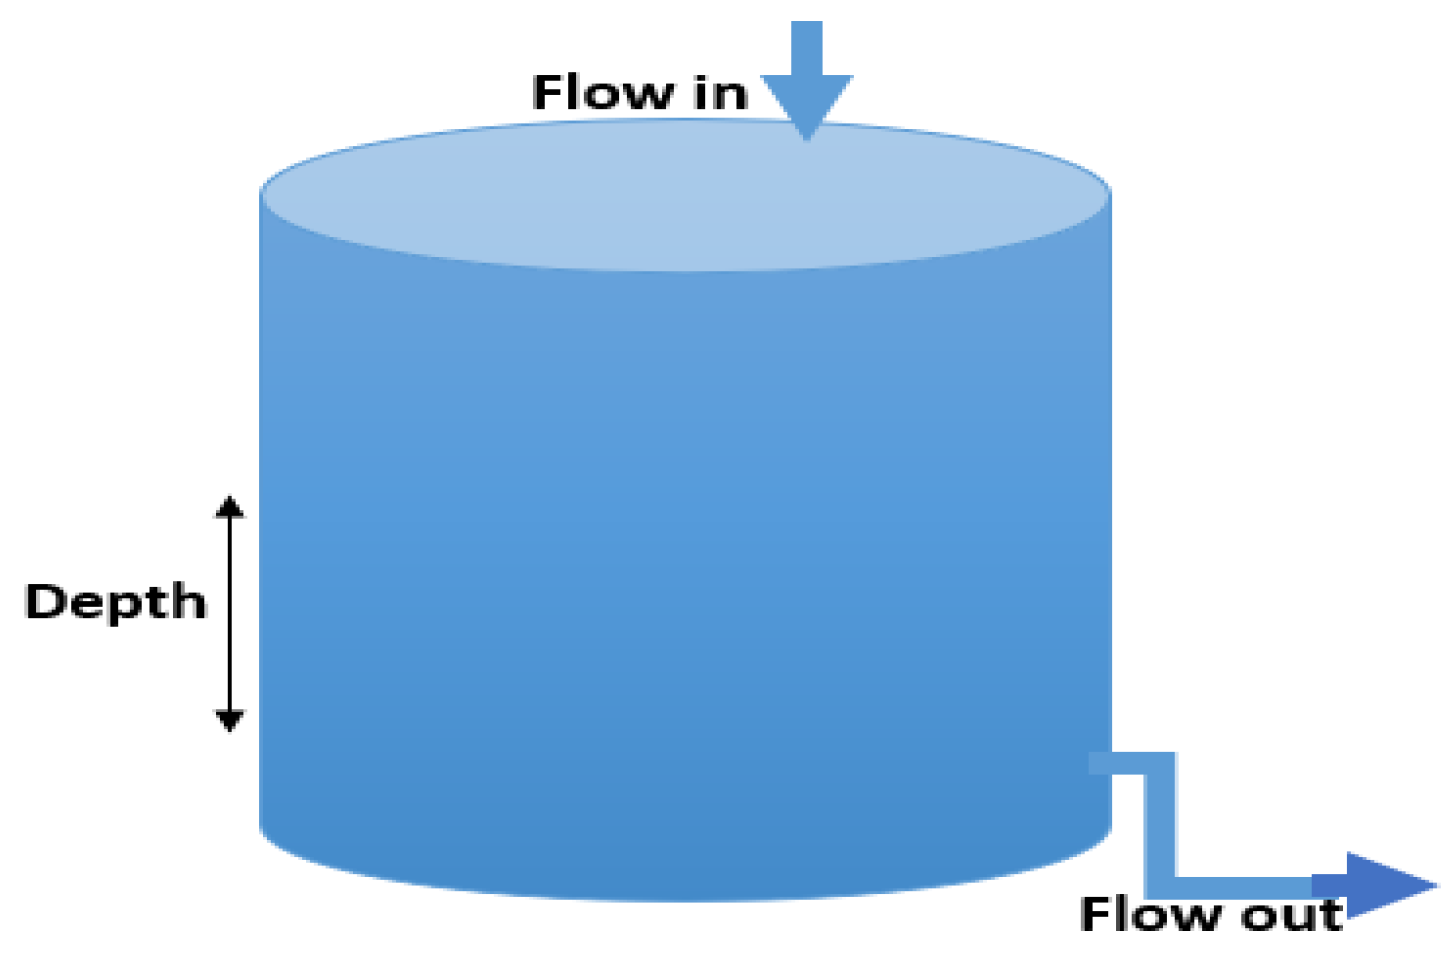
Figure 4.
Fuzzy logic controller scheme.
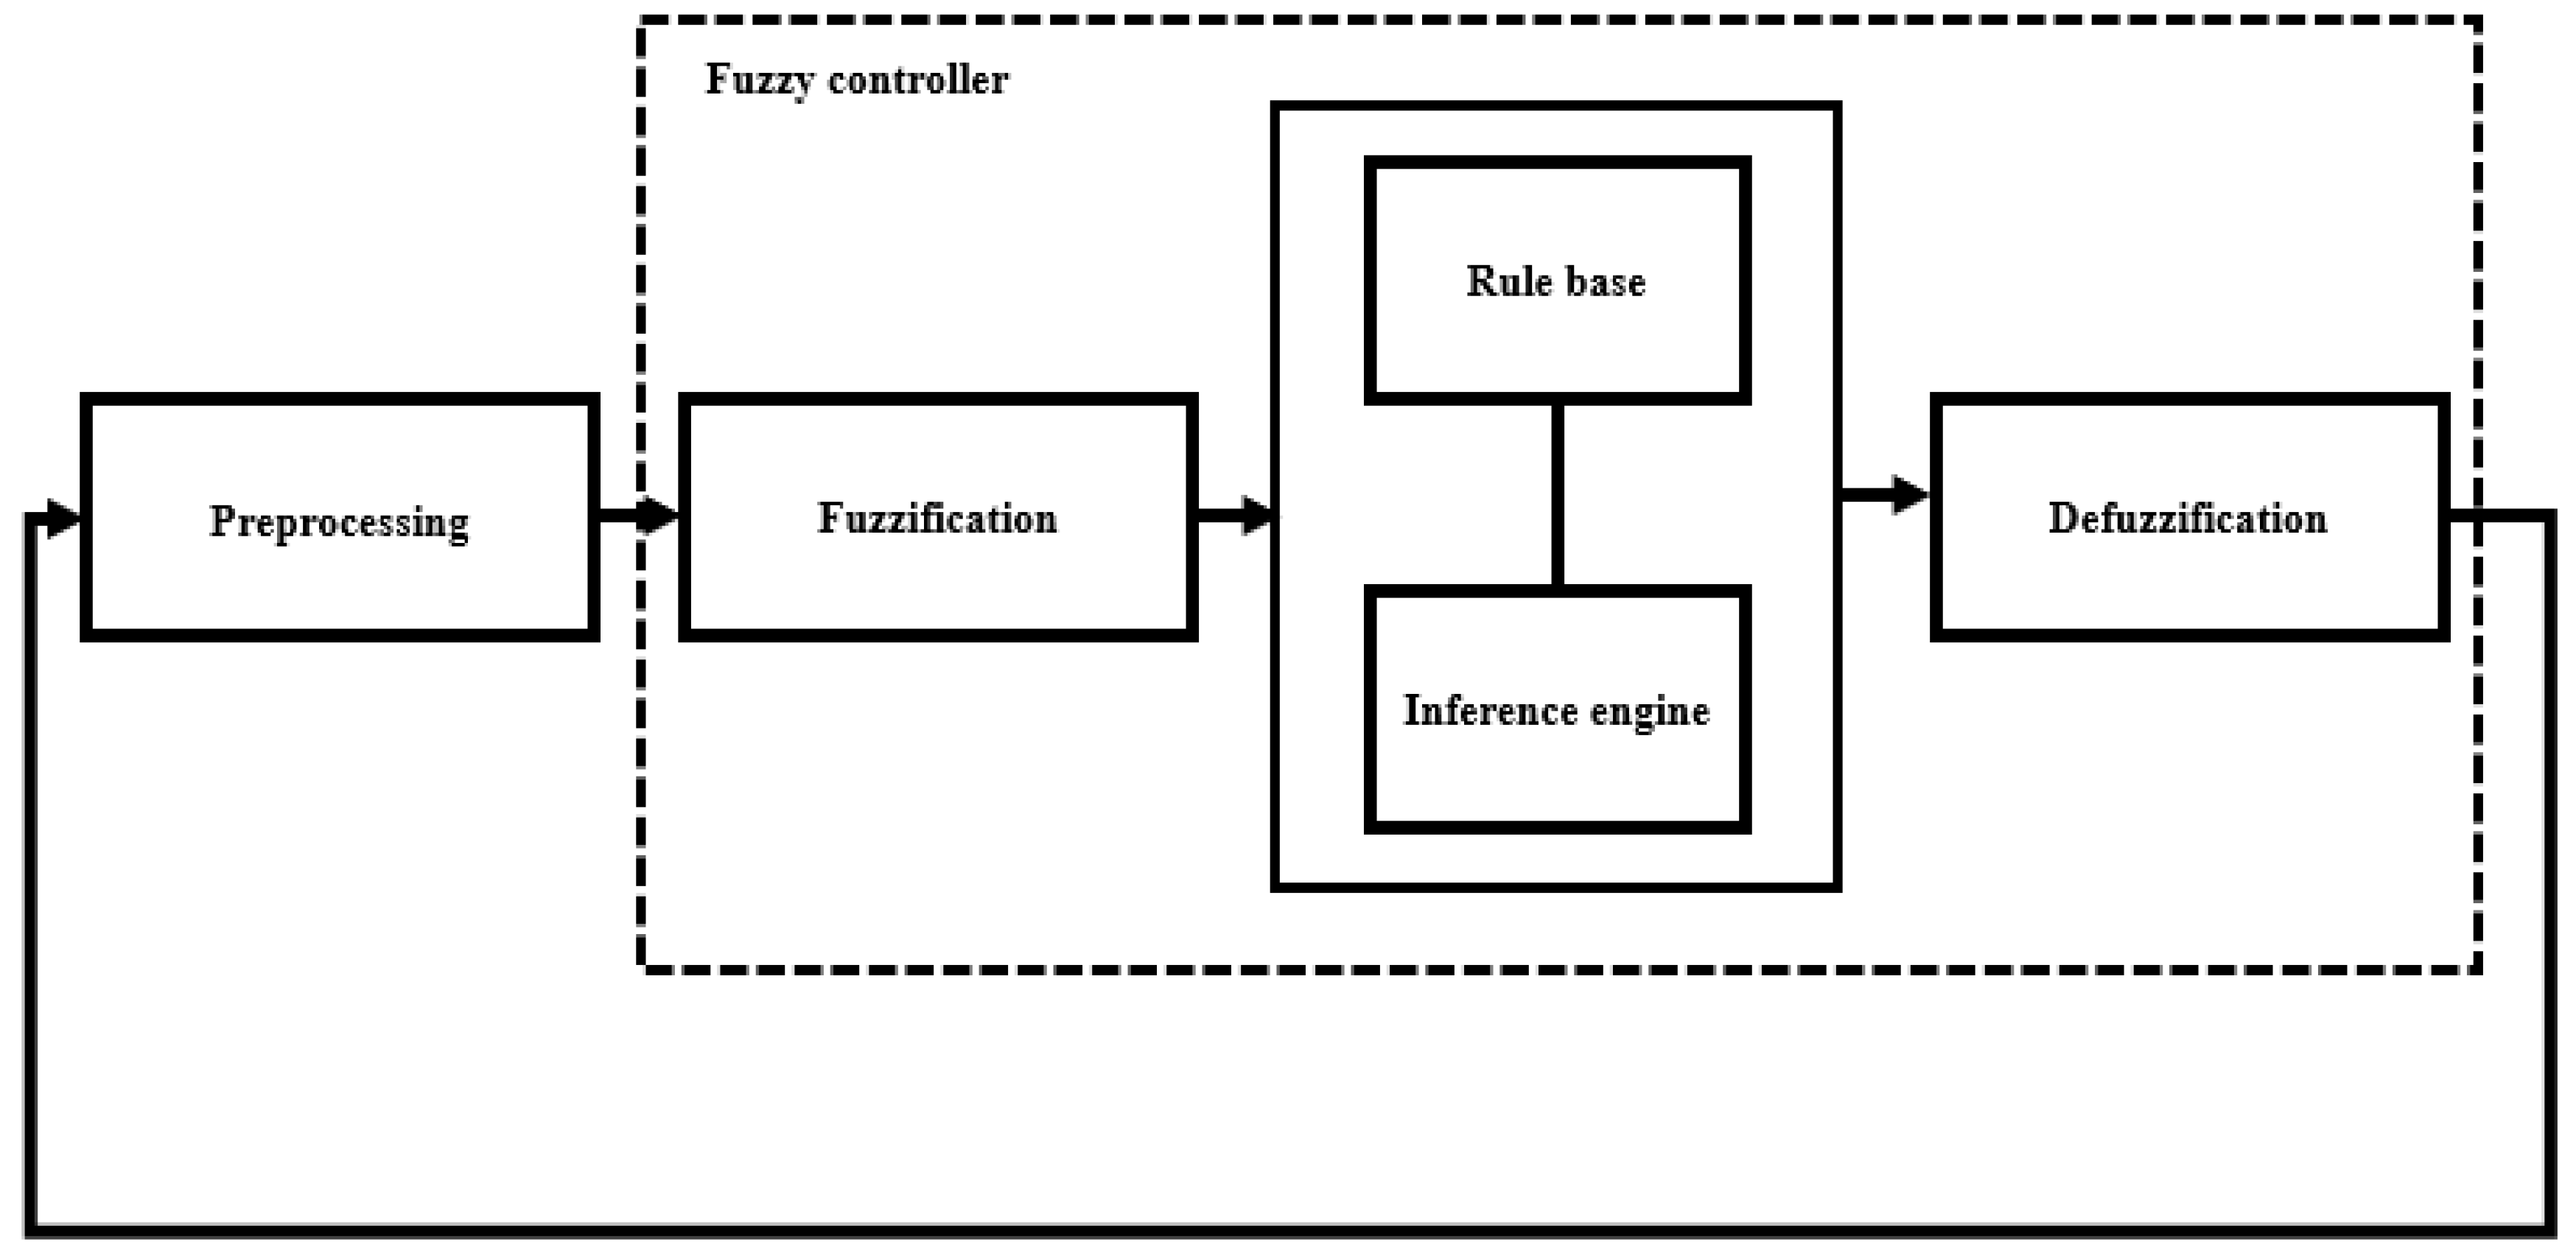
Figure 5.
Fuzzy membership function for temperature.
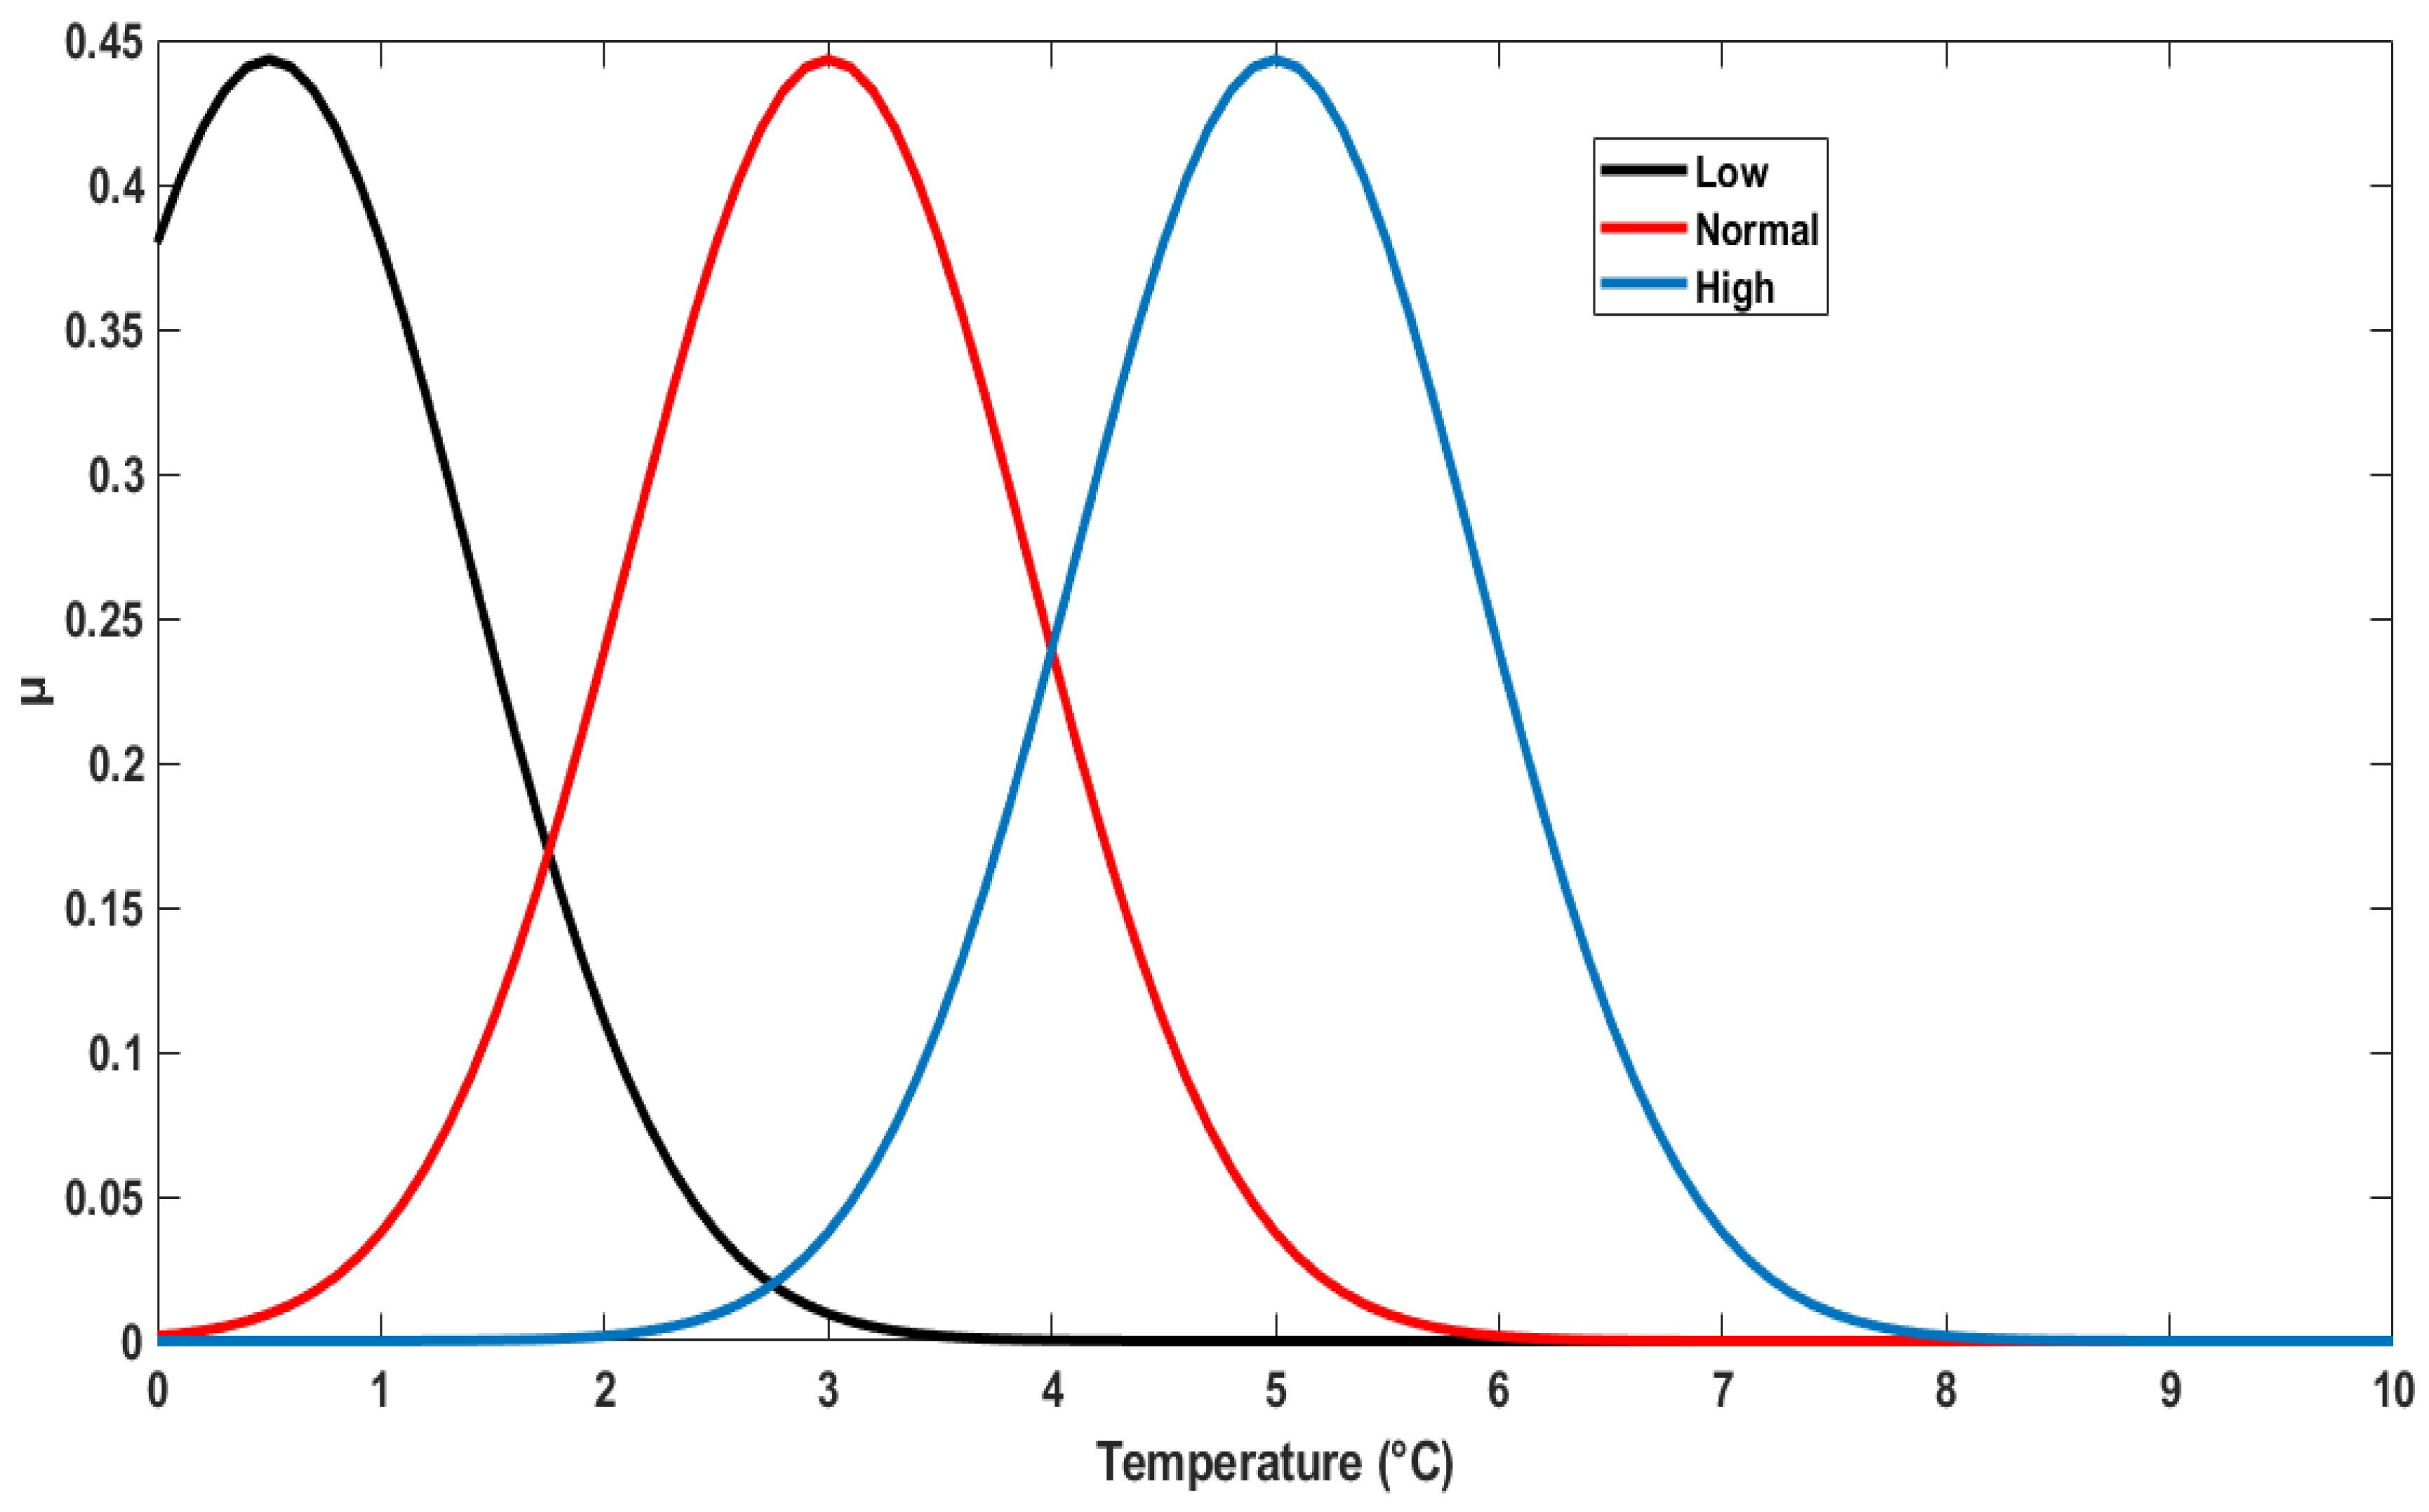
Figure 6.
Fuzzy membership function for humidity.
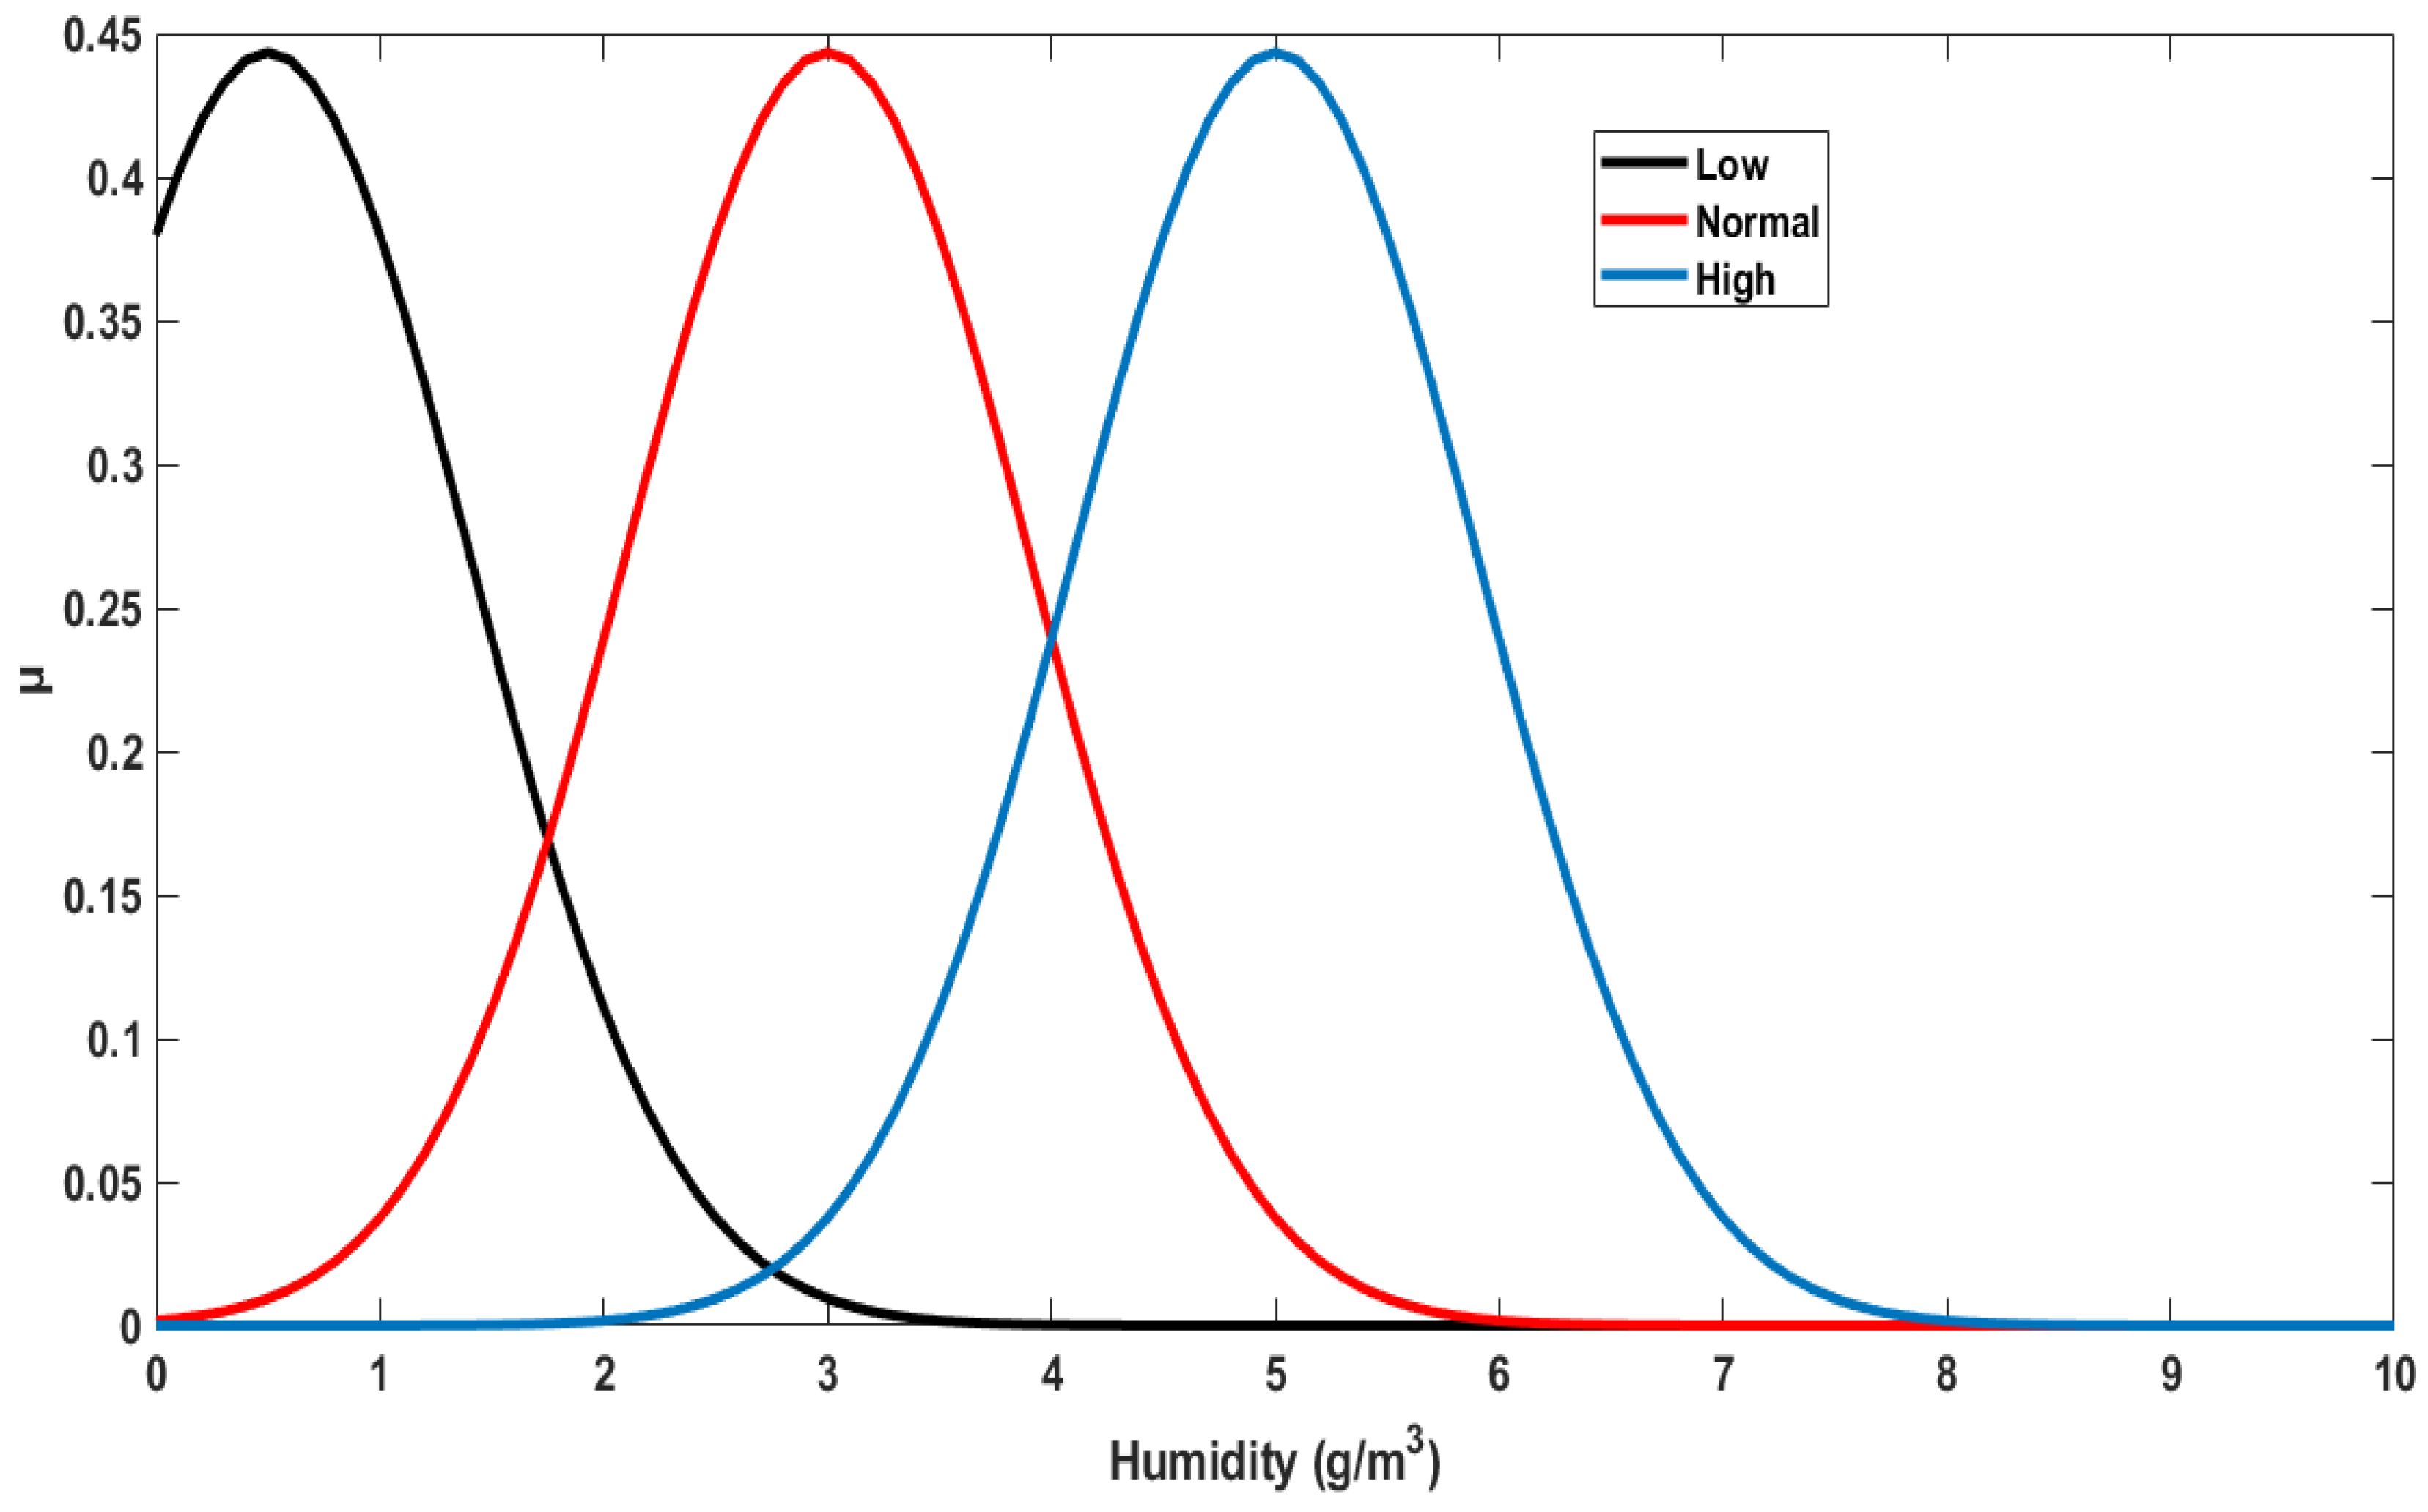
Figure 7.
Fuzzy membership function for soil moisture.

Figure 8.
Fuzzy membership function for opening valve.
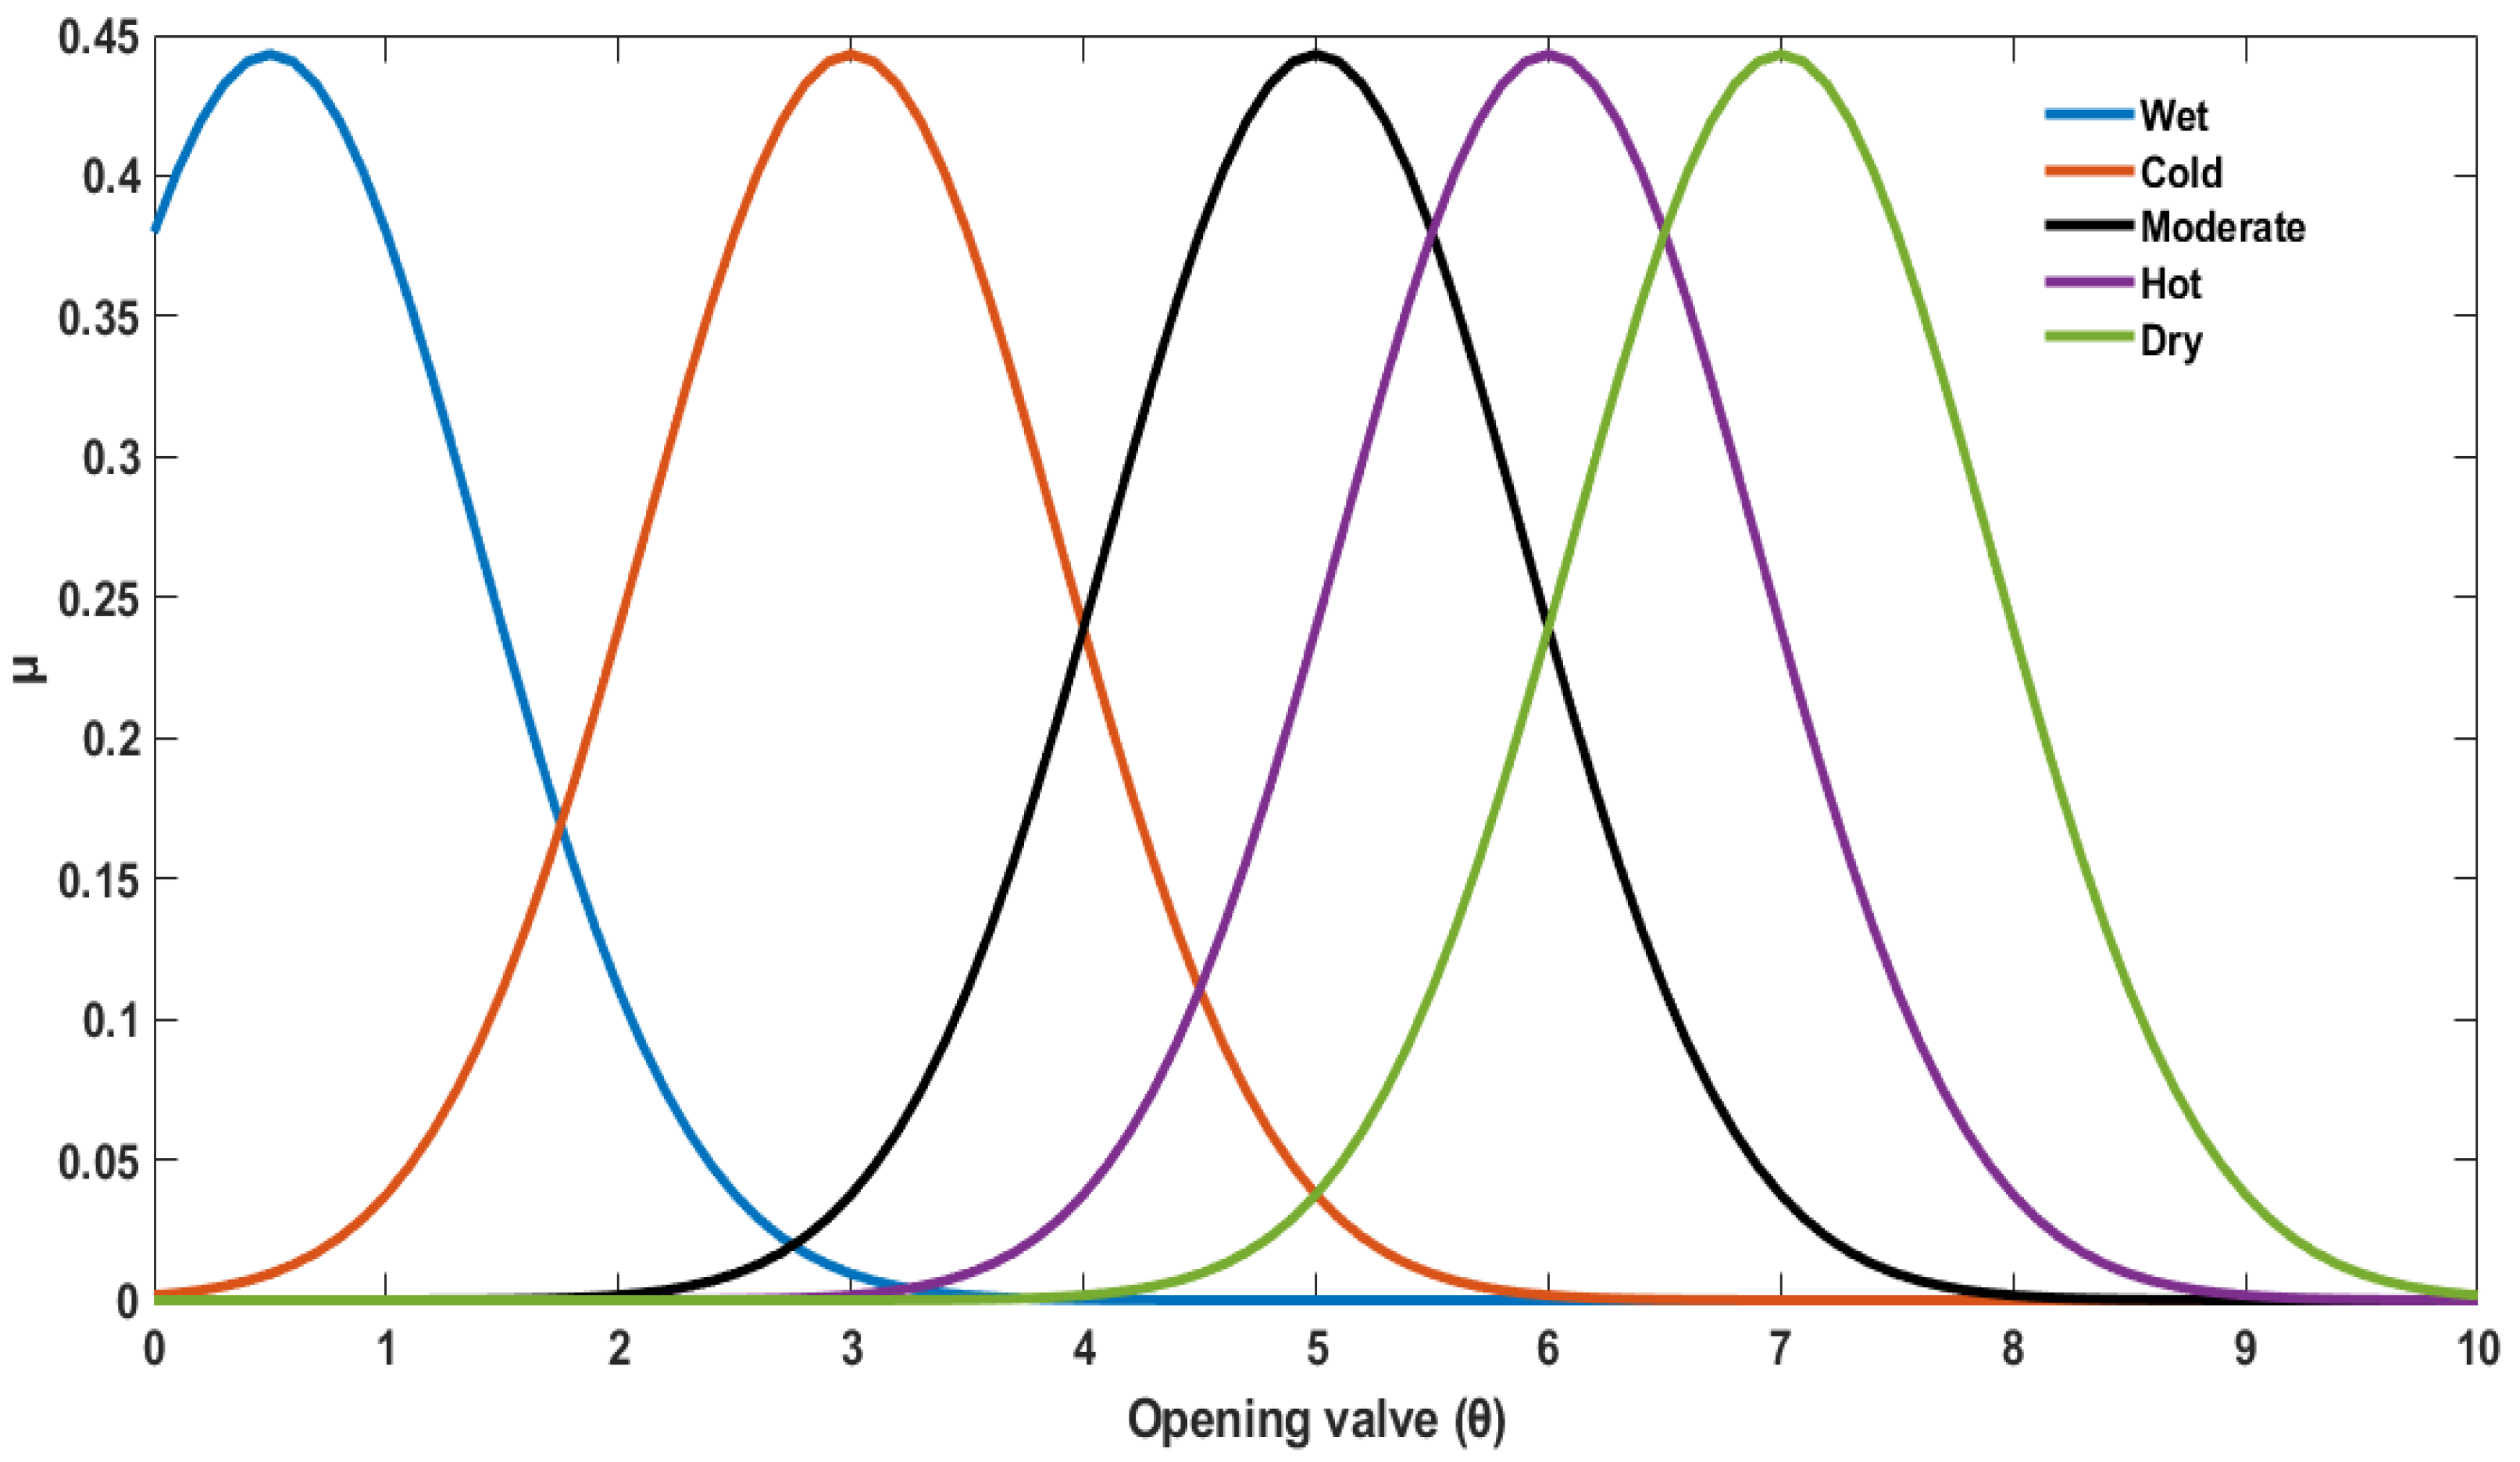
Figure 9.
Rules of the fuzzy interface system.
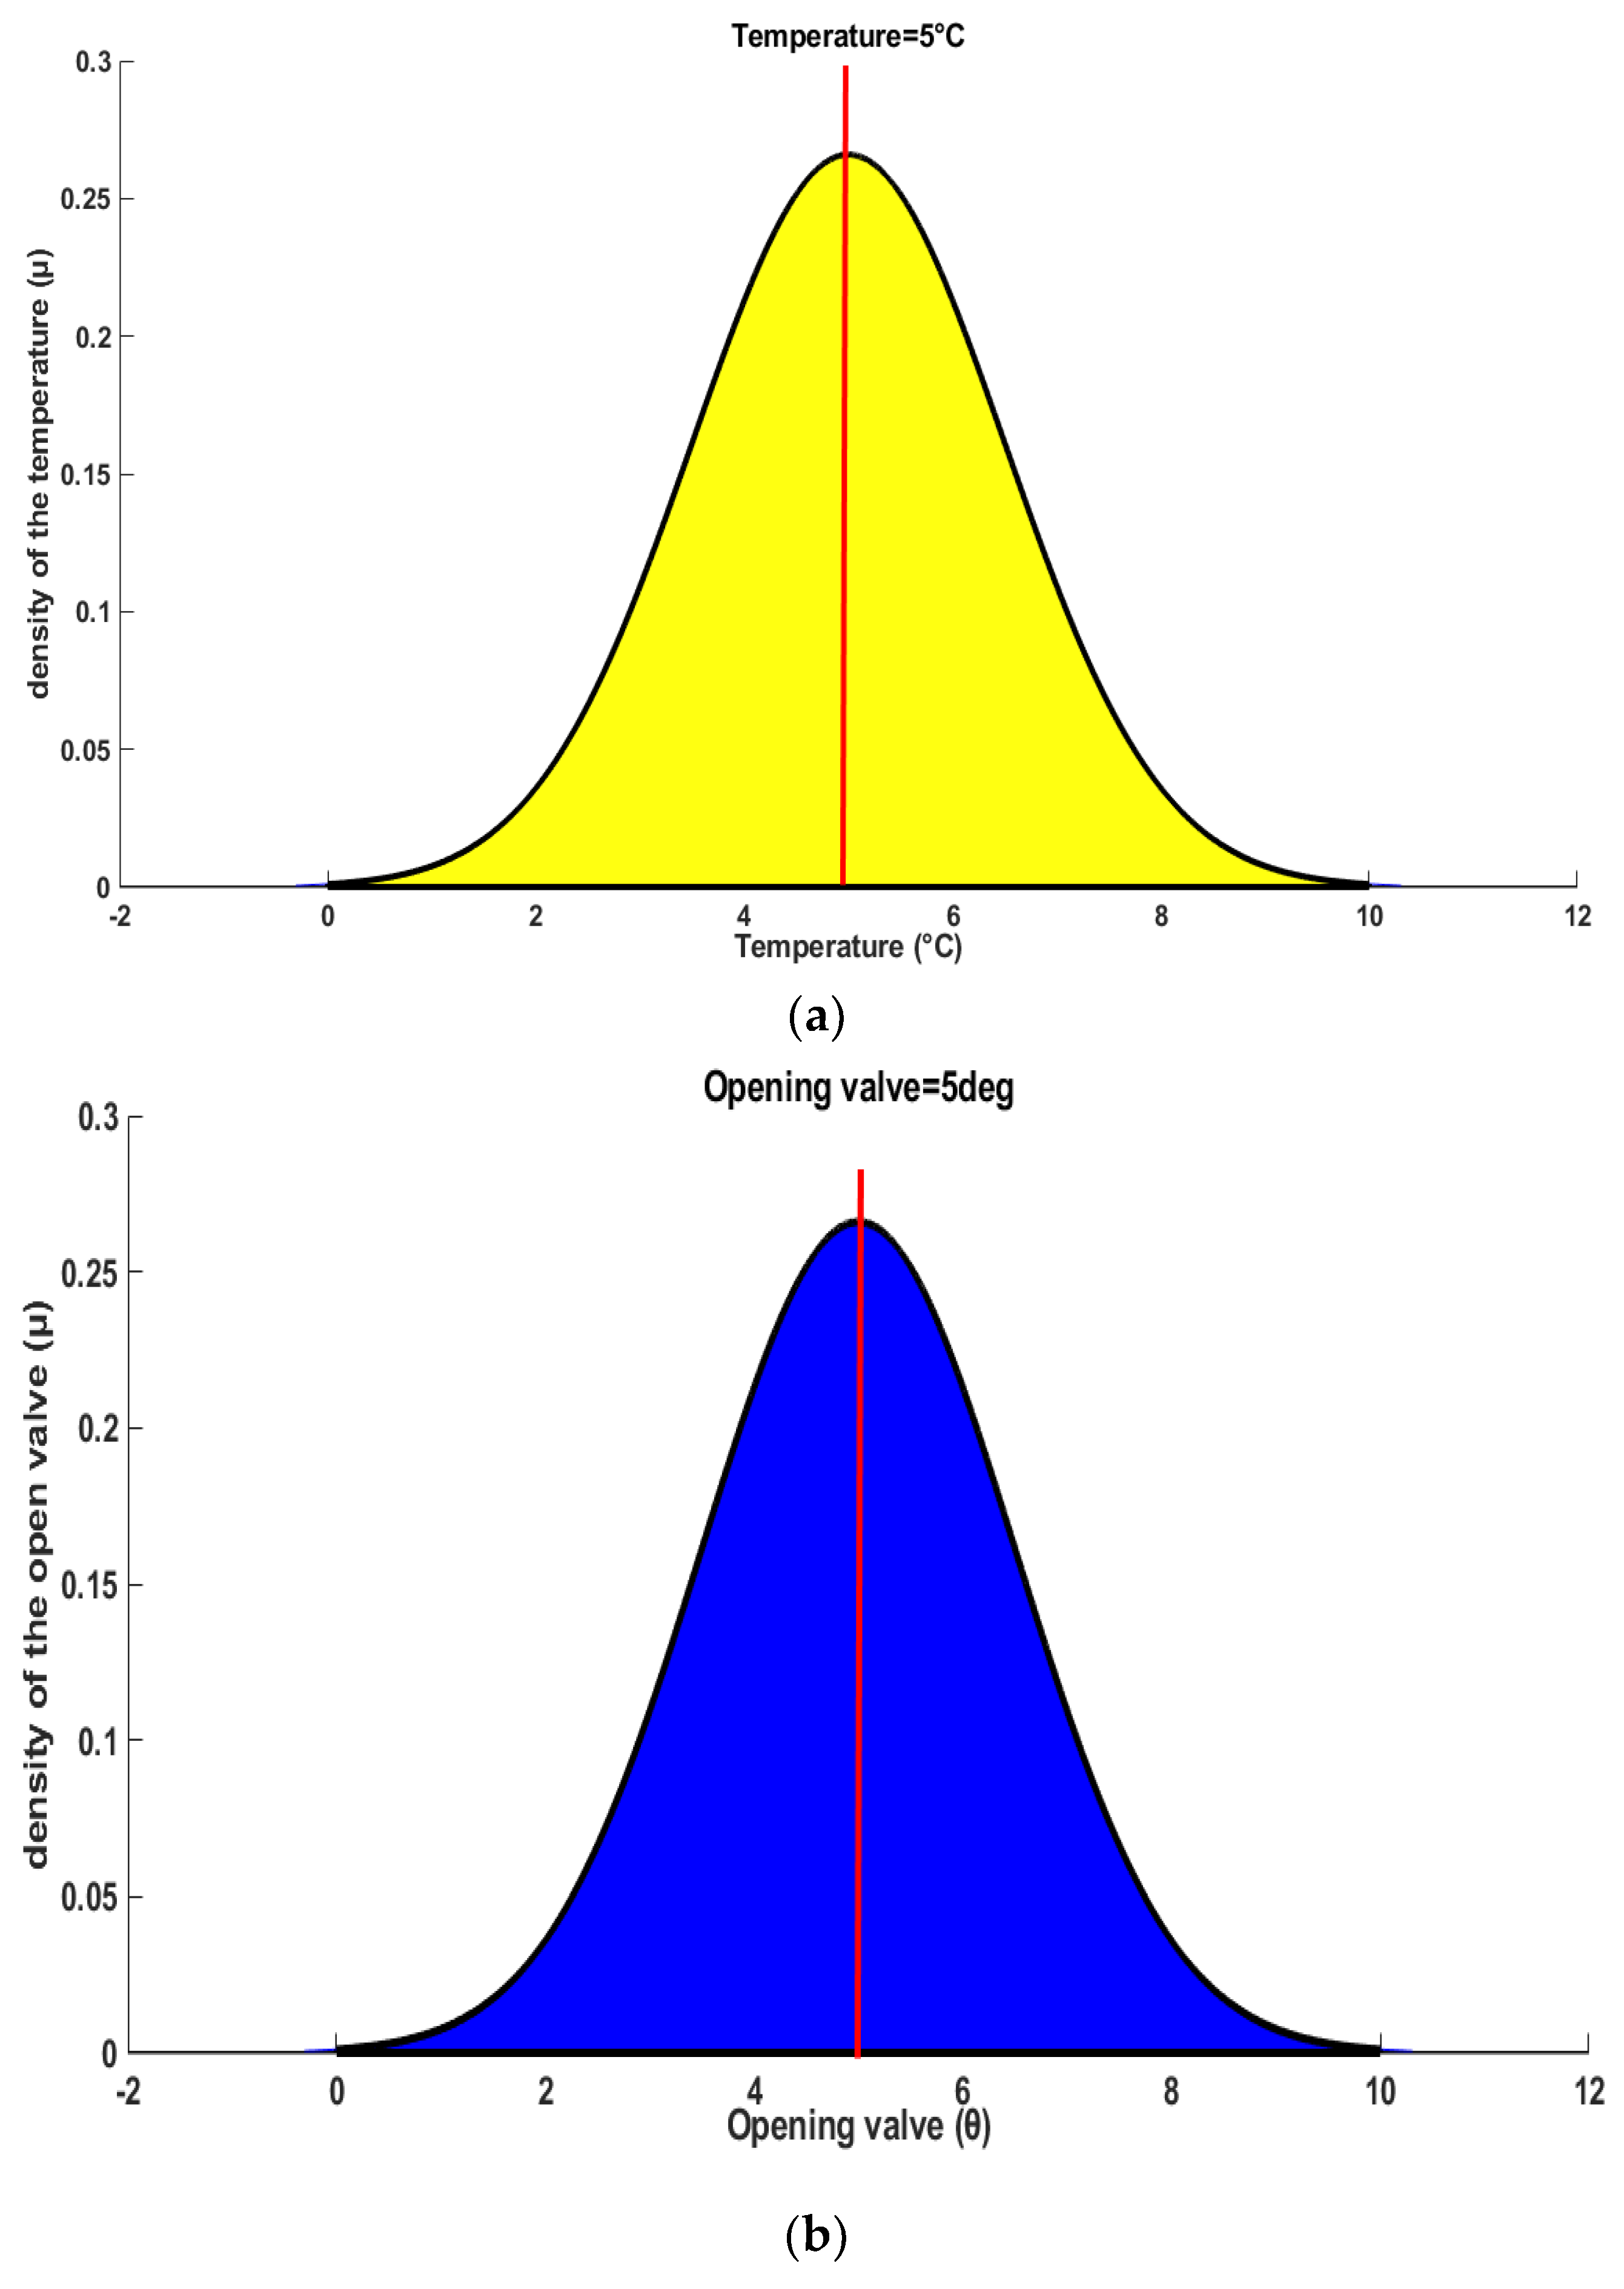
Figure 10.
Fuzzy logic rule surface.
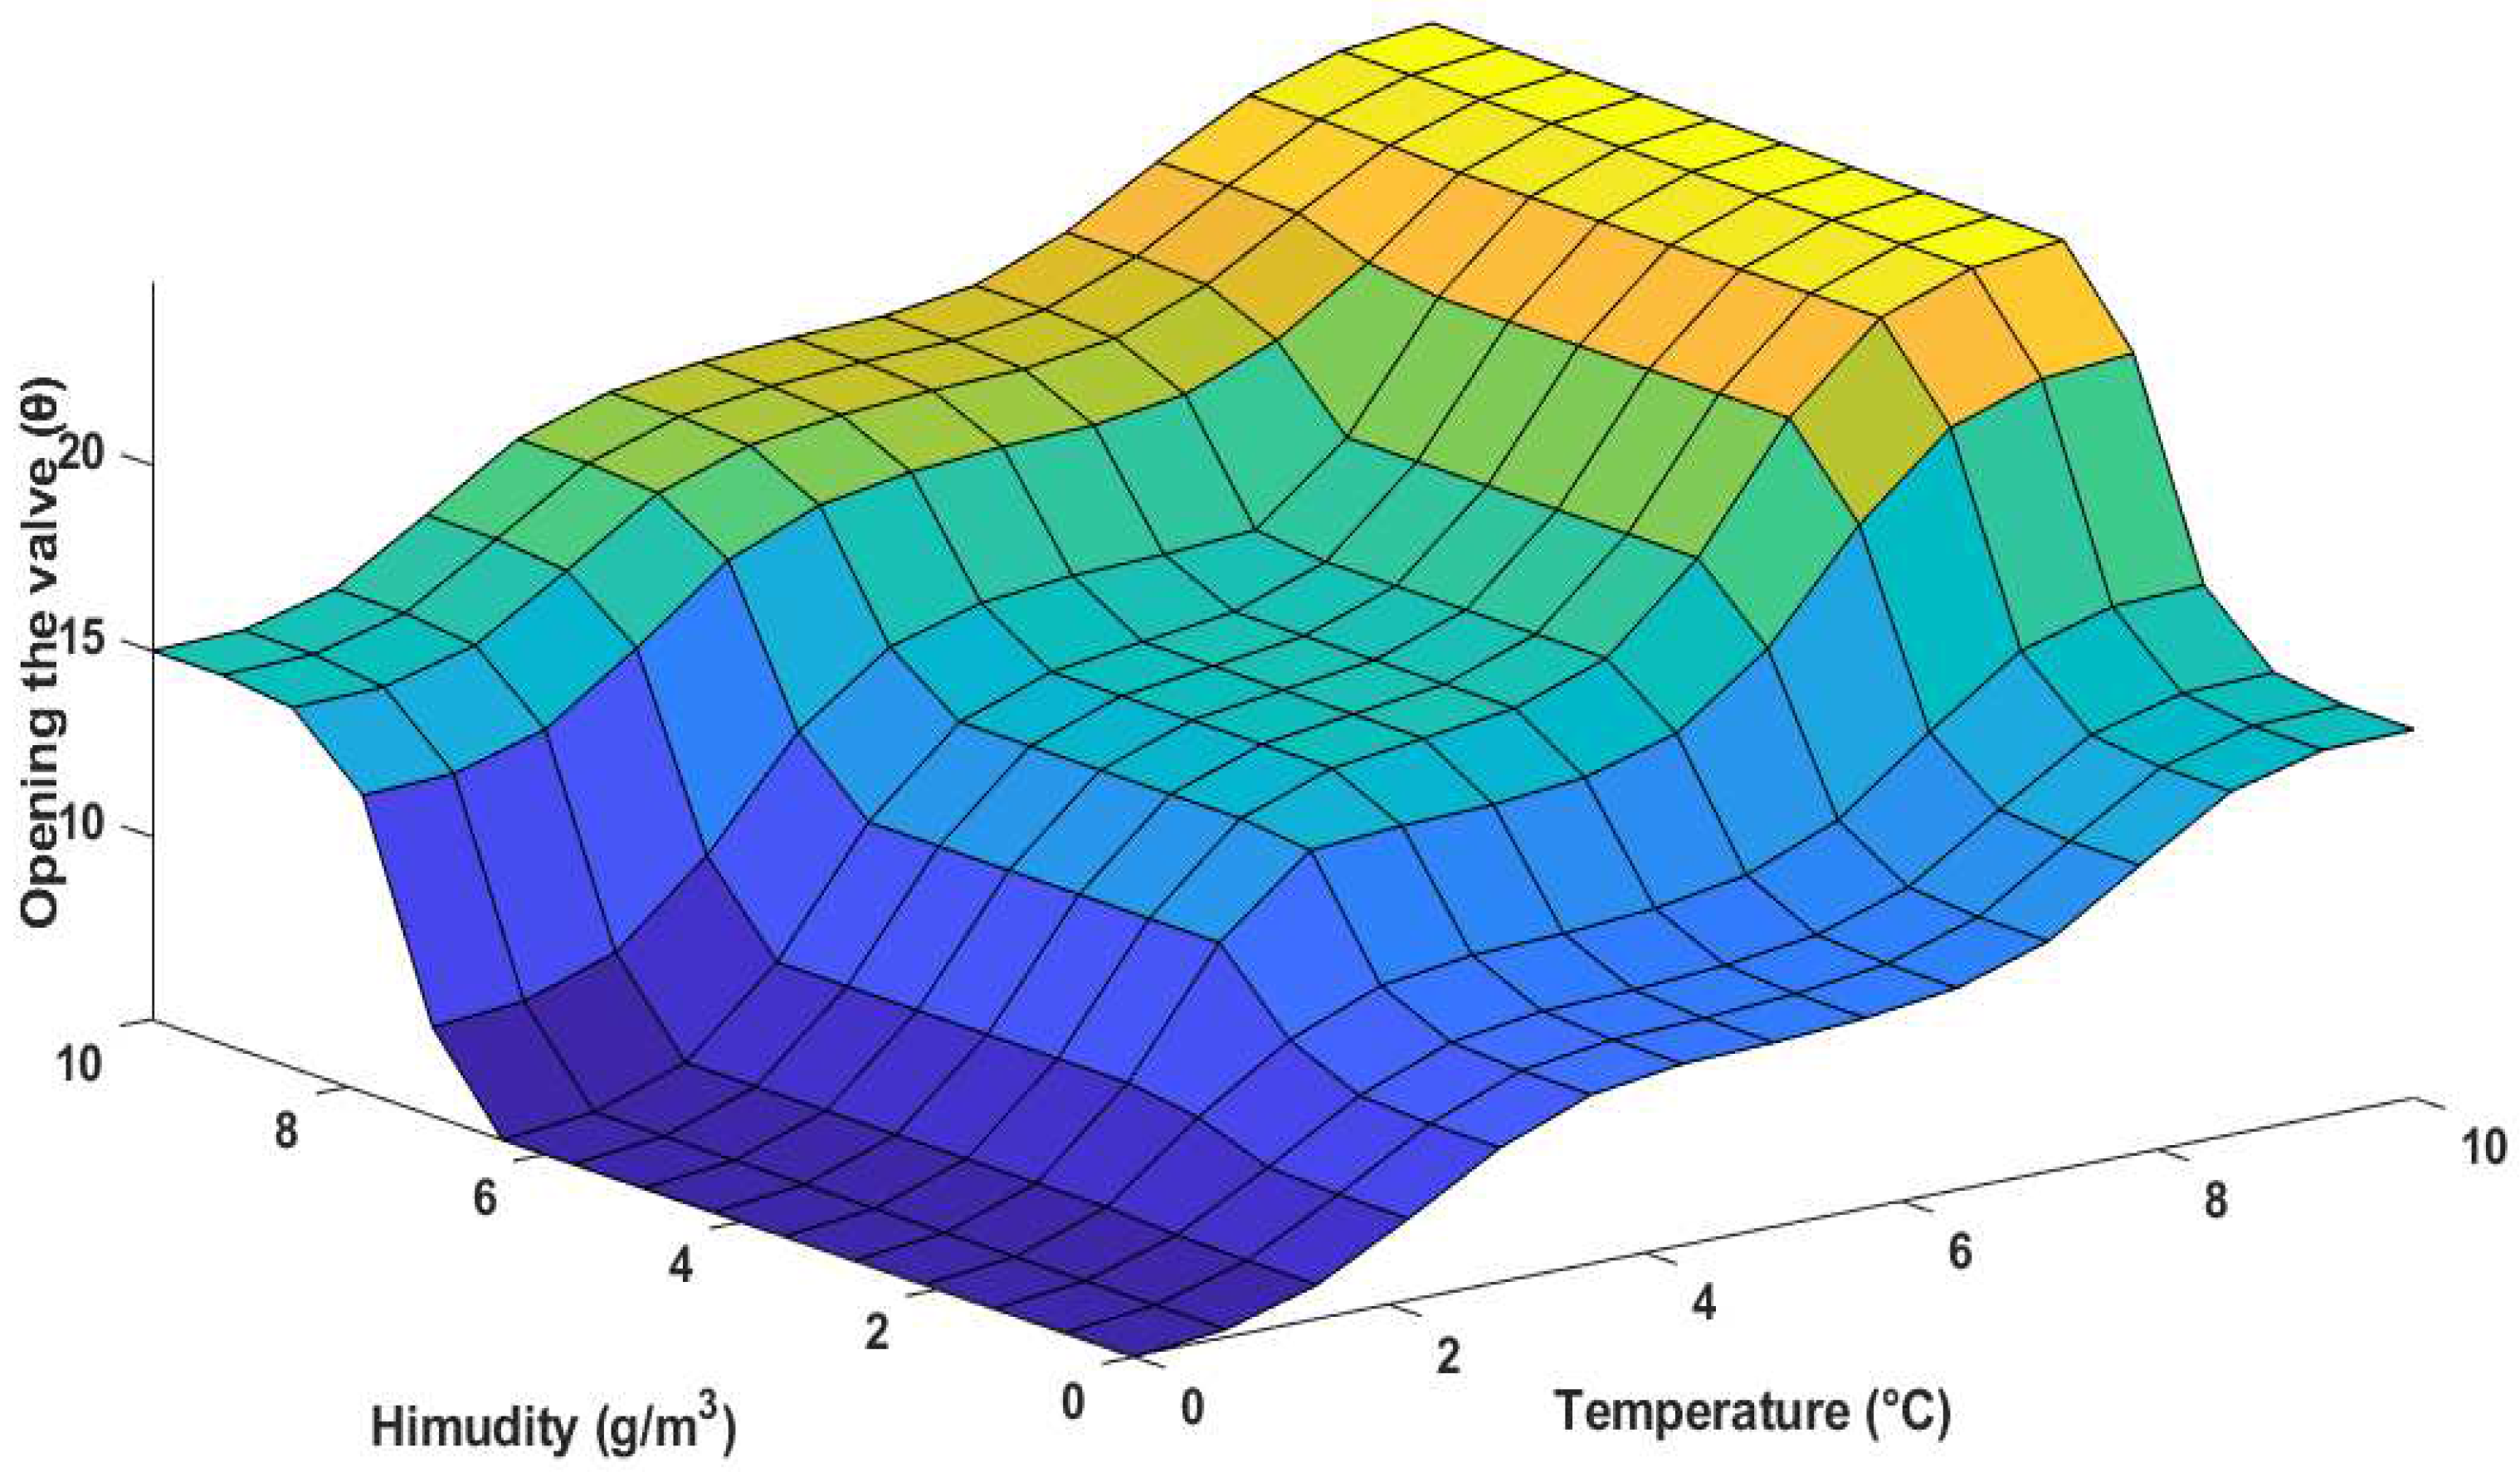
Figure 11.
Block diagram of smart agriculture system.
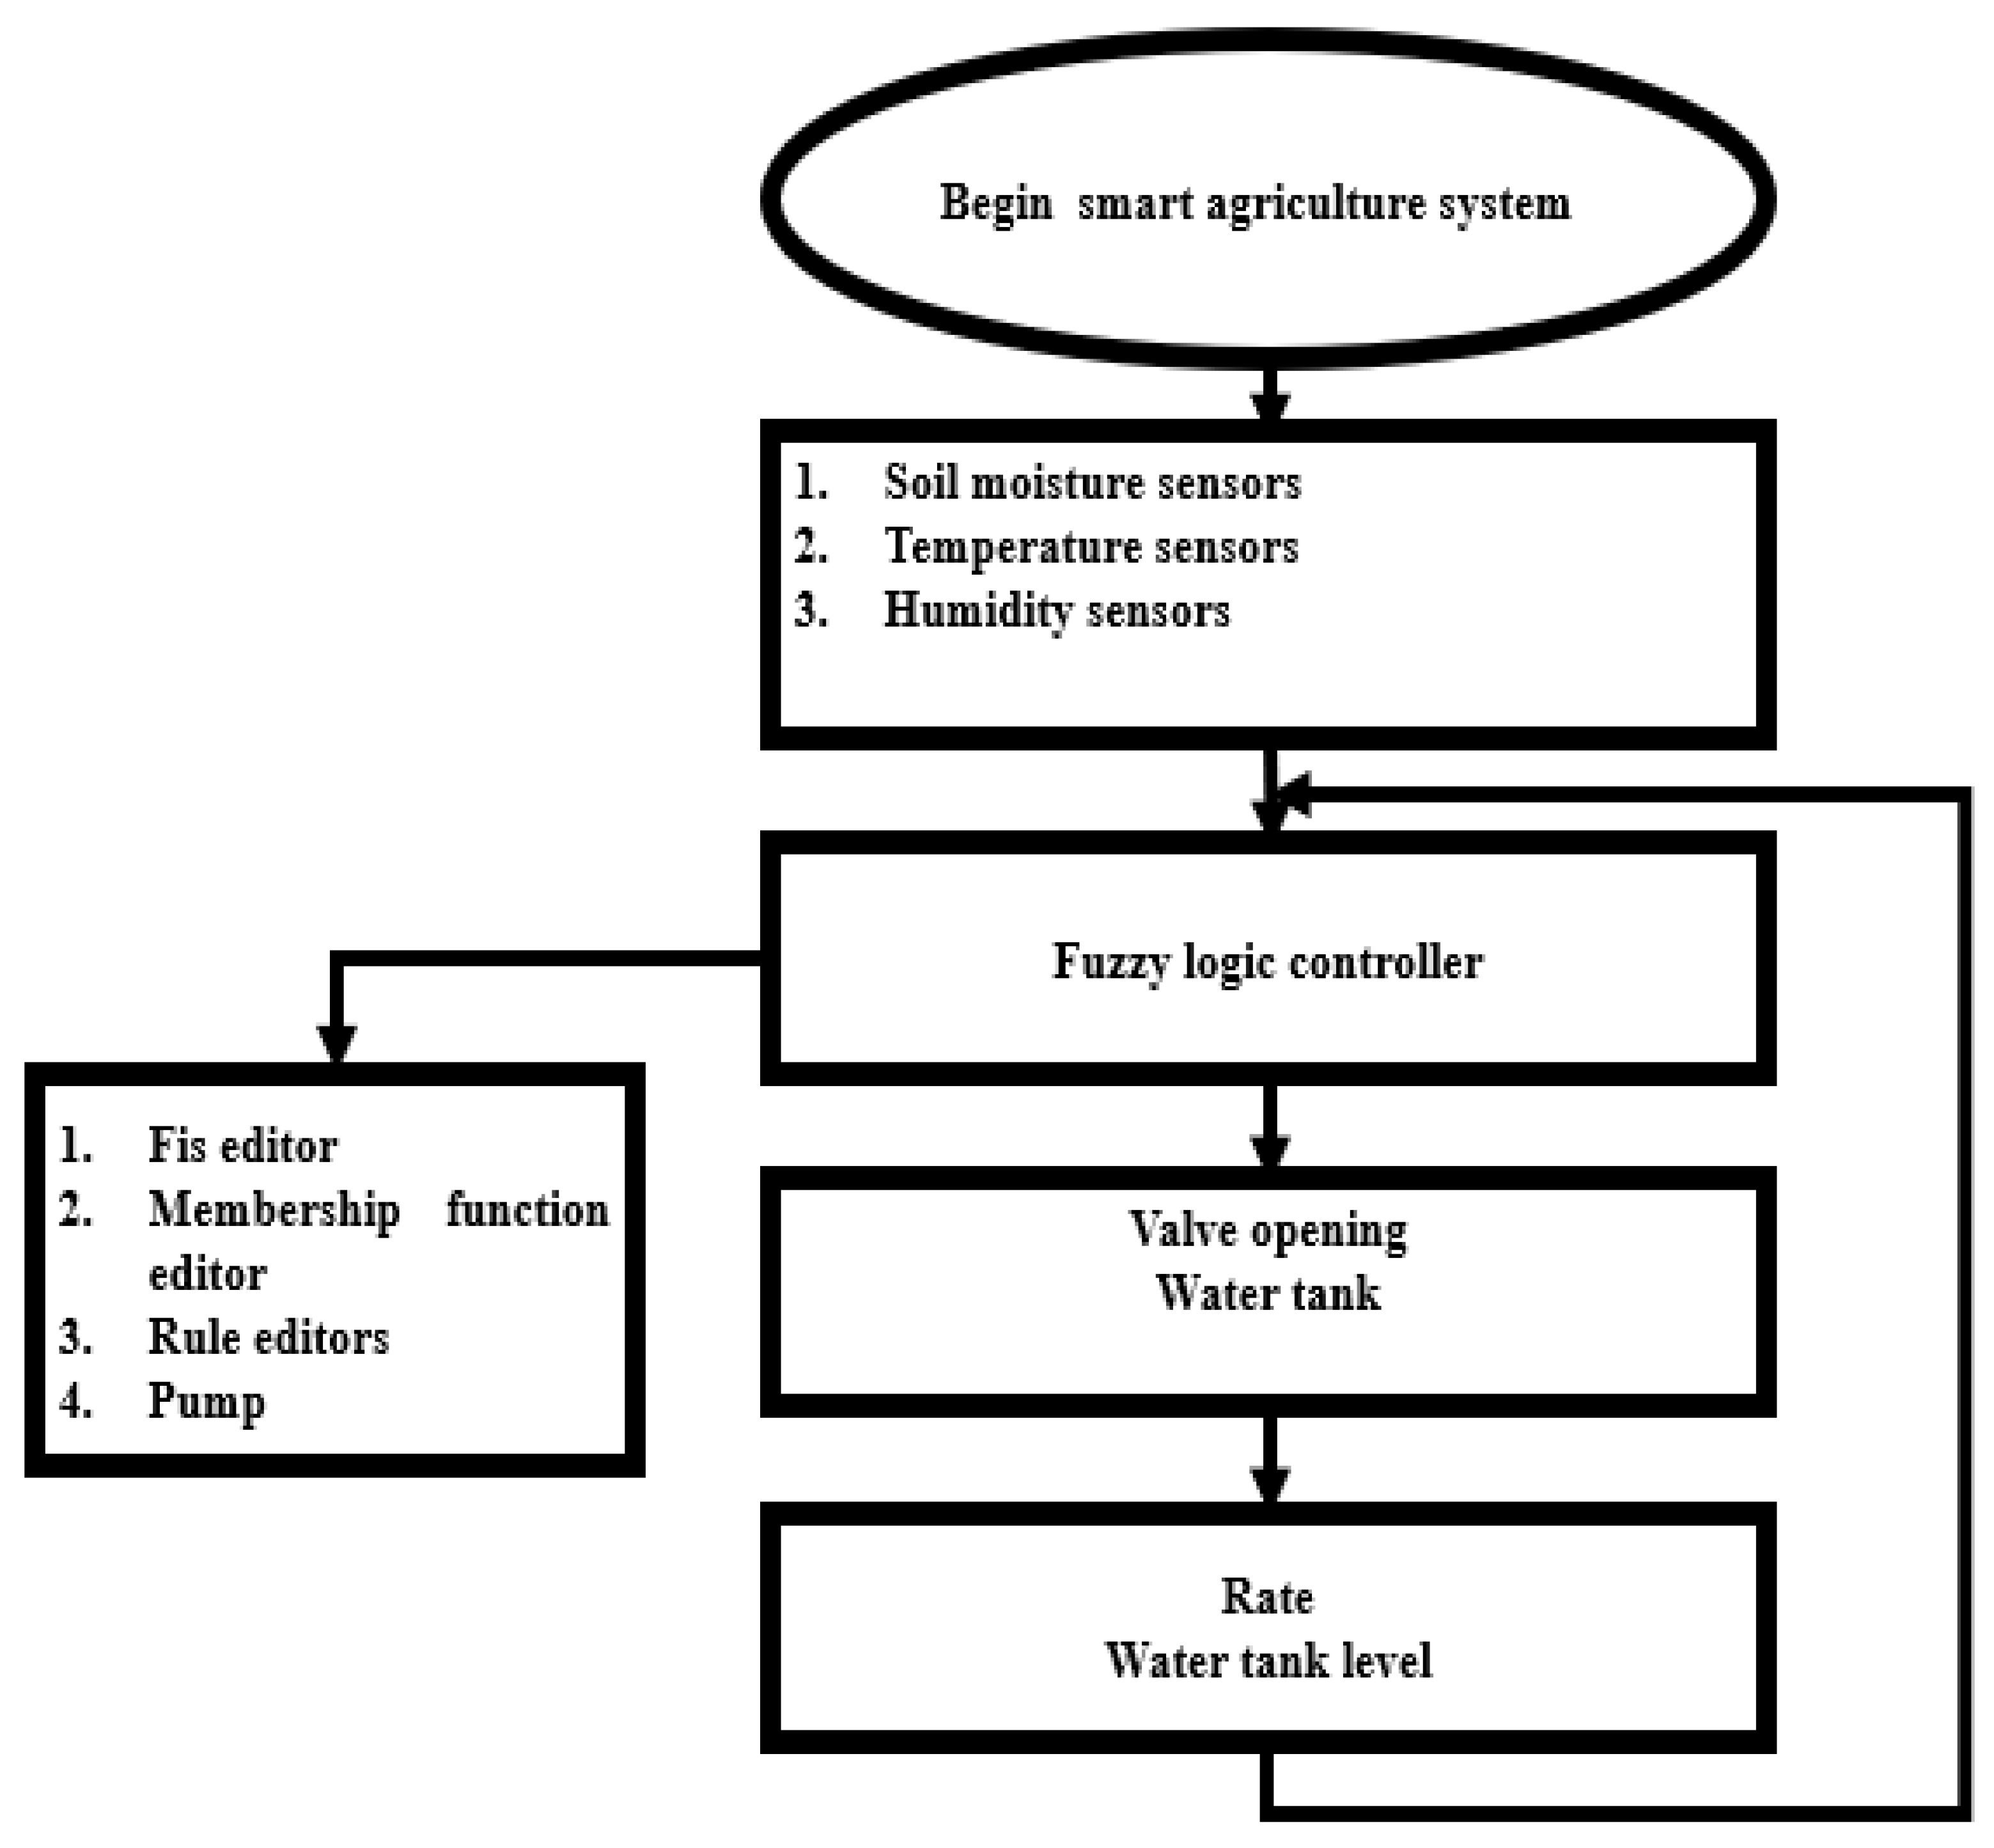
Figure 12.
Schematics of the model.
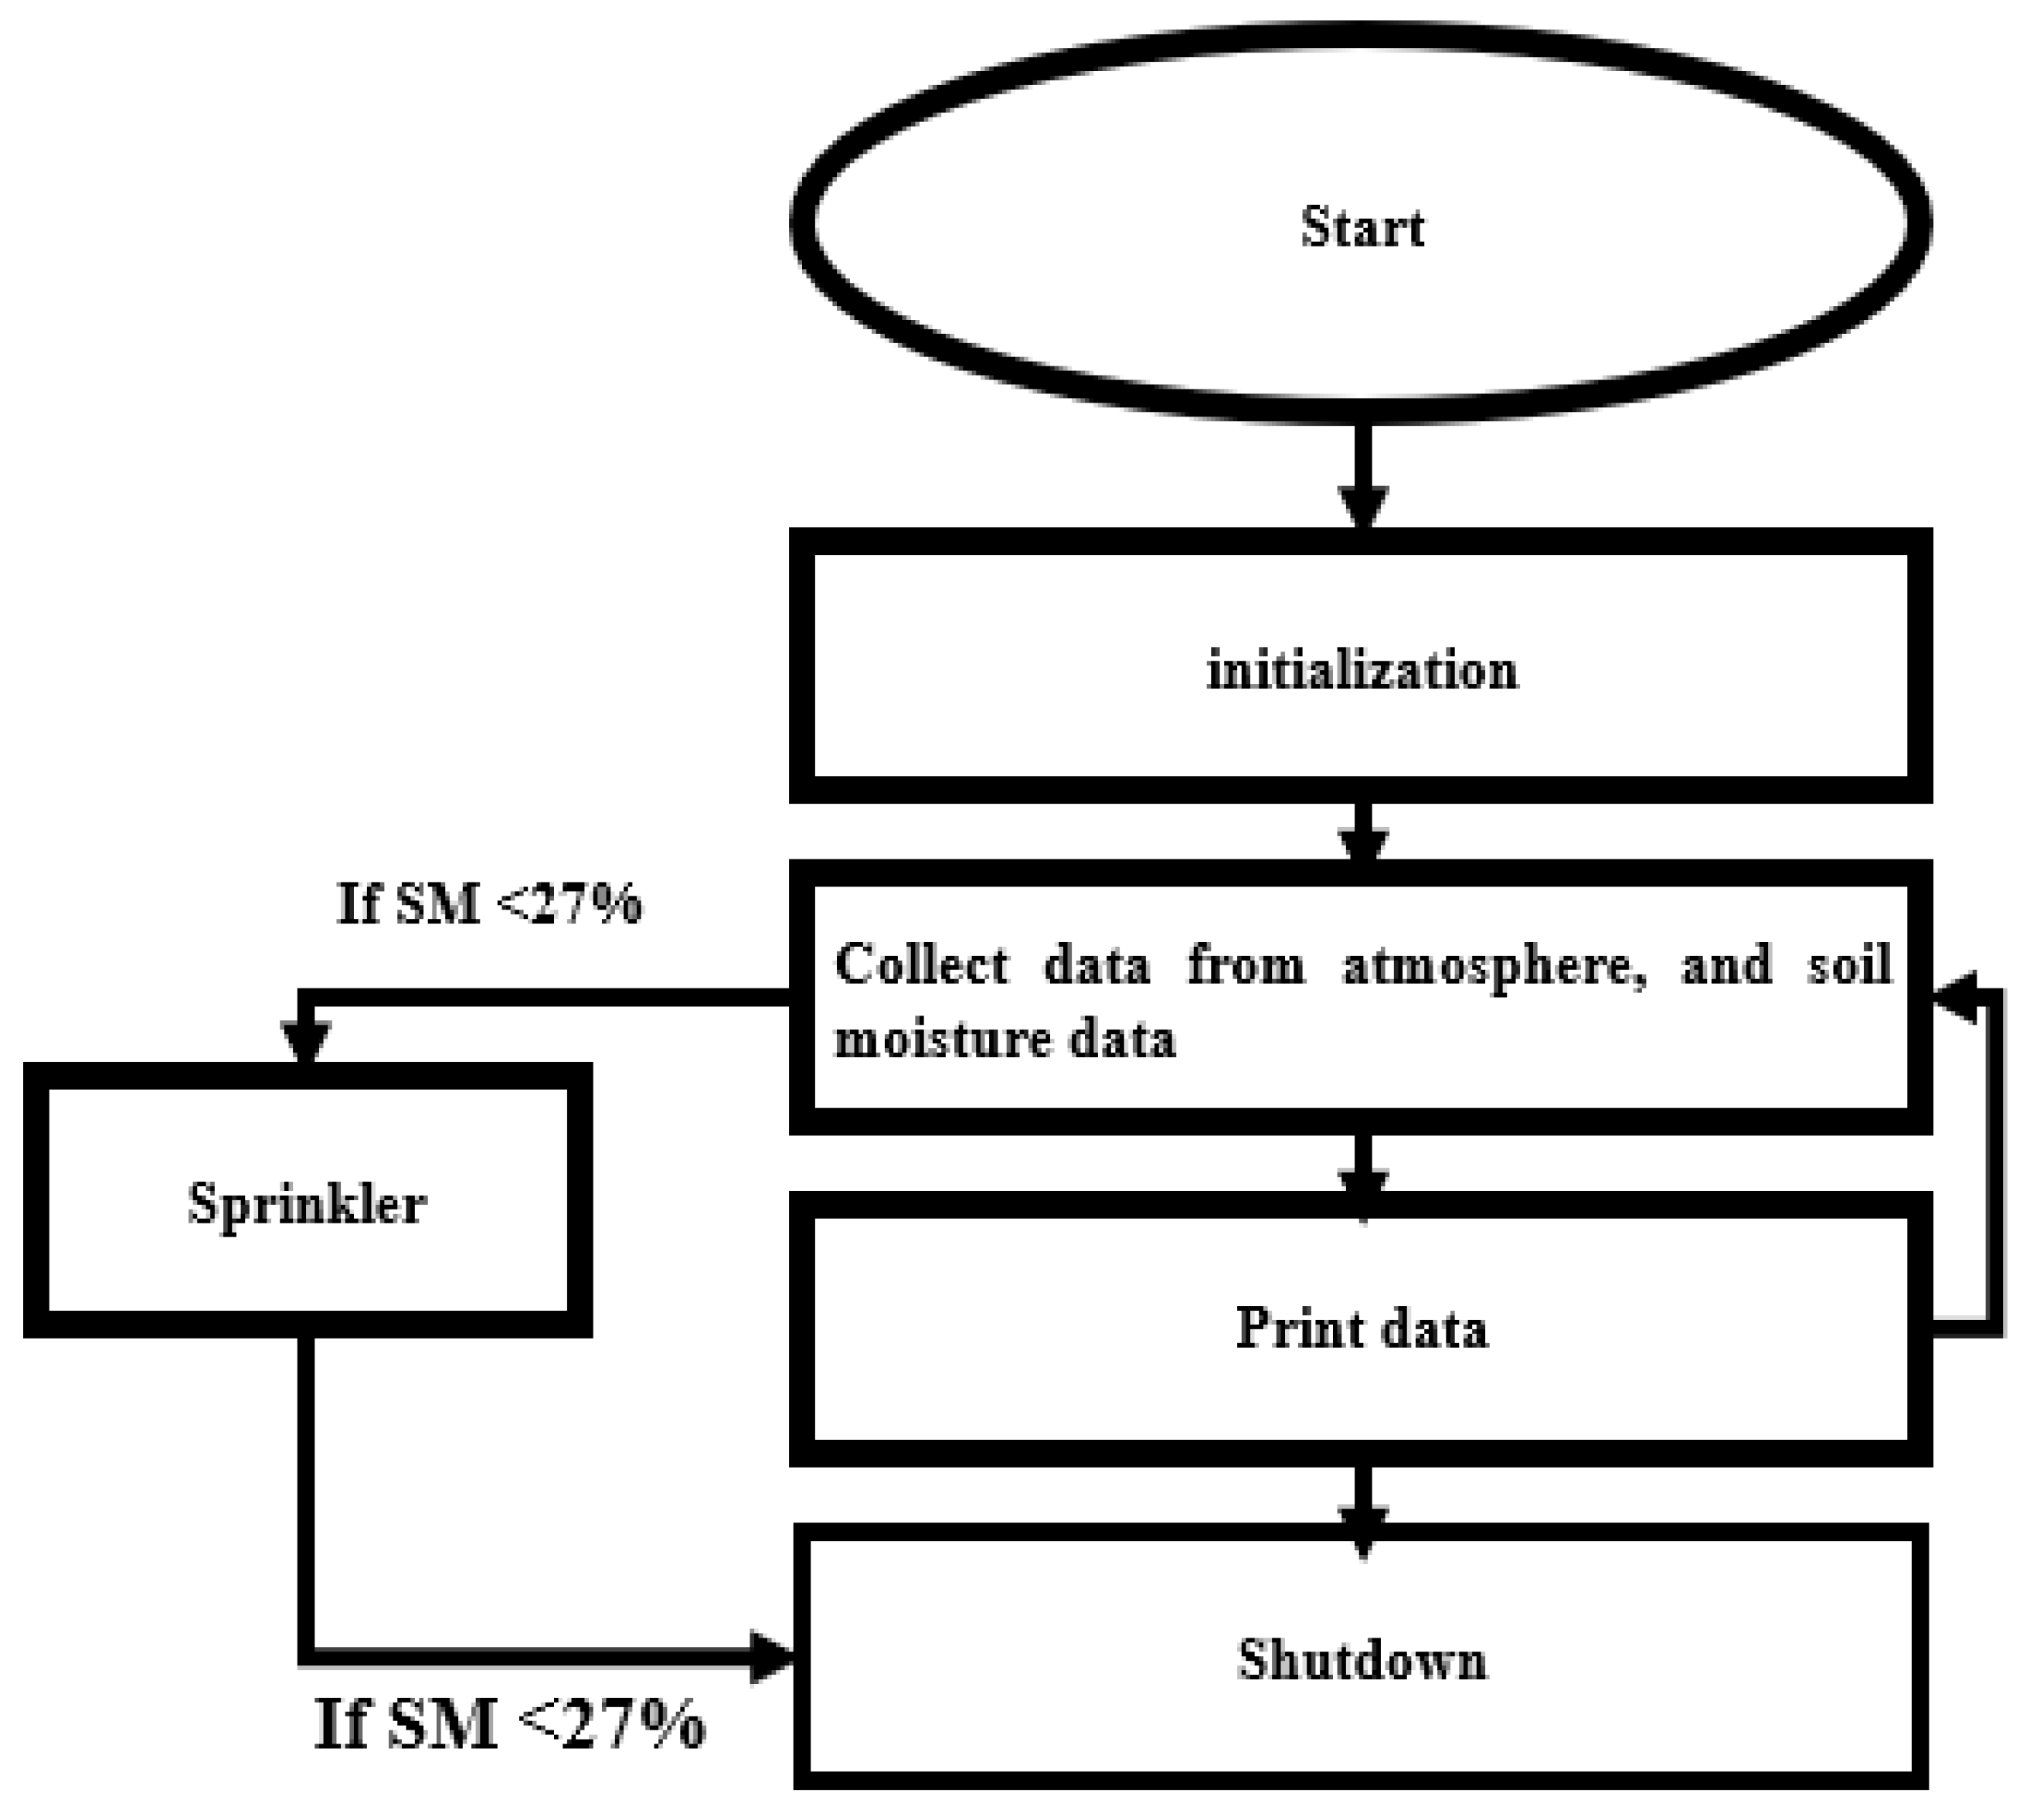
Figure 13.
Measurements of water level in agriculture fields.
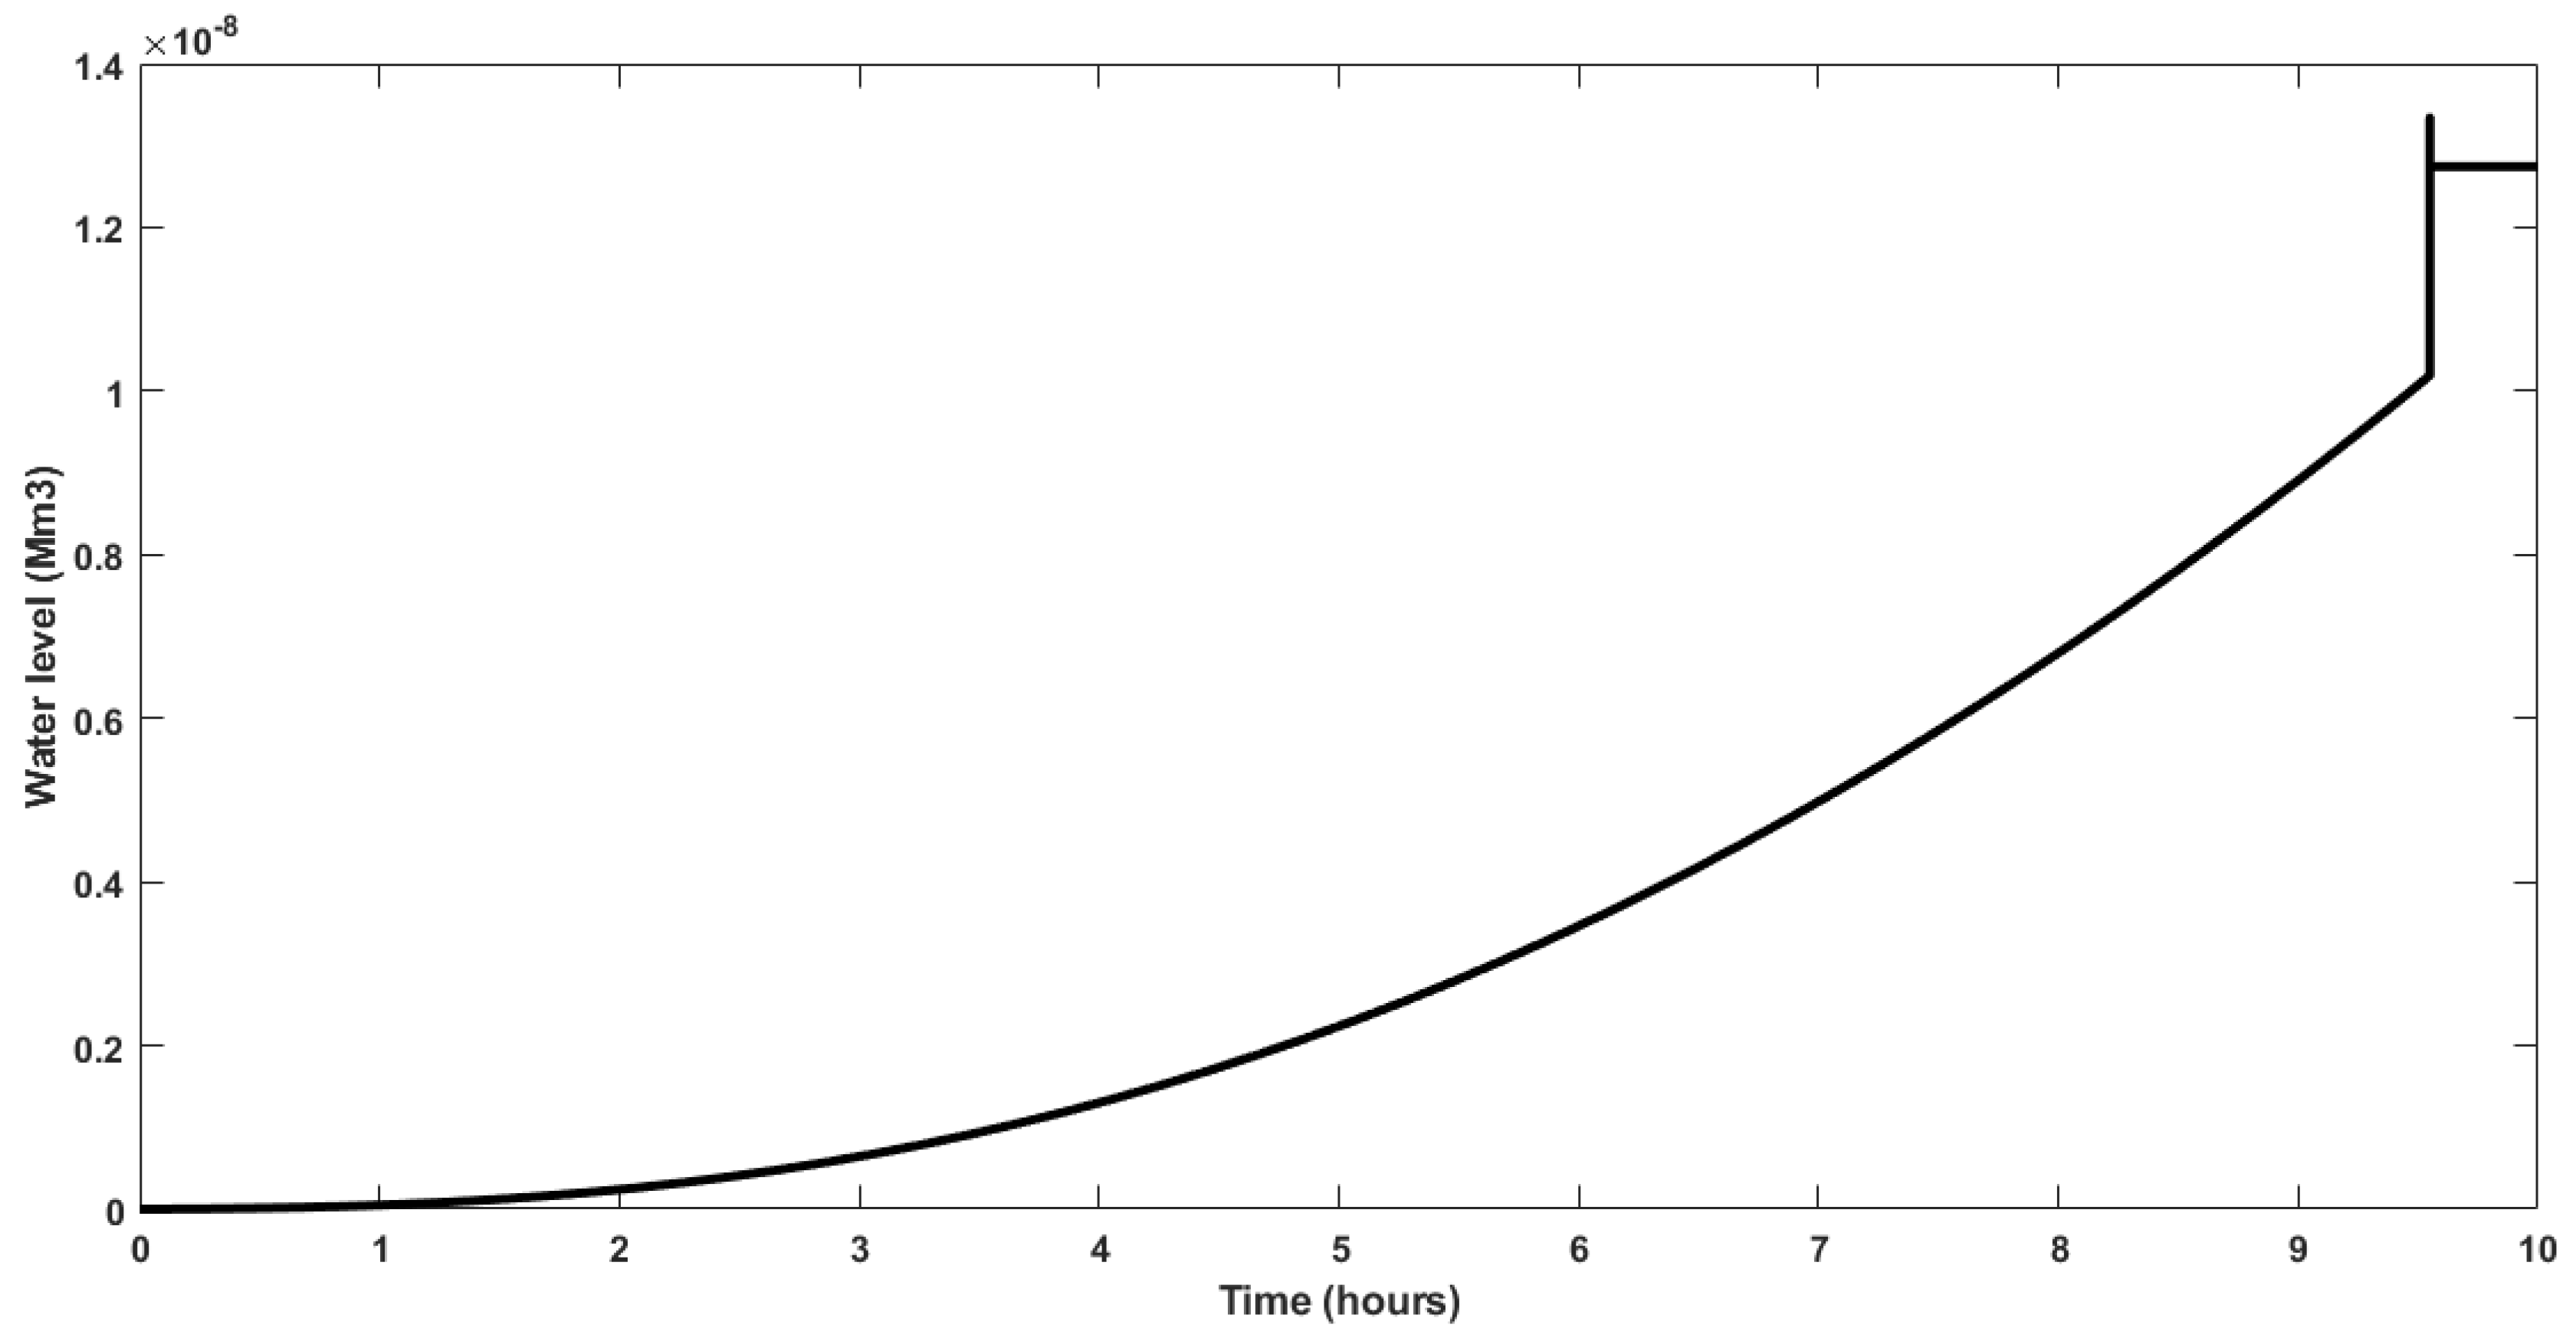
Figure 14.
Valve opening mechanism.
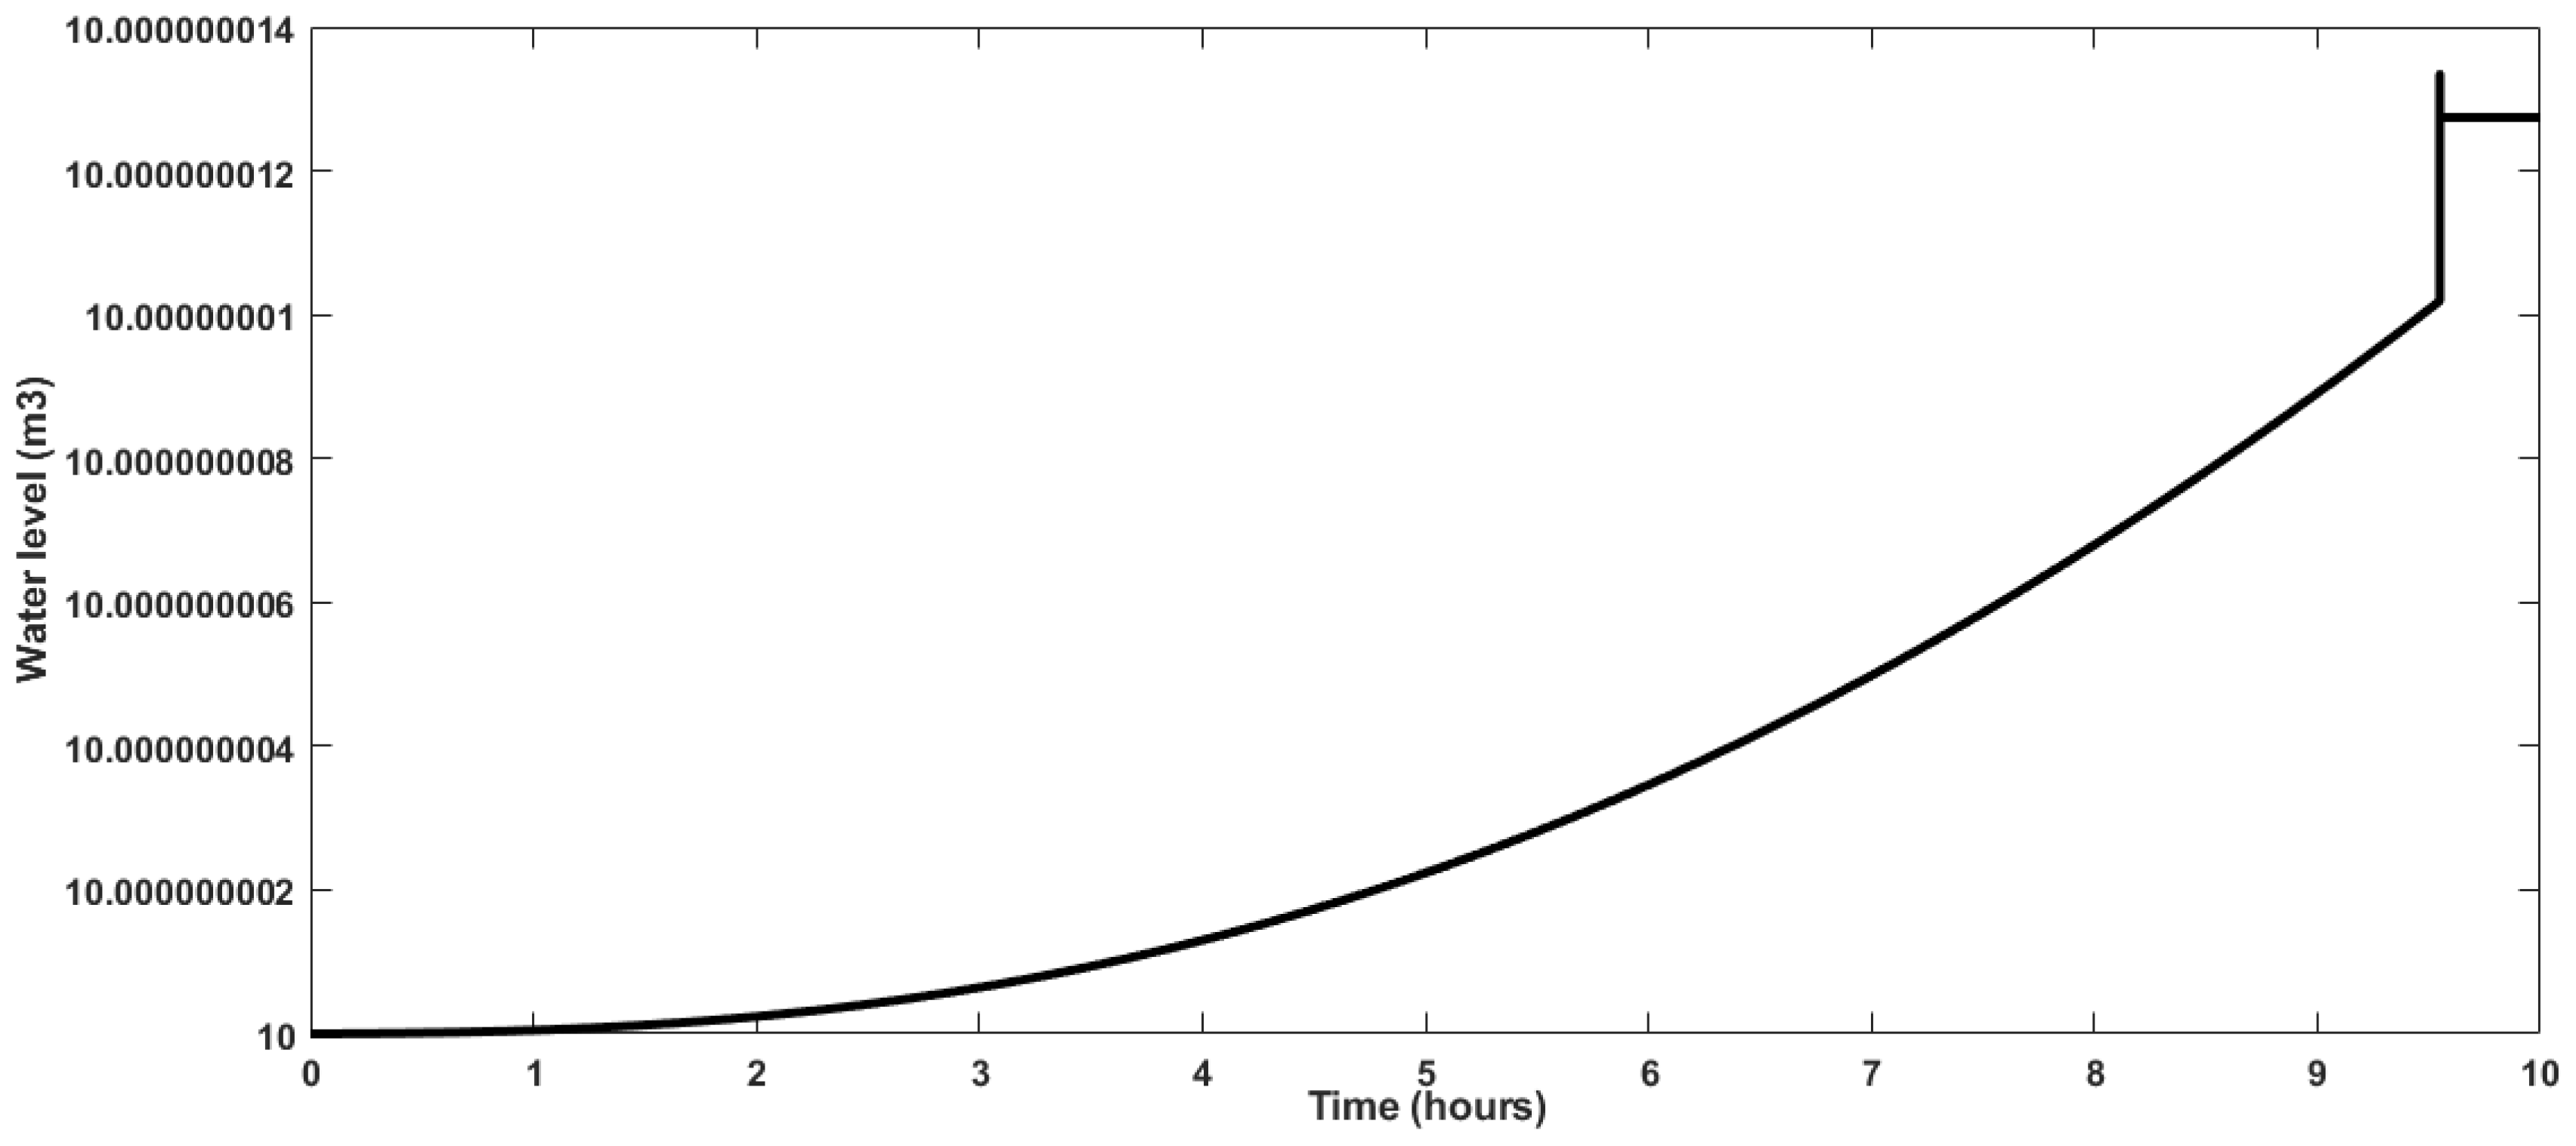
Figure 15.
Controller effort.
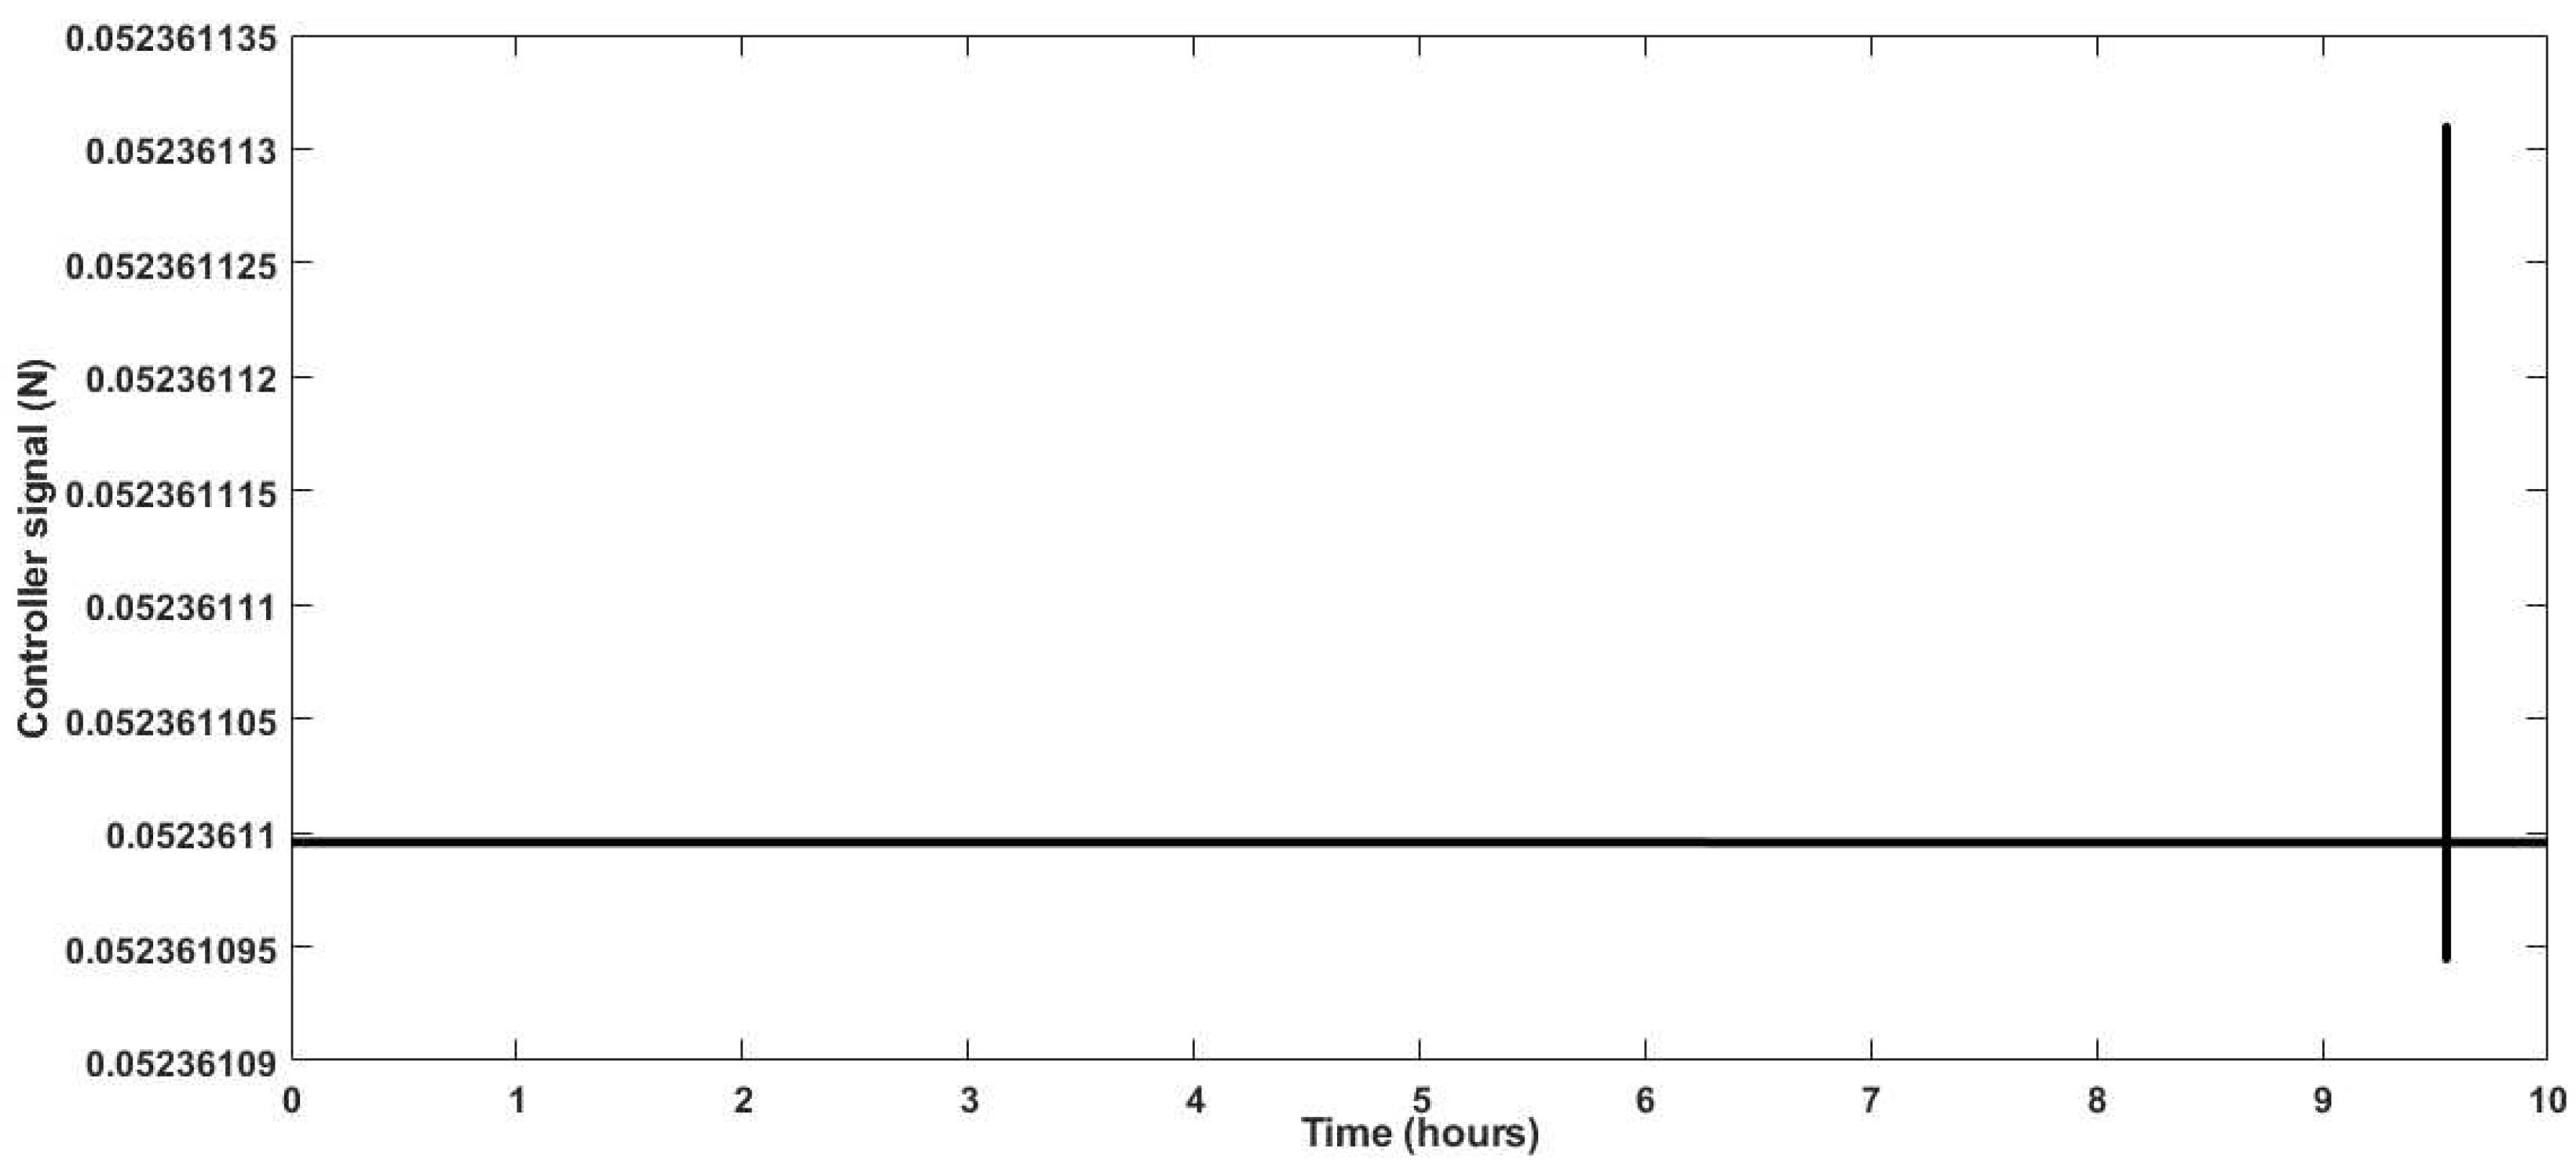
Figure 16.
The discharge rates.
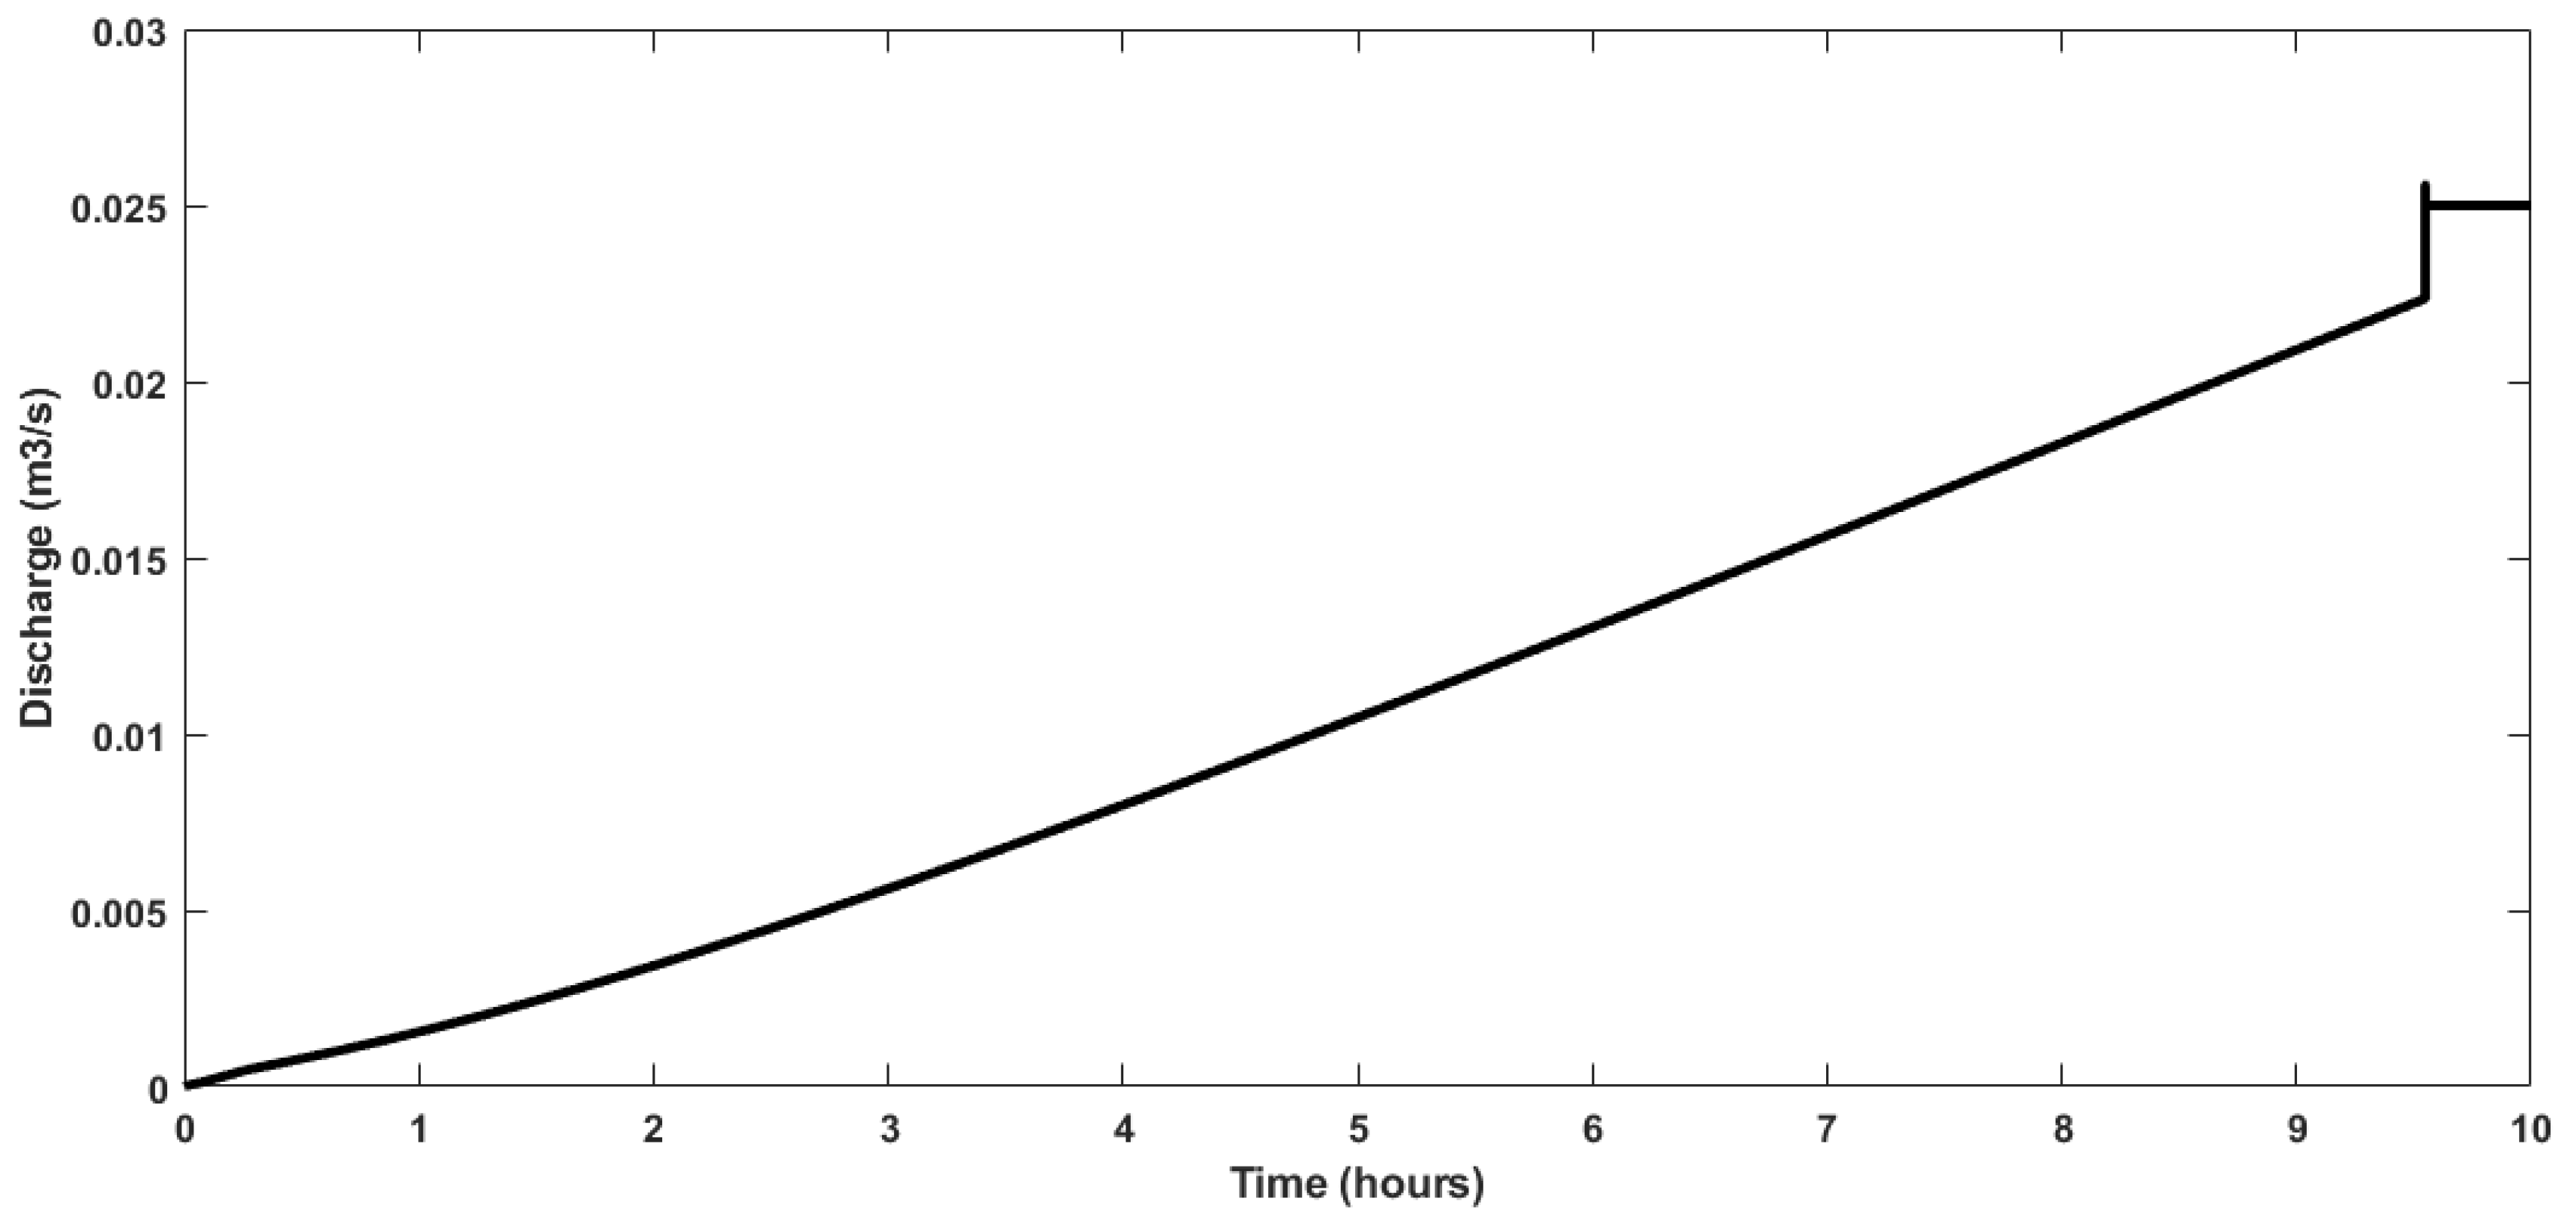
Figure 17.
Water level error.
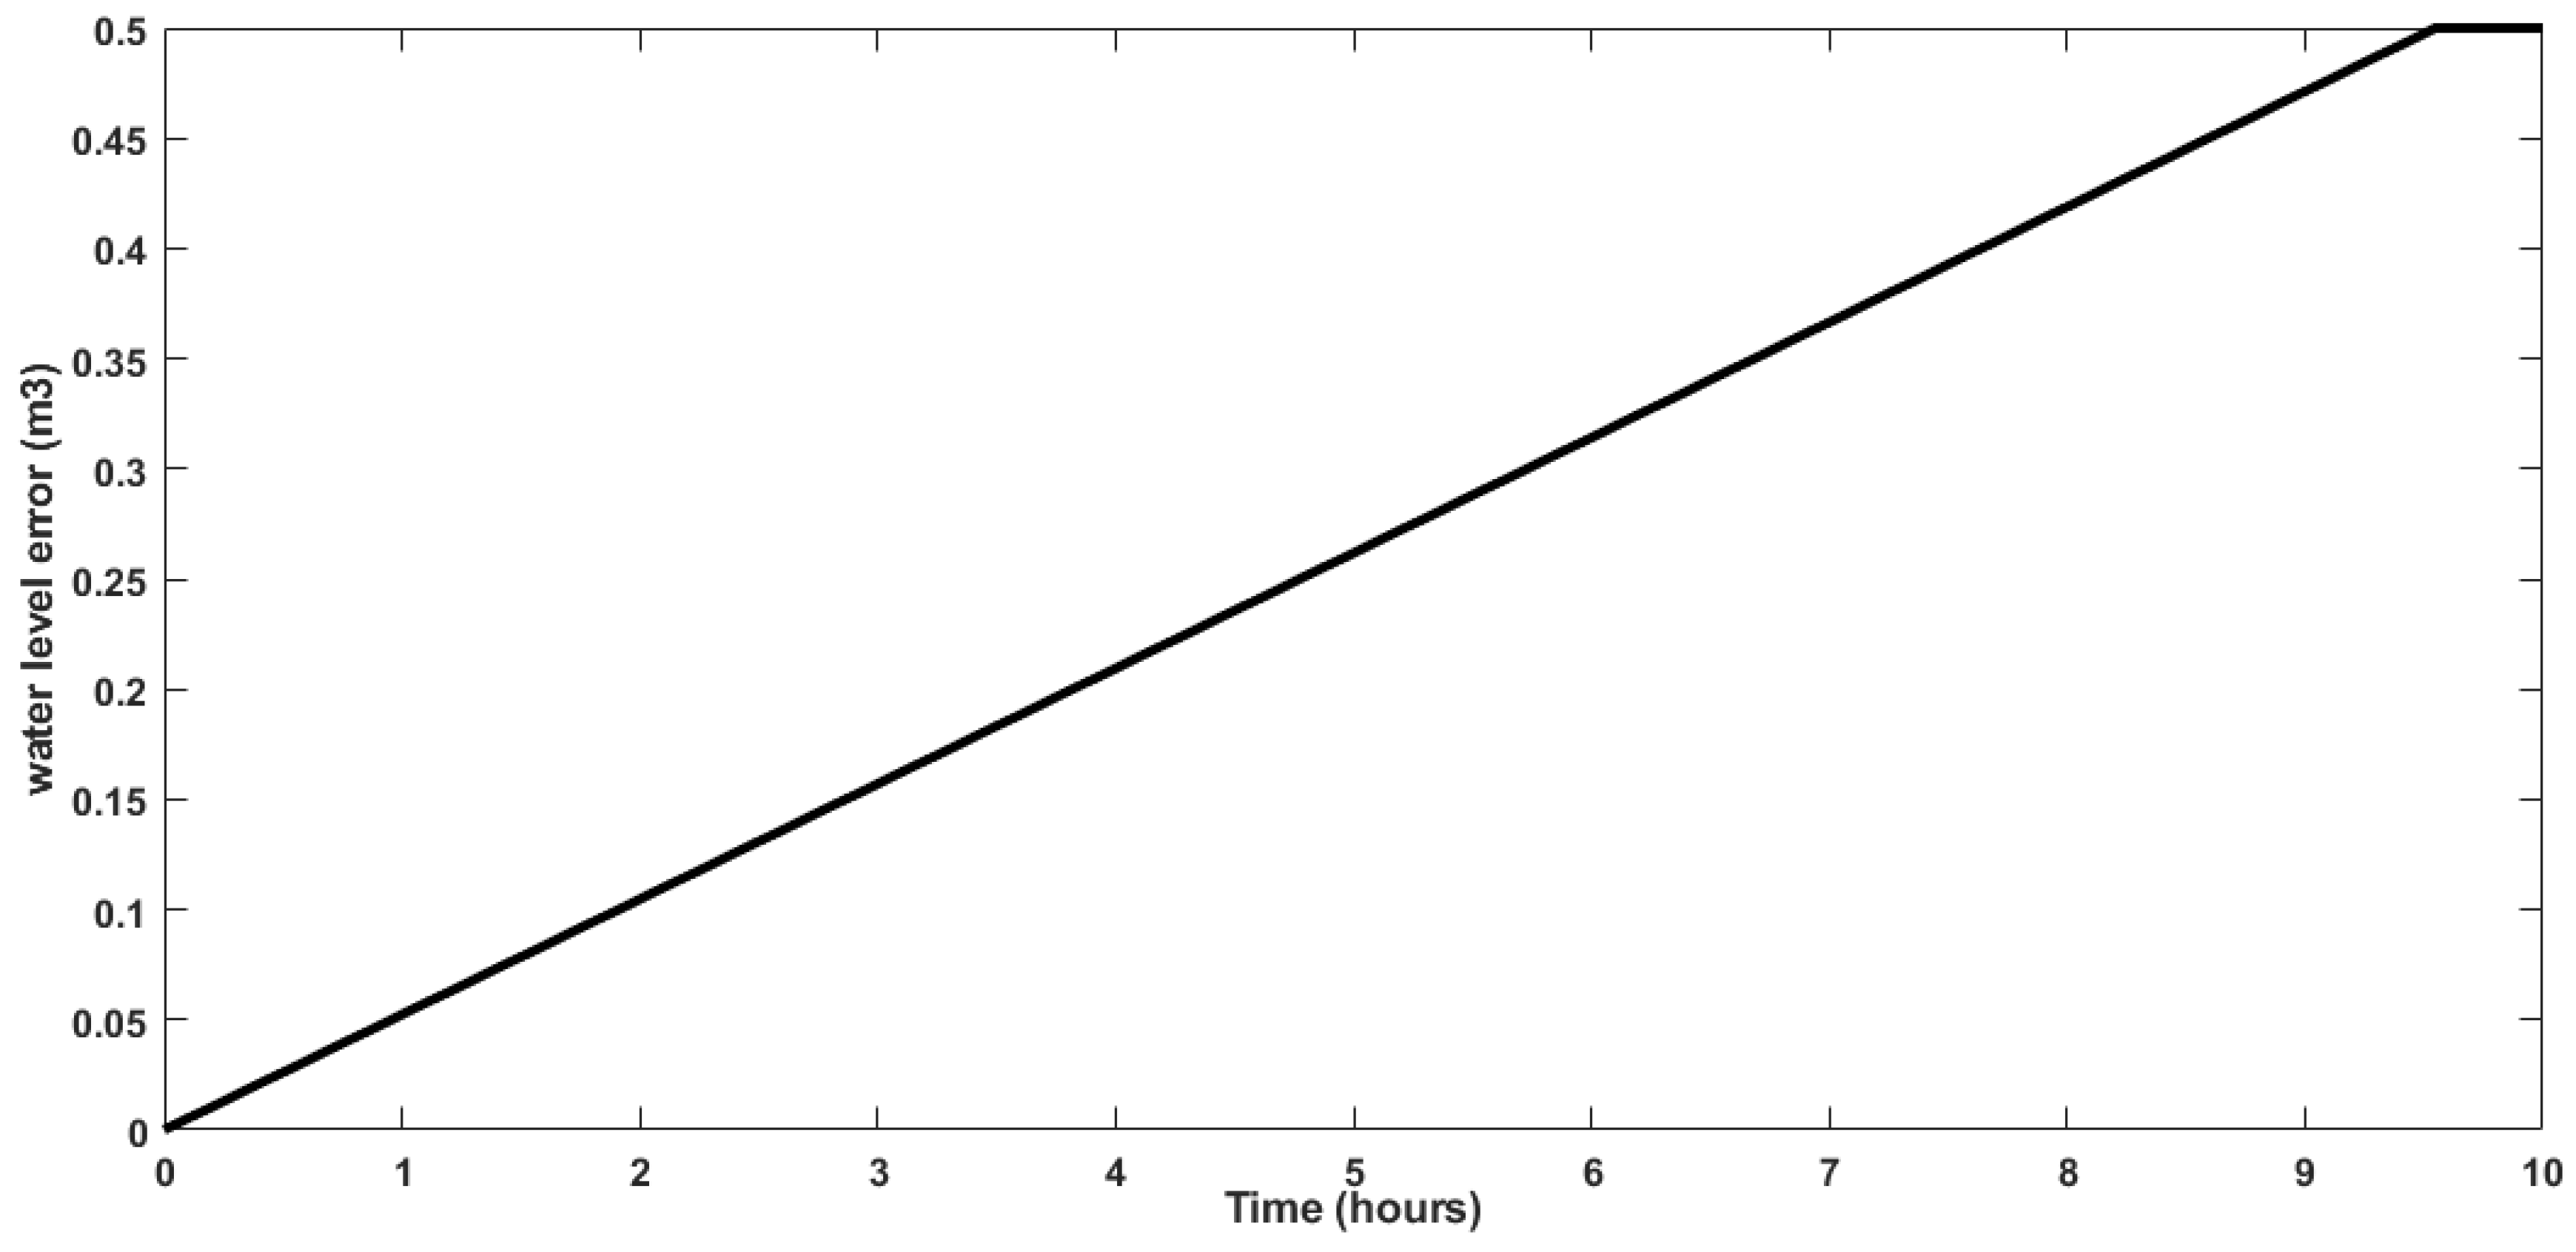
Figure 18.
Real-time flow of data packet.

| technologies | Goals | Business processing module | Alarm notification module | Data control | Communication protocol | Posting on social networks and public data |
|---|---|---|---|---|---|---|
| APOLLO | Controlling crop growth and conditions | Applicable, VRI estimation module | Applicable | Applicable, Crop Growth Monitoring and Crop Yield estimation | Not applicable | Not applicable |
| SMART AKIS | Management Information | Not applicable | Not applicable | Applicable, Flexible and adaptive platform of Smart farming Technologies | Not applicable | Applicable |
| SIG AGRO ASESOR | Crop SIG Manager | Applicable, VRF &VRI modules | Applicable | Applicable | Not applicable | Applicable |
| Agrivi | Applicable, Plan, monitor and analyze crop activities | Applicable, Crops seasons & Pest monitor alert | Applicable | Applicable, Crop data & inputs cost management | Not applicable | Not applicable |
| Smart Water-Saving | Intelligent irrigation programmer with sensory connectivity | Not applicable | Not applicable | Applicable, Soil moisture data acquisition | Applicable, Private Protocol | Not applicable |
| PLATEM PA | Applicable, Management Information with an intelligent VRF & VRI Open Data, Farmers/Providers & Social network | Applicable, Business-Rule Engine Based on data acquisition and historical data | Applicable, Notification module in Multimedia platform | Applicable, Historical data acquisition is represented in graphs and downloaded files | Communication Protocol Implemented based on Open Standard protocol in VRF & VRI devices | Farmers and providers access on-line forums to post results, crop failures, alerts, crop yield, |
| Controller algorithms | Advantages | Disadvantages | Applicable in smart agriculture? |
| PID | simplicity, applicability, and reliability | long tuning time | Yes, recommended |
| P | Easy to Implement | Long settling time Steady state error | Partially, recommended |
| PD | Easy to stabilize Faster response than just P controller | Can amplify high frequency noise | Partially, recommended |
| PI | No steady state error | Narrower range of stability | Partially, recommended |
| MPC | works effectively within constraints of the real actuator which are relatively narrow | lies on its complex algorithm that needs longer time than the other controller | Recommended |
| LQR | simplicity, robustness, and flexibility | only requires the knowledge of the system dynamics and the desired cost function. It does not depend on the initial conditions, disturbances, or uncertainties of the system | Recommended |
| Fuzzy logic | flexibility, ease of implementation, robustness, and interpretability | dependence on human expertise, difficulty in tuning, limited accuracy and computational complexity |
Best recommended |
| Slide mode | fast dynamic response, insensitivity to variations in plant parameters and external disturbance. | chattering, which is a very high-frequency oscillation of the sliding variable around the sliding manifold | Recommended |
| Backstepping | can accurately track the desired trajectory or setpoint, ensuring that the system behaves as intended | The high gain observes is needed to avoid full state measurement | Recommended |
| Adaptive | improve performance and robustness | High cost is produced and the process is very complex. | Recommended |
| Machine learning | Improved Accuracy, Cost Reduction, Scalability, Increased Efficiency, Data Dependency, Computational Resources, Sampling | Needs high training | Recommended |
Table 3.
Comparison of fuzzy memberships.
| Specification of the membership | Comparisons of the memberships | Level of estimating probability |
| Singleton membership function | This assigns a membership value of 1 to a specific value of x. It is useful when the set has a single element [15]. | Good |
| Triangular membership function | This is one of the most widely used membership functions. It is used to model sets that have a triangular shape. The membership value increases linearly from 0 to 1 and then decreases linearly from 1 to 0 [16]. | Better |
| Trapezoidal membership function | This is similar to the triangular membership function, but it has a flat top. It is used to model sets that have a trapezoidal shape [17]. | Better |
| Gaussian membership function | This is used to model sets that have a bell-shaped curve. It is often used in statistics to model normal distributions [18]. | Excellent |
| Sigmoidal membership function | This is used to model sets that have an S-shaped curve. It is often used in artificial neural networks [19]. | Better |
| Generalized bell membership function | This is a generalization of the Gaussian membership function. It is used to model sets that have a bell-shaped curve, but with more flexibility [17]. | Best |
| Z-shaped membership function | This is used to model sets that have a Z-shaped curve. It is often used in control systems [18] | Better |
Table 4.
Rule design for IOT device.
| Temperature | Opening valve | |||
| Wet | Cold | Moderate | Dry | |
| Low | N2 | Z | P1 | P2 |
| Normal | Z | Z | P1 | P2 |
| High | P2 | P1 | Z | P2 |
Table 5.
Simulation results of the IOT application in smart agriculture system.
| Input parameters | Output parameters | ||||||
| Temperature (Celsius) | Water vapor per Kg | ADH values | Water level sensors ( | Moisture in sounding (%) | Pumps flow (%) | Outflows(Q/se) | Valve opening(rad/sec) |
| 27 | 10 | 750 | 73.31 | 34.72 | 4.494 | 0.025 | 0.5 |
| 20 | 10 | 500 | 48.88 | 45.87 | 3.275 | 0.025 | 0.5 |
| 10 | 10 | 300 | 29.33 | 84.75 | 1.424 | 0.025 | 0.5 |
| 0 | 0 | 50 | 4.888 | 555.5 | 6.718 | 0.025 | 0.5 |
| 0 | 20 | 50 | 4.888 | 1111 | 6.718 | 0.03082 | 0.5 |
| 40 | 10 | 1000 | 97.75 | 23.92 | 4.008 | 0.025 | 0.5 |
Table 6.
Comparison of the previous work and current work.
| Specification parameters |
Current work | Previous work [2,3,4] | Change (%) (current work over previous work) |
| Rise time (sec) | 0.8 | 1.2 | 33.3 |
| Settling time (sec) | 0.012 | 1.04 | 98.8 |
| Peak time (sec) | 0.13 | 1.2 | 89.2 |
| Temperature (Celsius) | 27 | 27 | 0 |
| ADH values | 750 | 750 | 0 |
| Moisture in sounding (%) | 34.72 | 30 | 15.7 |
| Pumps flow (%) | 4.494 | 3.5 | 28.4 |
| Outflows(Q/se) | 0.025 | 0.025 | 0 |
| Valve opening(rad/sec) | 0.5 | 0.33 | 51.51 |
Disclaimer/Publisher’s Note: The statements, opinions and data contained in all publications are solely those of the individual author(s) and contributor(s) and not of MDPI and/or the editor(s). MDPI and/or the editor(s) disclaim responsibility for any injury to people or property resulting from any ideas, methods, instructions or products referred to in the content. |
© 2024 by the authors. Licensee MDPI, Basel, Switzerland. This article is an open access article distributed under the terms and conditions of the Creative Commons Attribution (CC BY) license (http://creativecommons.org/licenses/by/4.0/).
Copyright: This open access article is published under a Creative Commons CC BY 4.0 license, which permit the free download, distribution, and reuse, provided that the author and preprint are cited in any reuse.


