Preprint
Article

Historical Record of Heavy Metals since MIS 2 in a Sediment Core of Laizhou Bay, China

Altmetrics

Downloads

82

Views

29

Comments

0

Submitted:

19 January 2024

Posted:

19 January 2024

You are already at the latest version

Alerts
Abstract
The concentration of heavy metals in sediment is an important factor for assessing the quality of the nearshore environment. Geochemical background values are the normal concentrations of heavy metals in the natural environment. The use of different background values results in different evaluation results. Heavy metal (Cu, Pb, Zn, Cr, Cd, As, and Hg) concentration profiles along a sediment core were investigated to obtain background values and assess the depositional processes and contamination levels in Laizhou Bay. Apart from As and Hg, all other metals had similar distribution patterns and could be divided into four stages since marine isotope stage (MIS) 2. The results of the enrichment factor, geoaccumulation index, Pearson’s correlation coefficient, Nemerow pollution index, principal component analysis, and potential ecological risk index showed that element enrichment or contamination in the core sediments was absent and that all heavy metals were mainly naturally sourced. The changes in heavy metals since MIS 2 in the core sediments were predominantly related to the sedimentary environment, sediment sources, and mean grain size. The average values of the heavy metals in the U2 unit formed during the Middle Holocene can be used as reference values for background values.
Keywords: 
Subject: Environmental and Earth Sciences  -   Environmental Science

1. Introduction

Heavy metals are among the major chemical substances that cause environmental pollution [1,2]. Heavy metals have wide-ranging sources, long persistence, difficult degradation, difficult detection and recovery after pollution, and easy transfer and accumulation along the food chain [3,4]. They can directly or indirectly affect the DNA of organisms, causing the abnormal development of marine organisms and even the extinction of sensitive species, resulting in irreversible impacts on ecosystems [5,6]. Heavy metal indicators in seawater and sediments are important components of marine environmental assessment [7,8].
Laizhou Bay is located northwest of the Shandong Peninsula and in the southern part of the Bohai Sea, covering an area of approximately 6000 km2 [9]. It is a typical semi-enclosed coastal bay and an important fishing area in China. Several rivers discharge into the sea, such as the Yellow, Xiaoqing, Bailang, Wei, and Jiaolai rivers, and carry large amounts of sediment pollutants every year [10]. With the rapid economic development in the area, the combination of multiple human activities, such as land-based pollution, land reclamation projects, port shipping, and fishing, has led to prominent ecological and environmental issues in this sea area. Relevant studies have shown that human activity has increased the heavy metal content of sediments in the Bohai Sea [11]. In addition, changes in land-based pollution and water dynamics in the bays and estuaries of the Bohai Sea have significantly influenced the deposition and distribution of heavy metals in sediments, potentially causing corresponding changes to the ecological environment.
Extensive research has been conducted on the characteristics of heavy metal pollution and ecological risks in the sediments of Laizhou Bay, based on large amounts of surface sediment [10,11,12]. However, there are some differences in the results of different studies, especially in the evaluation of heavy metal pollution and ecological risks, owing to the lack of unified background values. For example, when assessing heavy metal pollution in Laizhou Bay, as the background values, Xu et al. (2015) used the concentration of heavy metals in Bohai sediment [13], Duan et al. (2021) used the content of soil elements in Shandong Province [10], and Xu et al. (2021) selected the concentration of heavy metals in Bohai sediment and the concentration of heavy metals in adjacent land soil in Shandong Province [14], and then compared and analyzed the differences in the calculation results. Therefore, using multiple evaluation methods and combining them with historical changes in heavy metal content will provide a more objective and comprehensive understanding of the metal pollution status in Laizhou Bay. The historical trends of heavy metals in the sediments of Laizhou Bay are poorly understood because of the lack of long drill holes. This study aimed to analyze historical variations in heavy metal content in Laizhou Bay using collected geological borehole data. Multiple evaluation methods were employed to comprehensively assess the status of heavy metal pollution and ecological risk. The goals were to gain a better understanding of heavy metal pollution in Laizhou Bay, identify characteristic pollutants, provide reference values for selecting background values of heavy metals in Laizhou Bay, and provide a scientific basis for preventing and controlling heavy metal pollution in related marine areas and for the comprehensive management of the Bohai Sea.

2. Materials and Methods

2.1. Sampling and Analytical Methods

In September 2013, the sediment core LZ01 (119.8413°E, 37.8316°N; Figure 1) was recovered using a rotary drill. The core was collected at a water depth of 17.82 m and has a length of 18.0 m. The average core recovery rate was 86.8%. The core was split lengthwise and sub-sampled in the laboratory. A total of 71 subsamples for grain size and elemental analyses from core LZ01 were taken at 25–30 cm intervals. Grain size and elemental analyses were carried out at the Center of Testing, Qingdao Institute of Marine Geology. The grain size was performed using a Mastersizer-2000 laser particle size analyzer (Malvern, UK) based on the standard method described by Xu et al (2015) [13]. The grain size parameters were calculated following Folk and Ward (1957) [15].
The concentrations of two major elements (Al and Fe) and three trace metals (Cu, Pb, and Zn) were measured using X-ray fluorescence spectrometry (XRF, Axios PW4400) according to the standard method outlined in Duan et al. 2021 [10]. The elements Cr and Cd were determined using an inductively coupled plasma mass spectrometer (Thermo X Series 2), while Hg and As were determined using a dual-channel atomic fluorescence spectrophotometer (AFS-920) following the procedures described in Xu et al. 2015 [13]. The concentration differences between the measured values and the standard values, as well as the errors from repeated measurements, were controlled within 10% and 5% respectively, to ensure the accuracy and precision of the experimental results [10].
Gastropods and unbroken shells, including the peat layers, were performed by Beta Analytics (Miami, FL, USA) for accelerator mass spectrometry (AMS) 14C dating (Table 1). Radiocarbon ages were corrected for fractionation using δ13C values measured simultaneously and for the regional marine reservoir effect (△R = −178 ± 50 a). Calendar ages were calculated with the Calib rev. 8.1.2 program using the Marine20 curve [16] and are reported as calendar 14C ages before 1950 CE with two standard deviation (2σ) uncertainty. Two samples from core LZ01 were selected for optically stimulated luminescence (OSL) dating of quartz (Table 2). The concentrations of K, U, and Th were measured using inductively coupled plasma mass spectrometry and converted into dose rates based on data from Aitken (1998) [17] and Marsh et al. (2002) [18].

2.2. Multivariate Analysis Method

The combination of correlation analysis and principal component analysis is an effective approach for identifying sources of heavy metals. Correlation analysis assesses whether the sources of heavy metals in regional sediments are the same based on the correlation between the elements. Principal component analysis reveals the relationships between variables and can be used to evaluate the potential sources of heavy metal pollution in sediments. SPSS 25 software for Windows (SPSS, USA) was used for the principal component analysis of the variables in this study.

2.3. Assessment Methods of Heavy Metal Pollution

2.3.1. Enrichment Factor

The enrichment factor (EF) is a quantitative indicator used to assess the degree of heavy metal pollution in sediments and identify its sources. Using Al as a reference element, the elemental content in the sample was standardized to eliminate the influence of particle size differences.
EF values can be calculated as follows (1):
EF = (C/Al)sample/(C/Al)baseline
where Csample and Alsample are the hevay metals and Al concentrations in each sample, respectively, and Cbaseline and Albaseline are the reference element concentrations [19]. EF < 1.5 indicates crustal sources, whereas EF > 1.5 is indicative of metals related to anthropogenic sources [20].

2.3.2. Geoaccumulation Index

The geoaccumulation index (Igeo) is commonly used to determine heavy metal contamination in sediments and eliminate the influence of natural geological contributions, and is calculated using equation (2):
Igeo = log2 (Ci/(1.5 × Bi))
where Ci is the measured concentration sediments and Bi is the geochemical background of the metal, with 1.5 represents the possible variations in the background data owing to lithogenic effects [21]. Based on Muller (1981), classification of geoaccumulation indices can be divided into seven classes, ranging from class 0 (Igeo ≤ 0, unpolluted) to class 7 (Igeo > 5, extremely polluted) [22].

2.3.3. Nemerow Pollution Index

The Nemerow index (PINemerow) considers the extreme value and pollution coefficient of each metal and reflects the overall degree of pollution in the sediments. This can be calculated using equation (3):
P = ( P i m a x 2 + P i a v r 2 ) / 2       P i = C i / B i
where p is PINemerow, Pimax represents the maximum index value of each pollution factor in the sediment, and Piavr is the average index value of each pollution factor in the sediment. Ci is the measured concentration in sediment and Bi is the assessment standard of heavy metal, which is referred to herein as the Class I Quality Standards for Marine Sediments in China (GB18668-2002) [23]. According to Kowalska et al. (2016) [24], PINemerow can be divided into four categories: clean (p < 1); slightly polluted (1 ≤ p < 2.5); moderately polluted (2.5 ≤ p < 7); heavily polluted (p ≥ 7).

2.3.4. Potential Ecological Risk Index

The potential ecological risk index (ER) evaluates the degree of heavy metal contamination in sediments based on the potential toxicity of heavy metals and the environmental response. It considers not only the measured and background concentrations of different metals but also their unique toxicities and combined ecological risks [25]. ER was calculated as follows:
C r i = C f i / C n i ,   E r i = T r i × C r i ,   E R = Σ E r i
where C r i is the pollution factor for the ith heavy metal, C f i and C n i are the measured concentration and geochemical background value, respectively, of the ith heavy metal, and T r i is a toxic response factor for heavy metals. Based on the toxicity of each metal in the environment [25], T r i was defined as 1 for Zn, 2 for Cr, 5 for Cu and Pb, 10 for As, 30 for Cd, and 40 for Hg. E r i indicates the potential ecological risk coefficient for the ith heavy metal and ER is a comprehensive potential ecological risk index for multiple heavy metals. For each heavy metal, five classes of E r i were determined: low potential ecological risk ( E r i < 40), moderate potential risk (40 ≤ E r i < 80), considerable potential ecological risk (80 ≤ E r i < 160), high potential ecological risk (160 ≤ E r i <320), and very high potential ecological risk ( E r i ≥ 320). The original classification standards were Cu, Pb, Zn, Cr, Cd, As, Hg, and PCB. However, the data collected in this study did not include PCB. Therefore, the classification values for ER were adjusted based on the proportions of these seven heavy metals and existing literature [14]. ER was divided into four grades: low ecological risk (ER < 105), moderate ecological risk (105 ≤ ER< 210), considerable ecological risk (210 ≤ ER< 420), and very high ecological risk (ER ≥ 420).

3. Results

3.1. Sedimentary Structure of the Core

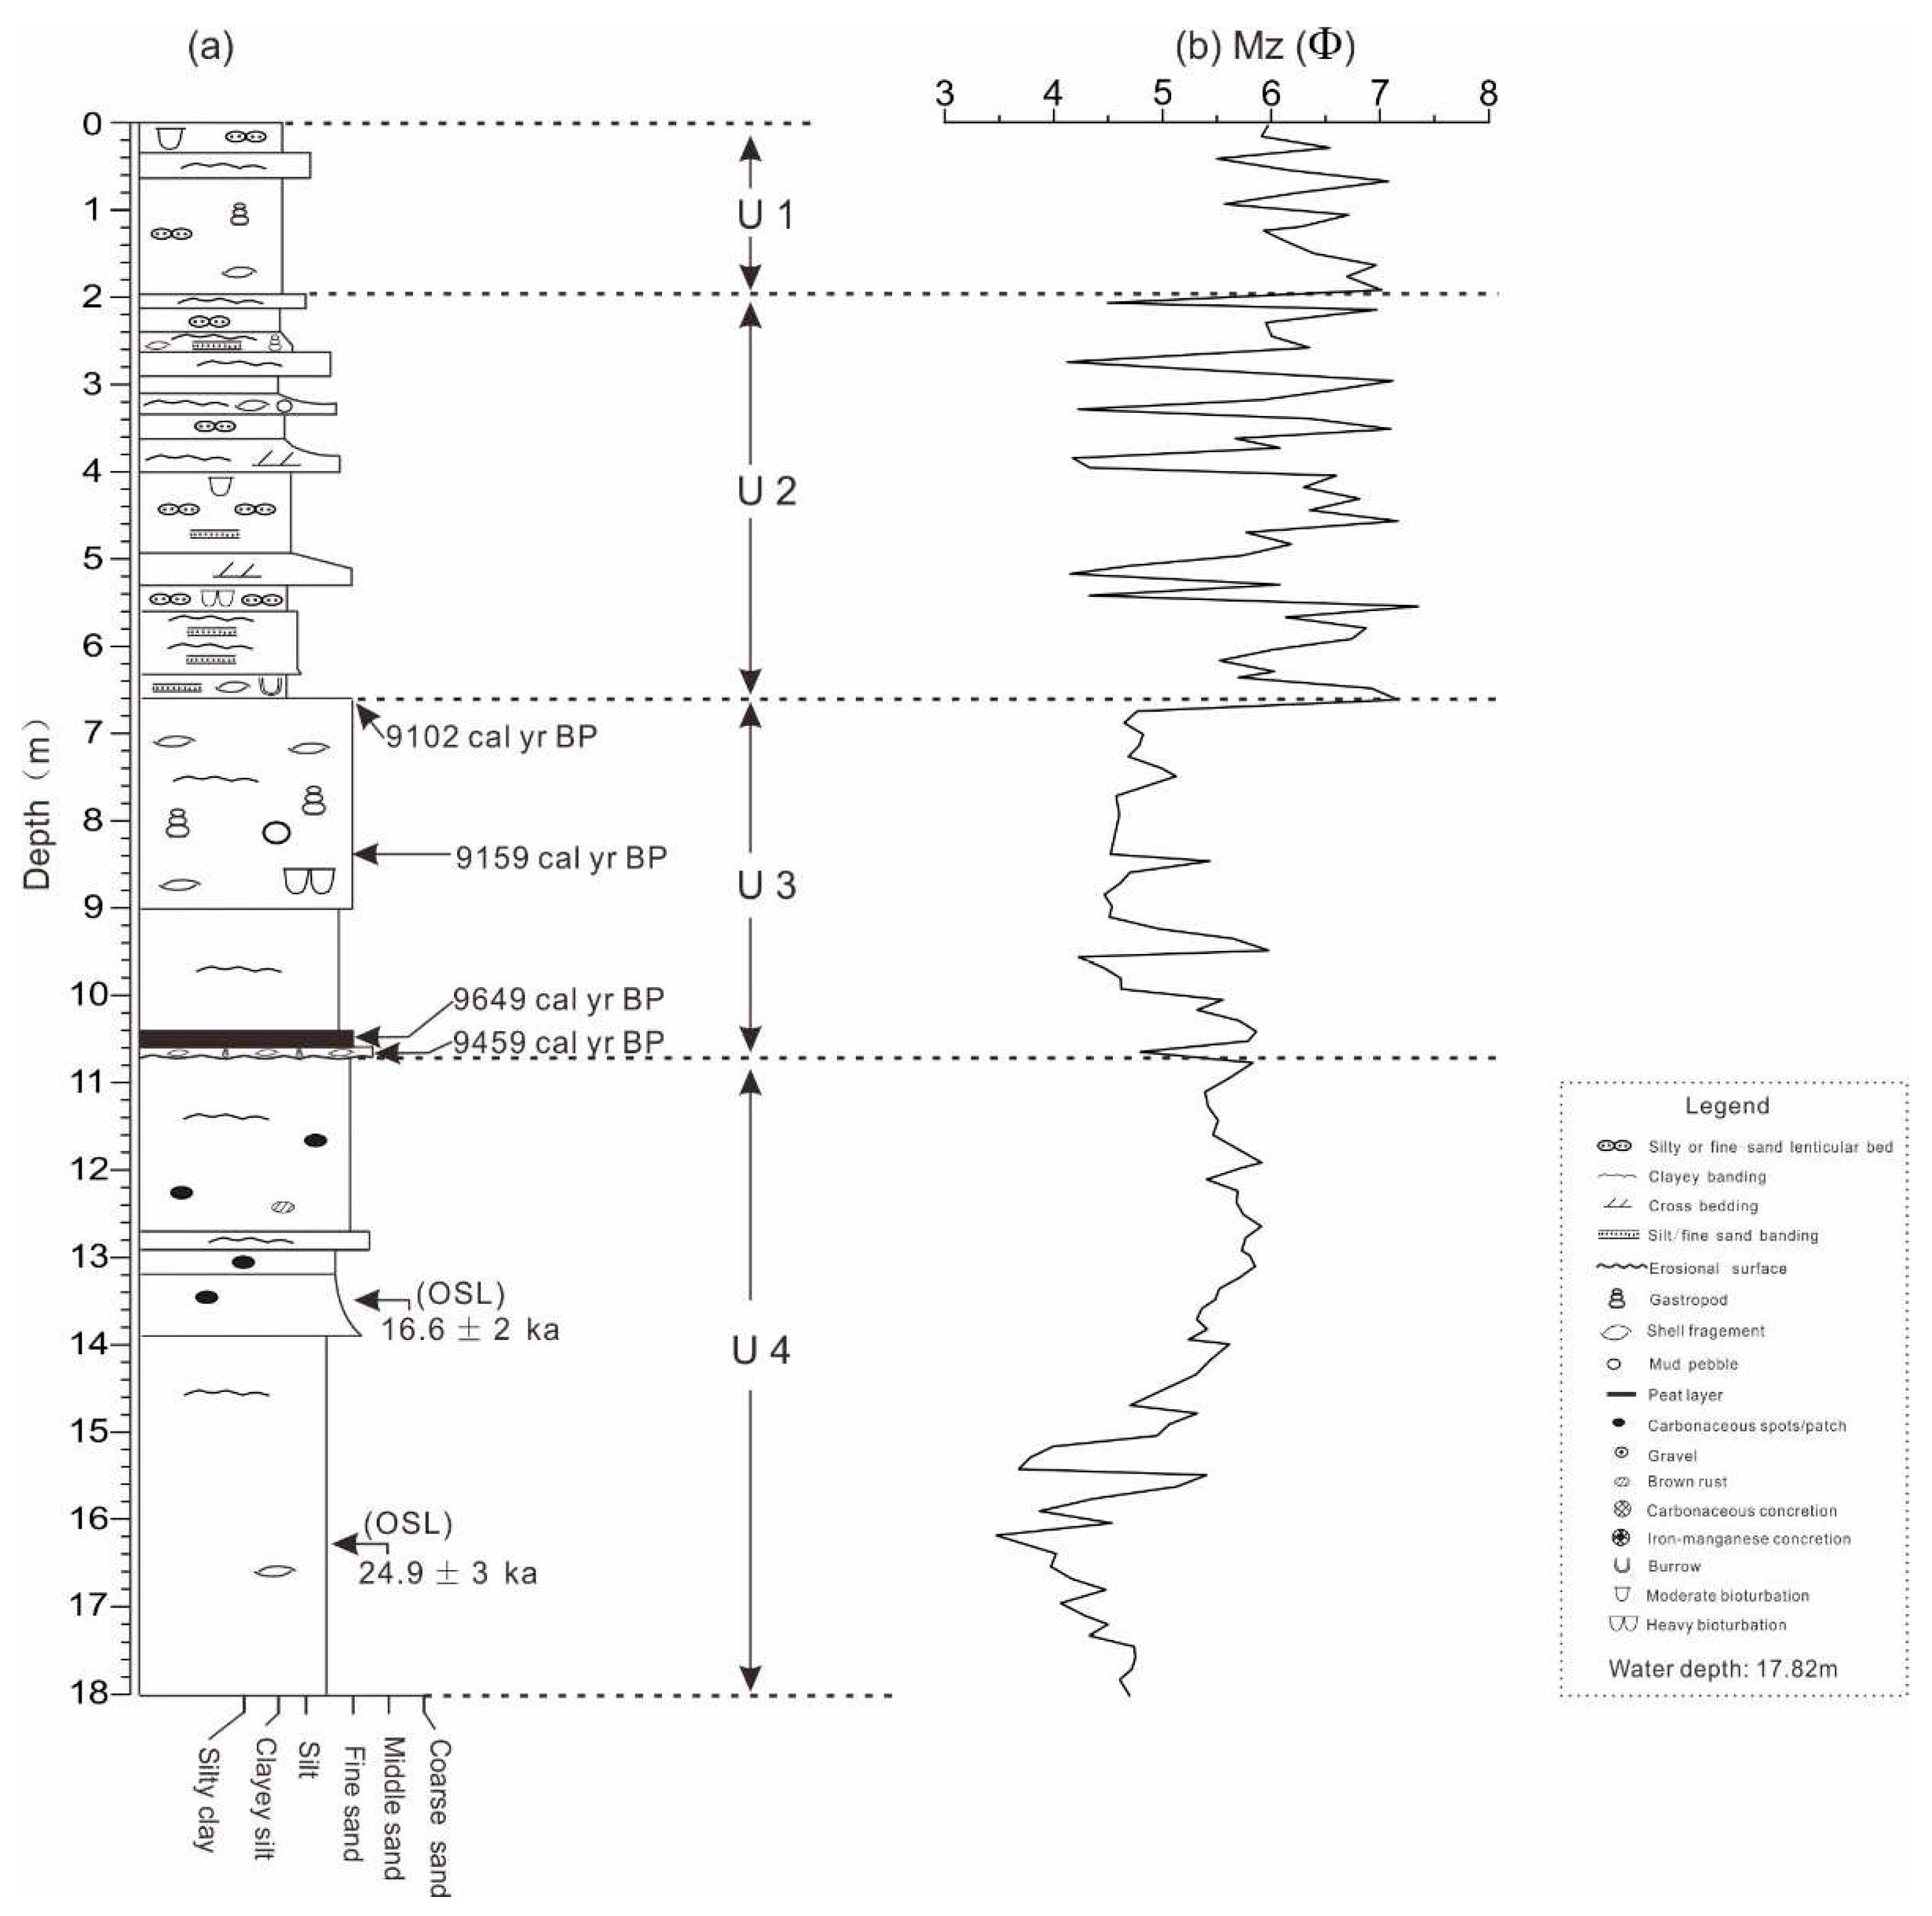
On the basis of the AMS14C and OSL ages, lithofacies characteristics, down-core distributions of heavy metals and grain size, and correlation with other well-studied cores from adjacent areas (Figure 2), four units (U1–U4 in descending order) can be identified for the sedimentary succession in core LZ01.
U4 (10.8–18.0 m) was characterized by dark grey, dark yellow-grey, earthy yellow silt-fine sand-medium sand, with the mean grain size ranging from 3.47 to 5.91 Φ (average 4.97 Φ). The sorting was generally poor without stratification, with occasional clayey bands, occasional black carbon spots, and small amounts of brown rust spots. The two OSL ages were 16.6 ± 2 ka and 24.9 ± 3 ka. Based on the sedimentary characteristics, this unit was interpreted as fluvial and floodplain deposits during Marine Isotope Stage (MIS) 2.
U3 (6.8–10.8 m) mainly comprised dark grey silt-fine sand, with clayey banding, shells, and gastropods. At the bottom were layers of peat and shell fragments, and the AMS14C ages were 9649 cal yr BP and 9459 cal yr BP. The mean grain size ranged from 4.46 to 5.98 Φ, with an average of 4.94 Φ. The peat layer is a marker of the Holocene bottom of the Bohai Sea. The other two AMS14C ages of the gastropods were 9102 cal yr BP and 9159 cal yr BP. Therefore, this unit was interpreted as a transgressive deposit that formed during the Early Holocene.
U2 (1.9–6.8 m) was characterized by dark grey clayey silt-silt, with a silt-fine sandy lens. The mean grain size ranged from 4.15 to 7.17 Φ, with an average of 5.73 Φ. No dating data were available for this unit. Based on its sedimentary characteristics, this unit was interpreted as shallow marine deposition during the Middle Holocene.
U1 (0–1.9 m) comprised dark grey clayey-silt, with the mean grain size ranging from 5.93 to 6.71 Φ (average 6.33 Φ). The sediment was much finer than that of the other units. Based on its sedimentary characteristics, this unit was interpreted as a Late Holocene littoral facies deposit.

3.2. Concentration of Heavy Metals

The mean Cu, Pb, Zn, Cr, Cd, As, and Hg concentrations in the LZ01 core were 19.77, 20.17, 57.70, 56.02, 0.08, 8.68, and 0.008 mg/kg, respectively (Table 3). The average concentrations of all heavy metals were lower than those in the Yellow River estuary [26], Dongying coast [11], and Southern Shandong Peninsula [27]. The concentrations of Cu and Zn were substantially higher than those in the surface sediments of Laizhou Bay [10]. The average concentrations of all heavy metals were below the element baseline in Shandong Peninsula soil [19]. Except for Pb, Zn, and As, all metals showed higher concentrations in the Musa Estuary [28] and Upolu Island [29].
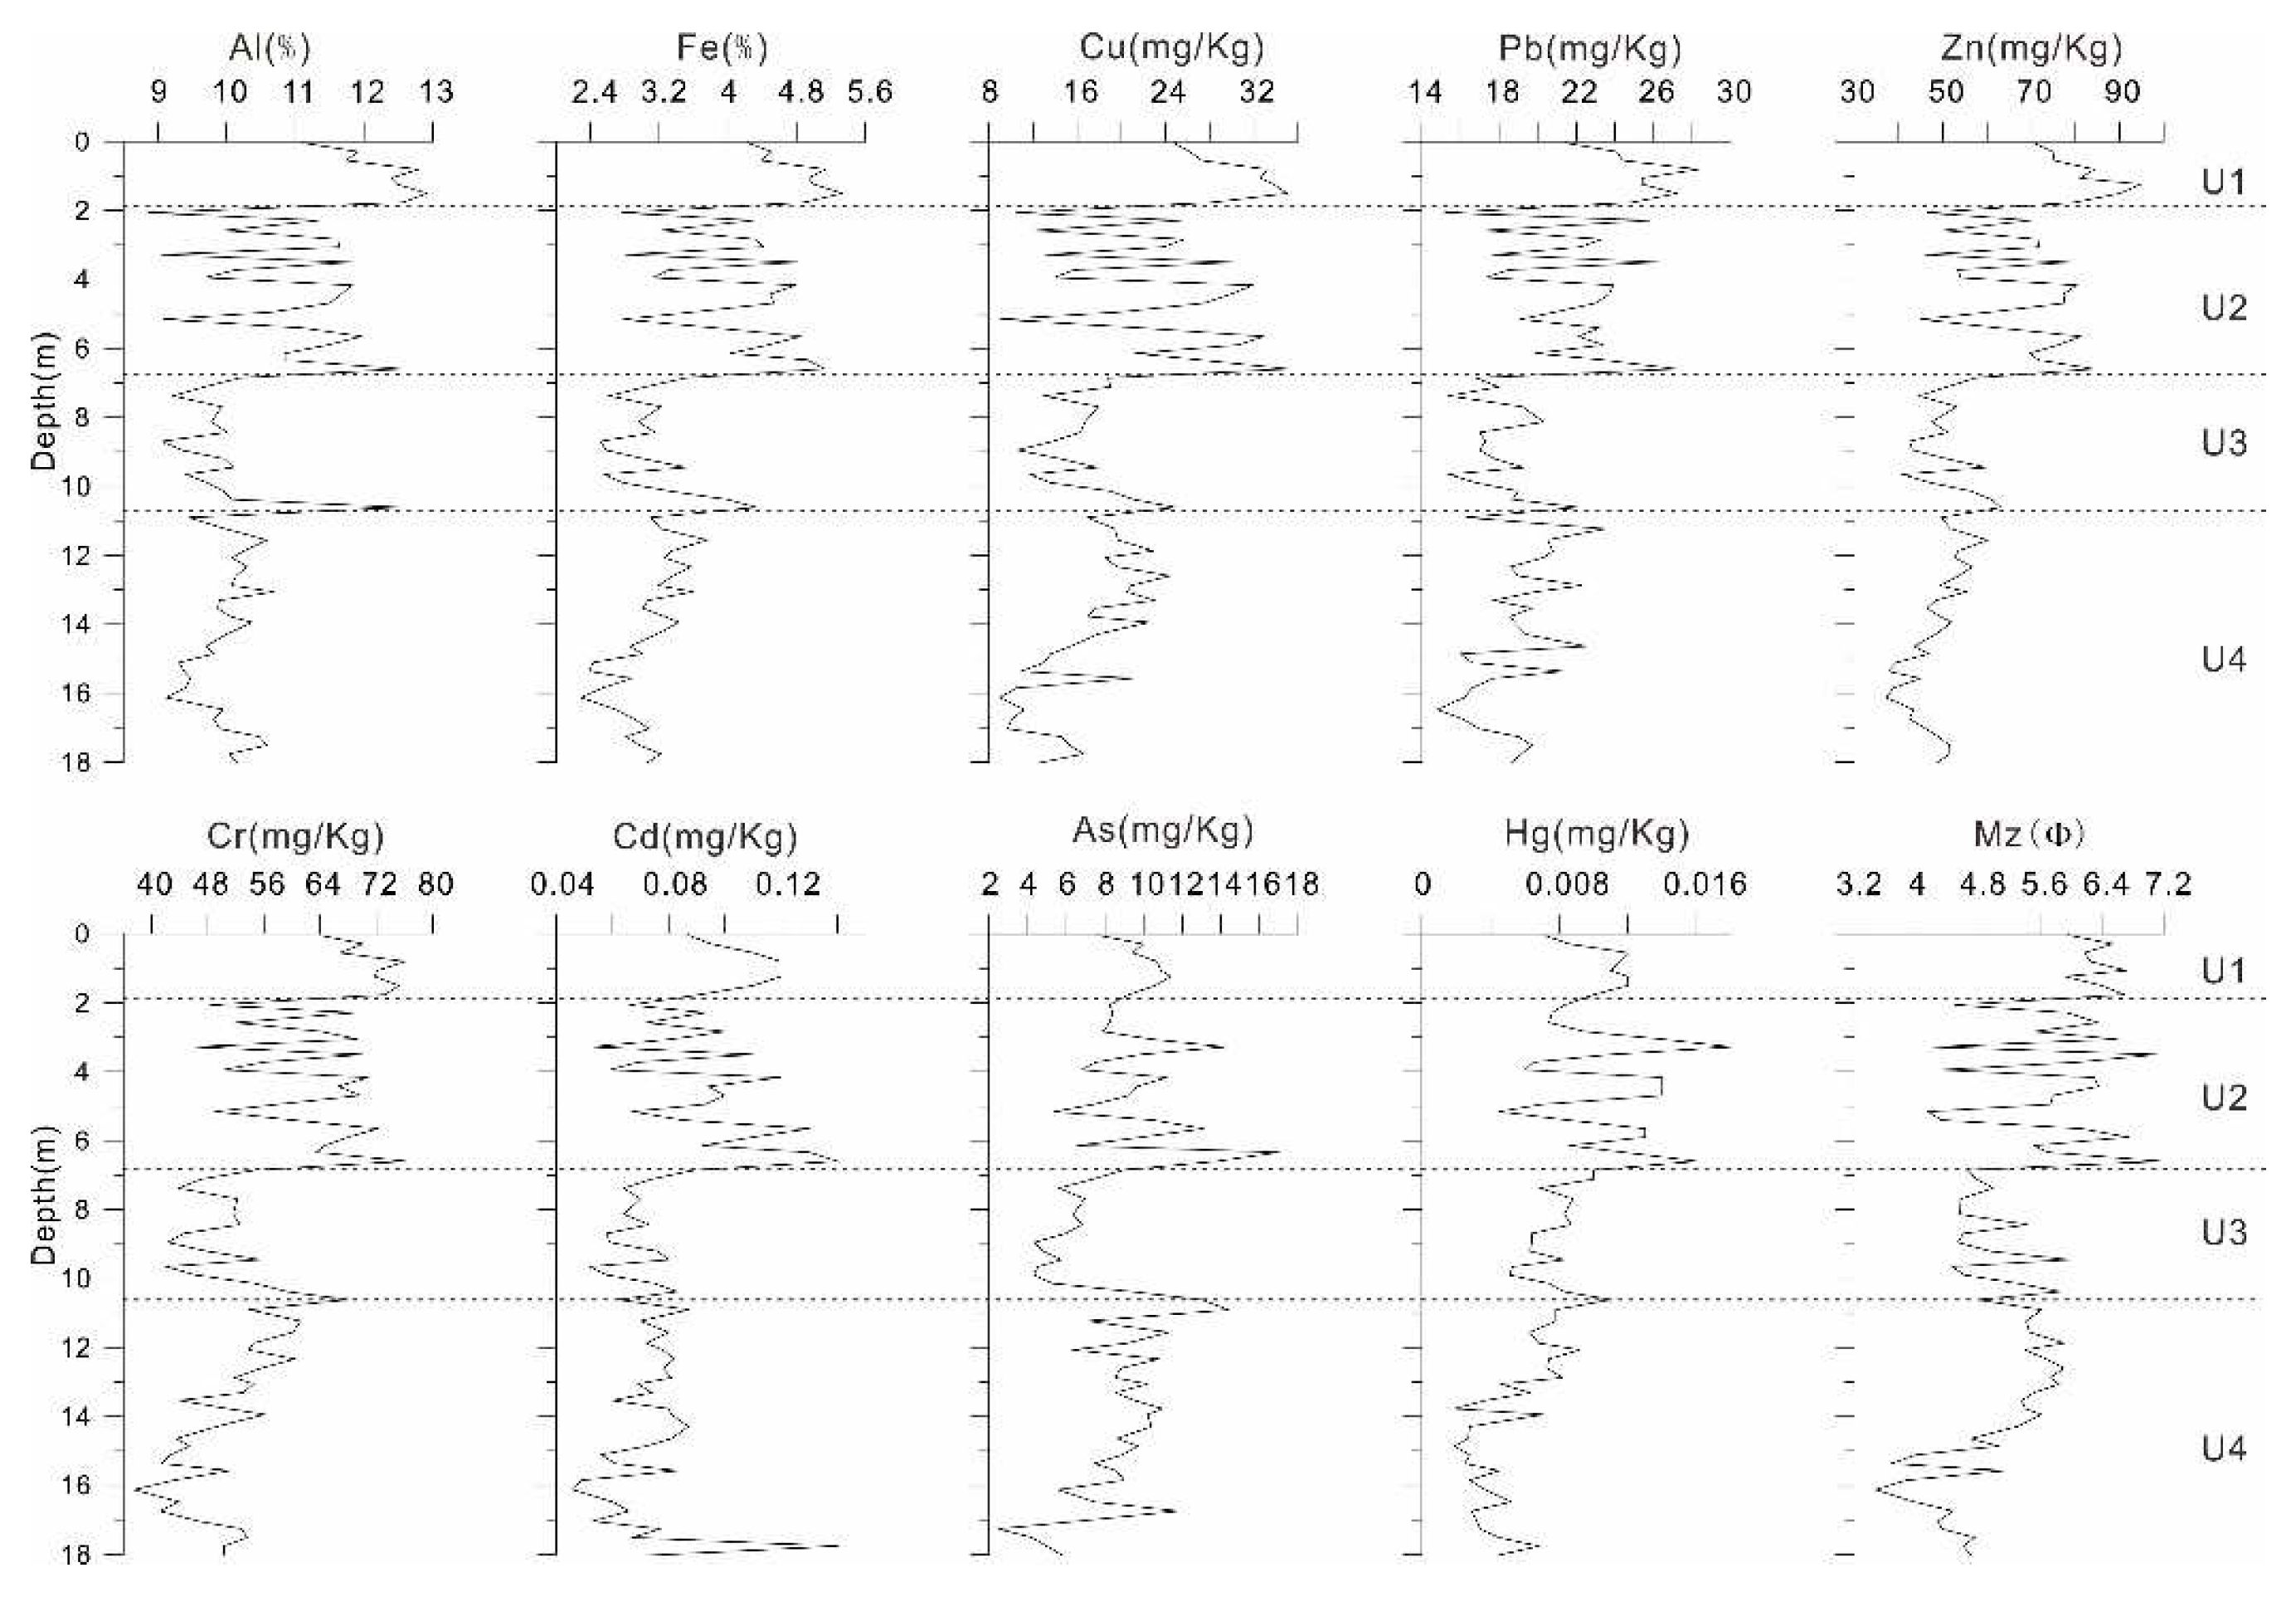
Figure 3 showed the vertical distributions of the mean grain size (Mz) and elements in the LZ01 sediment core. In addition to As and Hg, all the other metals had similar distribution patterns. Except for Hg, all other heavy metals showed the highest average concentrations in unit U1, which formed during the Late Holocene (Table 3).

4. Discussion

4.1. Assessment of Sediment Contamination
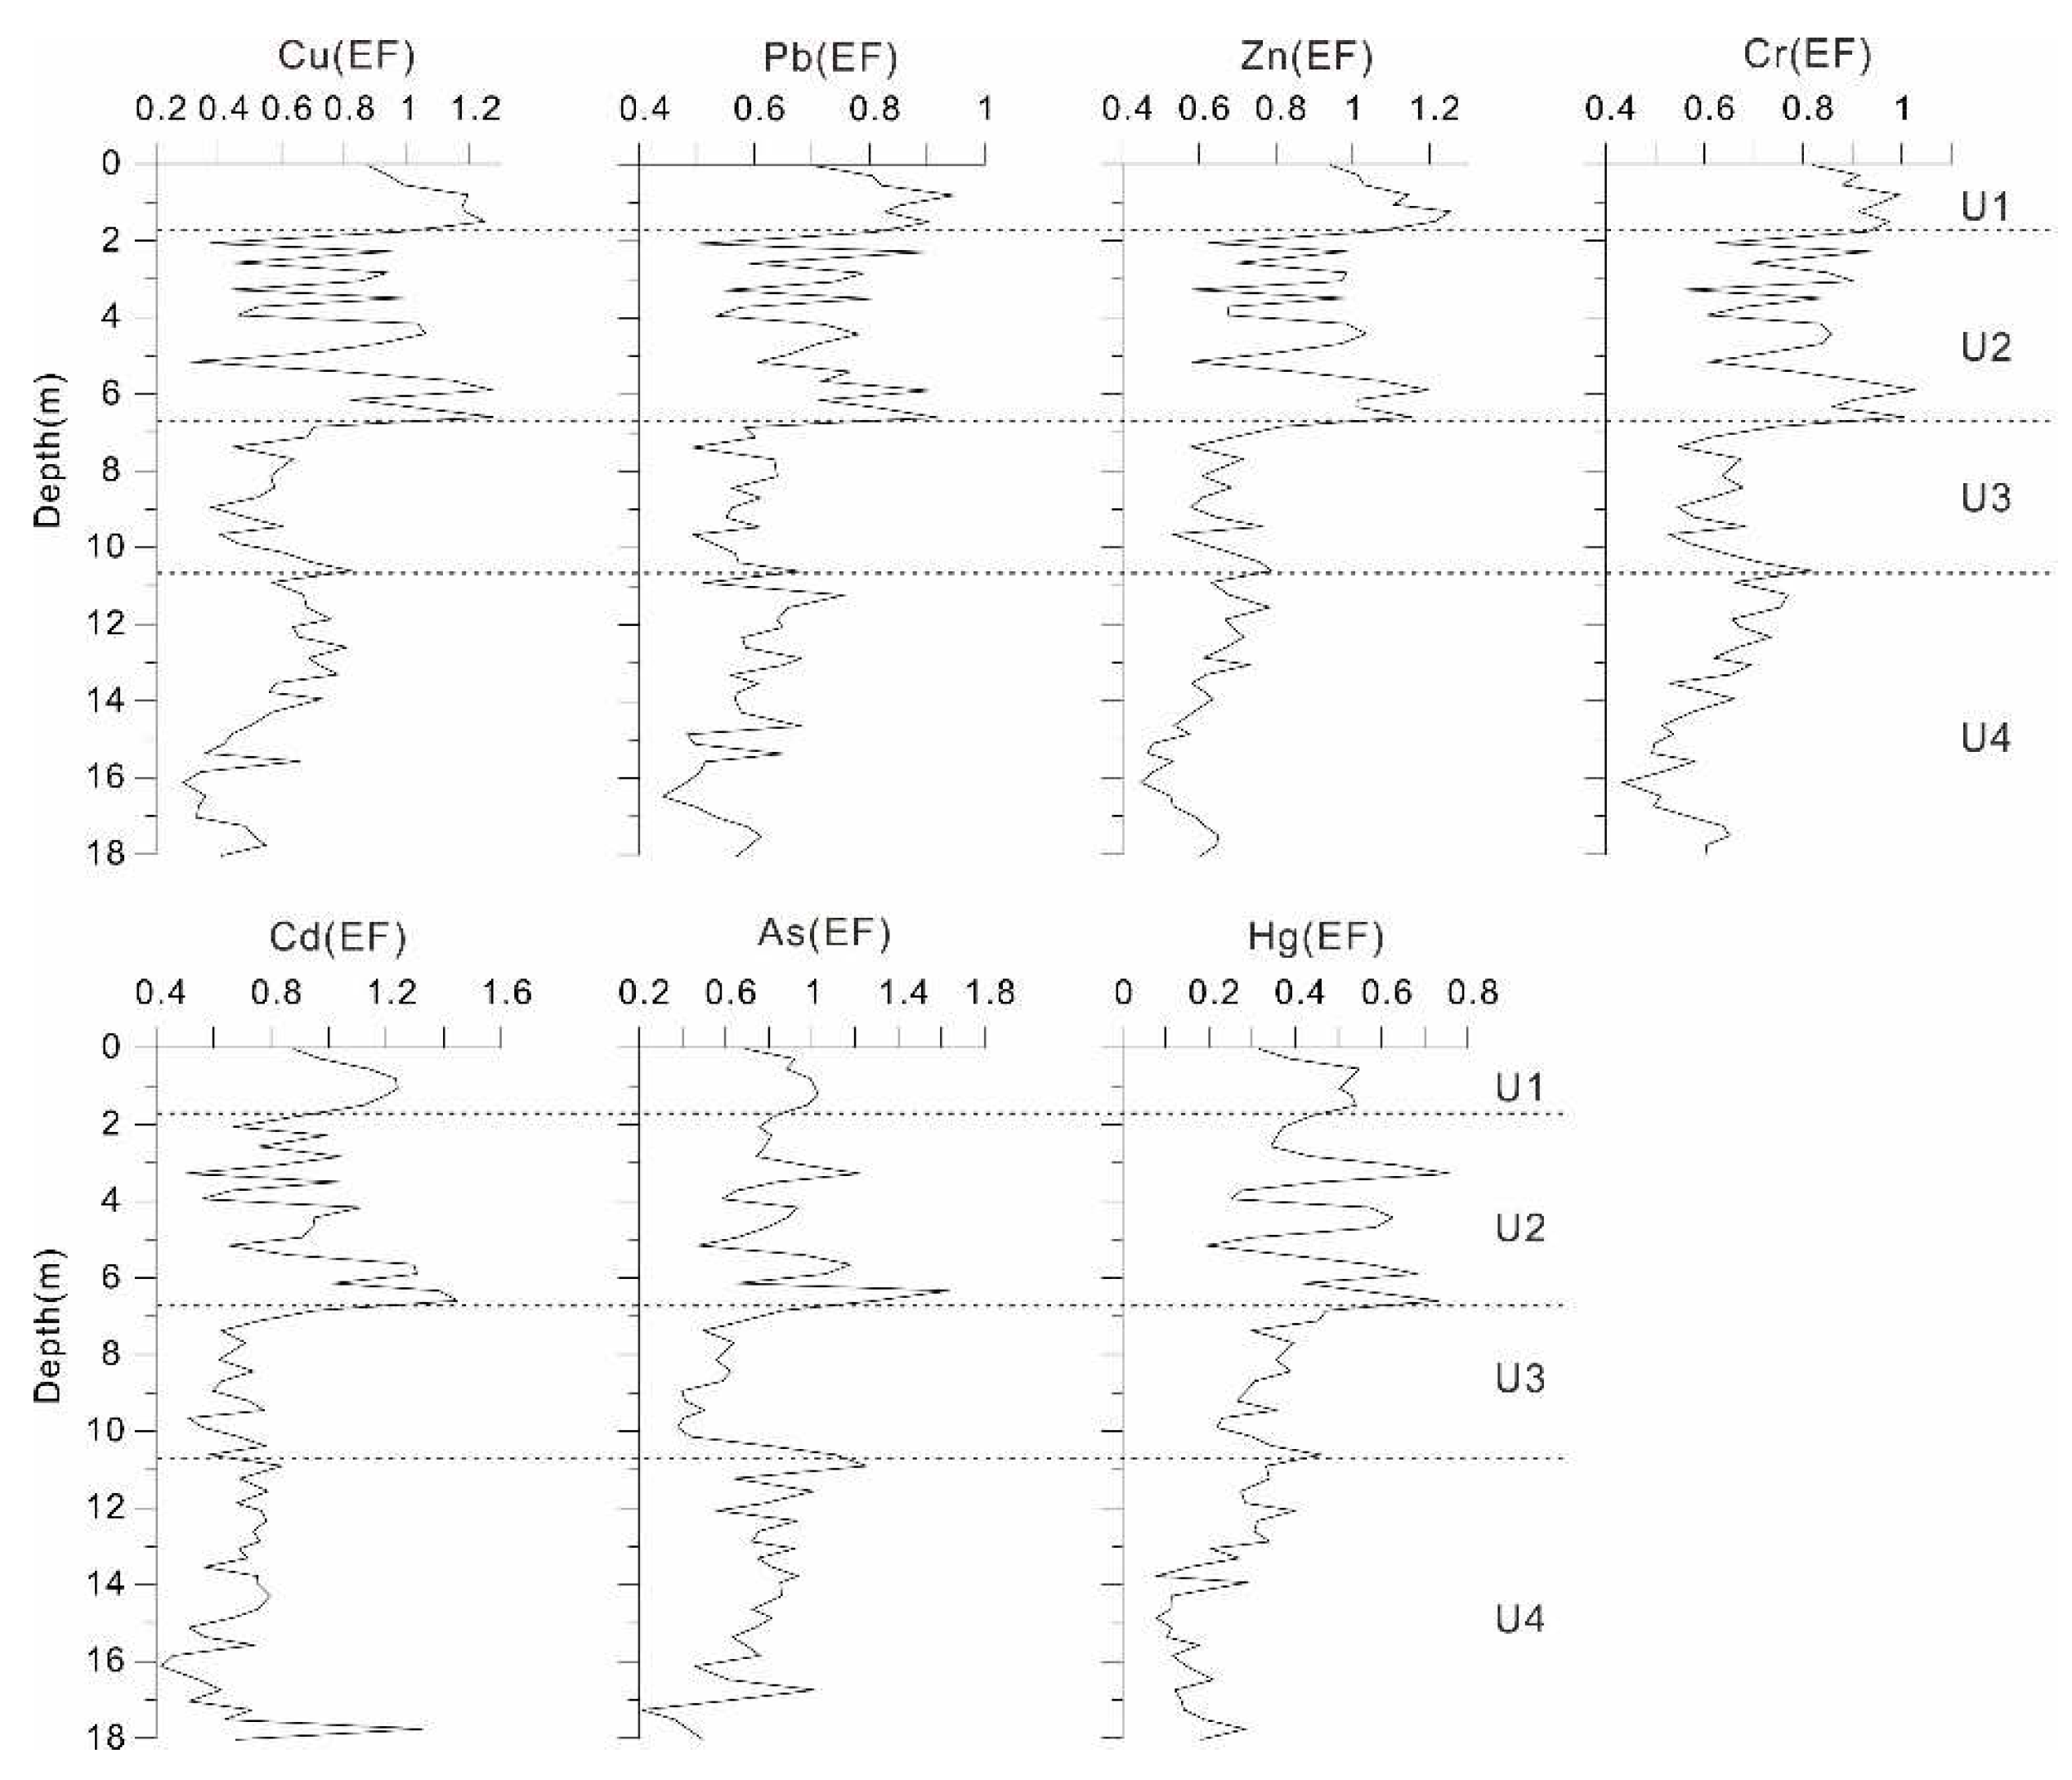
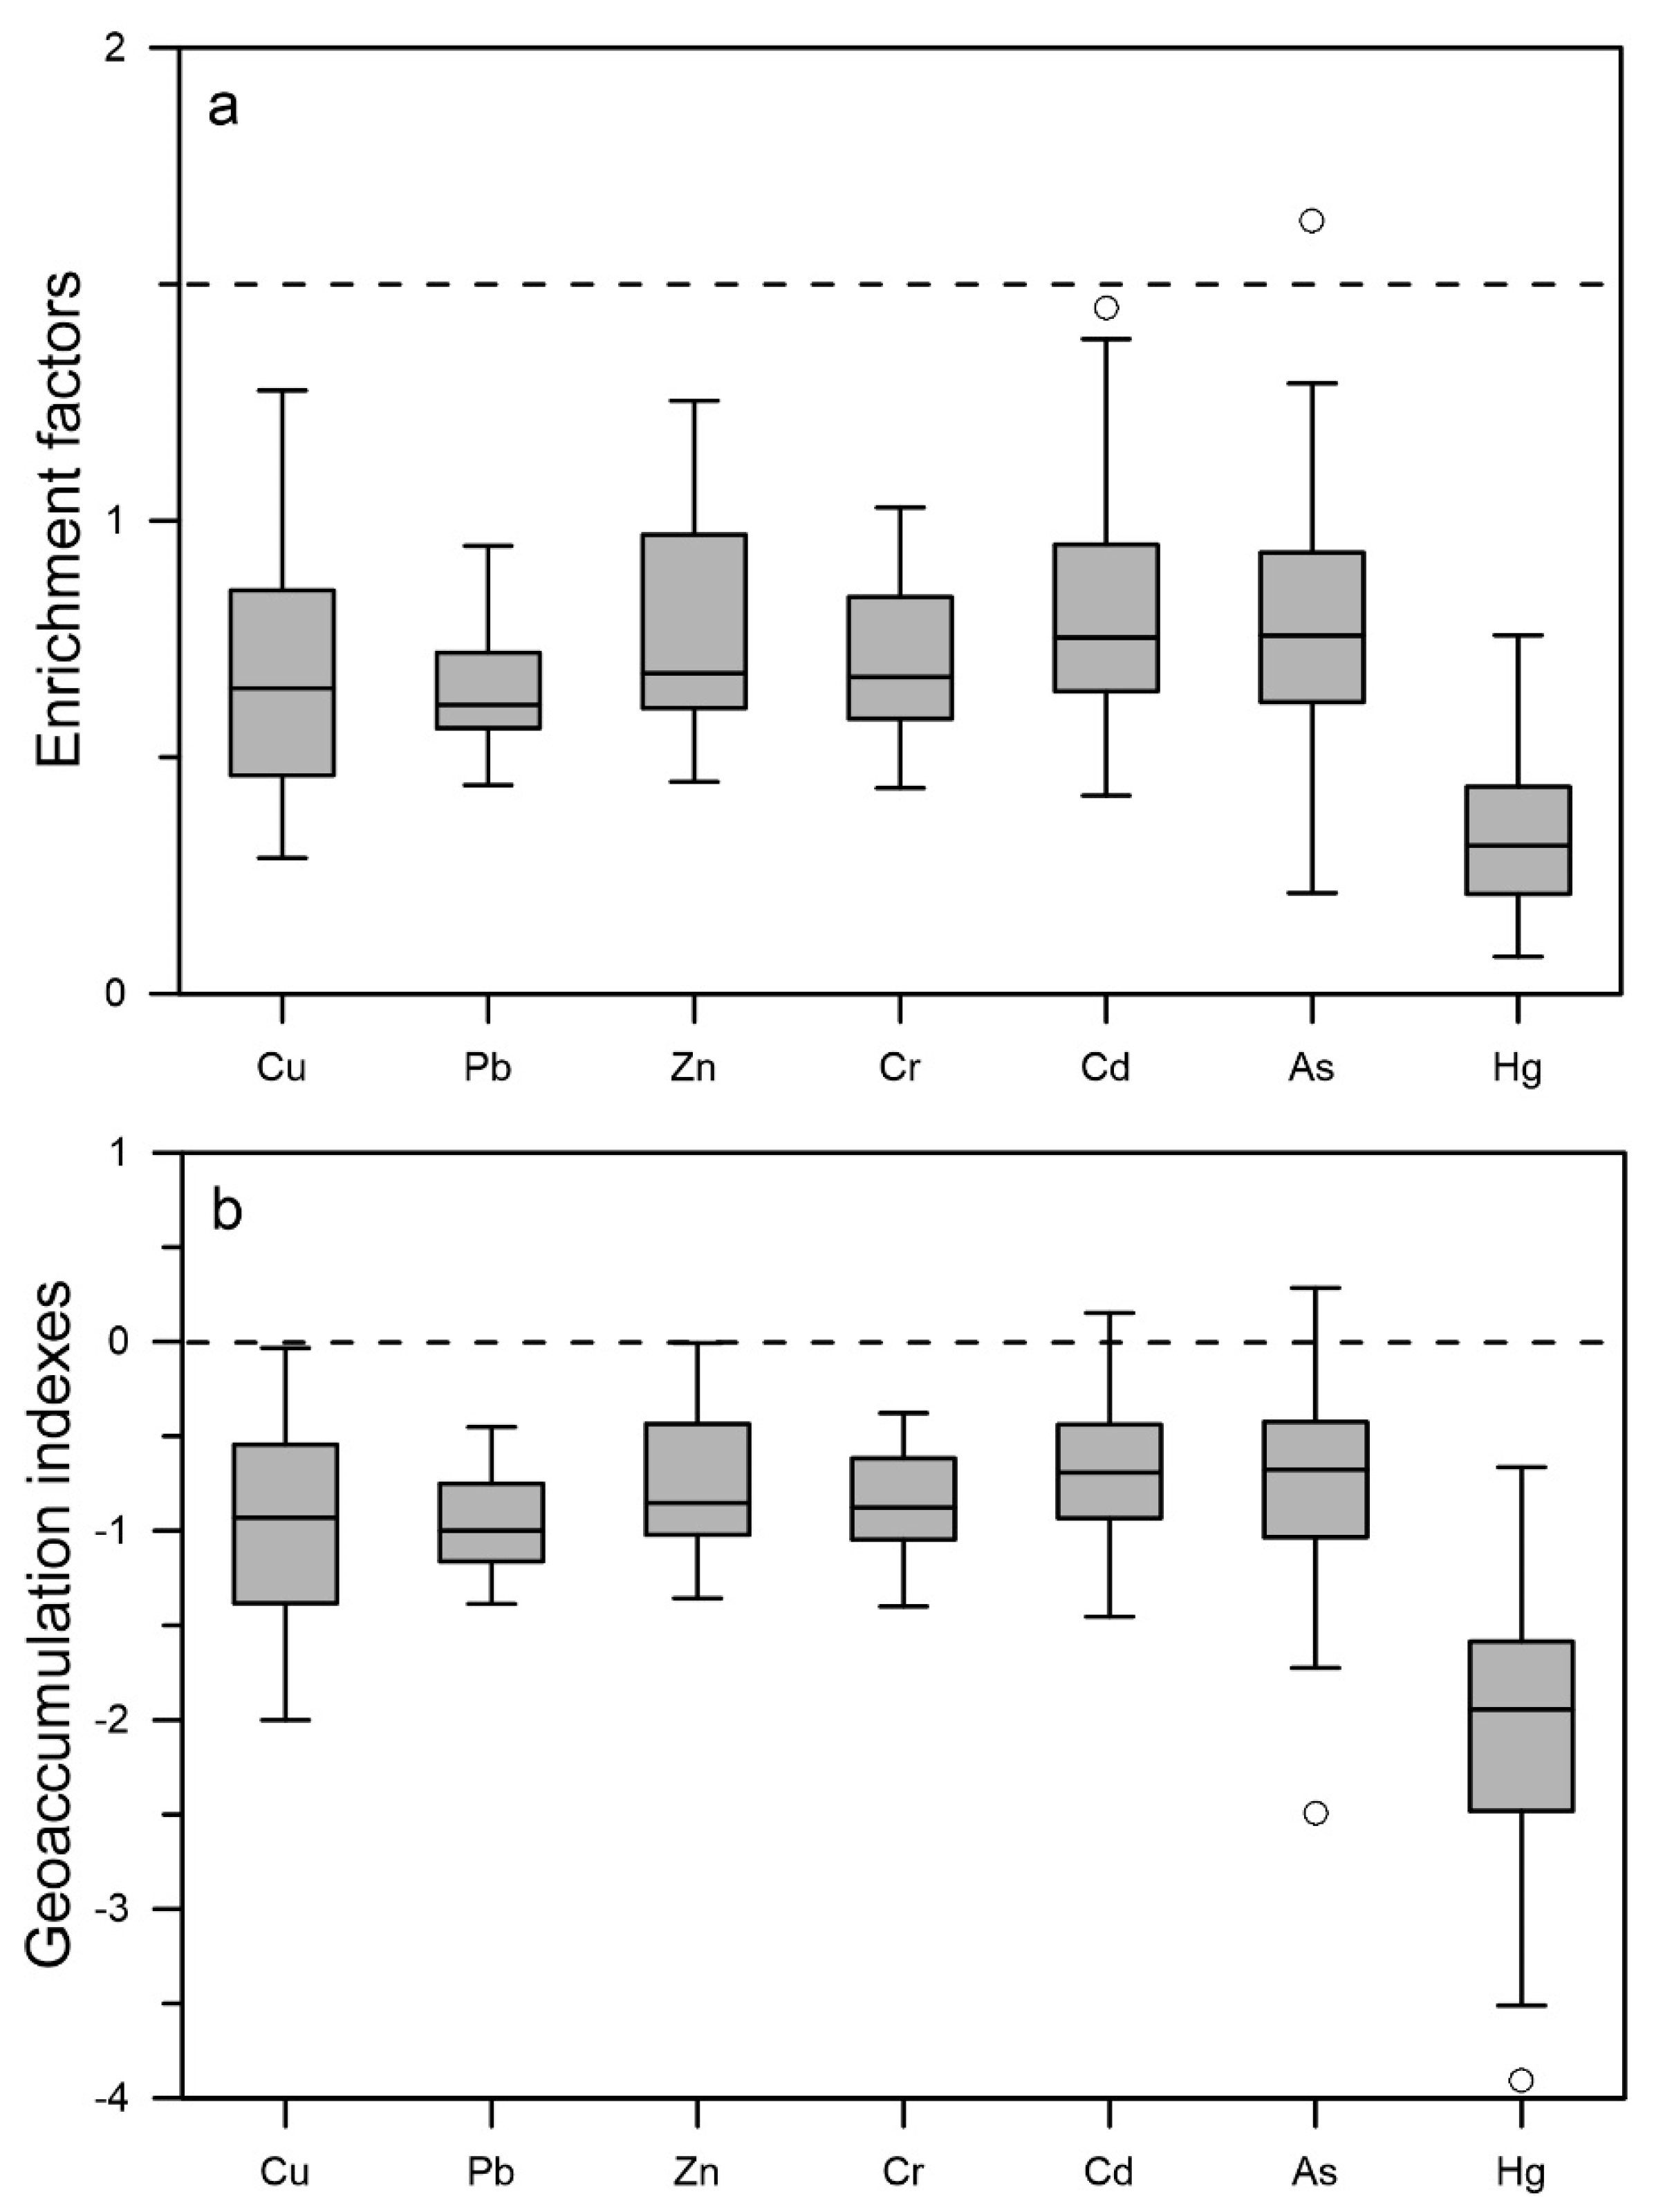
Figure 4 showed the calculated EF values in core sediments. The EFs of Cu, Pb, Zn, Cr, Cd, As, and Hg ranged from 0.29 to 1.28, 0.44 to 0.95, 0.45 to 1.25, 0.43 to 1.03, 0.42 to 1.45, 0.21 to 1.64, and 0.08 to 0.76, with mean values of 0.68, 0.65, 0.75, 0.70, 0.81, 0.77, and 0.34, respectively (Table 4). The EF values decreased in the order of Cd > As > Zn > Cr > Cu > Pb > Hg. The average EF of all metals was low (<1.5), suggesting that these metals were natural sources. The EF values of As exceeded 1.5 in 1.4% of the samples (Figure 4 and Figure 6a).
The Igeo values for Cu, Pb, Zn, Cr, Cd, As, and Hg in core sediments ranged from -2 to -0.03, -1.39 to -0.45, -1.36 to -0.01, -1.4 to -0.38, -1.45 to 0.15, -2.49 to 0.29, and -3.91 to -0.66, with mean values of -0.96, -0.96, -0.76, -0.85, -0.67, -0.76, and -2.07, respectively (Table 4). The average degree of pollution was the highest for Cd, followed by Zn, As, Cr, Cu, Pb, and Hg. The average Igeo values of all heavy metals were less than zero, indicating that the sediments were not polluted by these metals. The Igeo values of Cd and As exceeded zero in 5.6% and 4.3% of the samples, respectively (Figure 5 and Figure 6b).
The PINemerow values in the core sediments ranged from 0.37 to 0.82, with an average of 0.57 (Table 5 and Figure 7), indicating that the status of all sediments clean.
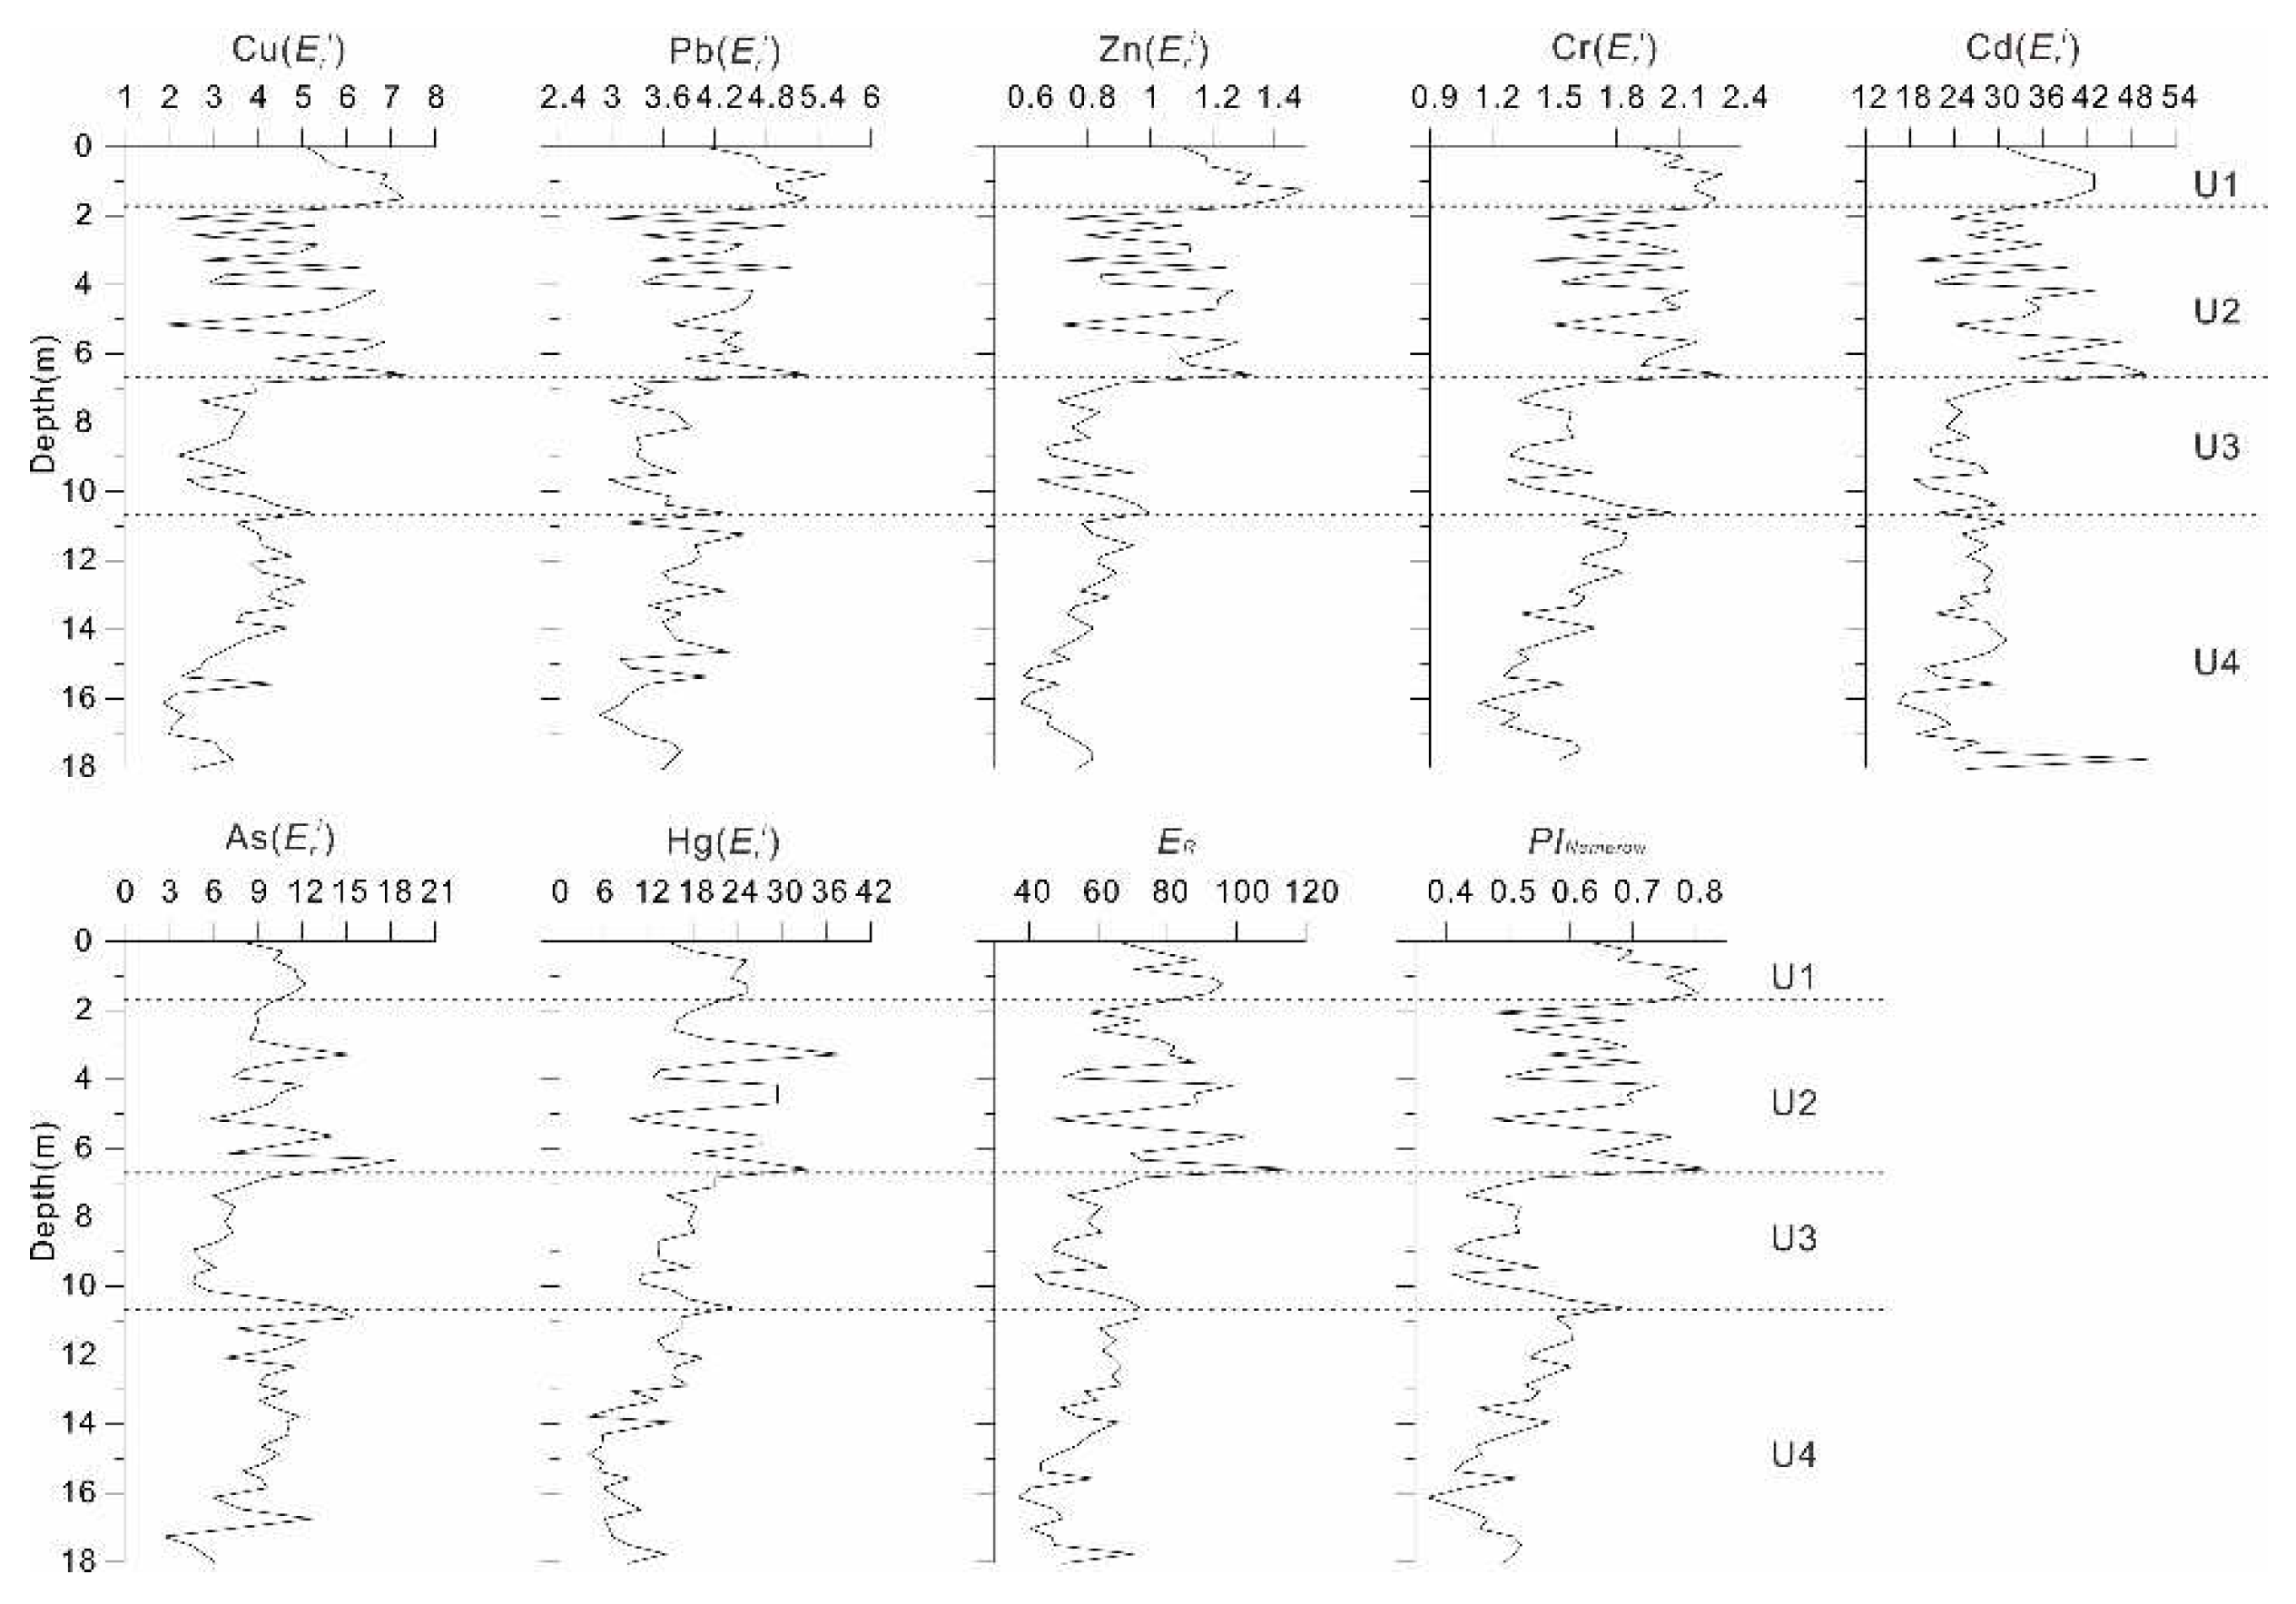
The vertical distribution of E r i was similar to that of Igeo (Figure 7). Except for Cd, the concentrations of all the other heavy metals were considered to present a low potential ecological risk ( E r i < 40) in all units (Table 4). For Cd, the sediments from units U1 and U2 were at moderate potential risk. The results of the potential ecological risk index (ER) showed that almost all heavy metals in the core sediments were at a low ecological risk (ER < 95) (Table 5 and Figure 7). Only a few layers in U1 and U2 showed a moderate ecological risk, appearing in the Middle and Late Holocene. Overall, the cumulative concentrations and potential ecological risk coefficients of the heavy metals in Laizhou Bay were low.
Figure 4. Vertical distributions of the EF values for trace elements in the core.
Preprints 96845 g004
Figure 5. Vertical distributions of the Igeo values for trace elements in the core.
Preprints 96845 g005
Figure 6. (a) Metal enrichment factors (EF) and (b) geoaccumulation indexes (Igeo) of trace metals in the core sediments of the present study.
Preprints 96845 g006
Figure 7. Vertical distributions of the E r i , ER and PINemerow values for heavy elements.
Preprints 96845 g007

4.2. Source of the Heavy Metals

The Pearson’s correlation coefficients between the concentrations of heavy metals (Cu, Pb, Zn, Cr, Cd, As, and Hg), selected major elements (Al and Fe), and Mz of the sediments are listed in Table 6. Except for As, Al was strongly correlated with the other elements (r = 0.61–0.94) and Mz (r = 0.73). Mz was moderately correlated with As and positively correlated with the other elements. Except for As, all the other elements were positively correlated with each other (1.0 > r ≥ 0.57).
Principal component analysis with varimax rotation was used to identify potential trace metal sources in the core sediments. The loadings are listed in Table 7. Only one principal component with eigenvalue > 1 was extracted, accounting for 78.21% of the total variance. The contribution of principal component 1 (PC1) (78.21%) included all metals and Mz, with high loadings for Al (0.93), Fe (0.98), Cu (0.96), Pb (0.87), Zn (0.97), Cr (0.97), Cd (0.90), Hg (0.75), and Mz (0.84), suggesting that these heavy metals had the same sources [30]. Al is considered as well conserved element and extremely resistant to weathering and erosion [31,32]. Therefore, Al is usually used as an indicator of terrigenous components in the ocean and of terrigenous origin. Aluminum was positively and moderately correlated with heavy metals. The average EF and Igeo values of all heavy metals were less than 1.5 and zero. Therefore, all the heavy metals can be inferred to be mainly derived from crustal materials or natural weathering. PC1 was a natural source. The EF and Igeo values of As exceeded 1.5 and zero in 1.4% and 4.3% of the samples, respectively, indicating that the As may have had an anthropogenic source.
The sources and variations in heavy metal content in sediments are closely related to terrestrial inputs, sea-level changes, provenance shifts, and dynamic depositional environments [33]. The U4 sedimentary unit formed during the MIS2 period when the sea level was 120 m lower than it is today. The study area was exposed to the seabed and experienced fluvial deposition from small rivers and the Yellow River along the southern coast of Laizhou Bay [9]. The sediments were coarse grained. The heavy metal content in most of the sediments in the study area showed a strong correlation with grain size, indicating that heavy metals were mainly adsorbed onto fine-grained sediments. Therefore, the heavy metal content of U4 was relatively low. During the Holocene, the sea level gradually increased. Based on AMS14C dating data from boreholes, U3 formed in the Early Holocene, approximately 8–10 thousand years ago [9]. Previous studies have shown that the sea level at that time rose to the vicinity of the borehole, indicating the presence of a coastline near the borehole. Therefore, a peat layer developed at the bottom of U3 However, the provenance did not change significantly, and coarse-grained sediment from the rivers was still transported to this area, resulting in a heavy metal content similar to that in U4. As the sea level continued to rise, the study area was submerged by seawater, and the estuary retreated inland, forming the U2 marine sediment during the Middle Holocene. At this time, it was difficult for sediment from small rivers along the southern coast of Laizhou Bay to reach the study area, and the sediment in the borehole was mainly from the Yellow River with a fine grain size. The heavy metal content then began to increase. After reaching its maximum around 6–7 thousand years ago, the sea level began to fall, and the study area formed coastal deposits, marking the formation of the Bohai Inner Circulation [13]. In addition to sediments from the Yellow River, sediments from other areas of the Bohai Sea may be transported to this region through circulation. The sediments brought by circulation were mainly fine-grained sediments, resulting in a further increase in the heavy metal content in U1.

4.3. Selection of Elemental Background Values

The elemental background value refers to the content of chemical elements and compounds in the soil that have not been influenced by human contamination. However, finding areas on the surface of the Earth's that have not been affected by human activities is difficult. Therefore, the use of drill core sediments from historical periods is a better approach for obtaining background elemental values. When assessing heavy metal pollution using surface sediments from Laizhou Bay, the selection of different background values often leads to incomparable evaluation results. In the present study, we used drill core sediments to determine the average content of heavy metal elements in U2, including Cu (22.65 mg/kg), Pb (21.67 mg/kg), Zn (66.41 mg/kg), Cr (62.18 mg/kg), Cd (0.09 mg/kg), As (9.77 mg/kg), and Hg (0.011 mg/kg), which can be considered as background values for the Laizhou Bay region. The U2 unit was formed during the Middle Holocene, approximately 8–4 ka BP, when Laizhou Bay was submerged by seawater and the sea level was stable. The sediment source and depositional environment were similar to those of the present day, and there was no human activity during this period. Therefore, the average values of heavy metal elements in U2 can be considered as the elemental background values.

5. Conclusions

In this study, the vertical distributions of major and trace metals and their pollution statuses were investigated in core sediments from Laizhou Bay, China. A general stratigraphic framework of the LZ01 core since MIS 2 was identified based on the ages, lithofacies characteristics, down-core distributions of heavy metals and grain size, and correlation with other well-studied cores from adjacent areas. Apart from As and Hg, all other metals had similar distribution patterns and could be divided into four stages: MIS 2, Late Holocene, Middle Holocene, and Late Holocene. Except for Hg, all the other heavy metals showed their highest average concentrations during the Late Holocene. Multiple indicators indicated that there was no element enrichment or contamination in the core sediments and that all heavy metals were naturally sourced. The average values of the heavy metals in U2 formed during the middle Holocene can be used as reference values for background values.

References

  1. Gil, F.; Olmedo, P. Food safety heavy metals and metalloids, in: Encyclopedia of Human Nutrition. 2023. [CrossRef]
  2. Thorat, B.; Prasad, P.; Ram, A. Heavy metal accumulation in a moderately polluted Ulhas estuary, Western India. Reg. Stud. Mar. Sci. 2023, 60, 102818. [Google Scholar]
  3. Briffa, J.; Sinagra, E.; Blundell, R. Heavy metal pollution in the environment and their toxicological effects on humans. Heliyon 2020. [Google Scholar] [CrossRef] [PubMed]
  4. Rehman, T.; Naz, S.; Hussain, R.; Chatha, A.M.M.; et al. Exposure to heavy metals causes histopathological changes and alters antioxidant enzymes in fresh water fish (Oreochromis niloticus). Asian J. Agricul. Biol. 2021. [Google Scholar] [CrossRef]
  5. Chen, B.; Liu, J.; Qiu, J.; et al. Spatio-temporal distribution and environmental risk of sedimentary heavy metals in the Yangtze river estuary and its adjacent areas. Mar. Pollut. Bull. 2016, 116, 469–478. [Google Scholar] [CrossRef] [PubMed]
  6. Li, C.; Wang, H.; Liao, X.; et al. Heavy metal pollution in coastal wetlands: A systematic review of studies globally over the past three decades. J. Hazard Mater. 2022. [Google Scholar] [CrossRef] [PubMed]
  7. Onakpa, M.M.; Njan, A.A.; Kalu, O.C. A review of heavy metal contamination of food crops in Nigeria. Ann. Glob. Health 2018. [Google Scholar] [CrossRef] [PubMed]
  8. Strode, E.; Jansons, M.; Purina, I.; et al. Sediment quality assessment using survival and embryo malformation tests in amphipod crustaceans: The Gulf of Riga, Baltic Sea AS case study. J. Mar. Syst. 2017. [Google Scholar] [CrossRef]
  9. Yuan, X.; Hu, R.; Feng, X.; et al. Sedimentary records and implications for the evolution of sedimentary environments inferred from BH1302 during the late Quaternary in the Bohai Sea, China. Mar. Geol. 2023, 456, 106986. [Google Scholar] [CrossRef]
  10. Duan, Y.; Pei, S.; Liao, M.; et al. Spatial distribution of heavy metals in the surface sediments of Laizhou Bay and their sources and pollution assessment. Mar. Geol. Quat. Geol. 2021, 41, 67–81. [Google Scholar]
  11. Wu, Z.; Dong, Y.; Liu, R. Assessment of heavy metal contamination in surface sediments off the Dongying coast, Bohai Sea. Mar. Pollut. Bull. 2022, 180, 113826. [Google Scholar] [CrossRef]
  12. Li, G.; Hu, B.; Bi, J.; et al. Heavy metals distribution and contamination in surface sediments of the coastal Shandong Peninsula (Yellow Sea). Mar. Pollut. Bull. 2013, 76, 420–426. [Google Scholar] [CrossRef] [PubMed]
  13. Xu, G.; Liu, J.; Pei, S.; et al. Sediment properties and trace metal pollution assessment in surface sediments of the Laizhou Bay, China. Environ. Sci. Pollut. Res. 2015, 22, 11634–11647. [Google Scholar] [CrossRef] [PubMed]
  14. Xu, Y.; Gao, H.; Wei, X.; et al. Heavy metals and their ecological risk in the surface sediments of Laizhou Bay. Period. Ocean Uni. China 2021, 51, 74–85. [Google Scholar]
  15. Folk, R.L.; Ward, W.C. Brazos river bar: a study in the significance of grain size parameters. J. Sediment. Res. 1957, 27, 3–26. [Google Scholar] [CrossRef]
  16. Stuiver, M.; Reimer, P.J.; Reimer, R.W. CALIB 8.2 [WWW Program]. 2020. at. http:// calib.org. accessed 2020-8-14.
  17. Aitken, M. An Introduction to Optical Dating: the Dating of Quaternary Sediments by the Use of Photon-stimulated Luminescence. 1998. Oxford University Press, Oxford.
  18. Marsh, R.; Prestwich, W.; Rink, W.; Brennan, B. Monte Carlo eterminations of the beta dose rate to tooth enamel. Radiat. Meas. 2002, 35, 609–616. [Google Scholar] [CrossRef]
  19. China National Environmental Monitoring Center (CNEMC). Chinese elemental background values for soils. 1990, Chinese Environmental Science Press, Beijing.
  20. Zhang, J.; Liu, C.L. Riverine composition and estuarine geochemistry of particulate metals in China-weathering features, anthropogenic impact and chemical fluxes. Estuar. Coast. Shelf Sci. 2002, 54, 1051–1070. [Google Scholar] [CrossRef]
  21. Muller, G. Heavy-metals in sediment of the rhine-changes since 1971. Umschau in Wissenschaft und Technik 1979, 79, 778–783. [Google Scholar]
  22. Müller, G. Die Schwermetallbelastung der sediment des Neckars und seiner Nebenflusse: eine Bestandsaufnahme. Chemiker Zeitung 1981, 105, 157–164. [Google Scholar]
  23. AQSIQ. (Administration of quality supervision, inspection and quarantine of the People's Republic of China). Marine Sediment Quality of China (GB 18668-2002). 2002. Standards Press of China, Beijing.
  24. Kowalska, J.; Mazurek, R.; Gąsiorek, M.; et al. Soil pollution indices conditioned by medieval metallurgical activity – A case study from Krakow (Poland). Environ. Pollut. 2016, 218, 1023–1036. [Google Scholar] [CrossRef]
  25. Hakanson, L. An ecological risk index for aquatic pollution control.a sedimentological approach. Water Res. 1980, 14, 975–1001. [Google Scholar] [CrossRef]
  26. Liu, R.; Wang, W.; Kong, L.; et al. Records of trace metals since the Holocene in sediments of Laizhou Bay, Bohai Sea, China. Mar. Pollut. Bull. 2023, 186, 114481. [Google Scholar] [CrossRef] [PubMed]
  27. Liu, S.; Zhang, Y.; Bi, S.; et al. Heavy metals distribution and environmental quality assessment for sediments off the southern coast of the Shandong Peninsula, China. Mar. Pollu. Bull. 2015, 100, 483–485. [Google Scholar] [CrossRef] [PubMed]
  28. Madadi, R.; Mejjad, N.; De-la-Torre, G.E. Geochemical speciation, ecological risk, and source identification of heavy metal(loid)s in sediments and waters from Musa Estuary, Persian Gulf. Mar. Pollut. Bull. 2023, 190, 114836. [Google Scholar] [CrossRef] [PubMed]
  29. Jeong, H.; Ra, K. Pollution and ecological risk assessments for heavy metals in coastal, river, and road-deposited sediments from Apia City in Upolu Island, Samoa. Mar. Pollut. Bull. 2023, 188, 114596. [Google Scholar] [CrossRef] [PubMed]
  30. Larrose, A.; Coynel, A.; Schäfer, J.; et al. Assessing the current state of the Gironde Estuary by mapping priority contaminant distribution and risk potential in surface sediment. Appl. Geochem. 2010, 25, 1912–1923. [Google Scholar] [CrossRef]
  31. Diagomanolin, V.; Farhang, M.; Ghazi-Khansari, M.; et al. Heavy metals (Ni, Cr, Cu) in the karoon waterway river, Iran. Toxicol. Lett. 2004, 151, 63–67. [Google Scholar] [CrossRef]
  32. Yuan, H.; Zhao, G.; Li, X.; et al. Regional distribution of heavy metals in surface sediments of Dafeng coastal wetlands in Yancheng, Jiangsu and its ecological implications. Mar. Geol. Front. 2018, 430, 51–59. [Google Scholar]
  33. Wang, Y. Spatial distribution characteristics and source analysis of heavy metals in sediments of typical estuaries on the south coast of Laizhou Bay. 2020, Master Dissertation of Shandong Normal University.
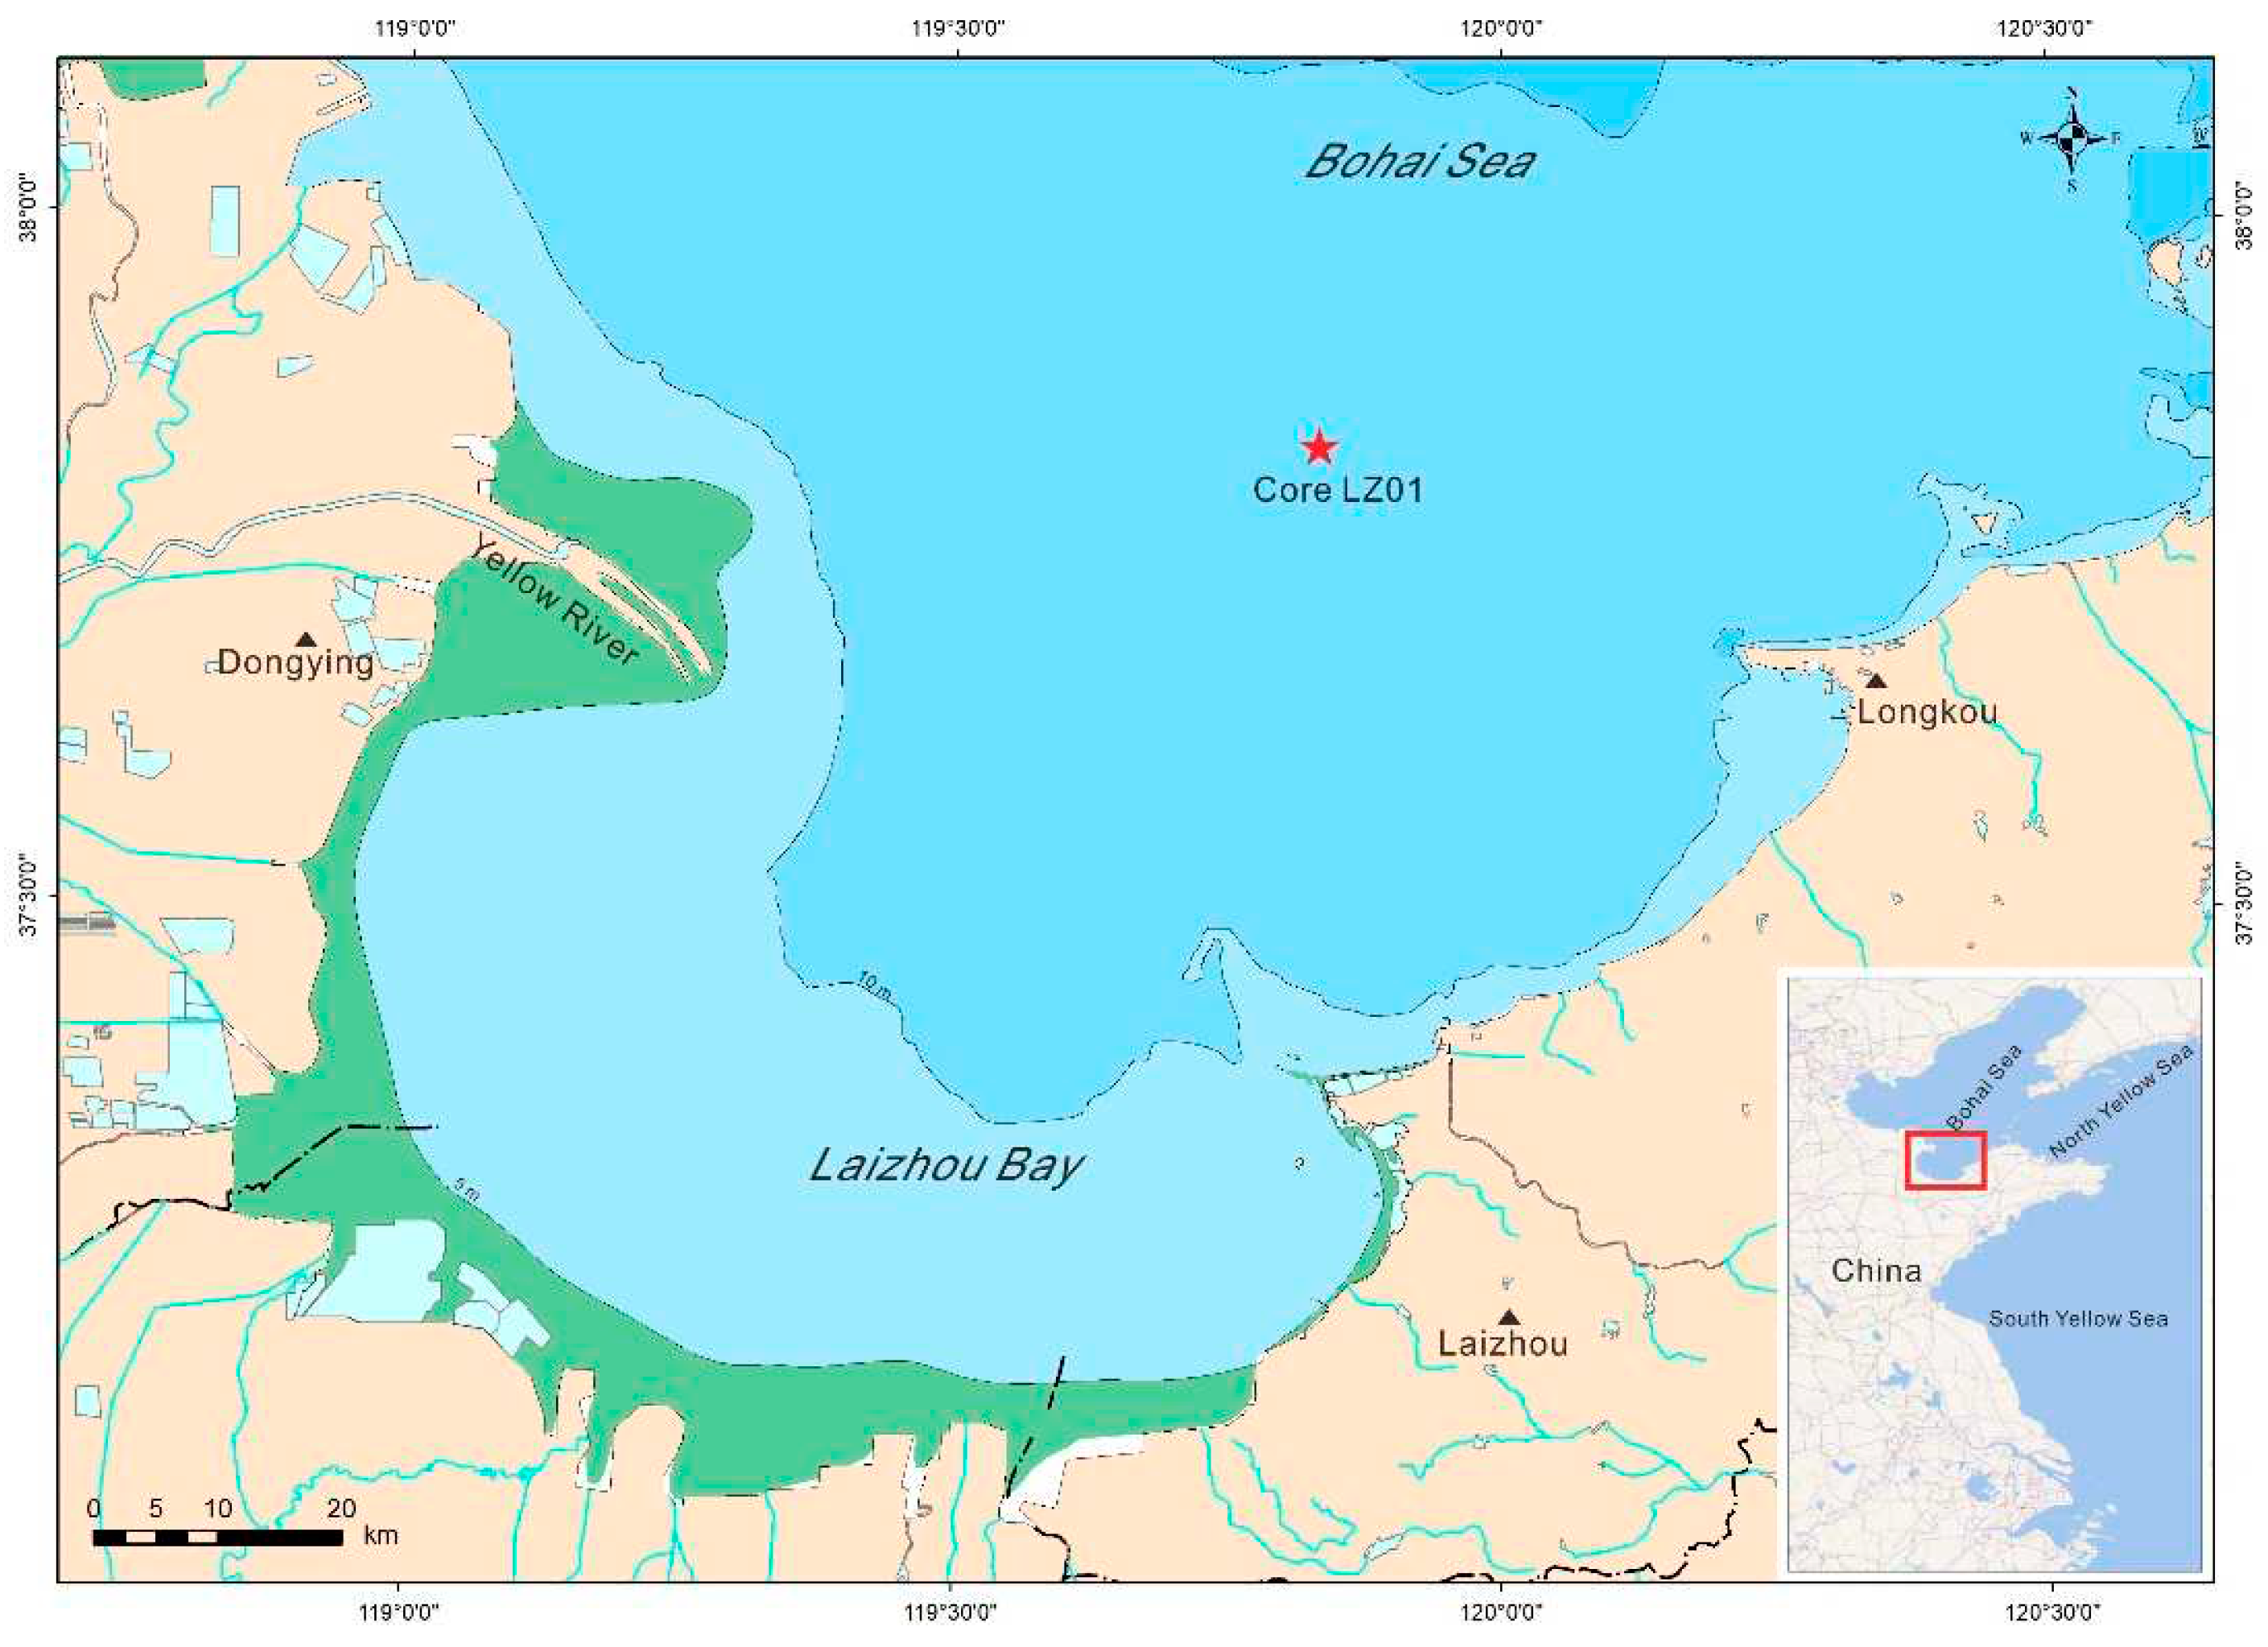
Figure 1. Location of the core LZ01 in the Laizhou Bay.
Preprints 96845 g001
Figure 2. Geological column of core LZ01 with AMS14C and OSL (a) and mean grain size (b).
Preprints 96845 g002
Figure 3. Vertical distribution of major and trace metals and mean grain size (Mz) in the core.
Preprints 96845 g003
Table 1. List of AMS14C ages from coreLZ01.
Depth (m) Materials δ13C
(permil)
Conventional age(14C yr BP) Calendar ages(Cal yr BP) Beta No.
Intercept Range (2σ)
6.83 Gastropod -2.3 8310 ± 40 9102 9012-9191 372002
8.40 Gastropod -4.8 8350 ± 40 9159 9065-9253 372003
10.46 Peat layer -22.9 8720 ± 40 9649 9563-9734 372004
10.64 Shell +4.1 8610 ± 40 9459 9405-9512 372005
Table 2. List of OSL ages from core LZ01.
Depth (m) Water content (%) U (ppm) Th (ppm) K (%) DE (Gy) Age (ka)
13.50 15.89 3.68 9.53 1.54 82.1 16.6 ± 2.0
16.27 16.97 2.75 6.7 1.59 102.16 24.9 ± 2.0
Table 3. Summary of trace metal concentrations in the sediment core and comparison with the average metal concentration in surface sediments (Unit: mg/Kg).
Locations time Cu Pb Zn Cr Cd As Hg References
LZ01 Avg. (n=71) 19.77 20.17 57.70 56.02 0.08 8.68 0.008 This study
U1 24.7-35 21.4-28.3 70.5-94.8 63.8-76.1 0.087-0.12 7.62-11.4 0.007-0.012
Avg. (n=8) 30.13 25.14 81.33 71.14 0.11 9.98 0.01
U2 9.1-35.2 15.2-27.2 45-84.2 46.2-76.2 0.053-0.14 5.37-17 0.005-0.018
Avg. (n=20) 22.65 21.67 66.41 62.18 0.09 9.77 0.011
U3 10.6-24.9 15.4-22.1 40.8-63.1 42.1-68 0.052-0.089 4.32-13 0.005-0.011
Avg. (n=15) 16.59 18.01 51.31 50.83 0.07 6.63 0.008
U4 9-24.4 14.8-23.5 37.2-60.1 37.5-61.2 0.046-0.14 2.48-14.4 0.002-0.009
Avg. (n=28) 16.57 18.80 48.15 50.09 0.07 8.62 0.005
Yellow River Estuary 22.84 21.23 64.8 61.07 0.09 11.12 0.01 [26]
Dongying Coast 22.5 21.6 70.2 66.4 0.12 12.8 na [11]
Laizhou Bay 19.06 20.3 55.98 60.1 0.11 11.72 0.038 [10]
Southern Shandong Peninsula 23.1 25 71.1 64.3 0.08 11.4 0.032 [27]
Coastal Shandong Peninsula 20 28.4 74.7 57.8 na na na [12]
Musa Estuary, Iran 23 7.33 51.5 105.5 0.18 2.48 na [28]
Upolu Island, Samoa 29 7.4 98.5 368 0.13 3.6 0.03 [29]
Element baseline in the soil of Shandong Peninsula 24 25.8 63.5 66 0.084 9.3 0.019 [19]
Table 4. Background values, EF, Igeo, and E r i values of trace metals in the core LZ01.
Parameters Cu Pb Zn Cr Cd As Hg
Mbackgrounda (mg/kg) 24 25.8 63.5 66 0.084 9.3 0.019
EF 0.29-1.28 0.44-0.95 0.45-1.25 0.43-1.03 0.42-1.45 0.21-1.64 0.08-0.76
0.68 0.65 0.75 0.70 0.81 0.77 0.34
Igeo -2 to -0.03 -1.39 to -0.45 -1.36 to -0.01 -1.4 to -0.38 -1.45- 0.15 -2.49-0.29 -3.91 to -0.66
-0.96 -0.96 -0.76 -0.85 -0.67 -0.76 -2.07
E r i 1.88-7.33 2.87-5.48 0.59-1.49 1.14-2.31 16.43-50 2.67-18.28 4-37.89
4.12 3.91 0.91 1.7 29.26 9.33 16.15
a Background values of heavy metals are the elemental baseline in the soil of the Shandong Peninsula[19].
Table 5. ER and PINemerow values for core sediments.
U1 U2 U3 U4
ER 66.55-96.01 46.97-114.76 41.95-72.18 36.93-72.07
Avg. 82.53 76.55 57.76 54.89
PINemerow 0.64-0.8 0.47-0.82 0.41-0.68 0.37-0.6
Avg. 0.74 0.64 0.50 0.50
Table 6. Pearson's correlation matrix for the major and trace metals and Mz (n= 71).
Al Fe Cu Pb Zn Cr Cd As Hg Mz
Al 1
Fe 0.94** 1
Cu 0.90** 0.94** 1
Pb 0.86** 0.85** 0.85** 1
Zn 0.93** 0.98** 0.93** 0.84** 1
Cr 0.93** 0.96** 0.92** 0.85** 0.96** 1
Cd 0.73** 0.82** 0.82** 0.78** 0.81** 0.77** 1
As 0.44** 0.56** 0.53** 0.40** 0.46** 0.47** 0.54** 1
Hg 0.61** 0.71** 0.70** 0.57** 0.73** 0.72** 0.57** 0.46** 1
Mz 0.73** 0.80** 0.82** 0.68** 0.78** 0.81** 0.68** 0.42** 0.57** 1
** Correlation is significant at the 0.1 level (two-tailed).
Table 7. Rotated component matrix for data of core sediments and eigenvalues, percentage of variances, and eigenvectors for the principal component (PC1).
Parameter PC1
Al 0.93
Fe 0.98
Cu 0.96
Pb 0.87
Zn 0.97
Cr 0.97
Cd 0.90
As 0.55
Hg 0.75
Mz 0.84
Eigenvalues 7.82
Percentage of variances 78.21
Cumulative % eigenvectors 78.21
Disclaimer/Publisher’s Note: The statements, opinions and data contained in all publications are solely those of the individual author(s) and contributor(s) and not of MDPI and/or the editor(s). MDPI and/or the editor(s) disclaim responsibility for any injury to people or property resulting from any ideas, methods, instructions or products referred to in the content.
Copyright: This open access article is published under a Creative Commons CC BY 4.0 license, which permit the free download, distribution, and reuse, provided that the author and preprint are cited in any reuse.
Prerpints.org logo

Preprints.org is a free preprint server supported by MDPI in Basel, Switzerland.

Subscribe

© 2024 MDPI (Basel, Switzerland) unless otherwise stated