1. Introduction
Viscosity is one of the most critical rheological measurements of fluids. Many recent reports on miniaturized viscosity sensors offer the advantage of inexpensive, in-situ, real-time, and continuous measurements [
1]. These are being used in many different industries, including automotive [
2,
3], and industrial settings [
4,
5,
6,
7,
8], to monitor fluid conditions. In addition, biomedical applications also use viscosity sensors to monitor things like blood coagulation rates and other biological properties of fluids [
9,
10,
11,
12].
Many of these miniaturized sensors are fabricated using a micro-electro-mechanical (MEMS) fabrication process. Although many different types of actuation and sensing are reported, this paper will focus on those based on vibrating elements. These vibrating sensors measure viscosity by using cantilever beams or plates [
13,
14,
15,
16], resonating membranes [
17], or through quartz crystal resonators technology [
18]. These vibration elements must be in contact with the fluid being tested to measure their rheological properties effectively.
The vibration elements in MEMS sensors are generally actuated through an electrical signal, and their behavior and interaction with the fluid are measured through another electrical signal. Both of these electrical signals are generally on-chip and integrated within the sensor. These electrical signals need to be effectively isolated from one another to obtain a reliable measurement. Isolating the electrical signals from the fluid is generally not a concern when measuring non-electrically conductive fluids such as lubricating oils used in automotive or industrial settings. On the other hand, an effective and reliable way to isolate the on-chip electrical signals is needed when measuring electrically conductive fluids in the food industry or biomedical applications.
There are several methods to waterproof electronics by applying a hydrophilic film. These include the CVD-based Parylene-C [
19,
20,
21,
22,
23,
24], silicone-based coating, and other polymers [
25,
26,
27]. Even though these have been proven effective at protecting packaged electronics and components placed on a PCB [
28,
29,
30,
31], there have not been many studies of their effectiveness when protecting actuators embedded in the sensing environment [
24].
As such, there is a need to adequately protect the electronic signals of MEMS devices, including sensors and micro-actuators submerged in fluids or other harsh environments. This work briefly describes the fabrication and packaging of thermally actuated MEMS viscosity sensors. Several sensors are tested in oil before applying three different waterproofing materials. The sensors are tested for differences in sensing performance in a conductive fluid before testing their longevity in fluids with an accelerated bias. Finally, an analysis of the failures is described to conclude this work, which guides coating solutions for micro-scale actuators operating in harsh and damaging environments.
2. Materials and Methods
Thermally actuated MEMS viscosity sensors were fabricated using the process described in [Puchades]. After fabrication, the sensors are singulated using a wafer saw and attached to an FR-4 PCB with a two-part epoxy (Loctite Epoxy Heavy Duty). The PCB has an access hole drilled on the back so that the fluid under test can access both sides of the membrane. The sensor is then wire-bonded to the copper traces in the PCB. The wire-bonding wire (75-µm diameter Al/Si wire) and the metal pads on the sensor are then covered with the same two-part epoxy for electrical isolation and protection during handling and testing. The center of the membrane is exposed to the liquid. Lastly, pin headers are soldered to the PCB board a distance away from the sensor.
The fabricated sensors are tested in standard calibrating oils N10, N26, N35, and N100 (Cannon Instruments Company). The sensors are actuated with a 20-V, 50 µsec pulse at a repetition rate of 5 Hz. The heater resistance is 100 Ohms. The resulting signal corresponds to a free-response of an underdamped harmonic oscillation and is monitored and measured using a LabVIEW interface as described in [
32]. Data is collected for 3 minutes in each oil. The sensors are cleaned with a degreaser solution (Formula 409), rinsed in DI water and isopropyl alcohol (IPA), and thoroughly dried between tests.
One packaged sensor without the waterproofing coated is tested with the same test bias conditions (20-V, 50 µsec pulse at a repetition rate of 5 Hz) until failure. The failure is inspected with an optical microscope and scanning electron microscope (SEM.)
Three waterproofing materials are then applied to different sensors: Parylene-C, “nano coat” (Chipquick), and nitrocellulose-based polymer film (DS - Sally Hansen Diamond Strength Nail Polish). Parylene-C is deposited using a room temperature low-pressure chemical vapor deposition process using a Specialty Coating Systems Parylene-C dimer as a precursor for 0.5 µm and 2.0 µm thicknesses. An adhesion promoter (A-174 Silane from CA Cookson Electronics Co.) is used as an overnight pre-treatment on the sensors receiving a Parylene-C thin film. Liquid nano-coating from Chipquick, model NANOCOAT200UV-2, is coated via a dip coat method and cured at 60 °C for 10 minutes. Four dip/cure cycles are applied for a target thickness of ~0.5 µm. The nitrocellulose-based polymer (DS) is applied using a single brush-on application and cured at room temperature for 24 hours for a target thickness of 2 µm.
The thickness of the waterproofing materials was measured using a Tencor P-2 stylus profilometer on test structures on cleaned glass slides that had been masked with KaptonTM (3M) tape.
The sensors are then tested in glycerol/water mixtures of 66%, 77%, 80%, and 92% glycerol-to-water ratios by volume. Tap water was used to ensure the presence of ions. The sensors are actuated with the same conditions as when tested in oil. The sensors are cleaned in DI water and dried between tests.
Long-term reliability tests are performed in 66% glycerol/water mixtures in selected sensors for 1.2 million actuations, which corresponds to ~1.5 days of continuous actuation at a rate of 10 actuations per second. The test conditions are 20-V, 50 µsec pulse at a repetition rate of 10 Hz. If there were no failures, the actuation energy was increased by 5X to accelerate failures by increasing the heater voltage pulse bias to 45 V.
3. Results and Discussion
The fabricated thermally actuated viscosity sensors used in this study are based on the work presented in [
17]. The working principle of this sensor is based on the thermal impulse actuation of a thin silicon membrane, which vibrates at its natural frequency. When the sensor is immersed in a fluid, the underdamped response of the system can be analyzed to obtain fluid properties such as density and viscosity. The thermal impulse is applied to the membrane via an in-situ polysilicon resistor. The movement of the membrane is measured through a Wheatstone bridge of boron-implanted p+-silicon piezo resistors. During normal operating conditions, the center of the membrane has been shown to be displaced by ~120 nm when an instant power of 4 Watts is applied [
32,
33]. The driving and amplification circuitry are described in detail in [
32].
3.1. Fabrication and packaging of thermally actuated MEMS viscosity sensors
Careful packaging of the fabricated sensors is critical to achieve effective insulation of the metal signal traces from the conductive fluids.
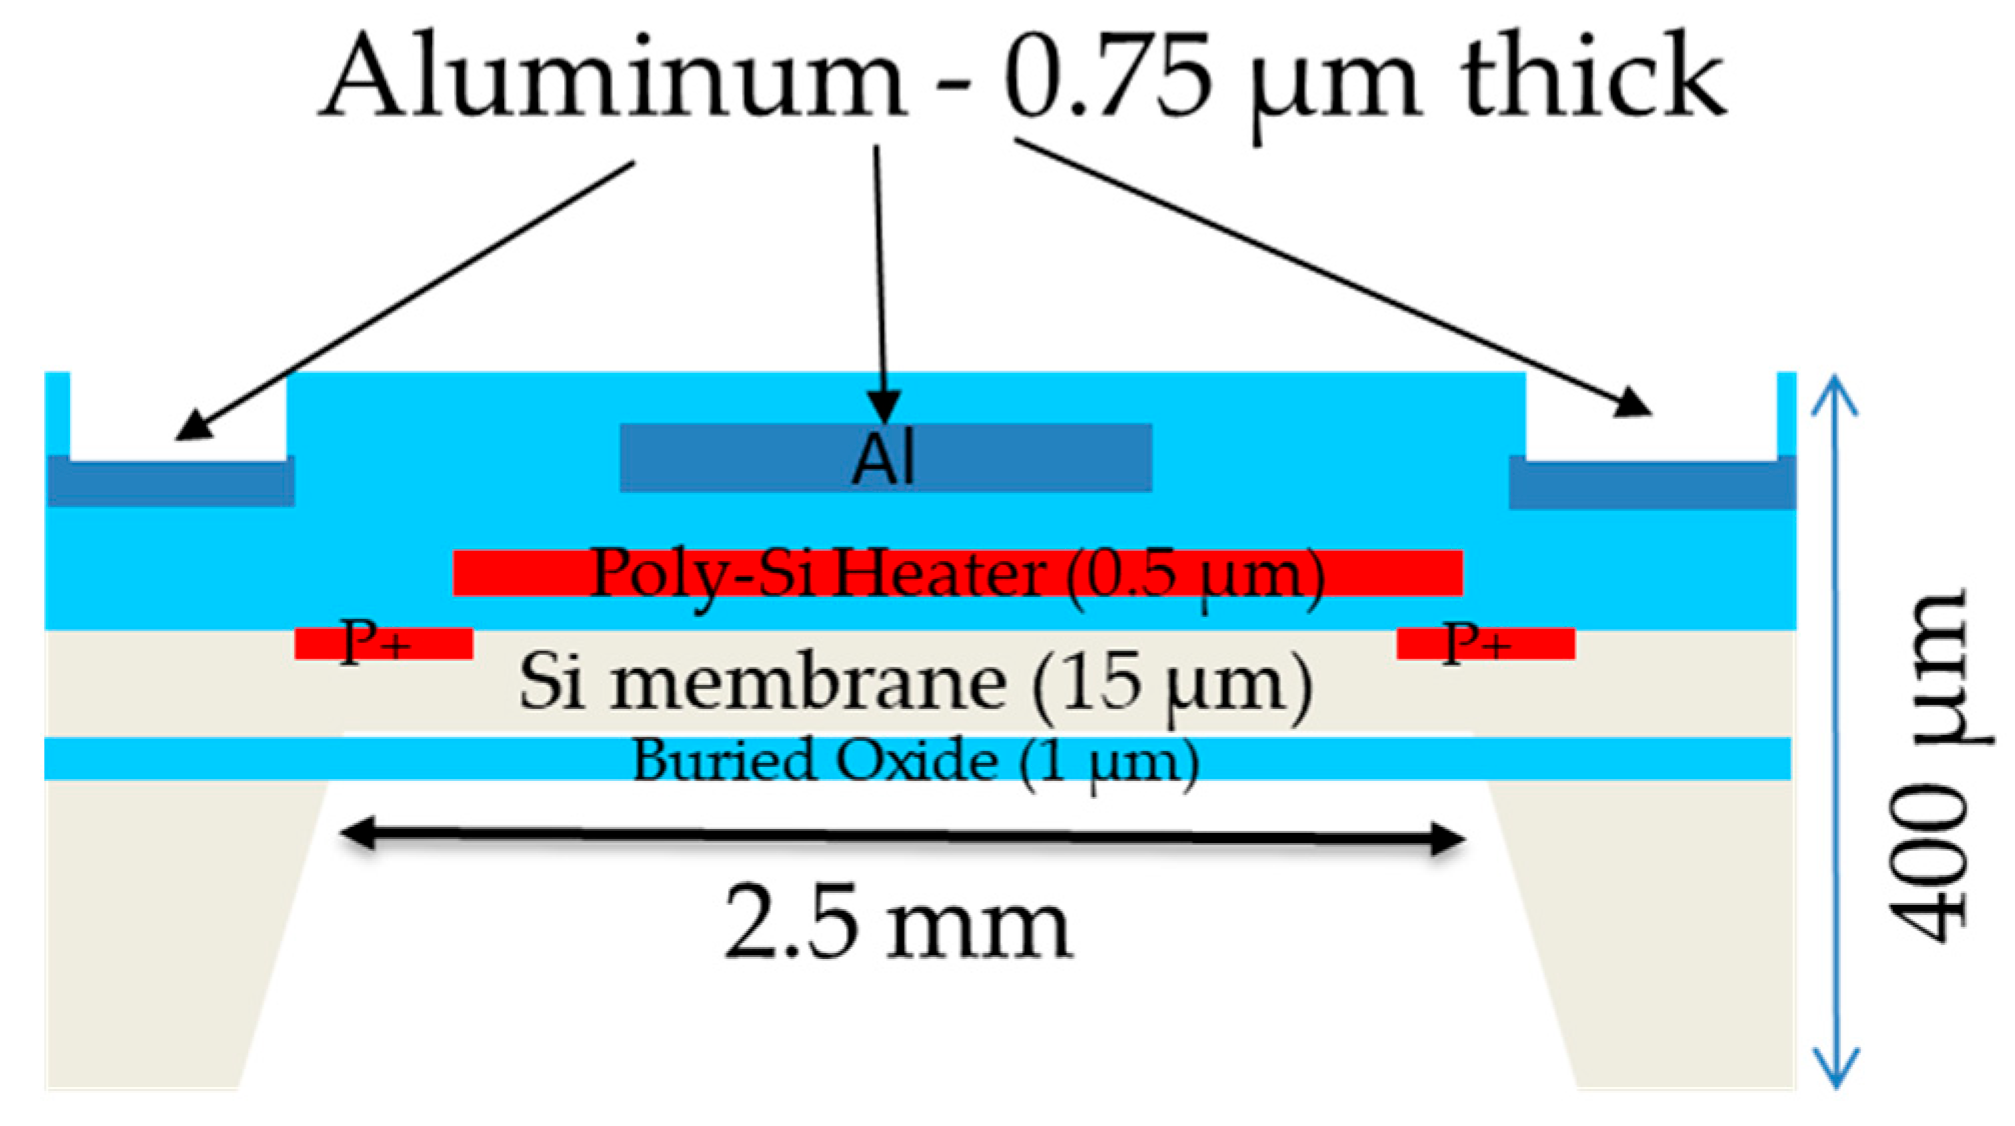
Figure 1a shows a cross-section schematic of the sensor material components. As described in detail by [
17], a silicon membrane of 15 µm of thickness is fabricated on SOI substrates. Sensing resistors are placed in a Wheatstone configuration by ion implanting boron ions (B
11+) directly into the silicon. These sensors are used to monitor the vibration of the membrane. The membrane actuation is accomplished by pulse-heating the polysilicon heater (0.5 µm thick) in the center of the membrane. Aluminum (0.75-µm thick) is used as the thin film material connecting the actuating and sensing elements. All these layers are insulated from one another using SiO
2. In addition, a final 0.5-µm thick SiO2 layer is used as a final passivation layer, burying the interconnecting aluminum. This top SiO2 layer is etched in certain regions to crate pad openings to connect the aluminum to the PCB via wire bonds.
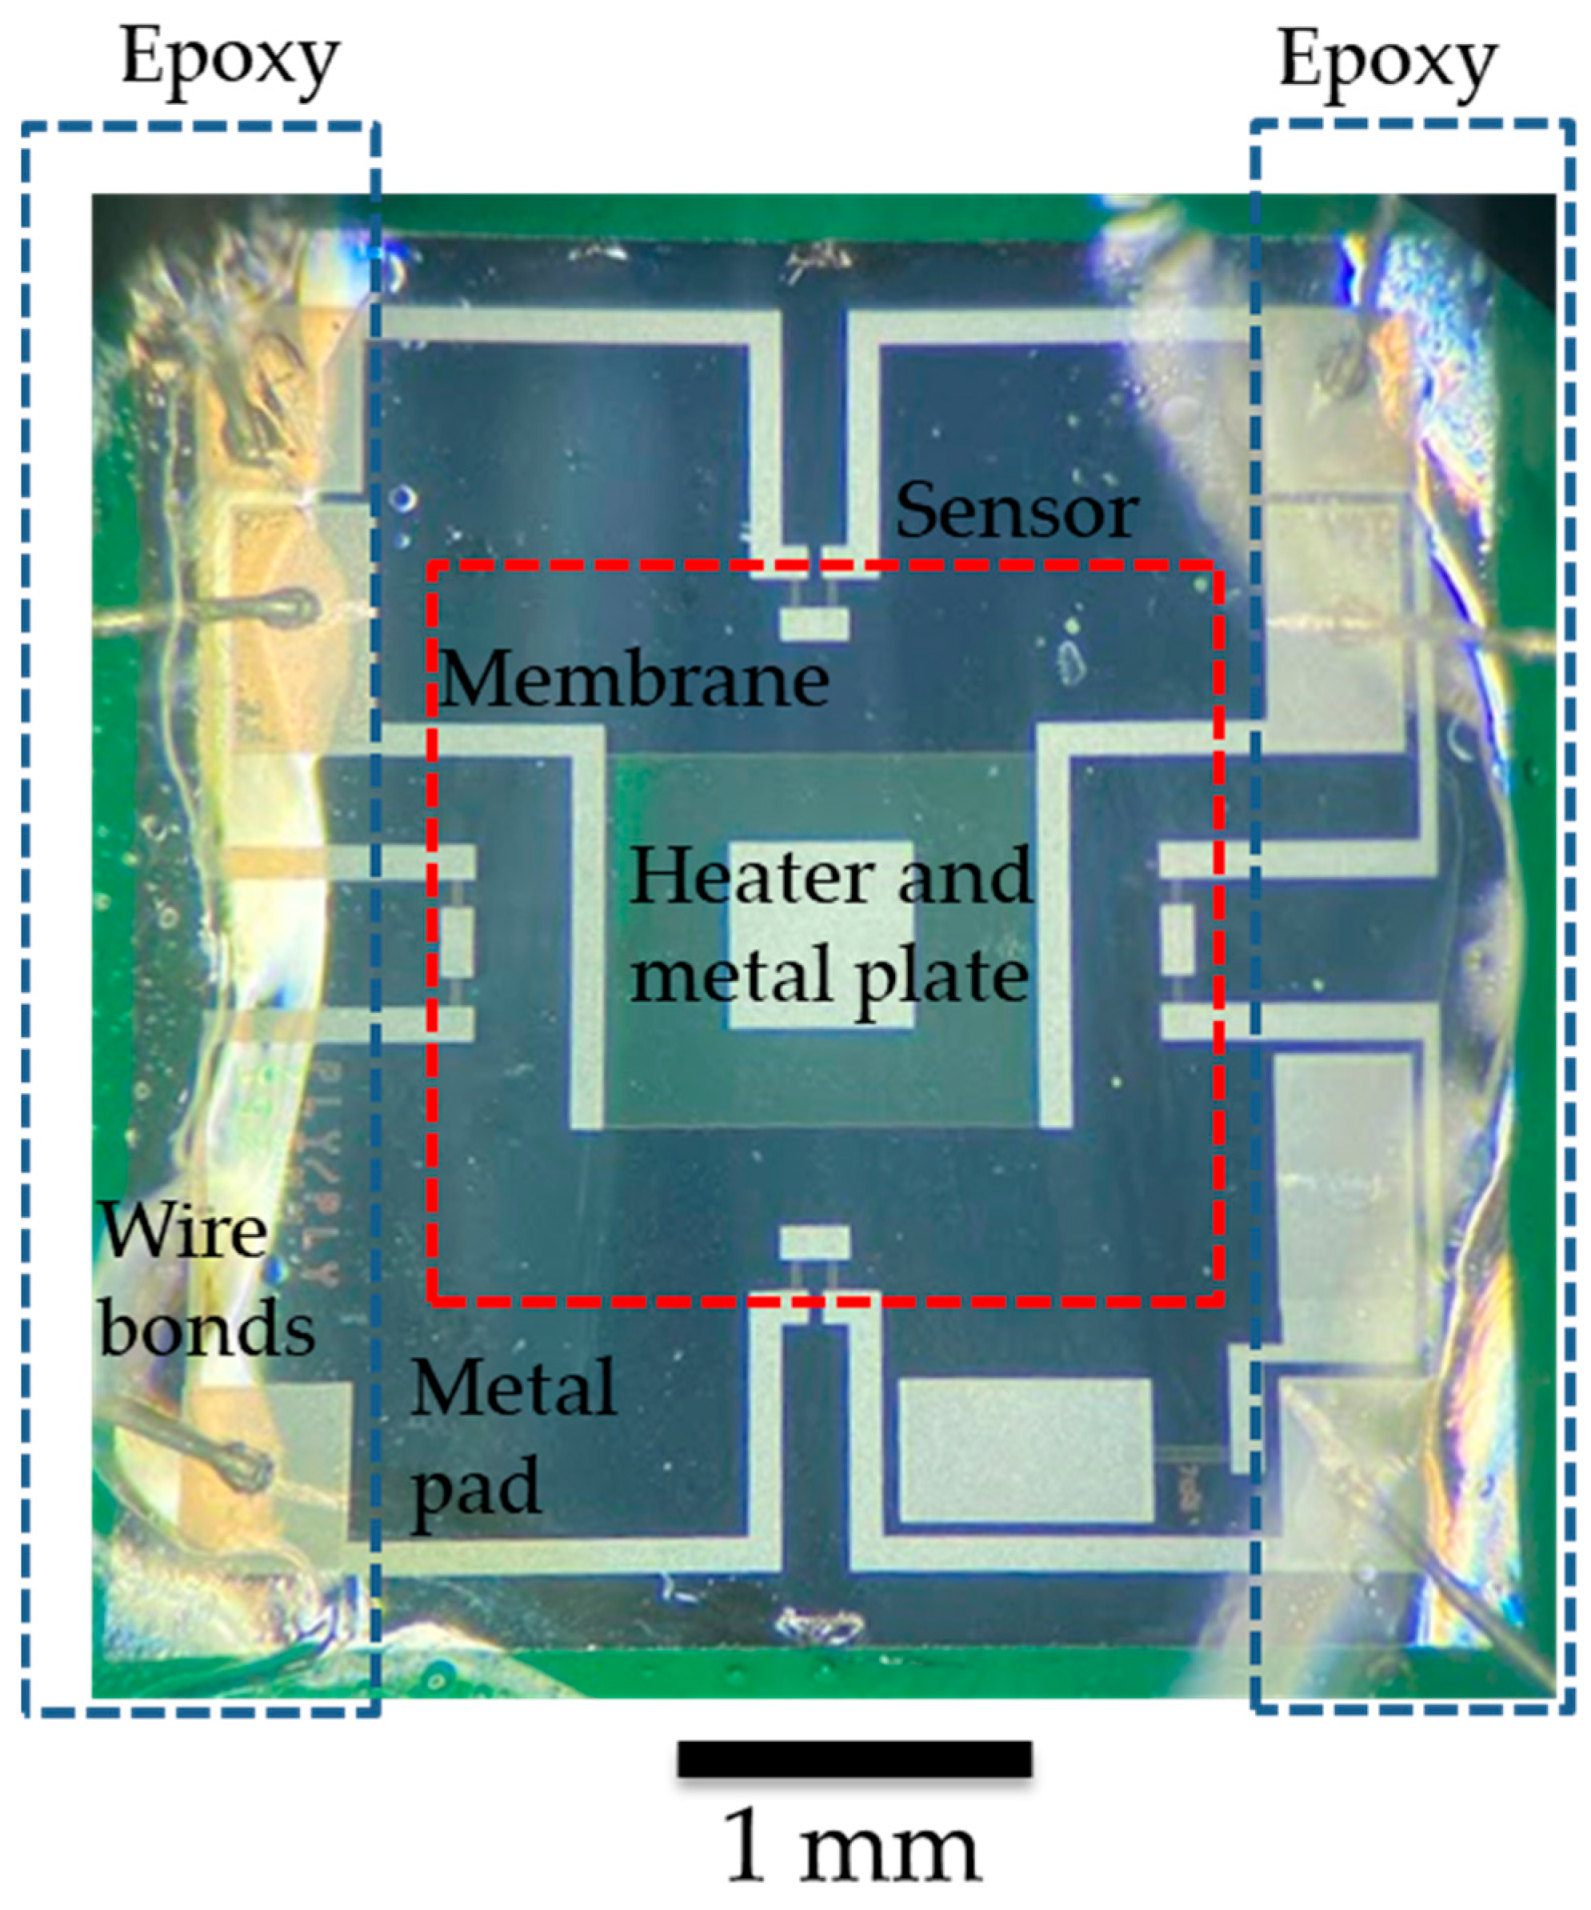
Figure 2 shows a top-down picture of a packaged device before testing in air and oil. Text labels are included to indicate the main actuation and sensing components and the exposed metal pads and wire bonds that need to be protected during packaging. Epoxy is applied over the wire bonds and the exposed metal pads for mechanical stability and waterproofing. The center of the sensor is where the actuating/sensing membrane is located and must be kept without thick coatings to ensure its proper actuation and interaction with the fluid under test. The waterproofing material has not been applied at this point.
3.2. Test in oil with varying viscosity at room temperature
A total of eight sensors were packaged and tested. The initial test consists of measuring the natural vibration frequency to verify sensor functionality after packaging. All eight sensors resonated at a frequency between 30 and 32 KHz, indicating full functionality. The sensors were then tested individually in standard oils of different viscosities for 3 minutes at a measured room temperature of 19 °C. The viscosity of the standard oils used were 20.7, 53.5, 86.3, and 330.7 cSt, respectively, for N10, N24, N35, and N100 oils. The sensors were cleaned between tests to avoid cross-contamination of the standard oils.
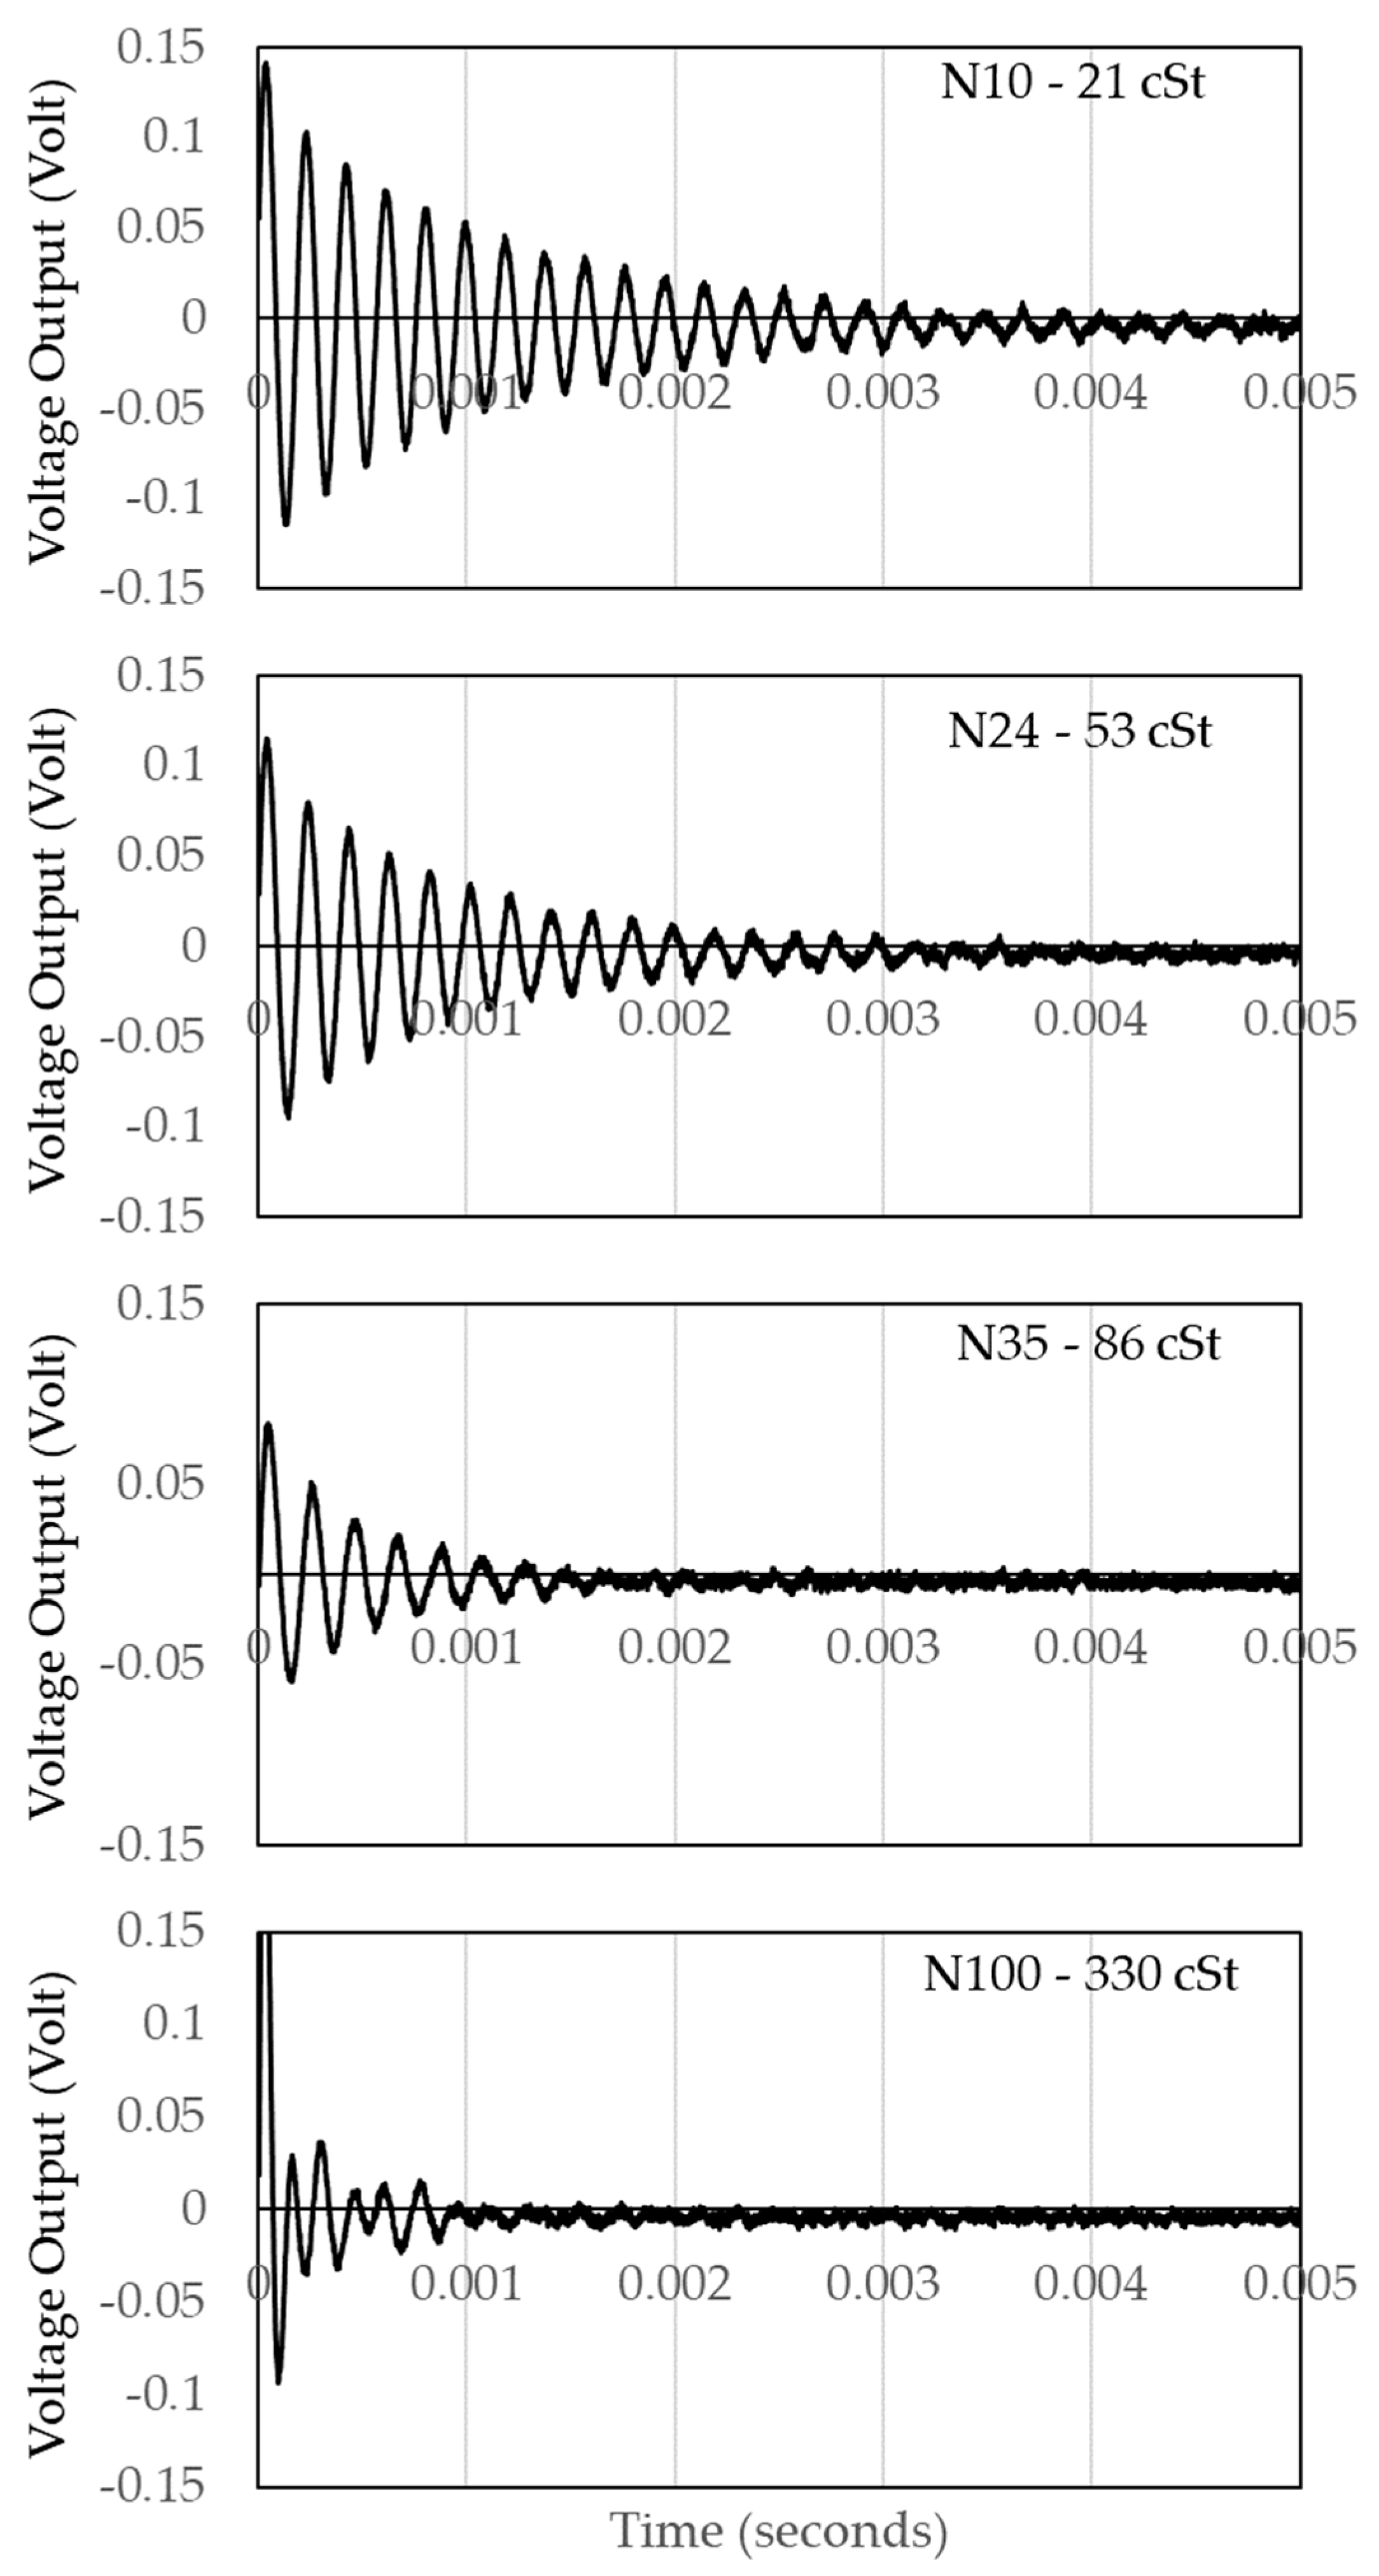
Figure 3 shows a typical output obtained with an oscilloscope while testing a particular sensor in the four different standard oils. As seen in
Figure 3, the output response follows the underdamped response of a harmonic oscillator, and measurements can be made on the frequency and decaying exponential from which other characteristic values, such as the damping coefficient or Q factor, can be extracted.
LabVIEW is used to extract the frequency, Q factor, and amplitude of the waveforms for approximately 3 minutes each at 1-second intervals.
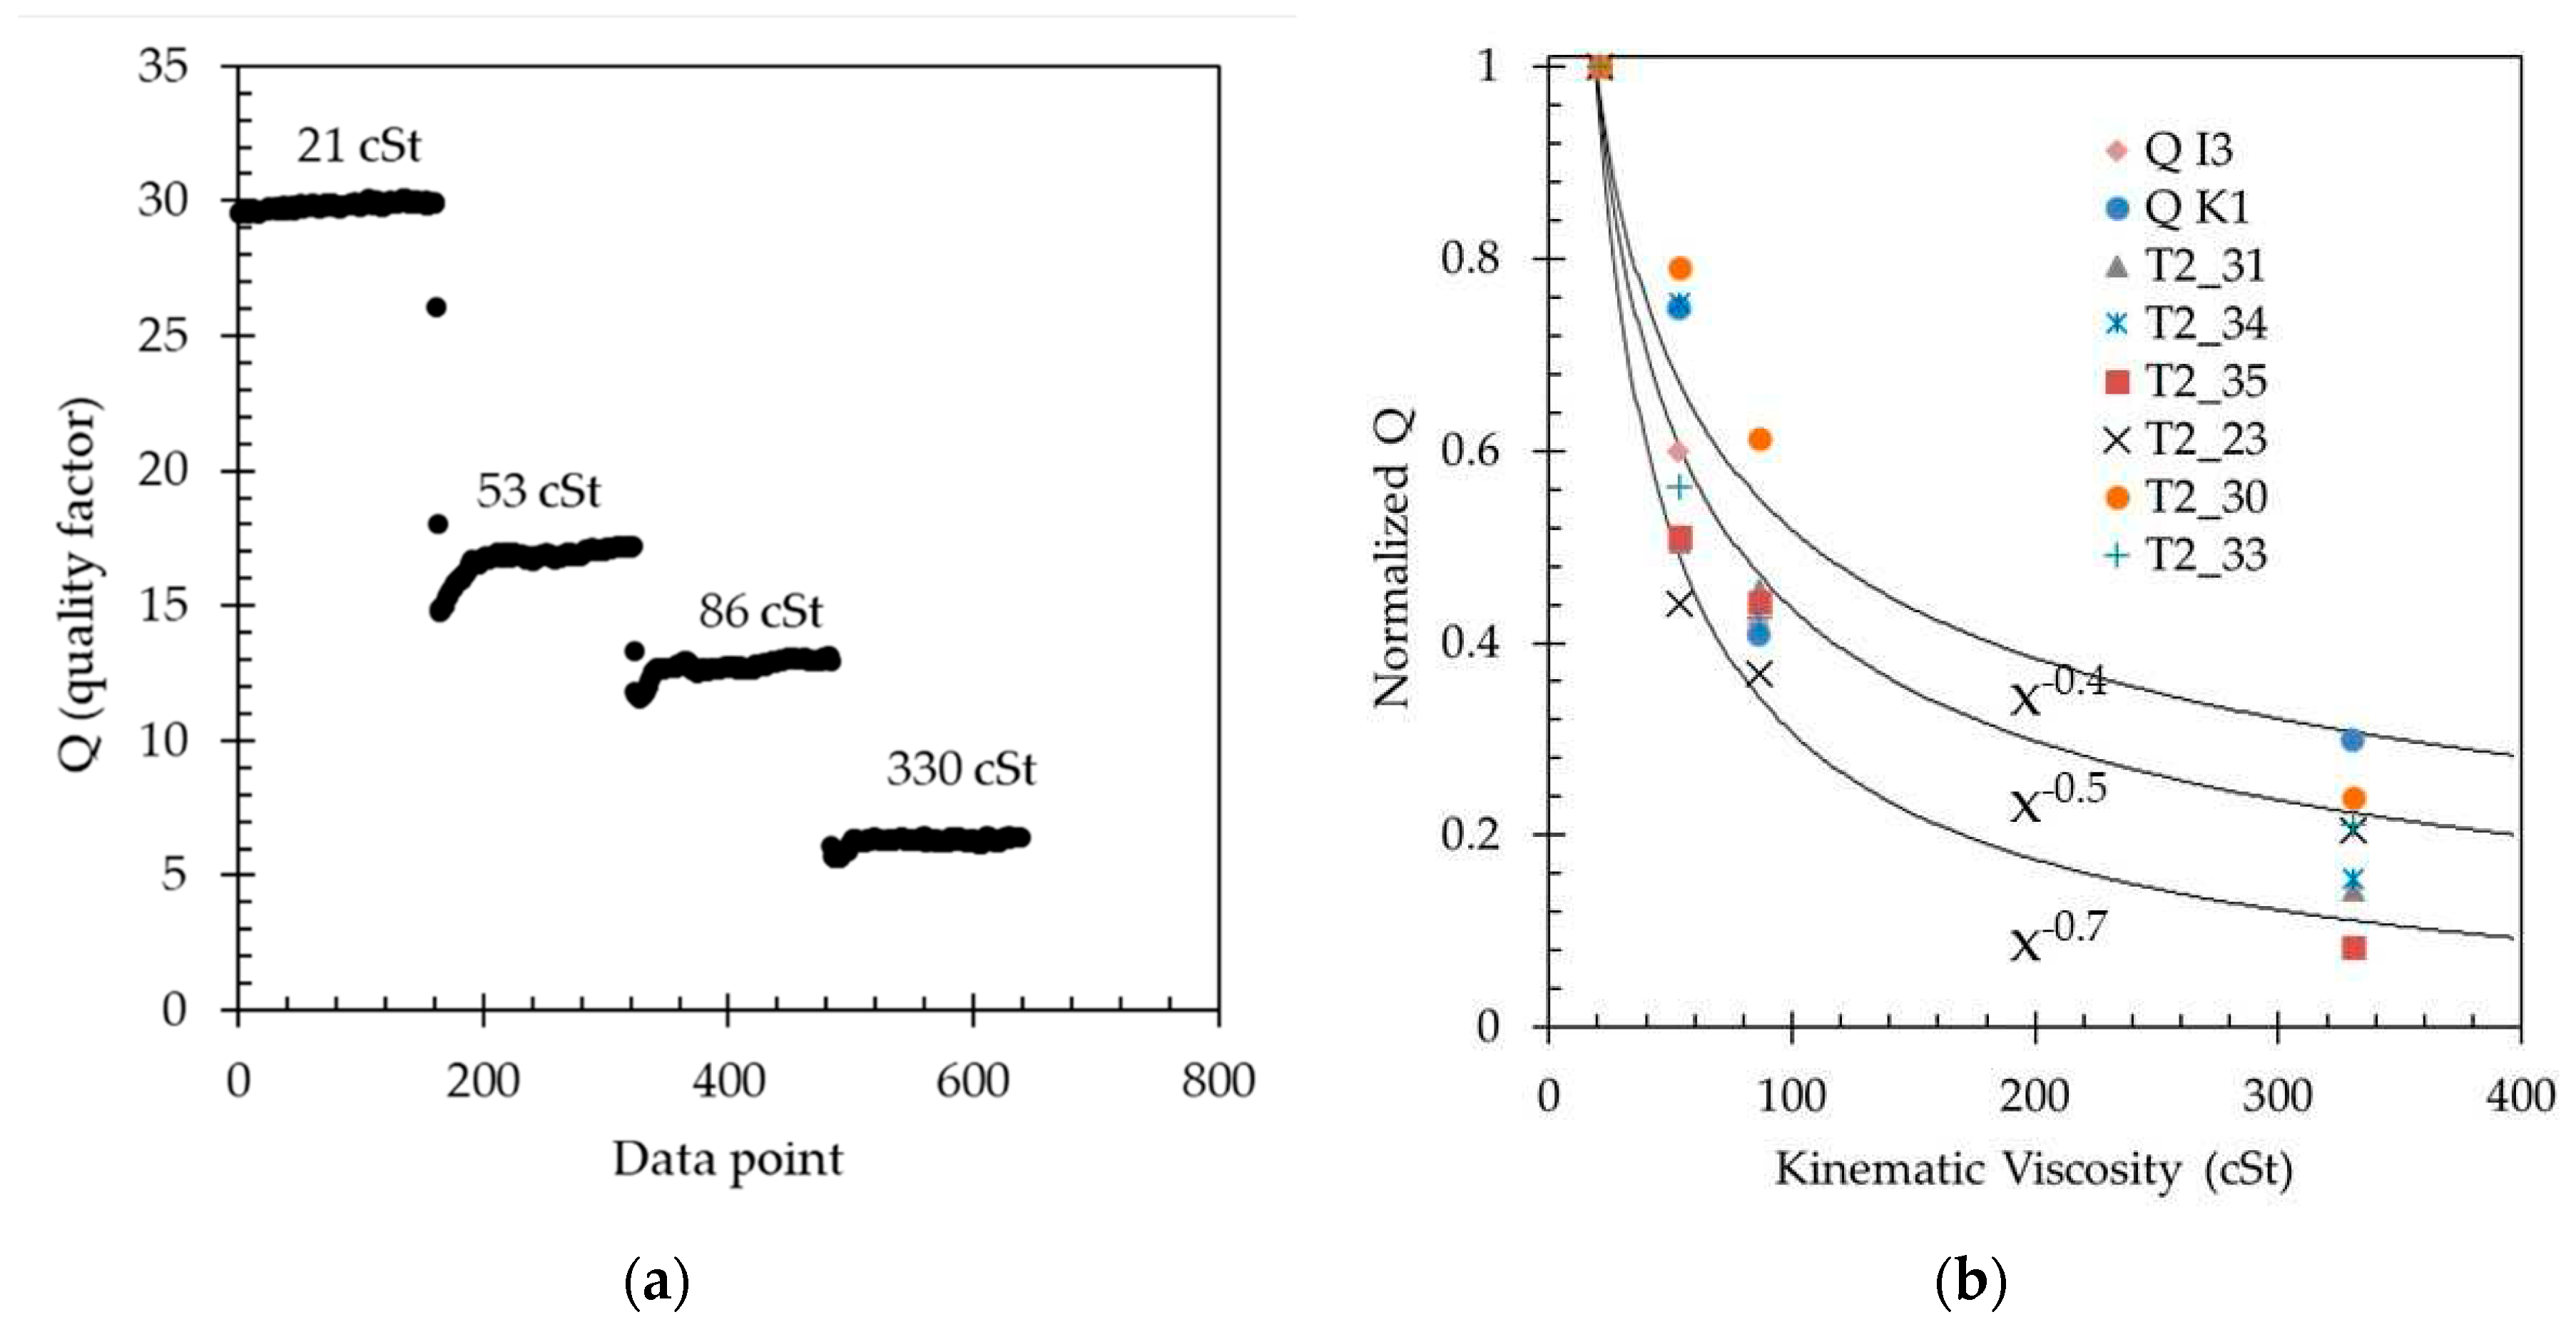
Figure 4a shows the typical output collected using LabVIEW for the quality factor of a particular sensor. The Q factor is extracted by finding the decaying exponential [
17]. As seen in
Figure 4b, the value of Q decreases as the sensor is placed in oils of increasing viscosity. The sensors are carefully placed in the same position during testing. Care must be taken not to introduce bubbles to the back of the diaphragm, as this would result in erroneous measurements and results [
33]. It can also be observed from this data that a conditioning time is needed before the measured value reaches a steady state value.
Average and standard deviations of Q are calculated for each test interval for each particular oil, and the data is plotted against the viscosity to determine the response of each sensor to changes in fluid viscosity.
Figure 4b summarizes the data collected for all eight sensors. The average values for Q follow an exponential decay inversely proportional to the kinematic viscosity of the fluid, as predicted in [
17] as Q ≈ 1/ξ, and ξ = (υ/ω
a2)
0.5, where
υ is the kinetic viscosity of the fluid,
ω the radial frequency and
a the length of one of the sides of the membrane. As such, Q ≈ υ
−0.5. The variation seen in the behavior from sensors is due to fabrication and packaging non-idealities of a lab environment. To visually aid in the interpretation of the data and sensor behavior with viscosity, three solid lines are superimposed to the data, indicating exponential fits of x
-0.4, x
-0.5, and x
-0.7, respectively, where x is kinematic viscosity.
3.3. Failure in water
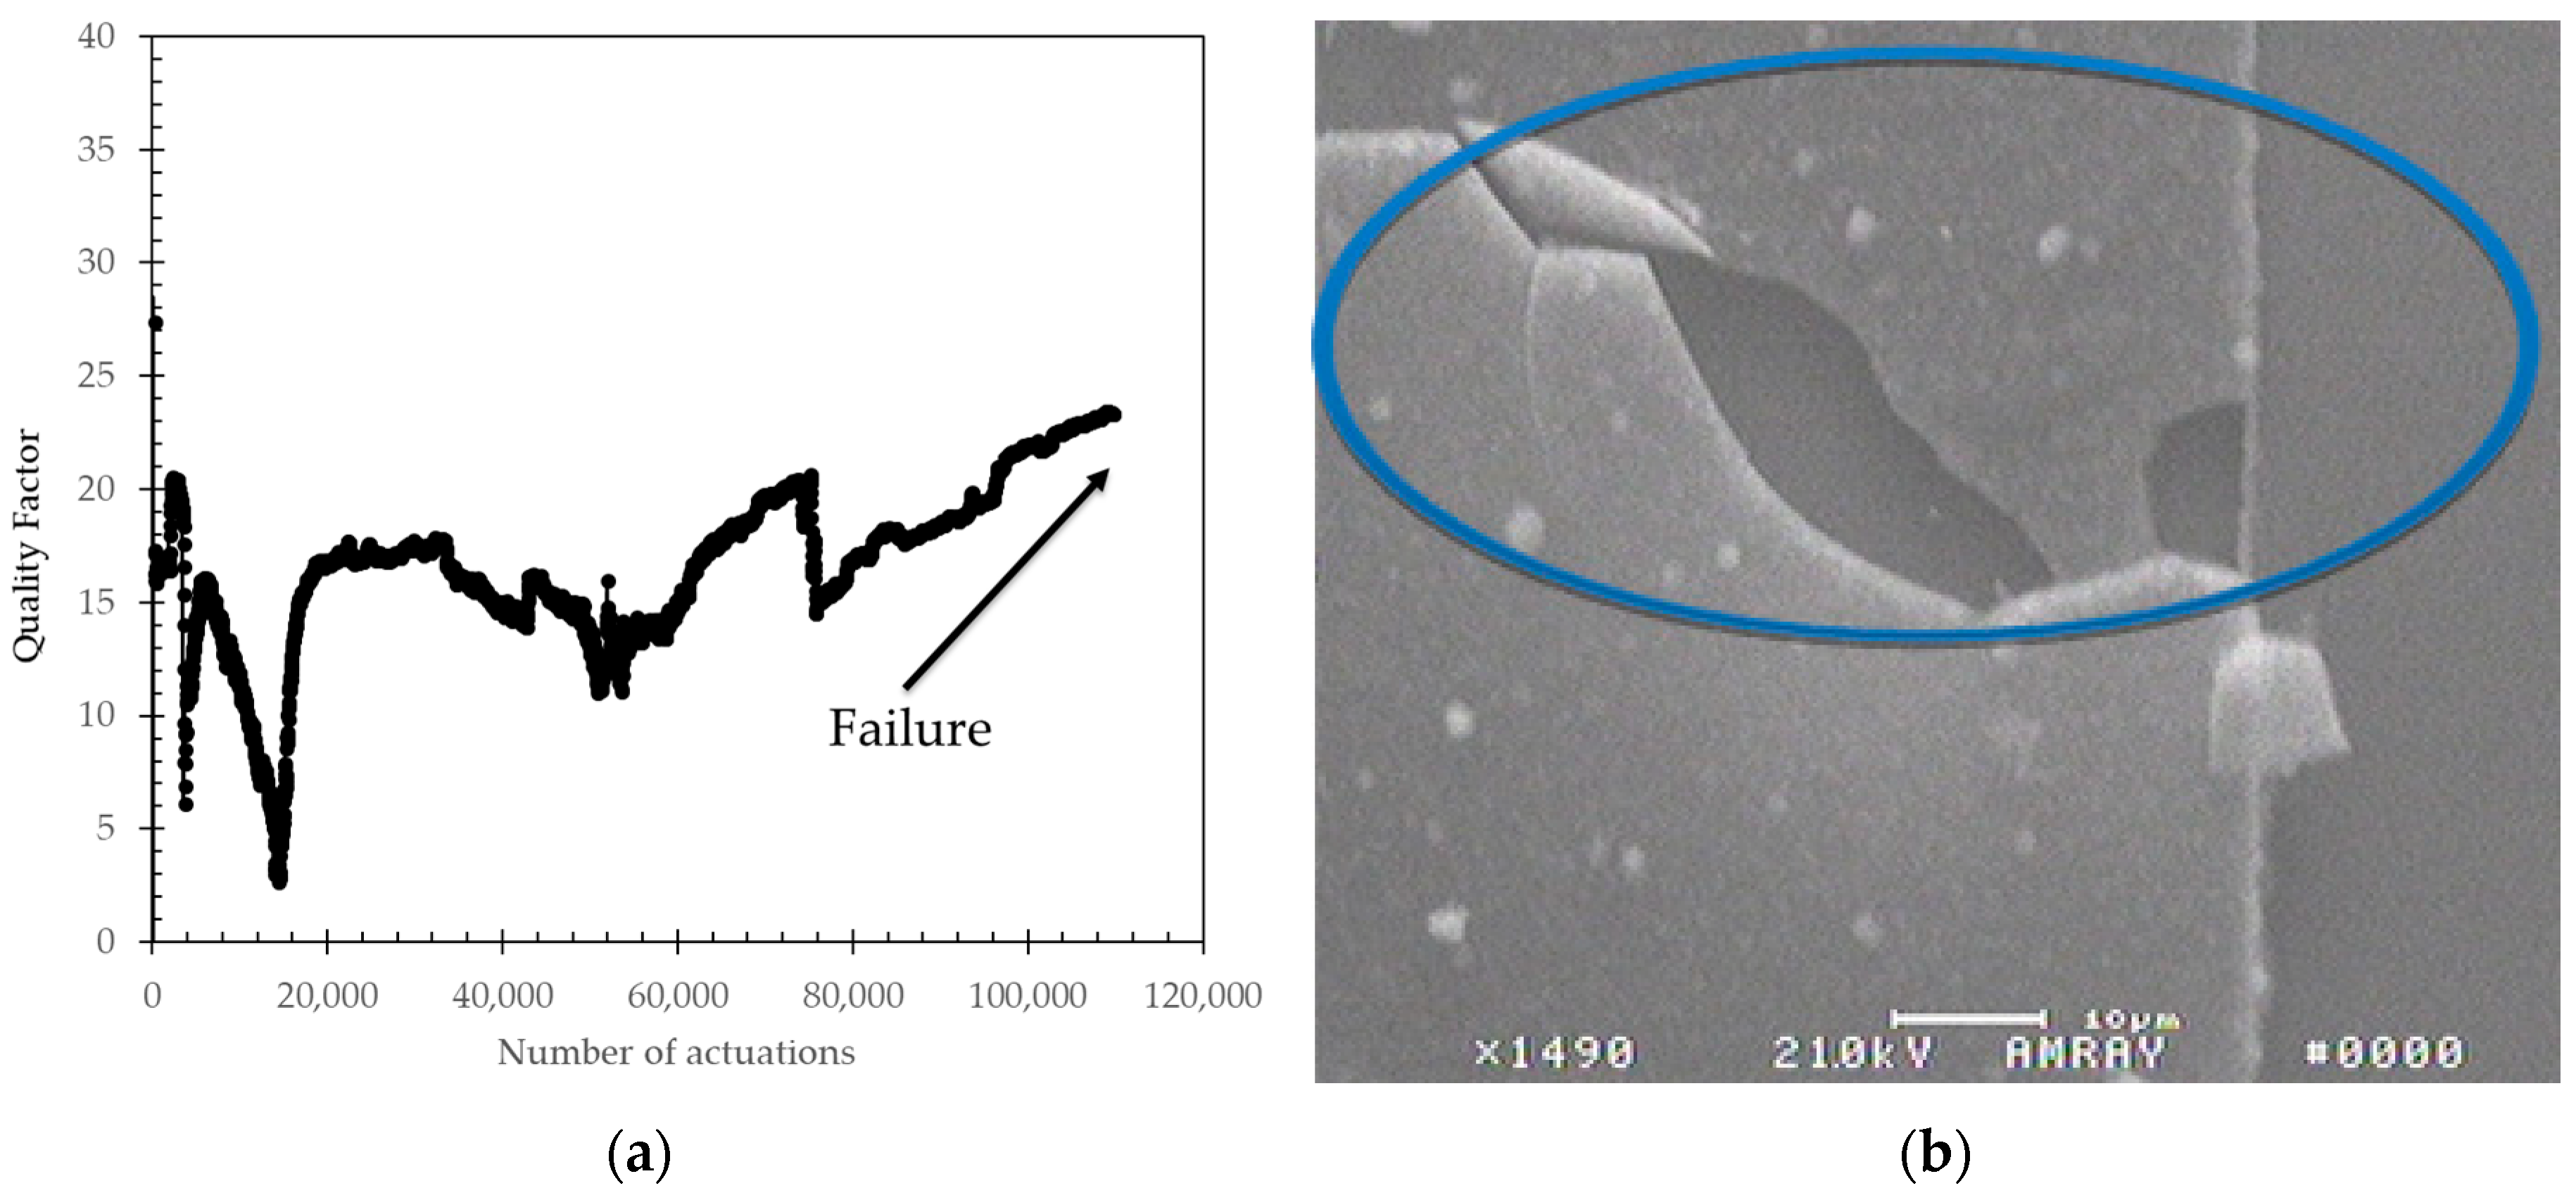
One sensor was placed in tap water without a waterproofing coat and tested with the same test conditions described in the methodology section (20-V, 50 µsec pulse at a repetition rate of 5 Hz). The vibration characteristics were monitored until the device failed. As shown in
Figure 5a, the Q of the vibrations remains relatively constant for ~ 100,000 actuations (approximately 5 hours) before the device failed and the oscillations stopped. Under microscope inspection, it was observed that the metal line that connects to the membrane heater actuator had been corroded, resulting in an open circuit condition. SEM analysis of the failure, as seen in
Figure 5b, indicated that a crack or a pinhole in the top SiO
2 passivation layer, which is applied during the microfabrication process, led to water reaching the metal line and corroding it through galvanic corrosion [
34]. Even though the sensors were fabricated with a top SiO
2 passivating layer and functioned in conductive fluids, they provided an unstable output and failed within a few thousand actuations. It is important to keep in mind that this SiO
2 passivating layer is not intended to act as a waterproofing material, and failures are expected.
3.4. Apply waterproofing
The sensors were cleaned once more with a degreaser agent, rinsed in DI water and IPA, and dried. The waterproofing material was then applied to the center of the membranes, as described in the methods sections. The objective is to apply a thin layer so that it does not disturb the sensor operation but is effective at protecting the electronic signals from interacting with a conductive fluid and either affecting the signal or making the sensor fail. Whereas the CVD deposition of the Parylene-C materials required a pre-treatment in an adhesion enhancement agent [
34], the applications of the nano coat material and nail polish (DS) did not require any additional steps. The resulting thickness of the applied waterproofing coats is shown in
Table 1 as the correlation of the sensor number and waterproofing material.
The vibration frequency of a simply supported square thin plate can be calculated according to Equation (1):
As described in [
35,
36], the effect of viscosity on the free vibration response of thin plates can be regarded as an energy dissipative element that modifies the added virtual mass
β of a vibrating element in a fluid with density ρ
fluid in Equation (1) according to:
where β is defined as
and
In addition, the quality factor Q can then be defined as
Equation (1) can be expressed as a function proportional to the spring constant
k and mass
m of the vibrating element. :
With the addition of another layer, the spring constant
k is expected to change by a fraction
x related to the spring constant of the material
kcoat, and the mass
m increase proportionally by
mcoat according to Equation (7).
Therefore, both the frequency and the Q factor are expected to decrease with the addition of the waterproofing coat as long as the change in mass is more significant than the change in the effective spring constant of the membrane.
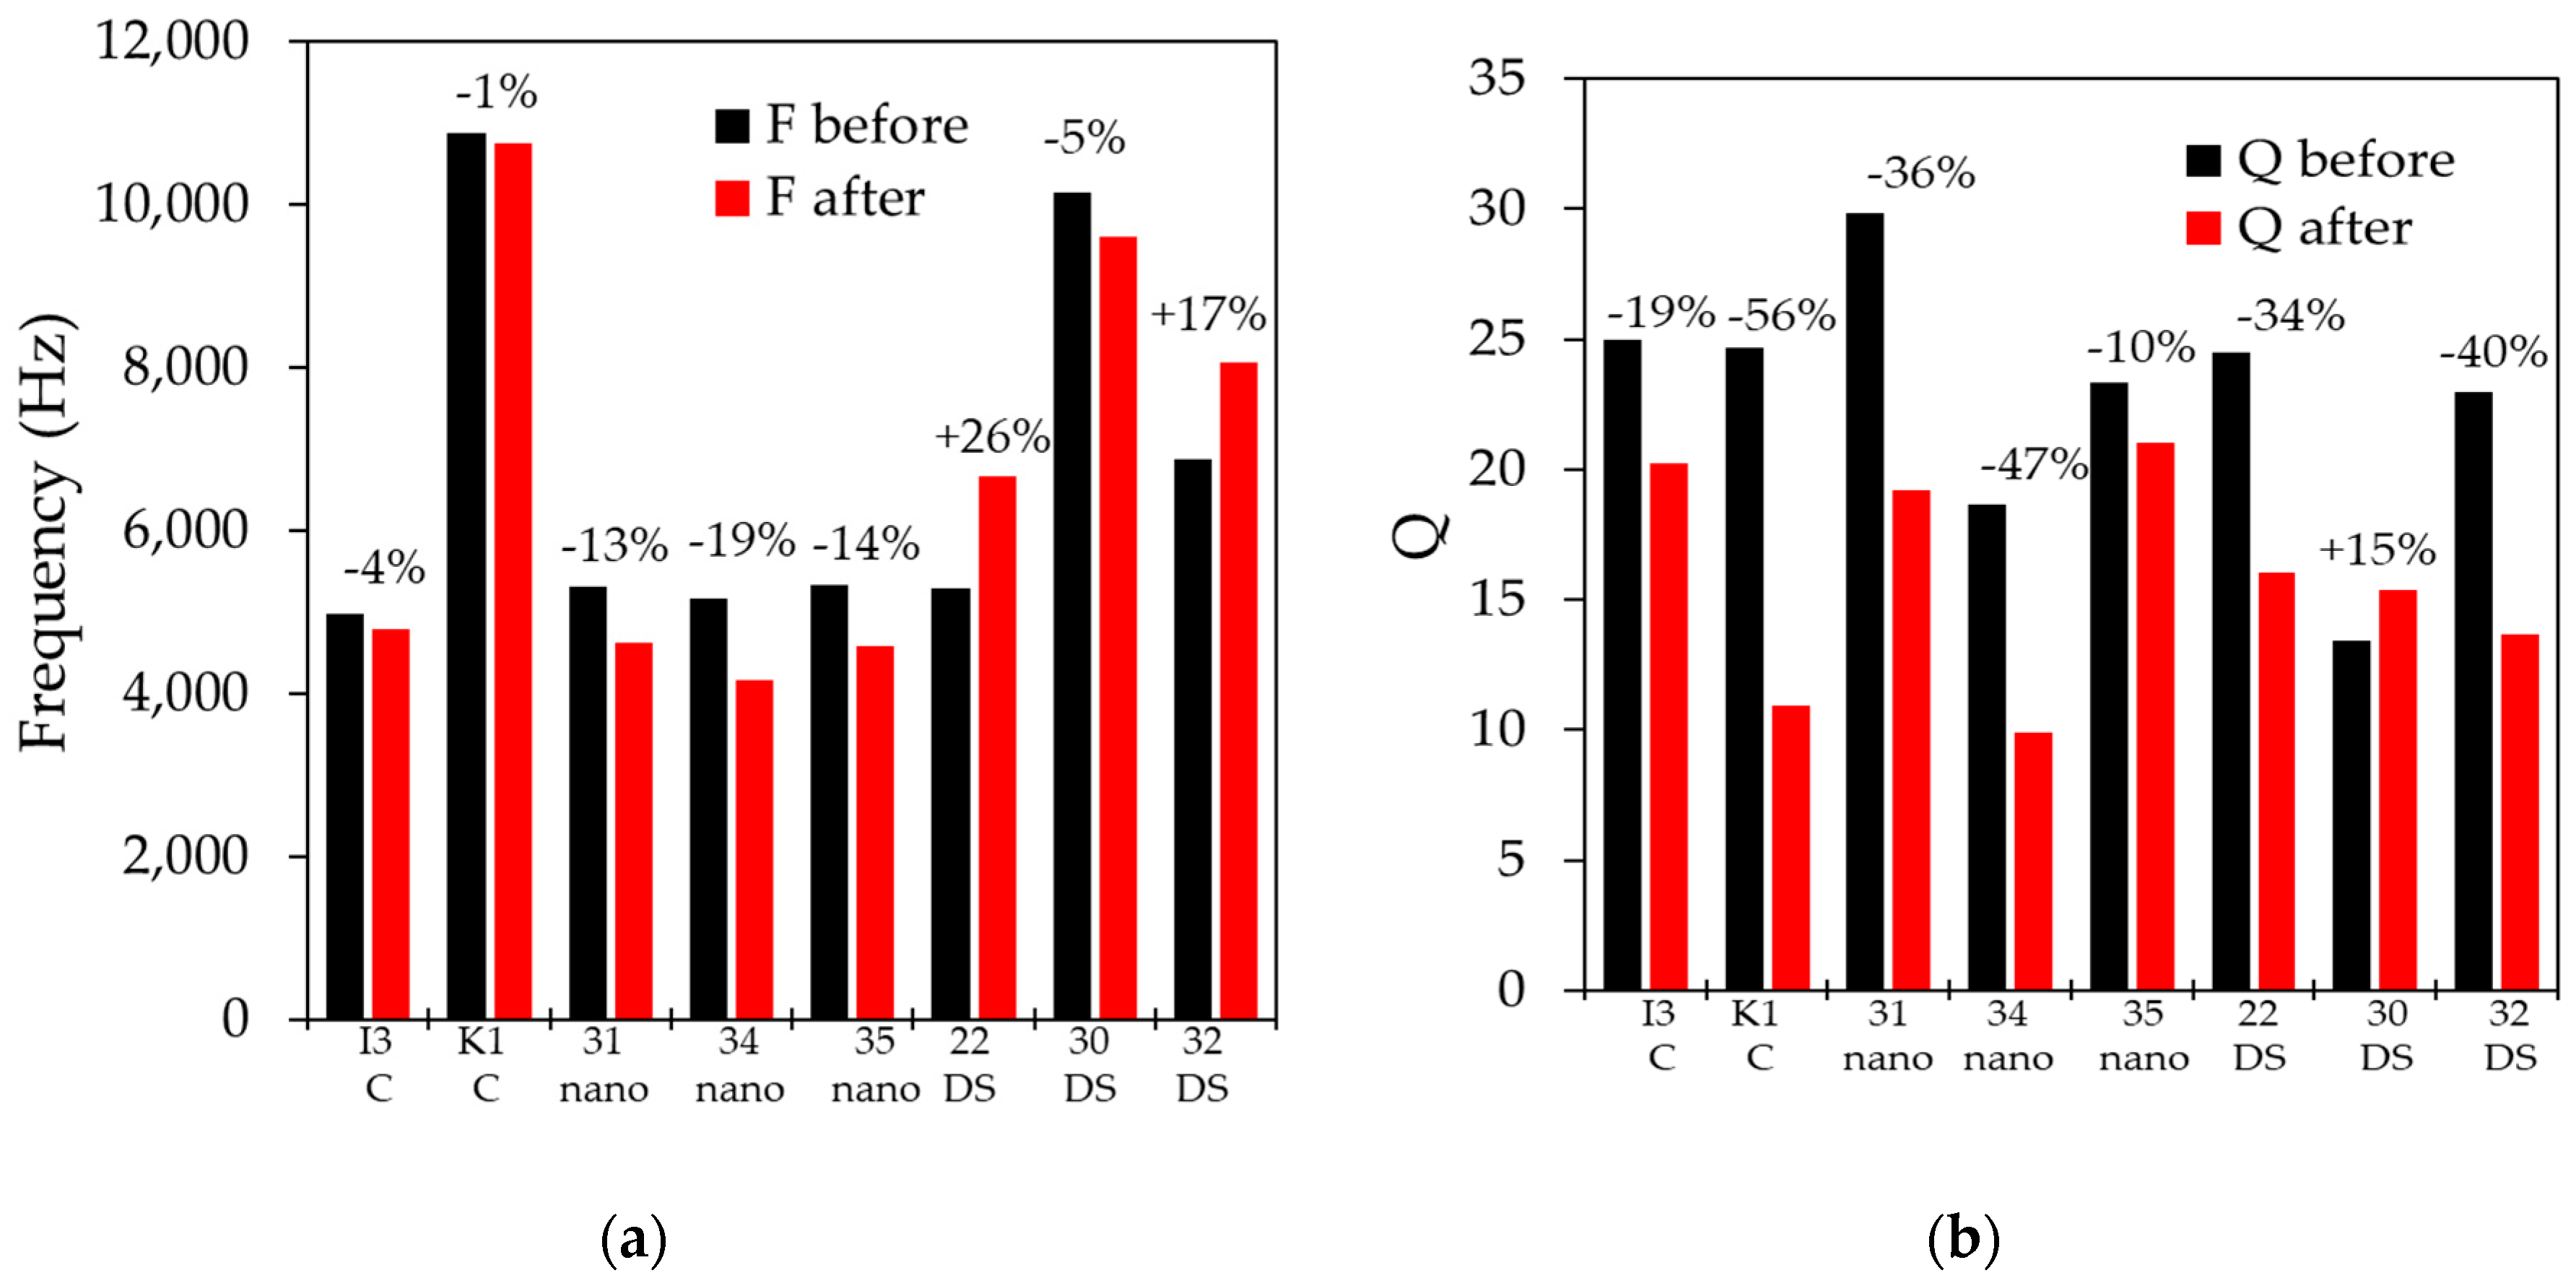
Figure 6 below shows a comparison of the before and after frequency and Q values of the sensors that were coated with the different materials when tested in fluids with a kinematic viscosity rating of 20-21 cSt. As seen in
Figure 6, the samples coated with Parylene-C show the least change, with a decrease between 1% and 5%. The samples coated with the nano coat show a more significant increase of 15 to 20%. The samples coated with nail polish (DS) show more inconsistent results, with two samples increasing in frequency by 25% and one decreasing by 15%. More significant variation is observed in Q, with a reduction of 20% and 50% (
Figure 6b). When the change in frequency and Q are plotted against the measured thickness, as seen in
Figure S1, a loose correlation can be observed between the parameters, indicating that the change in frequency and Q is negative for thinner films but turns positive for thicker films. As such, it may be possible to find a thickness for each particular material that could result in no change as the added mass and the effective spring constant are balanced.
3.6. Test in glycerol with varying viscosity at room temperature
The sensors were then tested in varying solutions of water/glycerol mixtures that were chosen to approximately match the viscosity of standard oils used in the previous tests. The expected viscosities of the 66%, 77%, 80%, and 92%, by volume, of glycerol in water were 21.3, 56.3, 70.4, and 309.0 cSt, respectively. The sensors were actuated with the same test conditions (20-V, 50 µsec pulse at a repetition rate of 5 Hz), and data was collected in 1-second intervals for 3 minutes.
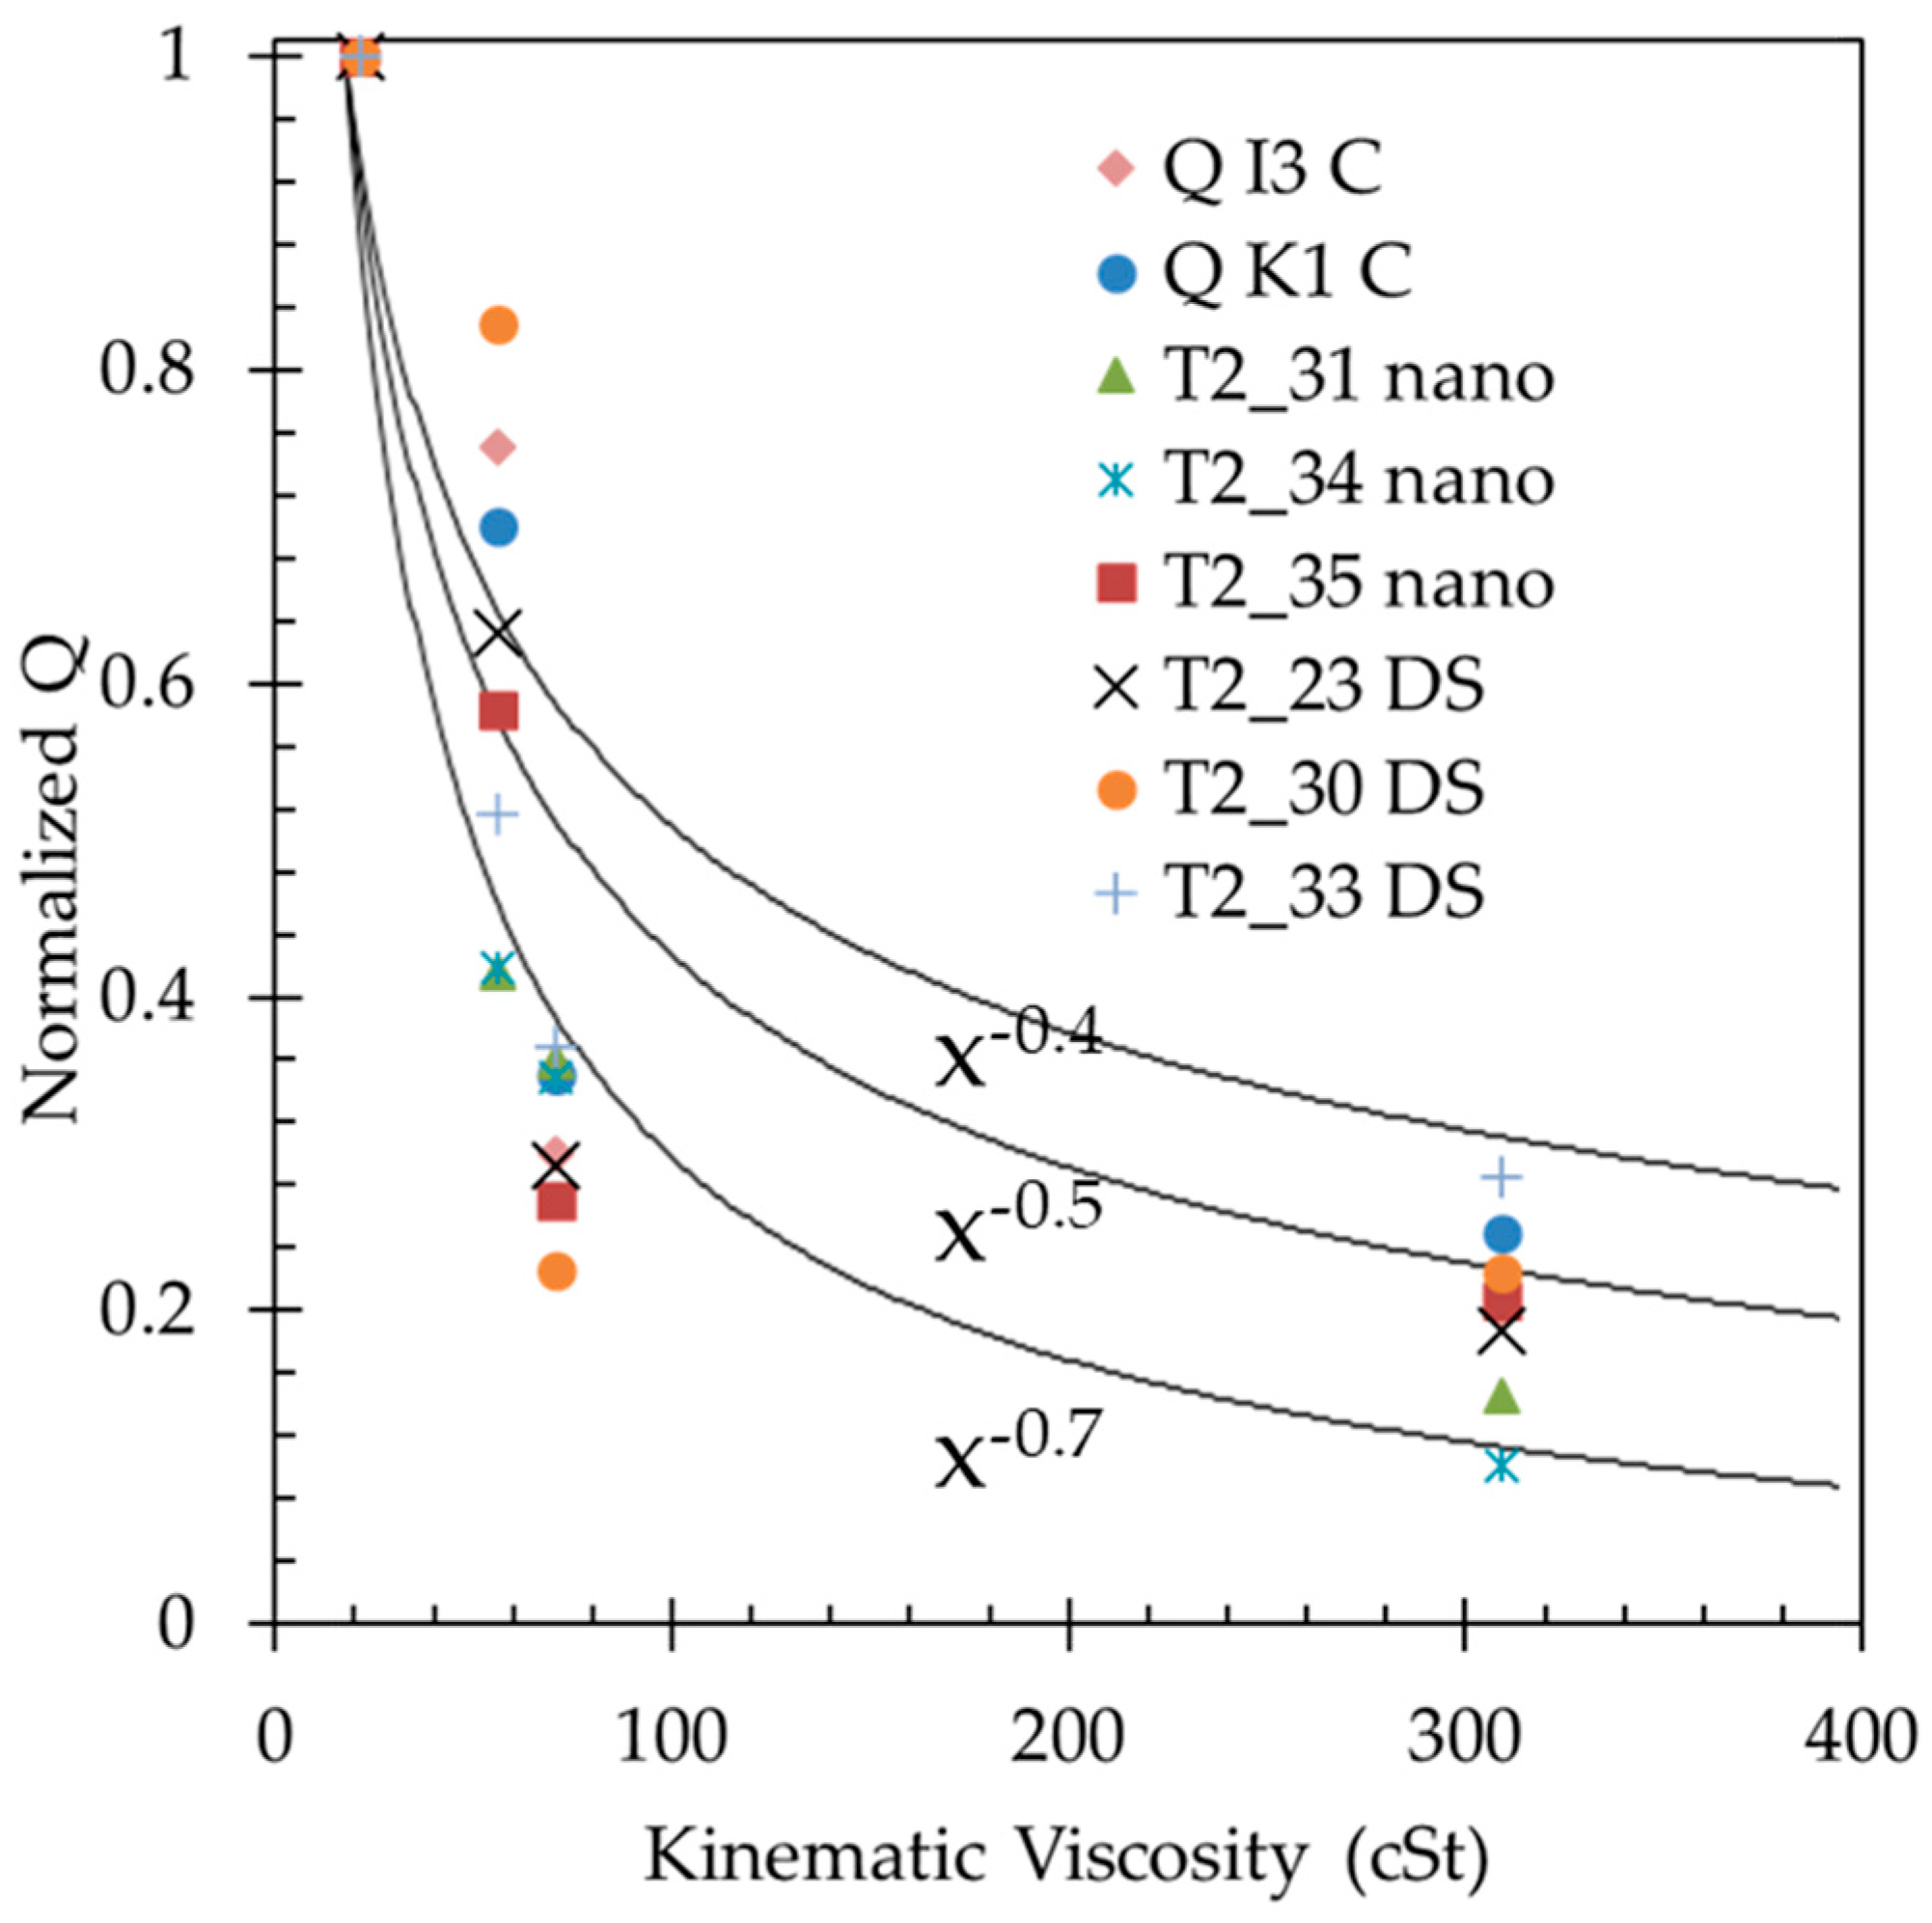
The normalized averages of the quality factor for each are shown in
Figure 7. The value of the quality factor decays in a similar fashion as that of the sensor before the application of the waterproofing material. On the other hand, the measurements taken in the mid-range of viscosities show a larger spread of values when compared to the in-oil measurements due to the additional mass and changes in vibration frequencies, as described in [
34]. The standard deviation was also calculated to be around 1% for the lower viscosities and 3% for the higher viscosities. The data of these averages and standard deviations are presented in
Table S1 and S2 in the supplementary information for both the tests in oil and glycerol. Solid lines are superimposed to the data to aid in the visualization of the data, indicating exponential fits of x
-0.4, x
-0.5, and x
-0.7, respectively, where x is kinematic viscosity.
The response of each of the sensors was plotted individually to compare the before and after response of each sensor, which is included in
Figures S2 and S3 in the supplementary material.
Figure S4 shows a log-log version of
Figure 4 and
Figure 7, where the summary of the fits and their spread can also be visually observed.
Table 2 shows the fitting terms where an increase in the value of the exponential term is seen between each sensor when compared individually before and after the application of the waterproofing material. This also correlates with the observation of the data shown in
Figure 4 and
Figure 7.
3.7. Long term testing
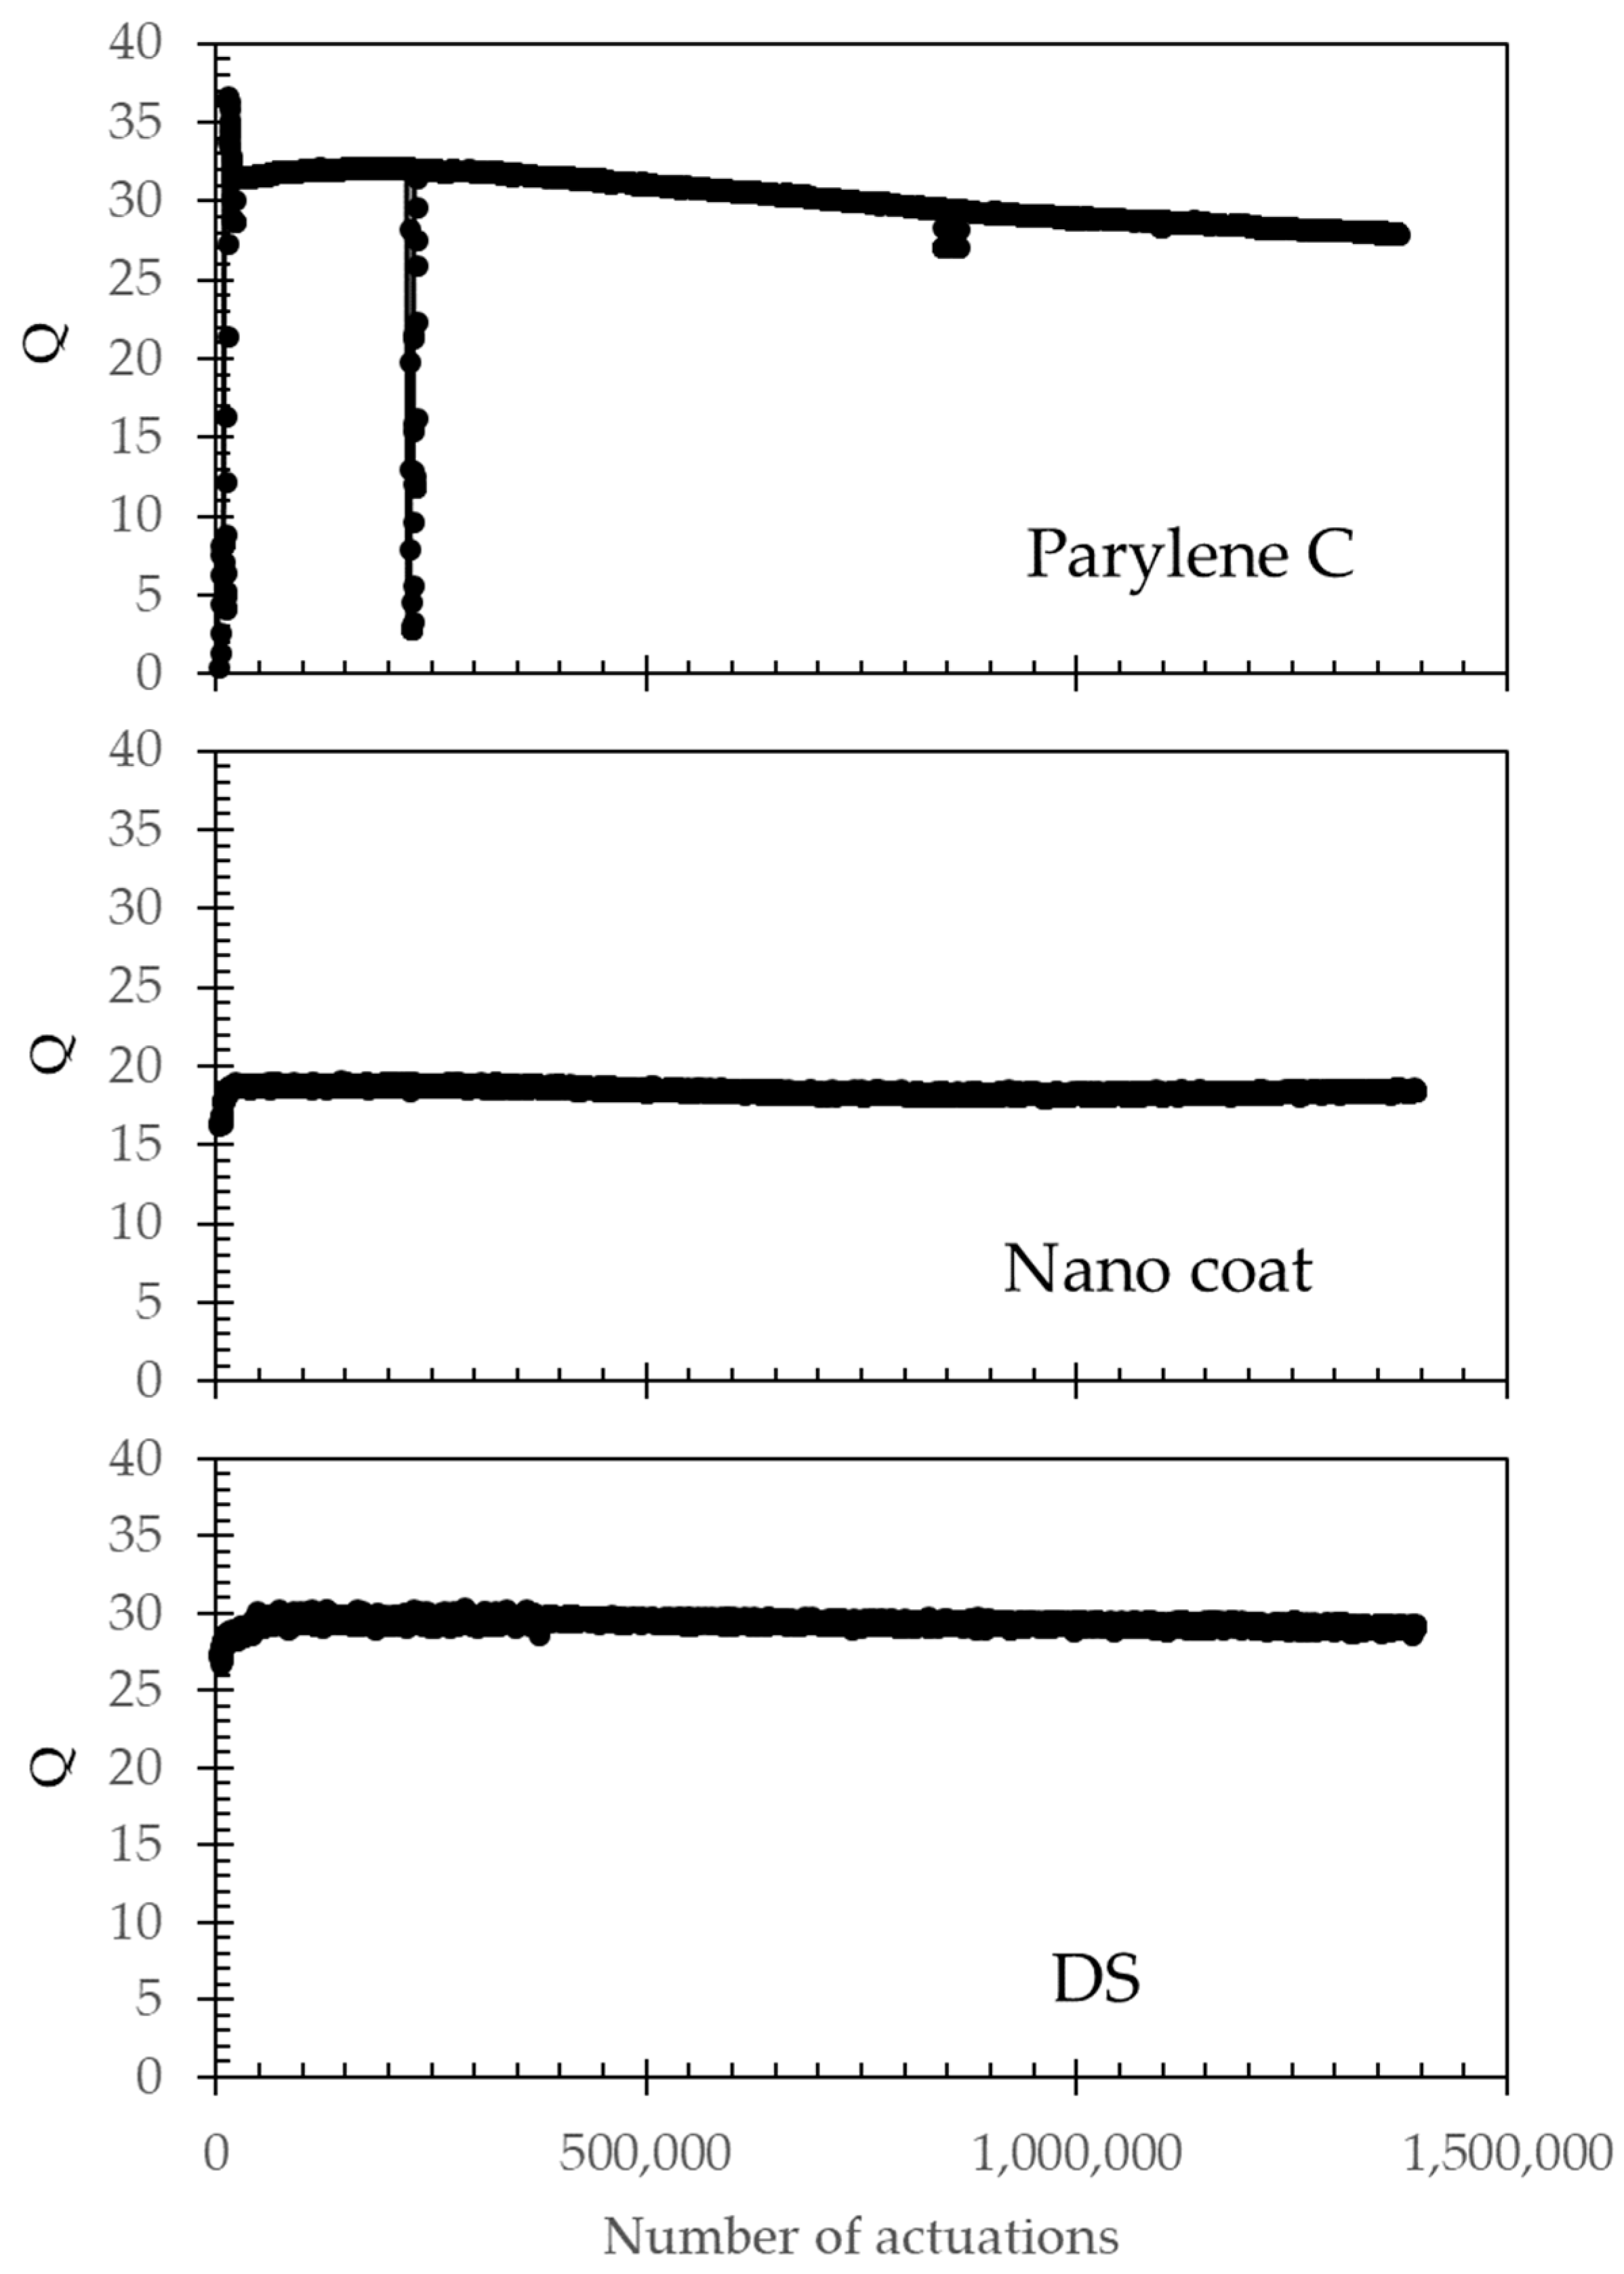
Selected sensors from each of the applied waterproofing coatings were tested for long-term operation. Testing under normal operating conditions (20-V, 50 µsec pulse at a repetition rate of 5 Hz) showed that the waterproofed sensors do not fail as the membrane movement is restricted to the elastic regime.
Figure 8 shows the value of the Q value for the three different waterproofing coats. No failures are seen over 1.2 million actuations, which would correspond to 2.7 days of continuous operation at 5 actuations per second. Other possible operating conditions that are not continuous could require, for example, daily measurements of 5 minutes, extending the tested 1.2 million actuations to >2 years.
To accelerate the failures, the energy delivered through the heater actuator was increased by ~5x over the normal operation conditions (from 20 V to 45 V). This ~5x increase in power and energy results in an expected 5x increase in the displacement at the center of the membrane from 120 nm to 600 nm [
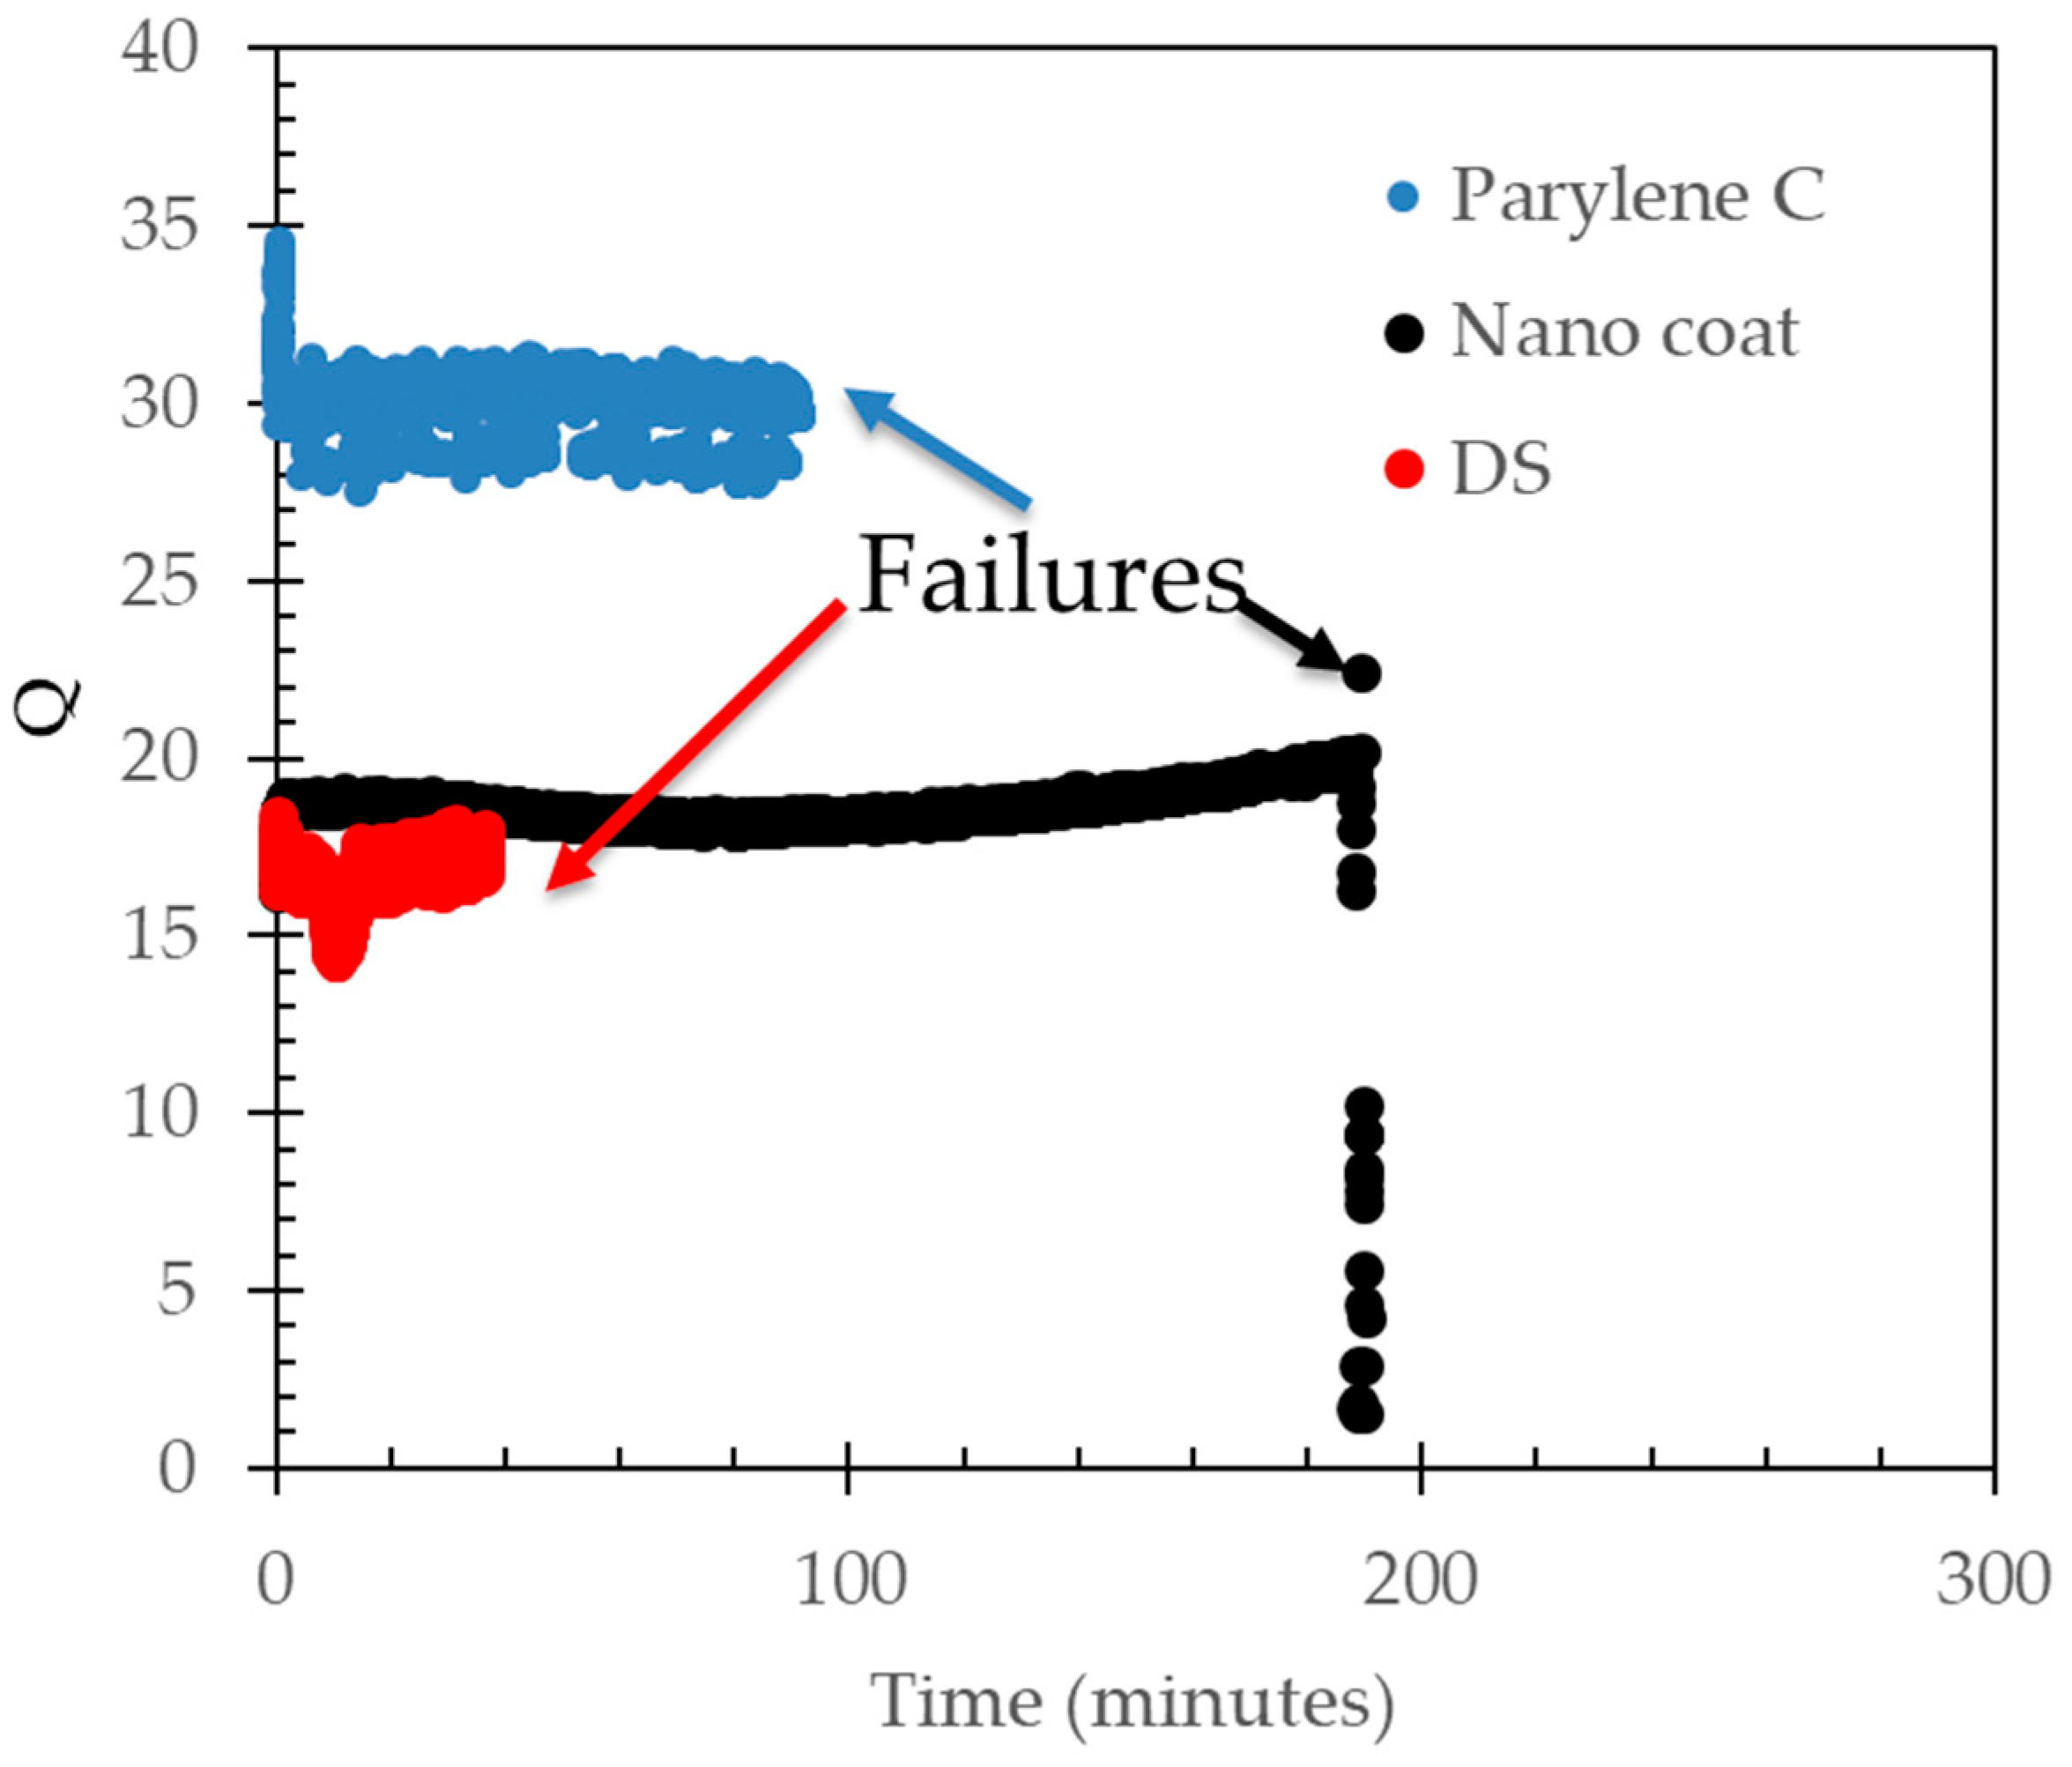
36]. With these accelerated conditions, it is seen in
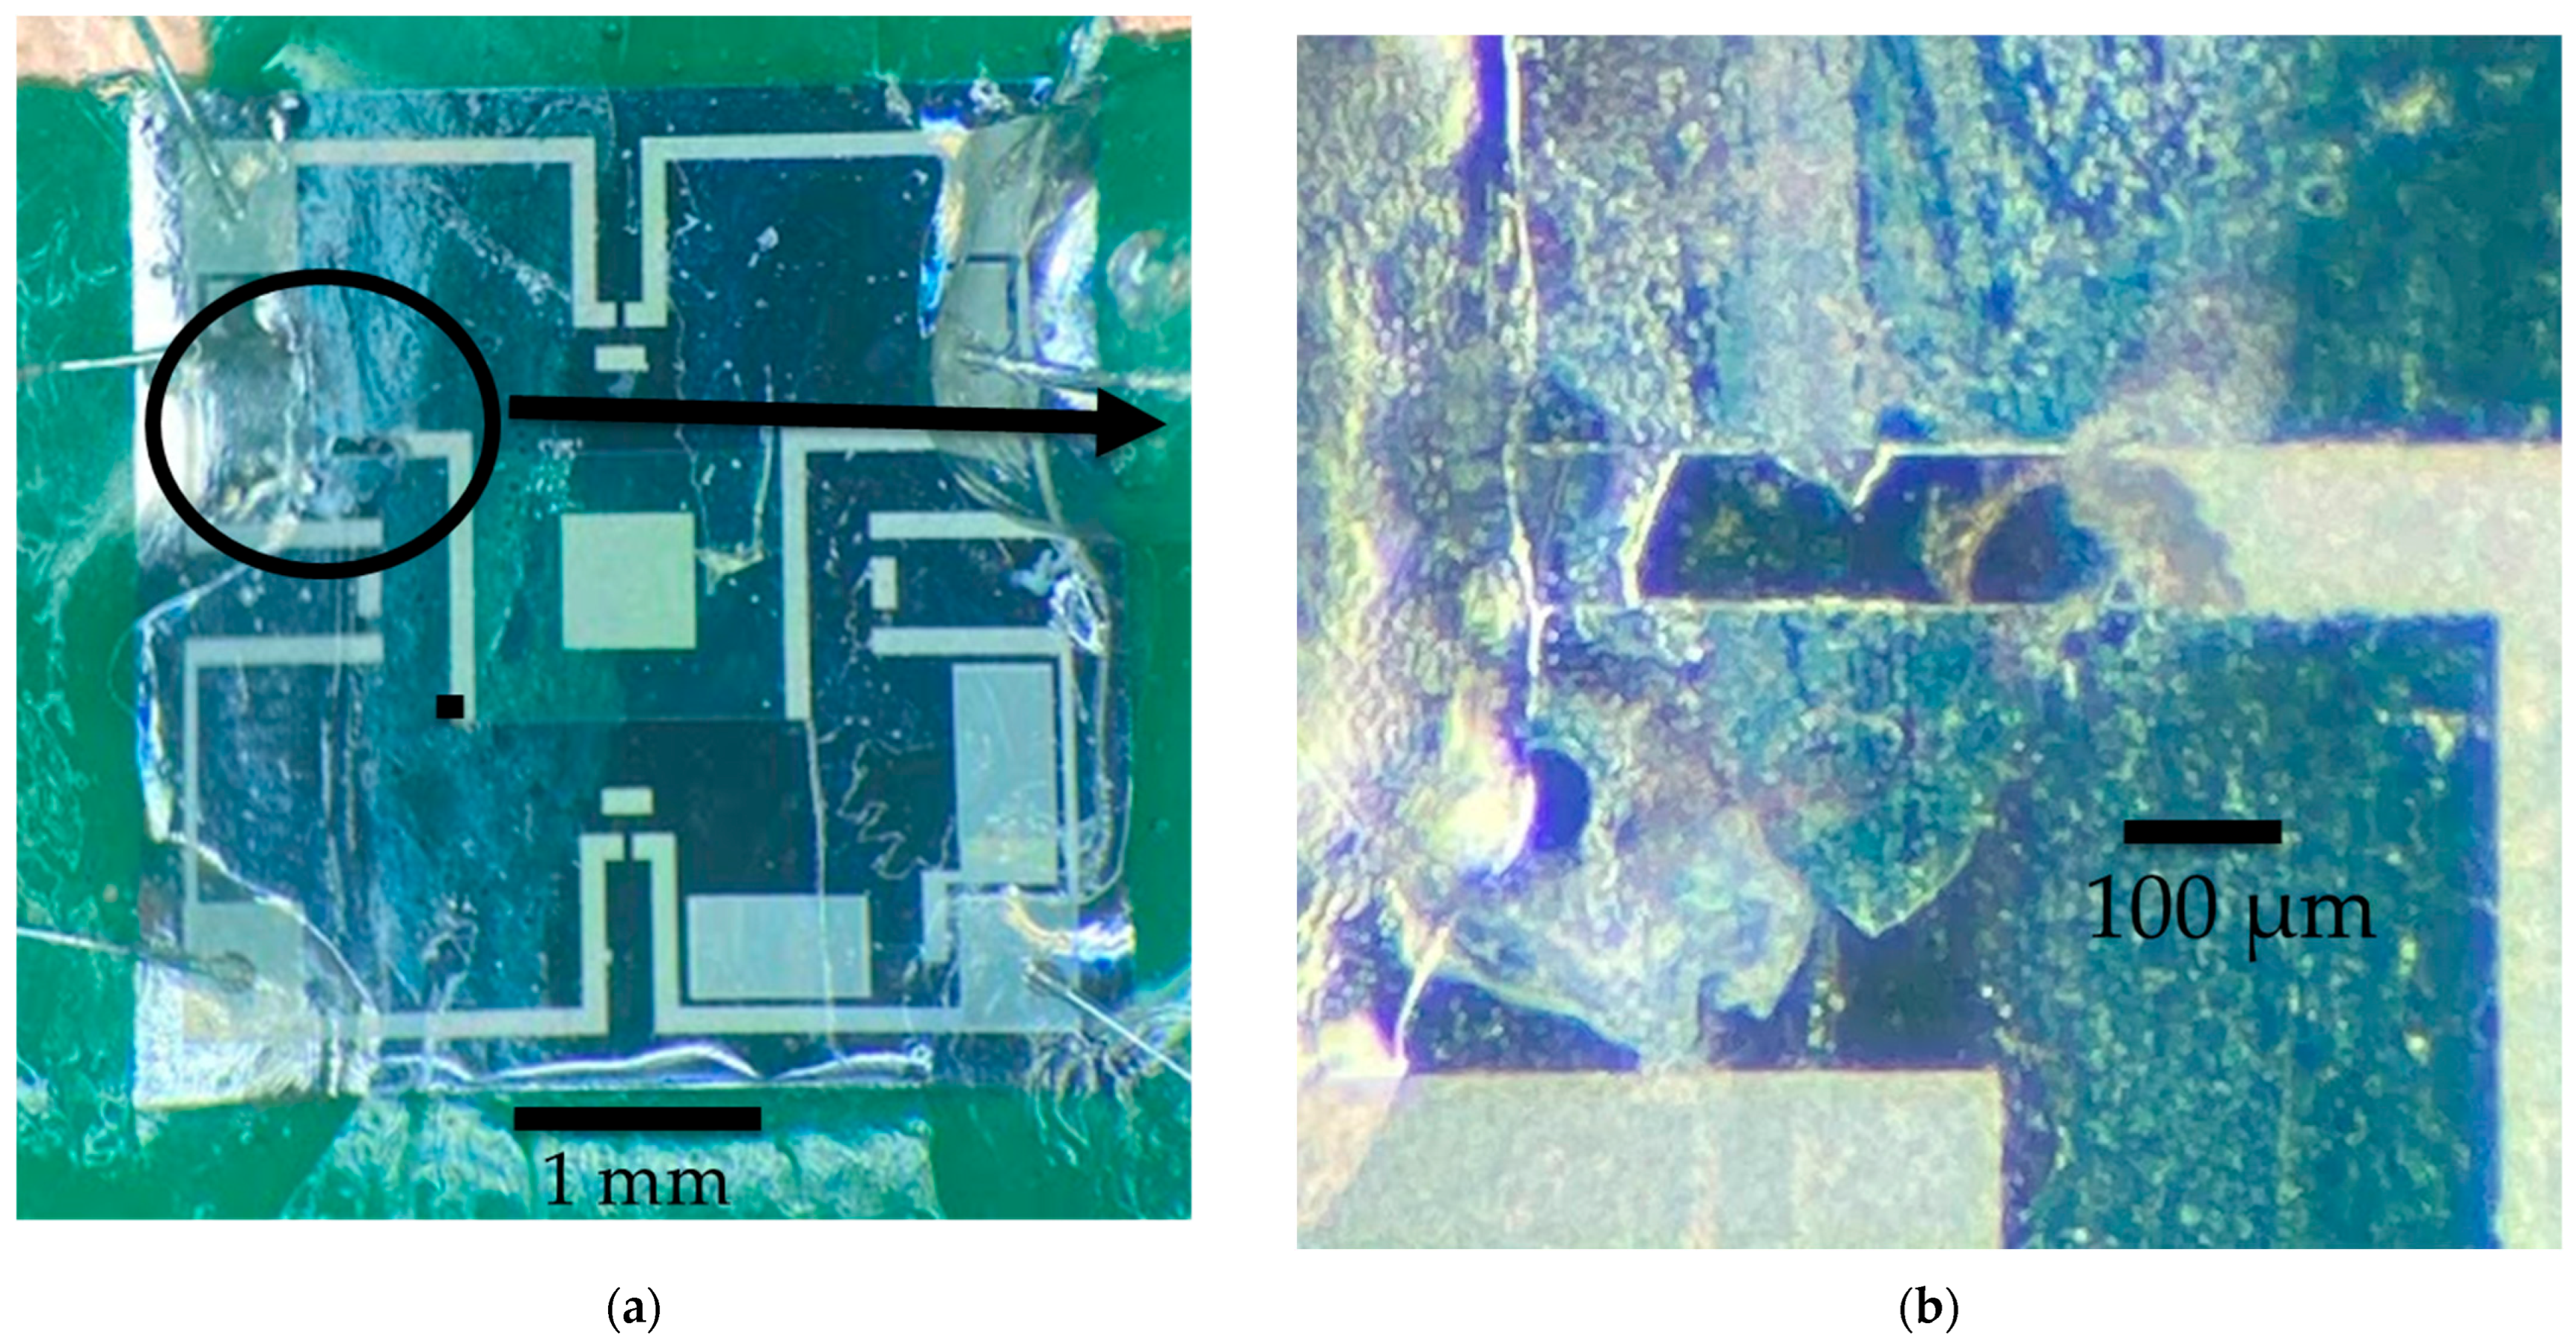
Figure 9 that the Parylene C failed after approximately 100 minutes, the nano coat samples failed after 3 hours, and the nail polish (DS) sample failed after 58 minutes. Microscope inspections indicate that for all samples, galvanic corrosion has taken place in the heating element metal trace, starting at a location near the edge of the membrane, as shown in
Figure 10a,b.
The nano coat material seems to provide longer-lasting protection than the other two materials tested under harsh test conditions. The chemical composition of the nano coat material is proprietary as it is a commercial product used to protect PCB components with a maximum operating temperature of up to 175 °C, but according to its datasheet, it contains fluorocarbons and fluoro-acrylates, but not silicone additive [
37]. Fluoro carbons have been shown to form a hydrophobic polymer [
38]. As such, the application of the nano coat material to glass has shown a water contact angle of 113.3° and an oil contact angle of 82.0° [
37]. Parylene C provided adequate protection during normal operating conditions but seemed to mechanically fail earlier than the nano coat material when the actuation magnitude was increased. Finally, the nail polish material (DS) showed adequate protection during normal operating conditions but failed the earliest when the conditions were increased. Overall, the results presented here indicate that adding a protective coating to a micro-actuator will significantly improve its reliability in electrically conductive fluids.
4. Conclusions
Parylene-C, fluoro acrylate-based “nano coat” (Chipquick) polymer and nitrocellulose-based polymer film (DS - Sally Hansen Diamond Strength Nail Polish) were coated as thin layers of waterproofing materials on different thermally actuated viscosity sensors. All three coating materials provided adequate protection when they were used to waterproof the sensors under normal operating conditions. Although the vibration response of the sensors was modified, it did not affect their functionality in a significant way when measuring conductive fluids based on glycerol-water mixtures. All the sensors that were treated lasted over 1.2 million actuations without any decay in performance or failures. When the test conditions were increased to accelerate failures, the “nano coat” samples lasted 2x longer than the other two due to their more stable chemical composition and lower stiffens. Visual analysis of the failures indicates that the edge of the diaphragm, which undergoes the largest stress and strain values during actuation, was the main location of the mechanical failure. This work guides coating solutions for micro-scale actuators operating in harsh and damaging environments.
Supplementary Materials
The following supporting information can be downloaded at the website of this paper posted on
Preprints.org.
Author Contributions
Conceptualization, LG, SC, KR and IP; methodology, CL, LK, and AU; software, SC, CL, LJ, AU, and IP; validation, LG, SC, KR and IP; formal analysis, LG, KR, IP; investigation, LG, SC, KR, CL, LJ, AU, and IP..; resources, IP..; data curation, LG, SC, KR, CL, LJ, AU, and IP; writing—original draft preparation, LG, and IP..; writing—review and editing, AU, LG, and IP..; visualization, LG, SC, KR, CL, LJ, AU, and IP..; supervision, IP,.; project administration, IP..; funding acquisition, IP All authors have read and agreed to the published version of the manuscript.
Funding
This research was partially funded by Poseidon Systems LLC, 830 Canning Pkwy, Victor, NY 14564.
Data Availability Statement
Acknowledgments
The authors acknowledge support from the Kate Gleason College of Engineering at Rochester Institute of Technology.
Conflicts of Interest
The authors declare no conflict of interest.
References
- P. Singh, K. Sharma, I. Puchades, and P. B. Agarwal, “A comprehensive review on MEMS-based viscometers,” Sensors and Actuators A: Physical, vol. 338. Elsevier B.V., May 01, 2022. [CrossRef]
- B. Jakoby, M. Scherer, M. Buskies, and H. Eisenschmid, “Microacoustic viscosity sensor for automotive applications,” in Proceedings of IEEE Sensors, IEEE, pp. 1587–1590. [CrossRef]
- B. Jakoby, M. Scherer, M. Buskies, and H. Eisenschmid, “An automotive engine oil viscosity sensor,” IEEE Sens J, vol. 3, no. 5, pp. 562–568, Oct. 2003. [CrossRef]
- M. A. Nour and M. M. Hussain, “A Review of the Real-Time Monitoring of Fluid-Properties in Tubular Architectures for Industrial Applications,” Sensors, vol. 20, no. 14, p. 3907, Jul. 2020. [CrossRef]
- M. Schneider, G. Pfusterschmied, F. Patocka, and U. Schmid, “High performance piezoelectric AlN MEMS resonators for precise sensing in liquids,” Elektrotechnik und Informationstechnik, vol. 137, no. 3, pp. 121–127, Jun. 2020. [CrossRef]
- J. Toledo, V. Ruiz-Díez, G. Pfusterschmied, U. Schmid, and J. L. Sánchez-Rojas, “Calibration procedure for piezoelectric MEMS resonators to determine simultaneously density and viscosity of liquids,” Microsystem Technologies, vol. 24, no. 3, pp. 1423–1431, Mar. 2018. [CrossRef]
- R. K. Maurya, R. Kaur, R. Kumar, and A. Agarwal, “A novel electronic micro-viscometer,” Microsystem Technologies, vol. 25, no. 10, pp. 3933–3941, Oct. 2019. [CrossRef]
- S. Clara, F. Feichtinger, T. Voglhuber-Brunnmaier, A. O. Niedermayer, A. Tröls, and B. Jakoby, “Balanced torsionally oscillating pipe used as a viscosity sensor,” Meas Sci Technol, vol. 30, no. 1, Jan. 2019. [CrossRef]
- S. E. Mena et al., “A droplet-based microfluidic viscometer for the measurement of blood coagulation,” Biomicrofluidics, vol. 14, no. 1, Jan. 2020. [CrossRef]
- S. B. Puneeth and S. Goel, “Handheld and ‘Turnkey’ 3D printed paper-microfluidic viscometer with on-board microcontroller for smartphone based biosensing applications,” Anal Chim Acta, vol. 1153, Apr. 2021. [CrossRef]
- H. Kang, I. Jang, S. Song, and S. C. Bae, “Development of a Paper-Based Viscometer for Blood Plasma Using Colorimetric Analysis,” Anal Chem, vol. 91, no. 7, pp. 4868–4875, Apr. 2019. [CrossRef]
- S. B. Puneeth, N. Munigela, S. A. Puranam, and S. Goel, “Automated Mini-Platform with 3-D Printed Paper Microstrips for Image Processing-Based Viscosity Measurement of Biological Samples,” IEEE Trans Electron Devices, vol. 67, no. 6, pp. 2559–2565, Jun. 2020. [CrossRef]
- T.-V. Nguyen, M.-D. Nguyen, H. Takahashi, K. Matsumoto, and I. Shimoyama, “Viscosity measurement based on the tapping-induced free vibration of sessile droplets using MEMS-based piezoresistive cantilevers,” Lab Chip, vol. 15, no. 18, pp. 3670–3676, 2015. [CrossRef]
- Agoston, A.; Keplinger, F.; Jakoby, B. Evaluation of a Vibrating Micromachined Cantilever Sensor for Measuring the Viscosity of Complex Organic Liquids. Sensors and Actuators A 2005, 123–124, 82–86. [Google Scholar] [CrossRef]
- Goodwin, A.R.H.; Jakeways, C.V.; De Lara, M.M. A MEMS Vibrating Edge Supported Plate for the Simultaneous Measurement of Density and Viscosity: Results for Nitrogen, Methylbenzene, Water, 1-Propene,1,1,2,3,3,3-hexafluoro-oxidized-polymd, and Polydimethylsiloxane and Four Certified Reference Materials. J Chem Eng Data 2008, 53, 1436–1443. [Google Scholar] [CrossRef]
- Martin, B.A. Viscosity and density sensing with ultrasonic plate waves. Sens Actuators A Phys 1990, 22, 704–708. [Google Scholar] [CrossRef]
- Puchades and L. F. Fuller, “A Thermally Actuated Microelectromechanical (MEMS) Device For Measuring Viscosity,” Journal of Microelectromechanical Systems, vol. 20, no. 3, pp. 601–608, Jun. 2011. [CrossRef]
- Goubaidoulline, J. Reuber, F. Merz, and D. Johannsmann, “Simultaneous determination of density and viscosity of liquids based on quartz-crystal resonators covered with nanoporous alumina,” J Appl Phys, vol. 98, no. 1, pp. 0143051–0143054, 2005. [CrossRef]
- J. Ortigoza-Diaz et al., “Techniques and considerations in the microfabrication of parylene c microelectromechanical systems,” Micromachines, vol. 9, no. 9. 2018. [CrossRef]
- B. J. Kim and E. Meng, “Micromachining of Parylene C for bioMEMS,” Polymers for Advanced Technologies, vol. 27, no. 5. 2016. [CrossRef]
- W. Xu, X. Wang, B. Mousa, M. Paszkiewicz, and Y. K. Lee, “A CMOS MEMS Thermal Flow Sensor for Gas and Liquid with Parylene-C Coating,” IEEE Trans Electron Devices, vol. 68, no. 2, 2021. [CrossRef]
- W. Lee et al., “All-in-one low-intensity pulsed ultrasound stimulation system using piezoelectric micromachined ultrasonic transducer (pMUT) arrays for targeted cell stimulation,” Biomed Microdevices, vol. 19, no. 4, 2017. [CrossRef]
- E. Campbell, L. A. J. Davis, G. Hayward, and D. Hutchins, “Cross-coupling in sealed cMUT arrays for immersion applications,” in Proceedings - IEEE Ultrasonics Symposium, 2007. [CrossRef]
- M. Mariello et al., “Reliability of protective coatings for flexible piezoelectric transducers in aqueous environments,” Micromachines (Basel), vol. 10, no. 11, 2019. [CrossRef]
- J. Xiong et al., “A Deformable and Highly Robust Ethyl Cellulose Transparent Conductor with a Scalable Silver Nanowires Bundle Micromesh,” Advanced Materials, vol. 30, no. 36, 2018. [CrossRef]
- L. Li, Y. Bai, L. Li, S. Wang, and T. Zhang, “A Superhydrophobic Smart Coating for Flexible and Wearable Sensing Electronics,” Advanced Materials, vol. 29, no. 43, 2017.
- D. P. Wang, Z. H. D. P. Wang, Z. H. Zhao, C. H. Li, and J. L. Zuo, “An ultrafast self-healing polydimethylsiloxane elastomer with persistent sealing performance,” Mater Chem Front, vol. 3, no. 7, 2019. [CrossRef]
- X. Li et al., “Preparation and properties of a superhydrophobic surface on the printed circuit board (PCB),” Appl Phys A Mater Sci Process, vol. 129, no. 6, 2023. [CrossRef]
- Z. Li et al., “Water and mildew proof SiO2& ZnO/silica sol superhydrophobic composite coating on a circuit board,” RSC Adv, vol. 11, no. 35, 2021. [CrossRef]
- S. Wan, Y. Cong, D. Jiang, and Z. H. Dong, “Weathering barrier enhancement of printed circuit board by fluorinated silica based superhydrophobic coating,” Colloids Surf A Physicochem Eng Asp, vol. 538, 2018. [CrossRef]
- N. Levkina, S. Vantsov, and A. Medvedev, “Waterproof coatings for printed circuit boards,” ELECTRONICS: Science, Technology, Business, no. 7, 2018. [CrossRef]
- Puchades, I. A Thermally actuated microelectromechanical (MEMS) device for measuring viscosity. Theses, Jul. 2011. Available: https://scholarworks.rit.edu/theses/2 (accessed on 6 December 2023).
- Puchades, M. Koz, and L. Fuller, “Mechanical vibrations of thermally actuated silicon membranes,” Micromachines (Basel), vol. 3, no. 2, 2012. [CrossRef]
- Chau, L.G. A MEMS viscosity sensor for conductive fluids. Theses, Jan. 2012. Available: https://scholarworks.rit.edu/theses/238 (accessed on 5 December 2023).
- Lamb, H. On the vibrations of an elastic plate in contact with water. Proceedings of the Royal Society of London. Series A, Containing Papers of a Mathematical and Physical Character 1920, 98, 205–216. Available: http://www.jstor.org/stable/93996.
- Y. Kozlovsky, “Vibration of plates in contact with viscous fluid: Extension of Lamb’s model,” J Sound Vib, vol. 326, no. 1–2, pp. 332–339, Sep. 2009. [CrossRef]
- CHIPQUICK, “Nanocoat2000 Datasheet,” Nanocoat2000 Datasheet. 2023.
- Y. Zhou et al., “A novel hydrophobic coating film of water-borne fluoro-silicon polyacrylate polyurethane with properties governed by surface self-segregation,” Prog Org Coat, vol. 134, pp. 134–144, Sep. 2019. [CrossRef]
Figure 1.
Cross-sectional schematic of the basic sensor structure indicating the thickness of the different materials used. Not to scale.
Figure 1.
Cross-sectional schematic of the basic sensor structure indicating the thickness of the different materials used. Not to scale.
Figure 2.
Top-down microscope picture of a packaged sensor with labels indicating the main components, areas that need to be protected with epoxy, and the membrane region, which must remain epoxy-free. The scale bar is 1 mm.
Figure 2.
Top-down microscope picture of a packaged sensor with labels indicating the main components, areas that need to be protected with epoxy, and the membrane region, which must remain epoxy-free. The scale bar is 1 mm.
Figure 3.
Sequence of the response of the sensor when interrogating standard oils of different viscosities.
Figure 3.
Sequence of the response of the sensor when interrogating standard oils of different viscosities.
Figure 4.
(a) Typical extracted data from the waveform response of a sensor in different oils. Each data point is collected at 1-second intervals; (b) Normalized q-factor value calculated for each sensor in oils of different viscosities. Each data point is an average of about 180 data points. The standard deviation of the measurement is about 1% for the lower viscosities and 3% for the higher viscosities, but not shown for simplicity.
Figure 5.
(a) Quality factor as a function of actuation for a sensor tested in DI water without any waterproofing coat. The sensor functions, but it is very variable and fails after approximately 100,000 actuations; (b)SEM of location near the failure point where the metal line is discontinuous and results in an open circuit.
Figure 6.
(a) Measured sensor frequency in a viscous fluid (20-21 cSt) before and after the application of the indicated waterproofing material; (b) Measured sensor Q factor in a viscous fluid (20-21 cSt) before and after the application of the indicated waterproofing material.
Figure 6.
(a) Measured sensor frequency in a viscous fluid (20-21 cSt) before and after the application of the indicated waterproofing material; (b) Measured sensor Q factor in a viscous fluid (20-21 cSt) before and after the application of the indicated waterproofing material.
Figure 7.
Normalized q-factor value calculated for each sensor in glycerol/water mixtures of different viscosities. Each data point is an average of about 180 data points. The standard deviation of the measurement is about 1% for the lower viscosities and 3% for the higher viscosities, but not shown for simplicity.
Figure 8.
Q-factor measured for selected sensors with the indicated waterproofing film. These three sensors did not fail up to 1.2 million actuations.
Figure 8.
Q-factor measured for selected sensors with the indicated waterproofing film. These three sensors did not fail up to 1.2 million actuations.
Figure 9.
Q-factor measured for selected sensors with the indicated waterproofing film. These three sensors were tested under high bias (5x normal bias) to accelerate the failures. The nano coat film lasted the longest for approximately 3 hours.
Figure 9.
Q-factor measured for selected sensors with the indicated waterproofing film. These three sensors were tested under high bias (5x normal bias) to accelerate the failures. The nano coat film lasted the longest for approximately 3 hours.
Figure 10.
(a) Microscope picture of a device coated with nano coat, which failed after nearly three hours of actuation under accelerated bias conditions that were 5x higher than normal operation conditions; (b) Detail of the failure location on the metal line that connects the heater in the center of the membrane. Galvanic corrosion is observed.
Table 1.
Measured thickness of waterproofing materials.
Table 1.
Measured thickness of waterproofing materials.
| Sensor |
Waterproofing materials |
Measured Thickness |
| Q I3 C |
Parylene-C (CVD) |
1.93 µm |
| Q K1 C |
Parylene-C (CVD) |
0.52 µm |
| T2_31_nano |
Nano coat 4X (dip coat) |
0.73 µm |
| T2_34_nano |
Nano coat 4X (dip coat) |
0.91 µm |
| T2_35_nano |
Nano coat 4X (dip coat) |
0.86 µm |
| T2_23_DS |
DS (brushed on) |
3.2 µm |
| T2_30_DS |
DS (brushed on) |
2.7 µm |
| T2_33_DS |
DS (brushed on) |
2.6 µm |
Table 2.
Fitted power model of normalized Q as a function of viscosity.
Table 2.
Fitted power model of normalized Q as a function of viscosity.
| Sensor |
Before waterproofing |
After waterproofing |
| |
Y-Intercept |
Exponential Term |
Rsq |
Y-Intercept |
Exponential Term |
Rsq |
| Theoretical→ |
4.58 |
-0.5 |
- |
4.58 |
-0.5 |
- |
| Q I3 C |
3.49 |
-0.44 |
0.91 |
6.47 |
-0.62 |
0.817 |
| Q K1 C |
3.90 |
-0.46 |
0.85 |
4.71 |
-0.53 |
0.84 |
| T2_31 nano |
8.56 |
-0.69 |
0.98 |
7.53 |
-0.69 |
0.99 |
| T2_34 nano |
10.25 |
-0.68 |
0.84 |
13.21 |
-0.85 |
0.99 |
| T2_35 nano |
4.00 |
-0.44 |
0.96 |
5.14 |
-0.58 |
0.82 |
| T2_23 DS |
4.71 |
-0.56 |
0.95 |
6.49 |
-0.63 |
0.87 |
| T2_30 DS |
5.73 |
-0.53 |
0.95 |
5.31 |
-0.58 |
0.63 |
| T2_33 DS |
5.34 |
-0.56 |
0.99 |
3.35 |
-0.45 |
0.85 |
|
Disclaimer/Publisher’s Note: The statements, opinions and data contained in all publications are solely those of the individual author(s) and contributor(s) and not of MDPI and/or the editor(s). MDPI and/or the editor(s) disclaim responsibility for any injury to people or property resulting from any ideas, methods, instructions or products referred to in the content. |
© 2024 by the authors. Licensee MDPI, Basel, Switzerland. This article is an open access article distributed under the terms and conditions of the Creative Commons Attribution (CC BY) license (http://creativecommons.org/licenses/by/4.0/).
