Preprint
Article

Sound-Absorbing, Thermal-Insulating Material Based on Poly (methylsiloxane) Xerogel and Cellulose Nanofibers

Altmetrics

Downloads

104

Views

35

Comments

0

A peer-reviewed article of this preprint also exists.

Submitted:

21 January 2024

Posted:

22 January 2024

You are already at the latest version

Alerts
Abstract
The automotive industry needs to improve energy efficiency rapidly to achieve carbon neutrality while creating a safe, secure, comfortable driving environment for customers. Porous sound-absorbing materials and porous thermal insulators are typically used to satisfy these requirements despite limitations in mass and space. While these porous materials are similar, the microstructures they offer for high performance differ in the size and connectivity of their fluid phases, which enhances the difficulty of achieving excellent sound absorption and thermal insulation in the same material. In this study, a hydrophobic cellulose nanofiber–poly(methylsiloxane) xerogel composite was developed using computational microstructure modeling. This porous material has high porosity and excellent thermal insulation and sound absorption properties.
Keywords: 
Subject: Engineering  -   Automotive Engineering

1. Introduction

Governments are setting targets for carbon neutrality. The automotive industry is also under pressure to establish and significantly accelerate strategies for further improvements in energy efficiency and weight reduction toward zero greenhouse gas emissions. Meanwhile, a high level of comfort, which is achieved through quietness and good air-conditioning performance, among others, is needed to provide a safe, secure, pleasant traveling environment for customers. Porous sound-absorbing materials and porous thermal insulators are widely used to satisfy these requirements in a limited mass and space. A typical property that indicates the performance of a porous sound-absorbing material is its sound absorption coefficient. A high-performance porous sound absorber generally has a mixed structure of a solid phase as its base material and a fluid phase consisting of braided channels with diameters ranging from several tens of micrometers to several millimeters; its sound absorption properties depend on its microstructure [1,2,3,4,5].
Another typical property that arises from porous structure is thermal conductivity. A high-performance porous thermal insulator generally has a mixed structure comprising a solid phase as its base material and a fluid phase consisting of independent spaces with diameters ranging from several tens of nanometers to several tens of micrometers; its thermal insulation properties also depend on its microstructure [6,7,8]. Thus, porous sound absorbers and porous thermal insulators are similar; they differ in the microstructures they offer for high performance, specifically the size and connectivity of their fluid phases. The difference in the size scale of fluid phase makes it difficult to achieve compatibility between the two materials at high dimensions.
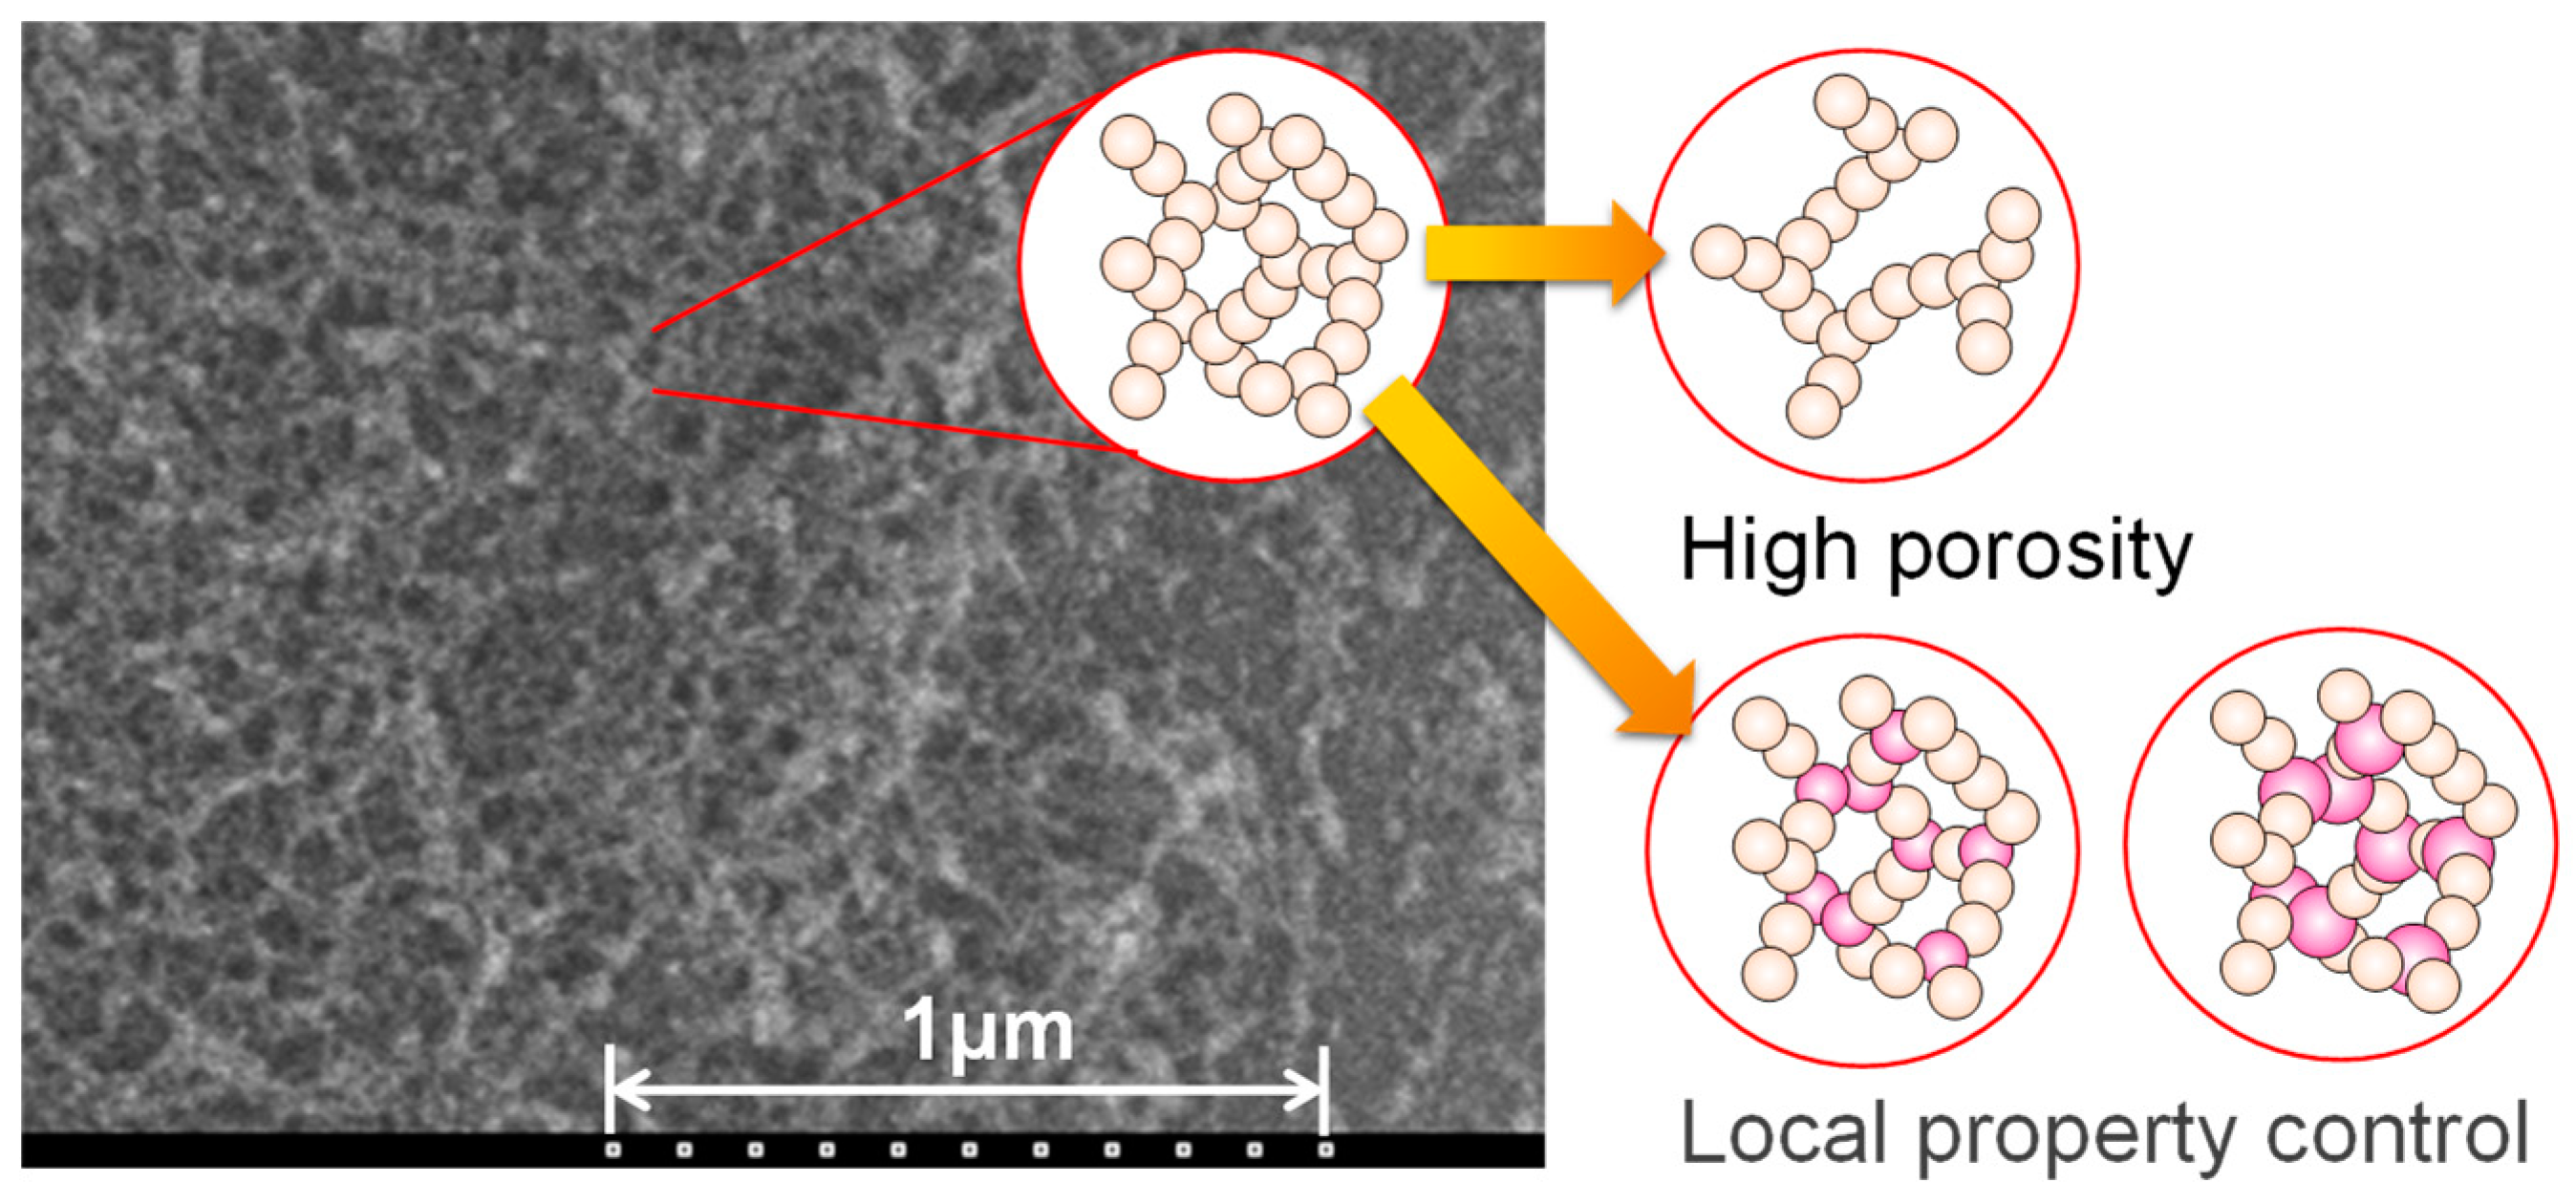
Therefore, we have been working on the research and development of porous materials using materials model-based research through collaboration between industry, the government, and academia. This research method aims to develop materials with favorable performance efficiently by backcasting from the required functions of such products. The phenomena occurring in the internal microstructure of a material are modeled using mathematical formulas based on the energy propagation mechanism, and the product is designed based on the modeling results. We have developed a computational microstructure modeling approach that predicts three properties of porous materials: sound absorption, thermal insulation, and vibration damping (Figure 1) [9,10,11,12]. Vibration damping is an important property that affects the ride and feel of a vehicle, but is not the subject of this study.
In this study, we developed a porous material with excellent sound absorption and thermal insulation using this computational microstructure modeling approach. The porous material was obtained in a sol-gel process from organoalkoxysilanes and cellurose nanofibers (CNFs), namely, a composite xerogel of poly(methylsiloxane) (PMS) and CNF.

2. Materials and Methods

2.1. Computational microstructure modeling approach to designing porous materials

The sound absorption and heat conduction phenomena occurring in the solid and fluid phases inside porous materials are formulated using the homogenization method. This section outlines the microstructural design model of such sound absorption phenomenon.
The sound absorption model considers the viscosity of the fluid phase and attenuation due to heat dissipation. Homogenization is applied using asymptotic expansion to directly obtain the equivalent properties necessary to predict the macroscopic properties of the porous sound-absorbing material from its microstructure. These equivalent properties are then applied to a model of porous sound absorbers to determine the macroscopic properties of the material, such as its sound absorption coefficient, as described by Yamamoto et al. [13].
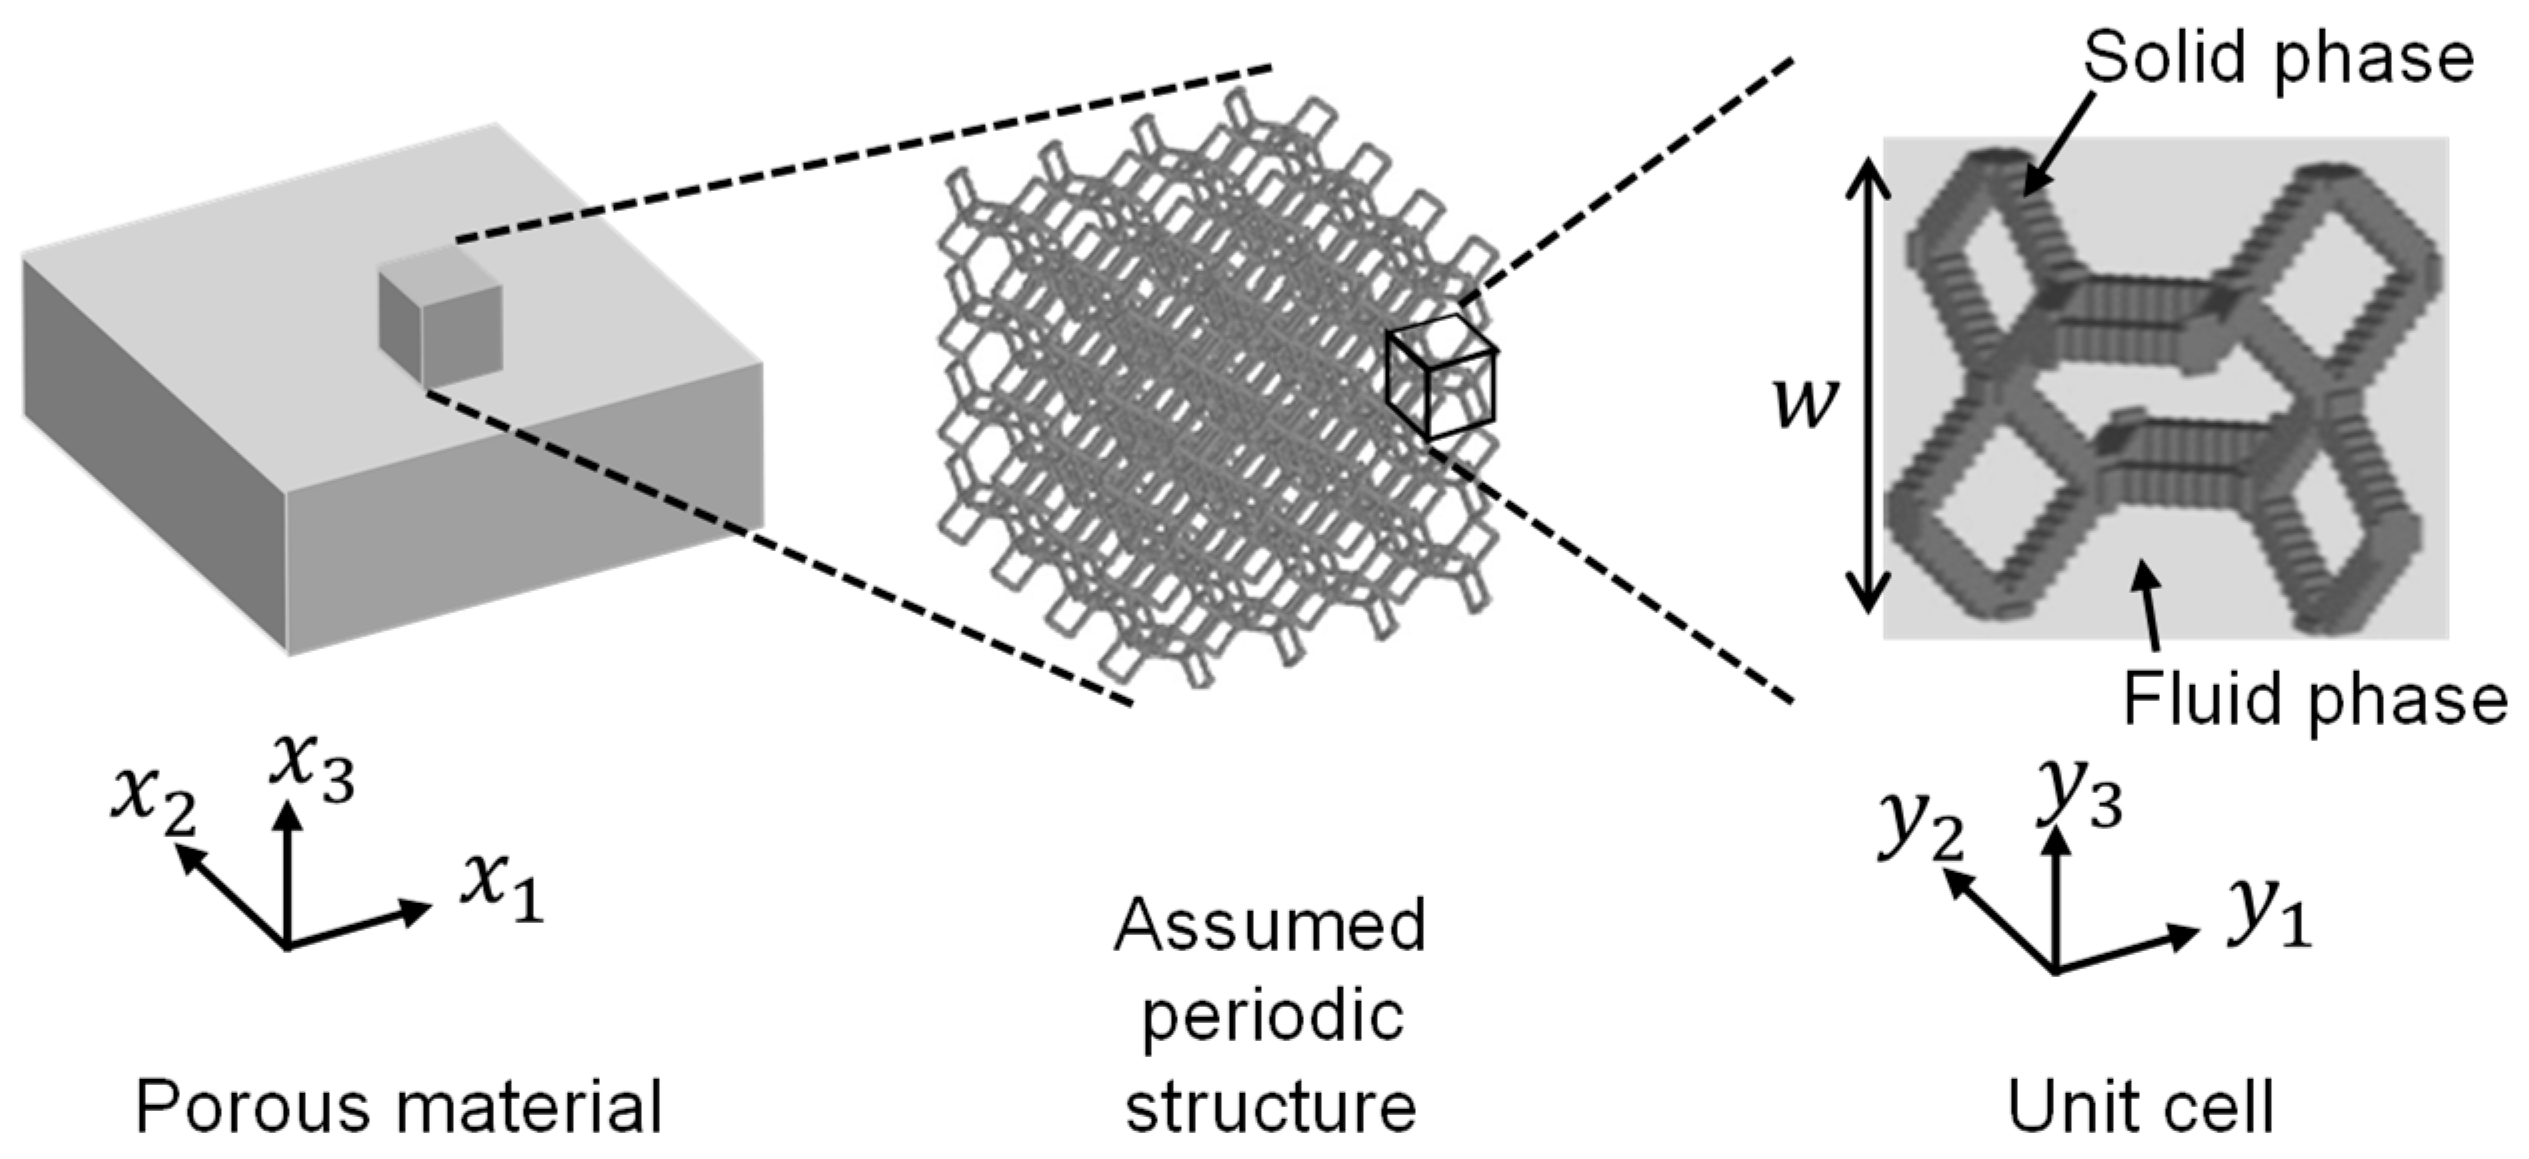
Consider the porous sound-absorbing material with a periodic microstructure shown in Figure 2. For the microscale governing equations, the equilibrium, constitutive, and displacement–strain relations of a linear elastic body are applied to the solid phase. The linearized Navier–Stokes equations are applied to the flow field of the fluid phase, which is assumed to exhibit microdisplacement. The temperature field of the fluid phase follows the first law of thermodynamics. Because the specific heat of the solid phase is sufficiently high compared with that of the fluid phase, the temperature field of the solid phase is assumed to be in equilibrium. The law of conservation of mass and an equation of state are considered to be the governing equations. Velocity, vertical stress, and temperature continuity conditions are imposed at the boundary between the solid and fluid phases. Assuming an asymptotically expanded solution and substituting it into the microscale governing equations, we obtain microscale boundary value problems. Macroscopic properties, such as equivalent density, are obtained by volume-averaging the solutions obtained from solving these equations. The macroscale governing equations for the solid and fluid phases are derived by averaging the microscale governing equations. Performance indicators, such as the sound absorption coefficient, are determined by solving these equations.
The microscale governing equations of a porous sound-absorbing material are described. The solid phase is an isotropic linear elastic body, the fluid phase is a viscous fluid with a compressible viscosity coefficient μ f , and all fluid phases are assumed to be connected. The governing equations for the solid phase are expressed as Equation (1), where ω is angular frequency, u i s is the displacement of the solid phase, ρ s is the mass density, c i j k l s is the elasticity tensor, ε k l s is the distortion, and σ i j s is the stress.
ρ s ω 2 u i s = σ i j s x j ,   σ i j s = c i j k l s ε k l s ,   ε k l s = 1 2 u k s x l + u l s x k
The velocity and mass density of the fluid phase are denoted as v i f and δ f , respectively. The governing equations for the flow field of the fluid phase are expressed in terms of the linearized Navier–Stokes equations, given that they are of a small amplitude.
ρ f j ω v i f = σ i j f x j ,   σ i j f = p f δ i j + 2 μ f ε ˙ i j f 2 3 μ f δ i j ε ˙ k k f ,   ε ˙ i j f = 1 2 v i f x j + v j f x i
The specific heat of the solid phase is sufficiently high compared with that of the fluid phase, so the temperature T 0 can be assumed to be in equilibrium. Then, only the fluid phase needs to be considered for the temperature field, and the governing equation can be expressed as follows according to the first law of thermodynamics:
q i f x i = j ω ρ f C v f τ f + j ω ρ f R τ f j ω p f ,   q i f = κ i j f τ f x j ,
where τ f is the temperature variation, C v f is the constant-volume specific heat, R is the gas constant, q i f is the heat flow velocity, and κ i j f is the thermal conductivity. The law of conservation of mass and equation of state for the fluid phase can be expressed as follows:
ρ f v i f x i + j ω δ f = 0 ,   p f P f = δ f ρ f + τ f T f .
The boundary conditions at the boundary Γ s f between the solid and fluid phases are written in terms of the continuity of velocity, boundary vertical stress, and temperature as follows:
j ω u i s = v i f ,   σ i j s n j s + σ i j f n j f = 0 ,   τ f = 0 ,
where n i s and n i f are the unit normal vectors of the solid and fluid phases, respectively, outward to the domain at Γ s f .
Assuming that the microstructure is periodic, let Y be the unit cell and l be the size of the unit cell ( l = w in Figure 2). The representative macroscale length L is the wavelength of the porous material, and the ratio of the representative microscale length to the representative macroscale length is ε = l L . Let x be the macroscale spatial variable and y = x / ε   ε 1 be the microscale spatial variable. Asymptotic expansion solutions are possible; Gilbert and Mikelić [14] and Clopeau et al. [15] applied two-scale convergence theory to a problem of porous materials. For the state quantities u i s , v i f , p f , τ f , and δ f , we assume the asymptotic expansion solution of Sanchez-Palencia [16] as follows:
u i s = u i s 0 x , y + ε u i s 1 x , y + ε 2 u i s 2 x , y + ,
v i f = v i f 0 x , y + ε v i f 1 x , y + ε 2 v i f 2 x , y + ,
p f = p f 0 x , y + ε p f 1 x , y + ε 2 p f 2 x , y + ,
τ f u i s = τ f 0 x , y + ε τ f 1 x , y + ε 2 τ f 2 x , y + ,
δ f u i s = δ f 0 x , y + ε δ f 1 x , y + ε 2 δ f 2 x , y + ,
where all terms on the right-hand side are periodic with respect to y ( Y -periodic).
Applying the Galerkin method to a relational expression of the order of ε 1 for the solid phase, we obtain the following boundary value problem for the Y -periodic characteristic function χ i k l y :
Y c i j k l s c i j p q s χ p k l y y q δ u i s y j d Y = 0 .
The characteristic function χ i k l y can be obtained by solving the above equation under the condition Y χ i k l y = 0 to exclude rigid-body displacements.
Consider the relative velocity w i f 0 = v i f 0 j ω u i s 0 of the fluid phase to the solid phase on the order of ε 0 and replace v i f 0 with w f 0 + j ω u i s 0 . From the relation on the order of ε 1 , we obtain the following microscale boundary value problem for the flow field of the fluid phase:
Y ρ f j ω ξ i k y δ w i f d Y + Y μ f ξ i k y y j δ w i f y j d Y + Y 1 3 μ f ξ i k y y i δ w i f y i d Y
Y ξ i k y y i δ p f d Y Y δ w i f y i π k y d Y = Y δ ξ k k y d Y
where ξ i k y and π k y are the Y -periodic characteristic functions of relative velocity and pressure, respectively. ξ i k y = 0 at Γ s f . ξ i k y and π k y are obtained by implement the condition Y π k y d Y = 0 to exclude the constant-pressure component.
From the relation for the temperature τ f 0 of the fluid phase on the order of ε 0 , we obtain the following boundary value problem:
Y 1 j ω ρ f C p f κ i j f ζ y y j δ τ f y i d Y + Y ζ y δ τ f d Y = Y δ τ f d Y ,
where ζ y is a Y -periodic characteristic function with respect to temperature; the isothermal condition ζ y = 0 is satisfied at Γ s f .
The characteristic function χ i k l y in unit cell Y , obtained by solving the corresponding boundary value problem, is volume averaged. The homogenized elastic tensor c i j k l s of the solid phase is obtained using the following formula:
c i j k l H = 1 Y Y c i j k l s c i j p q s χ p k l y y q d Y ,
where Y is the volume of the unit cell Y of the porous material.
The equivalent density ρ k i f c of the fluid phase is obtained by volume averaging the ξ i k y of the fluid phase Y f in the unit cell.
ρ k i f c = 1 j ω ξ i k y Y f 1 ,
where Y f is the volume of the fluid phase Y f in the unit cell and   Y f is the volume average of Y f .
The equivalent volumetric modulus of elasticity K f of the fluid phase is obtained by volume averaging the ζ y of the fluid phase Y f in the unit cell as follows:
K f = γ f P f γ f γ f 1 ζ y Y f .
The obtained macroscopic properties are then used to derive the macroscale governing equations for the solid and fluid phases respectively as follows [17]:
σ ^ i j s 0 x j + ρ ¯ ω 2 u i s 0 ρ 0 f ω 2 d i k u k s 0 j ω d i k ψ f 0 x k + j ω ϕ ψ f 0 x i + j ω k i j H ψ f 0 x j = 0 ,
d i k ρ 0 f 2 ψ f 0 x k x i + ω 2 θ f + ϕ K f ψ f 0 j ω d i k u k s 0 x i + j ω ϕ u i s 0 x i + j ω θ s , p q ε p q s 0 = 0 ,
where ψ f 0 is the potential function, defined as p f 0 = j ω ψ f 0 ; σ ^ i j s 0 is the stress in the solid phase without considering its coupling with the fluid phase; ϕ is the porosity; and ρ ¯ is the average mass density of the porous material, 1 ϕ ρ s + ϕ ρ 0 f . c i j k l H , k i j H , and θ s , p q are the homogenized macro properties of the solid phase (homogenized elastic tensors). θ f , K f , and d i k are the homogenized macro properties of the fluid phase.
σ ^ i j s 0 = c i j k l H ε k l s 0 ,   k i j H = 1 Y Y c i j k l s η k y y l d Y ,   θ s , p q = 1 Y Y χ k p q y y k d Y .
θ f = 1 Y Y η k y y k d Y ,   d i k = ρ f j ω ξ i k y .
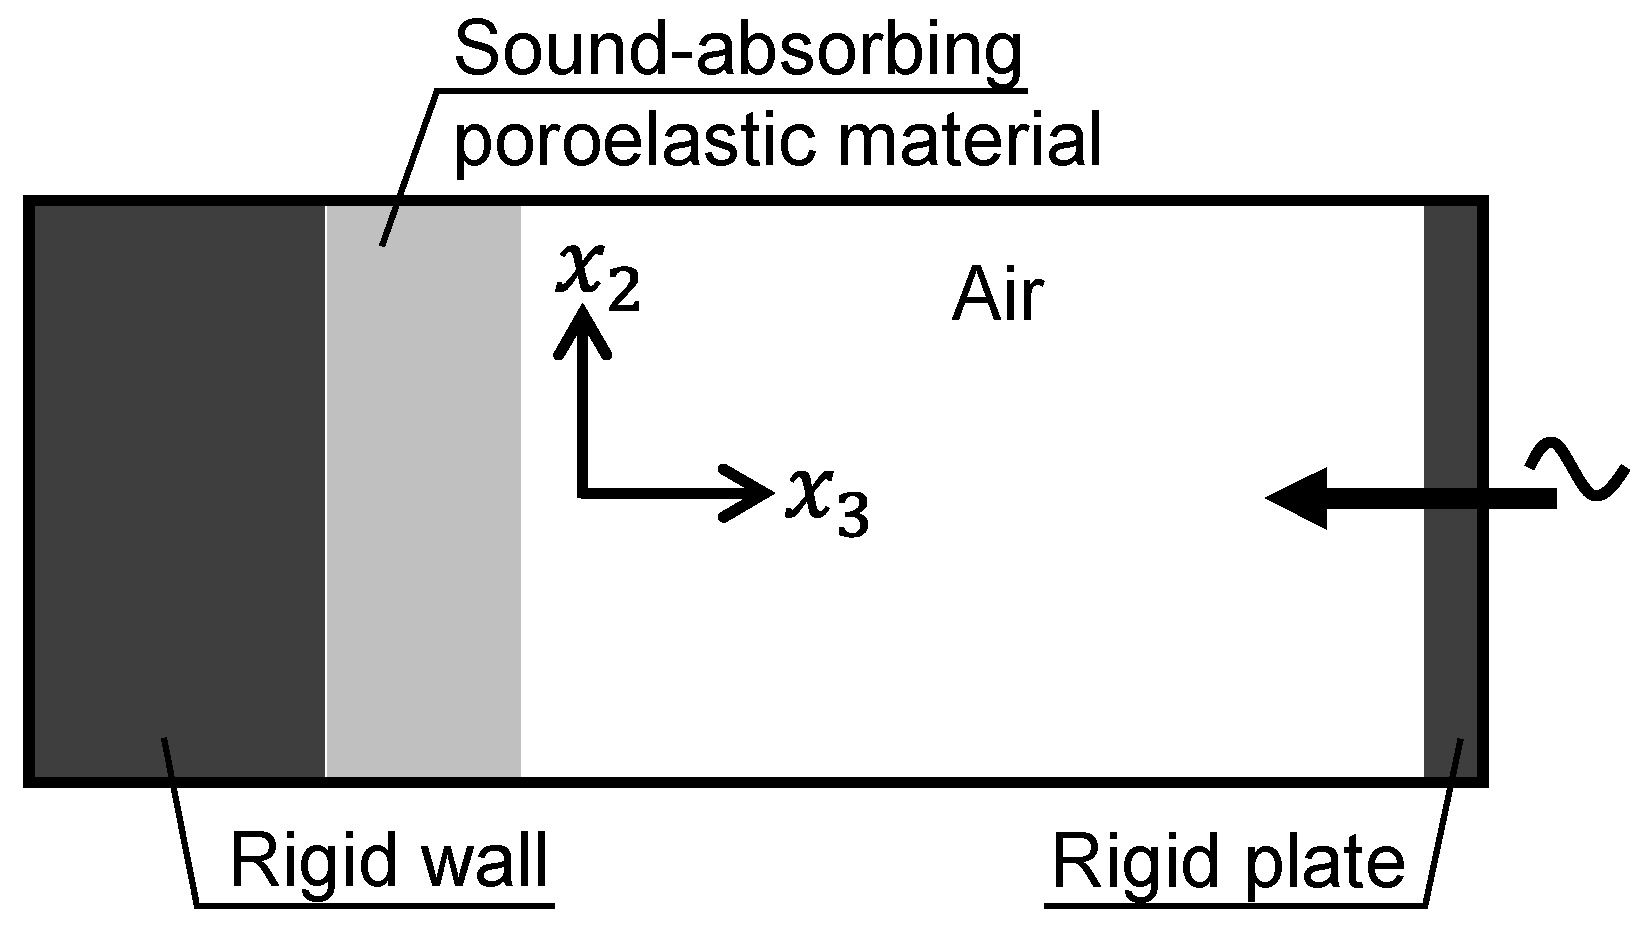
The vertical-incidence sound absorption coefficient is derived through Equation (21) using the acoustic tube model shown in Figure 3 and by formulating the porous sound-absorbing material using the homogenized macroscopic properties ( c i j k l H , k i j H , θ s , p q , θ f , K f , and d i k ) and the macroscale governing equations (Equations (17) and (18)).
α = 1 R 2 ,   R = e j k a l 2 l 1 p 1 p 2 p 1 p 2 e j k a l 2 l 1 e j k a 2 l 2 ,
where k a is the frequency of air. p 1 and p 2 are the sound pressures at distances l 1 and l 2 , respectively, from the surface of the porous sound-absorbing material in the acoustic tube.

2.2. Application of computational microstructure modeling to porous materials

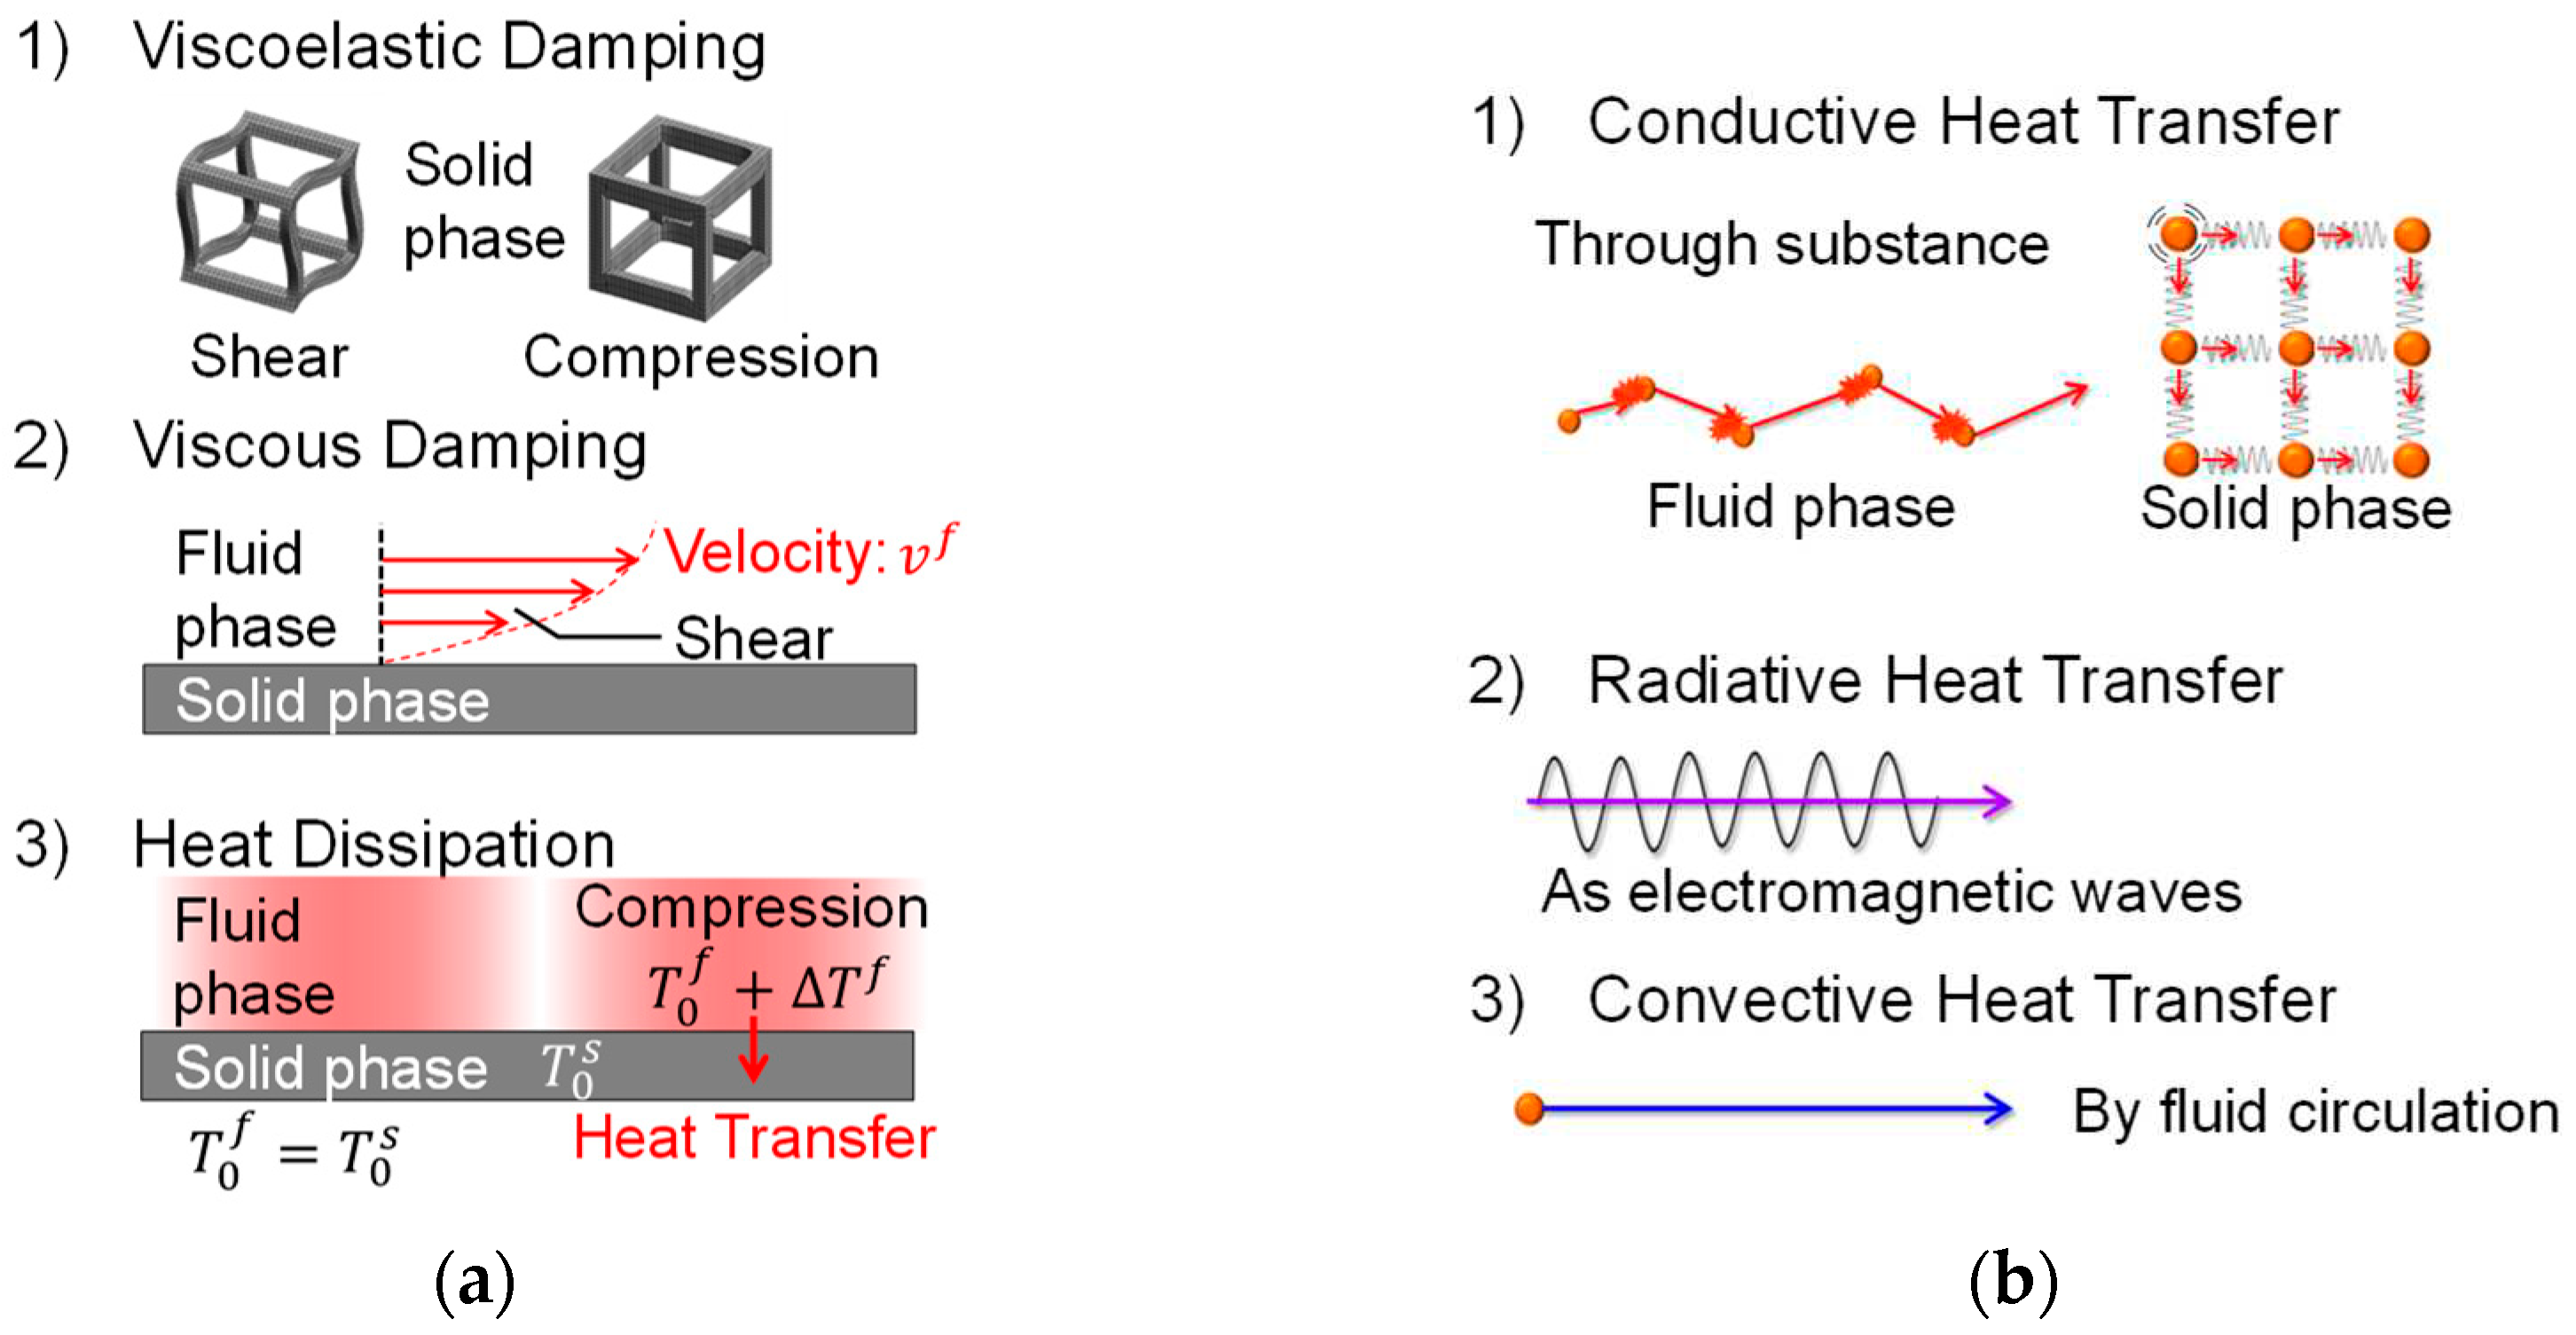
As shown in Figure 4 (a), a porous sound-absorbing material absorbs sound by converting the energy of sound waves entering the material into thermal energy through viscoelastic damping in the solid phase and through viscous damping and heat dissipation at the boundary between the fluid and solid phases. In other words, the more numerous the boundaries between the fluid and solid phases, the greater the sound absorption. Furthermore, the effect of flow resistance emerges when sound waves can penetrate the porous sound-absorbing material. Both of these requirements can be fulfilled by a high-performance porous sound-absorbing material that has a mixed structure consisting of a solid phase as the base material and a fluid phase consisting of channels with diameters ranging from several tens of micrometers to several millimeters.
As shown in Figure 4 (b), a porous thermal-insulating material insulates by decrease contributions by the heat propagation paths inside the material: heat conduction in the solid and fluid phases, heat radiation, and heat convection. Therefore, heat conduction in the solid phase and heat radiation and heat convection in the fluid phase can be reduced by a high-performance porous insulation material that has a structure comprising a solid phase with a minimal volume fraction and a fluid phase consisting of independent spaces with diameters of less than several tens of micrometers. Drastic suppression of the heat conduction in the fluid phase requires a mixed structure composed of a fluid phase consisting of spaces with diameters on the order of tens of nanometers (about 70 nm or less at atmospheric pressure); these diameters are less than the mean free path of air in the standard state. Thus, in general, high-performance porous thermal-insulating materials do not function as sound absorbers because they do not have channels through which sound waves can pass or the spaces in the fluid phase are too minute for sound waves to penetrate. Therefore, achieving both high sound absorption and high thermal insulation in the same material using the conventional approach is difficult.
In this study, we develop a porous material with excellent sound absorption and thermal insulation properties by materializing a sound absorption mechanism that does not allow sound waves to penetrate the material, which addresses this problem. Specifically, this porous material absorbs sound by causing the solid phase to vibrate violently when sound waves are incident, thereby inducing relative velocity and viscous damping at the boundary between the fluid and solid phases. The microscopic structure of this material is designed using the model shown in Section 2.1, and its performance is verified.

2.3. Preparation of porous materials and performance evaluation methods

A prototype porous composite material consisted of PMS xerogel and CNFs was fabricated to resemble the microstructure and Young's modulus of the porous sound absorber model calculated in Section 3.1. The fabrication procedure accorded with Kanamori et al. [18] and Yamasaki et al. [19].
The vertical-incidence sound absorption coefficients of the prepared xerogel specimens were measured using a WinZacMTX (Nihon Onkyo Engineering Co., Ltd.; per JIS A 1405-2 and ISO 10534-2). The inner diameter of the acoustic tube was 40 mm, and the measurement frequency range was 200–4,800 Hz.
The flow resistance per unit thickness was measured using an AirReSys (Nihon Onkyo Engineering Co., Ltd.; per ISO 9053). The differential pressure before and after the specimen was read when air flowed through the specimen at a velocity of 0.5 mm/s. The results were normalized using the flow velocity and specimen thickness.
Young’s modulus and the loss modulus were measured using a modulus measurement system (Nihon Onkyo Engineering Co., Ltd.). The specimen was placed on the base plate of a shaker, and a mass plate was placed on top of the specimen to construct a spring–mass system in the thickness direction. Resonance was generated by vibrating the base plate, and Young’s modulus was calculated using the resonance frequency and the thickness of the specimen. The loss factor was calculated using the full width at half maximum of the peak near the resonance frequency.
The pore size distribution was determined using an AutoPore IV 9500 mercury intrusion porosimeter (Micromeritics Instruments Corporation). A measurement specimen sized approximately 0.03–0.04 g was placed in a sealed glass container for measurement. The mercury intrusion pressure ranged from approximately 1 kPa to 400 MPa, and the measurement mode was pressure boosting.
Thermal conductivity was measured in a room under standard conditions using a simple measurement apparatus equipped with a heat flux sensor, thermocouples, an electric heater, and a thermal insulator, as shown in Figure 5. The heat flux sensor and a thermocouple were placed on the heater, which supplied a constant heat quantity. The test specimen, which was covered with an insulation material with a thermal conductivity of 0.0313 W/(m·K), was placed on the heater and the thermocouple, and a thermocouple and a 1 mm–thick resin plate was placed on the test specimen for measurement. Thermal conductivity was derived from the measured heat flux and the temperatures above and below the specimen. The thermal conductivity of the thermal-insulating material was 0.0313 W/(m·K) according to a steady-state thermal conductivity measurement system (HFM436/3/1 Lambda, NETZSCH-Gerätebau GmbH; per JIS A 1412-2 and ISO 8301) and 0.0469 W/(m·K) according to this simple measurement apparatus. Therefore, as a reference value, a calibrated value of thermal conductivity was also calculated assuming a constant percentage of heat flowing out of this simple system for the measurement of thermal conductivity.

3. Results and Discussion

3.1. Predicted sound absorption coefficients

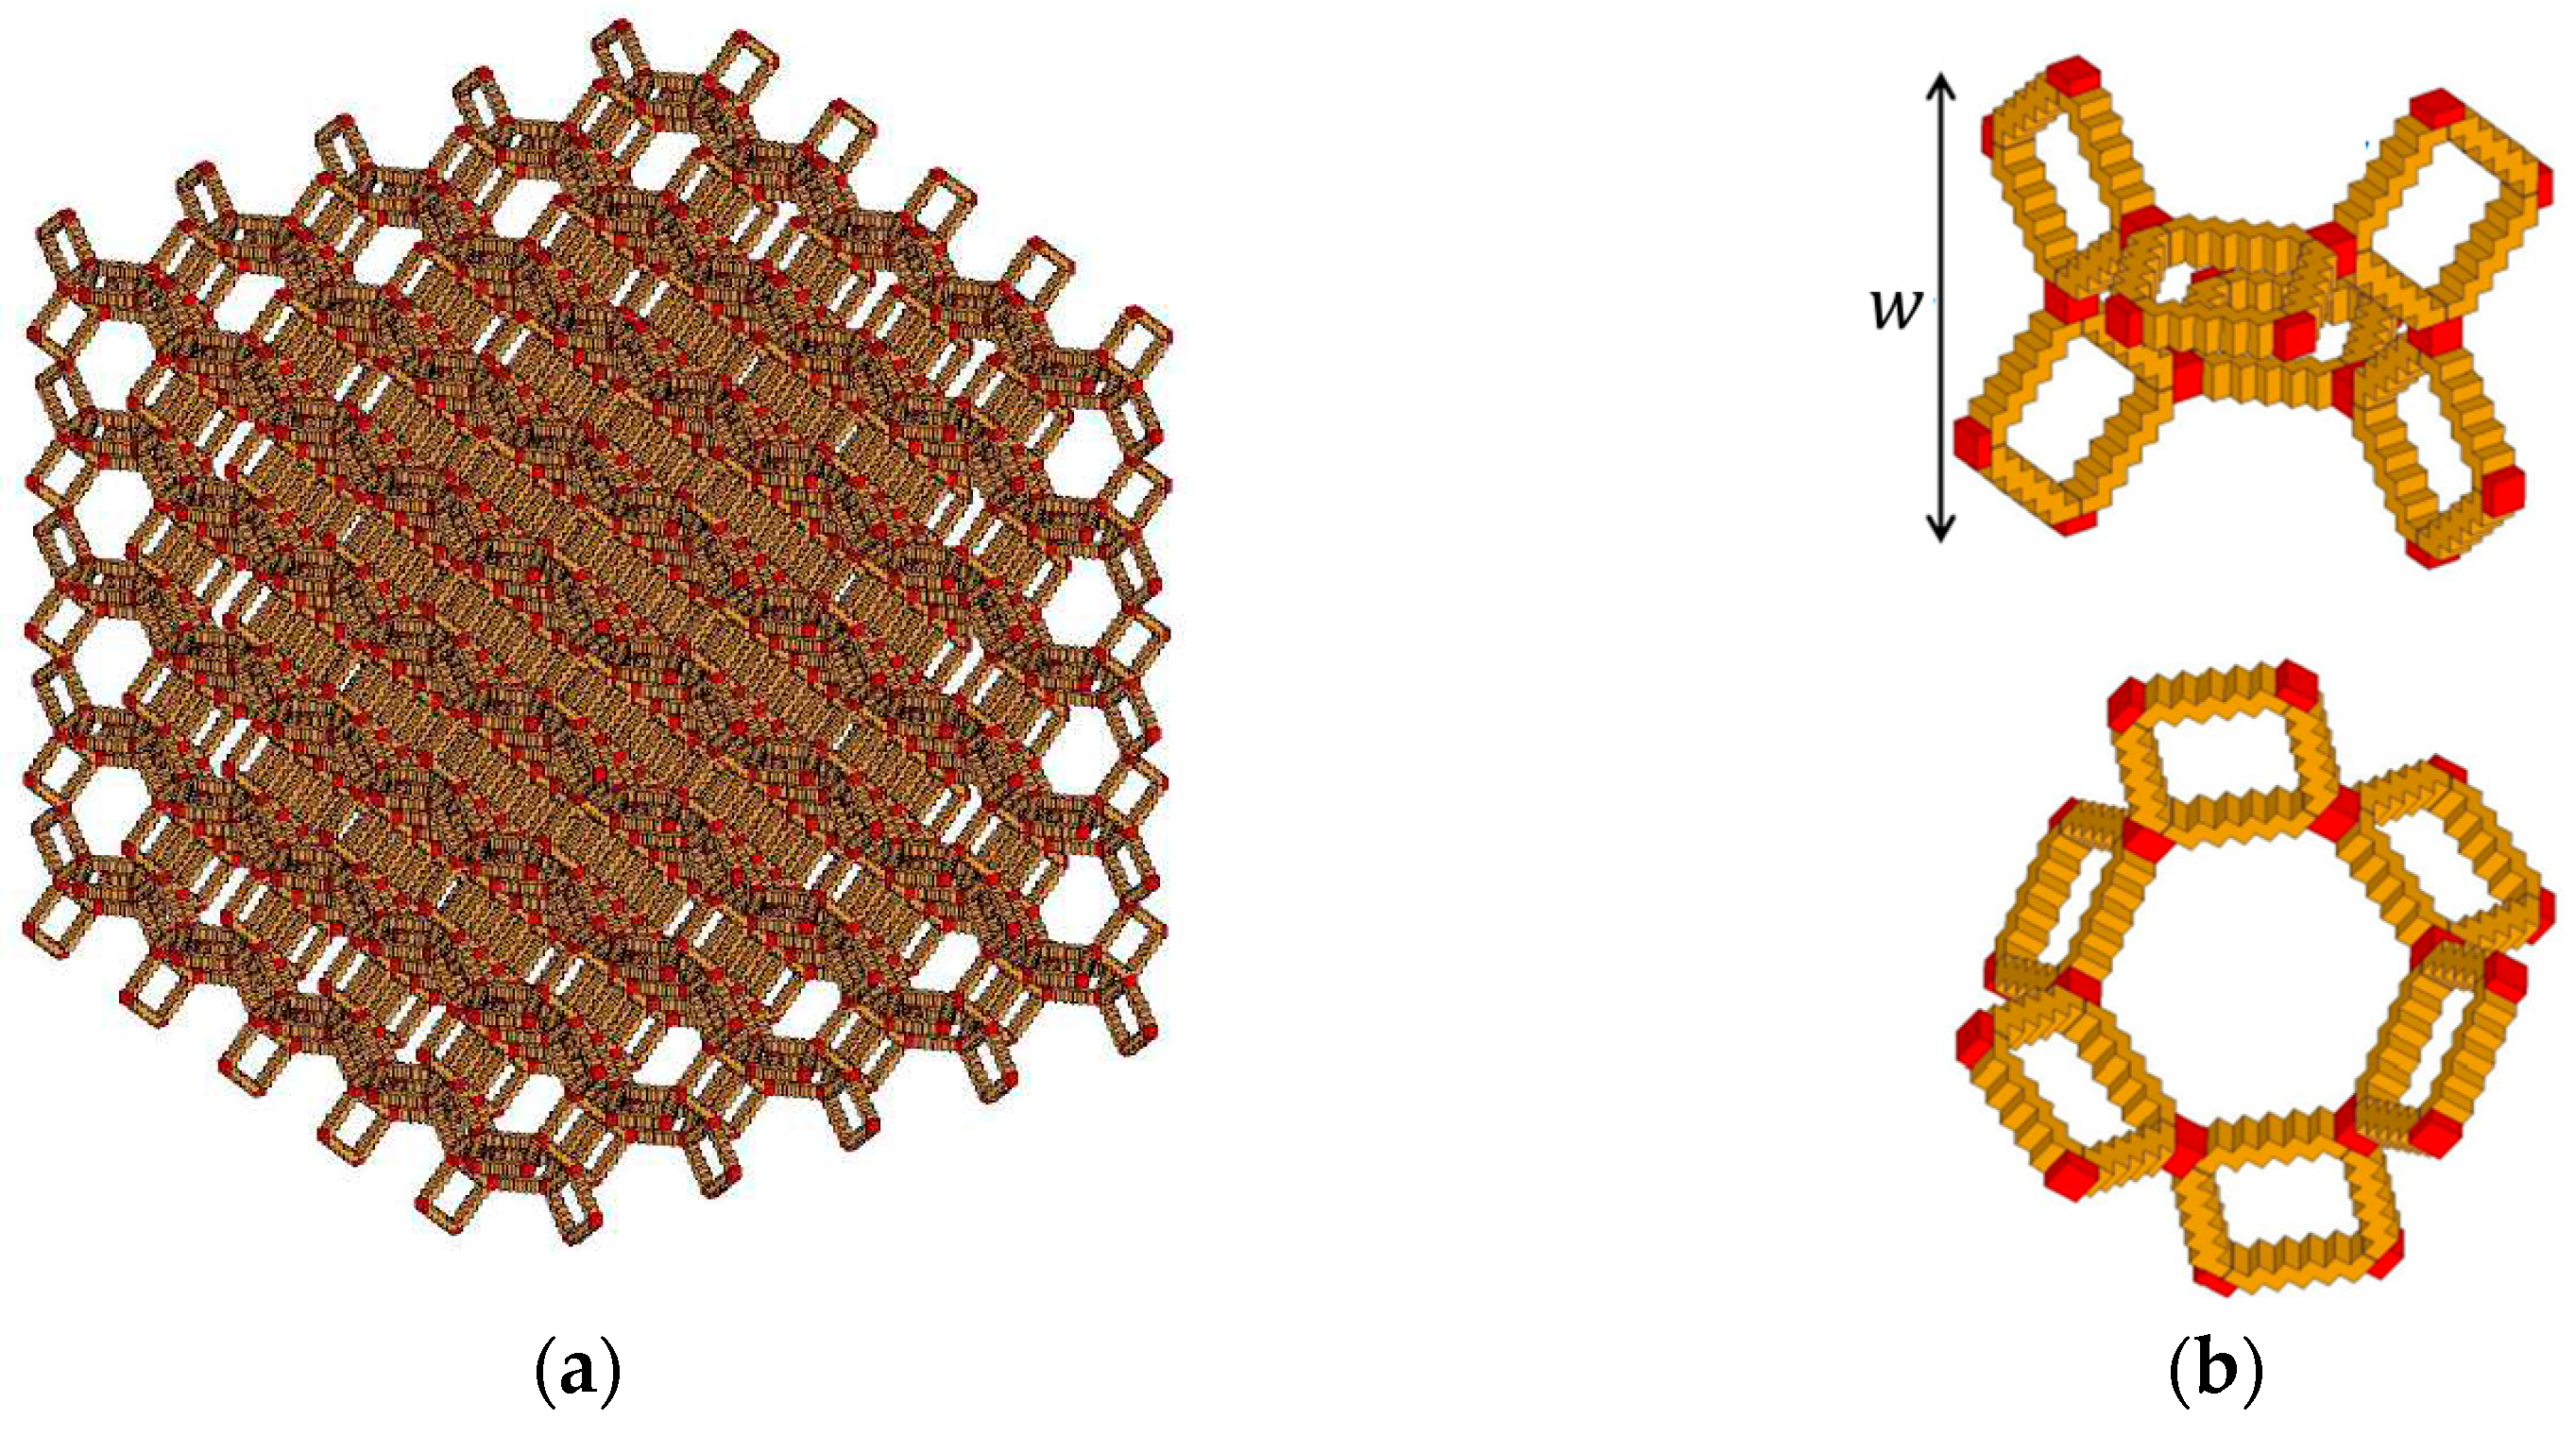
In this study, we made the solid phase vibrate violently due to incident sound waves to induce relative velocity and viscous damping at the boundary between the fluid and solid phases as a sound absorption mechanism without sound wave penetration, which is unlike the conventional method shown in Section 2.2. The main result of this verification is the goal of this study. The vertical-incidence sound absorption coefficient was calculated using the model shown in Section 2.1 to verify the abovementioned concept. The Kelvin cell model in Figure 6 was used to represent the microstructure of the porous sound-absorbing material. Its unit cell (Figure 6(b)) consisted of a rectangle and a hexagon with bar-like ligaments. Given the same lengths w of the three sides of the unit cell ( w x = w y = w z = w ), the sizes of the square and hexagonal vacancies were approximately 1/3 w and 2/3 w , respectively. The lengths w of the three sides of the unit cell were varied from 1 to 10 μm (the average pore size was approximately 0.5–5.2 μm), which are almost impenetrable to sound waves. The material of the ligaments was glass, and the material properties of the joints between ligaments were set as shown in Table 1.
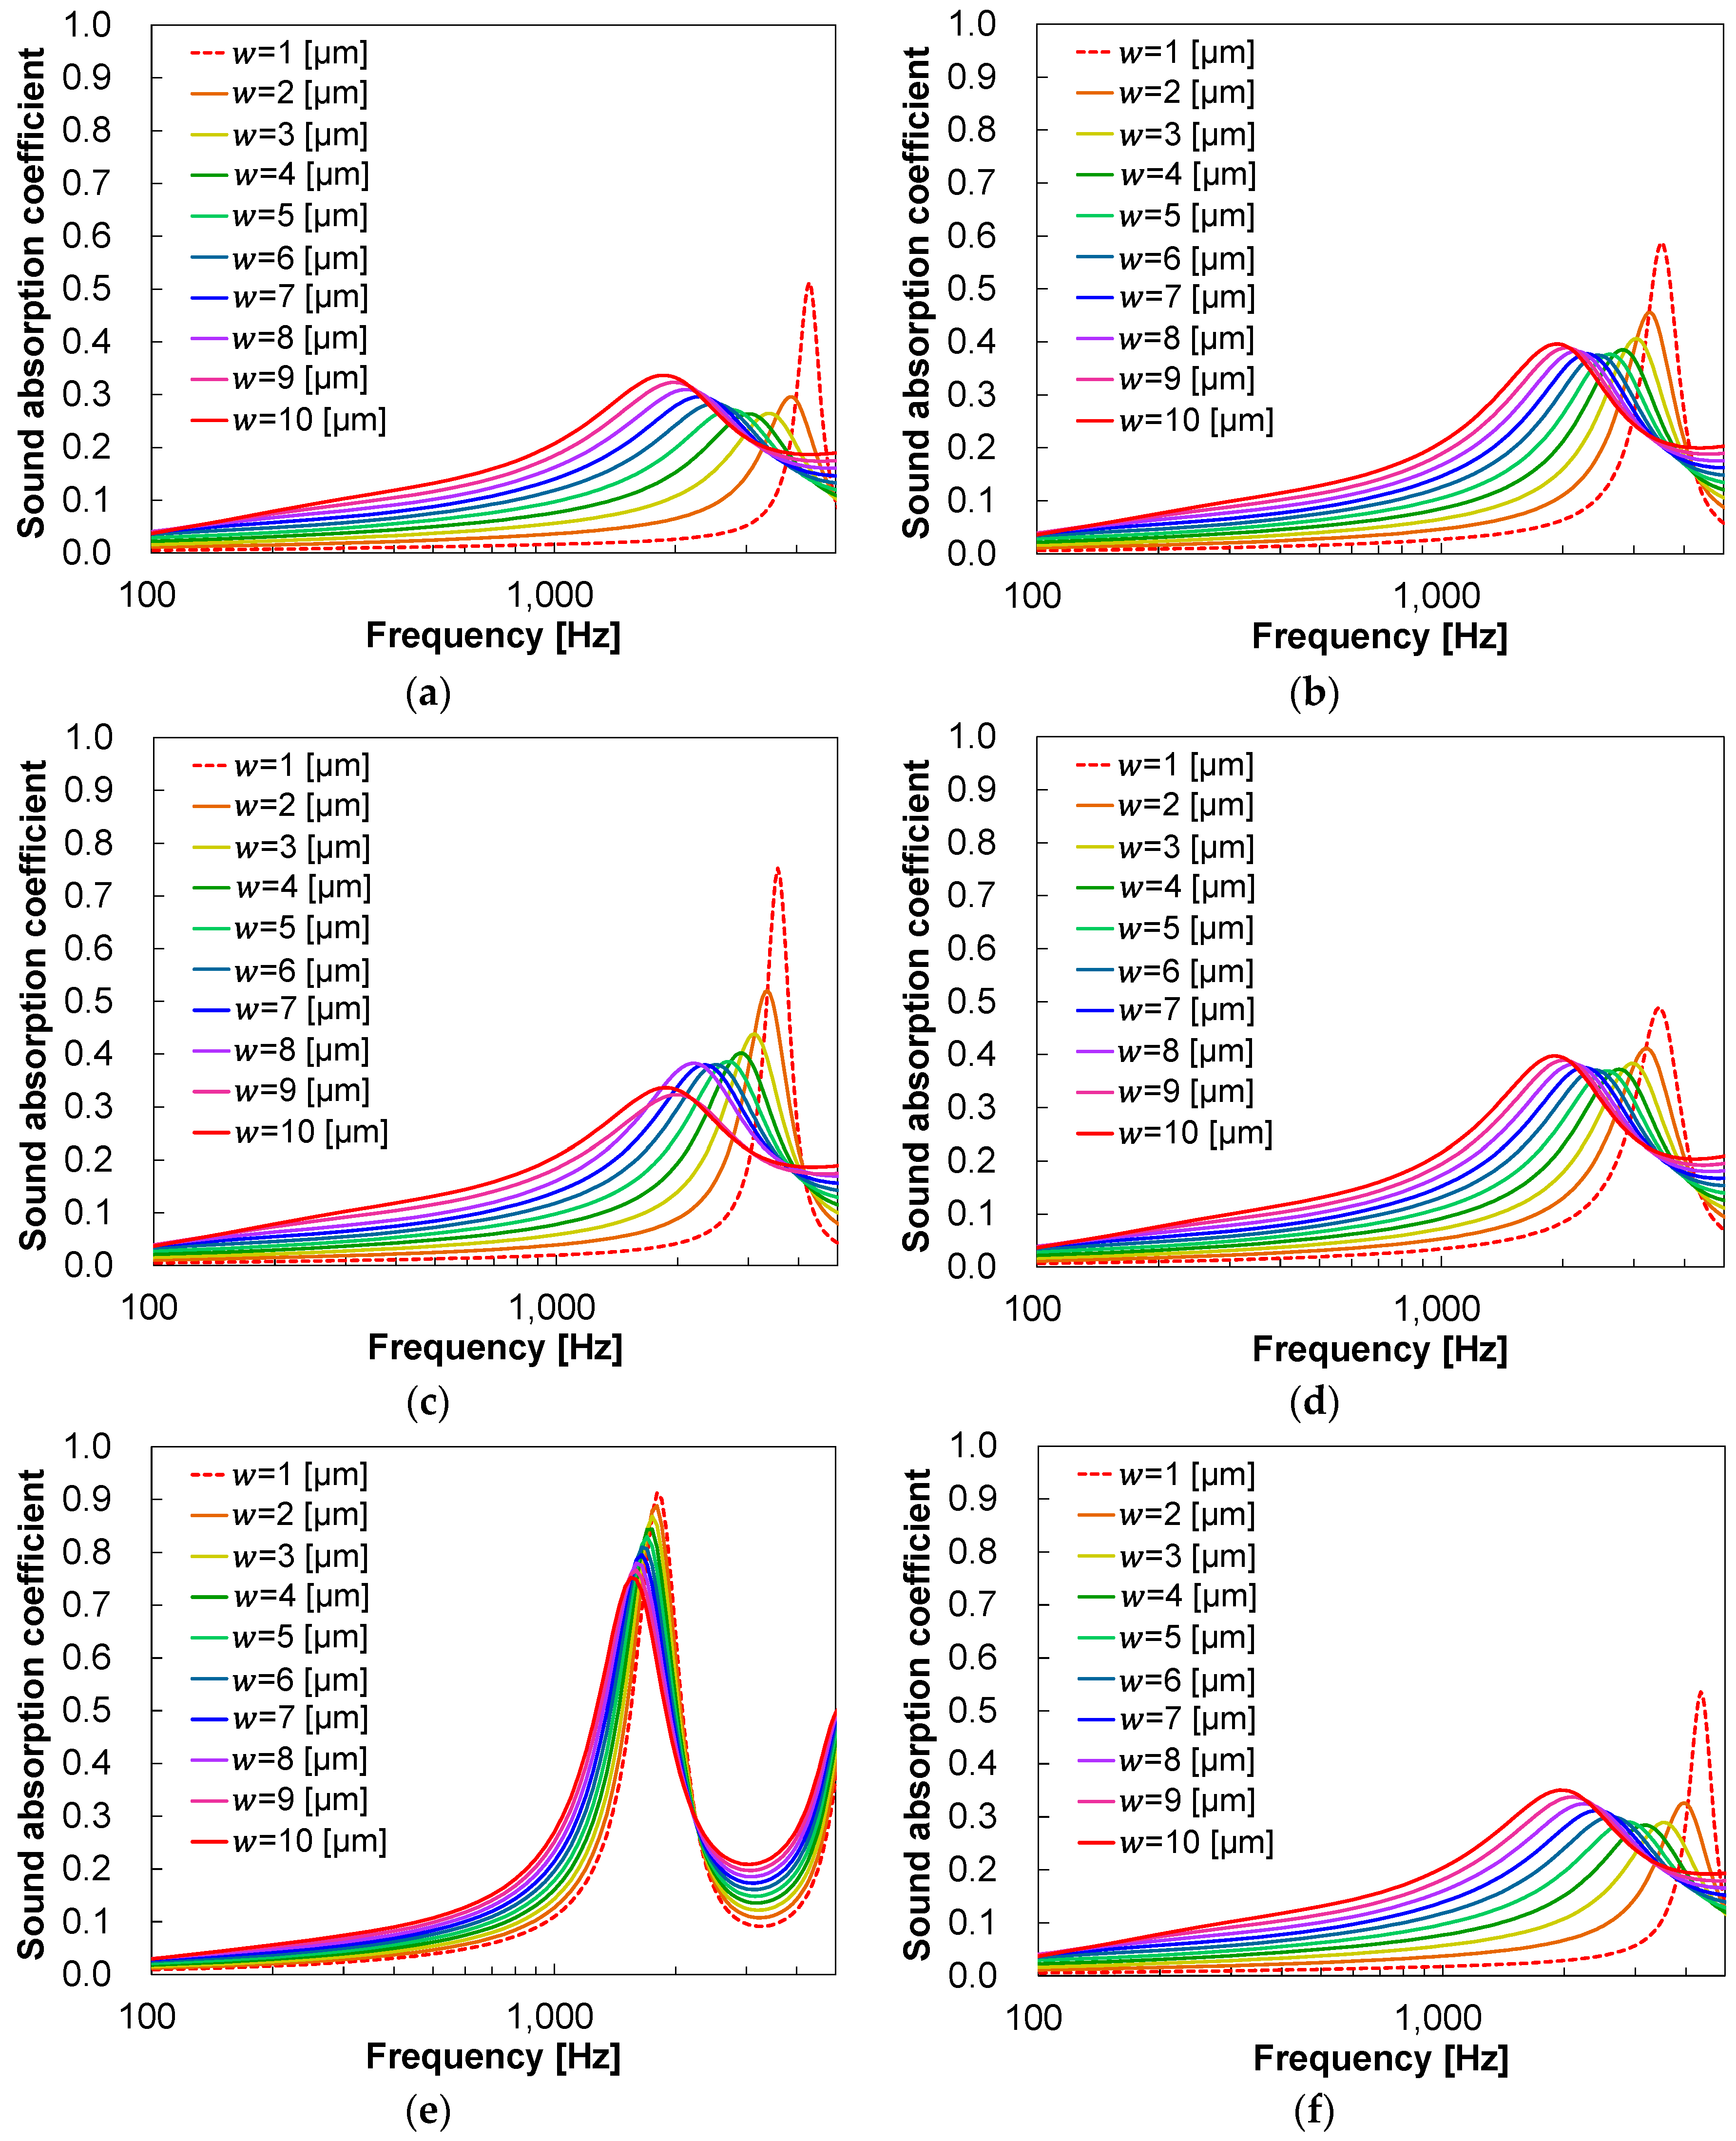
Figure 7 shows the spectra of the predicted sound absorption coefficients, and Table 2 shows the average sound absorption coefficients in the 1/3-octave band from 500 to 3,150 Hz and from 1,000 to 5,000 Hz, which are commonly required for sound-absorbing materials in the automotive field.
In the sound absorption coefficient spectra of both glass (Figure 7(a)) and rubber 1 (Figure 7(b)), the peak shifts to the higher-frequency side and narrows as w decreases. This peak shift is caused by the resonance frequency of the ligaments shifting to the higher-frequency side as w reduces and the bar-like ligaments become thinner and lighter. The narrowing of the peak is caused by a decrease in the number of sound waves penetrating the sound absorber, which reduces the contribution of viscous damping and heat dissipation due to air vibration and increases the contribution of viscoelastic damping and viscous damping due to the resonance of the sound absorber. Moreover, the peaks in the sound absorption coefficient are higher for all w values when the bonding points between the ligaments have rubber-like material properties. This may be due to (1) an increase in viscoelastic damping caused by the distortion of the rubber at the joint or (2) an increase in viscous damping caused by an increase in the resonance amplitude of the ligament due to a smaller ratio of the spring constant at the joint to the ligament weight. The results were compared by varying only the loss factor or Young’s modulus at the joint to determine the cause.
First, the sound absorption coefficient spectra of rubber 1 (Figure 7(b)), rubber 2 (Figure 7(c)), and rubber 3 (Figure 7(d)), which differ only in loss factor, were compared. The results show that a lower loss factor at the joint makes the peak of the sound absorption coefficient more intense. Given a larger contribution of viscoelastic damping caused by the distortion of the rubber at the joint, a higher loss factor at the joint improves the peak value due to the higher thermal conversion effect caused by the distortion. On the contrary, given a larger contribution of viscous damping caused by the larger amplitude of the ligament resonance, a lower loss factor at the joint enhances the peak value because the resonance is not suppressed. Therefore, the contribution of viscous damping to the sound absorption phenomenon is higher than that of viscoelastic damping. The average sound absorption coefficients of rubber 1, rubber 2, and rubber 3 in the 1/3-octave band were also compared (Table 2). The results show that the average sound absorption coefficient is slightly higher at higher loss factors at the joint. This is because a higher loss factor at the joint widens the resonance frequency of the ligament, which in turn widens the frequency range of the sound absorption coefficient peak, resulting in a slightly larger average sound absorption coefficient.
Next, the sound absorption coefficient spectra of rubber 1 (Figure 7(b)), rubber 4 (Figure 7(e)), and rubber 5 (Figure 7(f)), which differ only in Young’s modulus, were compared. The peak frequency of the sound absorption coefficient shifts to the lower-frequency side at smaller Young’s moduli at the joint; the peak value is significantly high for rubber 4 in particular. This peak shift to the lower-frequency side is caused by the shift of the resonance frequency of the ligament to the lower-frequency side due to the decrease in the spring constant of the joint. The improvement in the peak value is caused by the amplification of the viscous damping at the boundary between the ligament and the stagnant air inside the sound-absorbing material, which occurs as the ratio of the spring constant of the joint to the ligament weight decreases and the resonance amplitude of the ligament increases.
These results suggest that the sound absorption performance can be improved by increasing the resonance amplitude of the ligament and amplifying the viscous damping at the boundary between the fluid and solid phases, thereby verifying the concept of a sound absorption mechanism without sound wave penetration.

3.2. Performance evaluation results

Figure 8 shows a scanning electron microscopy (SEM) image of the PMS xerogel. Preparatioin of a high-porosity structure using only PMS network with varied material properties of the ligaments and joints is difficult. Therefore, we developed a composite of PMS xerogel and CNFs.
The CNF–PMS xerogel composite was synthesized using the raw material formulation in Table 3 as follows. A CNF dispersion was mixed with a 5 mmol/L aqueous acetic acid solution, and the mixture was stirred using a stirrer at 1,150 rpm for 15 min at room temperature. Urea and n -hexadecylammonium bromide (CTAB) were then dissolved in the mixture, and dimethyldimethoxysilane (DMDMS) and methyltrimethoxysilane (MTMS) were added to the mixture for hydrolysis. The samples were allowed to gel and age at 80°C, washed, solvent-exchanged, and dried to obtain dried samples. Finally, the samples were dried at 120°C for 1 h. The CNF dispersions used were Rheocrysta (2 wt% aqueous dispersions of CNFs oxidized using 2,2,6,6-tetramethylpiperidine-1-oxyl; DKS Co., Ltd.) and hydrophobic CNF dispersions prototyped by DKS Co., Ltd.
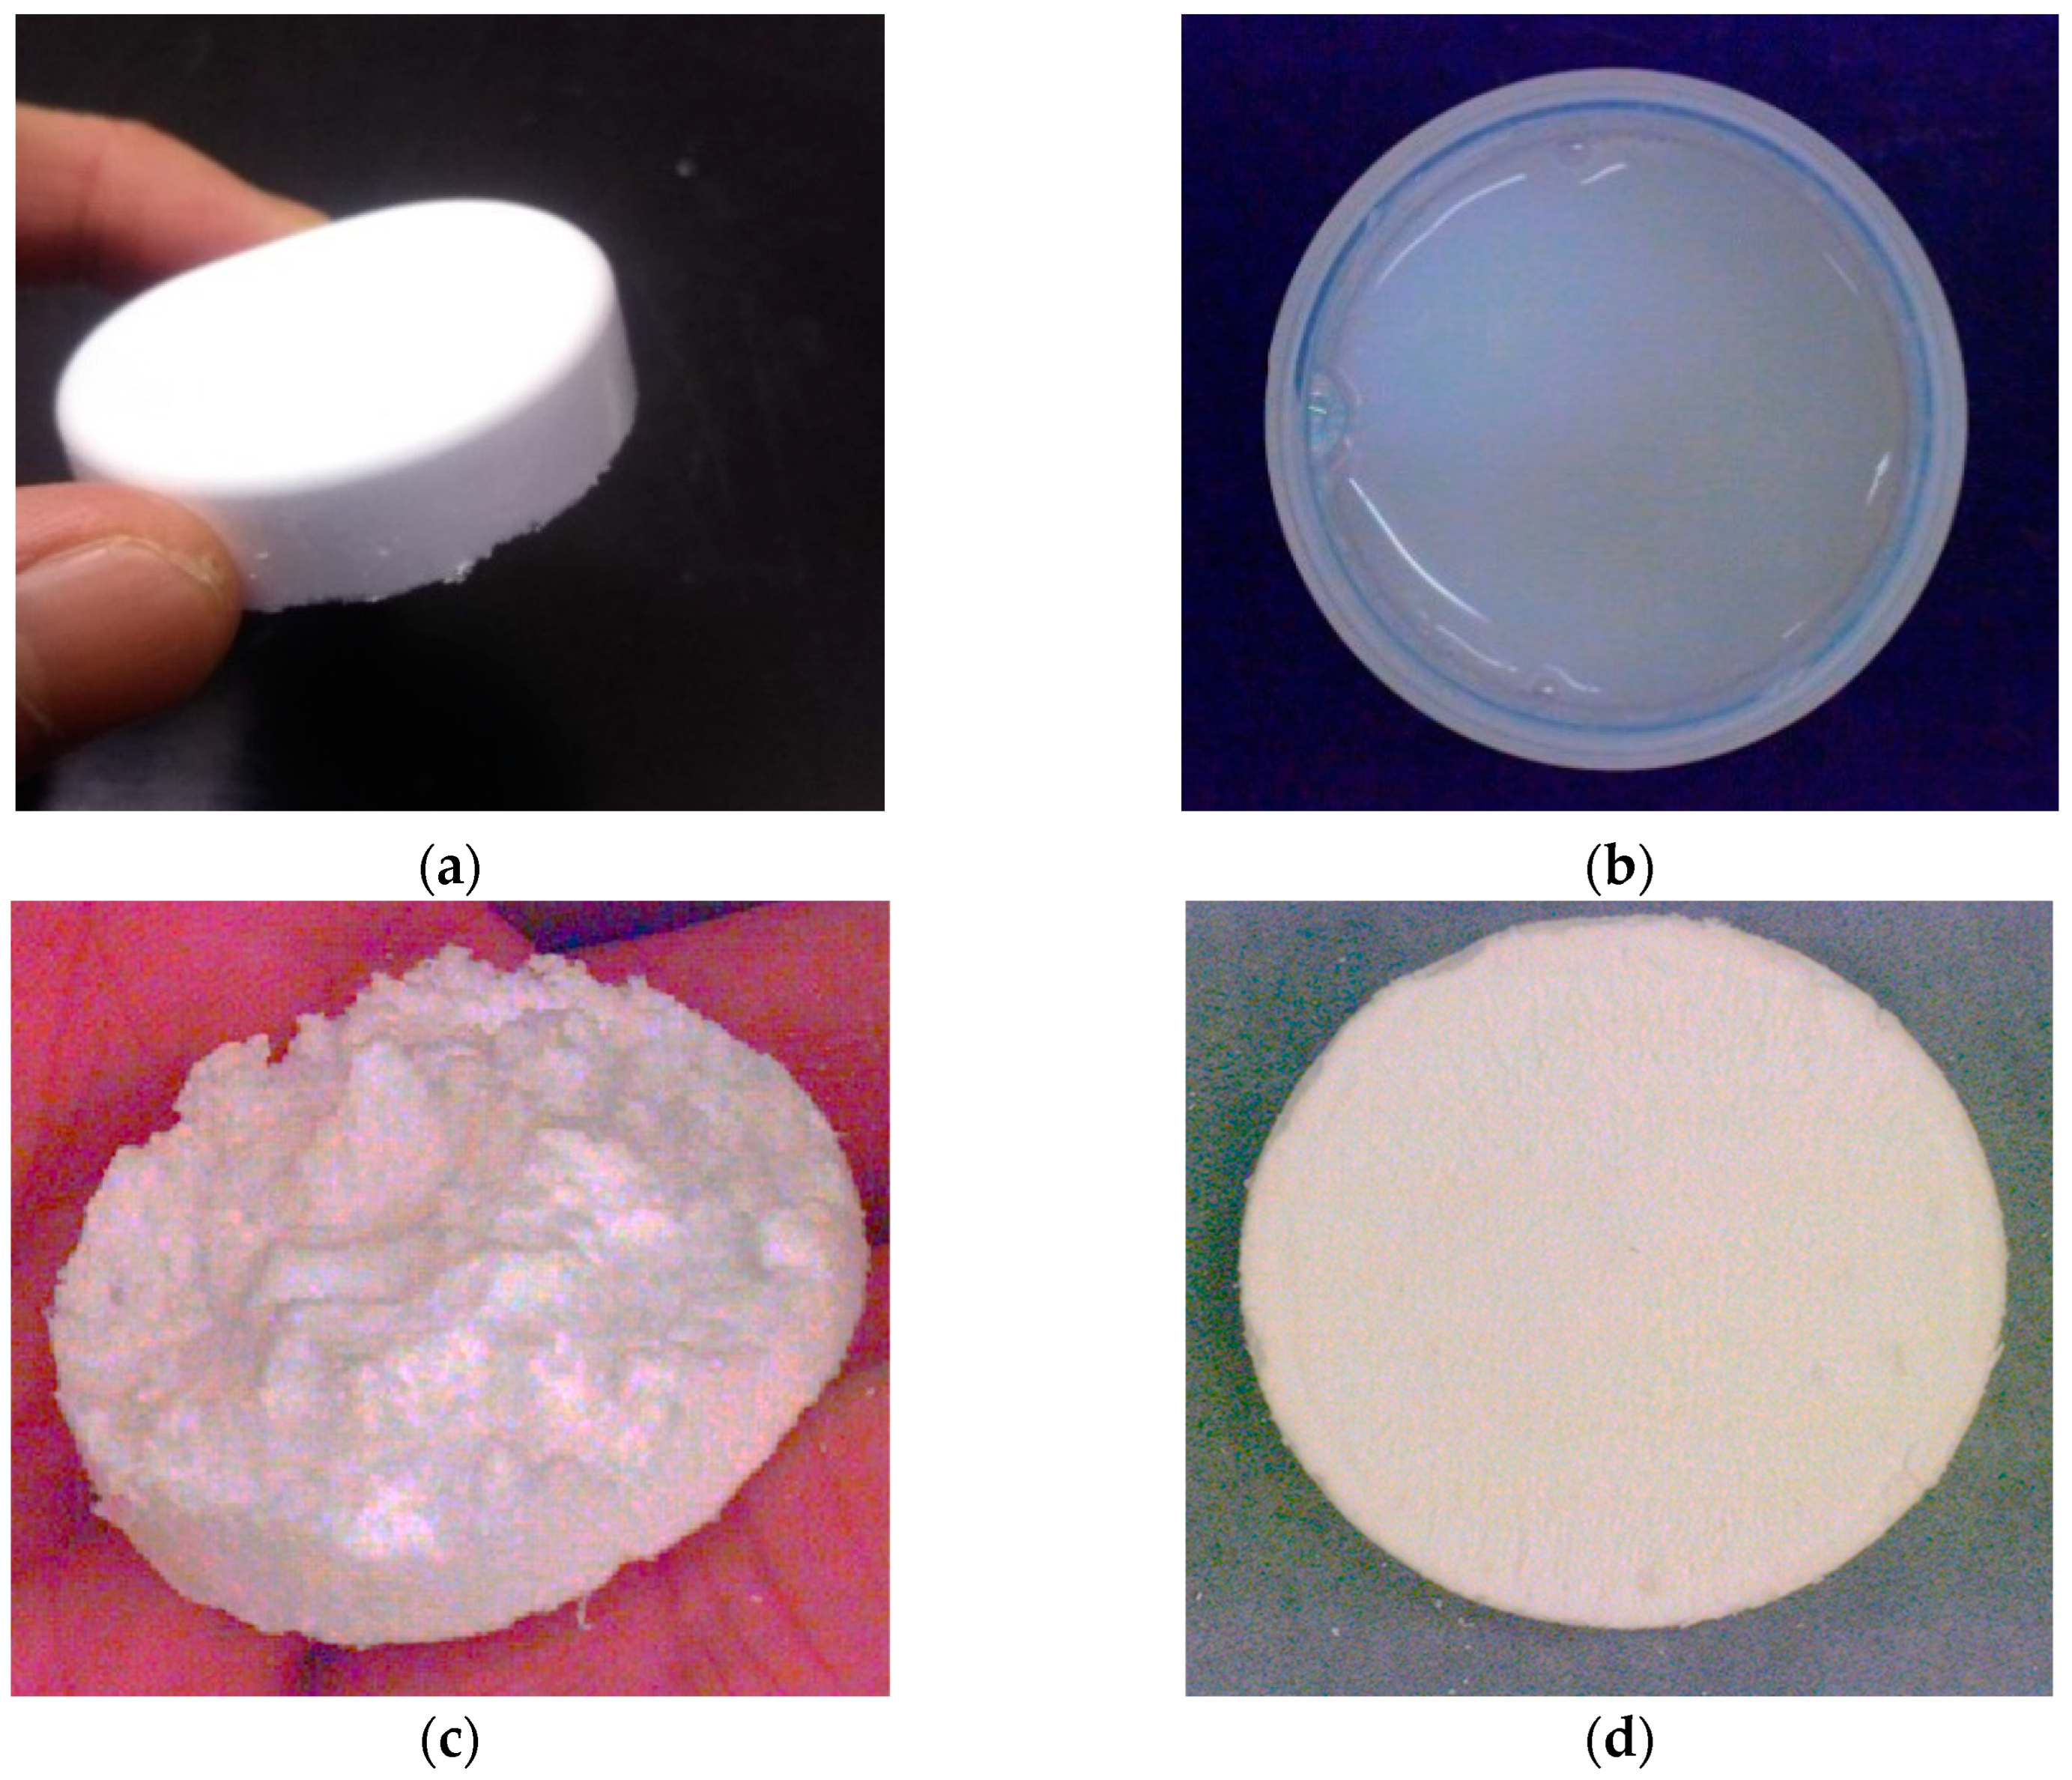
The appearance of the produced PMS xerogels is shown in Figure 9. The original PMS xerogel (Figure 9(a)) was synthesized as a homogeneous dry gel. Its porosity, calculated using the bulk and skeletal densities, was 89.5%. The aged diluted PMS xerogel (Figure 9(b)), in which the amount of alkoxysilane precursors was decreased to half its volume to increase its porosity, did not form a gel structure after aging; it remained in solution form. The CNF–PMS xerogel composite (Figure 9(c)), in which the amount of alkoxysilane precursors was also decreased to half its volume, was synthesized as a dry gel. However, it was mechanically weak, and its surface was damaged when something came in contact with the specimen. Its porosity was 94.2%. The hydrophobic CNF–PMS xerogel composite (Figure 9(d)) was a tougher dry gel than the CNF–PMS xerogel composite. Its porosity was 93.2%. A moderate interaction or inter-dispersion was observed between the sol framework and CNFs, and the toughness of the gel depended on the balance between them.
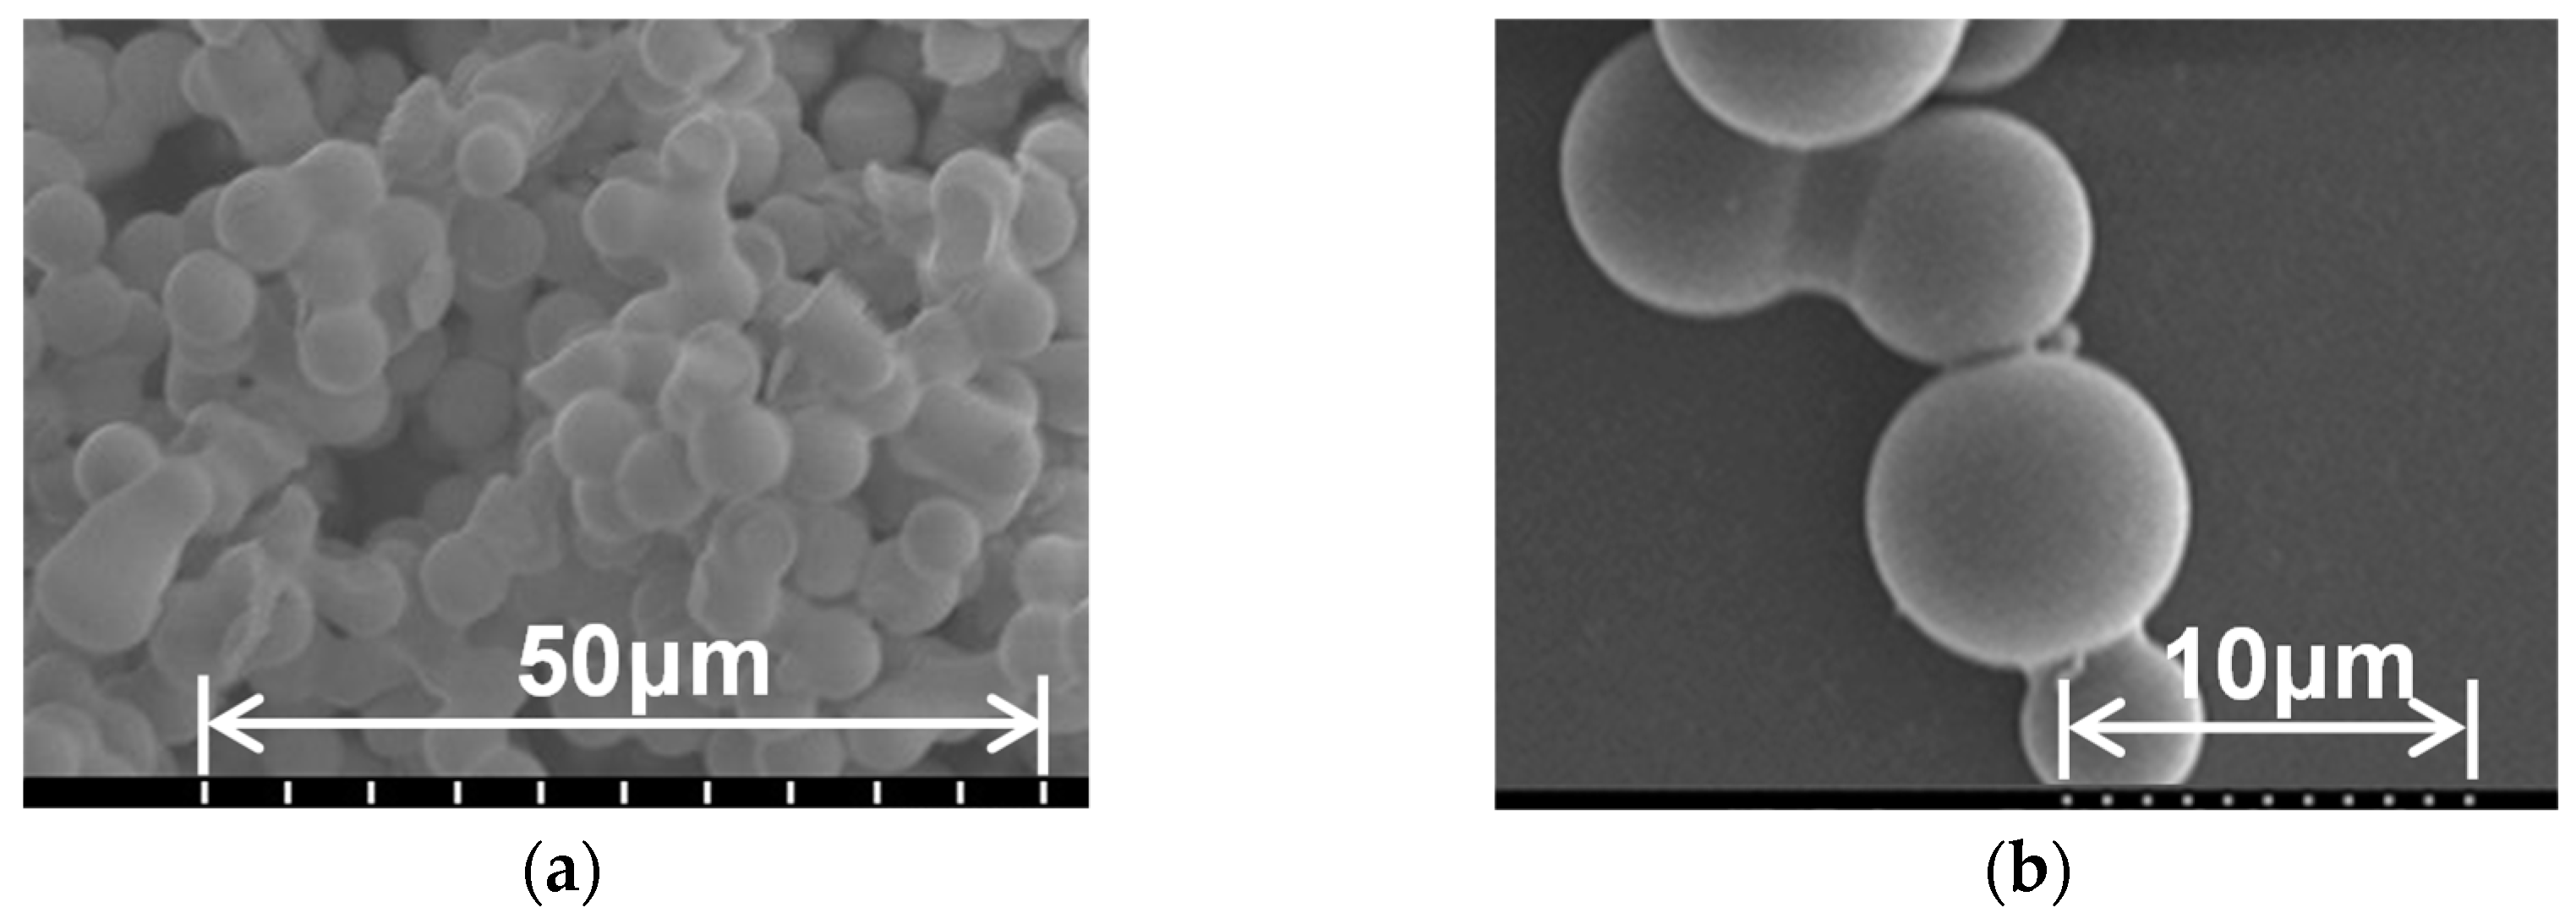
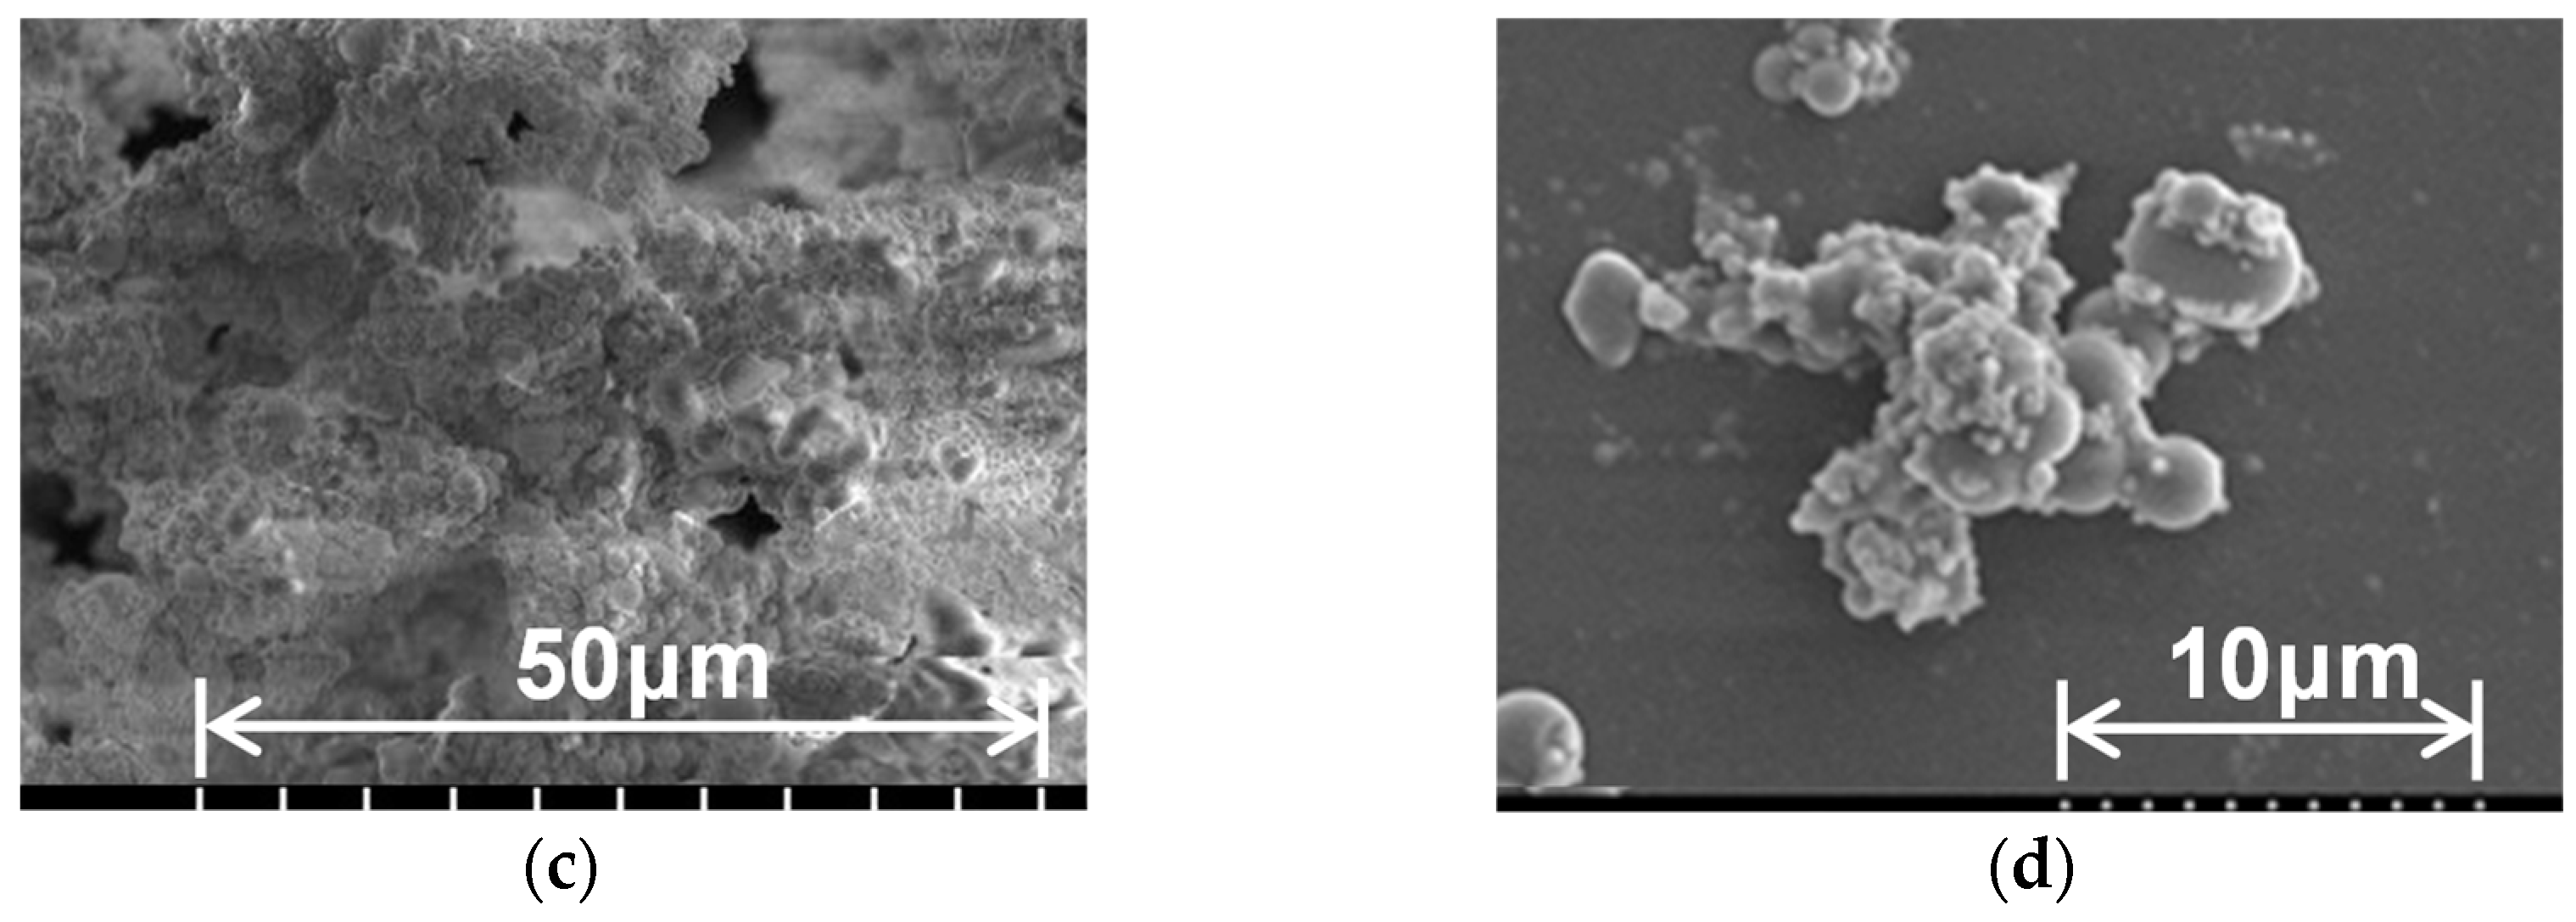
SEM images of the original PMS xerogel and the hydrophobic CNF–PMS xerogel composite are shown in Figure 10. In the original PMS xerogel, gel particles with diameters of several micrometers are strung together to form the three-dimensional porous structure. The hydrophobic CNF–PMS xerogel composite comprises gel particles with a broad size distribution (diameters ranging from several hundred nanometers to several micrometers). No fibrous structures are observed. The small particles between the larger particles are the added CNFs. The hydrophobic CNF–PMS xerogel composite has a higher porosity than the original PMS xerogel, suggesting that the CNFs also function as binders. The sparse distribution of the CNFs forms rigid and flexible sites, forming a structure similar to the rubber 4 model (Section 3.1).
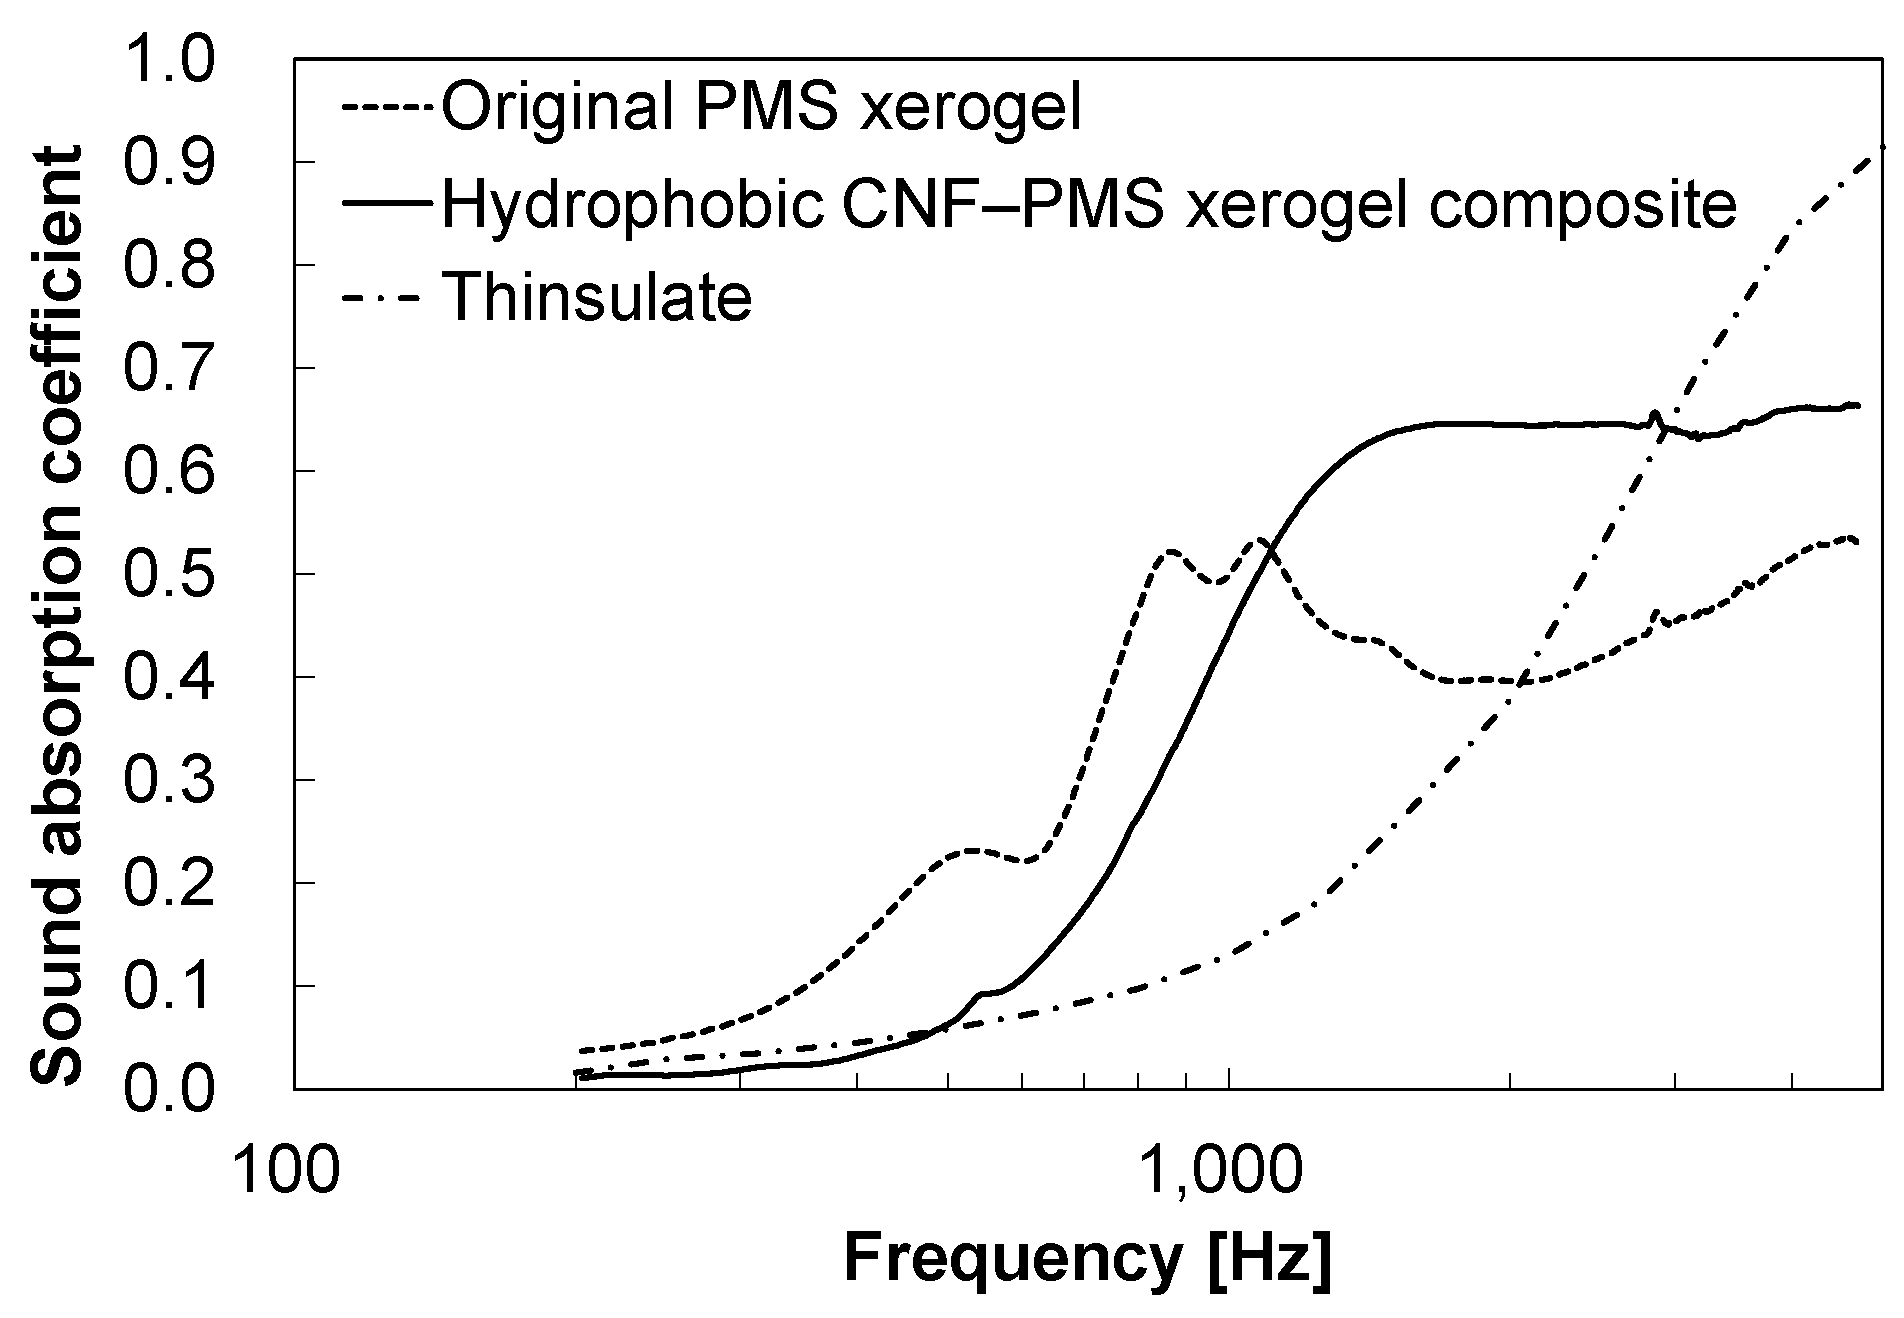
Table 4 shows the measured properties of the original PMS xerogel and the hydrophobic CNF–PMS xerogel composite, and Figure 11 shows their measured vertical-incidence sound absorption coefficients. The hydrophobic CNF–PMS xerogel composite exhibits an average sound absorption coefficient of 0.45 from 500 to 3,150 Hz. This value is higher than that of the original PMS xerogel despite the smaller thickness of the hydrophobic composite; it is also approximately 1.7 times that of a porous sound-absorbing material commonly used in automobiles (3M Thinsulate; Table 4). The Young’s modulus of the hydrophobic CNF–PMS xerogel composite is 1/20 times that of the original PMS xerogel, suggesting that the stress concentration at the flexible sites causes the structure to displace easily during compression. This result also suggests that the hydrophobic CNF–PMS xerogel composite forms rigid and flexible sites, and as shown in the calculation model of rubber 4 in Section 3.1, the ligament of the hydrophobic specimen resonates more easily, which improves the sound absorption coefficient. The sound absorption coefficient of the hydrophobic CNF–PMS xerogel composite does not decrease at frequencies above 1,000 Hz and remains high. The flow resistance per unit thickness is 1.35E+06 N·s/m4 for the original PMS xerogel and 5.54E+05 N·s/m4 for the hydrophobic CNF–PMS xerogel composite, suggesting that the hydrophobic specimen with higher porosity is penetrated by sound waves to a greater extent. This helps enhance the sound absorption coefficient in the high-frequency range. The peak diameter in the pore size distribution of the original PMS xerogel is 8.1 μm, which is larger than the upper limit considered in the calculation model, namely, w = 10 μm (the average pore size is approximately 5.2 μm). In addition, it is possible that the pore size is measured smaller than actual due to deformation of this material during the measurement. Therefore, the flow resistance is lower than expected.
The thermal conductivity of the original PMS xerogel is 0.0371 W/(m·K) (the calibrated value is 0.0248 W/(m·K)), which was measured using the simple thermal conductivity measurement apparatus shown in Figure 5. The thermal conductivity of the hydrophobic CNF–PMS xerogel composite, also measured using the simple apparatus, is 0.0378 W/(m·K) (the calibrated value is 0.0252 W/(m·K)). Although this is a reference value, this is approximately 1.4 times the insulation performance of 3M Thinsulate. Therefore, a porous material with both excellent sound absorption and thermal insulation was developed through computational microstructure modeling.

4. Conclusions

A hydrophobic CNF–PMS xerogel composite was developed via computational microstructure modeling. Compared with the original PMS xerogel, the hydrophobic composite material exhibited excellent sound absorption while maintaining high thermal insulation and high porosity. This material can be used in unexposed parts, such as the inside of interior parts of automobiles, and demonstrates excellent sound absorption and thermal insulation properties. In addition, the material may be strengthened by improving the interaction or inter-dispersion between the PMS framework and CNFs. A tougher version of this material can be used in parts that are subjected to harsh conditions in the future, such as prime movers and automobile drive units.

Author Contributions

Conceptualization, Daiji Katsura.; Methodology, Daiji Katsura.; Computational analysis, Daiji Katsura. and Takashi Yamamoto.; Experimental validation, Daiji Katsura., Tetsuya Maeda. and Kazuyoshi Kanamori.; Data Curation, Daiji Katsura.; Writing & Editing, Daiji Katsura.; Supervision, Joji Ohshita.

Funding

This research received no external funding.

Informed Consent Statement

Not applicable.

Data Availability Statement

Due to the nature of this research, participants of this study did not agree for their data to be shared publicly, so supporting data is not available.

Conflicts of Interest

The authors declare no conflict of interest.

References

  1. Gao, K.; van Dommelen, J.A.W.; Geers, M.G.D. Investigation of the effects of the microstructure on the sound absorption performance of polymer foams using a computational homogenization approach. Eur J Mech A Solids 2017, 61, 330–344. [Google Scholar] [CrossRef]
  2. Gao, K.; van Dommelen, J.A.W.; Göransson, P.; Geers, M.G.D. A homogenization approach for characterization of the fluid–solid coupling parameters in Biot׳s equations for acoustic poroelastic materials. J Sound Vib 2015, 351, 251–267. [Google Scholar] [CrossRef]
  3. Zieliński, T.G. Microstructure-based calculations and experimental results for sound absorbing porous layers of randomly packed rigid spherical beads. J Appl Phys 2014, 116. [Google Scholar] [CrossRef]
  4. Perrot, C.; Chevillotte, F.; Tan Hoang, M.; Bonnet, G.; Bécot, F.-X.; Gautron, L.; Duval, A. Microstructure, transport, and acoustic properties of open-cell foam samples: experiments and three-dimensional numerical simulations. J Appl Phys 2012, 111. [Google Scholar] [CrossRef]
  5. Lee, C.-Y.; Leamy, M.J.; Nadler, J.H. Frequency band structure and absorption predictions for multi-periodic acoustic composites. J Sound Vib 2010, 329, 1809–1822. [Google Scholar] [CrossRef]
  6. Shrestha, S.S.; Tiwari, J.; Rai, A.; Hun, D.E.; Howard, D.; Desjarlais, A.O.; Francoeur, M.; Feng, T. Solid and gas thermal conductivity models improvement and validation in various porous insulation materials. Int J Therm Sci 2023, 187, 108164. [Google Scholar] [CrossRef]
  7. Zhou, Y.; Huang, B.; Cao, B.-Y. Vibrational modes with long mean free path and large volumetric heat capacity drive higher thermal conductivity in amorphous zeolitic imidazolate Framework-4. Mater Today Phys 2021, 21, 100516. [Google Scholar] [CrossRef]
  8. Qiu, B.; Bao, H.; Zhang, G.; Wu, Y.; Ruan, X. Molecular dynamics simulations of lattice thermal conductivity and spectral phonon mean free path of PbTe: bulk and nanostructures. Comput Mater Sci 2012, 53, 278–285. [Google Scholar] [CrossRef]
  9. Yamamoto, T.; Katsura, D.; Kubota, H. Optimization of microstructure of sound-absorbing poroelastic material by homogenization method. In JSAE Annual Congress (Spring) Proceedings, 2018; p. 20185332.
  10. Yamakawa, K.; Yamamoto, T.; Katsura, D. Acoustic modelling technique of internal structures of a sound-absorbing foamed resin by homogenization method. In JSAE Congress (Autumn) Proceedings, 2019; p. 20196290.
  11. Katsura, D.; Yamamoto, T.; Yamakawa, K.; Hatakeyama, N.; Miura, R.; Okajima, J.; Inaba, K.; Ishizawa, Y.; Ochiai, H.; Yukawa, H.; Murashige, K.; Katagihara, J.; Tomotsu, J.; Ishimoto, T.; Ohshita, J. Development of thermal management and noise/vibration control material model technology by model-based research (MBR) 1st report. JSAE Annual Congress (Spring) Proceedings, 2021; p. 20215301.
  12. Yamakawa, K.; Yamamoto, T.; Katsura, D.; Inoue, M.; Hatakeyama, N.; Miura, R.; Okajima, J.; Inaba, K.; Ishizawa, Y.; Yukawa, H.; Ito, H.; Ishimoto, T.; Ohshita, J. Development of thermal management and noise/vibration control material model technology by model-based research (MBR) (2nd report). JSAE Annual Congress (Spring) Proceedings, 2022; p. 20225223.
  13. Yamamoto, T.; Maruyama, S.; Terada, K.; Izui, K.; Nishiwaki, S. A generalized macroscopic model for sound absorbing poroelastic media using a homogenization method. Comput Methods Appl Mech Eng 2011, 200, 251–264. [Google Scholar] [CrossRef]
  14. Gilbert, R.P.; Mikelić, A. Homogenizing the acoustic properties of the seabed: Part I. Nonlinear Anal 2000, 40, 185–212. [Google Scholar] [CrossRef]
  15. Clopeau, T.; Ferrín, J.L.; Gilbert, R.P.; Mikelić, A. Homogenizing the acoustic properties of the seabed, part II. Math Comput Modell 2001, 33, 821–841. [Google Scholar] [CrossRef]
  16. Sanchez-Palencia, E. Non-homogeneous Media and Vibration Theory, Lecture Notes in Physics; Volume 127; Springer-Verlag: Berlin, 1980. Volume 127; Springer-Verlag: Berlin, 1980. [Google Scholar]
  17. Yamamoto, T.; Maruyama, S.; Terada, K.; Izui, K.; Nishiwaki, S. Prediction of sound absorption coefficients of poroelastic media by the homogenization method. In 40th International Congress and Exposition on Noise Control Engineering 2011, INTER-NOISE, 2011; Volume 2011; pp. 1989–1996.
  18. Kanamori, K.; Aizawa,M. ; Nakanishi, K.; Hanada, T. New transparent methylsilsesquioxane aerogels and xerogels with improved mechanical properties. Adv Mater 2007, 19, 1589–1593. [Google Scholar] [CrossRef]
  19. Yamasaki, S.; Sakuma, W.; Yasui, H.; Daicho, K.; Saito, T.; Fujisawa, S.; Isogai, A.; Kanamori, K. Nanocellulose xerogels with high porosities and large specific surface areas. Front Chem 2019, 7, 316. [Google Scholar] [CrossRef] [PubMed]
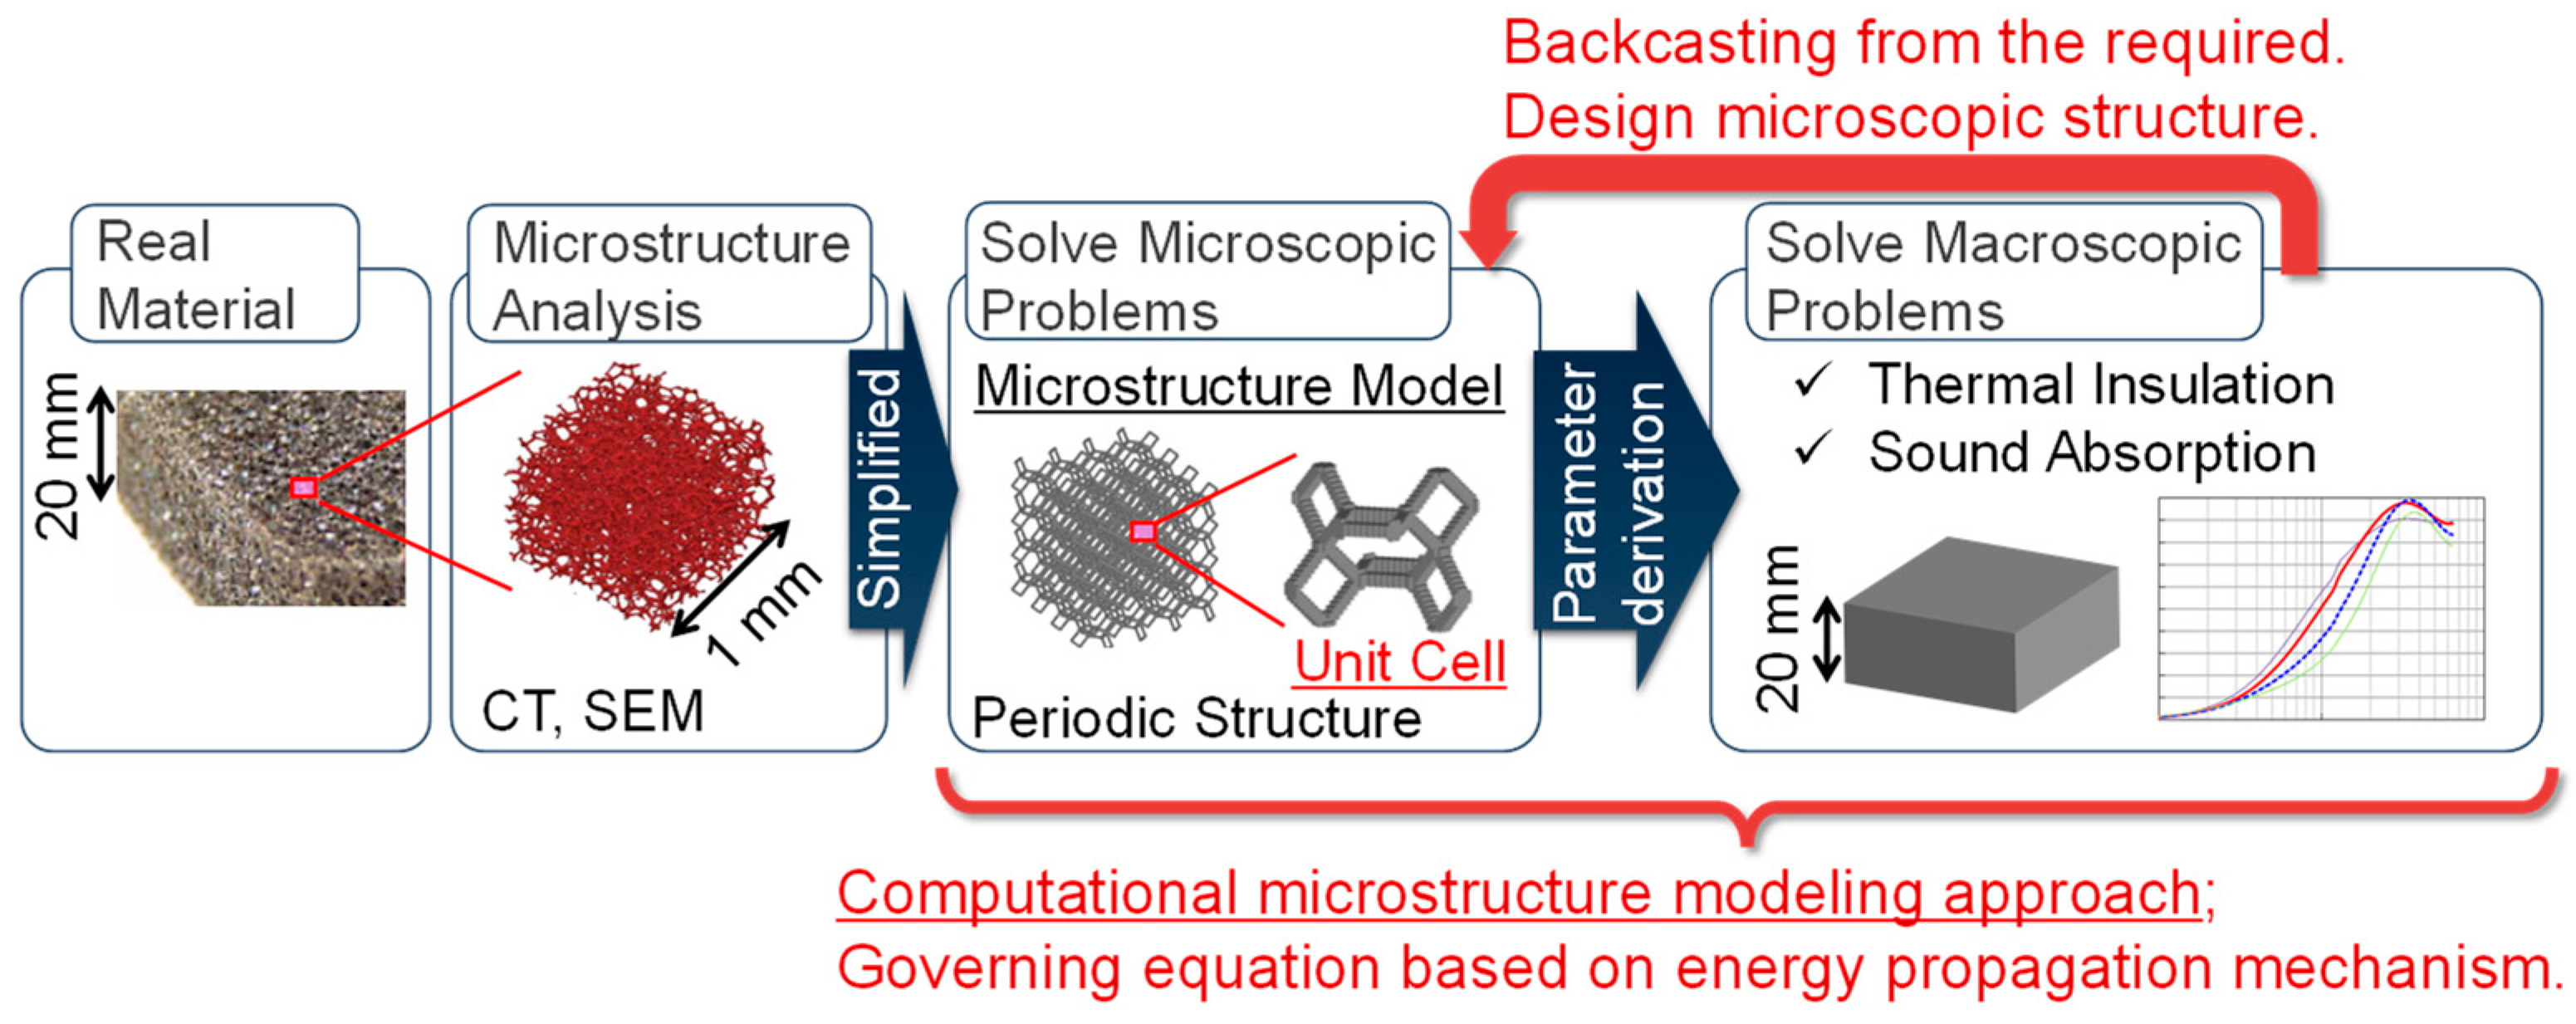
Figure 1. Development of high-performance multifunctional materials via materials model-based research.
Preprints 96947 g001
Figure 2. Schematic diagram of homogenization of sound-absorbing poroelastic material.
Preprints 96947 g002
Figure 3. Acoustic tube model for calculating sound absorption coefficients at vertical incidence.
Preprints 96947 g003
Figure 4. Mechanisms inside porous materials: (a) sound absorption; (b) heat transfer.
Preprints 96947 g004
Figure 5. Simple thermal conductivity measurement apparatus.
Preprints 96947 g005
Figure 6. Calculation model of microstructure of simulated porous material: (a) periodic structure; (b) unit cell.
Preprints 96947 g006
Figure 7. Spectra of predicted sound absorption coefficients of simulated porous material: (a) glass; (b) rubber 1; (c) rubber 2; (d) rubber 3; (e) rubber 4; (f) rubber 5.
Preprints 96947 g007
Figure 8. Scanning electron microscopy image of poly(methylsiloxane) (PMS) xerogel.
Preprints 96947 g008
Figure 9. External appearance of synthesized PMS xerogels: (a) original PMS xerogel; (b) diluted PMS xerogel after aging; (c) CNF–PMS xerogel composite; (d) hydrophobic CNF–PMS xerogel composite.
Preprints 96947 g009
Figure 10. SEM images of synthesized PMS xerogels: (a) original PMS xerogel; (b) original PMS xerogel; (c) hydrophobic CNF–PMS xerogel; (d) hydrophobic CNF–PMS xerogel.
Preprints 96947 g010aPreprints 96947 g010b
Figure 11. Measured vertical-incidence sound absorption coefficients of synthesized PMS xerogels.
Preprints 96947 g011
Table 1. Material properties of ligaments and joints in calculation model.
Young’s modulus
(GPa)
Poisson’s ratio
Density
(kg/m3)
Loss factor
Glass 71.6 0.23 2,200 0.002
Rubber 1 0.1 0.35 1,100 0.3
Rubber 2 0.1 0.35 1,100 0.1
Rubber 3 0.1 0.35 1,100 0.5
Rubber 4 0.01 0.35 1,100 0.3
Rubber 5 1 0.35 1,100 0.3
Table 2. Average 1/3-octave band absorption coefficients from 500 to 3,150 Hz and from 1,000 to 5,000 Hz.
500–3,150 Hz
Average α(-)
@ w = 1 μm
1,000–5,000 Hz
Average α(-)
@ w = 1 μm
500–3,150 Hz
Average α(-)
@ w = 10 μm
1,000–5,000 Hz
Average α(-)
@ w = 10 μm
Glass 0.02 0.07 0.23 0.25
Rubber 1 0.08 0.12 0.25 0.27
Rubber 2 0.06 0.10 0.23 0.25
Rubber 3 0.09 0.13 0.25 0.28
Rubber 4 0.22 0.29 0.31 0.39
Rubber 5 0.03 0.08 0.23 0.25
Table 3. Raw material formulation of composite of cellulose nanofibers (CNFs) and PMS xerogel. CTAB: n -hexadecylammonium bromide; MTMS: methyltrimethoxysilane; DMDMS: dimethyldimethoxysilane.
Original
PMS Xerogel
Diluted
PMS Xerogel
CNF
PMS Xerogel
Hydrophobic CNF
PMS Xerogel
CTAB/g 0.4 0.2 0.2 0.2
Urea/g 3.0 3.0 3.0 3.0
Acetic acid/ml 10 10 10 10
CNF dispersion/g 0 0 1.0 0.2
MTMS/ml 3.0 1.5 1.5 1.5
DMDMS/ml 2.0 1.0 1.0 1.0
Table 4. Properties of original PMS xerogel and hydrophobic CNF–PMS xerogel composite.
Original
PMS Xerogel
Hydrophobic CNF
PMS Xerogel
3MTM
ThinsulateTM
Porosity [%] 89.5 93.2 -
Pore size distribution
Peak size [μm]
8.1 - -
Thickness [mm] 10 8 10
Flow resistivity
[N s/m4]
1.35E+06 5.54E+05 -
Bulk Density
[kg/m3]
168.2 88.4 -
Young's modulus
[Pa]
3.0E+04 1.5E+03 -
Loss factor 0.250 0.939 -
500–3,150 Hz
Average
Sound absorption
coefficient
0.39 0.45 0.27
1,000–5,000 Hz
Average
Sound absorption
coefficient
0.43 0.62 0.49
Thermal conductivity
[W/(m·K)]
0.0371
(0.0248)
0.0378
(0.0252)
0.0536
(0.0358)
Disclaimer/Publisher’s Note: The statements, opinions and data contained in all publications are solely those of the individual author(s) and contributor(s) and not of MDPI and/or the editor(s). MDPI and/or the editor(s) disclaim responsibility for any injury to people or property resulting from any ideas, methods, instructions or products referred to in the content.
Copyright: This open access article is published under a Creative Commons CC BY 4.0 license, which permit the free download, distribution, and reuse, provided that the author and preprint are cited in any reuse.
Prerpints.org logo

Preprints.org is a free preprint server supported by MDPI in Basel, Switzerland.

Subscribe

© 2024 MDPI (Basel, Switzerland) unless otherwise stated