Preprint
Article

Genome–Wide Identification, Characterization and Expression Profile of F–box Protein Family Genes Shed Light on Lateral Branch Development in cultivated peanut (Arachis hypogaea L.)

Altmetrics

Downloads

101

Views

42

Comments

0

A peer-reviewed article of this preprint also exists.

Submitted:

22 January 2024

Posted:

22 January 2024

You are already at the latest version

Alerts
Abstract
: F-box proteins are a large gene family in plants, and play crucial roles in plant growth, development, and stress response. However, a comprehensive investigation of F-box family genes in cultivated peanut (Arachis hypogaea L.), has not been undertaken. In this study, we used a bioinformatics approach to identify and analyze F-box protein family genes in the cultivated peanut genome, and examined their expression profiles. Herein, a total of 95 F-box protein family members on 18 chromosomes were identified in cultivated peanut, which were sequentially designed as AhFBX1-AhFBX95. Phylogenetic analysis classified these AhFBXs into four different groups (Group I - IV), and eight subfamilies based on the structural domains of the C-terminal. Structural analysis revealed the presence of ten unique motifs within these genes. Additionally, the investigation of non-synonymous and synonymous substitution rates (Ka/Ks), and synteny in the F-box proteins, provided valuable insights into the evolutionary and domestication processes of AhFBX genes in peanut. Furthermore, in silico expression profiling of 22 different tissues demonstrated that most genes were predominantly expressed in leaves, pistils, and the aerial gynophore tip, while some members showed tissue-specific expression at the apex of both vegetative and reproductive shoots. Subsequently, we validated the expression of 9 differentially expressed genes (DEGs) using transcriptomeic data of lateral branch development and qRT-PCR analysis. These DEGs may be involved in regulating the development of lateral branches and subsequently affect the architecture of peanut plants.
Keywords: 
Subject: Biology and Life Sciences  -   Plant Sciences

1. Introduction

The ubiquitin-protease system plays a crucial role in protein degradation in eukaryotes. Within the cell, ubiquitin E3 ligase participates in varous of physiological processes by regulating the ubiquitination of regulatory proteins [1,2]. The Skp-Cullin-F box (SCF) protein, a subset of ligase E3, is characterized by the involvement of SKP-1 and SKP-1 like proteins in substrate recognition. SKP1 further interacts with specific N-terminal domain proteins of the F-box, ultimately assisting in protein degradation [3,4]. The F-box protein family is one of the largest protein families in plants and its encoded genes play criitical roles in plant growth and development. They are also involved in the transduction of plant hormone and light signals [5]. F-box proteins possess a specific structural pattern consisting of approximately 40-50 amino acids. Notably, this family is distinguished by the presence of at least one F-box structural domain at the N-terminal end and an interacting secondary structure at the C-terminal end of the protein [6]. These features allow for the categorization of the protein into different subfamilies, each with divergent functions. To date, a large number of F-box protein family members have been identified in various plant species, such as Arabidopsis thaliana (694), rice (687), maize (359), alfalfa (972), soybean (725), ,tomato (139), eggplant (389), and poplar (337), among others [7,8,9,10,11,12,13,14].
The expression pattern and gene function of some F–box protein genes in plant growth and development had been clarified. For instance, in Arabidopsis thaliana, MAX2 has been identified as a positive regulator of photomorphogenesis. By constructing a pps mutant, the expression of MAX2 was reduced, leading to repression of shoot lateral branching [15]. Song et al. demonstrated that the development of plant leaf morphology is influenced by the expression of At1g27340 (LCR), using a constructed Arabidopsis miR394 mutant [16]. Interestingly, abnormal leaf development was observed when this gene was expressed either excessively low or high. Similarly, Marrocco et al. confirmed the crucial role of EID1 in shaping plant photomorphogenesis by manipulating photopigments in Arabidopsis thaliana [17]. Additionally, Qin et al. substantiated that the F-box protein family gene QDtbn1 acts as a negative regulatory factor, determining the number of tassel branches in maize [18]. Currently, the availability of the peanut genomes allows for the exploration of various gene families in the entire genome [19,20,21,22], including the SNARE [23], SAUR [24], PIF [25], and aquaporin [26] families. However, a comprehensive study on the of F-box protein family in peanut has yet to be conducted.
Peanut is a vital oilseed crop that provides high-quality vegetable oil and proteins, making a significant contribution to economic value. The variations in plant varieties depend on the nutritional and reproductive growth patterns, as well as the differences in the angle of lateral branches and main stem [27]. Therefore, peanut plants can be classified into four branching habits: erect, bunch, spreading and prostrate [28,29]. The plant ideotype plays a crucial role in optimizing the utilization of light energy, which greatly affects yield, cultivation methods, and suitability for machine harvesting [30]. Therefore, studying plant branching is essential for cultivating optimal crop varieties. Previous research on staple cereal crops has successfully developed high-yield versions by studying genes related to branch development [31,32]. Similarly, the growth pattern of lateral branches, particularly the first lateral branch, is an important agronomic trait that determines the plant architecture and production in peanuts. However, the study of branch habit genes in peanuts is still limited. Fortunately, our previous research has identified three candidate genes of the F-box family associated with lateral branch angle (LAB) using genome-wide association study (GWAS) and bulk segregant analysis (BSA) [33]. Among these genes, Araip.E64SW could be negatively regulated the lateral branch development, potentially leading to a spreading or prostrate appearance. Therefore, the aim of this study is to investigate the expression patterns of F-box protein genes in various tissues of cultivated peanuts, with a focus on their patterns during lateral branch development.
To comprehensively study F-box protein genes and their potential involvement in lateral branch development, we have identified F-box protein genes using bioinformatics approaches, and integrated the expression data from various tissues of "Tifrunner" cultivar and previous transcriptomic data from different stages of branching development. This process highllights the potential AhFBX genes related to lateral branch development in peanut. The main objectives of this research are: (1) assessing the quantity, physicochemical properties, conserved domain features, gene structure, and evolutionary origins of AhFBXs; (2) explicating the computationally predicted expression patterns of AhFBXs aross different peanut tissues; (3) pinpointing the potential AhFBX candidates related to lateral branch development; and (4) elucidating the expression patterns of these candidate genes in branching development across diverse plant types. With this investigation, our goal is to provide gene resources that enhance our understanding of the molecular mechanisms in which F-box associated genes contribute to peanut branching development and impact on plant architecture. This study holds significant value in the formulation of plant architecture.

2. Materials and Methods

2.1. Genome–wide identification and chromosome localization

The complete genomic data for cv. Tifrunner was procured from Peanutbase (http://peanutbase.org/). Using procedure outlined by Zhao et al. [34], we everaged the conserved domain (accession: PF00646) of the F-box protein family to execute F-box protein sequence detection through HMMER v3.3.2 (http://hmmer.org/). Once redundant sequences were excluded, potential sequences were submitted to the SMART (http://smart.embl-heidelberg.de/), Pfam database (http://pfam-legacy.xfam. org/), and CDD (http://www.ncbi.nlm.nih.gov/Structure/cdd/wrpsb.cgi) databases, in order to validate whether the retrieved protein sequences incorporated the appropriate conserved domains. Family members were labeled according to their sequential appearance on the respective genomic chromosomes, ranging from AhFBX1 to AhFBXn. The chromosomal location diagram was constructed using MapChart 2.32 [35], based on the physical positioning of AhFBX genes in the reference genome.

2.2. Physicochemical properties, phylogenetic tree and gene structure analysis

The physicochemical attributes of the entire gene family were compued using Expasy (http://www.expasy.org/tools/protparam) [36], predicting such properties as the amino acid count, molecular weight, isoelectric point (pI), instability index, aliphatic index, lipophilicity and hydrophilicity. The subcellular localization was predicted using Cello (http://cello.life.nctu.edu.tw/). From the Arabidopsis Information Resource website (TAIR, http://www.arabidopsis.org/index.jsp), a total of 90 AtFBXs exhibiting complete conserved domains (with E-value < 1e-7) were retrieved. Subsequently, a phylogenetic analysis of AhFBXs and AtFBXs was performed using MEGA X (Bootstrap = 1000 replicates) [37]. The conserved motifs, along with gene structure, were predicted using MEME (http://meme-suite.org/tools/meme) [38] and the online platform Gene Structure Display Server (GSDS) 2.0 (http://gsds.gao-lab.org/) [39].

2.3. Prediction of cis–acting elements in the promoter region

An analysis was conducted on the upstream promoter region of AhFBXs, which spans a 2,000 bp sequence, to predict its cis-acting elements within the promoter region. This was accomplished using the PlantCARE resource (http://bioinformatics.psb.ugent.be/webtools/plantcare /html/). Subsequently, a comprehensive map of the cis-acting elements was constructed with the aid of the GSDS 2.0 [39].

2.4. Collinearity and estimation of Ka/Ks ratios analysis

Gene collinearity and Ka/Ks values were examined using the one-step MCScanX module (E-value < 1e-5) from the TBtools software. The basic non-synonymous/synonymous mutation ratio (Ka/Ks) calculator were employed to analyze gene collinearity and Ka/Ks values, respectively [40,41,42]. These tools provided enhanced clarity in interpreting evolutionary patterns. The Ks value can be utilized to estimate the divergence time of duplication events, where the divergence time (T) equals Ks divided by twice the neutral substitution rate (λ). The λ is estimated at 8.12x10⁻⁹ for peanut [19].

2.5. In silico expression analysis of AhFBX genes in different tissues

Tissue-specific expression patterns of AhFBXs were examined using data expressed as fragments per kilobase of exon per million aligned fragments (FPKM) data. This data, acquired from https://dev.peanutbase.org/expression/expr_tissue_Hyp.html [43], was transformed via the application of log2(FPKM+1). Subsequent normalization was performed using the z-score method, denoted by the equation (∑(x²)-(∑x)²/n)/n. Within this equation, 'x' represents the raw value, while 'n' denotes the number of data points. To visualize gene expression, a heatmap was generated using R software (https://www.r-project.org/).

2.6. Expression analysis in lateral branch development of peanut

The erect variety, Jihua 5 (JH5), and the prostrate germplasm, M130, were selected as materials described previously [33]. They were grown under rigorously controlled environmental conditions within a climatically-controlled chamber, maintained at a stable temperature of 25℃. Furthermore, they were subjected to a circadian rhythm consisting of 16 hours of light succeeded by 8 hours of darkness.
Transcriptomic profiles of the lateral branch development for two distinct varieties were analyzed at various stages in the growth of the first lateral branches (BioProject: PRJNA675413). Samples were systematically collected at five-day intervals up to 30 days after planting (DAP), specifically at 5, 10, 15, 20, 25 and 30 DAP. During these stages, the lateral branch development phase for 'JH5' was denoted as J5, J10, J15, J20, J25 and J30, respectively. Similarly, timescales for the M130 variety were labelled as M5, M10, M15, M20, M25 and M30. The FPKM values for both cultivars at the different developmental stages were utilized to analyze the expression patterns in the of lateral branch development.

2.7. RNA extracted and qRT–PCR analysis

Total RNA extraction and first-strand cDNA synthetization were performed using the previously referenced method [44]. RT-qPCR primers were designed using Primer Premier 5 software (Table S1), and PCR amplification system and procedure were conducted following the protocol described previously [44]. The relative expression of candidate genes were calculated utilizing 2-ΔΔCt method [45]. GraphPad Prism 8.0 software was used for multiple comparisons (p<0.05) and correlation analysis (p<0.01).

3. Results

3.1. Identification and chromosome location of AhFBXs

A total of 95 AhFBX genes were identified using bioinformatics approaches in cultivated peanut. Each was found to contain the typical F-box domain (ILSRLPTKHLARTSCVSKRWR) and sequentially named AhFBX1-AhFBX95 (Table S2). Of these, 94 AhFBXs were assigned to 18 chromosomes, excluding Arahy.07 and Arahy.18 (Table S2, Figure 1). Of these, members that were exhibited on Arahy.04 and Arahy.14 numbered 18 and 17 respectively. The Arahy.09 and Arahy.19 both displayed 16 members each. Furthermore, the Arahy.06 only comprised 4 members, while Arahy.03, Arahy.08, and Arahy.13 each held 3 members. There were Arahy.10 contained 2 or fewer members. Specially, AhFBX95 was positioned on scaffold_50:16019-23949. As for chromosome distribution, there seemed to be a trend with most AhFBX genes being found at either terminal of each chromosome, and a fewer number of genes located centrally or near the middle of the chromosome.

3.2. Physicochemical properties and subcellular localization prediction of AhFBXs

All of the AhFBX proteins consisted of 212–1372 amino acids (aa), yielding an average of approximately 449 aa per protein.The relative molecular weights, isoelectric point (pI), instability index and aliphatic index ranged from 24.05–157.44 kDa, 4.88–9.78, 7.41–66.74 and 75.23–115.82, with all of these proteins being hydrophilic (Table S2). Subcellular localization prediction (Table S2) indicated that AhFBX proteins were located in various cellular structures (Table S2). Specifically, 51 members (or 53.7%) were found in the cytoplasmic membrane, 24 members (or 25.2%) in the cell nucleus, eight members (or 8%) in chloroplasts, seven members (or 7%) in the extracellular matrix, three members (or 3%) in the cytoplasm, and two members (or 2%) in the mitochondria.

3.3. Classification and phylogenetic tree of AhFBXs

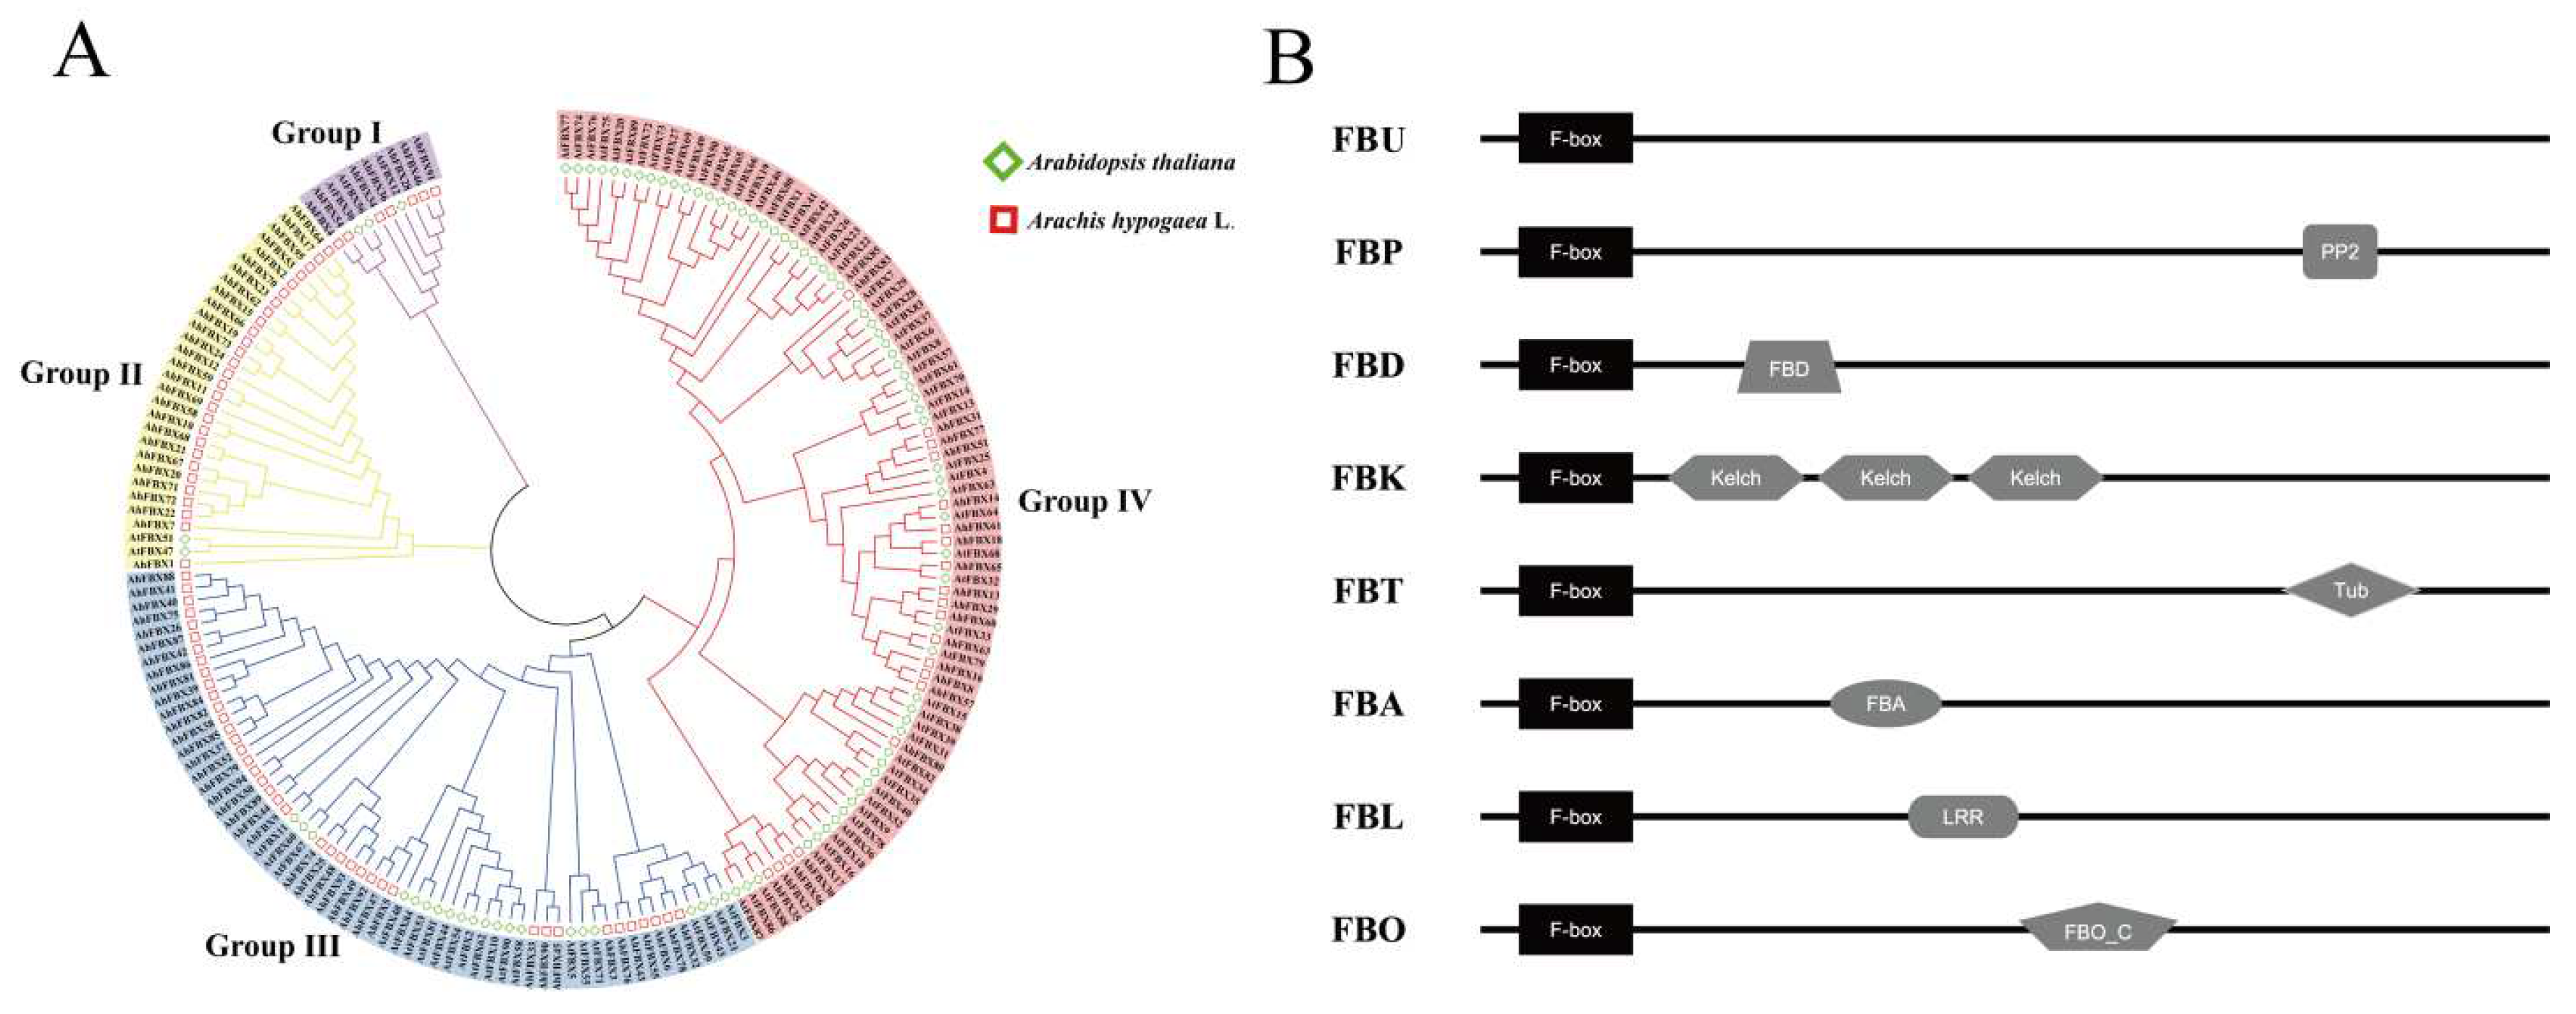
A systematic evolutionary analysis with AtFBX proteins underscores that AhFBX proteins were categorized into 4 subgroups, including Group I (consisting of 7 out of 95 members, 7/95), Group II (28/95), Group III (40/95), and Group IV (20/95) (Figure 2A). Subsequently, the four subgroups were subdivided into eight subfamilies according to the differences in C–terminal structural domains, demonstrated in Figure 2B. Within these subfamilies, the FBU subfamily lacked any specific structural domains. The FBA, FBD, FBK, FBT, FBP, FBL, and FBO subfamilies were each defined by their respective structural domains: FBA, FBD, Kelch repeat, Tub, PP2, LRR (leucine–rich repeat), and FBO_C respectively.
In Group I, the FBP subfamily, FBA, FBU, and FBD were represented with 3, 2, 1, and 1 members, respectively. Group II consisted of 20 FBA members and 8 FBU members. Group III was comprised of 20 FBD members, 12 FBU members, 4 FBK members, 3 FBL members, and 1 FBA member. Lastly, Group IV contained 8 FBU members, 4 FBA members, 3 FBD members, 3 FBO members, and 2 FBT members. The number of family members for each of the eight subfamilies, listed in descending order, was as follows: FBU (29) > FBA (27) > FBD (24) > FBK (4) > FBP (3)/FBL (3)/FBO (3) > FBT (2).

3.4. Conserved Motifs and gene structural of AhFBXs

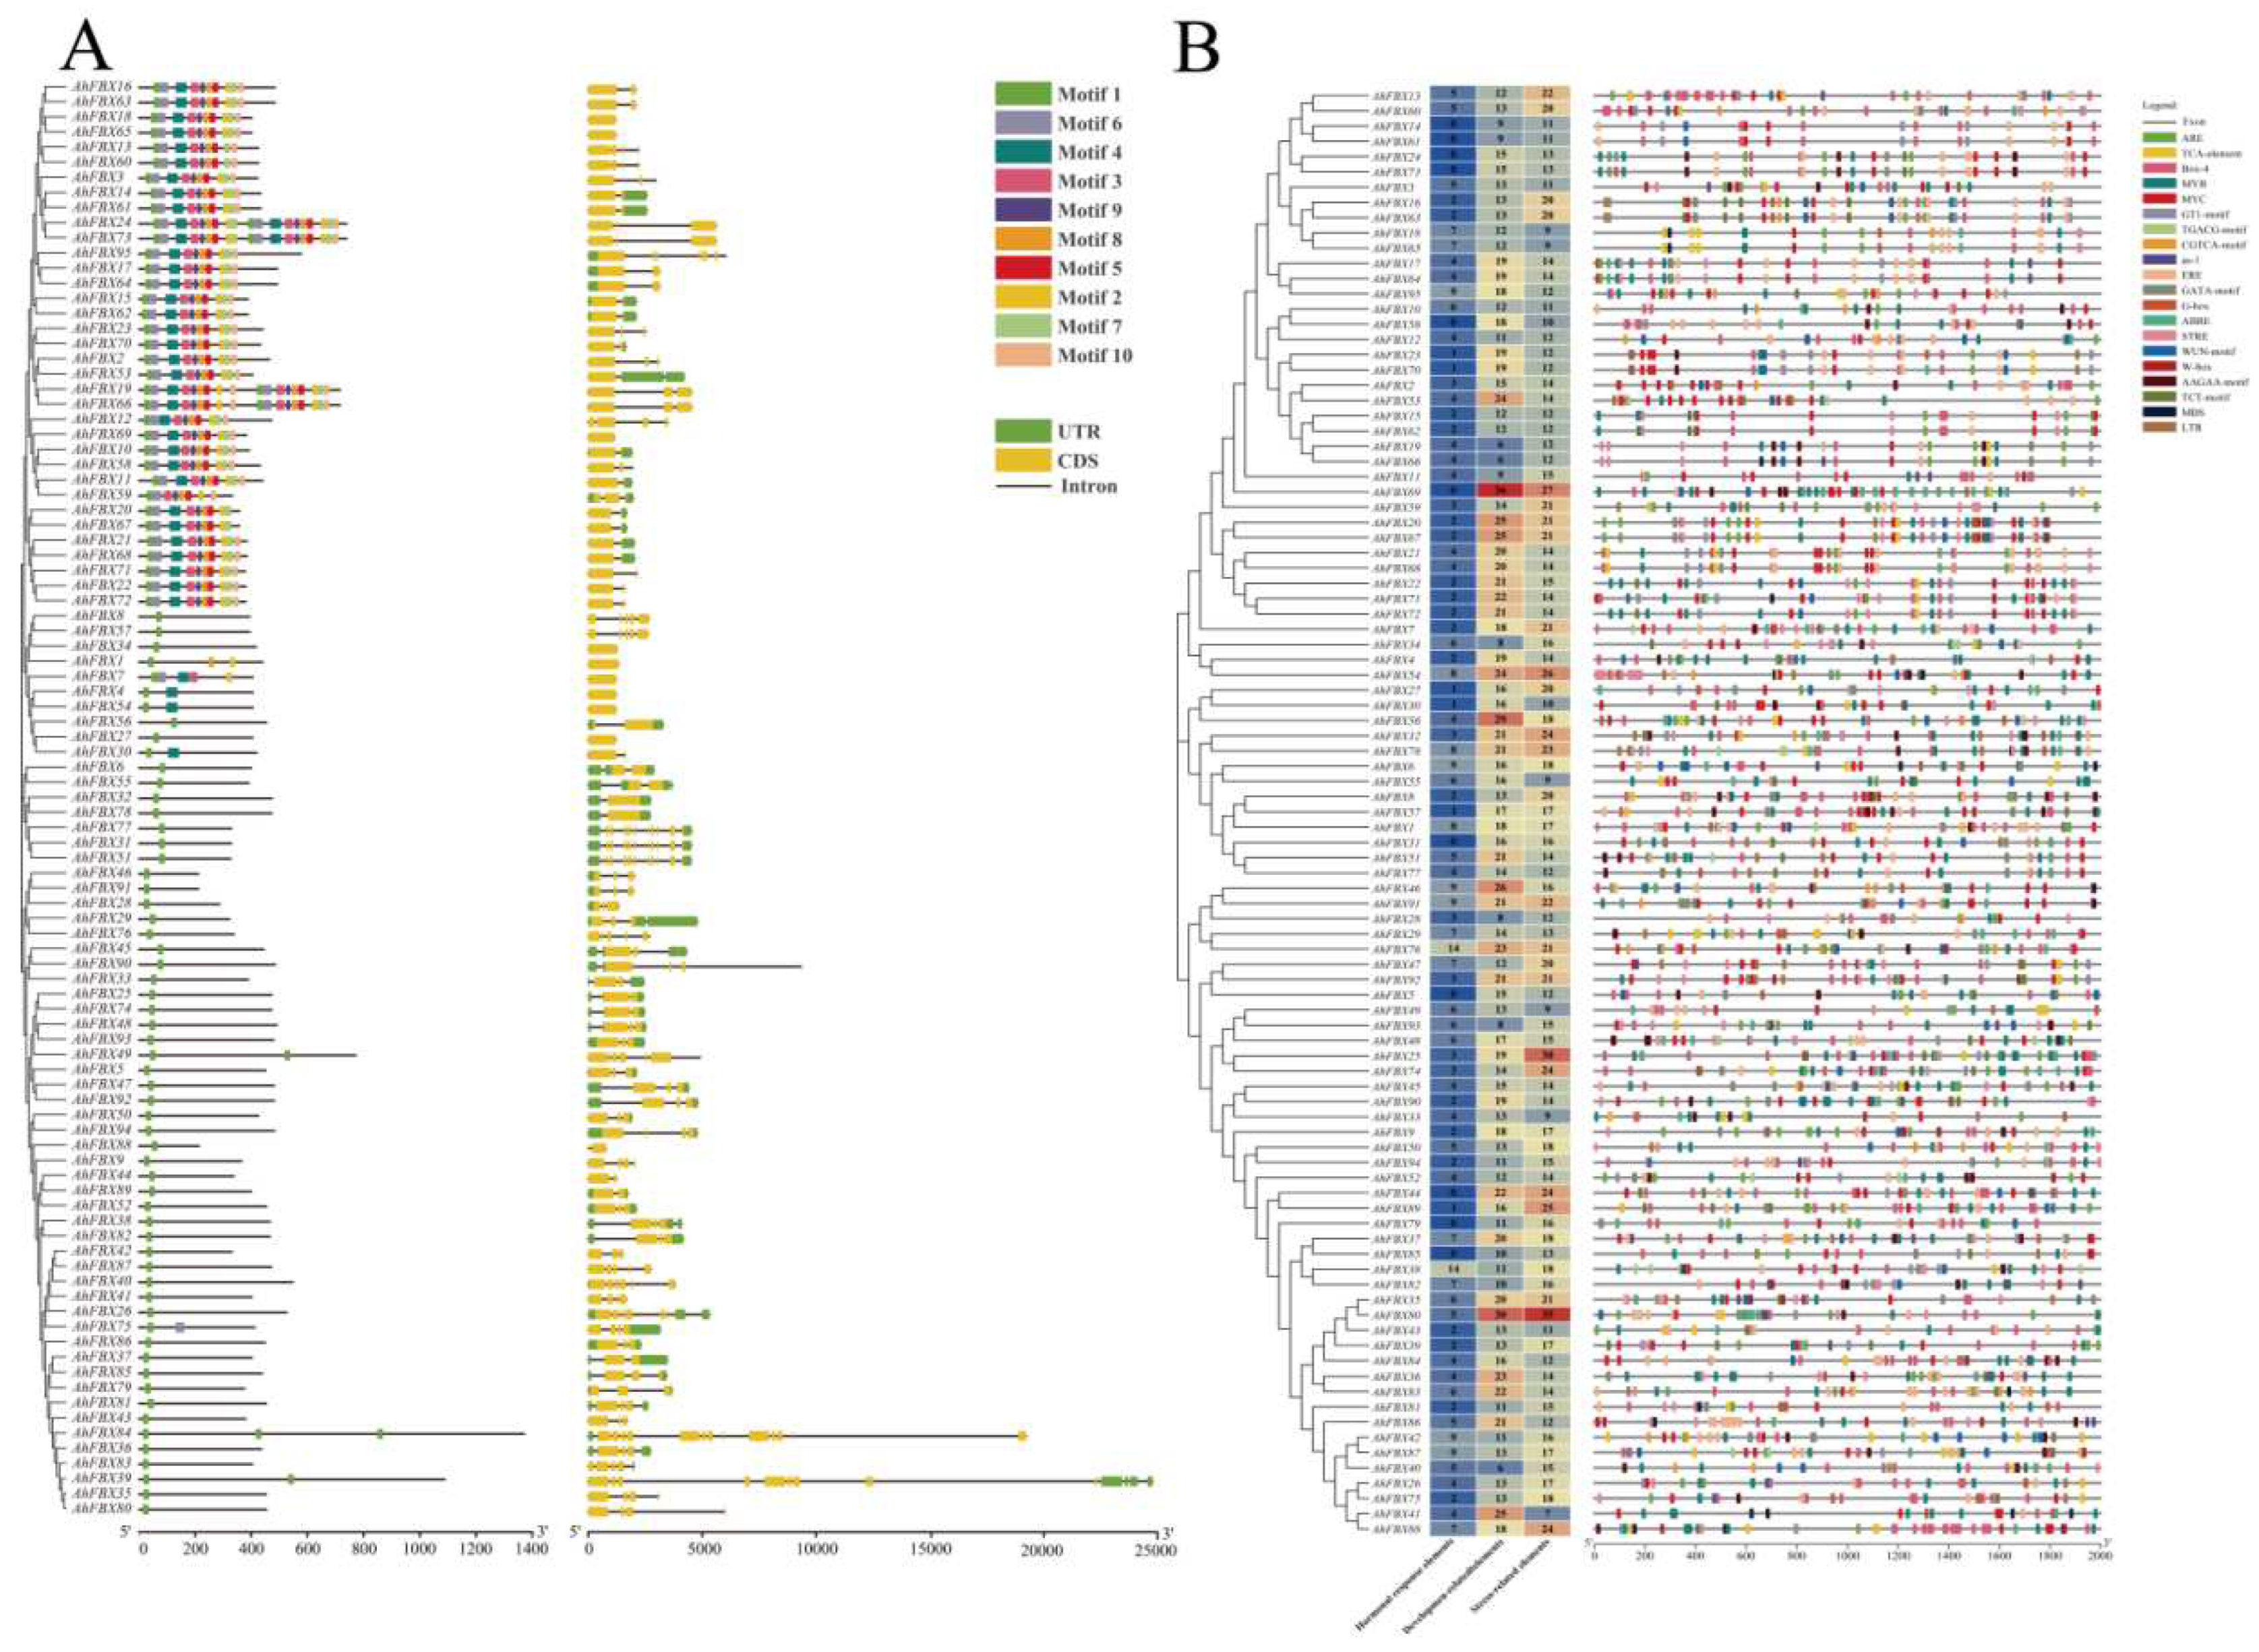
The AhFBX proteins were identified to contain at least 10 conserved motifs, predominantly annotated as F–box domain, and certain family members lacked recognizable motifs except for Motif1 (Table S3, Figure 3A). Among these, 35 AhFBX proteins had at least 10 conserved motifs. Notably, AhFBX24 and AhFBX73 contained 19 motifs, while AhFBX19 and AhFBX66 featured 18 motifs. The remaining AhFBX proteins only included 1–3 motifs. The disparity in conservative motifs could be served as a crucial foundation for identification and categorization of the AhFBX proteins. Additionally, AhFBX genes contained 1–15 exons and 1–13 introns. Of these, 53 (55.8%) members had 2–3 exons and 84 (88.4%) members had 1–4 introns. The family members with the highest number of exons and introns are AhFBX39 and AhFBX84. AhFBX39 had 15 exons and 13 introns, while AhFBX84 had 13 each of exons and introns. The members that possessed the same number of exons were grouped together, suggesting a potential correlation between the gene structure and its clustering group.

3.6. Cis–acting elements in the promoter region of AhFBXs

To predict the potential functions of AhFBXs, we analyzed the cis–acting elements in different gene promoter regions using the sequences located 2,000 bp upstream of the CDS. All members mainly divided into three categories (Table S4, Figure 3B). The first category comprised elements related to plant hormone responses, including the TCA–element, TGACG–motif, MBS, as–1, and others; The second category encompassed elements pertained to growth and development, including but not limited to the ARE, Box–4, GT1–motif, ABRE, TGACG-motif, and more. The third category contained elements that were associated with resistance to various stress, such as MYB, MYC, ERE, and ABRE etc. This distribution of cis–elements suggested that AhFBXs were closely related to plant growth and development, as well as responded to various stresses.

3.5. Collinearity and estimation of Ka/Ks ratios of AhFBXs

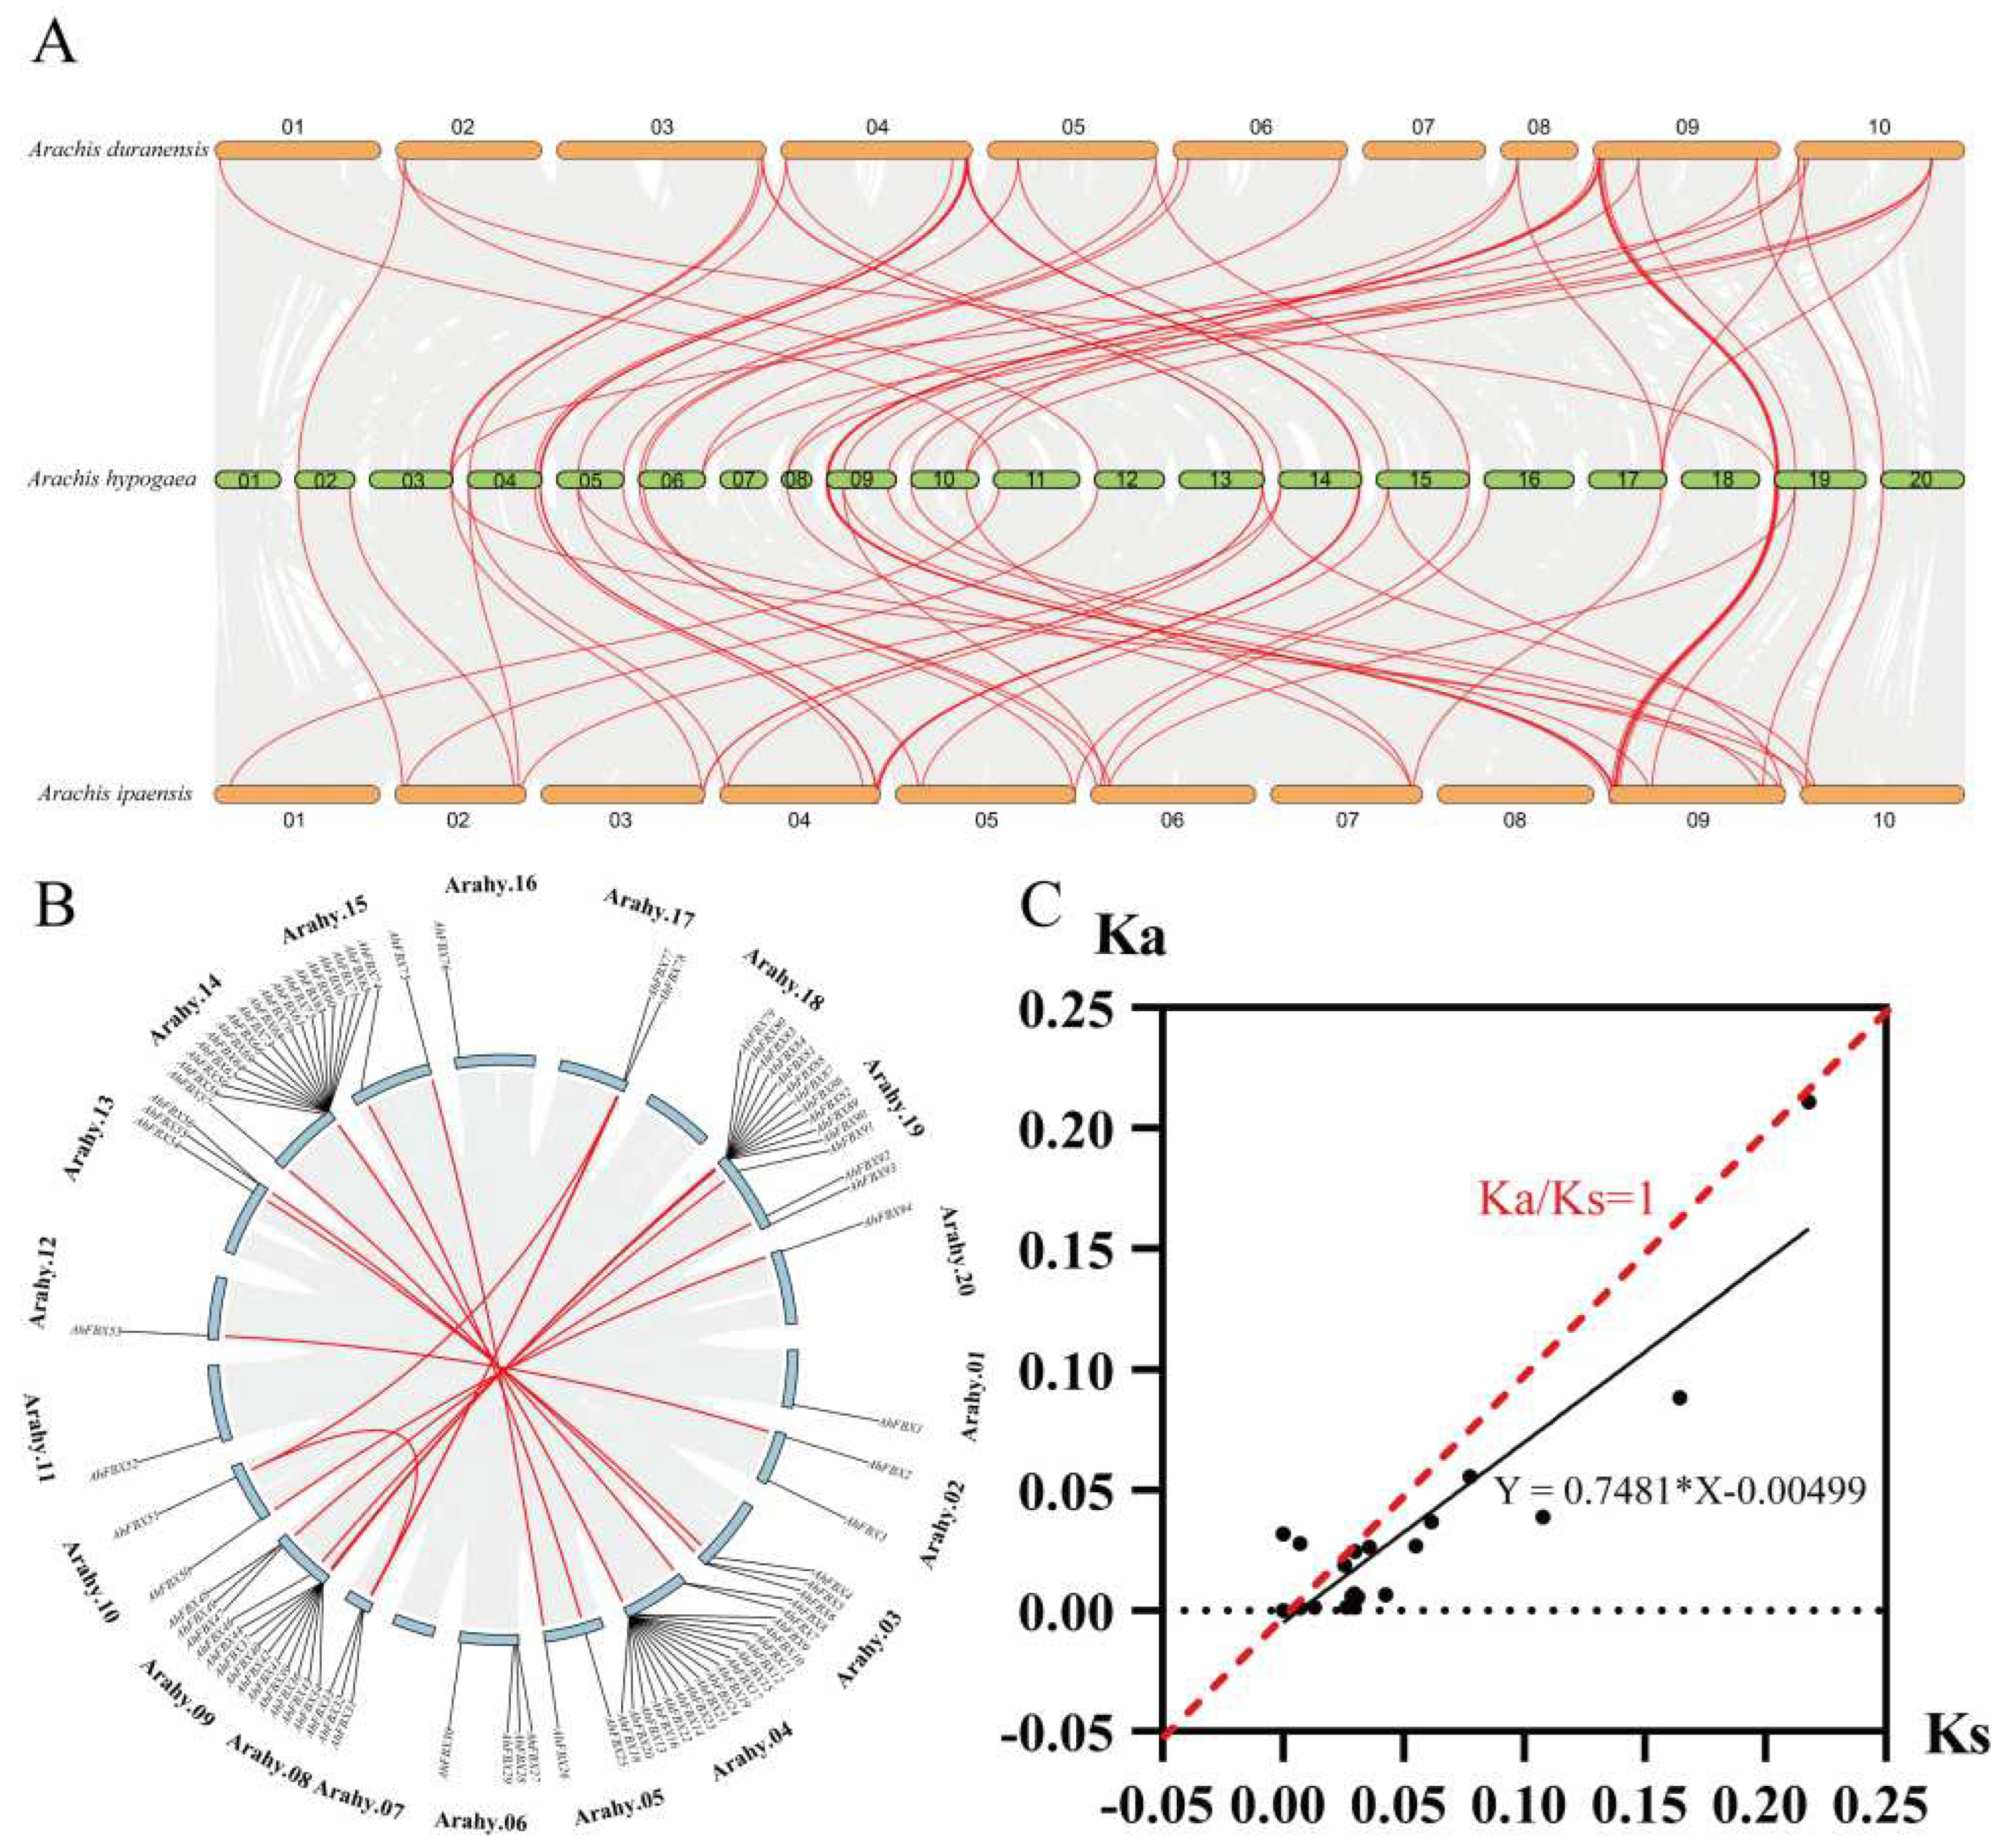
To gain a better understanding of the duplication events and evolutionary relationship of AhFBXs, we conducted collinearity and Ka/Ks analysis. A total of 133 pairs of collinear genes were identified in inter-species (Table S5, Figure 4A). A substantial number of segmental duplication events were observed in Aradu.04/Arahy.04, Aradu.09/Arahy.09, Araip.04/Arahy.14 and Araip.09/Arahy.19, suggested that the segmental duplication events played an important role in the evolution of peanuts. Similarly, intra-species collinearity analysis of cultivated peanut revealed that paired genes predominantly existed in chromosomes Arahy.04/Arahy.14 and Arahy.09/Arahy.19 (Table S6, Figure 4B). In addition, 19 pairs of duplicated genes had valid Ka, Ks and Ka/Ks. Among these, the Ks value of AhFBX gene pairs ranged from 0.0072 to 0.2182, indicating that large-scale AhFBX gene duplication events occurred as far back as 13.4 million years ago (MYA), and as recently as 0.44 MYA. The Ka/Ks values for all gene pairs were less than 1, with the exception of AhFBX36/AhFBX83, indicated that these genes likely underwent substantial purifying selection throughout evolution (Table S7, Figure 4C).

3.7. In silico expression patterns of AhFBXs in different tissues

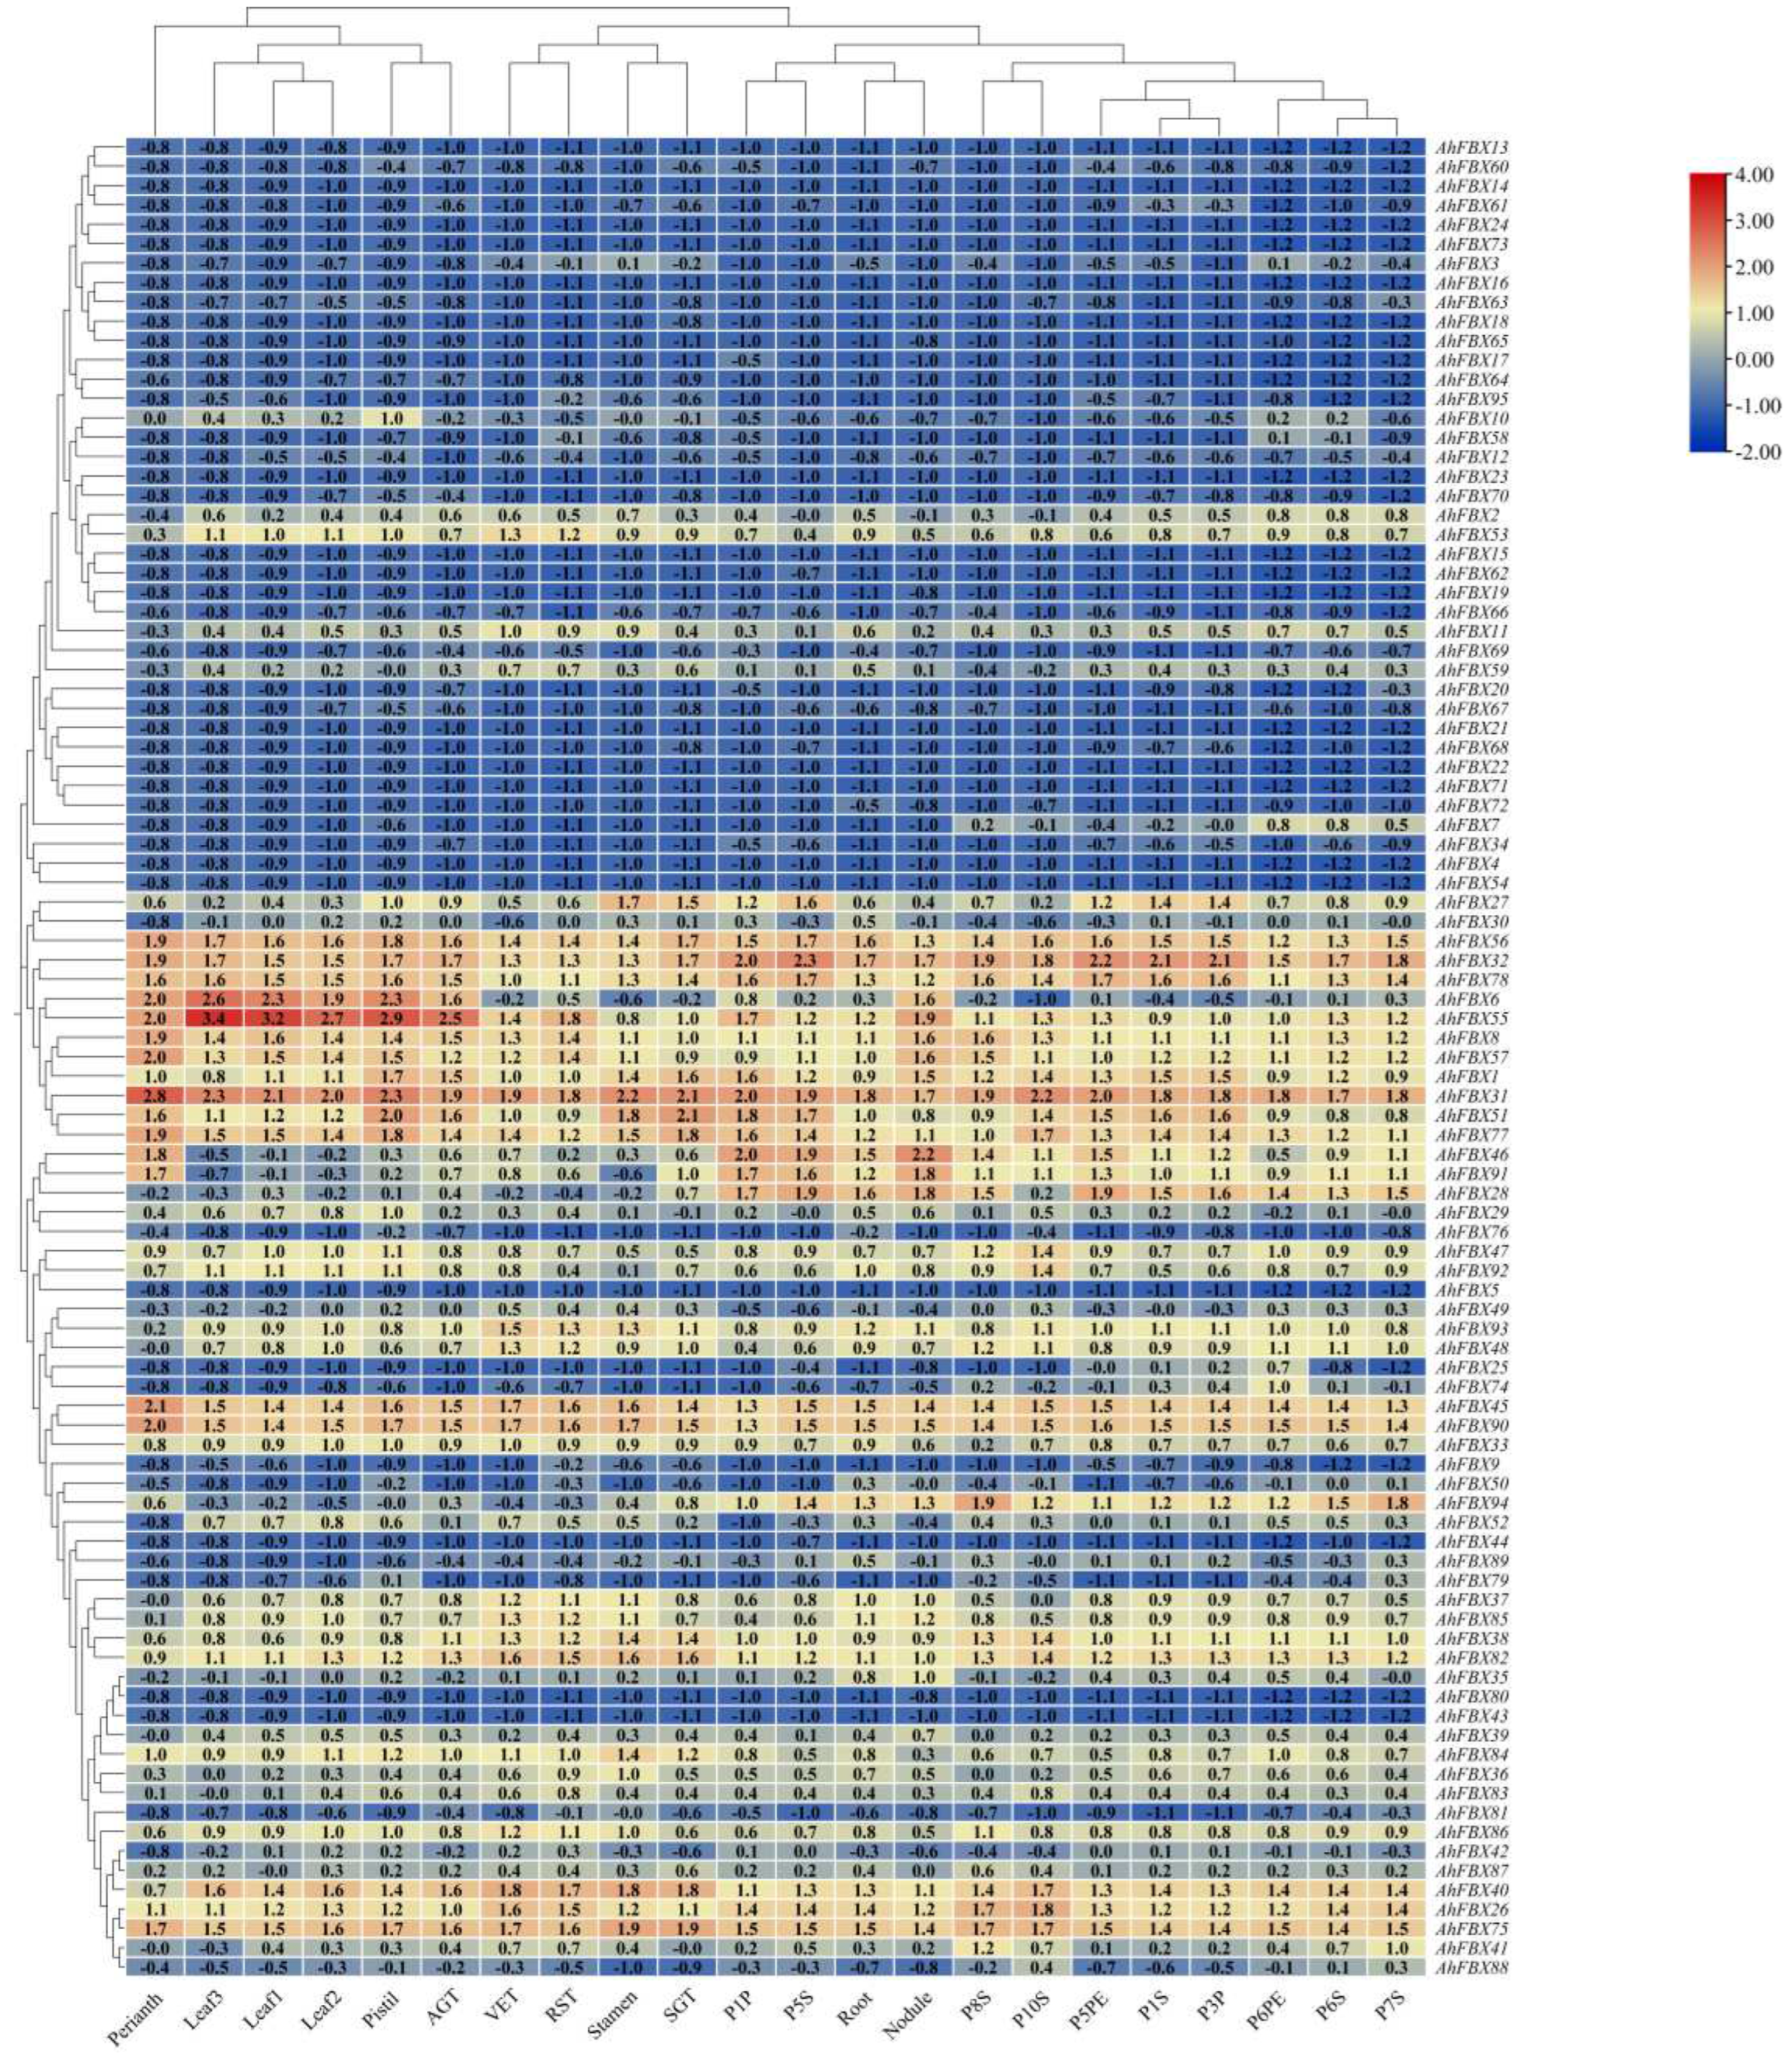
To explore the expression patterns of AhFBX genes in different tissues, we analyzed the expression profiles of 22 tissues (Table S8, Figure 5). Of these genes, 24 up-regulated expression genes and 47 down-regulated expression genes were found in all tissues. For instance, AhFBX40, AhFBX45, AhFBX55 and AhFBX90 from Group Ⅲ, displayed higher and positive expression levels in all tissues. And AhFBX15, AhFBX19, AhFBX62 and AhFBX66 from Group Ⅱ, showed lower and negative expression levels in all tissues. Besides, 25 genes showed tissue-specific expression patterns in all tissues. AhFBX28, AhFBX46 and AhFBX91 were highly expressed in pods, seeds, roots and nodules, while AhFBX6 was identified to be highly expressed in leaves, pistils and aerial gynophore tips. Interestingly, a part of homoeologous genes from same group exhibited a similar expression pattern, and the variation in expression patterns of homoeologous genes could be a result of polyploidization and duplication events that occurred during their evolution.

3.8. Expression of AhFBX genes during the lateral branch development

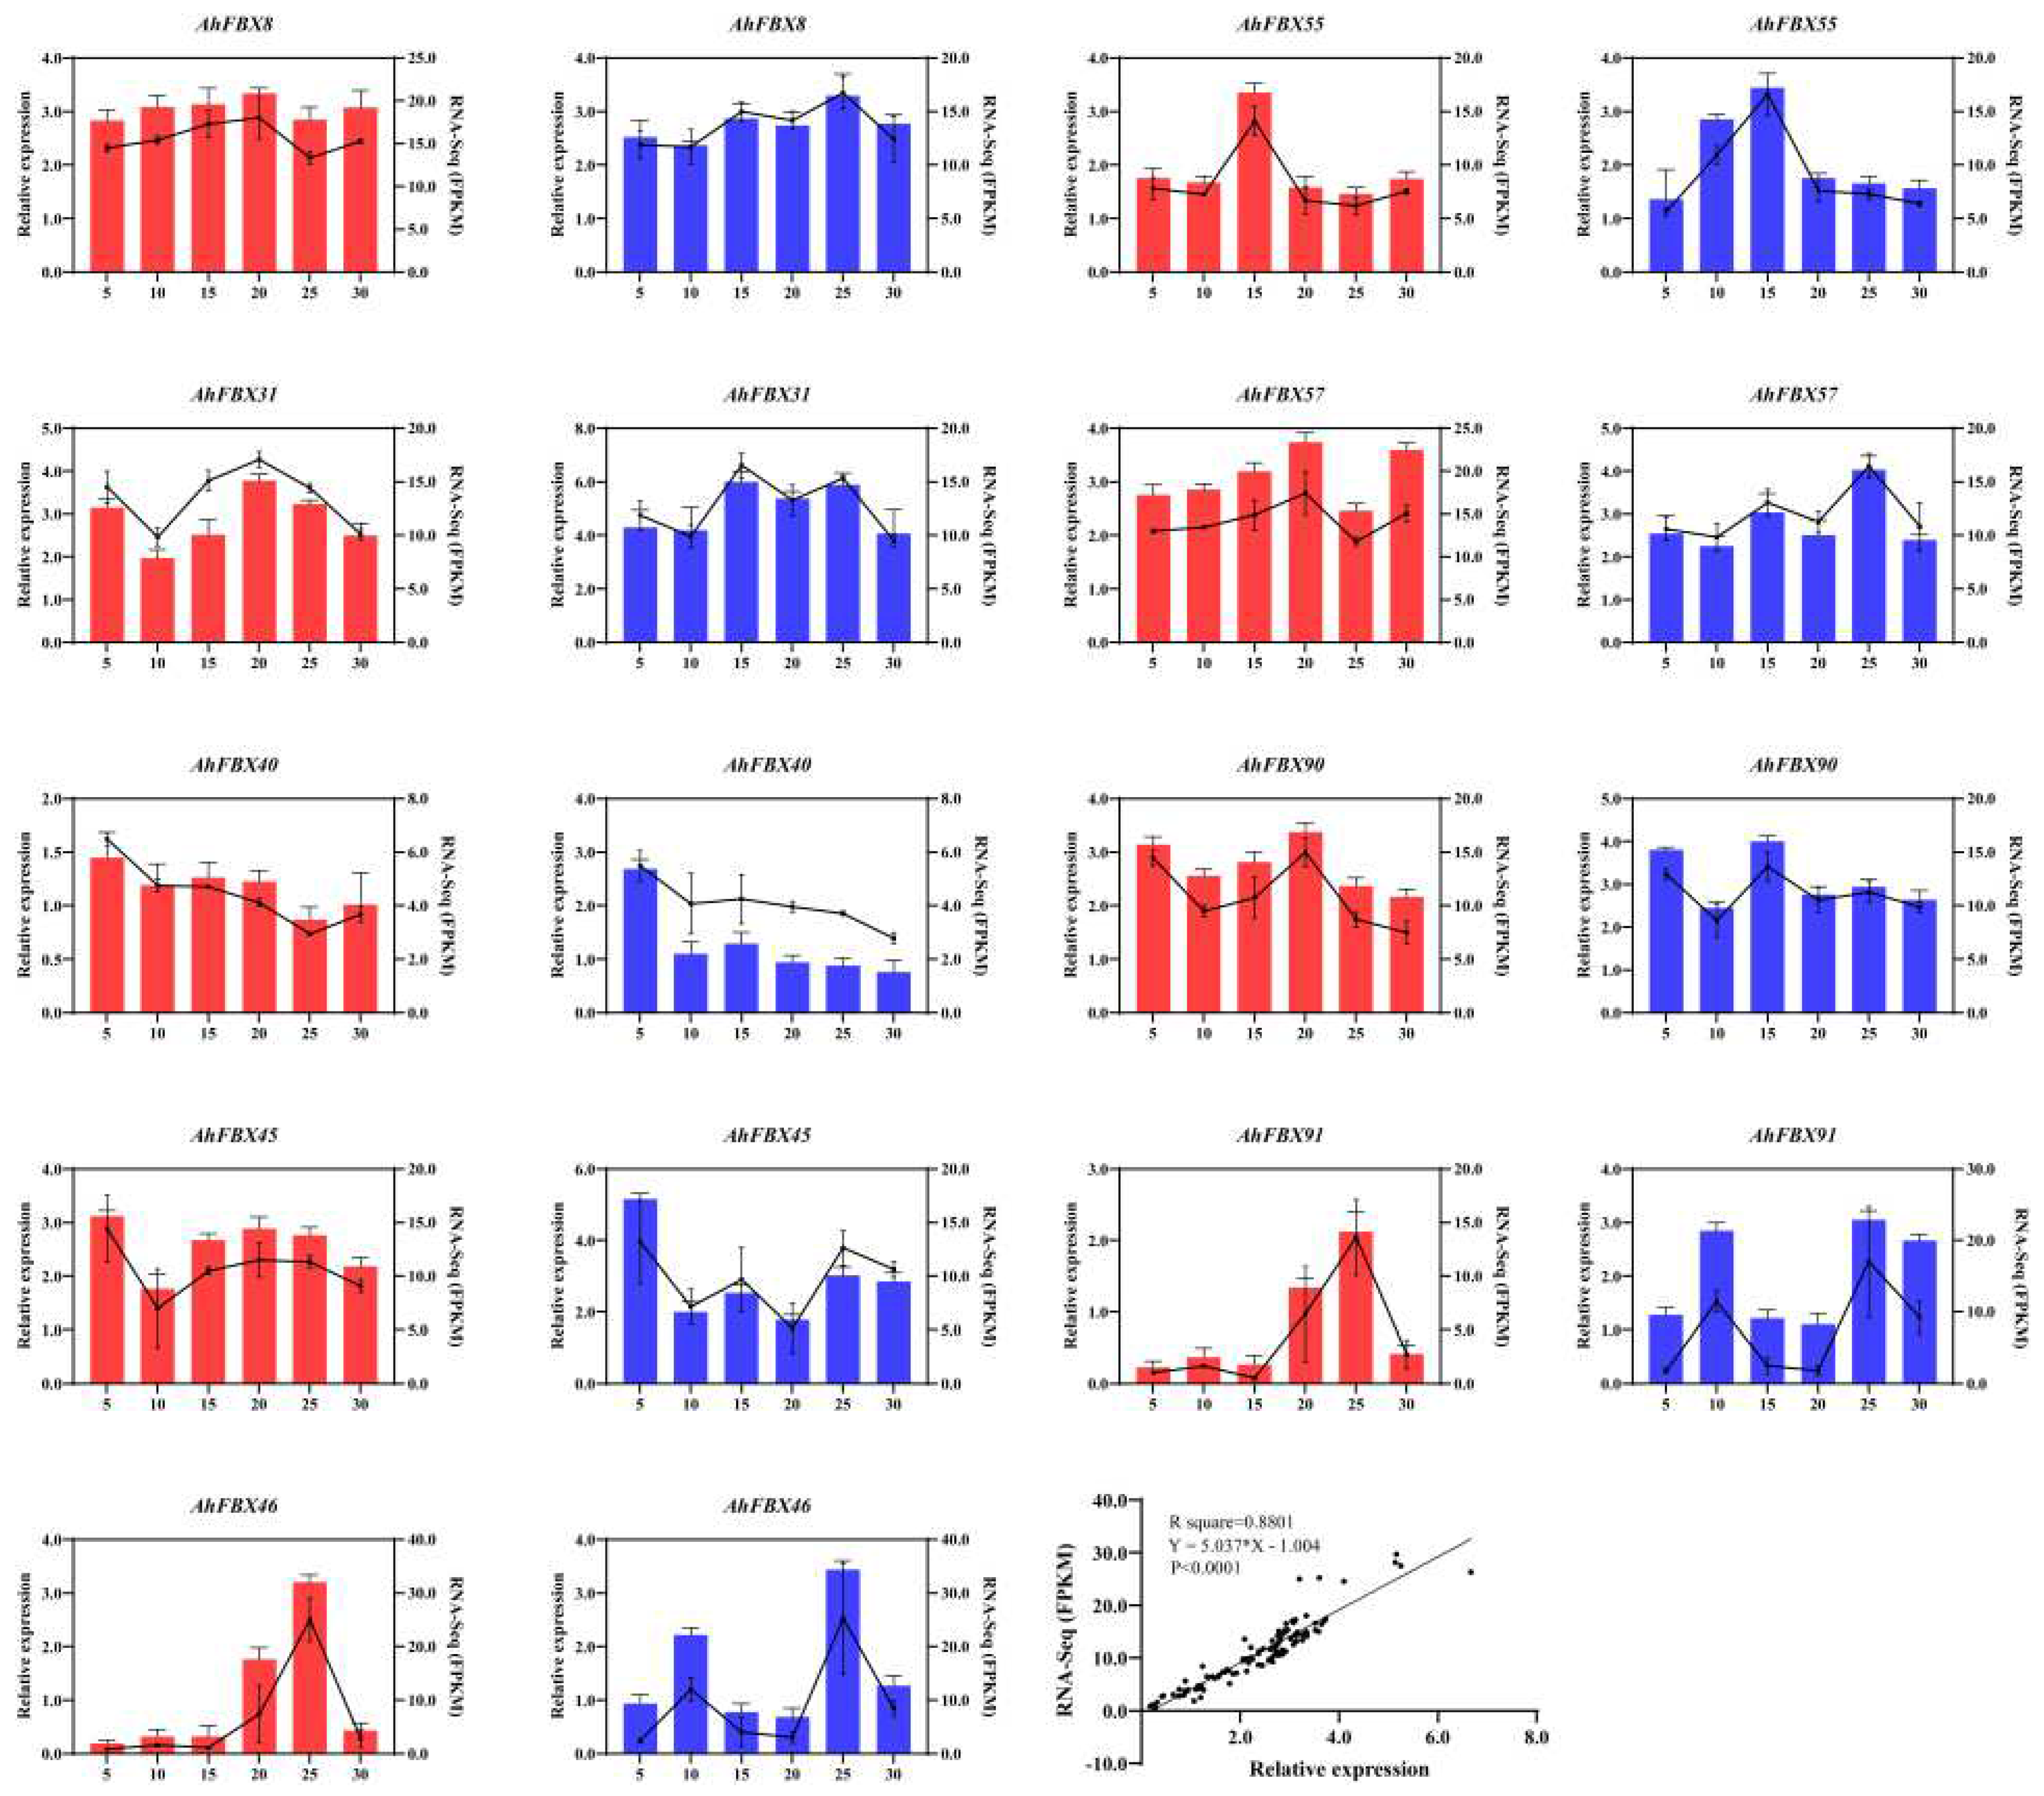
To verify the transcriptomic data of AhFBX genes during lateral branch development, we selected 9 DEGs for validation analysis (Table S9, Figure 6). Of these, AhFBX40, AhFBX45 and AhFBX90 showed high expression at 5DAP of two cultivars. Additionally, AhFBX46 and AhFBX91 were highly expressed at 25DAP of both cultivars. Interestingly, some AhFBXs showed specific expression patterns during the lateral branches development. For instance, AhFBX46 and AhFBX91 were highly expressed at 10DAP of M130; AhFBX31 and AhFBX90 were highly expressed at 15DAP of M130; AhFBX8, AhFBX31, AhFBX57 and AhFBX90 were highly expressed at 20DAP of JH5; AhFBX8 and AhFBX57 were highly expressed at 25DAP of M130. Correlation analysis further revealed a strong positive correlation between qRT-PCR and FPKM values. Based on these findings, it is hypothesized that the expression changes of these AhFBX genes were associated with the developmental changes of lateral branches.

4. Discussion

The F-box protein superfamily, primarily found in plants, plays a crucial role in a wide range of physiological and biochemical processes. The heterogeneity of F-box protein structures is predominantly due to variations in their C-terminal domains which are primarily responsible for substrate recognition and binding via interaction with SCF subunits. These proteins partake in different signal transduction pathways, thereby helping regulate vital cellular processes, rendering the F-box proteins one of the largest families of regulatory proteins. The identification of F-box proteins through whole-genome sequencing, however, can vary substantially among species, largely due to differences in chromosome number and evolutionary lineage. Moreover, the subfamily composition within the F-box protein family also exhibit diversity across species. Previous researches reported the discovery of 694 F-box proteins in Arabidopsis, 687 in rice, 359 in maize, 927 in alfalfa, and 725 in soybean [5,6,7,8,9,10,11,46]. However, our study has identified a markedly lower count of F-box proteins, totaling merely 95, a figure that falls drastically short compared to crops like rice, maize, soybean, and alfalfa. A previous investigation on maize revealed the highest number of F-box protein subfamilies with a total of 12 subfamilies, which include FBX, FBT (Tub), FBD, FBW (WD40), FBL (LRR), FBK (Kelch-type), FBP (PP2), FBDUF (DUF295), TLH, FBA, JmjC, and ALH [9]. Alfalfa, on the other hand, boasts the highest number of F-box protein subfamilies among legumes, with 15 subfamilies. These comprised of F-box, FBA, LRR, FBD, Kelch, DUF, PP2, TUB, WD40, PAS, Actin, GSH-synth ATP, ARM, JmjC, and LysM [10]. In our study, we observed the presence of merely eight subfamilies within the F-box protein family in peanut, a substantially smaller quantity than in maize and alfalfa. We speculate that the restricted count of F-box protein family members and subfamilies in peanut may be accredited to the significant homology between the A and B subgenomes of cultivated peanut, the abundance of repetitive sequences, and the diminished genome heterozygosity [19].
Distinct subfamilies demonstrating individual domains illustrate diverse functions integral to plant growth and development. Prior research predominantly delved into the role of the F-box protein family members in stress response processes, while investigations related to growth and development have not been extensively conducted. Consequently, it is essential to examine the equilibrium between target genes involved in stress response and those related to growth and development. For instance, a study on the FBK subfamily revealed that OsFBK12, an F-box protein encompassing the Kelch repeats domain in rice, collaborates with OSK1 to form the SCF complex. This results in the degradation of SAMs impacting the ETH content and influencing the leaf senescence process in rice [47]. Similarly, in Arabidopsis, the Kelch repeats F-box (KFB) proteins KFB01, KFB20, and KFB50 interact with PAL isoenzymes. The regulation, either through an increase or decrease of KFB expression, impacted the activity of PAL, which subsequently affected the rate-limiting process in the phenylpropanoid pathway. This eventually determined the lignin content in cells [48]. The Tub domain, earmarked as a distinct feature of the FBT subfamily, is recognized in numerous plant proteins. Overexpressed AtTLP9 mutants in Arabidopsis emonstrated ABA sensitivity, hinting at a potential involvement of the Tub domain in the ABA signaling pathway [49]. The PP2 (PHLOEM PROTEIN 2) domain is a characteristic recognition domain of the FBP subfamily. PP2 proteins are involved in vascular formation, transport of plant nutrients and macromolecules, and signal transduction processes, and are closely related to nutrient transport. PP2 proteins are involved in wound healing, resistance to biotic stress, and nutrient transport in plants. It is speculated that the FBP subfamily could be involved in regulating the formation of phloem in plants and participating in nutrient transport pathways [50,51]. The LRR (leucine-rich repeats) domain has been confirmed to be involved in plant root development and immunity in Arabidopsis thaliana [52]. In our study, FBL subfamily contained the LRR domain, and the molecular mechanisms underlying their regulation of lateral branch development is not yet understood. The FBO, FBD, FBA, FBU subfamilies identified in this study also have unclear functions in other crops, and other subfamilies, apart from the already known functions, may also participate in regulating lateral branch development.
Whole-genome duplication (WGD) events can provide an explanation for the large number of members within the F-box protein family and their diverse range of functions. Additionally, collinearity and the estimation of Ka/Ks ratios can assist researchers in indirectly confirming the allotetraploid origin of the peanut genome.By analyzing the Ka/Ks ratios of various F-box genes, it can be inferred that the cultivated peanut has undergone two significant WGD events throughout its evolutionary history. The first event occurred around 60 MYA when legume crops diversified into different species [53]. The second event took place approximately 2.16 MYA, resulting in the formation of the current allotetraploid peanut [19].In this study, 19 gene pairs were identified through intraspecific collinearity analysis. Through Ka/Ks analysis of these gene pairs, it was determined that the duplication timeframe of family members ranged from 13.4 MYA to 0.34 MYA. Among the selected gene pairs, 11 pairs demonstrated differentiation occurring after 2.16 MYA, while 8 pairs indicated differentiation occurring before 2.16 MYA. These findings suggest that the cultivated peanut differentiation also experienced the WGD event. Thus, the F-box protein family members have undergone both the differentiation of the legume crop genome and the duplication event within the peanut gene during the process of evolution.
The F-box protein family displays a wide range of structural and functional diversity, which is evident in the diversity of their expression patterns. Our investigation of AhFBX the sequences located 2,000 bp upstream of the CDS of cultivated peanuts revealed significant variations, indicating their diverse functionalities. We analyzed the promoter of the AhFBXs genes and found numerous cis-elements, including ones associated with light, plant hormone, and stress responses. This suggests that AhFBX genes play roles in various physiological and biochemical processes. Some commonly found cis-elements include ARE, G-box, AuxRE, MYB, BOX, and TCA-element. Of particular interest is the BOX element, a light-responsive element composed of TAATTA. The promoter region of the rbcS-3A gene in pea contains several BOX elements, which contribute to the regulation of the light-controlled molecular switch [54]. In our study, we identified a total of 39 BOX elements in the promoter region of AhFBX genes associated with lateral branch development. This suggested that peanut may regulate lateral branch development through a light-controlled molecular switch. Another important cis-regulatory element is the G-box element, which is widely involved in light responses and has a core sequence of CCACGTGG. The G-box binding protein GBF in the rbcS-1A gene of Arabidopsis thaliana regulates photomorphogenesis [55]. Additionally, the G-box element in Arabidopsis thaliana participates in the regulation of circadian rhythm by binding to the pseudo response regulator PRR [56].
AhFBXs were a multifunctional gene family, which was confirmed via the RNA-seq data and qRT-PCR results in this study. In this study, we identified 9 DEGs for RNA-Seq. Through phylogenetic analysis, we classified these DEGs into four groups based on their protein sequences in Arabidopsis and peanuts. Group I consisted of AhFBX46, AhFBX91, AtFBX12 (At2g24250), and AtFBX56 (At2g16220). Group III consisted of AhFBX40, AhFBX45, AhFBX55, AhFBX90, AtFBX58 (At3g50080), and AtFBX5 (At1g23390). Group IV consisted of AhFBX8, AhFBX31, AhFBX57, and AtFBX79(At4g35930). AhFBX8, AhFBX57, AhFBX31 and AtFBX79 were divided into Group IV. In previous studies have linked the FBS mutant fbs4-1 of Arabidopsis (At4g35930) to stomata development [57]. Considering the transcriptome data, the specific expression of AhFBX46 and AhFBX91 in the seeds of peanuts, suggested that their involve in seed growth and development. A similar pattern has been observed for AtFBX12 (At2g24250) in Arabidopsis, which exhibits specific expression during seed development and was associated with the mitochondrial protein pathway [58]. Furthermore, AhFBX40, AhFBX45, AhFBX55, AhFBX90, AtFBX58 (At3g50080), and AtFBX5 (At1g23390) were divided into Group III, and potential involved in root development and secondary metabolism. Previous studies showed that AtFBX58 (At3g50080) in Arabidopsis regulates lateral root formation [59], and AtFBX5 (At1g23390) was a negative regulator involved in the synthesis of brassinosteroids and flavonoids, as well as responsive to leaf, stem, pod development, and environmental stresses [60]. These findings implied that these genes in cultivated peanuts may be had similar functions. In our study, 9 DEGs displayed different expression pattern in developmental changes of lateral branches, 15DAP-25DAP had significant change trend between the two cultivars. In this study, we speculated that the period of 15-25 DAP may be a critical stage for plant type differentiation in peanut. These DEGs could be provided a basis for future research on the gene function of lateral branch development and differentiation.

5. Conclusions

In this study, a comprehensive analysis of the F-box protein family in Arachis hypogaea was conducted, resulting in the identification of a total of 95 AhFBX genes, which were categorized into four subgroups and eight subfamilies according to the phylogenetic relationship and conserved domain. Collinearity analysis indicated that segmental duplication events played a pivotal role in the evolution of the AhFBX family. Furthermore, Ka/Ks analysis demonstrated that strong purifying selection influenced the evolution of AhFBXs. Differential expression patterns of peanut F–box protein family genes in different tissues, and they were involved in the regulation of peanut growth and development. Among them, AhFBX8, AhFBX31, AhFBX45, AhFBX46, AhFBX55, AhFBX57, AhFBX90 and AhFBX91 showed specific expression in lateral branch development. These genes hold promise for future functional studies of F-box proteins members and their significance in shaping peanut's lateral branch.

Supplementary Materials

The following supporting information can be downloaded at the website of this paper posted on Preprints.org. Table S1: Sequences of the primers used in this study; Table S2: Statistics of physical location of AhFBXs on peanut chromosomes; Table S3: Motif sequence of AhFBXs; Table S4: Cis-element analysis of AhFBXs gene promoters; Table S5: Syntenic relationships between Arachis hypogaea and Arachis duranensisArachis ipaensis; Table S6: Synteny analysis of the cultivated peanut; Table S7: Ka/Ks analysis and years of genetic evolution; Table S8: Published transcriptome data of the various tissues in cultivated peanuts; Table S9: Transcriptome expression data of AhFBXs in the lateral branch development; Table S10: The relative expression data of nine AhFBX genes.

Author Contributions

Conceptualization, X.Y. and C.M.; methodology, X.Y.; software, C.L. and P.M.; validation, C.L. and W.W.; formal analysis, X.Y. and G.M.; investigation, C.L., L.G., W.W. and P.M.; resources, G.M. And C.C.; data curation, C.L.; writing—original draft preparation, C.L. and L.G.; writing—review and editing, X.Y., C.M. and C.C.; visualization, X.Y.; supervision, X.Y.; project administration, X.Y.; funding acquisition, X.Y. All authors have read and agreed to the published version of the manuscript.

Funding

This research was supported by the National Natural Science Foundation of China (Grant No. 31701459); the Top Young Talents Support Program of Hebei Province (Grant No. 0602015); the Science and Technology Research Programs of Higher Education of Hebei Province (Grant No. ZD2022069); the State Key Laboratory of North China for Crop Improvement and Regulation (Grant No. NCCIR2022zz–6); Hebei Agricultural University Students Innovation and Entrepreneurship Training Program (Grant No. 2022203) and and was funded by the University Students Innovation and Entrepreneurship Training Program (Grant No. S202210086018).

Institutional Review Board Statement

Not applicable.

Informed Consent Statement

Not applicable.

Data Availability Statement

Not applicable.

Conflicts of Interest

The authors declare no conflict of interest.

References

  1. Sadanandom, A.; Bailey, M.; Ewan, R.; Lee, J.; Nelis, S. The ubiquitin-proteasome system: Central modifier of plant signalling. New Phytol. 2012, 196, 13-28. [CrossRef]
  2. Chen, L.; Hellmann, H. Plant E3 Ligases: Flexible Enzymes in a Sessile World. Mol. Plant. 2013, 6, 1388-1404. [CrossRef]
  3. Somers, D.E.; Fujiwara, S. Thinking outside the F-box: Novel ligands for novel receptors. Trends Plant Sci. 2009, 14, 206-213. [CrossRef]
  4. Lechner, E.; Achard, P.; Vansiri, A.; Potuschak, T.; Genschik, P. F-box proteins everywhere. Curr. Opin. Plant Biol. 2006, 9, 631–638. [CrossRef]
  5. Kipreos, E.T.; Pagano, M. The F-box protein family. Genome Biology. 2000, 1, s3001-s3002. [CrossRef]
  6. Xu, G.; Ma, H.; Nei, M.; Kong, H. Evolution of F-box genes in plants: different modes of sequence divergence and their relationships with functional diversification. Proc. Natl. Acad. Sci. U.S.A.. 2009, 106(3): 835-840. [CrossRef]
  7. Gagne, J.M.; Downes, B.P.; Shiu, S.; Durski, A.M.; Vierstra, R.D. The F-box subunit of the SCF E3 complex is encoded by a diverse superfamily of genes in Arabidopsis. Proc. Natl. Acad. Sci. U.S.A. 2002, 99, 11519-11524. [CrossRef]
  8. Jain, M.; Nijhawan, A.; Arora, R.; Agarwal, P.; Ray, S.; Sharma, P.; Kapoor, S.; Tyagi, A.K.; Khurana, J.P. F-Box Proteins in Rice. Genome-Wide Analysis, Classification, Temporal and Spatial Gene Expression during Panicle and Seed Development, and Regulation by Light and Abiotic Stress. Plant Physiol. 2007, 143, 1467-1483. [CrossRef]
  9. Jia, F.; Wu, B.; Li, H.; Huang, J.; Zheng, C. Genome-wide identification and characterisation of F-box family in maize. Mol. Genet. Genomics. 2013, 288, 559-577. [CrossRef]
  10. Song, J.B.; Wang, Y.X.; Li, H.B.; Li, B.W.; Zhou, Z.S.; Gao, S.; Yang, Z.M. The F-box family genes as key elements in response to salt, heavy mental, and drought stresses in Medicago truncatula. Funct Integr Genomics 2015, 15, 495-507. [CrossRef]
  11. Jia, Q.; Xiao, Z.X.; Wong, F.L.; Sun, S.; Liang, K.J.; Lam, H.M. Genome-Wide Analyses of the Soybean F-Box Gene Family in Response to Salt Stress. Int. J. Mol. Sci. 2017, 18, 818. [CrossRef]
  12. Mo, F.; Zhang, N.; Qiu, Y.; Meng, L.; Cheng, M.; Liu, J.; Yao, L.; Lv, R.; Liu, Y.; Zhang, Y.; Chen, X.; Wang, A. Molecular Characterization, Gene Evolution and Expression Analysis of the F-Box Gene Family in Tomato (Solanum lycopersicum). Genes (Basel). 2021, 12(3): 417. [CrossRef]
  13. Wang, Y.; Li, C.; Yan, S.; Yu, B.; Gan, Y.; Liu, R.; Qiu, Z.; Cao, B. Genome-Wide Analysis and Characterization of Eggplant F-Box Gene Superfamily: Gene Evolution and Expression Analysis under Stress. Int J Mol Sci. 2022, 23(24):16049. [CrossRef]
  14. Feng, C.H.; Niu, M.X.; Liu, X.; Bao, Y.; Liu, S.; Liu, M.; He, F.; Han, S.; Liu, C.; Wang, H.L.; Yin, W.; Su, Y.; Xia X. Genome-Wide Analysis of the FBA Subfamily of the Poplar F-Box Gene Family and Its Role under Drought Stress. Int J Mol Sci. 2023, 24(5):4823. [CrossRef]
  15. Shen, H.; Luong, P.; Huq, E. The F-Box Protein MAX2 Functions as a Positive Regulator of Photomorphogenesis in Arabidopsis. Plant Physiol. 2007, 145, 1471-1483. [CrossRef]
  16. Song, J.B.; Huang, S.Q.; Dalmay, T.; Yang, Z.M. Regulation of leaf morphology by microRNA394 and its target LEAF CURLING RESPONSIVENESS. Plant Cell Physiol. 2012, 53, 1283-1294. [CrossRef]
  17. Marrocco, K.; Zhou, Y.; Bury, E.; Dieterle, M.; Funk, M.; Genschik, P.; Krenz, M.; Stolpe, T.; Kretsch, T. Functional analysis of EID1, an F-box protein involved in phytochrome A-dependent light signal transduction. Plant J. 2006, 45, 423-438. [CrossRef]
  18. Qin, X.; Tian, S.; Zhang, W.; Dong, X.; Ma, C.; Wang, Y.; Yan, J.; Yue, B. Q(Dtbn1), an F-box gene affecting maize tassel branch number by a dominant model. Plant Biotechnol. J. 2021, 19, 1183-1194. [CrossRef]
  19. Bertioli, D.J.; Cannon, S.B.; Froenicke, L.; Huang, G.; Farmer, A.D.; Cannon, E.K.; Liu, X.; Gao, D.; Clevenger, J.; Dash, S.; Ren, L.; Moretzsohn, M.C.; Shirasawa, K.; Huang, W.; Vidigal, B.; Abernathy, B.; Chu, Y.; Niederhuth, C.E.; Umale, P.; Araújo, A.C.; Kozik, A.; Kim, K.D.; Burow, M.D.; Varshney, R.K.; Wang, X.; Zhang, X.; Barkley, N.; Guimarães, P.M.; Isobe, S.; Guo, B.; Liao, B.; Stalker, H.T.; Schmitz, R.J.; Scheffler, B.E.; Leal-Bertioli, S.C.; Xun, X.; Jackson, S.A.; Michelmore, R.; Ozias-Akins, P. The genome sequences of Arachis duranensis and Arachis ipaensis, the diploid ancestors of cultivated peanut. Nat Genet. 2016, 48(4):438–46. [CrossRef]
  20. Bertioli, DJ.; Jenkins, J.; Clevenger, J.; Dudchenko, O.; Gao, D.; Seijo, G.; Leal-Bertioli, S.C.M.; Ren, L.; Farmer, A.D.; Pandey, M.K.; Samoluk, S.S.; Abernathy, B.; Agarwal, G.; Ballén-Taborda, C.; Cameron, C.; Campbell, J.; Chavarro, C.; Chitikineni, A.; Chu, Y.; Dash, S.; El, Baidouri, M.; Guo, B.; Huang, W.; Kim, K.D.; Korani, W.; Lanciano, S.; Lui, C.G.; Mirouze, M.; Moretzsohn, M.C.; Pham, M.; Shin, J.H.; Shirasawa, K.; Sinharoy, S.; Sreedasyam, A.; Weeks, N.T.; Zhang, X.; Zheng, Z.; Sun, Z.; Froenicke, L.; Aiden, E.L.; Michelmore, R.; Varshney, R.K.; Holbrook, C.C.; Cannon, E.K.S.; Scheffler, B.E.; Grimwood, J.; Ozias-Akins, P.; Cannon, S.B.; Jackson, S.A.; Schmutz, J. The genome sequence of segmental allotetraploid peanut Arachis hypogaea. Nat Genet. 2019, 51, 877–884. [CrossRef]
  21. Zhuang, W.; Chen, H.; Yang, M.; Wang, J.; Pandey, M.K.; Zhang, C.; Chang, W.C.; Zhang, L.; Zhang, X.; Tang, R.; Garg, V.; Wang, X.; Tang, H.; Chow, C.N.; Wang, J.; Deng, Y.; Wang, D.; Khan, A.W.; Yang, Q.; Cai, T.; Bajaj, P.; Wu, K.; Guo, B.; Zhang, X.; Li, J.; Liang, F.; Hu, J.; Liao, B.; Liu, S.; Chitikineni, A.; Yan, H.; Zheng, Y.; Shan, S.; Liu, Q.; Xie, D.; Wang, Z.; Khan, S.A.; Ali, N.; Zhao, C.; Li, X.; Luo, Z.; Zhang, S.; Zhuang, R.; Peng, Z.; Wang, S.; Mamadou, G.; Zhuang, Y.; Zhao, Z.; Yu, W.; Xiong, F.; Quan, W.; Yuan, M.; Li, Y.; Zou, H.; Xia, H.; Zha, L.; Fan, J.; Yu, J.; Xie, W.; Yuan, J.; Chen, K.; Zhao, S.; Chu, W.; Chen, Y.; Sun, P.; Meng, F.; Zhuo, T.; Zhao, Y.; Li, C.; He, G.; Zhao, Y.; Wang, C.; Kavikishor, P.B.; Pan, R.L.; Paterson, A.H.; Wang, X.; Ming, R.; Varshney, R.K. The genome of cultivated peanut provides insight into legume karyotypes, polyploid evolution and crop domestication. Nat Genet. 2019, 51, 865-876. [CrossRef]
  22. Chen, X.; Lu, Q.; Liu, H.; Zhang, J.; Hong, Y.; Lan, H.; Li, H.; Wang, J.; Liu, H.; Li, S.; Pandey, M.K.; Zhang, Z.; Zhou, G.; Yu, J.; Zhang, G.; Yuan, J.; Li, X.; Wen, S.; Meng, F.; Yu, S.; Wang, X.; Siddique, K.H.M.; Liu, Z.J.; Paterson, A.H.; Varshney, R.K.; Liang, X. Sequencing of Cultivated Peanut, Arachis hypogaea, Yields Insights into Genome Evolution and Oil Improvement. Mol Plant. 2019, 12(7):920–934. [CrossRef]
  23. Lu, C.; Peng, Z.; Liu, Y.; Li, G.; Wan, S. Genome-Wide Analysis of the SNARE Family in Cultivated Peanut (Arachis hypogaea L.) Reveals That Some Members Are Involved in Stress Responses. Int. J. Mol. Sci. 2023, 24, 7103. [CrossRef]
  24. Liu, Y.; Xiao, L.; Chi, J.; Li, R.; Han, Y.; Cui, F.; Peng, Z.; Wan, S.; Li, G. Genome-wide identification and expression of SAUR gene family in peanut (Arachis hypogaea L.) and functional identification of AhSAUR3 in drought tolerance. BMC Plant Biol. 2022, 22, 178. [CrossRef]
  25. Wang, X.; Liu, Y.; Huai, D.; Chen, Y.; Jiang, Y.; Ding, Y.; Kang, Y.; Wang, Z.; Yan, L.; Jiang, H.; Lei, Y.; Liao, B. Genome-wide identification of peanut PIF family genes and their potential roles in early pod development. Gene, 2021, 781, 145539. [CrossRef]
  26. Han, Y.; Li, R.; Liu, Y.; Fan, S.; Wan, S.; Zhang, X.; Li, G. The Major Intrinsic Protein Family and Their Function Under Salt–Stress in Peanut. Front Genet, 2021, 12, 639585. [CrossRef]
  27. Gallavotti, A. The role of auxin in shaping shoot architecture. J. Exp. Bot. 2013, 64, 2593–2608. [CrossRef]
  28. Pittman, R. N. United States peanut descriptors. ARS (USA), 1995.
  29. Kayam, G.; Brand, Y.; Faigenboim-Doron, A.; Patil, A.; Hedvat, I.; Hovav, R. Fine-Mapping the Branching Habit Trait in Cultivated Peanut by Combining Bulked Segregant Analysis and High-Throughput Sequencing. Front Plant Sci, 2017, 8:467. [CrossRef]
  30. Donald, C.M. The breeding of crop ideotypes. Euphytica. 1968, 17, 385–403. [CrossRef]
  31. Zhang, L.; Yu, H.; Ma, B.; Liu, G.; Wang, J.; Wang, J.; Gao, R.; Li, J.; Liu, J.; Xu, J.; Zhang, Y.; Li, Q.; Huang, X.; Xu, J.; Li, J.; Qian, Q.; Han, B.; He, Z.; Li, J. A natural tandem array alleviates epigenetic repression of IPA1 and leads to superior yielding rice. Nat Commun. 2017, 8, 14789. [CrossRef]
  32. Tian, J.; Wang, C.; Xia, J.; Wu, L.; Xu, G.; Wu, W.; Li, D.; Qin, W.; Han, X.; Chen, Q.; Jin, W.; Tian, F. Teosinte ligule allele narrows plant architecture and enhances high-density maize yields. Science. 2016, 16, 365(6454): 658-664. [CrossRef]
  33. Li, L.; Cui, S.; Dang, P.; Yang, X.; Wei, X.; Chen, K.; Liu, L.; Chen, C.Y. GWAS and bulked segregant analysis reveal the Loci controlling growth habit-related traits in cultivated Peanut (Arachis hypogaea L.). BMC Genom, 2022, 27;23(1):403. [CrossRef]
  34. Zhao, N.; He, M.; Li, L.; Cui, S.; Hou, M.; Wang, L.; Mu, G.; Liu, L.; Yang, X. Identification and expression analysis of WRKY gene family under drought stress in peanut (Arachis hypogaea L.). PLoS One, 2020, 15(4): e0231396. [CrossRef]
  35. Voorrips, R.E. MapChart: software for the graphical presentation of linkage maps and QTLs. J. Hered. 2002, 93, 77–78. [CrossRef]
  36. Kumar, S.; Stecher, G.; Li, M.; Knyaz, C.; Tamura, K. MEGA X: Molecular Evolutionary Genetics Analysis across Computing Platforms. Mol. Biol. Evol. 2018, 35, 1547–1549. [CrossRef]
  37. Wilkins, M.R.; Gasteiger, E.; Bairoch, A.; Sanchez, J.C.; Williams, K.L.; Appel, R.D.; Hochstrasser, D.F. Protein identification and analysis tools in the ExPASy server. Methods Mol Biol. 1999, 112, 531–552. [CrossRef]
  38. Bailey, T.L.; Boden, M.; Buske, F.A.; Frith, M.; Grant, C.E.; Clementi, L.; Ren, J.; Li, W.W.; Noble, W.S. MEME SUITE: tools for motif discovery and searching. Nucleic Acids Res. 2009, 37, W202–W208. [CrossRef]
  39. Hu, B.; J.J.J.P. GSDS 2.0: an upgraded gene feature visualization server. Bioinformatics 2015, 31(8), 1296–1297. [CrossRef]
  40. Wang Y, Tang H, Debarry JD, et al. MCScanX: a toolkit for detection and evolutionary analysis of gene synteny and collinearity. Nucleic Acids Res. 2012;40(7):e49. [CrossRef]
  41. Chen, C.; Chen, H.; Zhang, Y.; Thomas, H.R.; Frank, M.H.; He, Y.; Xia, R. TBtools: An Integrative Toolkit Developed for Interactive Analyses of Big Biological Data. Mol Plant. 2020, 13(8):1194–1202. [CrossRef]
  42. Wang, D.; Zhang, Y.; Zhang, Z.; Zhu, J.; Yu, J. KaKs_Calculator 2.0: A Toolkit Incorporating Gamma-Series Methods and Sliding Window Strategies. Genomics, Proteomics & Bioinformatics. 2010, 8, 77–80. [CrossRef]
  43. Clevenger, J., Chu, Y., Scheffler, B., and Ozias-Akins, P. A developmental transcriptome map for allotetraploid Arachis hypogaea. Front. Plant Sci. 2016, 7, 1446. [CrossRef]
  44. Li, J.; Ma, Y.; Hu, M.; Zhao, Y.; Liu, B.; Wang, C.; Zhang, M.; Zhang, L.; Yang, X.; Mu, G. Multi-Omics and miRNA Interaction Joint Analysis Highlight New Insights Into Anthocyanin Biosynthesis in Peanuts (Arachis hypogaea L.). Front. Plant Sci. 2022 13:818345. [CrossRef]
  45. Livak, K.J.; Schmittgen, T.D. Analysis of relative gene expression data using real-time quantitative PCR and the 2(-Delta Delta C(T)). Method. Methods. 2001, 25, 402–408. [CrossRef]
  46. Moon, J.; Parry, G.; Estelle, M. The ubiquitin-proteasome pathway and plant development. Plant Cell. 2004, 16(12): 3181-95. [CrossRef]
  47. Chen, Y.; Xu, Y.; Luo, W.; Li, W.; Chen, N.; Zhang, D.; Chong, K. The F-box protein OsFBK12 targets OsSAMS1 for degradation and affects pleiotropic phenotypes, including leaf senescence, in rice. Plant Physiol. 2013, 163(4):1673-85. [CrossRef]
  48. Zhang, X.; Gou, M.; Liu, C.J. Arabidopsis Kelch repeat F-box proteins regulate phenylpropanoid biosynthesis via controlling the turnover of phenylalanine ammonia-lyase. Plant Cell. 2013, 25(12):4994-5010. [CrossRef]
  49. Lai, C.P.; Lee, C.L.; Chen, P.H.; Wu, S.H.; Yang, C.C.; Shaw, J.F. Molecular analyses of the Arabidopsis TUBBY-like protein gene family. Plant Physiol. 2004, 134(4):1586-97. [CrossRef]
  50. Swamy, MJ.; Mondal, S. Subunit association, and thermal and chemical unfolding of Cucurbitaceae phloem exudate lectins. A review. Int J Biol Macromol. 2023, 1; 233: 123434. [CrossRef]
  51. Dinant, S.; Clark, A.M.; Zhu, Y.; Vilaine, F.; Palauqui, J.C.; Kusiak, C.; Thompson, G.A. Diversity of the superfamily of phloem lectins (phloem protein 2) in angiosperms. Plant Physiol. 2003, 131(1):114-28. [CrossRef]
  52. DeFalco, T.A.; Anne, P.; James, S.R.; Willoughby, A.C.; Schwanke, F.; Johanndrees, O.; Genolet, Y.; Derbyshire, P.; Wang, Q.; Rana, S.; Pullen, A.M.; Menke, F.L.H.; Zipfel, C.; Hardtke, C.S.; Nimchuk, Z.L. A conserved module regulates receptor kinase signalling in immunity and development. Nat Plants. 2022, 8(4):356-365. [CrossRef]
  53. Young, N.D.; Debellé, F.; Oldroyd, G.E.; Geurts, R.; Cannon, S.B.; Udvardi, M.K.; Benedito, V.A.; Mayer, K.F.; Gouzy, J.; Schoof, H.; Van, de, Peer, Y.; Proost, S.; Cook, D.R.; Meyers, B.C.; Spannagl, M.; Cheung, F.; De, Mita, S.; Krishnakumar, V.; Gundlach, H.; Zhou, S.; Mudge, J.; Bharti, A.K.; Murray, J.D.; Naoumkina, M.A.; Rosen, B.; Silverstein, K.A.; Tang, H.; Rombauts, S.; Zhao, P.X.; Zhou, P.; Barbe, V.; Bardou, P.; Bechner, M.; Bellec, A.; Berger, A.; Bergès, H.; Bidwell, S.; Bisseling, T.; Choisne, N.; Couloux, A.; Denny, R.; Deshpande, S.; Dai, X.; Doyle, J.J.; Dudez, A.M.; Farmer, A.D.; Fouteau, S.; Franken, C.; Gibelin, C.; Gish, J.; Goldstein, S.; González, A.J.; Green, P.J.; Hallab, A.; Hartog, M.; Hua, A.; Humphray, S.J.; Jeong, D.H.; Jing, Y.; Jöcker, A.; Kenton, S.M.; Kim, D.J.; Klee, K.; Lai, H.; Lang, C.; Lin, S.; Macmil, S.L.; Magdelenat, G.; Matthews, L.; McCorrison, J.; Monaghan, E.L.; Mun, J.H.; Najar, F.Z.; Nicholson, C.; Noirot, C.; O'Bleness, M.; Paule, C.R.; Poulain, J.; Prion, F.; Qin, B.; Qu, C.; Retzel, E.F.; Riddle, C.; Sallet, E.; Samain, S.; Samson, N.; Sanders, I.; Saurat, O.; Scarpelli, C.; Schiex, T.; Segurens, B.; Severin, A.J.; Sherrier, D.J.; Shi, R.; Sims, S.; Singer, S.R.; Sinharoy, S.; Sterck, L.; Viollet, A.; Wang, B.B.; Wang, K.; Wang, M.; Wang, X.; Warfsmann, J.; Weissenbach, J.; White, D.D.; White, J.D.; Wiley, G.B.; Wincker, P.; Xing, Y.; Yang, L.; Yao, Z.; Ying, F.; Zhai, J.; Zhou, L.; Zuber, A.; Dénarié, J.; Dixon, R.A.; May, G.D.; Schwartz, D.C.; Rogers, J.; Quétier, F.; Town, C.D.; Roe, B.A. The Medicago genome provides insight into the evolution of rhizobial symbioses. Nature. 2011, 480, 520-524. [CrossRef]
  54. Gilmartin, PM.; Sarokin, L.; Memelink, J.; Chua, N.H. Molecular light switches for plant genes. Plant Cell. 1990, 2(5):369-78. [CrossRef]
  55. Schindler, U.; Menkens, A.E.; Beckmann, H.; Ecker, J.R.; Cashmore, A.R. Heterodimerization between light-regulated and ubiquitously expressed Arabidopsis GBF bZIP proteins. EMBO J. 1992, 11(4):1261-73. [CrossRef]
  56. Liu, T.L.; Newton, L.; Liu, M.J.; Shiu, S.H.; Farré, E.M. A G-Box-Like Motif Is Necessary for Transcriptional Regulation by Circadian Pseudo-Response Regulators in Arabidopsis. Plant Physiol. 2016, 170(1):528-39. [CrossRef]
  57. Li, Y.; Xue, S.; He, Q.; Wang, J.; Zhu, L.; Zou, J.; Zhang, J.; Zuo, C.; Fan, Z.; Yue, J.; Zhang, C.; Yang, K.; Le, J. Arabidopsis F-BOX STRESS INDUCED 4 is required to repress excessive divisions in stomatal development. J Integr Plant Biol. 2022, 64(1):56-72. [CrossRef]
  58. Lama, S.; Broda, M.; Abbas, Z.; Vaneechoutte, D.; Belt, K.; Säll, T.; Vandepoele, K.; Van, Aken. O. Neofunctionalization of Mitochondrial Proteins and Incorporation into Signaling Networks in Plants. Mol Biol Evol. 2019, 36(5): 974-989. [CrossRef]
  59. Schwager, K.M.; Calderon-Villalobos, L.I.; Dohmann, E.M.; Willige, B.C.; Knierer, S.; Nill, C.; Schwechheimer, C. Characterization of the VIER F-BOX PROTEINE genes from Arabidopsis reveals their importance for plant growth and development. Plant Cell. 2007, 19(4):1163-78. [CrossRef]
  60. Zhang, X.; Abrahan, C.; Colquhoun, T.A.; Liu, C.J. A Proteolytic Regulator Controlling Chalcone Synthase Stability and Flavonoid Biosynthesis in Arabidopsis. Plant Cell. 2017, 29(5):1157-1174. [CrossRef]
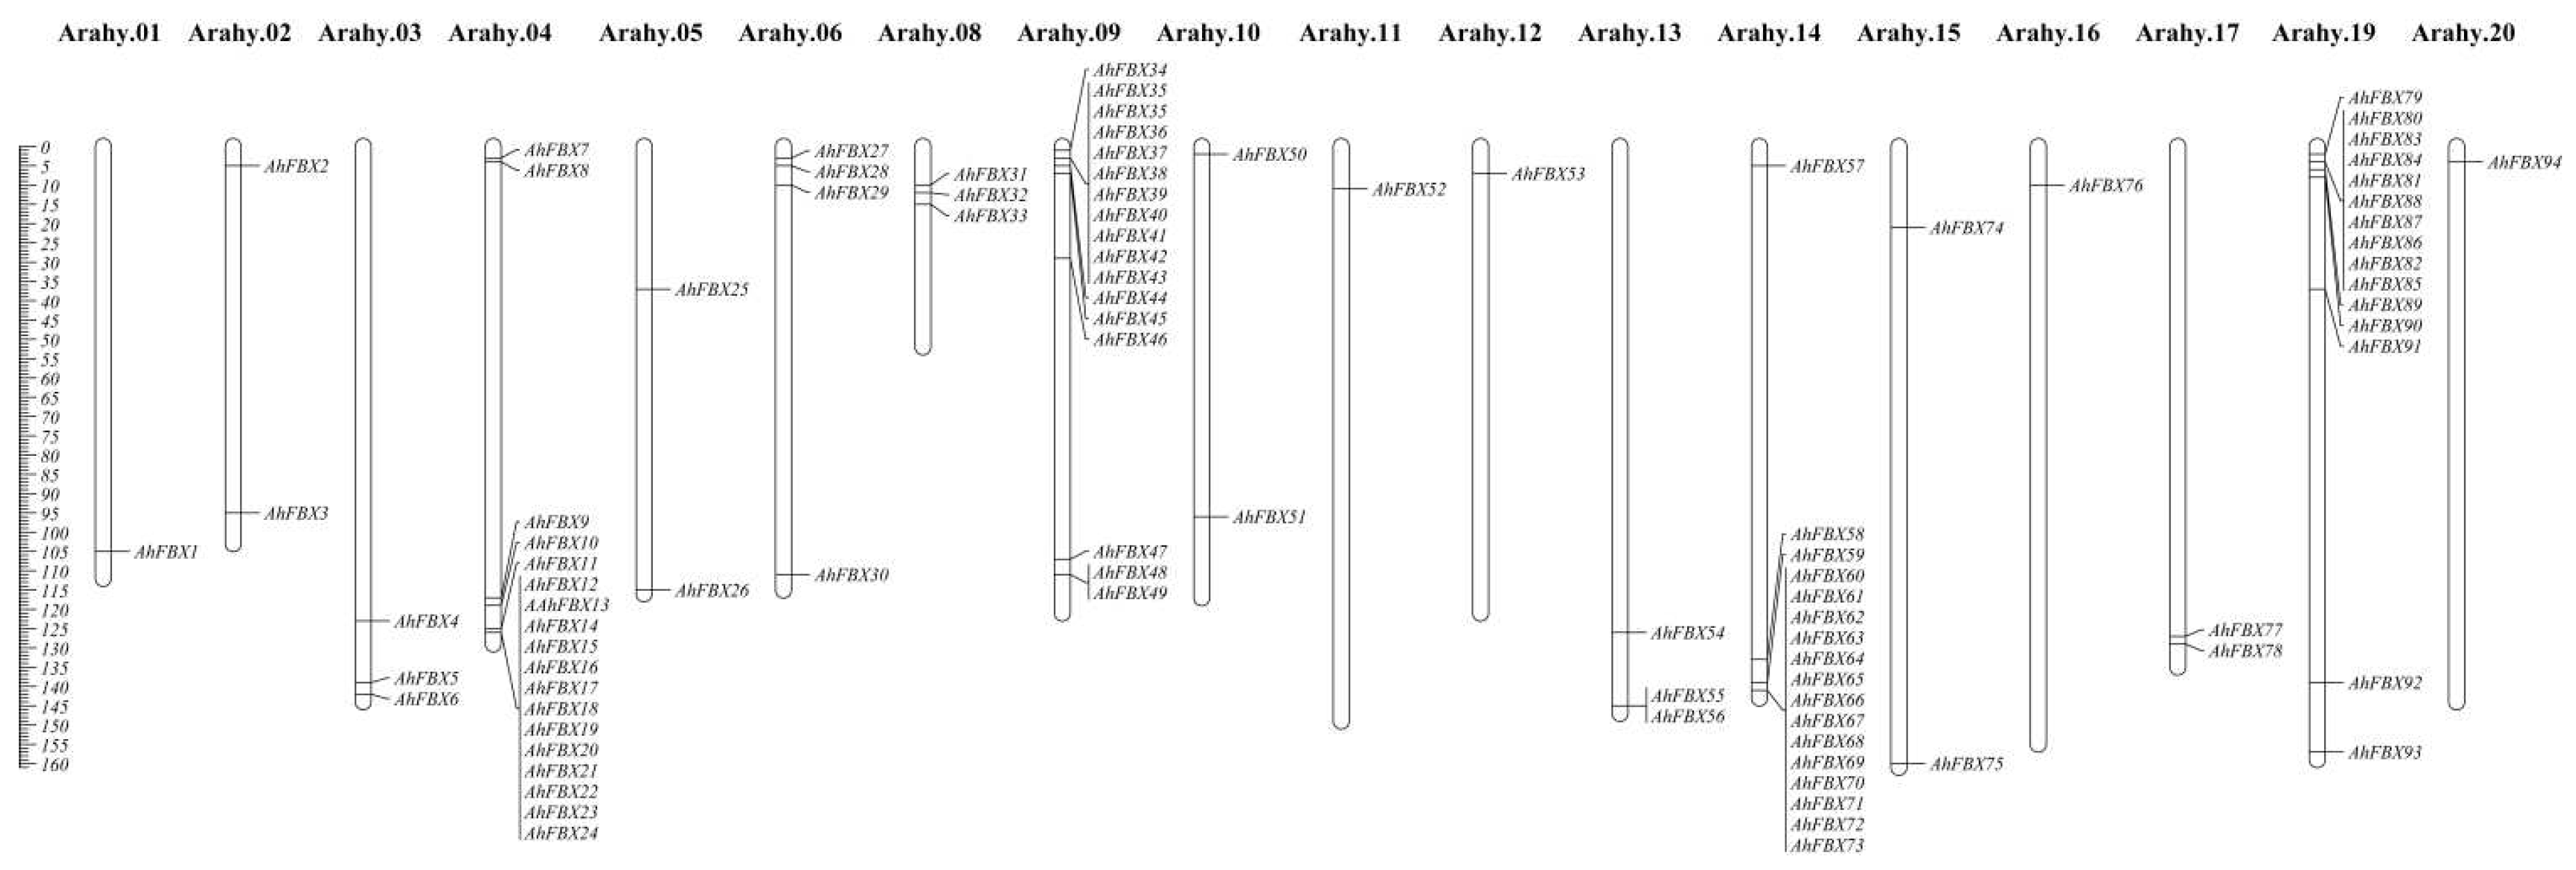
Figure 1. Chromosomes locations of AhFBX genes in cultivated peanut. Left ruler indicated chromosome length with Mb unit.
Preprints 97004 g001
Figure 2. Phylogenetic tree and subfamilies of AhFBX proteins. A. Phylogenetic tree of Arabidopsis thaliana and Arachis hypogaea. B. Eight subfamilies of F-box protein in peanut.
Preprints 97004 g002
Figure 3. Conserved motifs, gene structure and cis–elements of promotor region in AhFBXs. A. Conserved motifs and gene structure of AhFBXs. B. Different numerical value represents the number of components involved in hormonal response elements, development–related elements and stress–related elements.
Preprints 97004 g003
Figure 4. Collinearity plots in inter–species and intra–species, and Ka/Ks ratio of AhFBXs in peanut. A: Red line represented the AhFBX genes in colinear blocks between Arachis hypogaea and its diploid progenitors. B: Red line represents the AhFBX genes in colinear blocks in Arachis hypogaea. C: Ka/Ks ratio of duplicated AhFBX gene pairs in peanut.
Preprints 97004 g004
Figure 5. Expression patterns of F-box genes in 22 different of cv. Tifrunner. The red and blue colors indicated the up-regulated expression and down-regulated expression values, respectively.
Preprints 97004 g005
Figure 6. Expression patterns and correlation analysis of AhFBXs by qRT-PCR and FPKM. The red bar diagram represented expression pattern during the lateral branches developments of JH5. The blue bar diagram showed expression pattern during the lateral branches developments of M130. The line chart exhibited the FPKM values of AhFBX DEGs. The left and right Y axes of the bar diagram indicated the relative expression levels and the FPKM values of DEGs, respectively. The X and Y axes of the linear regression plot showed the relative expression levels of qRT-PCR and the FPKM values of transcriptomic data, respectively.
Preprints 97004 g006
Disclaimer/Publisher’s Note: The statements, opinions and data contained in all publications are solely those of the individual author(s) and contributor(s) and not of MDPI and/or the editor(s). MDPI and/or the editor(s) disclaim responsibility for any injury to people or property resulting from any ideas, methods, instructions or products referred to in the content.
Copyright: This open access article is published under a Creative Commons CC BY 4.0 license, which permit the free download, distribution, and reuse, provided that the author and preprint are cited in any reuse.
Prerpints.org logo

Preprints.org is a free preprint server supported by MDPI in Basel, Switzerland.

Subscribe

© 2024 MDPI (Basel, Switzerland) unless otherwise stated