
Submitted:
22 January 2024
Posted:
23 January 2024
You are already at the latest version
Abstract
Cancer, a globally prevalent and often deadly disease, holds promise for improved treatment through the integration of innovative medical technologies and interdisciplinary collaborations. Despite advancements, current cancer therapies lack a specific focus on addressing recurrence and targeting cancer stem cells (CSCs), known contributors to relapse. In this study, we utilized three types of cancer cells and generated three types of CSCs derived from them to conduct proteomic analysis and identified shared cell surface biomarkers as potential targets for a comprehensive treatment strategy. The selected biomarkers underwent evaluation through shRNA treatment, revealing contrasting functions in cancer and CSCs. Knocking down the identified protein showed promising results in regulating epithelial-mesenchymal transition (EMT) and stemness via the ERK signaling pathway. This led to a reduction in resistance to anticancer agents, ultimately enhancing the overall anticancer effects. Additionally, the biomarker's significance in clinical patient outcomes was confirmed using bioinformatics. Our study suggests a novel cancer treatment strategy that addresses existing limitations in current anticancer therapies.
Keywords:
Cancer
; Cancer Stem Cells
; Proteomic analysis
; New Biomarkers
; Dualistic effect
1. Introduction
Cancer is a common and prevalent global disease, accounting for approximately 25% of all deaths in most developed countries, making it the leading cause of death [1,2]. Cancer is characterized by its ability to invade and metastasize to other tissues or organs, making it difficult to cure [3]. Cancer-derived stem cells (CSCs), one of the intricate factors in cancer treatment, constitute a small population within cancer cells. This population accounts for 1-2% of cancer tissue and plays a pivotal role in cancer recurrence post-treatment.
Cancer stem cells, akin to normal stem cells, exhibit self-renewal and differentiation capabilities. However, unlike normal stem cells, they possess the ability to initiate tumor formation (tumorigenicity), propagate tumors throughout the body, and undergo unlimited self-renewal [4,5]. Typically existing in a dormant state, CSCs demonstrate resistance to anticancer drugs, posing a formidable obstacle in their eradication during cancer therapy and significantly contributing to cancer relapse and metastasis [6]. Consequently, comprehensive cancer treatment requires the targeted removal of both cancer cells and CSCs.
In recent years, research on targeted cancer therapies against CSCs has become increasingly active, complementing conventional surgical procedures, radiation therapy, and chemotherapy [7]. Nevertheless, challenges persist due to the involvement of CSCs in diverse signaling pathways, limited knowledge regarding substances targeting this small CSCs population, and the high resistance of these cells to anticancer agents [8].
To overcome these limitations, a new approach to cancer treatment is required. Recent research suggests that early cancer detection and appropriate treatment can substantially enhance the 5-year survival rate by over 80 - 90%. Early diagnosis also facilitates more feasible treatment options and interventions [9,10]. Therefore, the discovery of biomarkers using various omics-based analysis techniques for early cancer detection has emerged as a new technological advancement in cancer research [11,12].
New or novel biomarkers, indicative of physiological changes based on substances like DNA, RNA, and proteins within the human body, are being utilized as substances for prognostic confirmation after disease treatment or for the diagnosis of early-stage diseases [13]. However, due to the heterogeneous nature of cancer, discovering new markers is challenging. Therefore, overcoming the variability in treatment effectiveness due to genetic differences and simultaneously treating various types of cancer and CSCs with a single or combination therapeutic approach necessitates the development of innovative cancer therapeutics.
To address this, we applied proteomic analysis techniques to identify common new biomarker in the cell surface of lung cancer, liver cancer, breast cancer and each cancer cells-derived CSCs. These types of cancer are expected to increase in incidence due to factors such as the growing prevalence of lung cancer caused by the recent pandemic, the escalating worldwide prevalence of obesity, attributed to the abundance of food, is associated with an increasing number of liver cancer patients, and the consistently high incidence and mortality rate of breast cancer in women [14,15,16]. The goal of this research is to utilize proteomic analysis techniques for the discovery of novel biomarkers in both cancer and CSCs. Simultaneously, the aim is to evaluate the biological functions performed by this biomarker within each cell and assess its potential as novel biomarkers.
2. Results
2.1. Expression of PRKAR1A in transcriptomic level of various cell lines
To discover novel cell surface biomarker, proteomic analysis was conducted on a total of 6 different cell types to identify common biomarkers expressed in 3 types of cancer cells and CSCs, respectively. The proteomic analysis resulted in the examination of a total of 7,243 proteins, with a focus on 4,812 cell surface proteins, considering their potential as target substances and diagnostic biomarkers.
From the selected 4,812 proteins, 427 (8.9%) were consistently highly expressed in lung cancer, liver cancer, and breast cancer cells (Figure 1A). Among these, protein kinase cAMP-dependent type Ⅰ regulatory subunit alpha (PRKAR1A) emerged as a top-ranking candidate with potential applications as a diagnostic and therapeutic agent in cancer, given its lack of prior exploration in the literature. This gene associated with inducing carney complex (CNC) when mutated has unclear functions in cancer according to existing research [17]. Nexy, to validate the expression levels of PRKAR1A in cancer cells and CSCs, RNA was extracted from each cell type, synthesized cDNA, and performed conventional PCR to confirm the expression in transcriptomic level (Figure 1B). The cell lines used included human lung cancer cells A549, lung cancer stem cells (LCSC) derived from A549, human liver cancer cells Huh7, liver cancer stem cells (LiCSC) derived from Huh7, human breast cancer cells MCF7, and breast cancer stem cells (BCSC) derived from MCF7. Additionally, Umbilical cord blood-derived mesenchymal stem cells (UCB-MSC) were used as control cells of the cell lines used to compare the expression of PRKAR1A.
As shown in Figure 1B results, PRKAR1A was not expressed as control cell UCB-MSC; however, consistent with the proteomic analysis results, PRKAR1A was commonly expressed in cancer cells and CSCs. Qunatitative data of the detected band of PRKAR1A also showed a similar tedency as shown in Figure 1B (Figure 1C). These results mean thatPRKAR1A is expressed in cancerous cell lines compared to non-cancer cell line.
2.2. Efficient shRNA selection for biological functional assessment of PRKAR1A
To assess the biological functions of PRKAR1A in cancer cells and CSCs, we generated a series of short hairpin RNAs (shRNA) to downregulate PRKAR1A expression in each cell line. Initially, to select best effective shRNA, cells were transfected with a PRKAR1A-targeting shRNA series co-expressing GFP in vector was confirmed. The consistent expression of GFP across all transfected cells verified the successful transfection of shRNA (Figure S1). RNA was then extracted from the cells transfected with shRNAs, cDNA was synthesized, and the shRNA that most effectively knocked-down PRKAR1A gene expression was selected. In all 6 cell lines, shRNA-PRKAR1A C (referred to as shC) demonstrated effectiveness, consistently reducing the expression of PRKAR1A (Figure 2A,B). Similar to the results was observed from quantitative data of the detected PCR band of (Figure 2C,D). Based on this result,
2.3. Biological functional asessment through PRKAR1A knockdowned using shRNA
Next, we assessed the impact of PRKAR1A gene knockdown on biological functions of both cancer cells and CSCs using shRNA. While this protein is known to regulate the cAMP signaling pathway, Its function in cancer cells not well-understood [17,18,19,20,21]. To address the functions, we evaluated the impact of shRNA-mediated knockdown of the PRKAR1A gene on the cell’s proliferation and migration abilities.
In cell proliferation assay, a fundamental assessment of cellular proliferation [22], the downregulation of PRKAR1A led to increased cell proliferation in all cancer cells tested (Figure 3A), but decreased it in CSCs (Figure 3B) in time dependent manner. Long-term cell growth, division, and replication capabilities were further examined through the colony formation assay (CFA). In cancer cells, colonies were more abundant in the shC-treated group (Figure 4A), whereas in CSCs, colonies were fewer in the shC-treated group compared with those cancer cells (Figure 4B). Quantitative analysis of crystal violet staining at 570 nm absorbance supported these trends (Figure 4C-D).
The altered cell proliferation rate in each cell is considered to be influenced by changes in proteins associated with the cell cycle. Therefore, we observed changes in the protein cyclin D1 associated with cell cycle [23,24]. For this, the expression of cyclin D1 in transcriptomic level and a flow cytometry-based cell cycle analysis were conducted. As shown in the results of Figure 5A-B, when treated with shC, cyclin D1 expression at transcriptomic level increased in cancer cells, decreased in CSCs. Quantitative data of the detected band also showed a similar tendency as shown in Figure 5A-B (Figure 5C-D). This revealed that PRKAR1A regulates cyclin D1 expression in the G1 phase of cell cycle. Subsequent cell cycle analysis demonstrated changes in the S phase, with an increase in S phase in cancer cells, along with a decrease in the G1 and G2 phases (Figure S2A). In CSCs, the decrease in cyclin D1 induced a reduction in the S phase and an increase in the G1 and G2 phases (Figure S2B). Cyclin D1 expression was quantified relative to GAPDH values (Figure 5C-D), and cell cycle data were graphically represented for each phase (Figure 5E-F). Taken together, these results mean that PRKAR1A regulates entry into the S phase of the cell cycle, inversely affecting cell proliferation in cancer cells and CSCs.
Given PRKAR1A’s differential impact on cell migration in various cell types [21], we examined its role in cancer cells and CSCs through a scratch assay. In cancer cells, cell migration was significantly increased in cells treated with shC at 12 h compared to the control group at 0 h (Figure 6A). However, in CSCs, an opposite trend was observed (Figure 6B). Quantitative analysis of scratch width using Image J confirmed these observations (Figure 6C-D).
In summary, our findings demonstrate that the downregulation of PRKAR1A increases cell proliferation in cancer cells but decreased it in CSCs, and induced the enhanced cell migration in cancer cells while suppressing it in CSCs.
2.4. Regulation of Functionality via the ERK Signaling Pathway and EMT change
Next, we evaluated how the observed results are induced the activation of intracellular signaling pathways. To address this, we focused on the representative signaling pathway, ERK, which is associated with many intracellular functions.
Extracellular signal-regulated kinase (ERK) signaling pathway is a critical mechanism involved in various cellular functions, such as cell proliferation, migration, differentiation, cell cycle regulation, and apoptosis [25]. Additionally, it plays a significant role in tumor formation and the malignant progression of cancer [26,27], particularly through the epithelial-mesenchymal transition (EMT) [28]. Building on our previous data confirming that PRKAR1A regulates cell proliferation and migration, we sought to determine whether these effects associated with ERK phosphorylation in the ERK signaling pathway. To confirm whether PRKAR1A expression mediates the ERK signaling pathway, we evaluated the phosphorylation level of ERK (p-ERK) when shRNA was treated using an ERK inhibitor (PD98059). PD98059 is a known inhibitor of the mitogen-activated protein kinase (MAPK) pathway, specifically recognized for its impact on ERK inhibition, affecting cellular processes like survival, growth, differentiation, and metabolism [29].
Following 48 h of shC transfection to downregulate PRKAR1A expression, as shown in the result of Figure 7, the change of p-ERK protein expression was observed in the cell treated with shC compared with those of control groups. In the case of cancer cells, p-ERK expression increased when treated with shC, while decreased in CSCs (Figure 7A-B). On the other hand, when the ERK inhibitor PD98059 was treated, no changes in p-ERK were observed in any of the groups. This result suggests that, quantification of p-ERK expression using β-actin was similar with the observed western band (Figure 7C-D). These results mean that PRKAR1A regulates cellular biological functions via the ERK signaling pathway.
We examined alterations in the characteristic features of EMT in cancer cells with respect to the regulation of ERK phosphorylation by PRKAR1A shRNA. EMT represents a reversible cellular program that transitions cell from an epithelial (E) state to a more mesenchymal (M) state, with the potential for cells in the M state to revert to the E state through Mesenchymal-Epithelial Transition (MET) [30]. EMT plays a crucial role in embryonic development, wound healing, and cancer progression, with reported influences on the activity of the ERK signaling pathway [31]. It is imperative to investigate whether PRKAR1A, through regulated ERK phosphorylation, impacts EMT and, ultimately, stemness. Moreover, during EMT, the expression of specific genes associated with stemness, such as sox2, oct4, and nanog, can be regulated [32], potentially enhancing stem cell characteristics, cellular motility, and invasiveness. EMT is well-known for its involvement in the mechanisms related to cancer invasion and metastasis, contributing to the formation of CSCs with stem cell properties in the early stages of tumorigenesis [32,33,34].
In cancer cells treated with shC, the expression of the epithelial E-cadherin decreased and the mesenchymal markers N-cadherin, snail, slug, and vimentin increased (Figure 8A) in transcriptomic levels. In cancer stem cells, the observations were opposite to those in cancer cells (Figure 8B). The expression of these marker was quantified relative to GAPDH (Figure 8C-D). This trend was also observed at the protein level when PRKAR1A was knock-downed, showing a similar pattern (Figure 8E-F).
Regarding EMT changes, we next observed changes in biomarkers related to stemness in cancer cells and CSCs, such as sox2, oct4, and nanog genes associated with stem cell characteristics [31,32,33,34]. In cancer cells, stemness biomarker expression increased (Figure 9A), whereas in CSCs, it decreased (Figure 9B). Quantification of each stemness biomarker’s expression relative to GAPDH supported these findings (Figure 9C-D).
These results demonstrate that PRKAR1A can regulate both EMT and stemness through the ERK signaling pathway, thereby orchestrating distinct regulatory patterns in biological functions between cancer cells and CSCs with opposing effects.
2.5. Enhanced sensitivity against anticancer agent by PRKAR1A downregulation
CSCs are well known for its inherent resistance to anticancer agents [6]. This phenomenon intricately related to their acquisition of EMT and stemness functions. We evaluated how the downregulatio of PRKAR1A influences resistance to anticancer drugs.
The anticancer drug used was doxorubicin (referred as DOX), and as shown in Figure 10 (upper and lower panel), it was confirmed that the cytotoxic effect on cancer cells and CSCs increased with the increasing concentration of the anticancer drug. Furthermmore, as mentioned earlier, it was observed that tesistance to the drug appeared more in CSCs than in cancer cells. However, when PRKAR1A shRNA was treated, it was confirmed that the cnacer cell killing effect decreased (Figure 10A), and rather, in the case of CSCs, it was observed that cytotoxicity against CSCs increased in agent concentration-dependent manner (Figure 10B).
To validate the cell-killing effects induced by DOX, apoptosis assays were conducted using flow cytometry. A DOX concentration of 2 µM, determined by cell viability, was employed for cancer cells, while CSCs were treated with 4 µM concentration. Figure 11A illustrates that shC+DOX treatment resulted in the decreased cell death compared to other groups in cancer cells. In contrast, the shC+DOX group in CSCs exhibited increased cell death, consistent with the results of Figure 10 (Figure 11B).
In summary, these results suggest that the downregulation of PRKAR1A expression induces the increased resistance to anticancer agents, leading to the enhanced cancer cell killing effects. Conversely, in CSCs, it induces reducing resistance to anticancer treatments.
2.6. The reduction of drug resistance ability by PRKAR1A shRNA
In the previous findings, PRKAR1A knock-down demonstrated increased sensitivity to anticancer drug, resulting in enhanced cell-killing effects against CSCs. We extended our investigation to evaluate the impact of PRKAR1A knock-down on the cell-killing effects of cancer cells that are resistant to anticancer agents. For this, cells were subjected to repeated treatments with 2 µM DOX three times every 48 h to generate drug-resistant cells. Subsequently, these cells were transfected with shPRKAR1A and treated with DOX at concentrations of 0, 1, 2, 4, and 5 µM for 24 h.
Firstly, to confirm whether cells exposed to DOX indeed acquired resistance to anticancer drugs, we observed the expression pattern of the multidrug resistance 1 (MDR1) gene (Figure S3, and Figure 12A-D). After treating cells that had developed resistance to anticancer drug with shRNA, we evaluated how the cytotoxic effect on cancer cells changed when the anticancer drug was treated. In the results of Figure 12E-F, the increased cell survival rates were observed in drug-resistant cells compared to non-resistant cells after anticancer drug treatment. For example, in the case of A549 treated with 4 µM as shown in Figure 10A, it exhibited a 66.4% survival rate. However, after undergoing the drug resistnace process, the resluts of the same concentration treatment in Figure 12E showend a 82.5% improvement in survival rate, indicating heightened chemoresistance in the drug-resistant cells. Notably, shC treatment led to significantly increased cell survival rates in cancer cells. On the other hand, in CSCs, cells with acquired drug resistance exhibited increased cell survival rates when treated with doxorubicin, but shC led to decreased cell survival rates (Figure 12F). These results indicate that PRKAR1A can enhance the killing effect on drug-resistant cells by modulating the expression of MDR1.
2.7. The Bioinformatic sruvival data according to PRKAR1A expression in cancer patients
Based on the previous research results, we evaluated that PRKAR1A exerts its effects on cells in different patterns in both cancer and cancer stem cells. Next, we applied bioinformatics techniques to analyze whether this gene could be applied as a diagnostic marker in actual cancer patients and compared survival rate in cancer patients from The Cancer Genome Atlas (TCGA). In the clinical results, PRKAR1A expression was confirmed across various cancer types, including lung adenocarcinoma (LUAD), lung squamous cell carcinoma (LUSC), liver hepatocellular carcinoma (LIHC), and breast cancer (BRAC) (Figure 13). Although the expression of PRKAR1A was not consistently high in analyzed cancer patients, it was observed to be highly expressed in LIHC patients (Figure 13A).
However, when PRKAR1A was overexpressed in all tested cancer types, it was observed thath the survival period started to decrase significantly compared to patients with low expression at a specific time point (Figure 13B). This indicates that theexpression of PRKAR1A is associated with differences in the survival rates of patiens. Further research is required to elucidate the influence of diminished PRKAR1A expression on the aggressiveness of cancer. Nevertheless, an analysis of overall survival based on PRKAR1A expression revealed a consistent trend.
3. Discussion
The global rise in cancer, a perilous disease with high incidence and mortality rates worldwide, has sparked increased attention towards cancer therapy, leading to active research across various fields [1,2]. Despite these efforts, current research has not fully addressed the inherent challenges associated with cancer, including the difficulty in achieving complete cures, targeting cancer stem cells, and diagnose multiple types of cancer simultaneously [4,5,6,13]. Furthermore, cancer treatments often come with significant side effects, such as the acute or chronic toxicity of anticancer drugs, the inability to exclusively target tumors (posing a risk of attacking normal cells), and the induction of immune responses [7]. To overcome these limitations, this study aimed to conduct a proteomic analysis to identify cell surface biomarkers that are commonly expressed in various cancer types. These biomarkers hold the potential to serve as both diagnostic tools and therapeutic agents for diverse cancer.
In this study, we targeted three specific types of cancer based on their anticipated high future incidence, consistently elevated mortality rates, and the associated treatment challenges. Firstly, we chose lung cancer, driven by the escalating number of patients post-COVID-19 complications and its substantial mortality rates across both genders [14]. Secondly, liver cancer was included in our study, recognizing its rising incidence associated with the growing prevalence of obesity and irregular lifestyle choices [15]. Lastly, we focused on breast cancer, a leading cause of high incidence rates among women, characterized by its challenging treatment dynamics due to frequent metastasis and the presence of significant lymph nodes in the vicinity [16]. By concentrating on the development of biomarkers specific to lung, liver, and breast cancers, as well as exploring cancer-derived CSCs as potential candidates for anticancer treatment and diagnosis, our study aims to contribute valuable insights that can pave the way for more effective and targeted interventions in the battle against these challenging malignancies.
For this, we initiated a proteomic analysis to identify new biomarker proteins in lung cancer, liver cancer, breast cancer cells and each cancer-derived CSCs (Figure 1) We have selected the protein PRKAR1A, which is expressed on the cell surface, as a potential biomarker for future use as a diagnostic marker and as a target molecule for developing new drugs. Through this, we have identified PRKAR1A as an effective substance. This protein subunit encoded by the PKA gene and a part of the cAMP-dependent protein kinase A [17], emerged as a candidate biomarker. However, surprisingly, there is not much research on this protein, and there is almost no functional study in CSCs.
Despite the recognized role of cAMP in regulating various metabolic processes, including cell proliferation, differentiation, and apoptosis, the specific influence of PRKAR1A on cancer remains inadequately studied, with conflicting results within existing research on different cancer types [17,18,19,20,21]. To elucidate the biological function of PRKAR1A, we generated a series of shRNA, with shC identified as the most effective in all cells (Figure 2).
Our subsequent assessment of PRKAR1A’s impact on cancer cells and CSCs focused on key features of cancer growth and metastasis [3,22,37], including short-term cell proliferation and long-term colony formation, both regulated by PRKAR1A in opposite directions between cancer cells and CSCs (Figure 3,4). Understanding the opposing trends induced by PRKAR1A involved examining the alterations in the cell cycle based on cyclin D1 expression (Figure 5). Cyclin D1, a crucial cell cycle regulator often overexpressed in cancer, plays a role in promoting entry into the S phase and to cancer growth [23,24]. Downregulation of PRKAR1A increased cyclin D1 expression and the S-phase of the cell cycle in cancer cells, while in CSCs, it decreased cyclin D1 expression, shortening the S-phase. This clearly indicates that PRKAR1A is likely associated with signaling pathways related to the cell cycle. Further evaluation of another major cancer characteristic, cell mobility [3,37], through a migration assay demonstrated that downregulation of PRKAR1A increased the migration of cancer cells but decreased the migration of CSCs (Figure 6). These findings suggest that PRKAR1A regulates the biological functions of cancer cells and CSCs in opposite directions.
In elucidating the fundamental biological functions mediating these opposing roles in cancer and cancer stem cells, we considered the ERK pathway in cell signaling. This signal is a key pathway associated with cancer-related processes, such as cell proliferation, migration, and apoptosis [25,26,27]. Moreover, ERK phosphorylation is known to have a strong connection with the epithelial-mesenchymal transition (EMT) [28]. EMT is a process in which cells lose cell-cell adhesion, gain mobility and invasiveness, and transform into mesenchymal-like stem cells, with the ability to reversibly transition between epithelial and mesenchymal states [30]. Given its implications in cancer malignancy, anticancer drug resistance, EMT is a crucial and well-recognized mechanism in cancer research [38]. Furthermore, EMT is associated with the acquisition of stemness, a feature attributed to stem cells, characterized by their ability to self-replicate and differentiate into various cell types [31,32,33]. Well-known stemness markers include Sox2 (sex determining region Y-box 2), Oct4 (octamer-binding transcription factor 4), and Nanog (Nanog homeobox), which are known to be highly expressed specifically in CSCs [39]. It is also well known that these stemness markers are highly expressed in various types of cancer, including lung cancer, liver cancer, and breast cancer [40,41]. They are closely associated with cancer initiation, recurrence, increased invasiveness into other tissues or organs due to enhanced EMT, resistance to multiple anticancer drugs, and poor prognosis [42,43,44]. Several mechanisms regulate stemness, including the Wnt/β-catenin pathway, Notch pathway, JAK/STAT pathway, and PI3K/AKT/mTOR pathway [39]. However, research on whether the ERK pathway regulates stemness remains limited. Therefore, we assessed whether PRKAR1A induces changes in biological functions, EMT, and the stemness abilities of cells through the ERK signaling pathway, and we confirmed this.
The results showed that p-ERK expression was increased in cancer cells and decreased in CSCs. Moreover, when treated with the ERK inhibitor PD98059, there was no observed change in the p-ERK, indicating that PRKAR1A can directly regulate the phosphorylation of ERK [29] (Figure 7). We further examined the reversible changes in the EMT mechanism due to the ERK phosphorylation by assessing the expression of specific epithelial (E) marker and mesenchymal (M) markers. In cancer cells, the ERK phosphorylation induced EMT, while in CSCs, it led to MET (Figure 8). The associated changes in stemness markers (Figure 9) indicated that PRKAR1A regulates EMT and stemness through the ERK signaling pathway.
A successful approach in treating cancer involves early detection and removal through conventional therapy. However, over time, drug resistance increases, and further anticancer treatments become less effective. Considering the implications of EMT and stemness on chemoresistance [40,41,42,43,44], we explored their role in cancer cells and CSCs treated with the chemotherapeutic agent DOX (Figure 10 and 11). Downregulation of PRKAR1A reduced chemoresistance in CSCs, increasing cell death. The results collectively provide evidence that PRKAR1A can regulate cell chemoresistance.
To further investigate whether decreased PRKAR1A levels can reduce chemoresistance in cells with inherent drug resistance, we generated drug-resistant cancer cell lines and CSCs. The results mirrored those from Figure 10, suggesting that PRKAR1A can overcome chemoresistance even in cells with inherent drug resistance (Figure 12). Confirmation through the downregulation of the drug-resistant gene MDR1 emphasized PRKAR1A’s role in inducing chemoresistance in both cancer cells and CSCs through the regulation of MDR1 expression. MDR1, also known as ABCB1 (ATP-binding cassette transporter C1), is well-known for its role in transporting various therapeutic agents, including doxorubicin, methotrexate, edatrexate, daunorubicin, and others, out of the cell membrane, thereby regulating chemoresistance. It is particularly abundant in chemoresistant CSCs [34,35]. When we compared the expression of MDR1 between drug-resistant cell lines and regular cell lines, higher MDR1 expression in the drug-resistant cell lines was observed. Furthermore, the baseline expression of MDR1 was higher in CSCs compared to cancer cells. These results align with reports indicating that CSCs possess higher resistance to anticancer agents than cancer cells. Decreased expression of PRKAR1A in cancer cells led to increased MDR1 expression in both drug-resistant cell lines and regular cell lines. In contrast, in drug-resistant CSCs and regular CSCs cell lines, downregulation of PRKAR1A resulted in reduced MDR1 expression. This means that PRKAR1A can induce chemoresistance in both cancer cells and CSCs through the regulation of MDR1 expression.
The evaluation of PRKAR1A expression in actual cancer patients using The Cancer Genome Atlas (TCGA) revealed lower expression in LUAD, LUSC, and BRCA compared to normal individuals, with significantly elevated levels in LIHC. However, high PRKAR1A expression consistently correlated with lower survival rates compared with when it is expressed ay low levels (Figure 13). Of course, there are many variables, such as patient’s age, cancer grade, and previous treatment methods, to consider in this analysis, and further research is needed in the future. Nevertheless, these findings highlight the complex role of PRKAR1A in cancer prognosis and emphasize the importance of tailored analyses for different cancer types in biomarker development. Furthermore, an analysis of overall survival based on PRKAR1A expression revealed a consistent trend.
Taken together, there is a growing interest in the discovery of biomarkers that can potentially offer new directions for anticancer treatments to address the continually rising incidence and mortality rates of cancer [12,13]. In accordance with these research trends, this study focused on the discovery and validation of novel biomarkers with broad applicability across various cancer types. PRKAR1A, identified through proteomic analysis, emerged as a promising cell surface-expressed biomarker capable of regulating cancer biological functions, EMT, and stemness through ERK signaling pathway consequently diminishing the cell-killing effects associated with resistance to anticancer agents. Targeting PRKAR1A could offer a strategic approach to overcome conventional cancer treatment limitations and pave the way for new therapeutic directions.
4. Materials and Methods
4.1. Cell Culture
4.1.1. Cancer cells
The cell lines A549 (human lung cancer cell), Huh7 (human liver cancer cell), MCF7 (human breast cancer cell) and UCB-MSC (umbilical cord blood-derived mesenchymal stem cell) were all purchased from the American Type Culture Collection (ATCC, VA, USA). A549 and Huh7 cell lines were cultured in Dulbecco’s Modified Eagle’s Medium (DMEM) (Hyclone, UT, USA) containing 10% fetal bovine serum (FBS) (Hyclone, UT, USA) and 1% penicillin-streptomycin (PS) (Hyclone, UT, USA). MCF7 cells were cultured in RPMI 1640 Medium (Welgene, Gyeongsangbuk-do, South Korea) containing 10% FBS and 1% PS. UCB-MSC cells were cultured in stem cell conditioned basal medium of KSB-3 (Kangstem Biotech, Seoul, South Korea) and added to KSB-3 supplements with 10% FBS. All cell cultures were incubated at 37℃ in a humidified incubator with 5% CO2.
4.1.2. Cancer Stem Cells (CSCs)
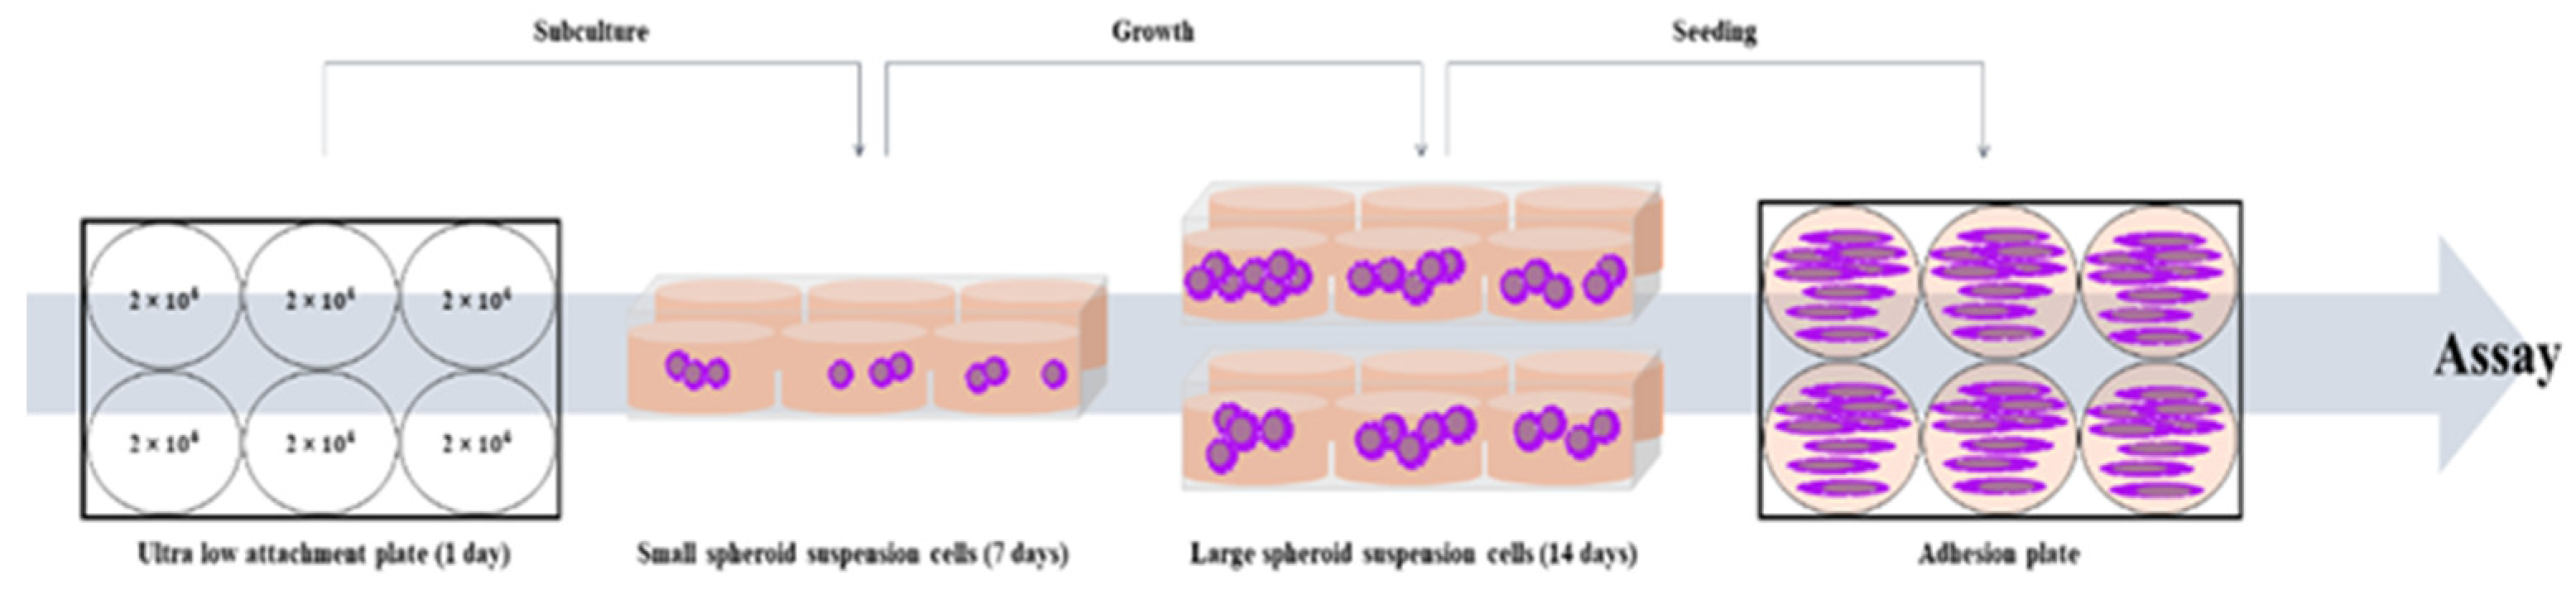
The cell lines Lung cancer-derived stem cell (LCSC), Liver cancer-derived stem cell (LiCSC), and Breast cancer-derived stem cell (BCSC) were cultured in DMEM/F-12 Nutrient Mixture Ham (DMEM/F-12) (Welgene, Gyeongsan-si, Gueongsangbuk-do, Korea) containing 10% FBS, 1% PS, 5 µg/ml insulin (Invitrogen, CA, USA), 20 ng/ml EGF (Gibco), 20 ng/ml b-FGF (Gibco), 1% B27 (Invitrogen, CA, USA). The cancer cell lines were cultured in Costar® 6-well Clear Flat Bottom Ultra-Low Attachment Multiple Well Plates (Corning, NY, USA), with appropriate medium. Cancer cells were seeded at a density of 2 × 10⁴ cells/well to make CSCs. All CSCs were sub-cultured on the 7th day of culture and incubated for 2 weeks. All cell cultures were incubated at 37℃ in a humidified incubator with 5% CO2 [45].
Scheme 1.
The scheme of CSCs culture from cancer cells.
4.2. Mass spectometry analysis
The proteomic analysis from cancer cells and CSCs was conducted similarly to our previous paper [46]. In brief, the process involved: Cancer cells and CSCs were lysed in a 30 µL buffer at 4°C, and the resulting supernatant underwent tryptic digestion after centrifugation. Protein concentration was determined using the Coomassie Plus Assay Reagent. Lysate proteins were treated with DTT and IAA, followed by trypsin digestion. A cleanup with an MCX cartridge involved equilibration, washing, and elution steps using specific solutions. The eluate was dried, and peptides were either extracted with formic acid for LC injection or stored at -20°C before analysis. Samples underwent separation through online reversed-phase chromatography using Thermo Scientific equipment. This included an Easy nano LC II autosampler, peptide trap EASY-Column, and analytical EASY-Column. Electrospray ionization was performed with a nano-bore stainless steel online emitter. The chromatography system was coupled with an LTQ Velos Orbitrap mass spectrometer featuring an ETD source. A data-dependent switching mode was applied to enhance peptide fragmentation, and protein identification utilized Sorcerer 2 against the 2014 UniProt human DB. Set tolerances included 1.0 Da for fragment mass, 25 ppm for peptide mass, and a maximum of 2 missed cleavages. Result filters were applied, considering a minimum number of peptides per protein, with static and variable modifications. Processed datasets were transformed to .sf3 files using Scaffold 3 program.
4.3. RNA extraction and conventional polymerase chain reaction (PCR)
At 48 h post-transfection, the cells were harvested and total RNA was extracted according to the manufacturer’s manual using TRIzol (Invitrogen, CA, USA). Then, it was quantified by NanodropTM (Thermo Fisher Scientific, Waltham, MA, USA). The extracted RNA was converted into complementary DNA (cDNA) with 2X RT Pre-Mix (Solgent, Daejeon, South Korea). The synthesized cDNA was subjected to conventional PCR using a 2X Taq PCR Pre-Mix (Solgent, Daejeon, South Korea) according to the manufacturer’s protocols. All samples synthesized by conventional PCR were confirmed by separation through 2% agarose gel electrophoresis (Vivantis, Molecular Biology Grade, USA) in TAE buffer. Gel images were taken using a chemiluminescence detection system (VilberLourmat, Everhardzell, Germany). The primer sequences for performing PCR are as shown in Table 1.
4.4. Cell proliferation assay
Cancer cells were seeded onto 6-well plates at 1.5 × 10⁵ cells/well and CSCs were seeded onto 6-well plates at 2 × 10⁵ cells/well. Then shRNA series were transfected into each cell lines as described, and then 4 h later, cells were seeded in triplicate onto a 96-well plate at a density of 8 × 10³ cells/well. After 48 h, cell viability was measured by 3-(4,5-Dimethylthiazol-2-yl)-2,5-diphenyltetrazolium bromide (MTT assay) (Sigma, UK) depending on time to confirm cell proliferation. After removing the culture medium, 100 µl of MTT reagent (2 mg/ml) was added to each well and incubated at 37℃ in a CO2 incubator for 4 h. Following the incubation period, the MTT reagent was removed, and 100 µl of dimethyl sulfoxide (DMSO; Sigma-Aldrich, St. Louis, MO, USA) was added to each well to react with the generated formazan for 20 minutes. Absorbance was measured at 540 nm using a microplate reader (Versamax microplate reader, Associates of cape cod incorporated, MA, USA). Cell proliferation was compared relative to the 0 h time point.
4.5. Cell colony formation assay and crystal violet stain
Cancer cells and CSCs were seeded at 1 × 10³ cells/well onto 6-well plate with appropriate medium, and then incubated for 10 days. The cell culture medium was replaced every 2 days. When the visible colony appeared, the cells were washed three times in PBS. Next, the cells were fixed with methanol for 20 minutes and stained with 0.1% crystal violet solution for 15 minutes in the dark at room temperature. After staining and visually confirming the formation of colonies, crystal violet in the colonies was dissolved by 100% methanol. The dissolved crystal violet was then distributed into a 96-well plate with 100 µl in each well and measured for absorbance at 570 nm using a microplate reader (Versamax microplate reader, Associates of cape cod incorporated, MA, USA). The measured values were compared to untreated cells, which were considered as 100%, to assess the relative differences in the other samples.
4.6. Cell cycle assay by flow cytometry
Cancer cells and CSCs after transfected with shPRKAR1A for 48 h were collected and washed with cold PBS for three times. And then, cells were fixed with 70% ethanol at 4℃ for 2 h. After washing cold PBS for three times, the cells were stained with propidium iodide (PI) solution (Thermo Fisher Scientific, Waltham, MA, UAS) at 4℃ overnight. Cell cycles were analyzed with Novocyte Flow Cytometer (ACEA Bioscience Inc, San Diego, CA, USA).
4.7. Wound healing scratch assay
After transfection as described, cancer cells were seeded at 6 × 10⁴ cells/well and at 8 × 10⁴ cells/well for CSCs onto 24-well plates. When the confluence of cells prepared in each group reaches 80%, they were scraped to make it uniformly wide at regular internal with a 200 µl sterile pipette tip. The photographs were taken at 0 and 12 h after scratch creation with a microscope (Nikon eclipse Ts2R). The ratio of cell movement in the 12 h sample compared to the 0 h sample was quantitatively analyzed by the image J program.
4.8. Western blot analysis
The protein extraction was performed from groups subjected to transfection with shC for 48 h, followed by a 1 h treatment with PD98059 (R&D systems, Minneapolis, MN, USA) at a concentration of 15 µM, and compared with the group that did not receive the treatment. Samples were harvested and washed with cold PBS for 2 times. Cell pellets were lysed by using EzRIPA Lysis Kit (RIPA buffer and inhibitors) (DAWINBIO Inc., Gyeonggido, South Korea) for 15 minutes on ice. Lysates were centrifuged at 13,000 RPM for 15 minutes at 4℃, and protein supernatant was measured by using the BCA protein assay reagent (Thermo Fisher Scientific, Waltham, MA, UAS). Equal amounts of proteins (15 µg) were separated by 10% sodium dodecyl sulfate polyacrylamide gel electrophoresis (SDS-PAGE). The proteins were transferred onto Immobilon®-P PVDF membrane (Millipore Co., MA, USA) and blocked with 3% skim milk for 1 h. Then, the membranes were incubated with 3% skim milk containing primary antibodies at 4℃ overnight. The primary antibodies against β-actin (1:1000, sc-4778, Santa Cruz., CA, USA), E-cadherin (1:1000, 3195, Cell Signaling Technology (CST), Danvers, MA, USA), N-cadherin (1:500, 14215S, CST), p-ERK (1:1000, sc-7383, Santa Cruz.) were used. After incubation, the membranes were incubated for 1 h at room temperature with horse radish peroxidase (HRP) conjugated secondary antibody. For the detection of the secondary antibodies targeting β-actin, N-cadherin, and p-ERK, HRP-conjugated anti-mouse IgG antibody (1:10,000, 31430, Invitrogen, Carlsbad, CA) were used, whereas HRP-conjugated anti-rabbit IgG Antibody (1:10,000, 7074, CST) were used for capturing E-cadherin. The protein band were developed with a chemiluminescent ECL reagent (Thermo Fisher, Waltham, MA, USA) using an enhanced chemiluminescence detection system (VilberLourmat, Everhardzell, Germany). For all primary antibodies were normalized to β-actin. The quantification of protein bands was performed using Image J software.
4.9. Drug resistance assay
After the transfection as described, cancer cells and CSCs were seeded in a 96-well plate at a density of 8 × 10³ cells/well. Subsequently, the anti-cancer drug, doxorubicin (Doxorubicin hydrochloride; Sigma Chemical, St. Louis, MO, USA) was administered at concentrations of 1, 2, 4, and 5 µM for 24 h. Following treatment, the medium was replaced with fresh medium, allowing a 48 h recovery period for the cells. Subsequent MTT assay was conducted to measure cell viability. After media removal, 100 µl of MTT (Sigma) reagent was added and incubated for 4 h at 37℃. The formazan crystals formed by the cells were dissolved in DMSO (Sigma-Aldrich) and measured at 540 nm using VerxaMax (Microplate Reader, Molecular Devices, Sunnyvale, CA). The cells treated with different concentration of doxorubicin were quantitatively compared to the values of untreated cells, and the results were represented graphically.
4.10. Generation of chemoresistant cell lines
After treating the cells with the anti-cancer drug, doxorubicin, at a concentration of 2 µM for 24 h, a recovery period of 48 h was provided by changing to a fresh medium. This process was repeated three times, and then morphological changes of the surviving cells were examined using Zoe (Bio-Rad Laboratories, Hercules, California). Following the development of anti-cancer drug resistant in the cells, as described, shPRKAR1A was transfected. Subsequently, conventional PCR and MTT assays were conducted.
4.11. Apoptosis assay
Apoptosis was detected using the FITC-Annexin V Apoptosis Detection Kit 1 (BD, New Jersey, USA) according to the manufacturer’s protocol. Sample were harvested and washed twice with cold PBS and re-suspended in 1X binding buffer at a concentration of 1 × 10⁶ cells/ml. The cells were transferred to 100 µl of the solution (1 × 10⁵ cells/ml), 5 µl of FITC-Annexin V, and 5 µl propidium iodide (PI) were added to stain for 15 minutes in the dark at room temperature. Next, 400 µl of 1X binding buffer was added to each sample. Finally, apoptotic levels were analyzed by flow cytometry (Novo Cyte flow cytometer, ACEA Bioscience Inc., USA). Data were analyzed using Novoexpress software (ACEA Biosciences Inc., USA).
4.12. Data Acquisition and Preprocessing
Expression and survival data for lung adenocarcinoma (LUAD), lung squamous cell carcinoma (LUSC), liver hepatocellular carcinoma (LIHC), and breast invasive carcinoma (BRCA) were obtained from The Cancer Genome Atlas (TCGA) via the OncoDB database. The data were subjected to preprocessing, which included normalization of expression values and confirmation of data integrity. The final dataset consisted of normalized expression values for the PRKAR1A gene and corresponding patient survival information, including time-to-event and vital status.
4.13. Statistical Analysis of Expression Data
Differential expression analysis was performed to compare PRKAR1A expression levels between cancerous and normal tissue samples. For this purpose, a two-sample t-test was employed, assuming unequal variances. The t-test was conducted to ascertain the significance of expression differences for PRKAR1A between the cancer samples and matched normal controls.
4.14. Survival Analysis
Survival analysis was conducted to investigate the association between PRKAR1A expression levels and patient prognosis. Kaplan-Meier survival curves were plotted to visualize differences in survival probabilities between high and low PRKAR1A expression groups. The survival curves were compared using the log-rank test to evaluate the statistical significance of differences in survival times. The Cox proportional hazards model was utilized to estimate hazard ratios, providing a measure of the effect size of PRKAR1A expression on survival. The model was adjusted for potential confounders, including age, sex, and cancer stage. Hazard ratios with 95% confidence intervals were calculated to assess the relative risk of mortality associated with PRKAR1A expression levels. Differential expression analysis was performed to compare PRKAR1A expression levels between cancerous and normal tissue samples. For this purpose, a two-sample t-test was employed, assuming unequal variances. The t-test was conducted to ascertain the significance of expression differences for PRKAR1A between the cancer samples and matched normal controls.
4.15. Software
All statistical analyses were performed using R statistical software (version 3.6.3). The survival package was used for survival analyses, and the ggplot2 package was employed for generating boxplots and Kaplan-Meier plots. P-values of less than 0.05 were considered indicative of statistical significance.
4.16. Statistical Analysis
All experiments were performed at least three times repetitive experiments, and the measured data were calculated as mean ± standard error of the mean (SEM) and presented as a graph. The significance test between groups was analyzed by one-way ANOVA. Statistical differences were indicated in the figures. *P < 0.05, ** P <0.01, and *** P <0.001. For statistical analysis, SPSS statistics software for Windows, Version 18 (SPSS Inc., IL, USA) was used.
5. Conclusions
This study is the first report to evaluating the potential of newly discovered anticancer targeting biomarker as theragnotic molecules. Identified through proteomic analysis, this biomarker has the unique capability to target both cancer cells and CSCs derived from various cancer types. The study focuses on the identification of common biomarkers expressed on the surfaces of diverse cancer cells with the objective of simultaneously targeting cancer and CSCs. The identified biomarker, PRKAR1A, exhibited expression in both cancer cells and CSCs, showcasing its ability to regulate EMT and stemness through ERK signaling pathway. Additionally, PRKAR1A demonstrated the capacity to influence the sensitivity of cancer cells and CSCs to anticancer agents, thereby impacting their cell-killing effects. The clinical outcomes associated with elevated levels of PKRAR1A underscore its significance as an unfavorable prognostic factor in cancer, emphasizing the critical need for further research on PRKAR1A in the context of cancer. In conclusion, this study proposes PRKAR1A as a promising diagnostic and therapeutic marker for cancer, highlighting its functional role as a biomarker that could contribute to the development of novel strategies in anticancer treatments.
Supplementary Materials
Figure S1: Transfection efficiency and confirmation of shRNA series by GFP expression in cancer cells and cancer stem cells.; Figure S2: Cell cycle analysis by flow cytometry post-PRKAR1A shRNA treatment.; Figure S3: Cell bright image of generated drug-resistant cells.
Author Contributions
Investigation, writing-original draft preparation, and validation J-W B; bioinformatic analysis and data collection A-R N; data collection, analysis, and validation K-G K; Conception and design, data analysis, administrative support and final approval of manuscript P-H K.
Funding
This research was supported by Basic Science Research Program through the National Research Foundation of Korea (NRF) funded by the Ministry of Education. (2020R1F1A1053663).
Conflicts of Interest
The authors declare no conflicts of interest.
References
- Sung, H.; Ferlay, J.; Siegel, R.L.; Laversanne, M.; Soerjomataram, I.; Jemal, A.; Bray, F. Global cancer statistics 2020: GLOBOCAN estimates of incidence and mortality worldwide for 36 cancers in 185 countries. CA: a cancer journal for clinicians 2021, 71, 209–249. [Google Scholar] [CrossRef]
- Torre, L.A.; Siegel, R.L.; Ward, E.M.; Jemal, A. Global cancer incidence and mortality rates and trends—an update. Cancer epidemiology, biomarkers & prevention 2016, 25, 16–27. [Google Scholar] [CrossRef]
- Alieva, M.; van Rheenen, J.; Broekman, M.L. Potential impact of invasive surgical procedures on primary tumor growth and metastasis. Clin Exp Metastasis 2018, 35, 319–331. [Google Scholar] [CrossRef]
- Fang, X.; Yan, Q.; Liu, S.; Guan, X. Cancer stem cells in hepatocellular carcinoma: intrinsic and extrinsic molecular mechanisms in stemness regulation. International Journal of Molecular Sciences 2022, 23, 12327. [Google Scholar] [CrossRef]
- Aponte, P.M.; Caicedo, A. Stemness in cancer: stem cells, cancer stem cells, and their microenvironment. Stem cells international 2017. [Google Scholar] [CrossRef]
- Phi, L.T.H.; Sari, I.N.; Yang, Y.; Lee, S.; Jun, N.; Kim, K.S.; Lee, Y.K.; Kwon, H.Y. Cancer stem cells (CSCs) in drug resistance and their therapeutic implications in cancer treatment. Stem cells international 2018. [Google Scholar] [CrossRef]
- Schirrmacher, V. From chemotherapy to biological therapy: A review of novel concepts to reduce the side effects of systemic cancer treatment. Int J Oncol 2019, 54, 407–419. [Google Scholar] [CrossRef]
- Ranji, P.; Salmani Kesejini, T.; Saeedikhoo, S.; Alizadeh, A.M. Targeting cancer stem cell-specific markers and/or associated signaling pathways for overcoming cancer drug resistance. Tumor Biol 2016, 37, 13059–13075. [Google Scholar] [CrossRef]
- Hiom, S.C. Diagnosing cancer earlier: reviewing the evidence for improving cancer survival. Br J Cancer 2015, 112, 1. [Google Scholar] [CrossRef]
- Bradley, C.J.; Given, C.W.; Roberts, C. Disparities in cancer diagnosis and survival. Cancer 2001, 91, 178–188. [Google Scholar] [CrossRef]
- Raymond, A.C.; Gao, B.; Girard, L.; Minna, J.D.; Gomika Udugamasooriya, D. Unbiased peptoid combinatorial cell screen identifies plectin protein as a potential biomarker for lung cancer stem cells. Scientific reports 2019, 9, 14954. [Google Scholar] [CrossRef]
- Cao, D.; Li, Z.; Jiang, X.; Lum, Y.L.; Khin, E.; Lee, N.P.; Wu, G.; Luk, J.M. Osteopontin as potential biomarker and therapeutic target in gastric and liver cancers. World journal of gastroenterology: WJG 2012, 18, 3923. [Google Scholar] [CrossRef] [PubMed]
- Bensalah, K.; Montorsi, F.; Shariat, S.F. Challenges of cancer biomarker profiling. Eur Urol 2007, 52, 1601–1609. [Google Scholar] [CrossRef] [PubMed]
- Luo, J.; Rizvi, H.; Preeshagul, I.R.; Egger, J.V.; Hoyos, D.; Bandlamudi, C.; McCarthy, C.G.; Falcon, C.J.; Schoenfeld, A.J.; Arbour, K.C. COVID-19 in patients with lung cancer. Annals of Oncology 2020, 31, 1386–1396. [Google Scholar] [CrossRef] [PubMed]
- Zelber-Sagi, S.; Noureddin, M.; Shibolet, O. Lifestyle and hepatocellular carcinoma what is the evidence and prevention recommendations. Cancers 2021, 14, 103. [Google Scholar] [CrossRef] [PubMed]
- Medeiros, B.; Allan, A.L. Molecular mechanisms of breast cancer metastasis to the lung: clinical and experimental perspectives. International journal of molecular sciences 2019, 20, 2272. [Google Scholar] [CrossRef]
- Bossis, I.; Stratakis, C.A. Minireview: PRKAR1A: normal and abnormal functions. Endocrinology 2004, 145, 5452–5458. [Google Scholar] [CrossRef] [PubMed]
- Pitsava, G.; Stratakis, C.A.; Faucz, F.R. PRKAR1A and thyroid tumors. Cancers 2021, 13, 3834. [Google Scholar] [CrossRef]
- Nadella, K.S.; Jones, G.N.; Trimboli, A.; Stratakis, C.A.; Leone, G.; Kirschner, L.S. Targeted deletion of Prkar1a reveals a role for protein kinase A in mesenchymal-to-epithelial transition. Cancer Res 2008, 68, 2671–2677. [Google Scholar] [CrossRef]
- Loilome, W.; Juntana, S.; Namwat, N.; Bhudhisawasdi, V.; Puapairoj, A.; Sripa, B.; Miwa, M.; Saya, H.; Riggins, G.J.; Yongvanit, P. PRKAR1A is overexpressed and represents a possible therapeutic target in human cholangiocarcinoma. International journal of cancer 2011, 129, 34–44. [Google Scholar] [CrossRef]
- Wang, S.; Cheng, Y.; Zheng, Y.; He, Z.; Chen, W.; Zhou, W.; Duan, C.; Zhang, C. PRKAR1A is a functional tumor suppressor inhibiting ERK/Snail/E-cadherin pathway in lung adenocarcinoma. Scientific Reports 2016, 6, 39630. [Google Scholar] [CrossRef]
- Gentili, C.; Sanfilippo, O.; Silvestrini, R. Cell proliferation and its relationship to clinical features and relapse in breast cancers. Cancer 1981, 48, 974–979. [Google Scholar] [CrossRef]
- Otto, T.; Sicinski, P. Cell cycle proteins as promising targets in cancer therapy. Nature Reviews Cancer 2017, 17, 93–115. [Google Scholar] [CrossRef]
- Musgrove, E.A.; Caldon, C.E.; Barraclough, J.; Stone, A.; Sutherland, R.L. Cyclin D as a therapeutic target in cancer. Nature Reviews Cancer 2011, 11, 558–572. [Google Scholar] [CrossRef] [PubMed]
- Lavoie, H.; Gagnon, J.; Therrien, M. ERK signalling: a master regulator of cell behaviour, life and fate. Nature reviews Molecular cell biology 2020, 21, 607–632. [Google Scholar] [CrossRef] [PubMed]
- Guo, Y.; Pan, W.; Liu, S.; Shen, Z.; Xu, Y.; Hu, L. ERK/MAPK signalling pathway and tumorigenesis. Experimental and therapeutic medicine 2020, 19, 1997–2007. [Google Scholar] [CrossRef] [PubMed]
- Kohno, M.; Pouyssegur, J. Targeting the ERK signaling pathway in cancer therapy. Ann Med 2006, 38, 200–211. [Google Scholar] [CrossRef] [PubMed]
- Hu, X.; Zhai, Y.; Kong, P.; Cui, H.; Yan, T.; Yang, J.; Qian, Y.; Ma, Y.; Wang, F.; Li, H. FAT1 prevents epithelial mesenchymal transition (EMT) via MAPK/ERK signaling pathway in esophageal squamous cell cancer. Cancer Lett 2017, 397, 83–93. [Google Scholar] [CrossRef] [PubMed]
- Zhao, Z.; Yu, H.; Kong, Q.; Liu, C.; Tian, Y.; Zeng, X.; Li, D. Effect of ERβ-regulated ERK1/2 signaling on biological behaviors of prostate cancer cells. American Journal of Translational Research 2017, 9, 2775. [Google Scholar] [PubMed]
- Singh, M.; Yelle, N.; Venugopal, C.; Singh, S.K. EMT: Mechanisms and therapeutic implications. Pharmacol Ther 2018, 182, 80–94. [Google Scholar] [CrossRef]
- Pradella, D.; Naro, C.; Sette, C.; Ghigna, C. EMT and stemness: flexible processes tuned by alternative splicing in development and cancer progression. Molecular cancer 2017, 16, 1–19. [Google Scholar] [CrossRef]
- Fabregat, I.; Malfettone, A.; Soukupova, J. New insights into the crossroads between EMT and stemness in the context of cancer. Journal of clinical medicine 2016, 5, 37. [Google Scholar] [CrossRef] [PubMed]
- Manfioletti, G.; Fedele, M. Epithelial–Mesenchymal Transition (EMT) 2021. International Journal of Molecular Sciences 2022, 23, 5848. [Google Scholar] [CrossRef] [PubMed]
- Roy, S.; Sunkara, R.R.; Parmar, M.Y.; Shaikh, S.; Waghmare, S.K. EMT imparts cancer stemness and plasticity: new perspectives and therapeutic potential. Frontiers in Bioscience-Landmark 2020, 26, 238–265. [Google Scholar] [CrossRef] [PubMed]
- Elliott, A.; Adams, J.; Al-Hajj, M. The ABCs of cancer stem cell drug resistance. IDrugs: the investigational drugs journal 2010, 13, 632–635. [Google Scholar] [PubMed]
- Dean, M. ABC transporters, drug resistance, and cancer stem cells. J Mammary Gland Biol Neoplasia 2009, 14, 3–9. [Google Scholar] [CrossRef]
- Dave, B.; Mittal, V.; Tan, N.M.; Chang, J.C. Epithelial-mesenchymal transition, cancer stem cells and treatment resistance. Breast Cancer Research 2012, 14, 1–5. [Google Scholar] [CrossRef] [PubMed]
- Zhao, W.; Li, Y.; Zhang, X. Stemness-related markers in cancer. Cancer translational medicine 2017, 3, 87. [Google Scholar] [CrossRef]
- Chiou, S.; Wang, M.; Chou, Y.; Chen, C.; Hong, C.; Hsieh, W.; Chang, H.; Chen, Y.; Lin, T.; Hsu, H. Coexpression of Oct4 and Nanog enhances malignancy in lung adenocarcinoma by inducing cancer stem cell–like properties and epithelial–mesenchymal transdifferentiation. Cancer Res 2010, 70, 10433–10444. [Google Scholar] [CrossRef]
- Sun, C.; Sun, L.; Li, Y.; Kang, X.; Zhang, S.; Liu, Y. Sox2 expression predicts poor survival of hepatocellular carcinoma patients and it promotes liver cancer cell invasion by activating Slug. Medical oncology 2013, 30, 1–10. [Google Scholar] [CrossRef]
- Chen, Y.; Shi, L.; Zhang, L.; Li, R.; Liang, J.; Yu, W.; Sun, L.; Yang, X.; Wang, Y.; Zhang, Y. The molecular mechanism governing the oncogenic potential of SOX2 in breast cancer. J Biol Chem 2008, 283, 17969–17978. [Google Scholar] [CrossRef]
- Rasti, A.; Mehrazma, M.; Madjd, Z.; Abolhasani, M.; Saeednejad Zanjani, L.; Asgari, M. Co-expression of cancer stem cell markers OCT4 and NANOG predicts poor prognosis in renal cell carcinomas. Scientific reports 2018, 8, 11739. [Google Scholar] [CrossRef] [PubMed]
- Smith, J.; Field, M.; Sugaya, K. Suppression of NANOG Expression Reduces Drug Resistance of Cancer Stem Cells in Glioblastoma. Genes 2023, 14, 1276. [Google Scholar] [CrossRef] [PubMed]
- Liu, X.; He, M.; Li, L.; Wang, X.; Han, S.; Zhao, J.; Dong, Y.; Ahmad, M.; Li, L.; Zhang, X. EMT and cancer cell stemness associated with chemotherapeutic resistance in esophageal cancer. Frontiers in Oncology 2021, 11, 672222. [Google Scholar] [CrossRef]
- Koh, E.; Kim, K.; Park, H.; Kim, J.; Kim, P. Active targeting of versatile nanocomplex using the novel biomarker of breast cancer stem cells. International Journal of Molecular Sciences 2022, 24, 685. [Google Scholar] [CrossRef]
- Koh, E.; You, J.; Jung, S.; Kim, P. Biological functions and identification of novel biomarker expressed on the surface of breast cancer-derived cancer stem cells via proteomic analysis. Mol. Cells 2020, 43, 384. [Google Scholar] [CrossRef]
Figure 1.
Proteomic analysis results for biomarker candidate and validation of PRKAR1A expression in each cell lines. Venn Diagram depicting the results of proteomic analysis (A). The validation of PRKAR1A in each cell lines (B). Quantitative values of PRKAR1A expression were normalized by GAPDH (C). Data shown represent the mean ± SD (n = 3). *P < 0.05, as compared with UCB-MSC versus other cell lines.
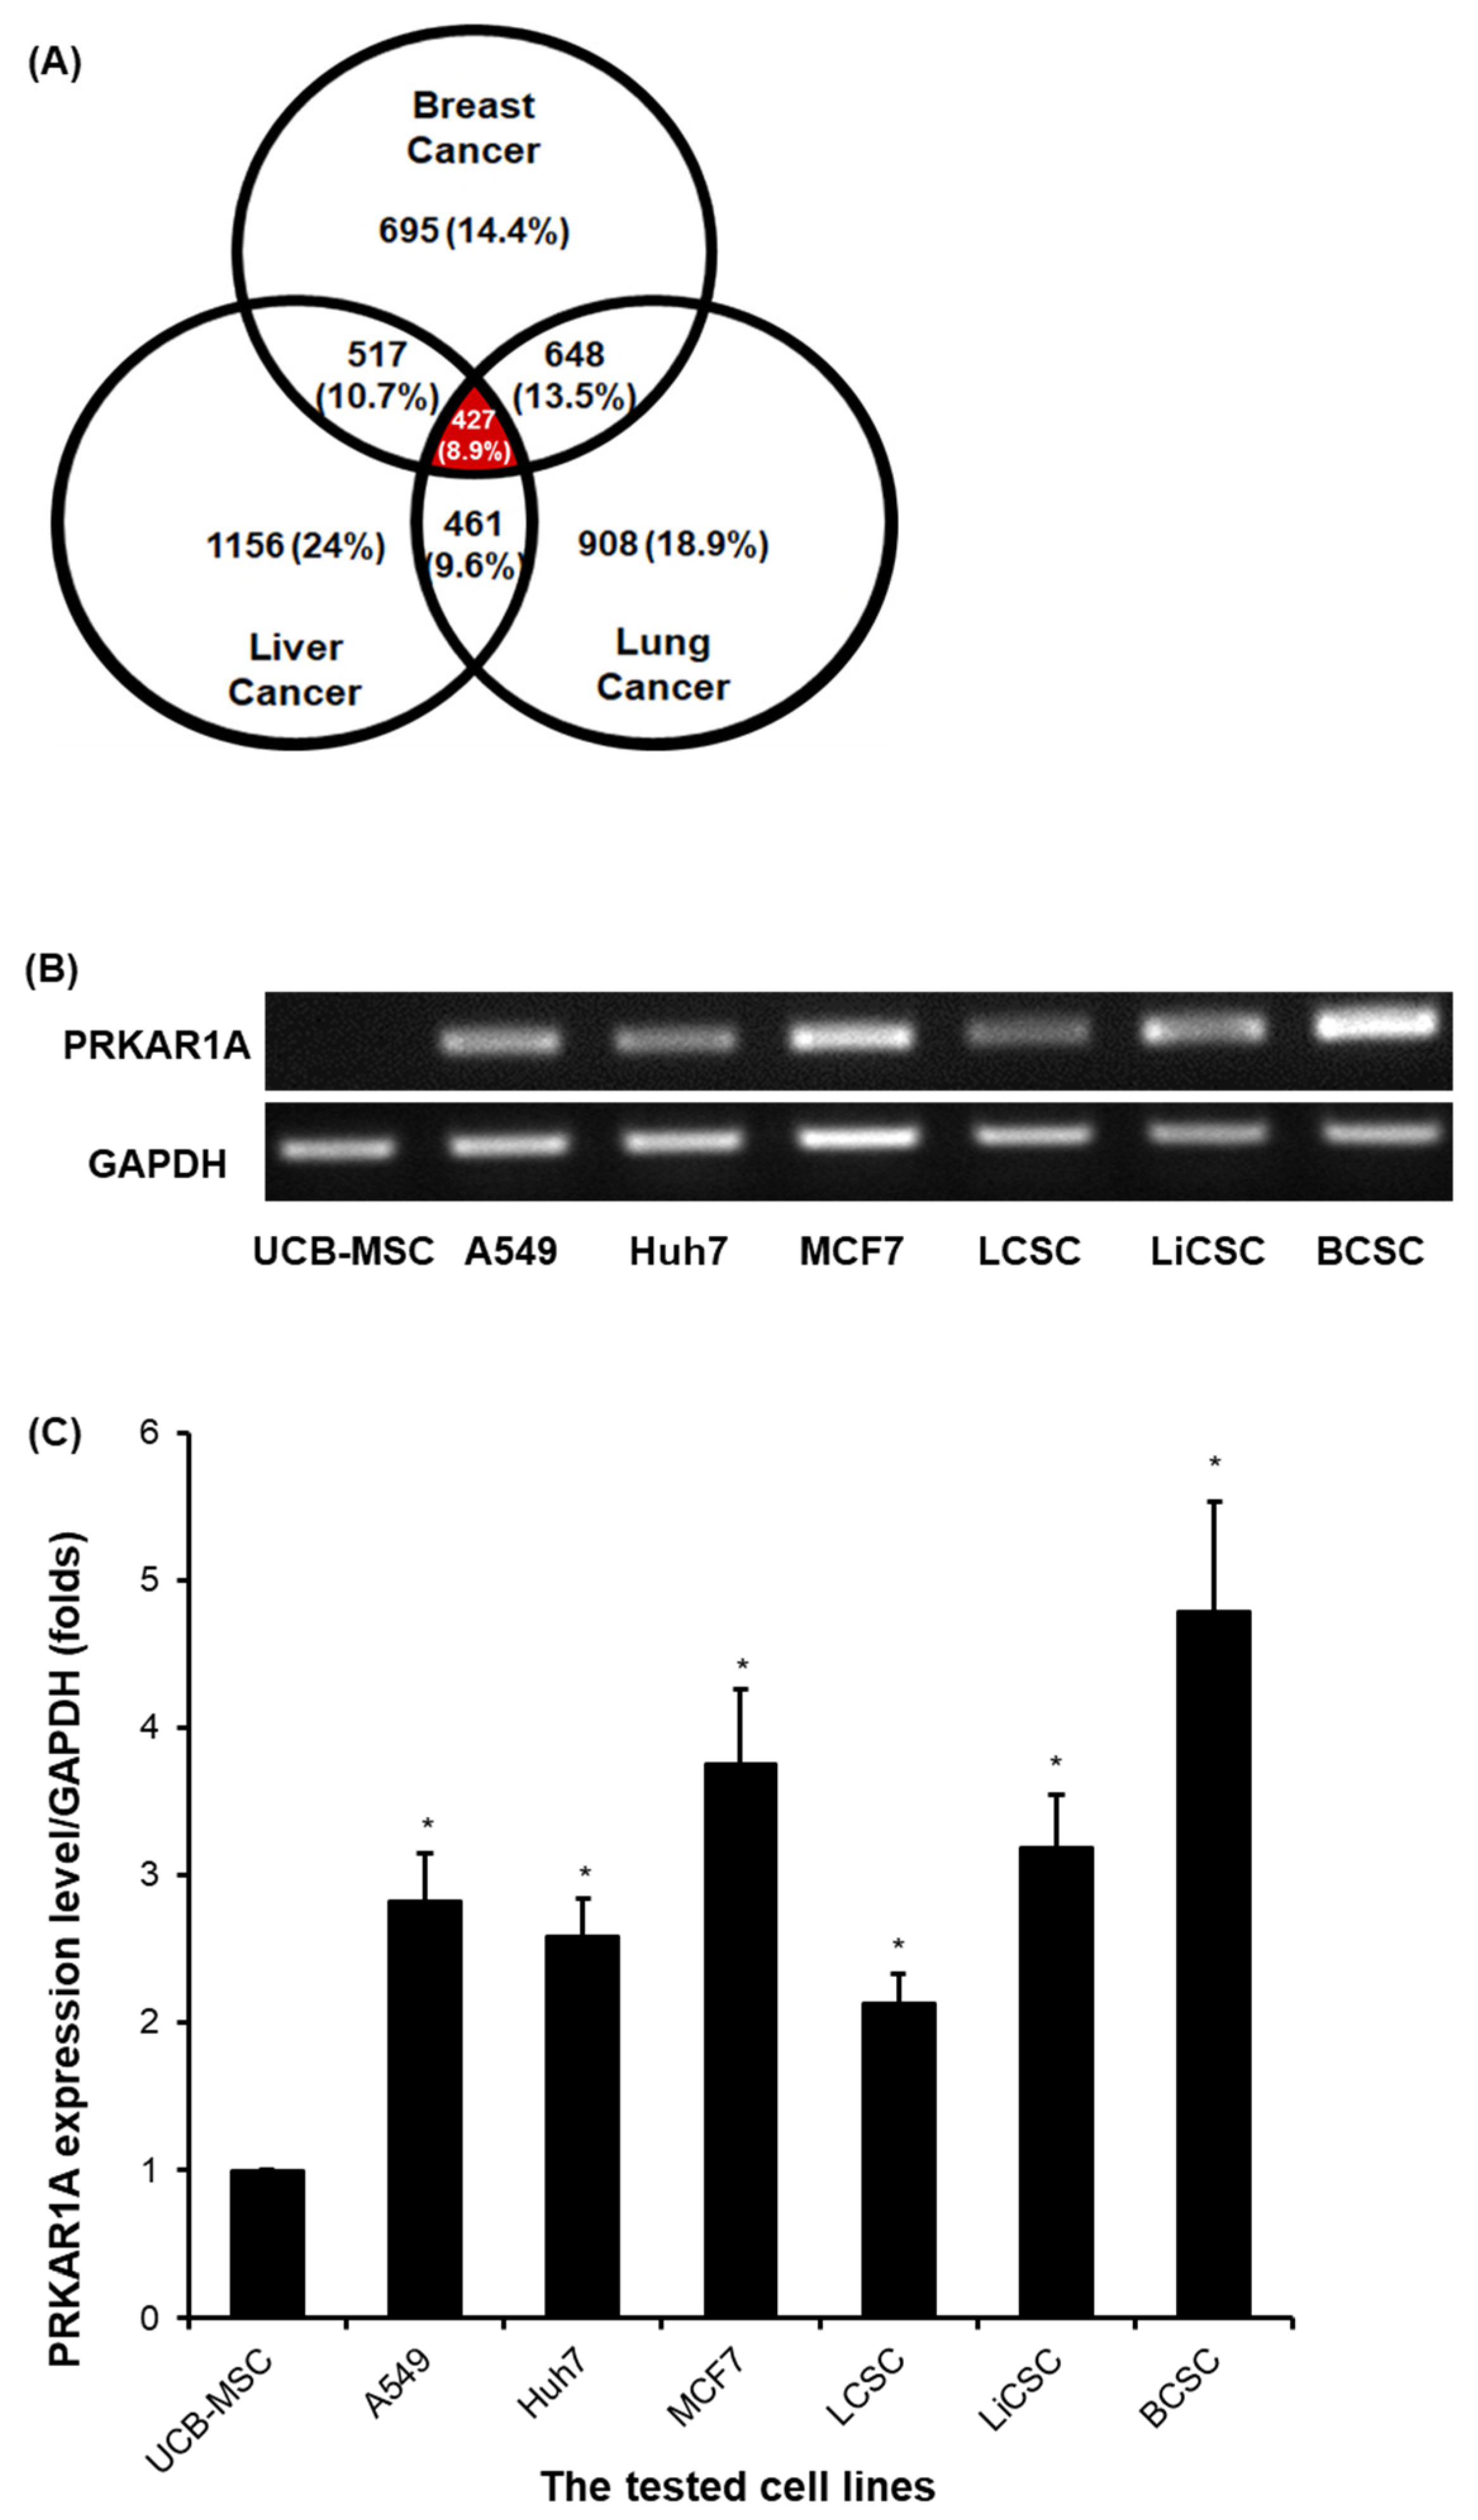
Figure 2.
The selection of optimal shRNA for PRKAR1A silencing in cancer cells and CSCs. Short hairpin RNA (shRNA) series were constructed in psi-LVRU6GP vector to effectively knock-down PRKAR1A gene in the cancer cells and CSCs. Transfection efficiency of PRKAR1A by constructed shRNAs through conventional PCR (A-B). Quantitative data of PRKAR1A expression was normalized by GAPDH (C-D). Data shown represent the mean ± SD (n = 3). ***P < 0.001, as compared with shScr.
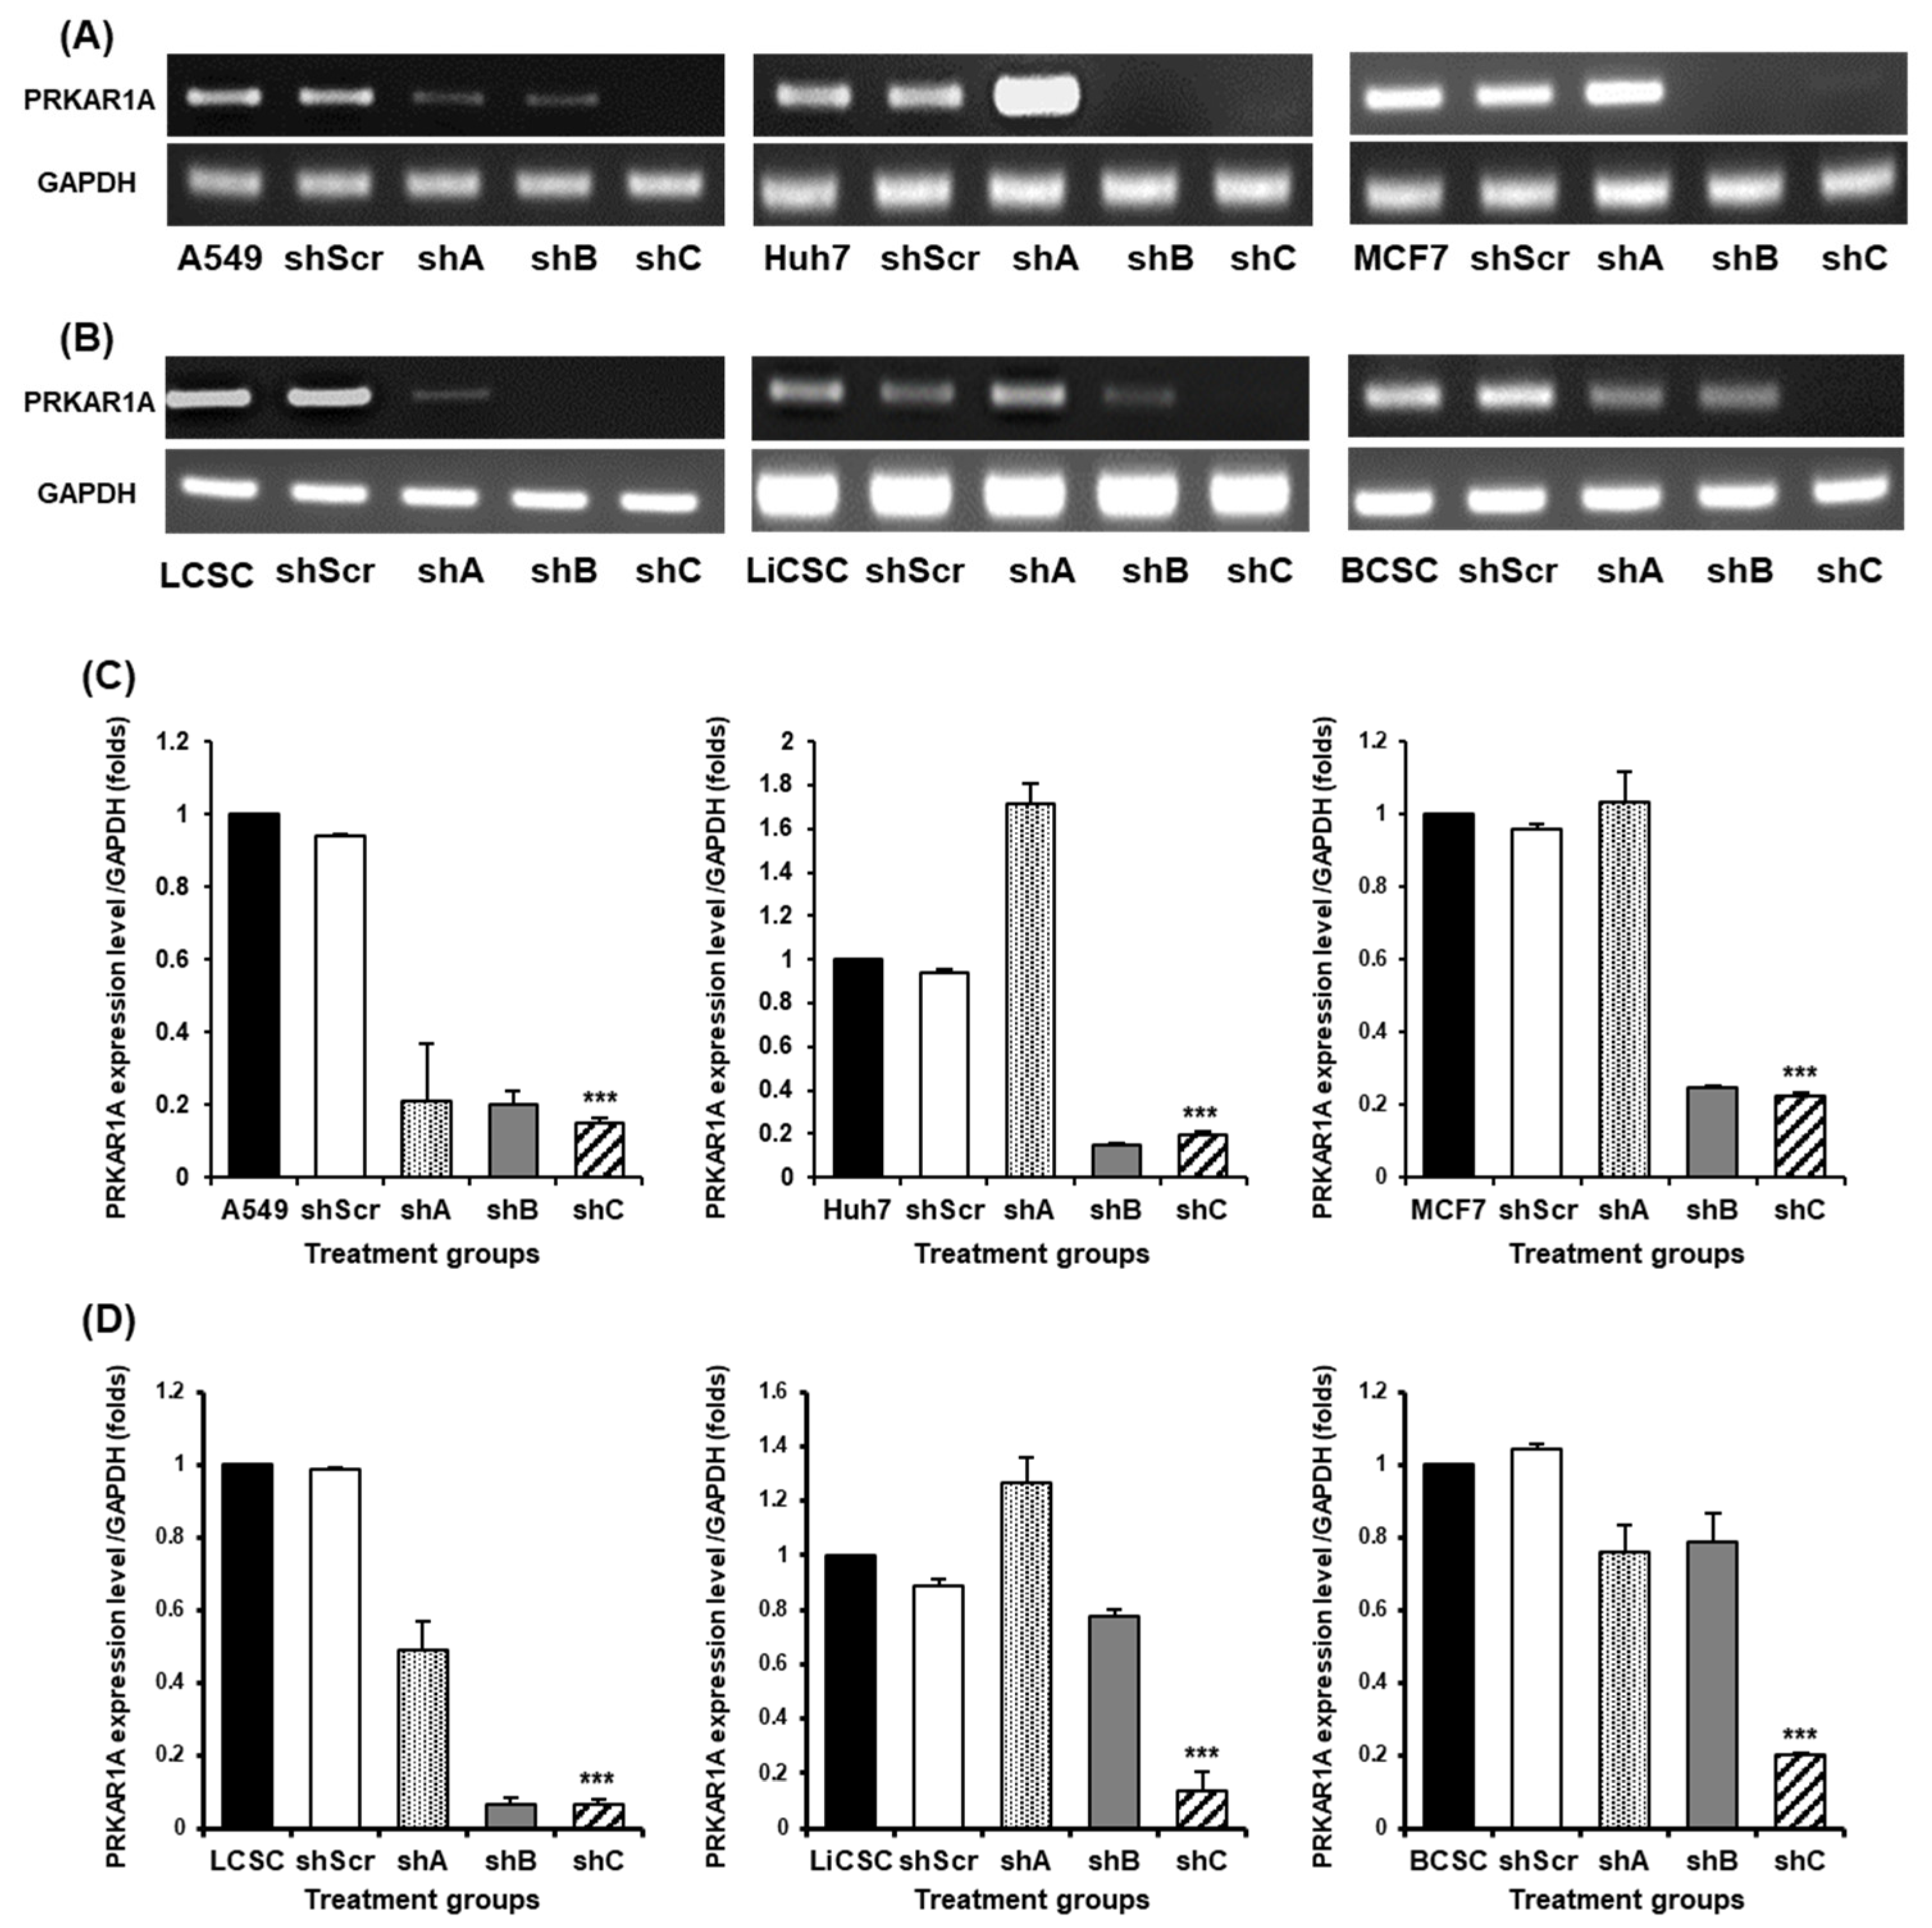
Figure 3.
Opposing cell proliferation by PRKAR1A silencing in cancer cells and CSCs. Cancer cells (A) and CSCs (B) were assessed for proliferation rate as o, 24, 48, and 72 h after shRNA treatment. Data shown represent the mean ± SD (n = 3). *P < 0.05, **P < 0.01, and ***P < 0.001 compared with shC versus shScr groups.
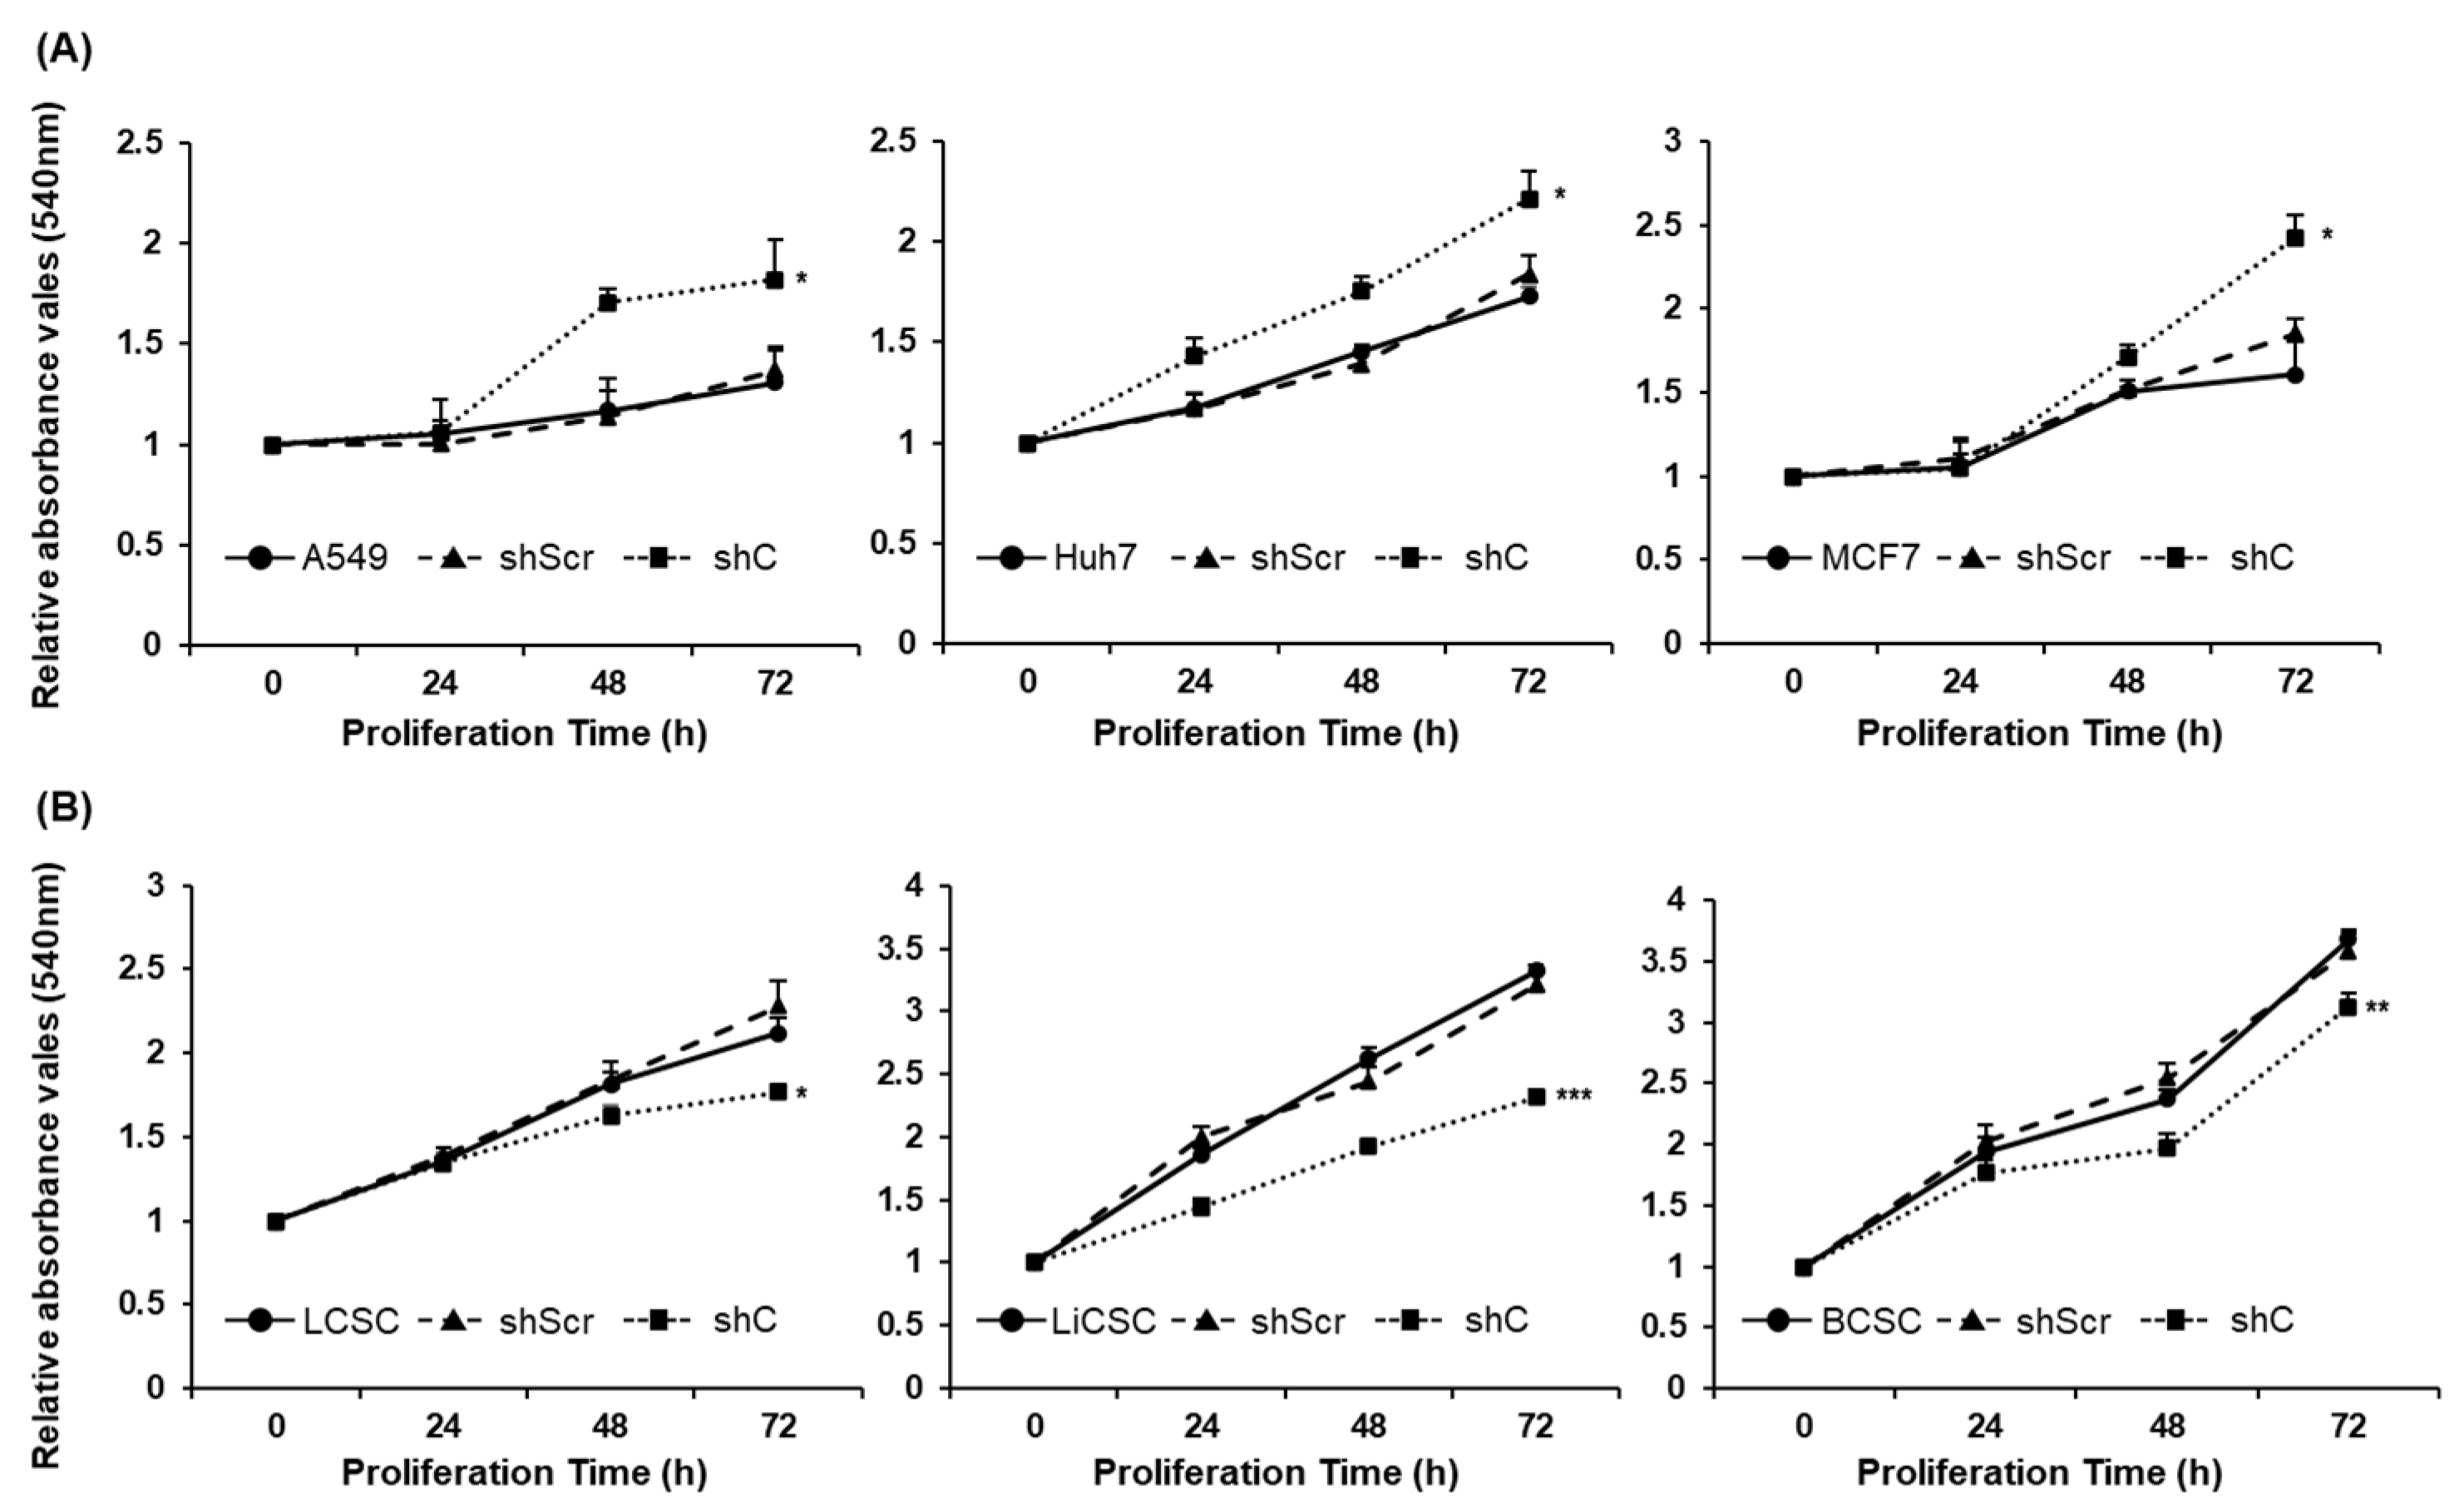
Figure 4.
The change of colony formation ability by PRKAR1A knock-down. The generated colonies were fixed with methanol and visually confirmed through crystal violet staining (A-B). The rectangular box represents a portion where individual single colonies were well observed. This area was magnified at a 100-fold scale for observation. After dissolving crystal violet in methanol, quantification was performed to measuring absorbance at 570 nm in a 96-well plate (C-D). Data shown represent the mean ± SD (n = 3). **P < 0.01, and ***P < 0.001 compared with shC versus shScr groups.
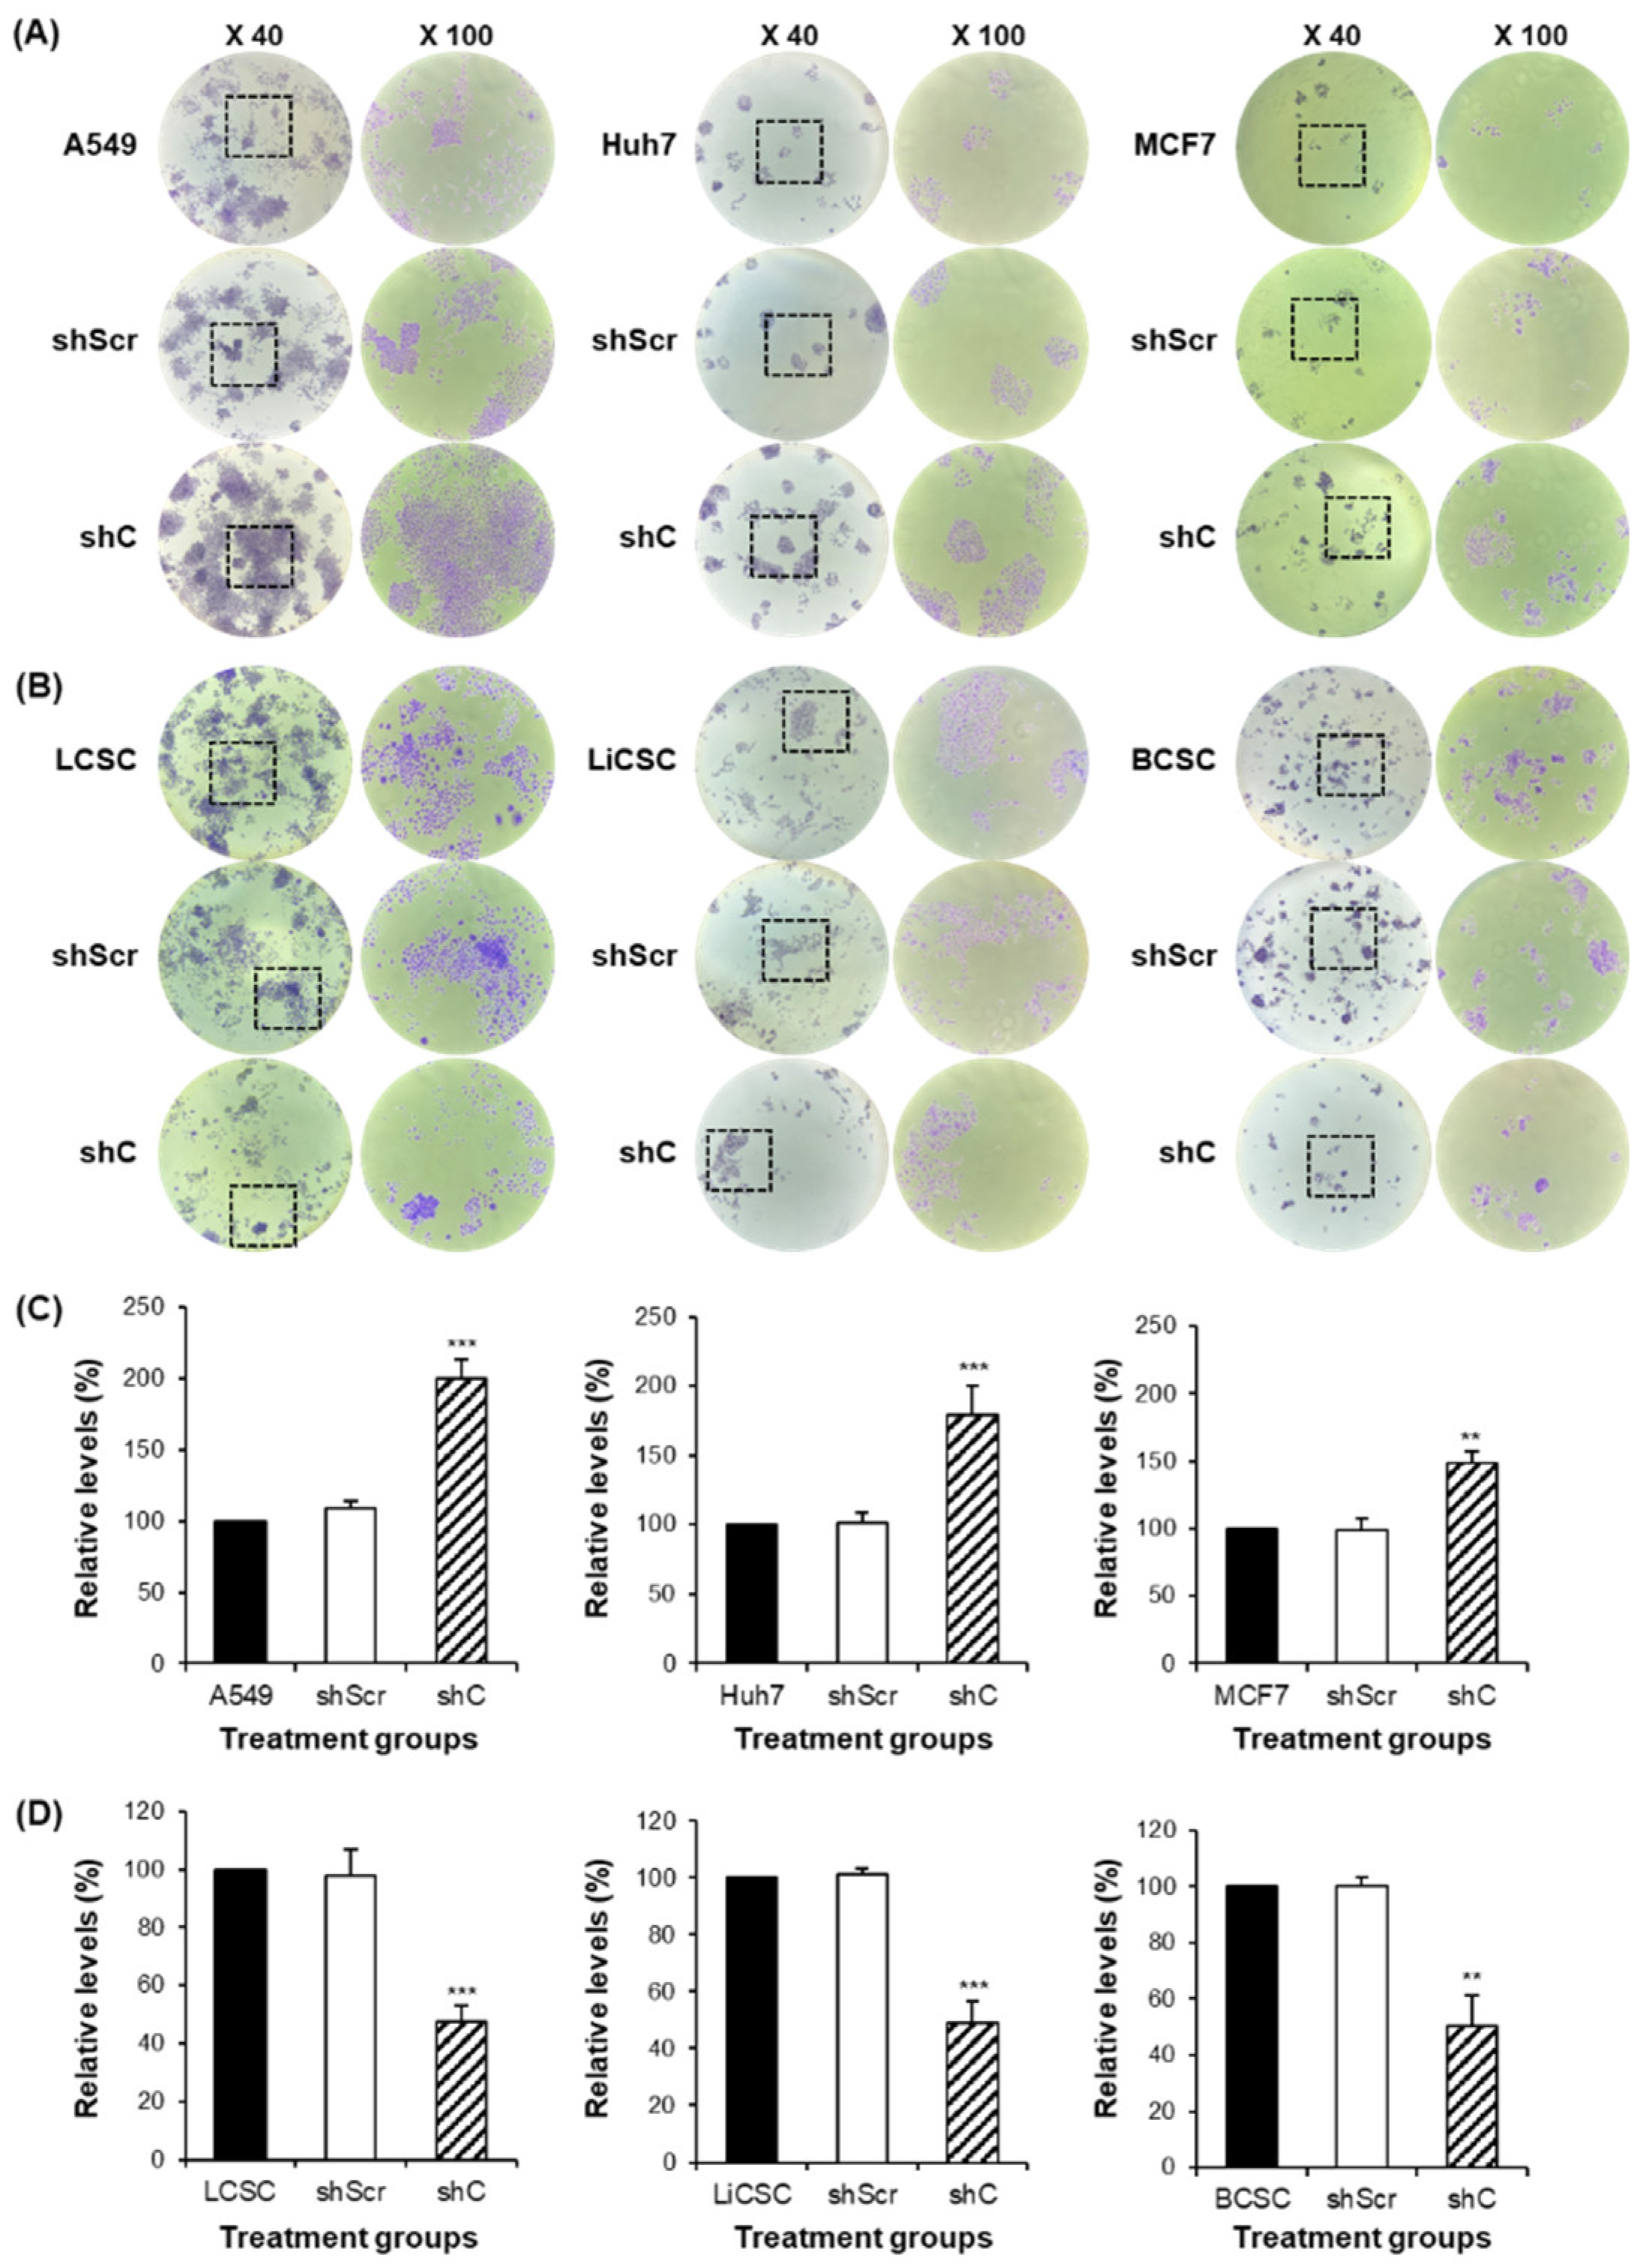
Figure 5.
Analysis of the cell cycle and induced changes in cyclin D1 in PRKAR1A sh RNA-treated cancer cells and -CSCs. The expression of cyclin D1 post-PRKAR1A shRNA (A-B). Quantitative data of cyclin D1 expression relative to GAPDH (C-D). Analysis of cell cycle using flow cytometry (E-F). Data shown represent the mean ± SD (n = 3). *P < 0.05, **P < 0.01, and ***P < 0.001 compared with shC versus shScr groups.
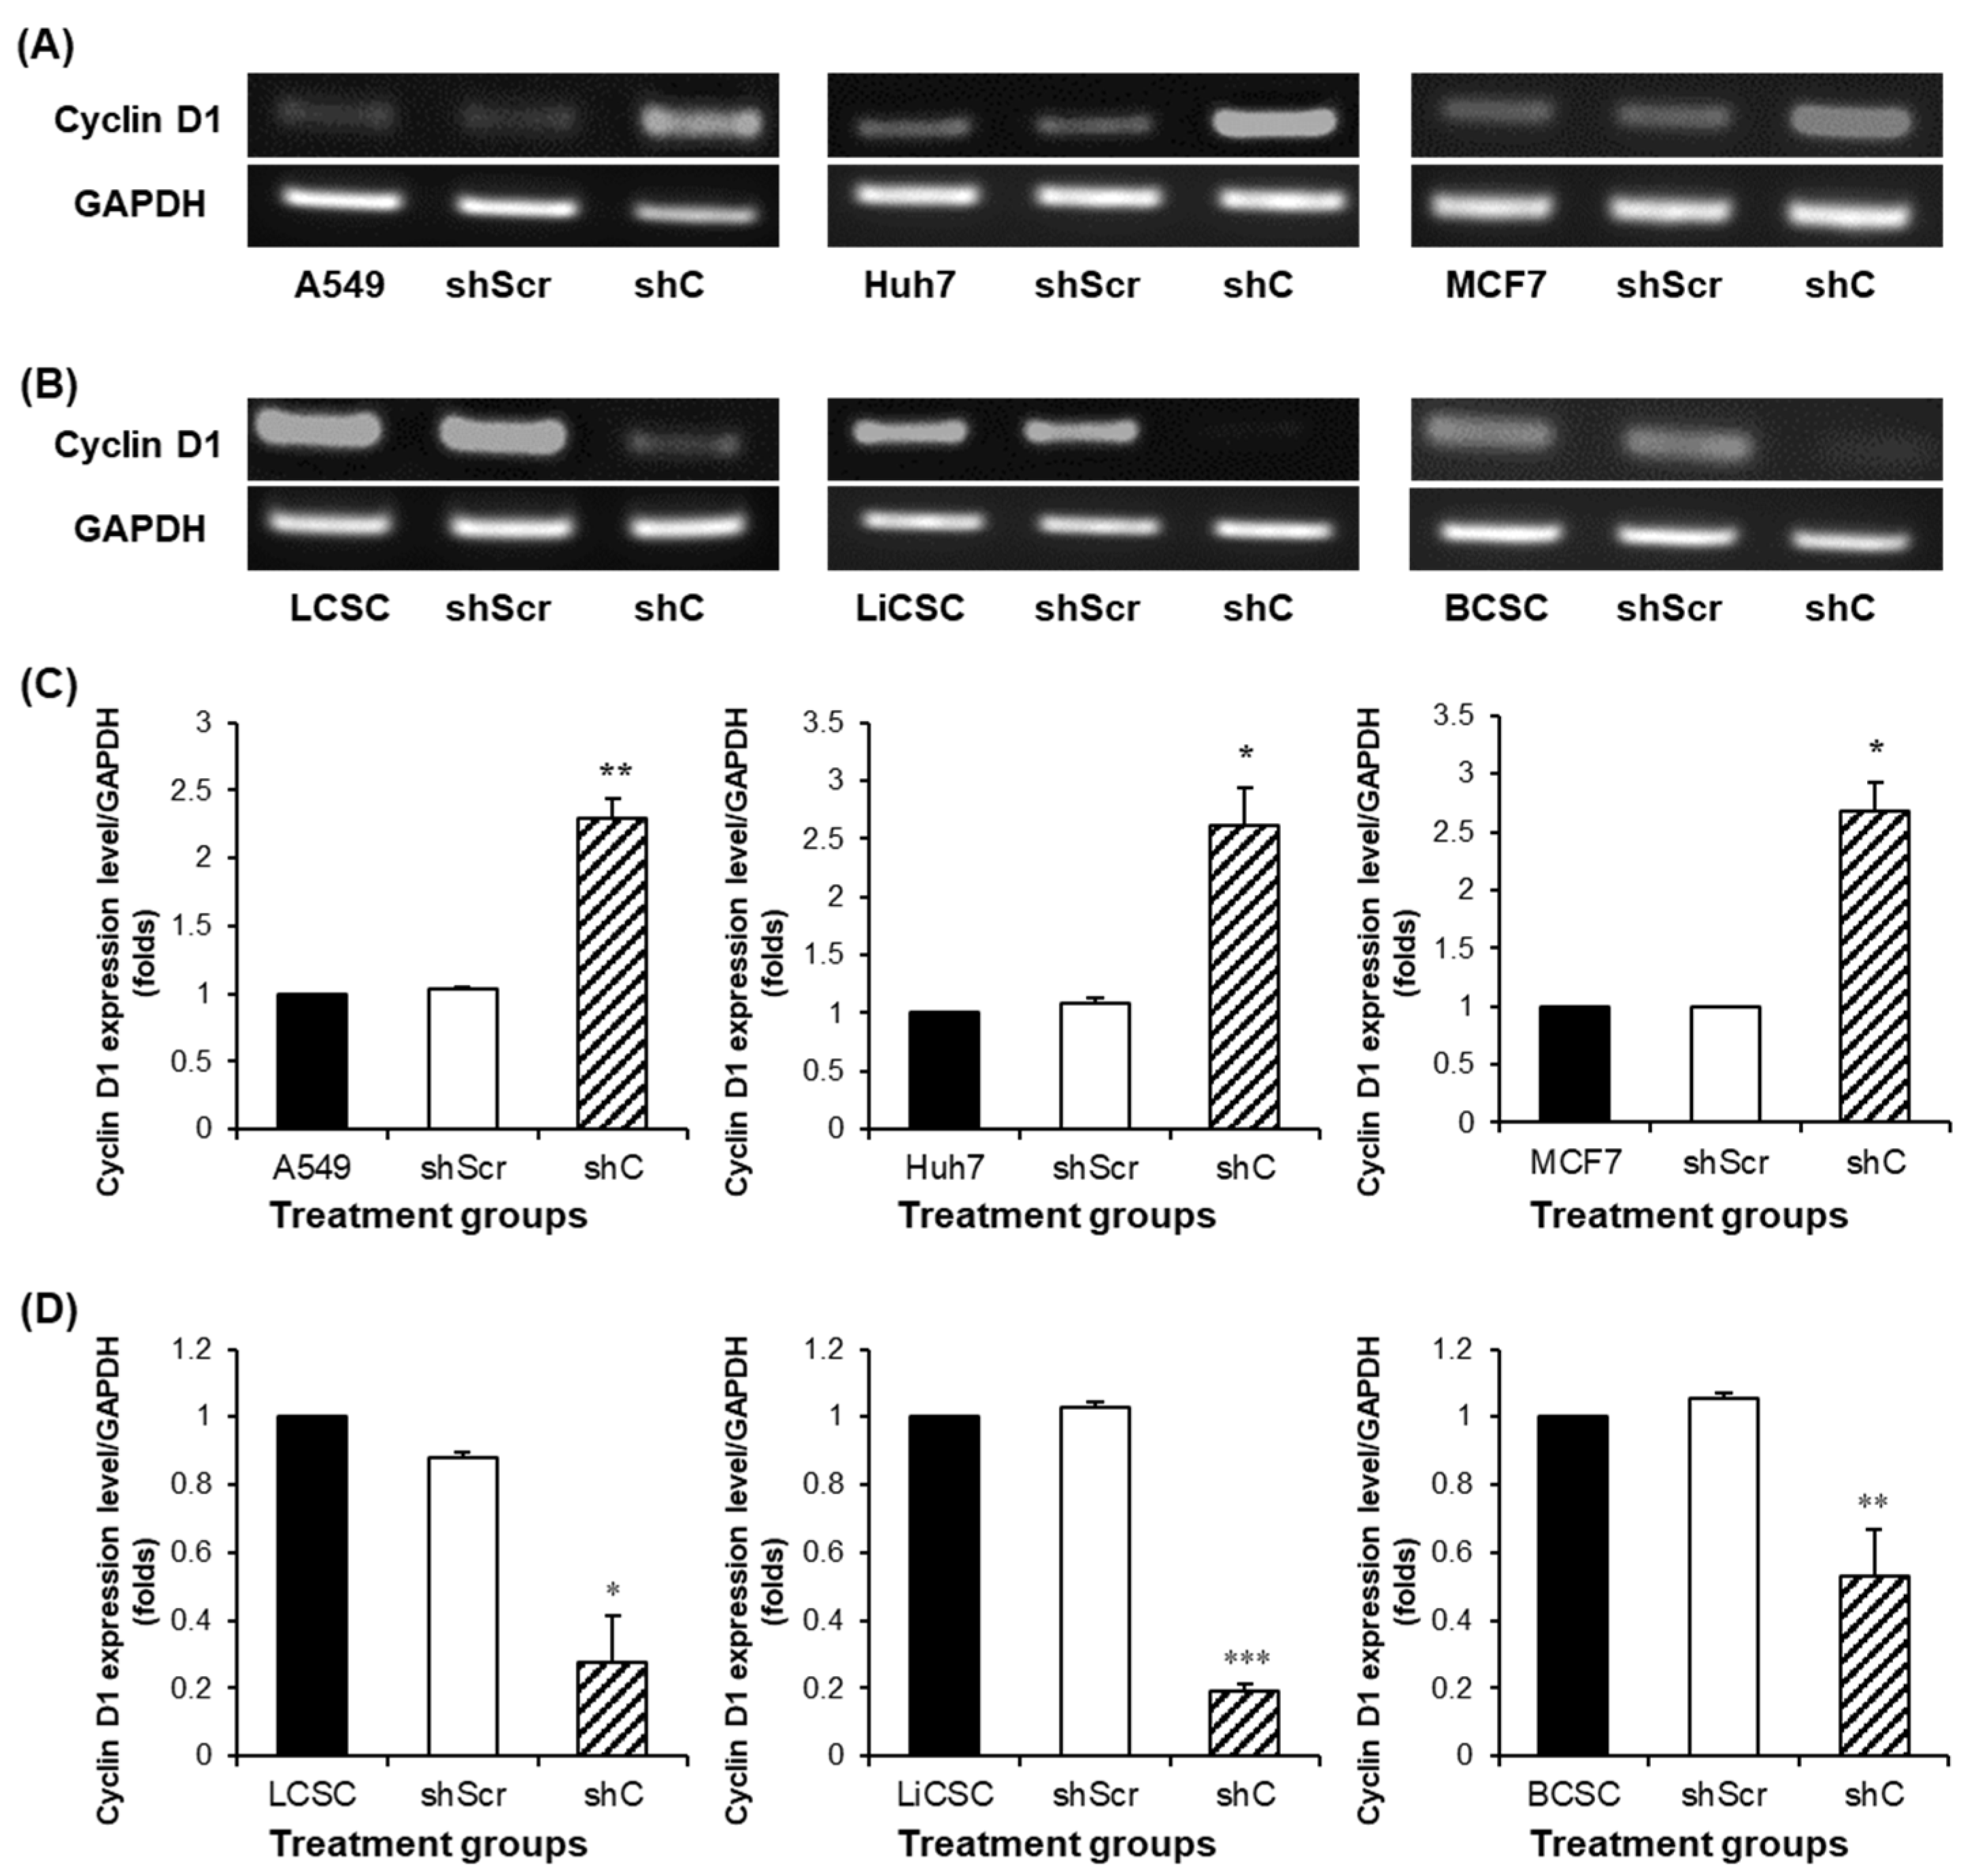
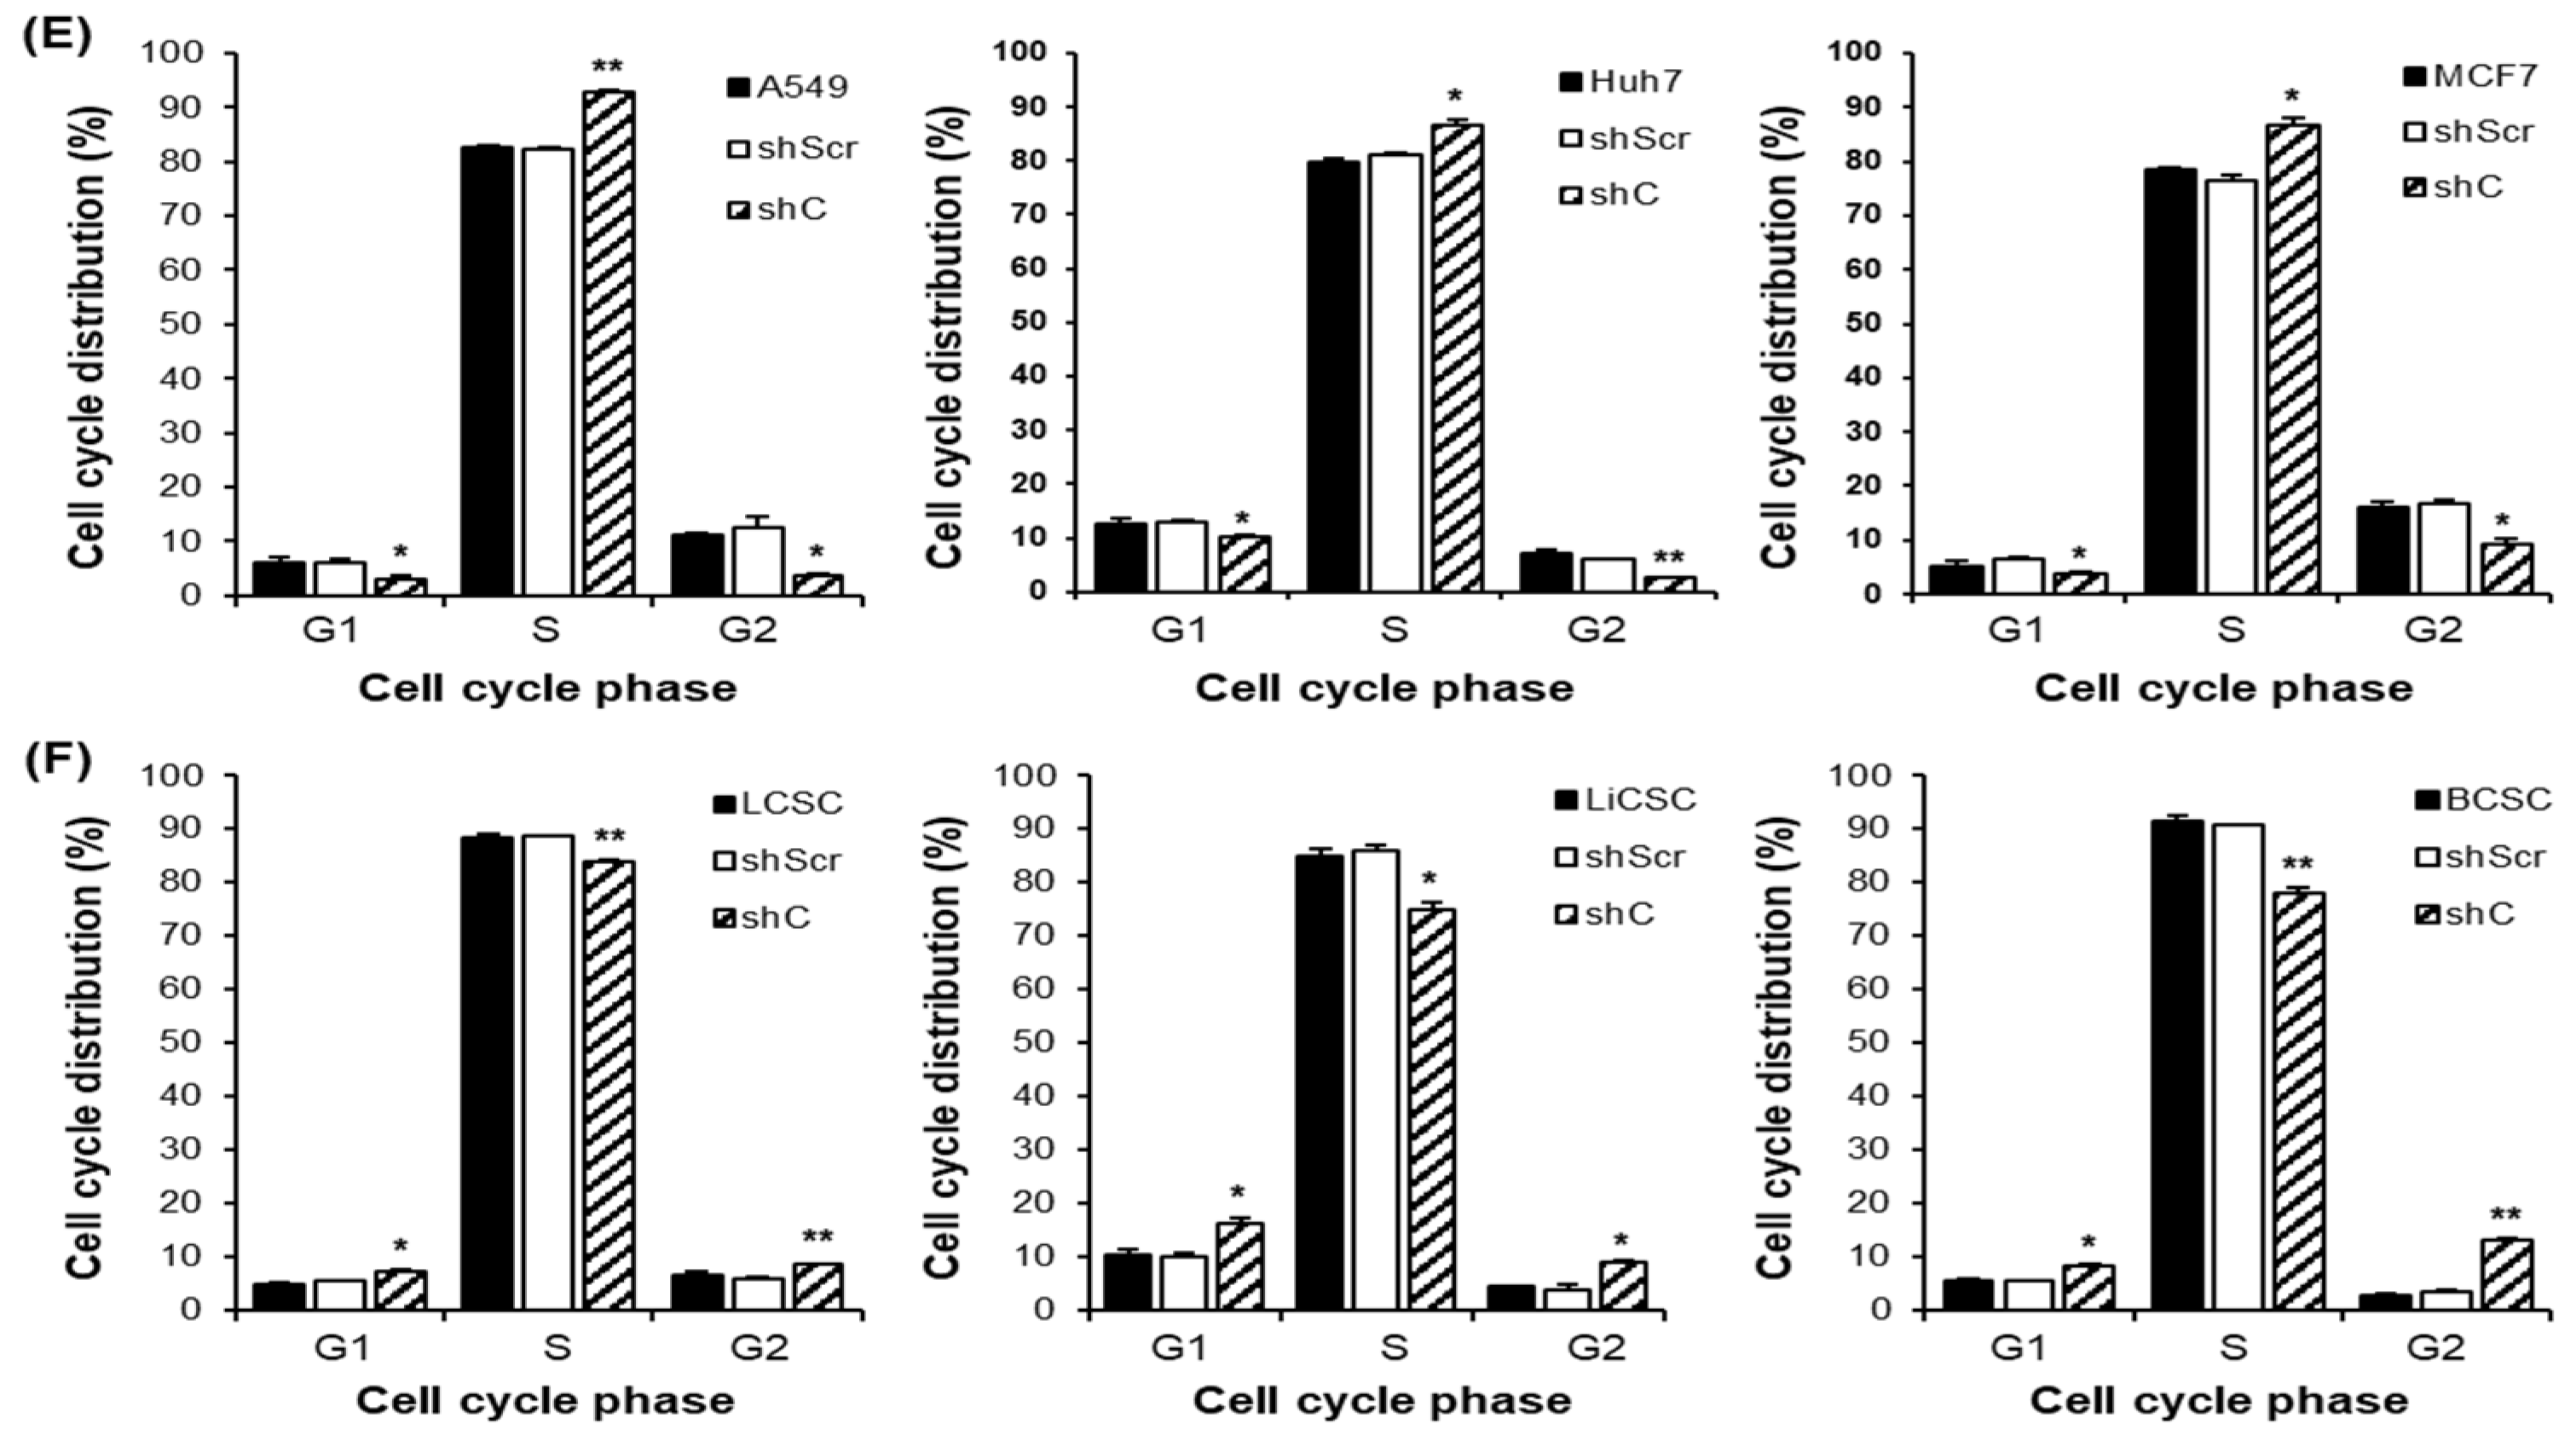
Figure 6.
Cell migration ability by downregulation of PRKAR1A. Images and crystal violet staining to confirm cell migration at 0 and 12 h (A-B). The migration area was measured using Image J. The wound-like area was quantified at 12 h relative to the baseline at 0 h and presented graphically (C-D). Data shown represent the mean ± SD (n = 3). *P < 0.05, **P < 0.01, and ***P < 0.001 compared with shC versus shScr groups.
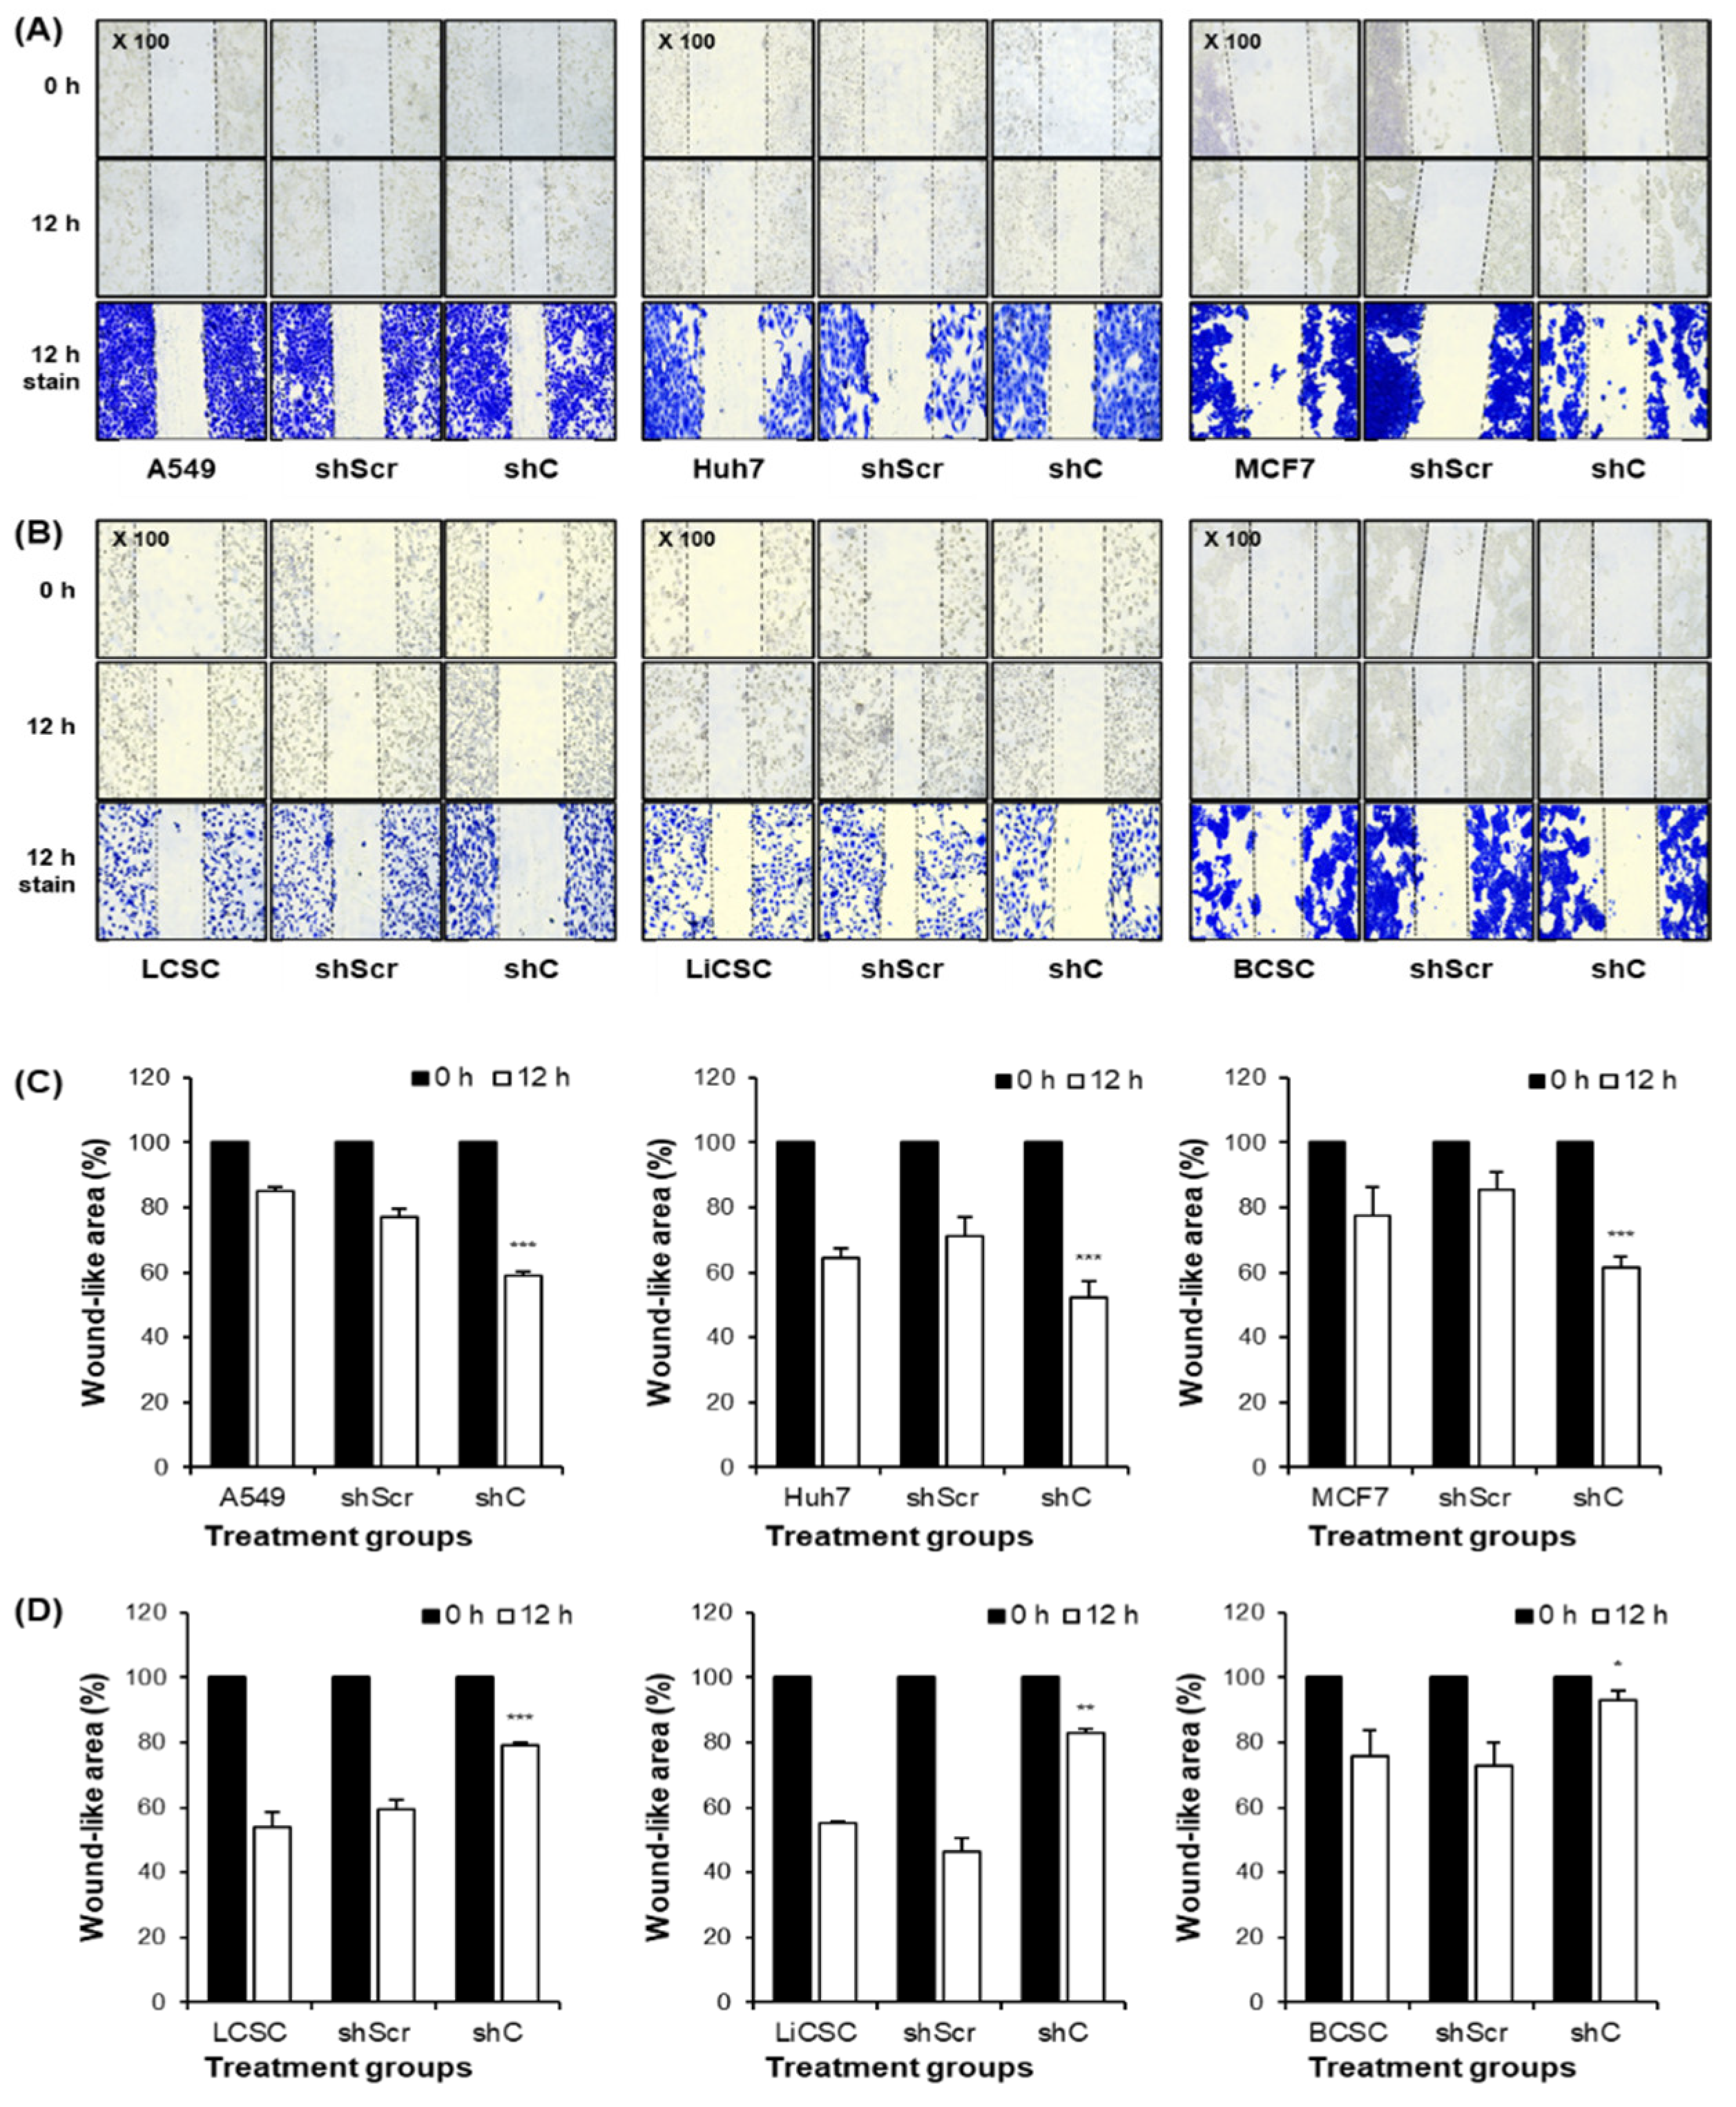
Figure 7.
Comparison of p-ERK expression by PRKAR1A downregulated in cancer cells and CSCs. The changes in the band of p-ERK expression by western blot (A-B). Quantification expression level of p-ERK expression was normalized by β-actin (C-D). Data shown represent the mean ± SD (n = 3). *P < 0.05, **P < 0.01, and ***P < 0.001 compared with shC versus shScr groups.
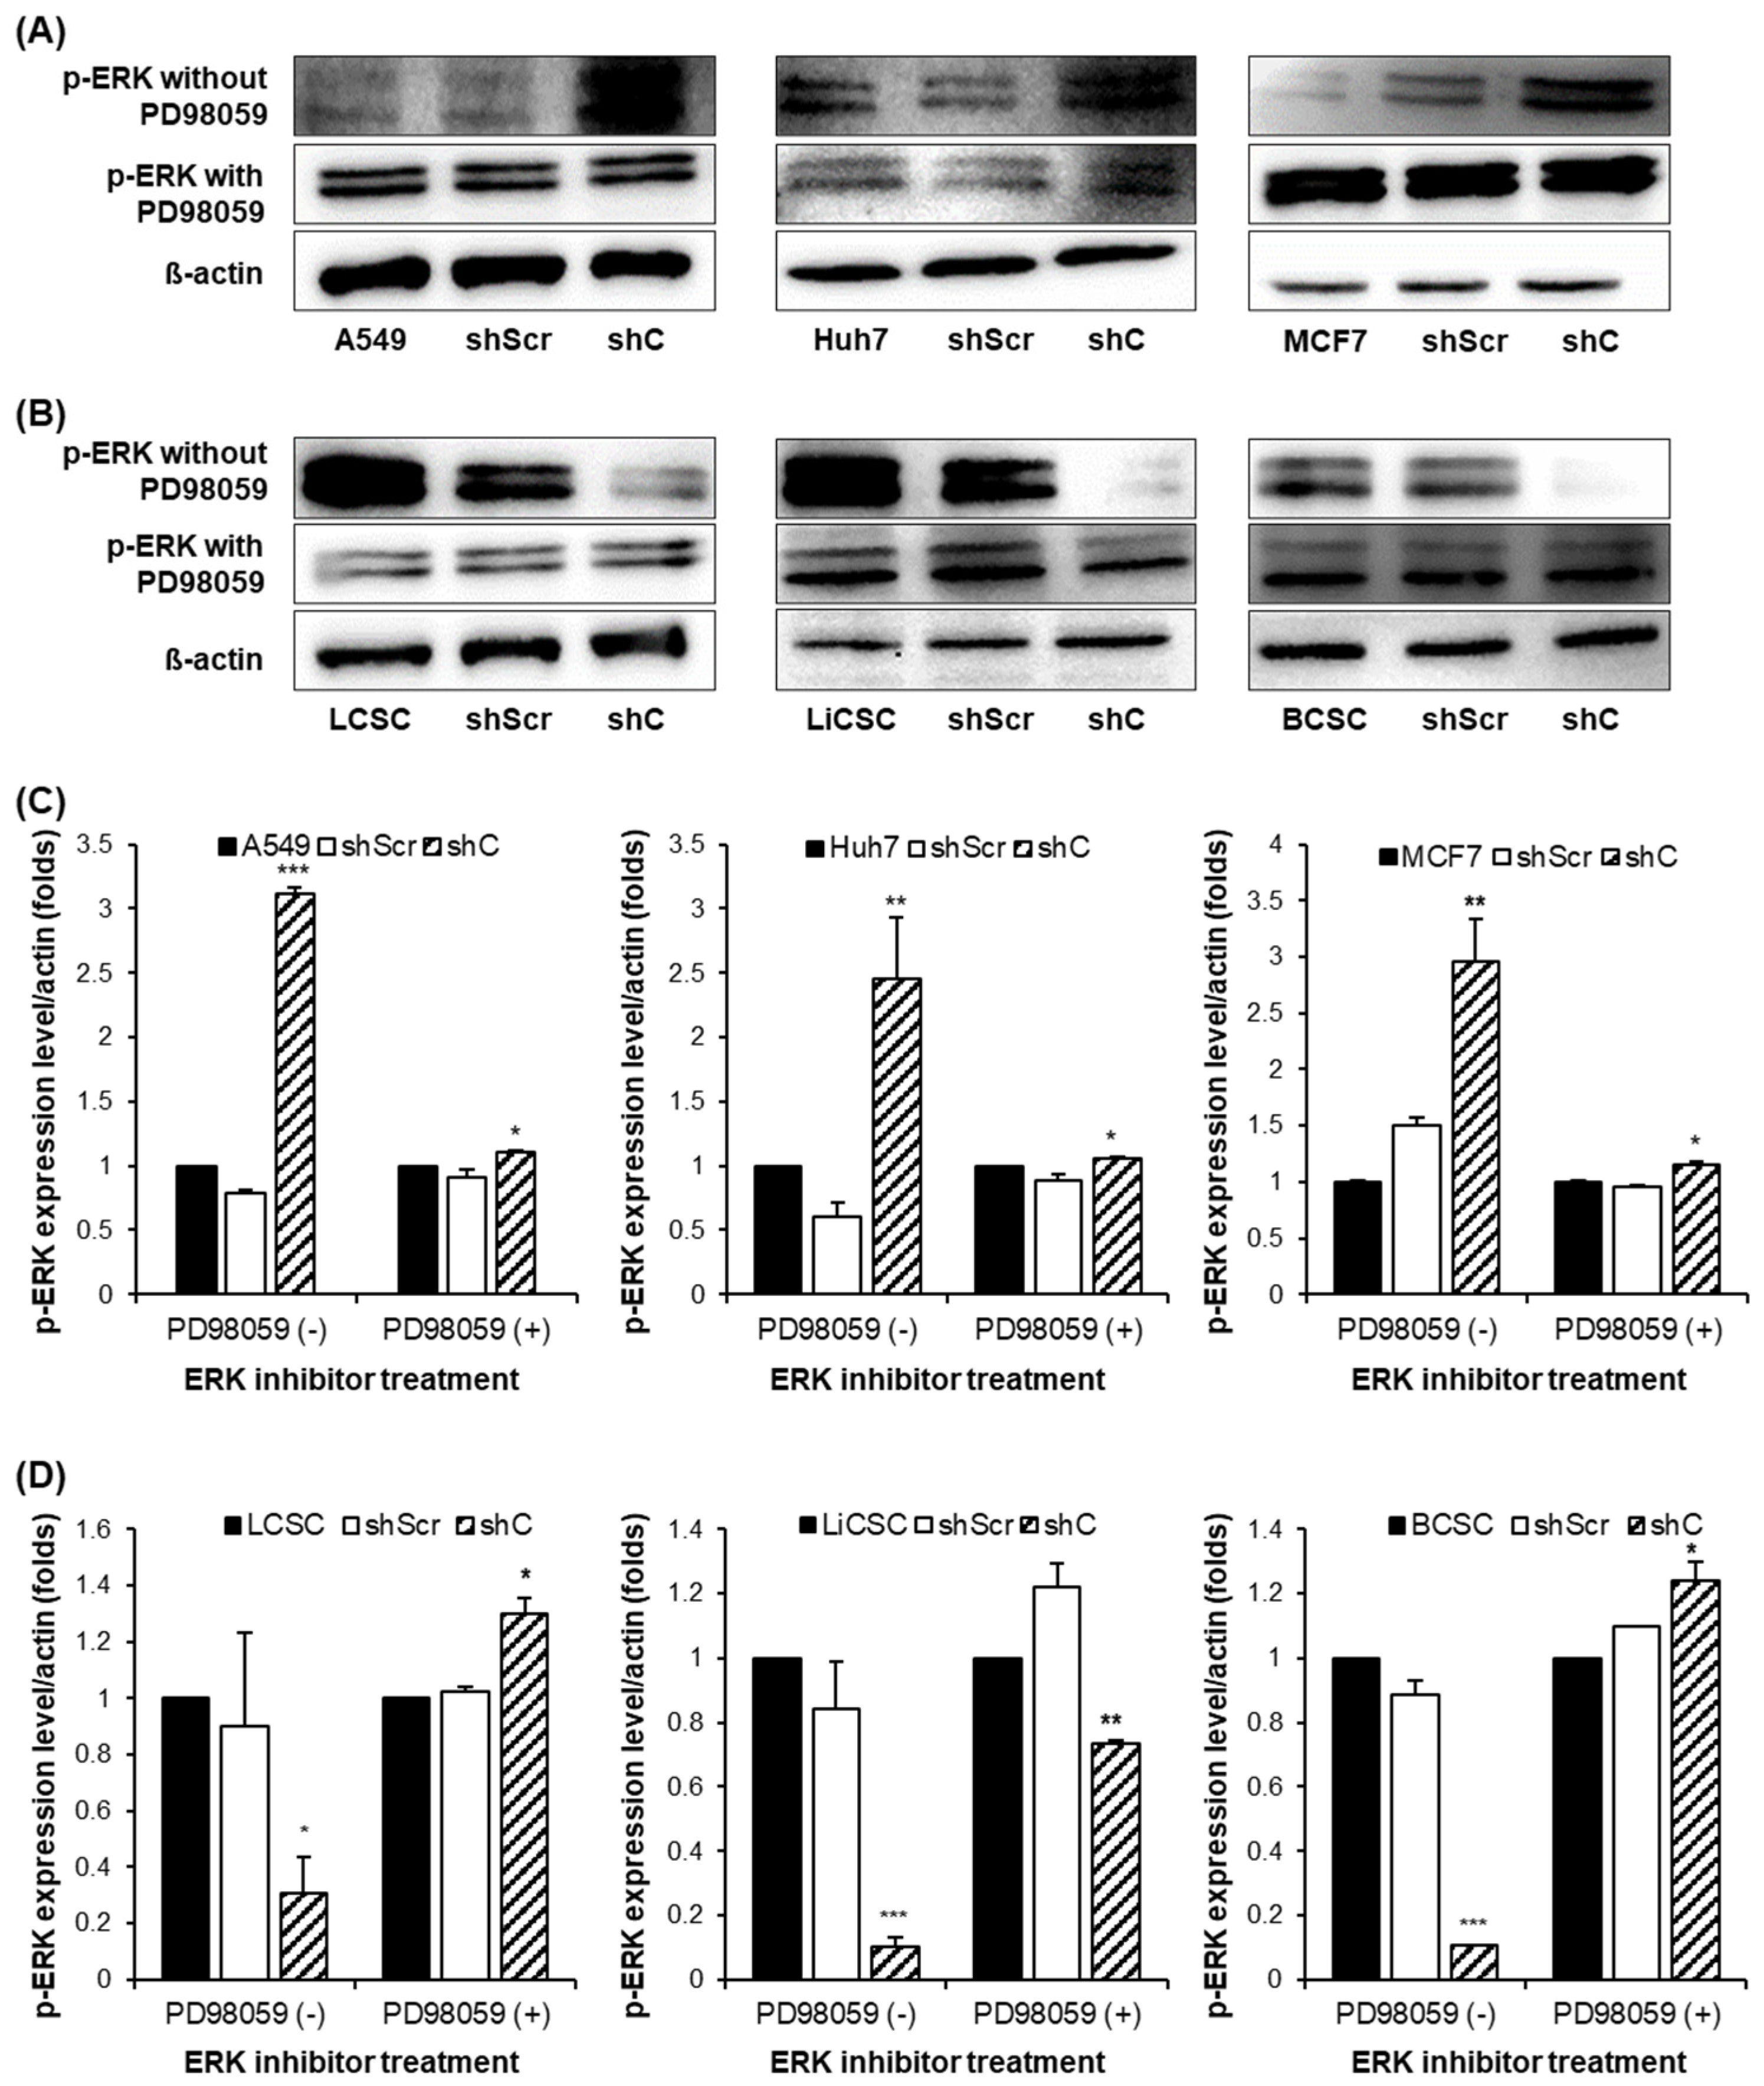
Figure 8.
The change of EMT and MET in cancer cells and CSCs according to PRKAR1A expression. The expression of EMT markers (A-B) and its quantitative data (C-D), western blot analysis of EMT and MET (E-F) and its quantitative data (G-H). Data shown represent the mean ± SD (n = 3). *P < 0.05, **P < 0.01, and ***P < 0.001 compared with shC versus shScr groups.
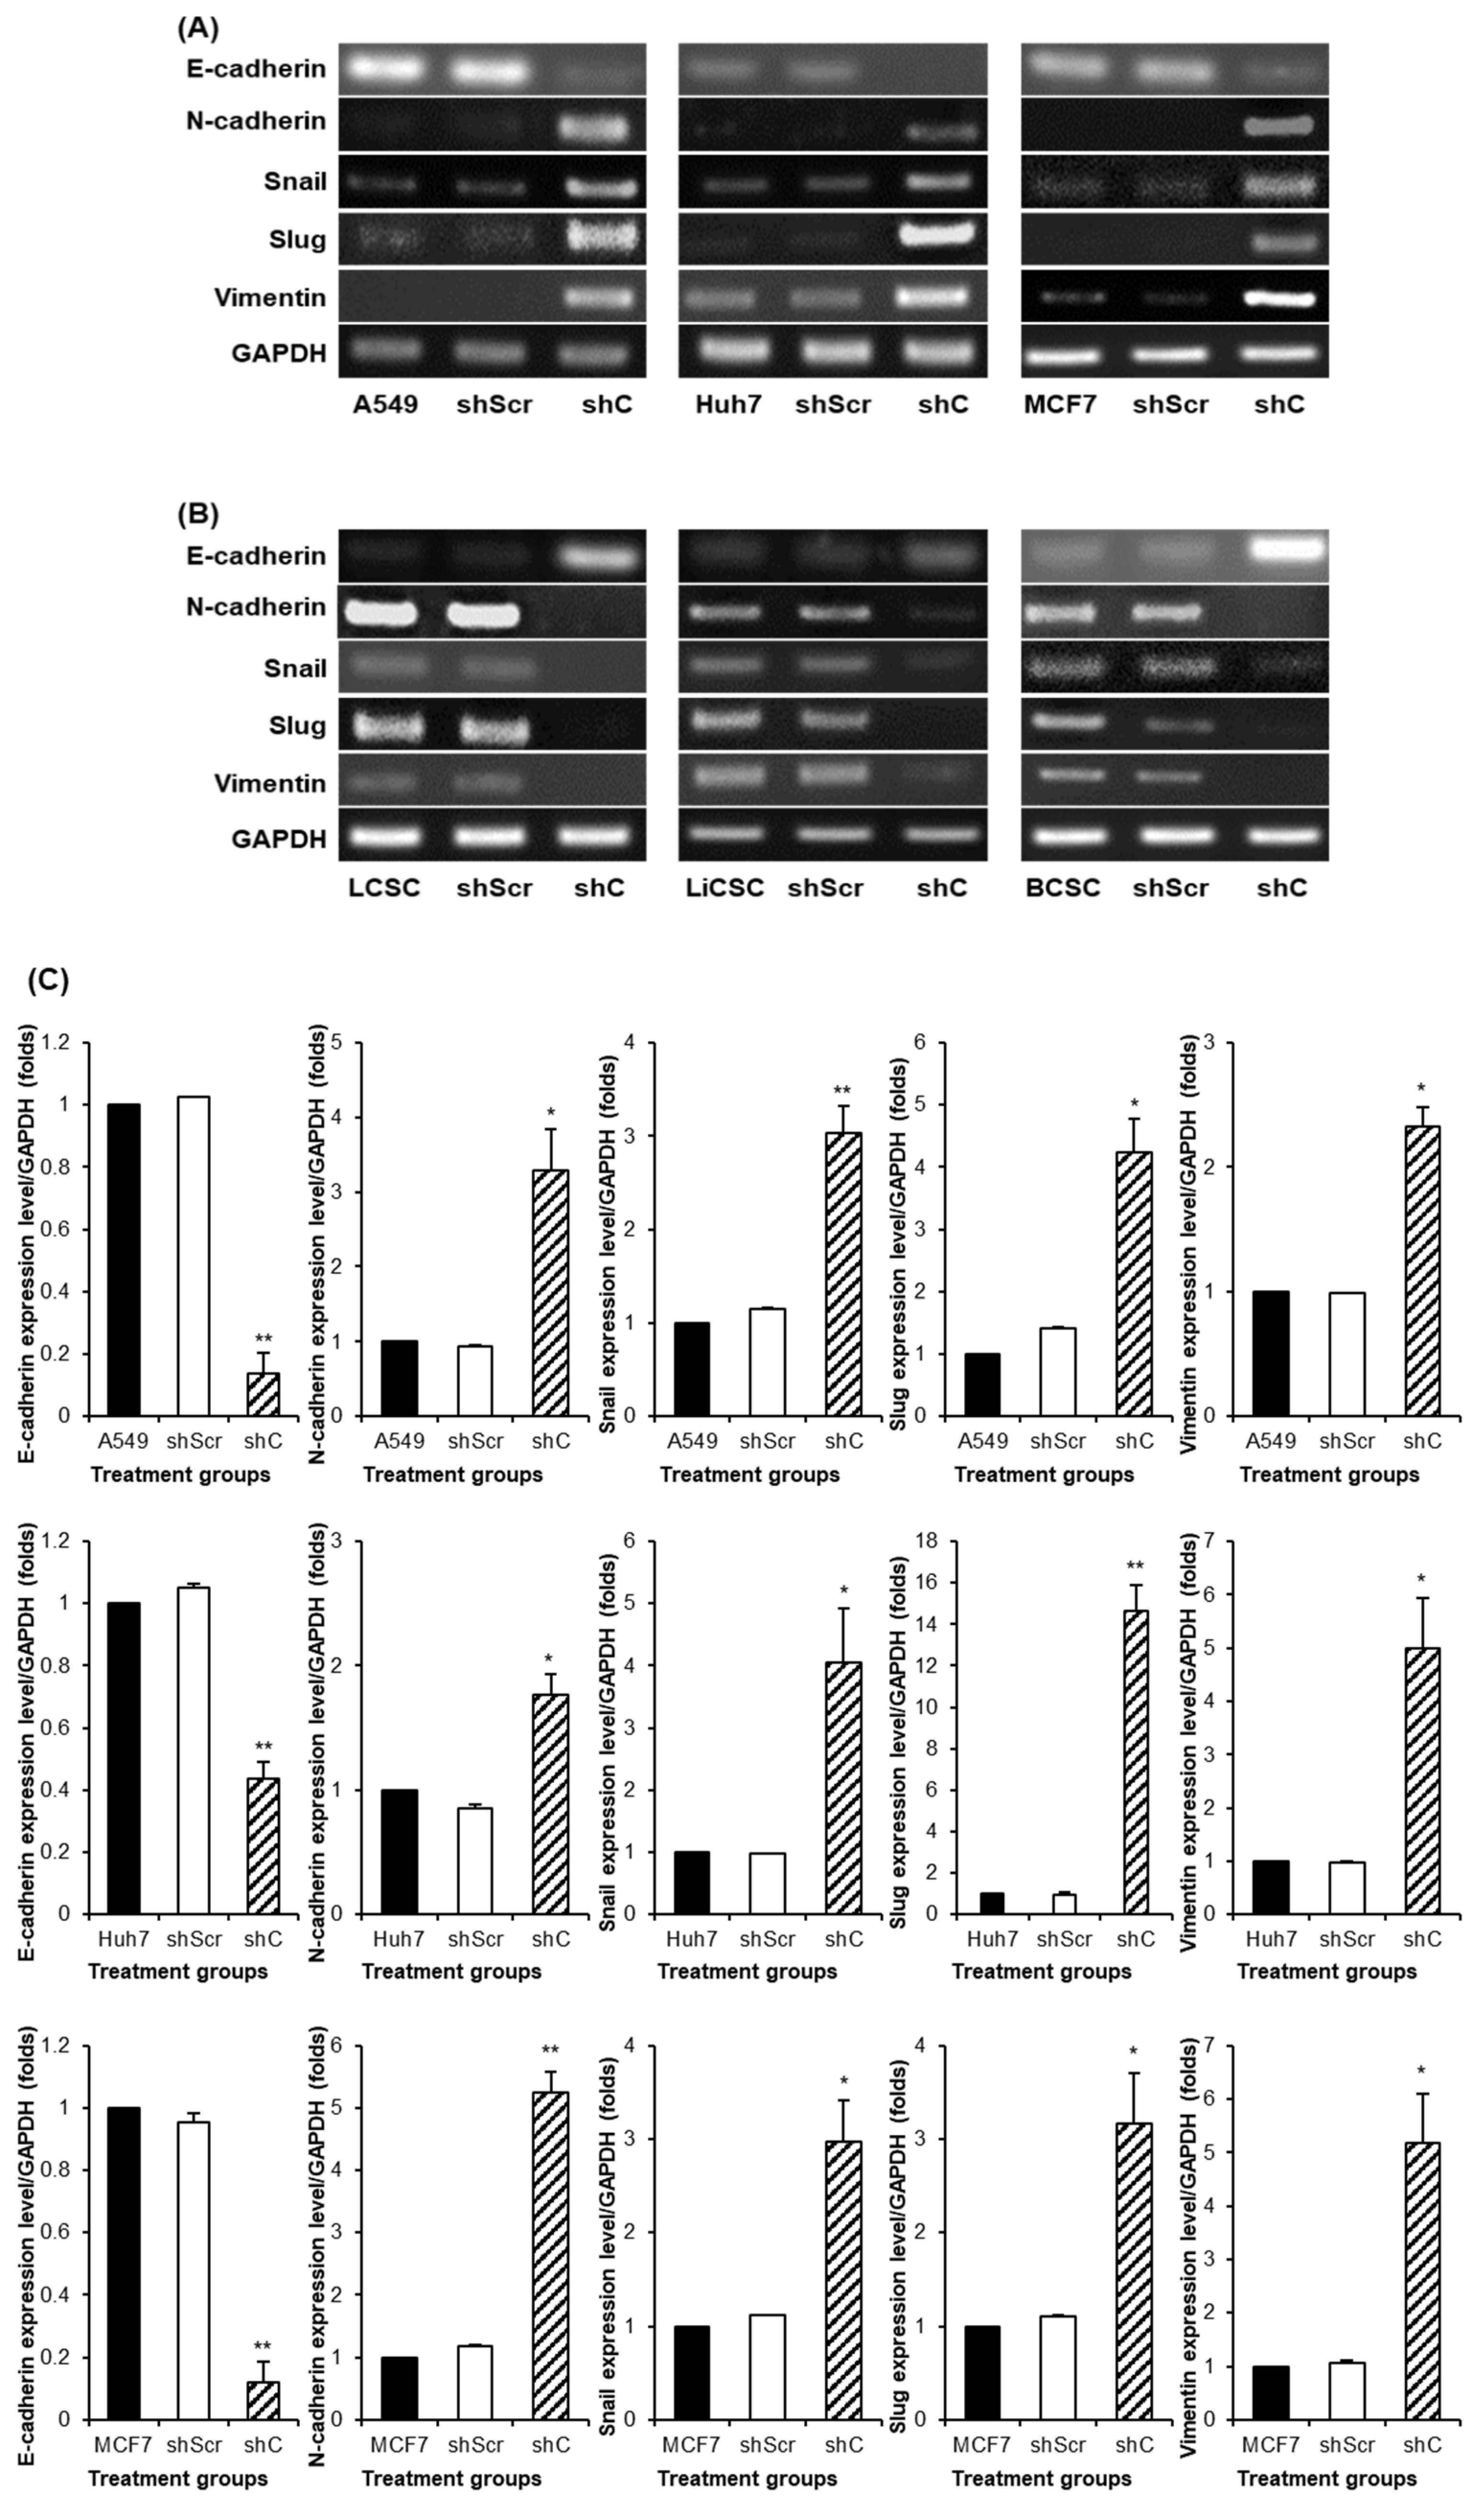
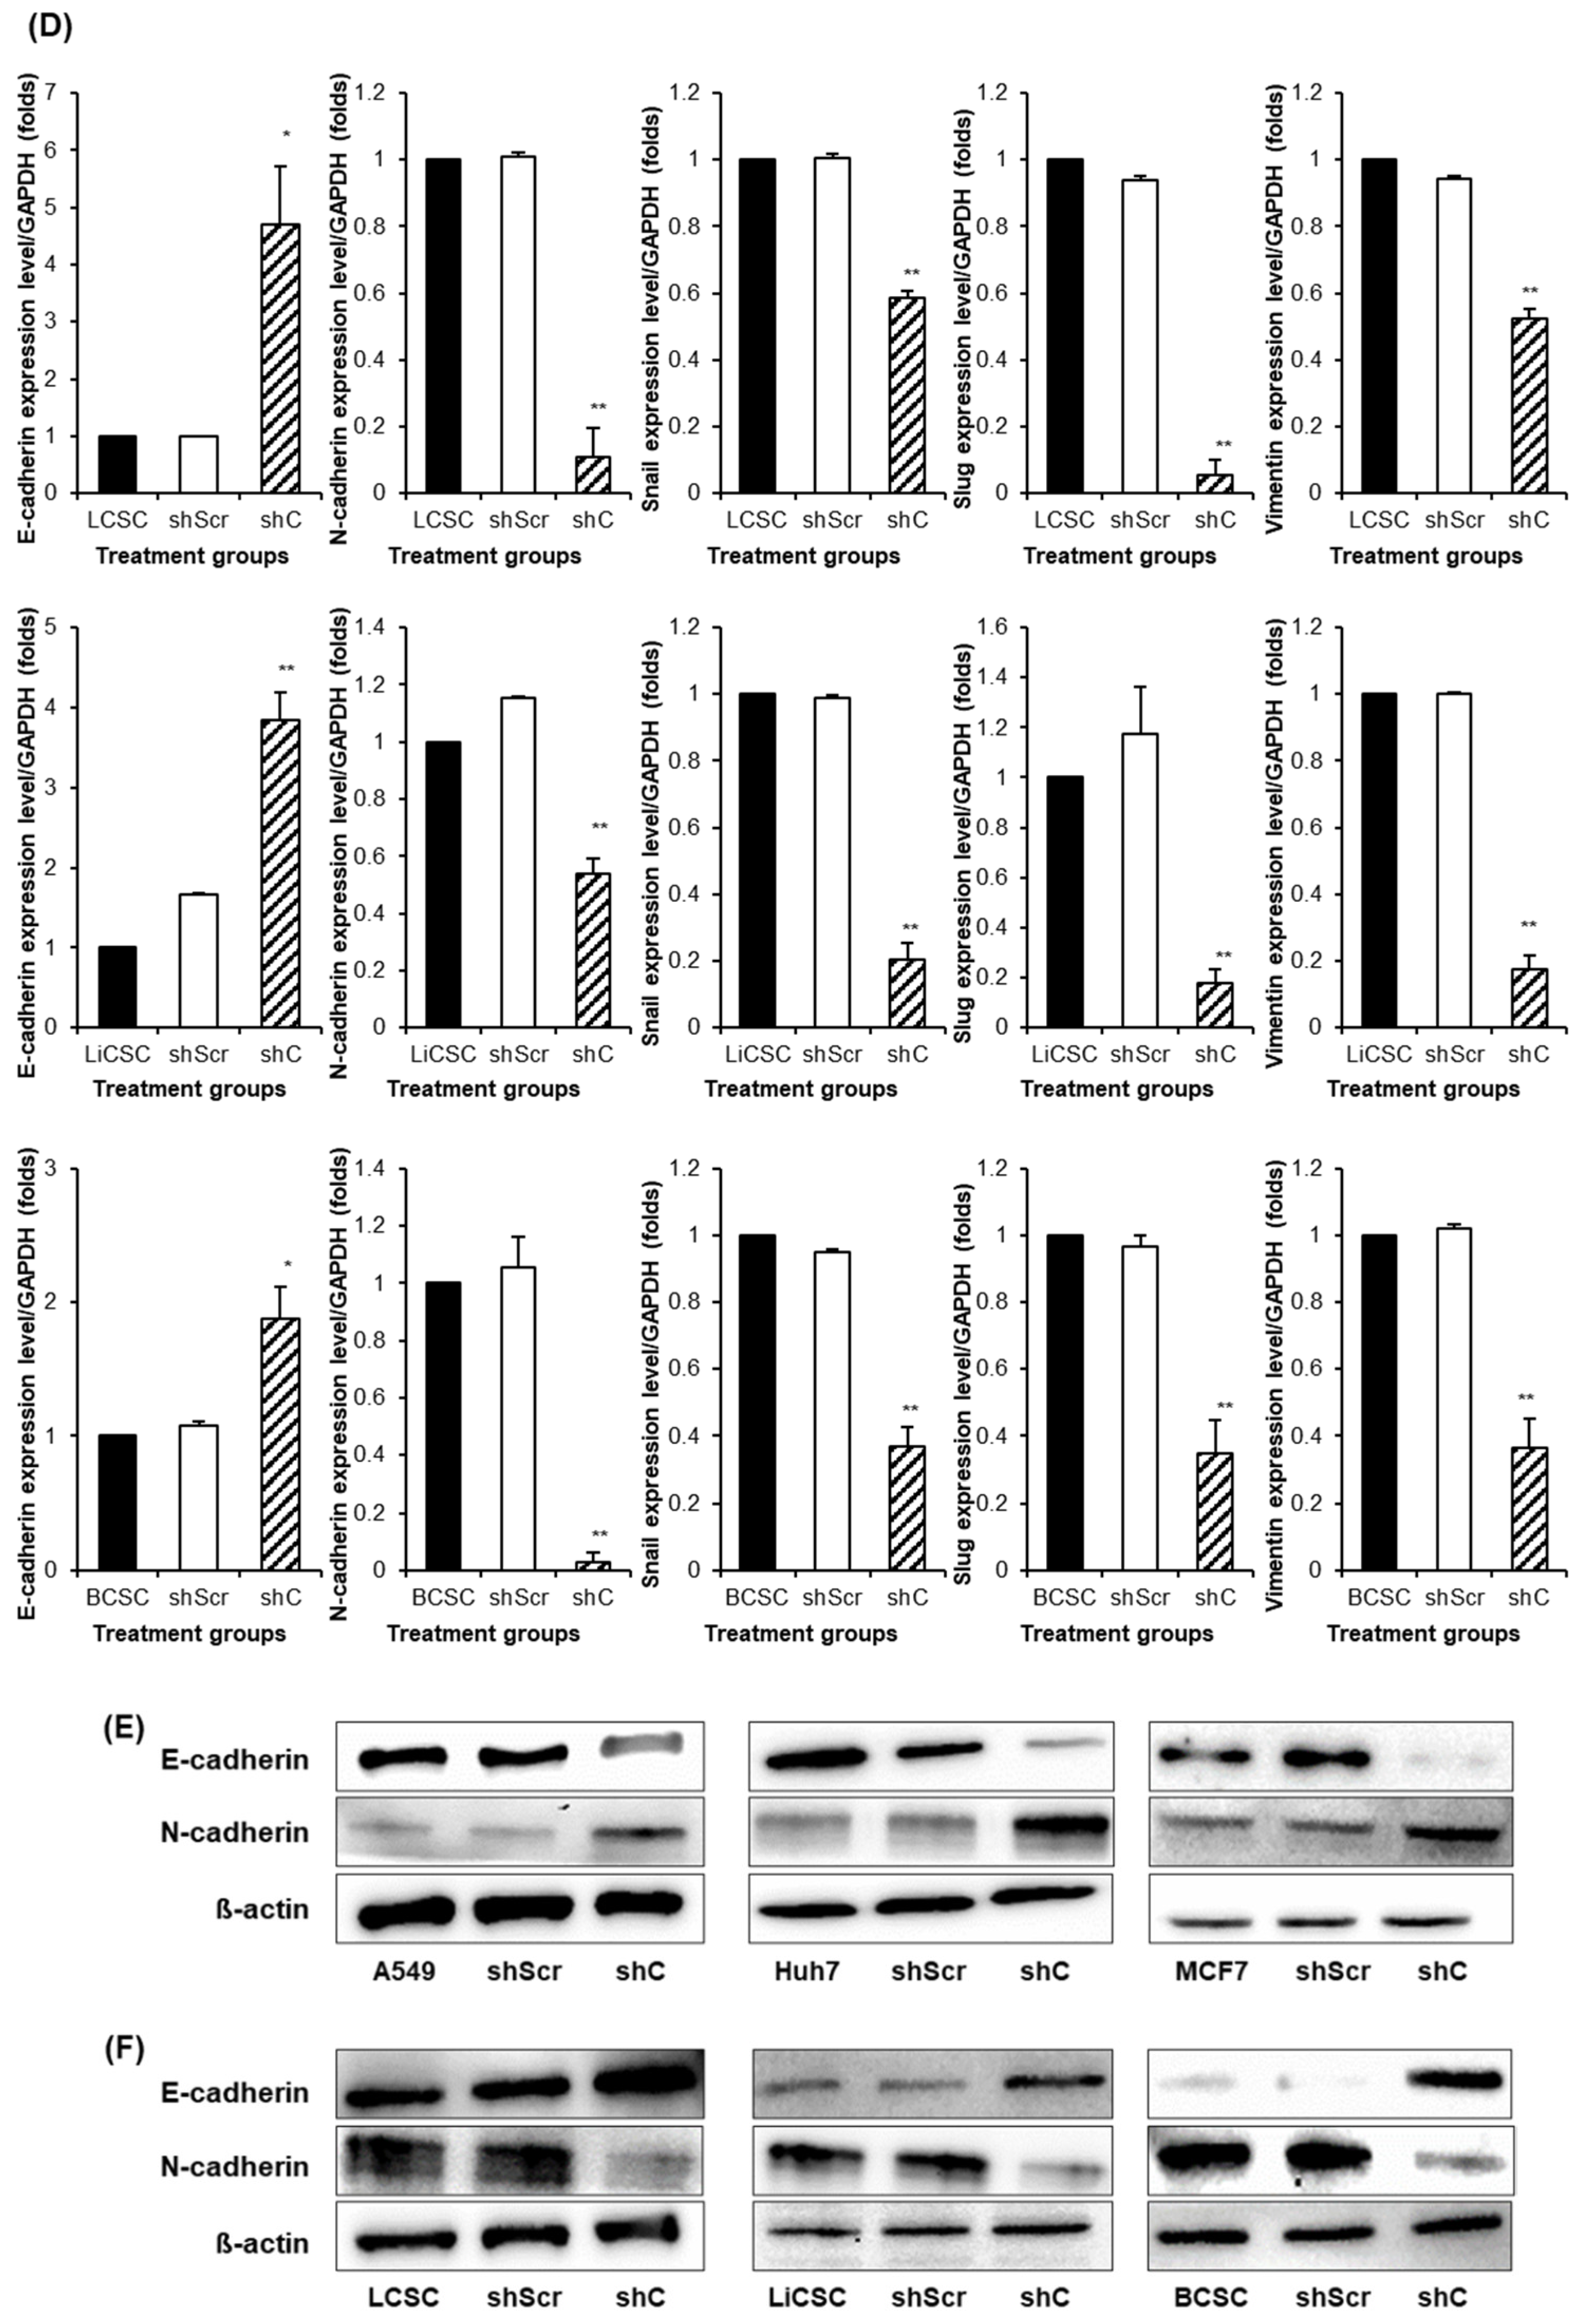
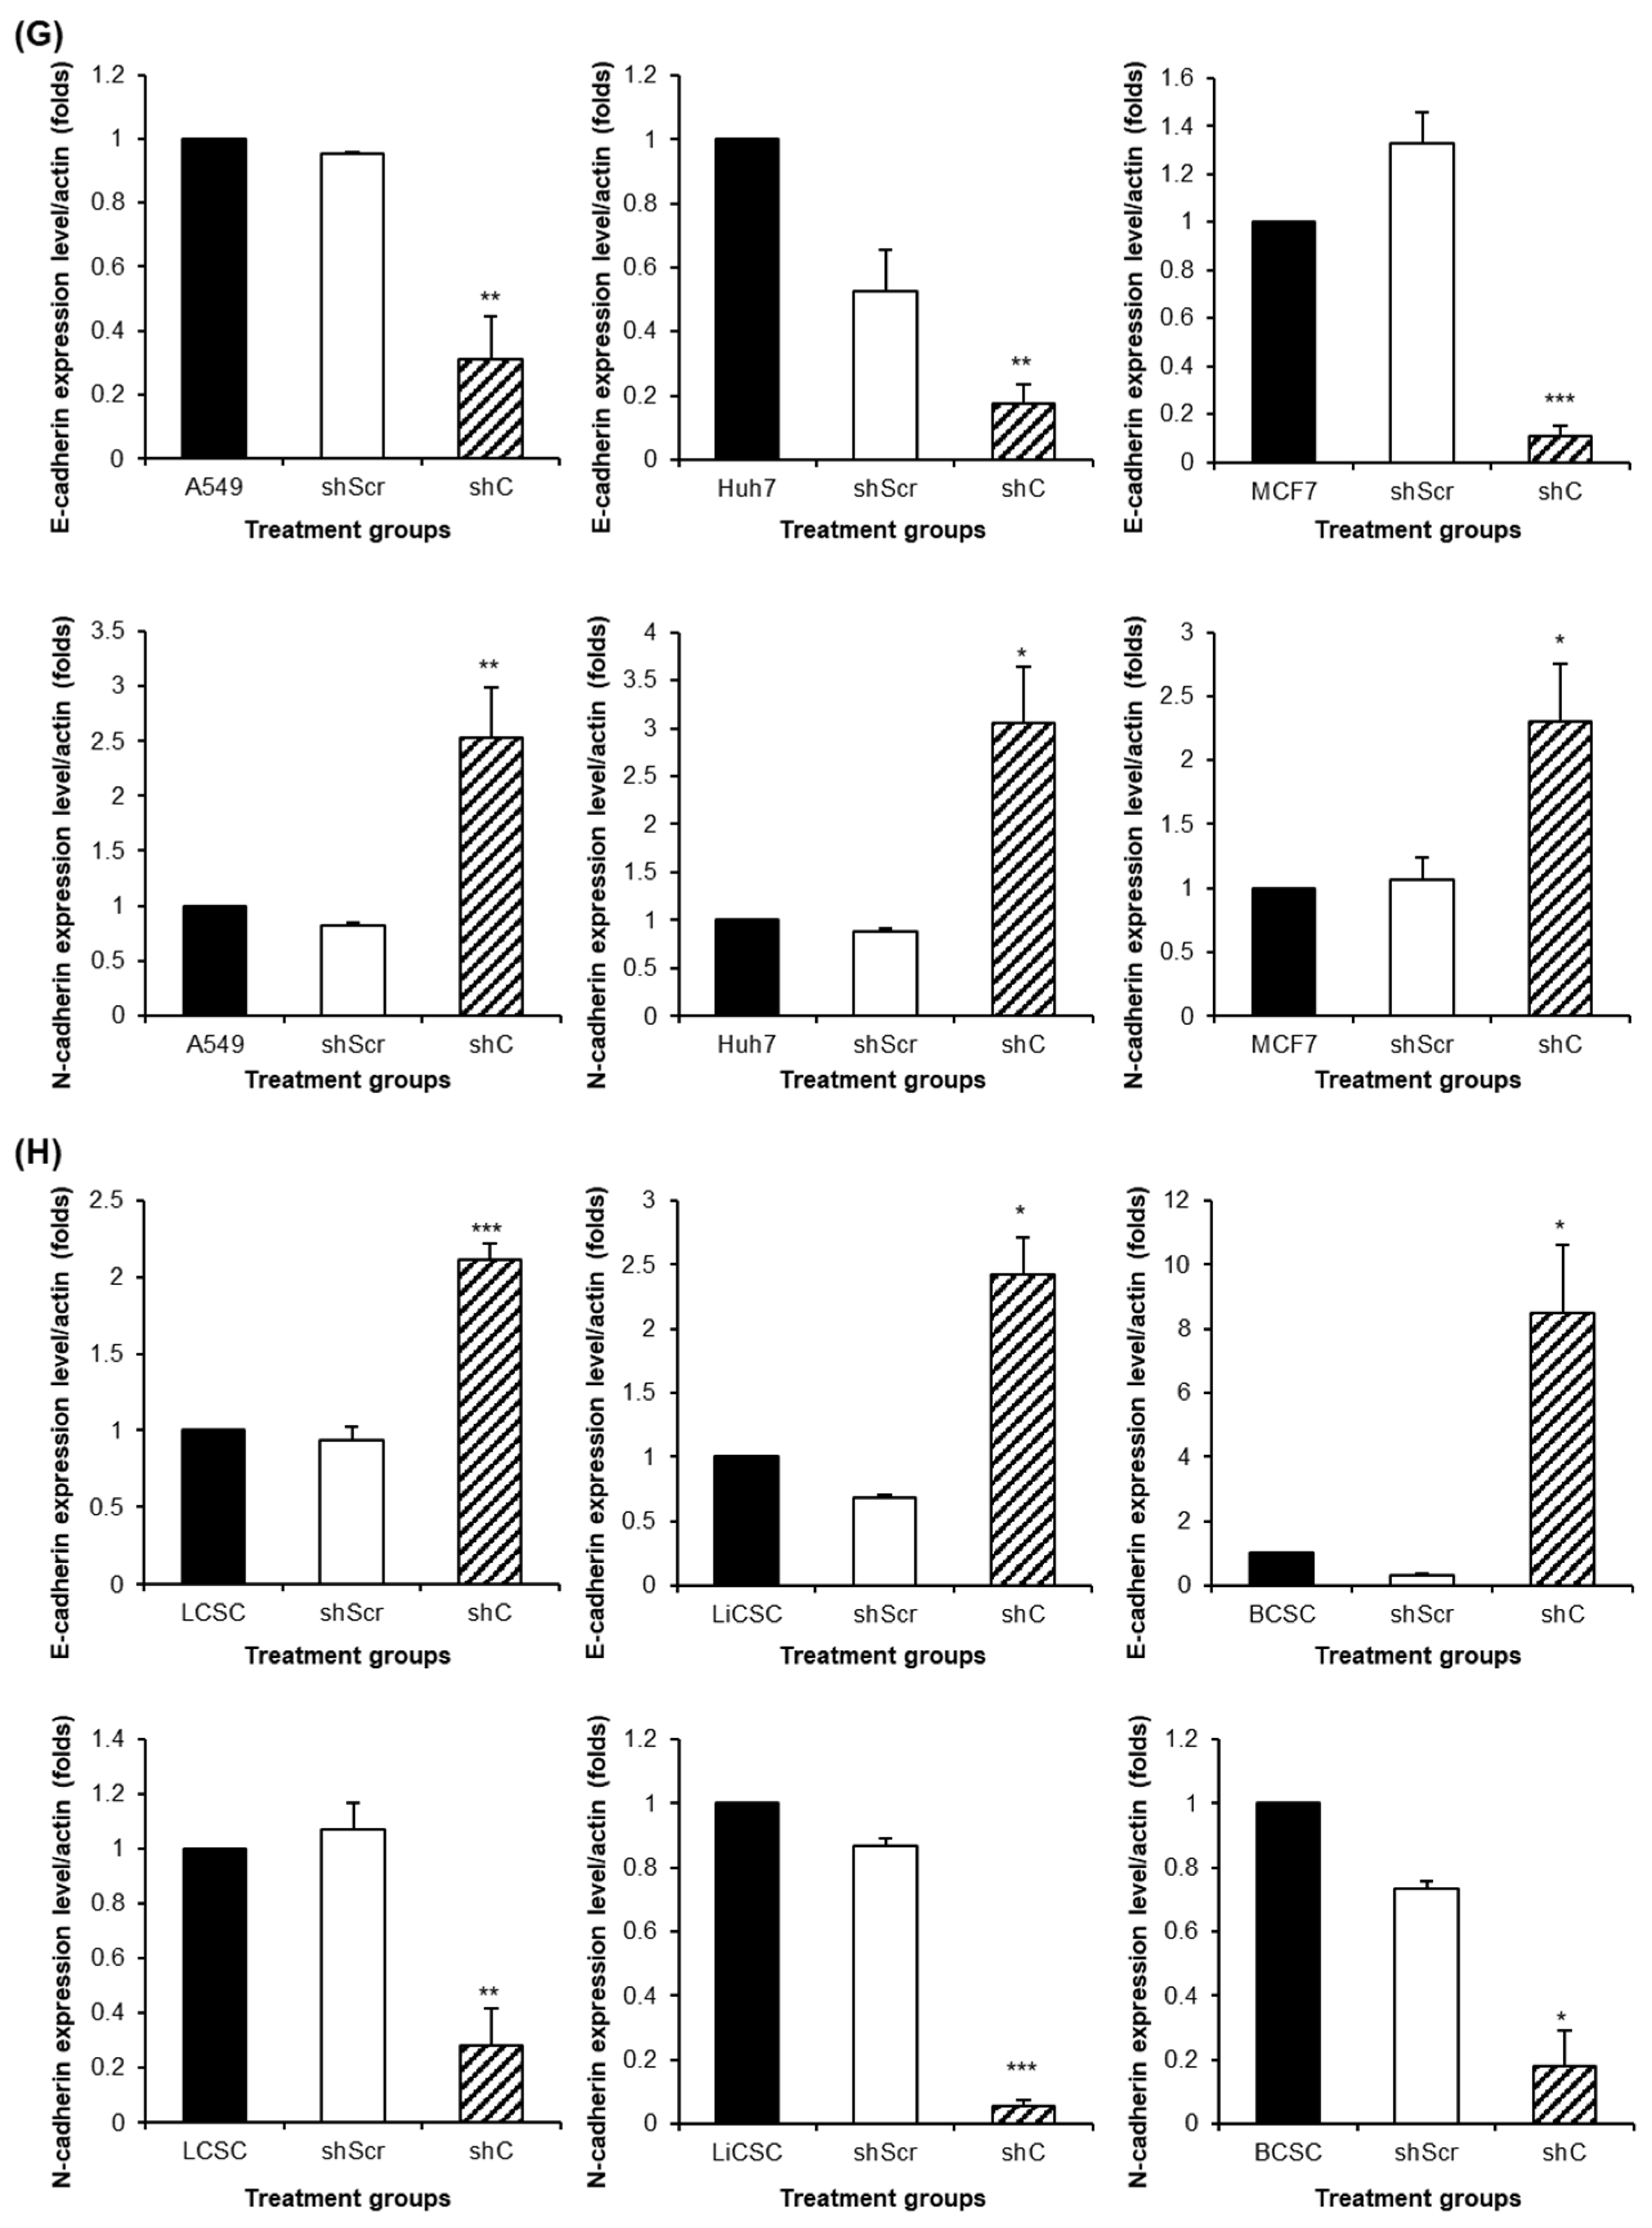
Figure 9.
The changed expression of stemness biomarkers by PRKAR1A shRNA in cancer cells and CSCs. PCR band of stemness biomarkers in transcriptomic level (A-B). Quantitative data represented using GAPDH (C-D). Data shown represent the mean ± SD (n = 3). *P < 0.05, **P < 0.01, and ***P < 0.001 compared with shC versus shScr groups.
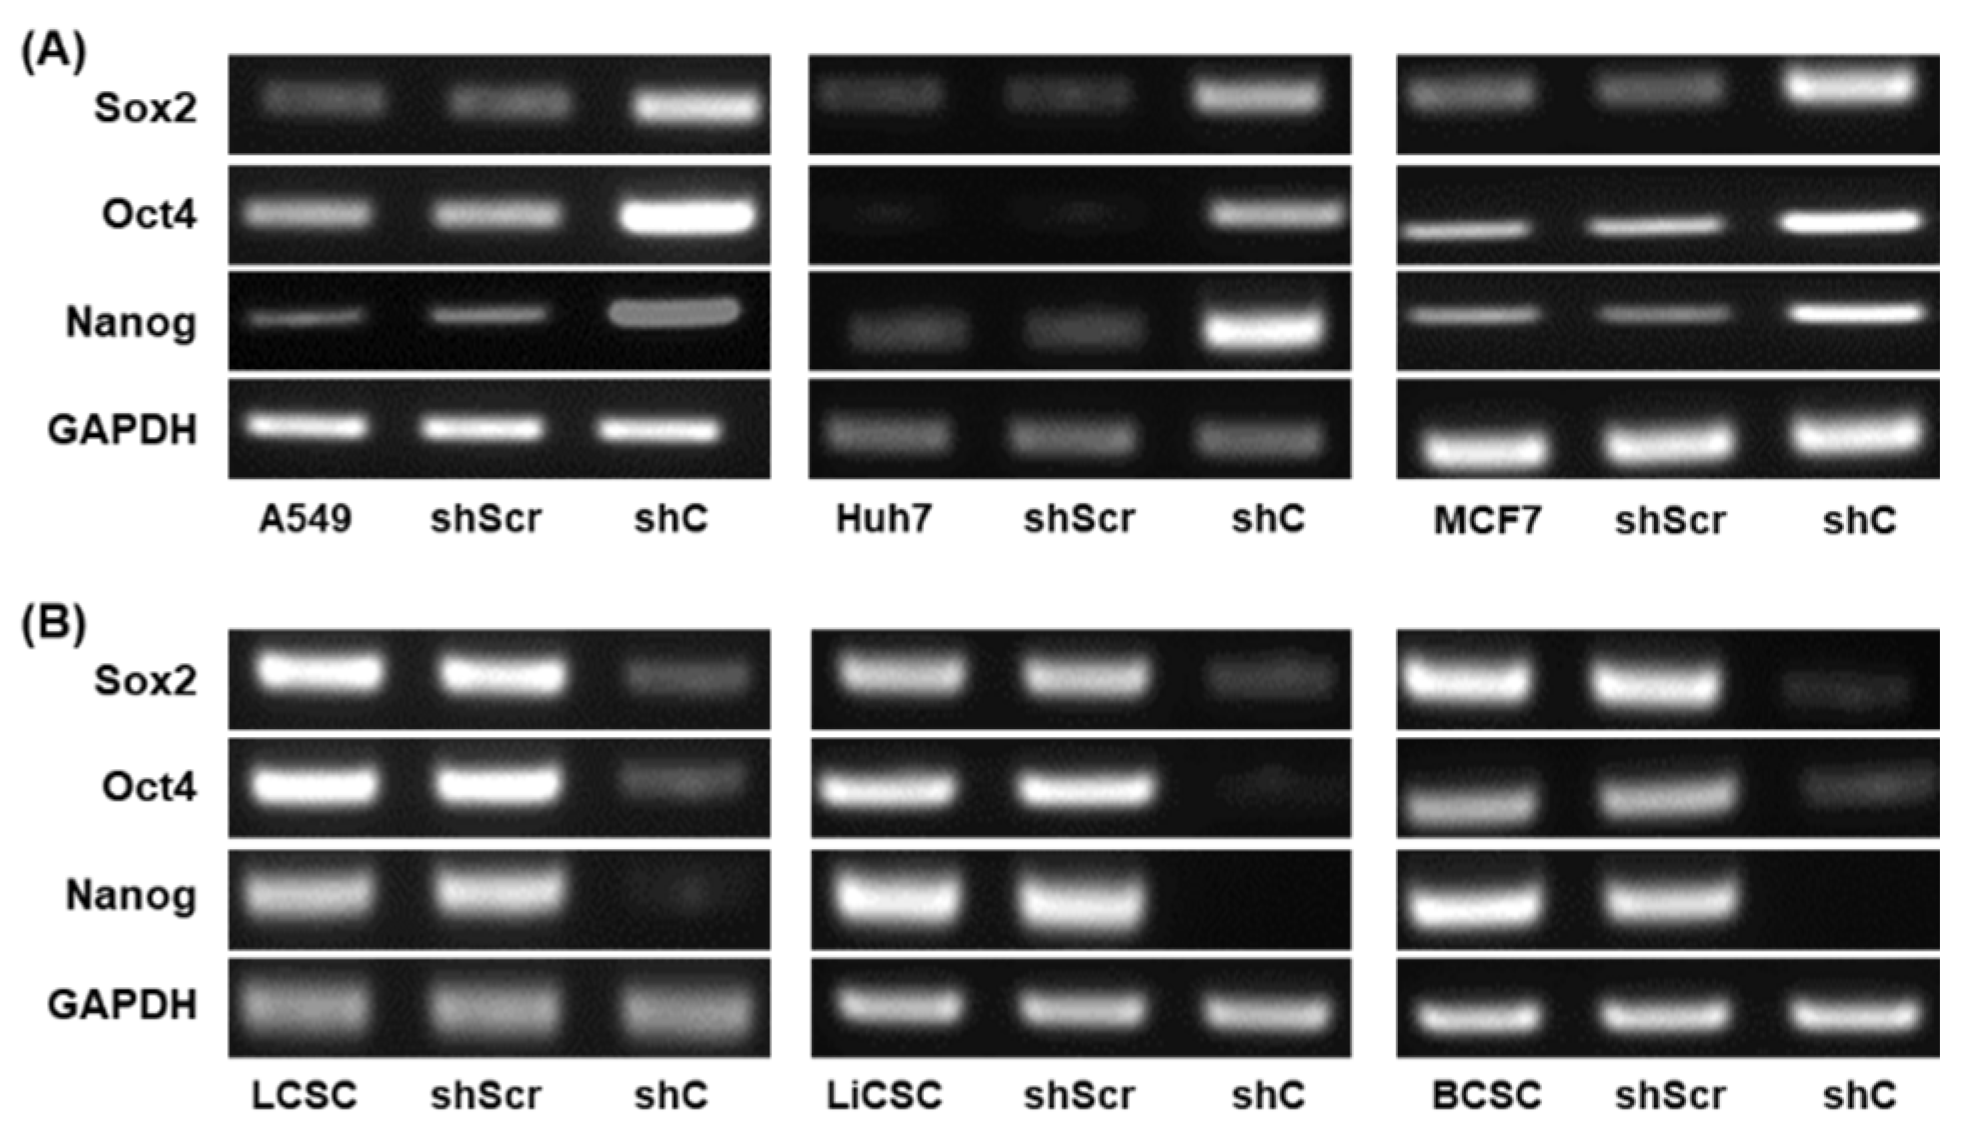
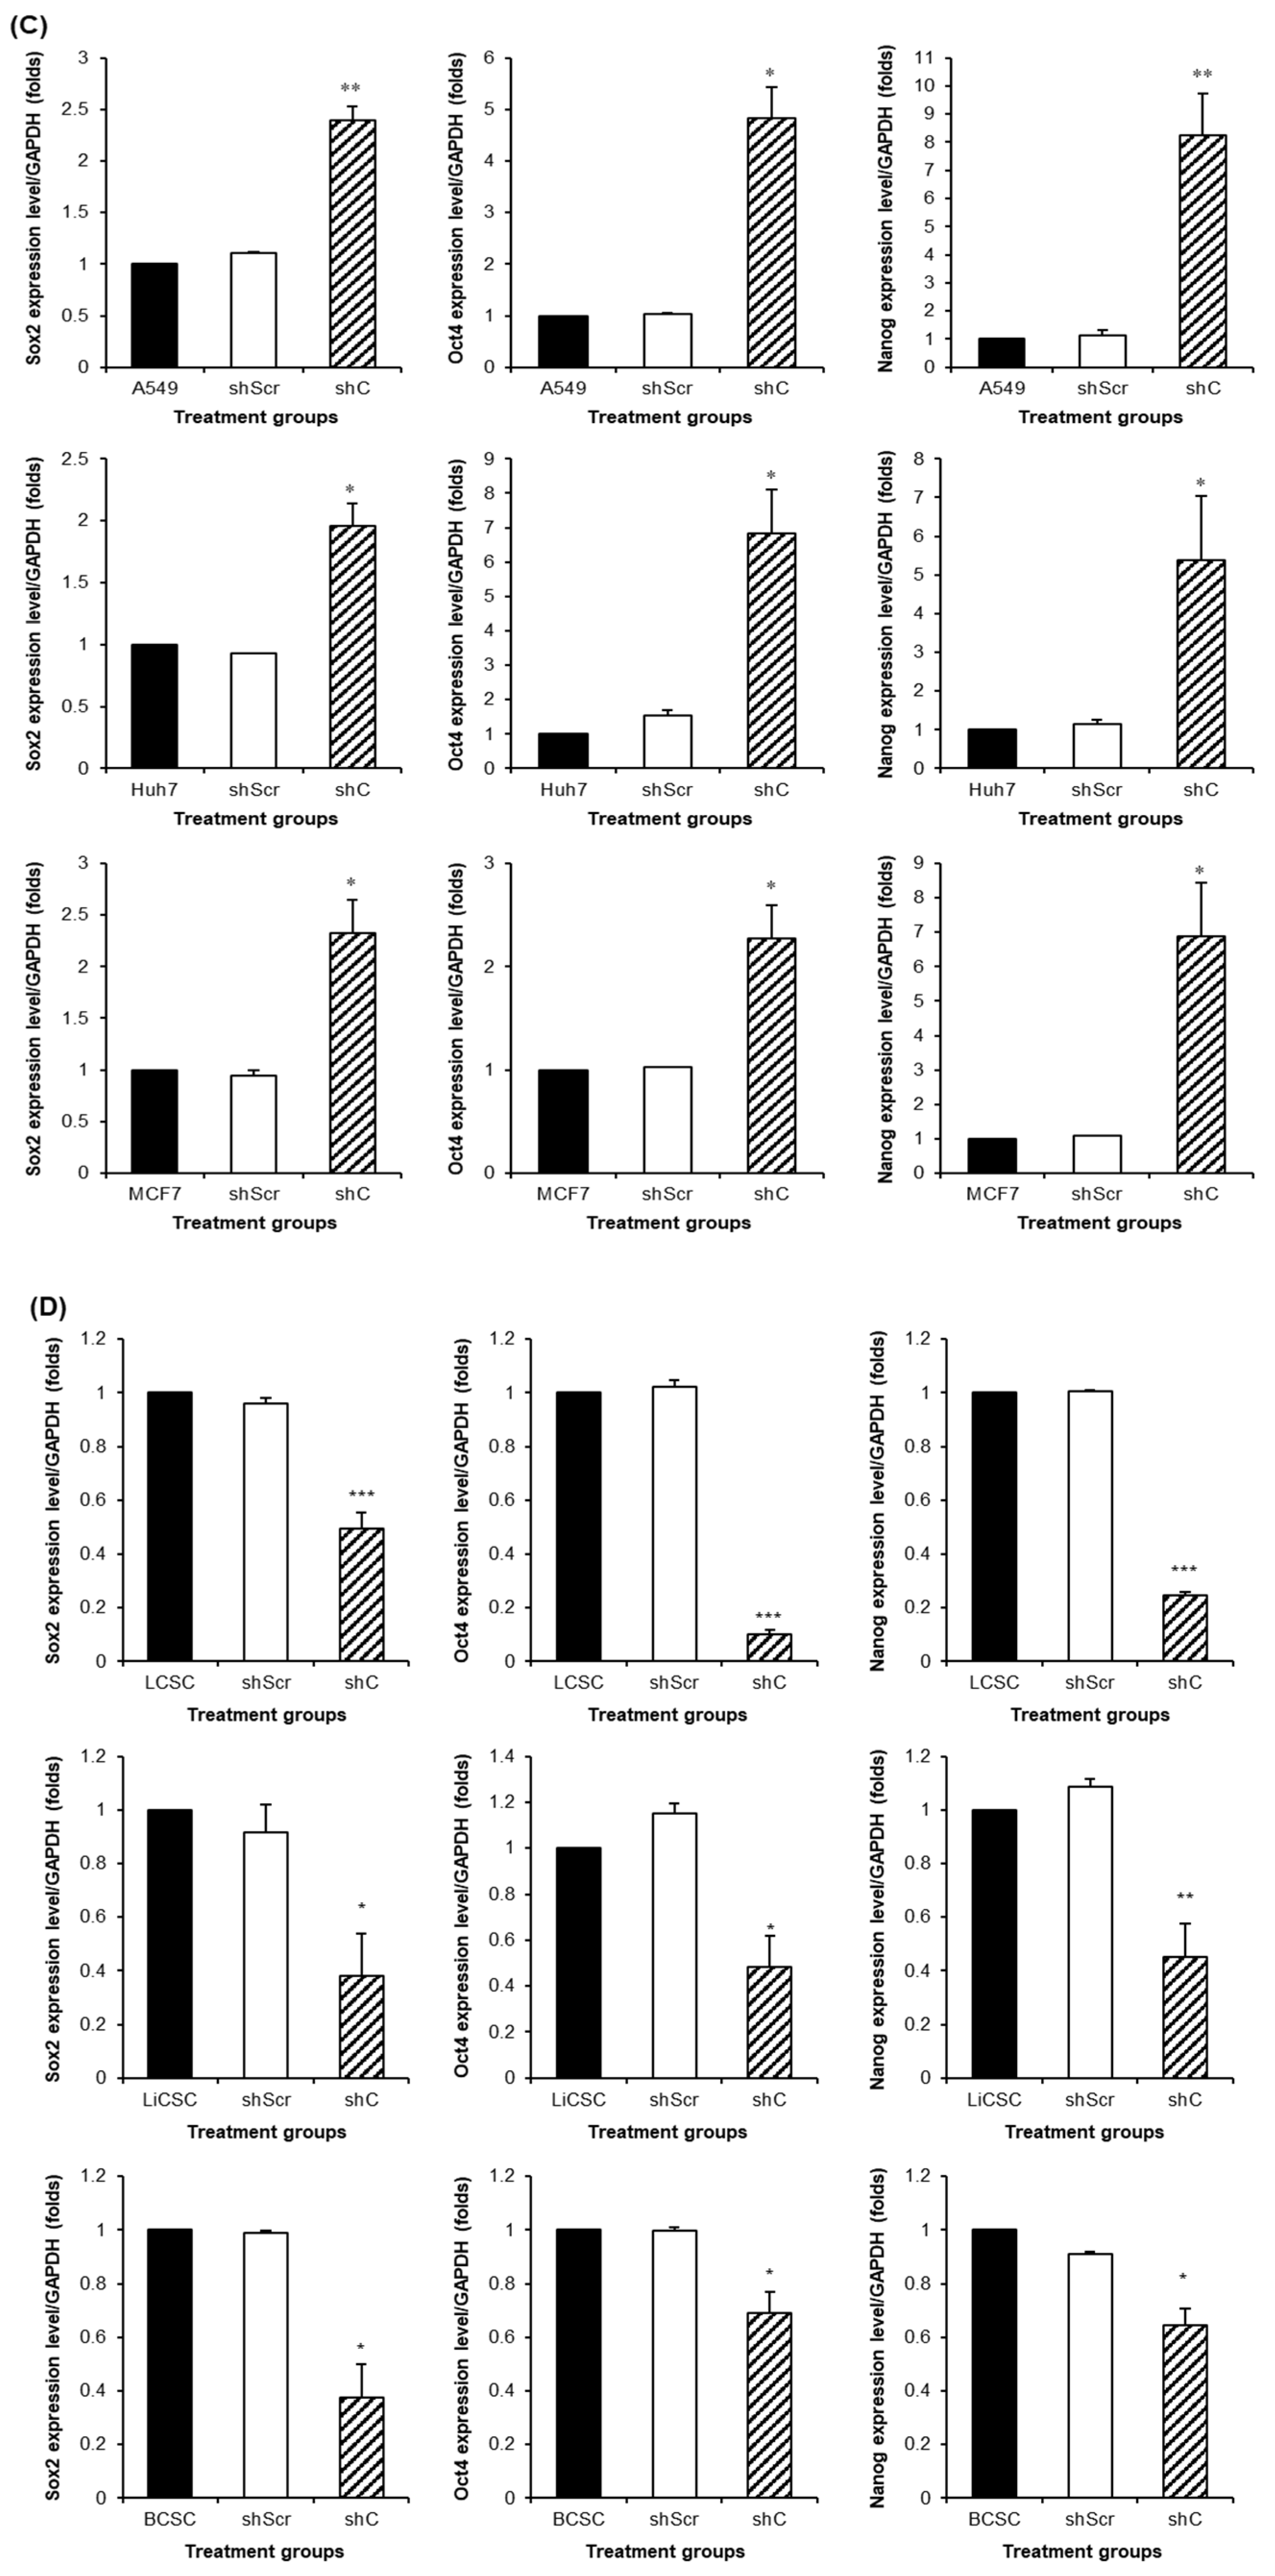
Figure 10.
Cancer cell killing effects by PRKAR1A shRNA treatment against anticancer agents. The anticancer drug resistance in cells with reduced PRKAR1A expression was assessed using the MTT assay. Cells were treated with doxorubicin (DOX) at concentrations of 0, 1, 2, 4, and 5 µM for 24 h, and cell viability was determined (A-B). Data shown represent the mean ± SD (n = 3). *P < 0.05, **P < 0.01, and ***P < 0.001 compared of the group treated with shC+DOX to cells treated with shScr+DOX, as well as cells without any treatment.
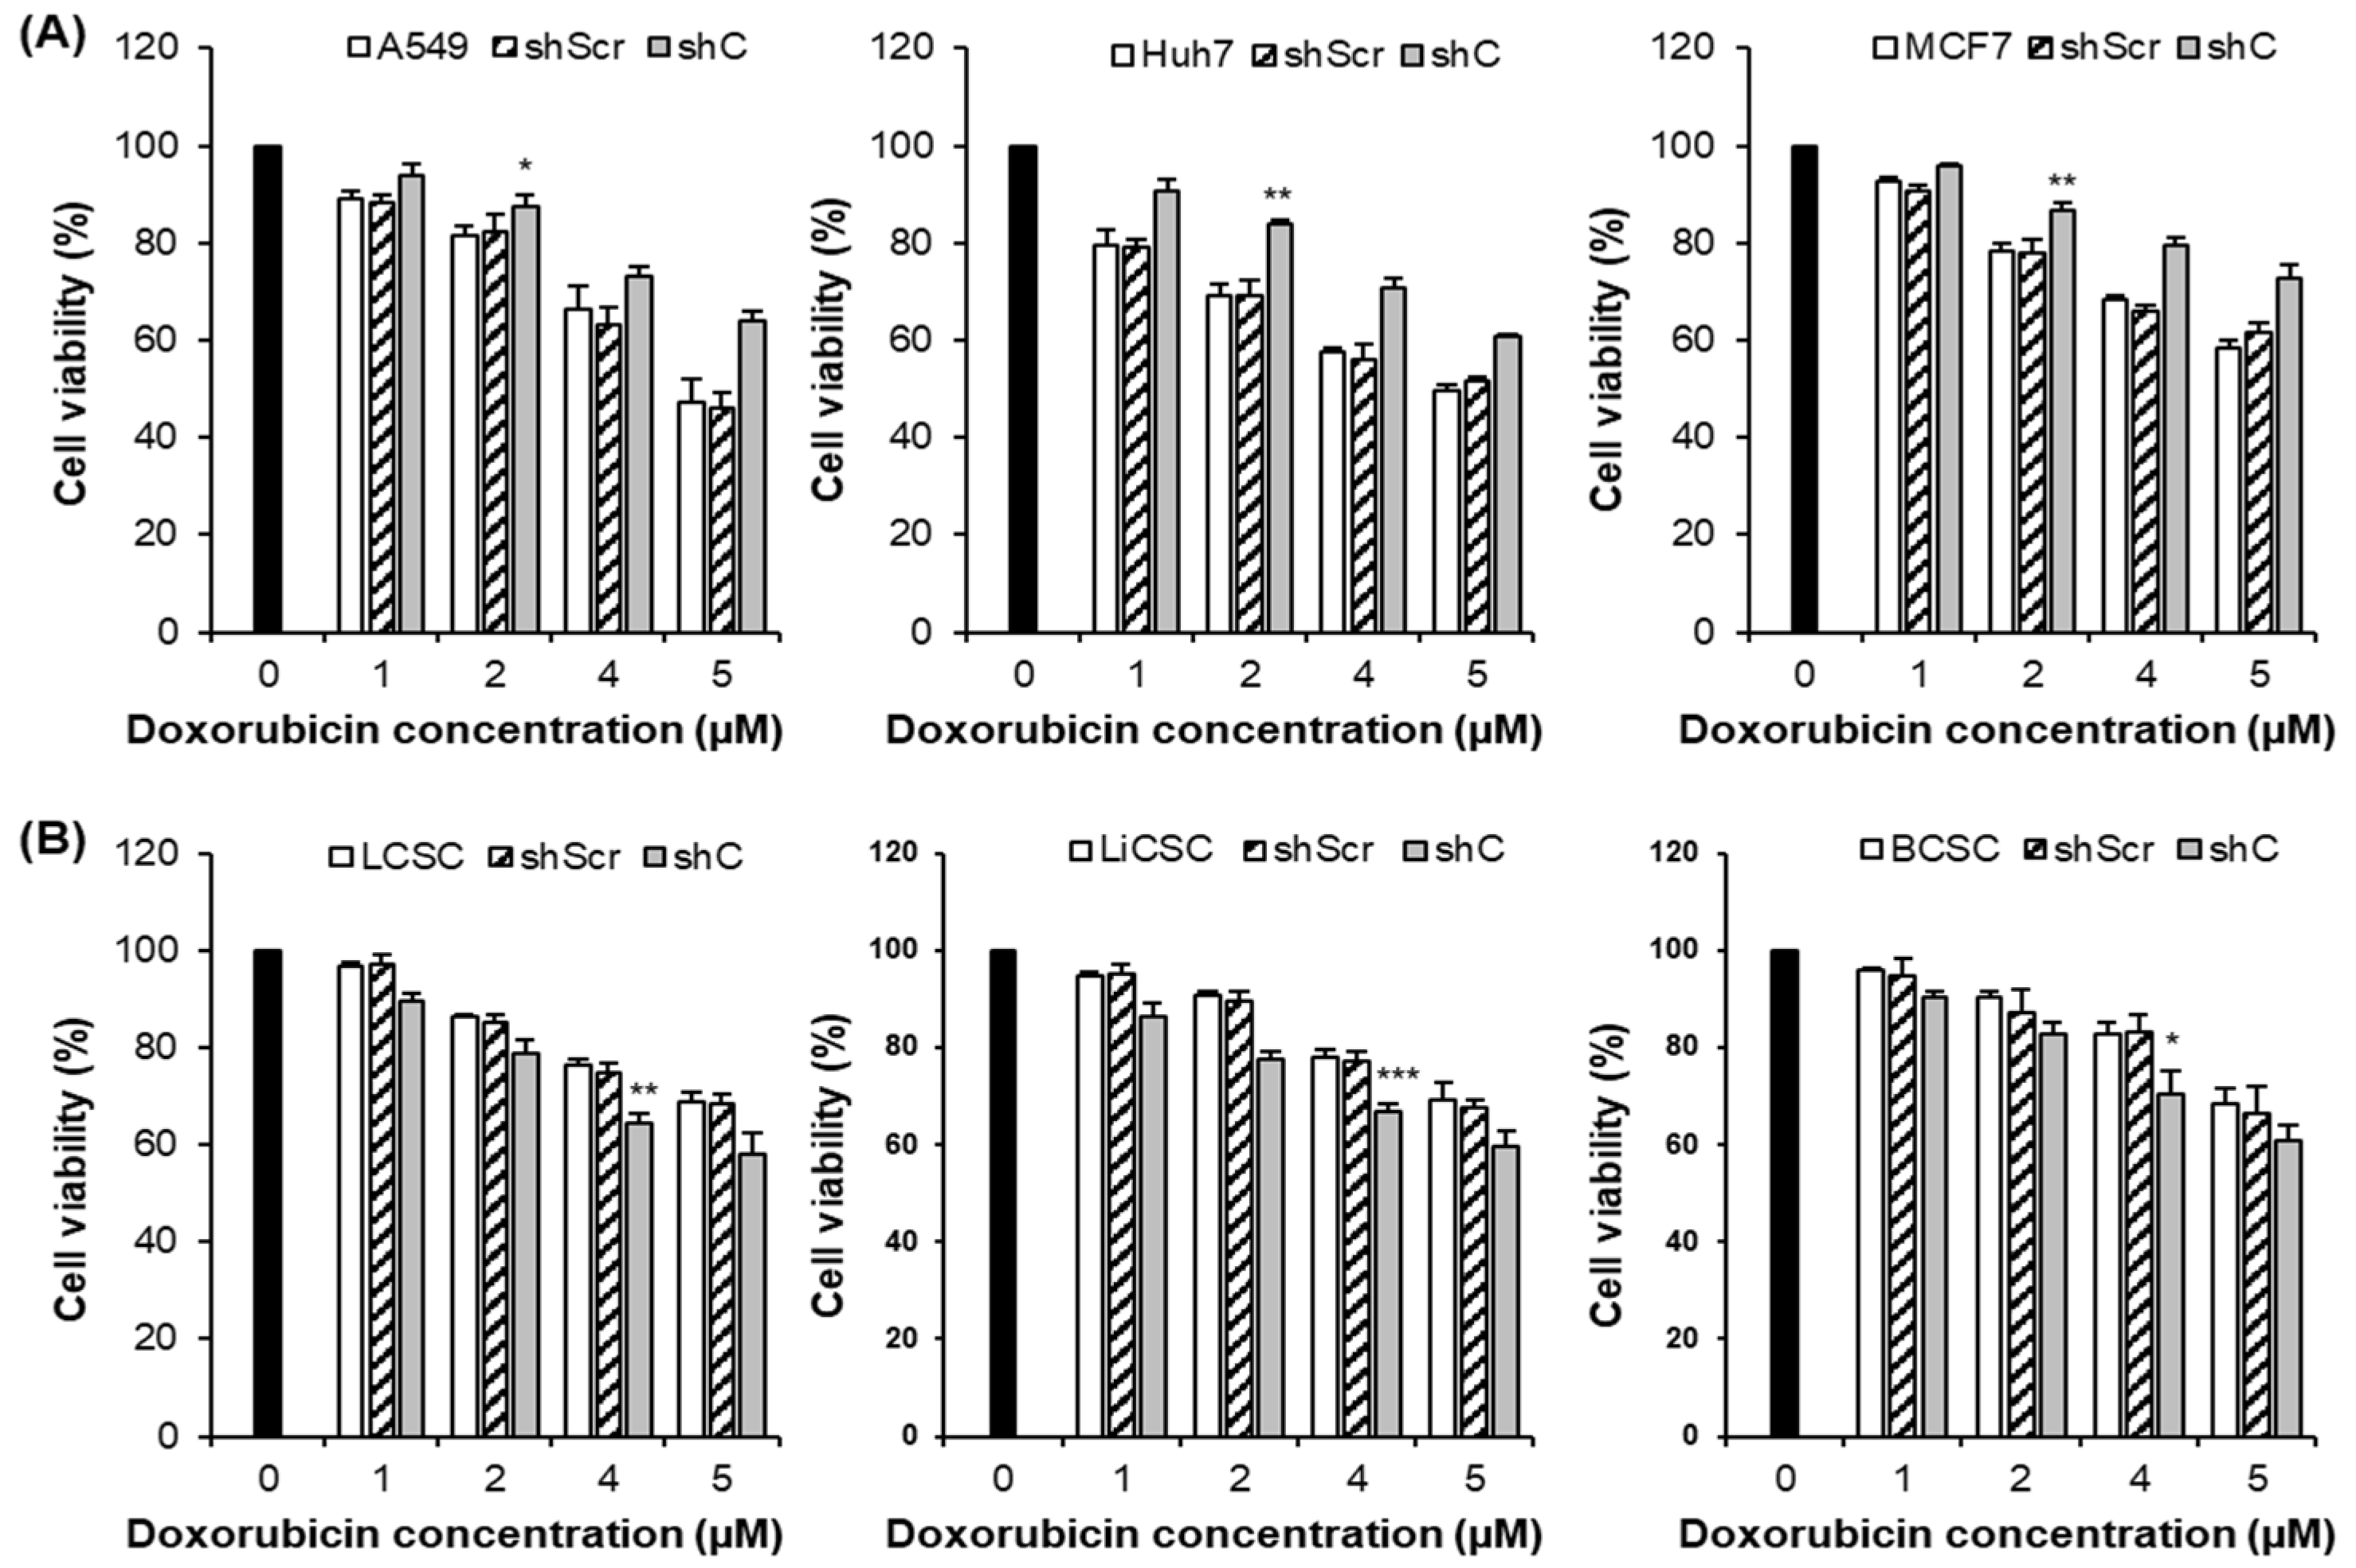
Figure 11.
The induction comparison of cell death by PRKAR1A knockdown in cancer cells and CSCs. The apoptosis assay was performed with annexin-V-FITC/PI flow cytometry analysis (A-B). Cell death was represented graphically as the sum of all cell death values in quadrants 1, 2, and 4. Data shown represent the mean ± SD (n = 3). *P < 0.05, and **P < 0.01 for the comparison of shC+DOX- and shScr+DOX-treated groups.
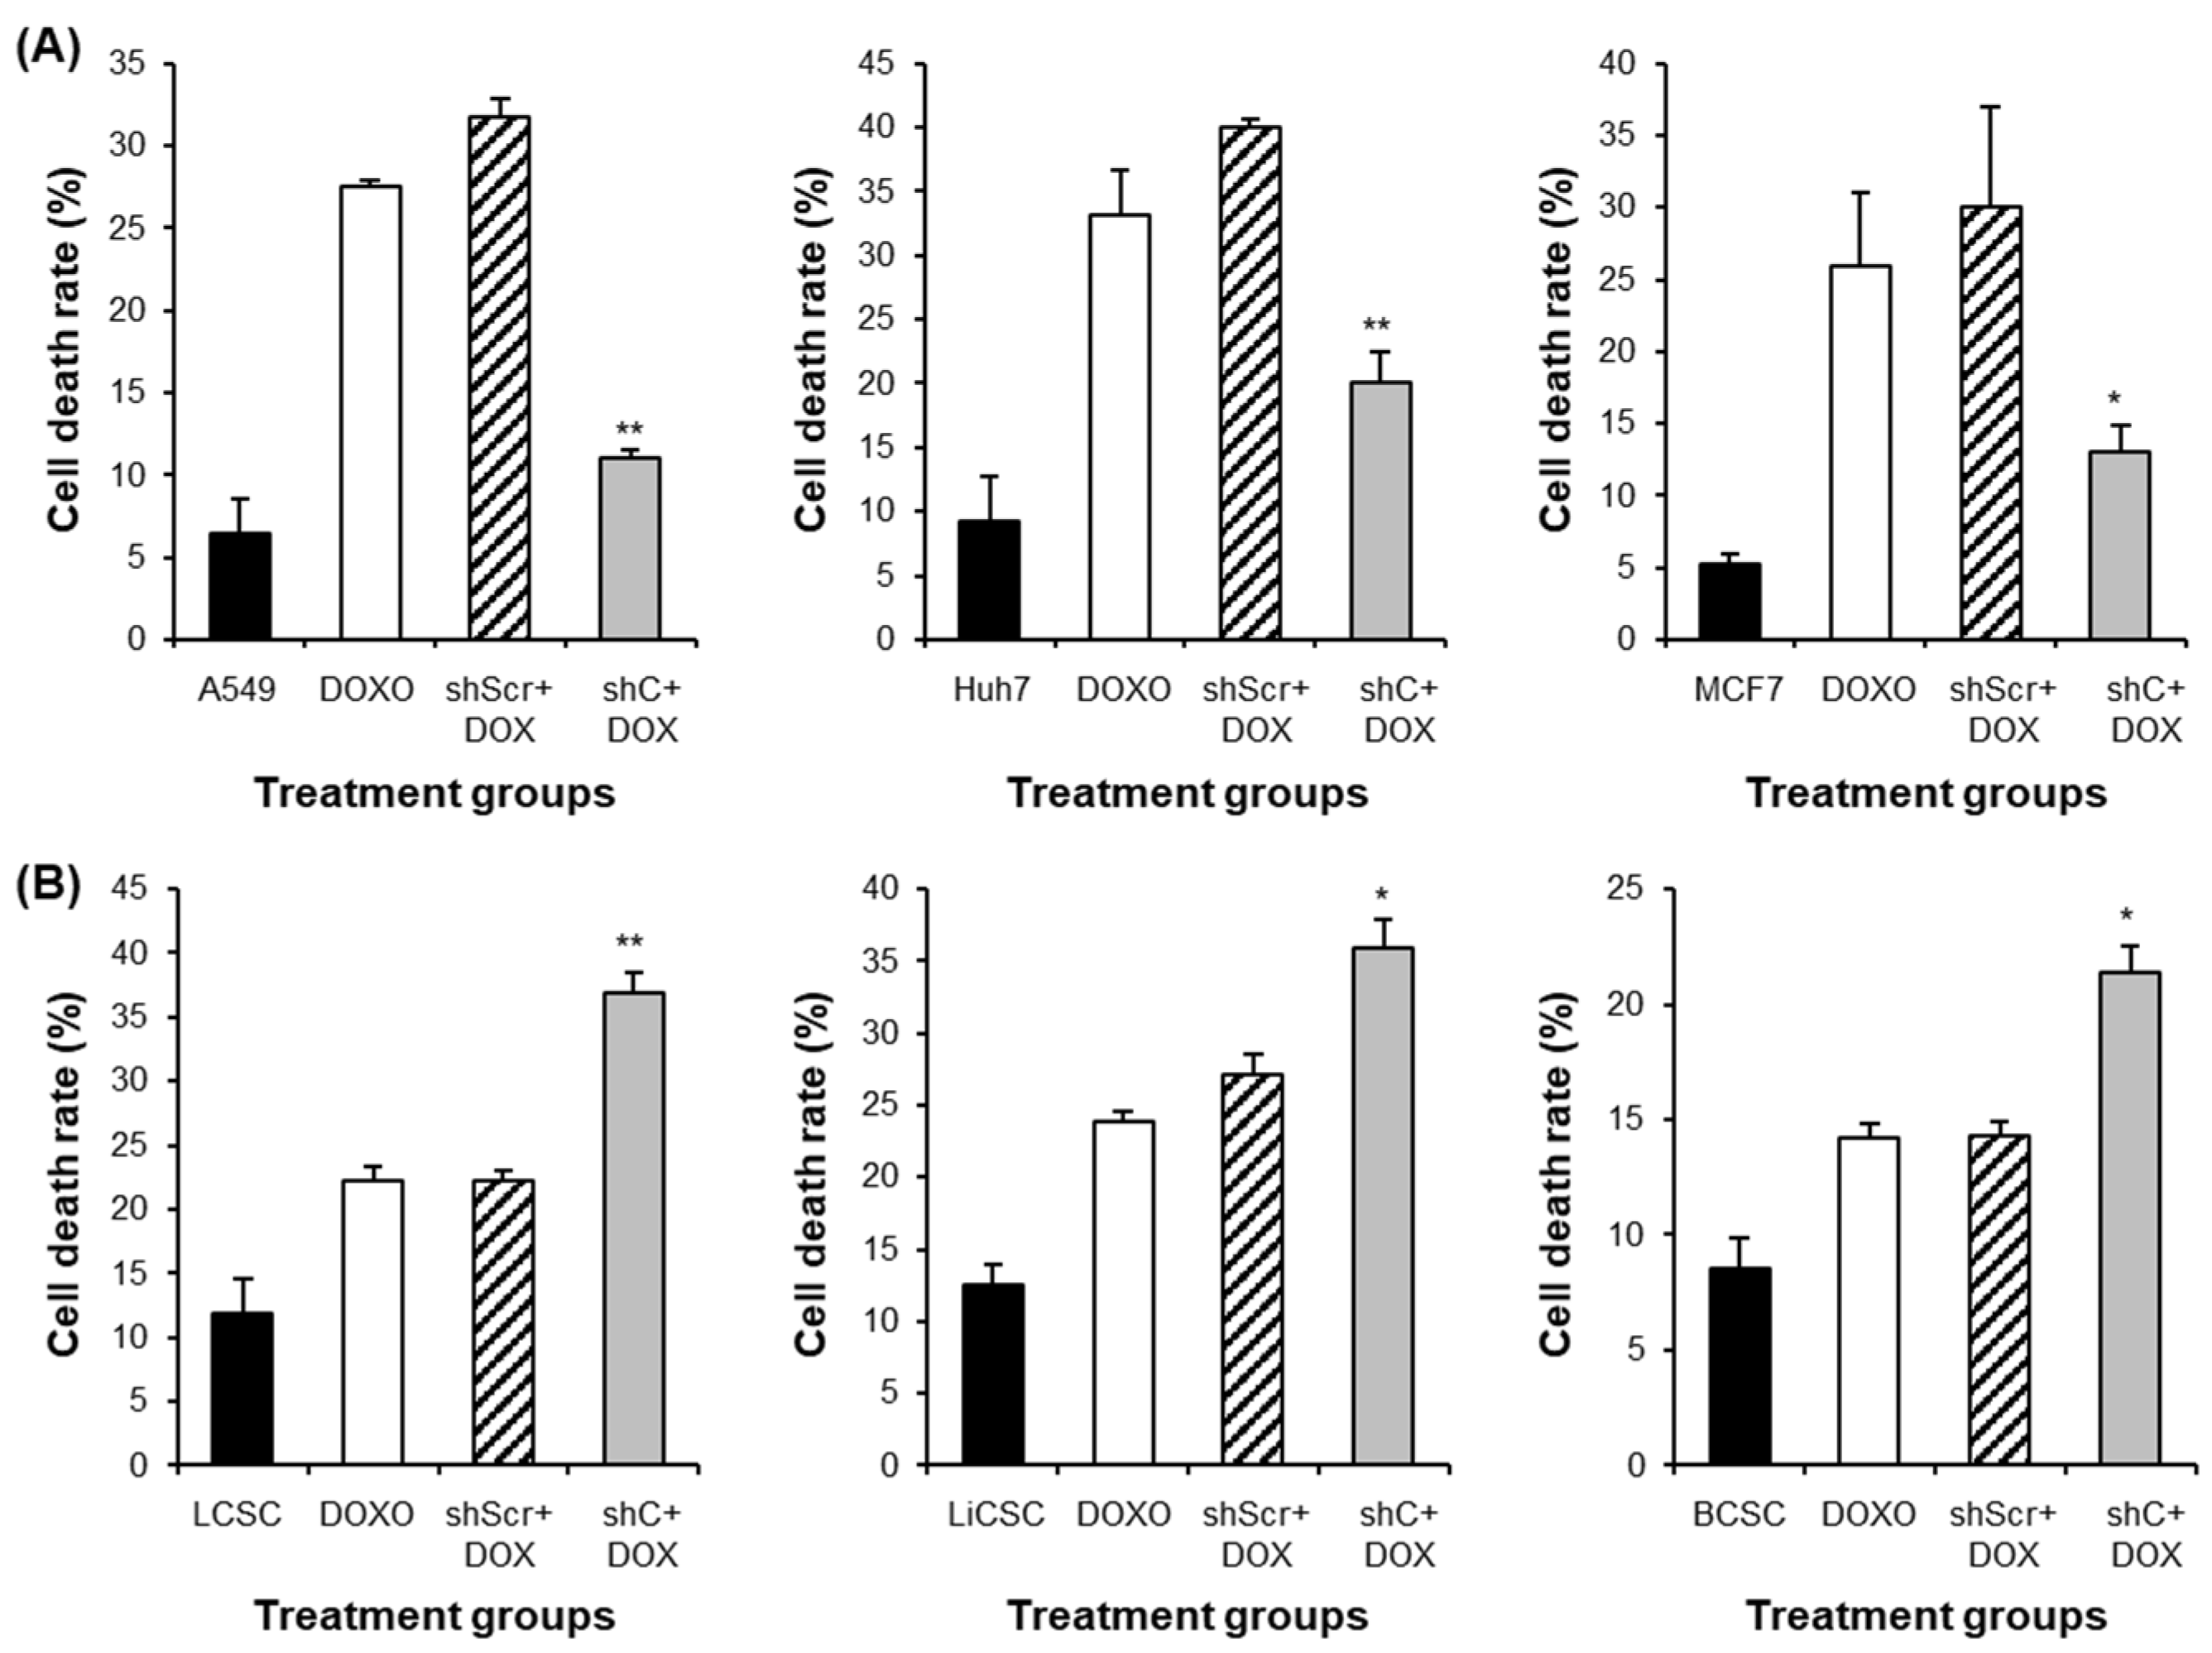
Figure 12.
MDR1 gene expression and cancer cell effects by PRKAR1A down-regulating in chemoresistance cell lines. MDR1 expression comparison (A-D) and cytoxic effects (E-F) in anticancer drug-resistant cancer cells and CSCs. Data shown represent the mean ± SD (n = 3). *P < 0.05, **P < 0.01, and ***P < 0.001 for the comparison of shScr ans shC.
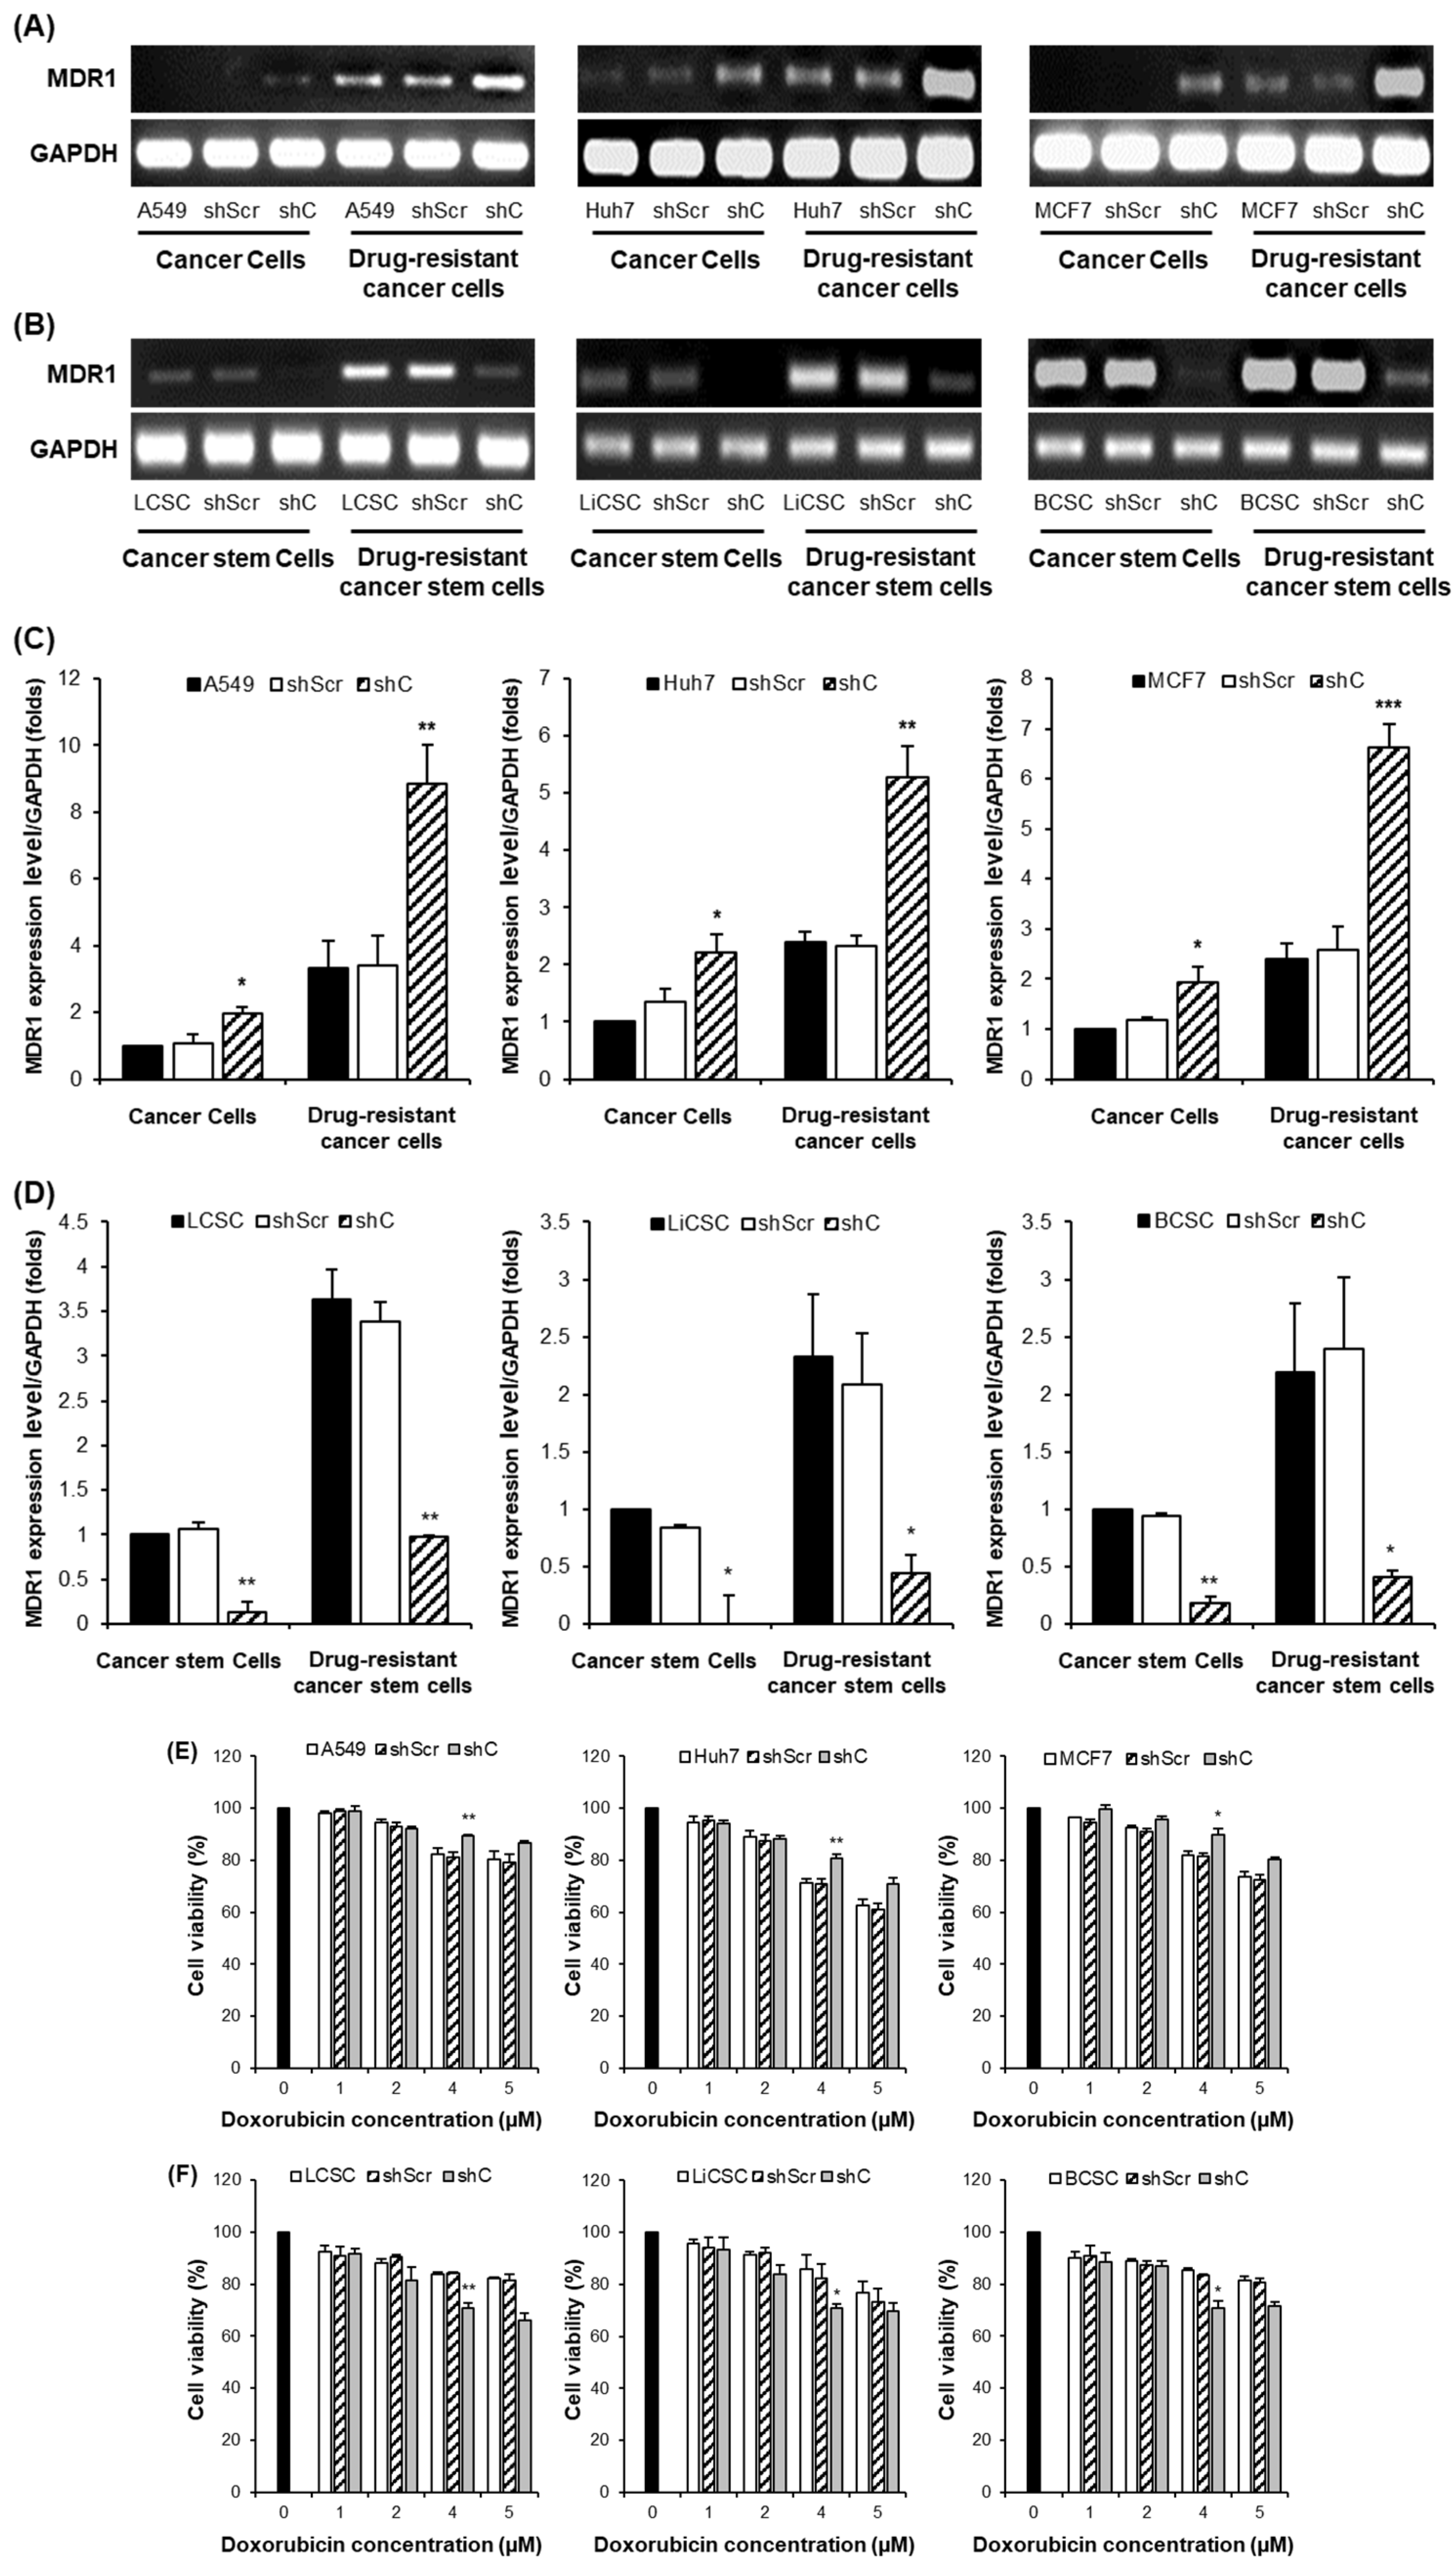
Figure 13.
Survival rate according to PRKAR1A expression in clinical patients. Comparison of PRKAR1A expression between normal and cancer patients (A), survival rate graph based on PRKAR1A expression (B).
Figure 13.
Survival rate according to PRKAR1A expression in clinical patients. Comparison of PRKAR1A expression between normal and cancer patients (A), survival rate graph based on PRKAR1A expression (B).
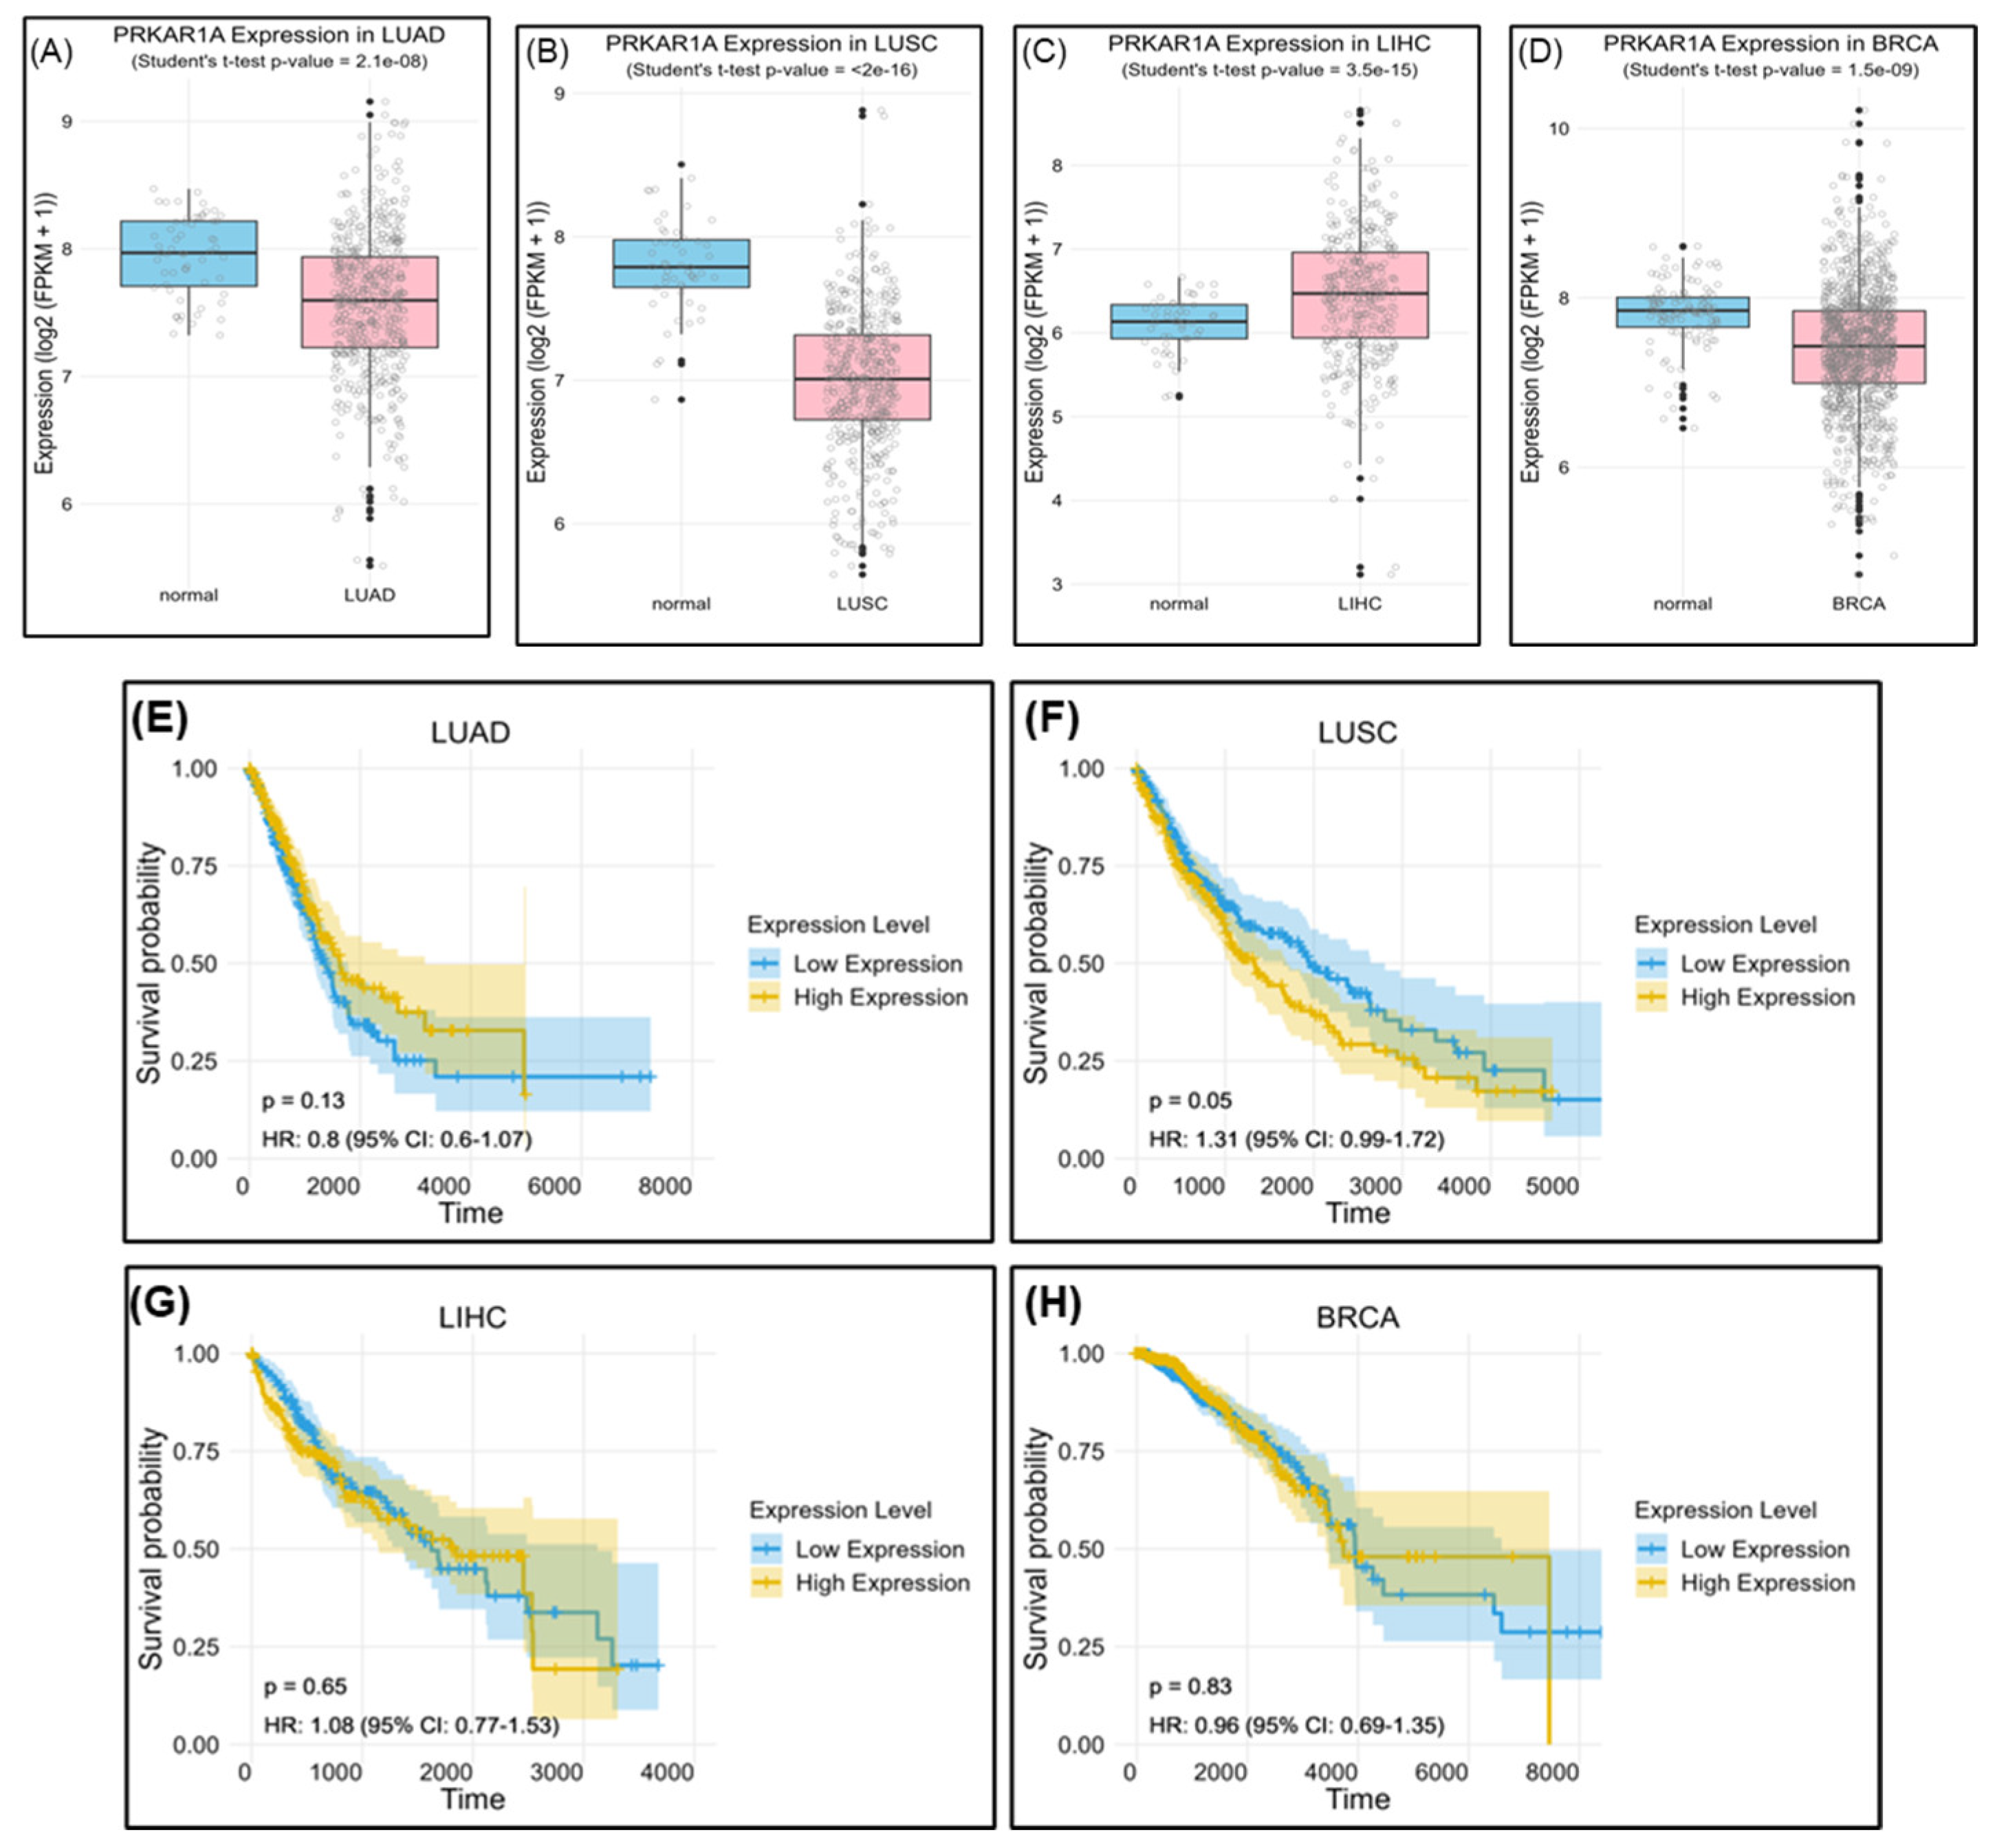

Table 1.
Primer sequences used for PCR analysis.
| Primer | Forward (5’-3’) | Reverse (5’-3’) |
| GAPDH | AGGGCTGCTTTTAACTCTGGT | CCCCACTTGATTTTGGAGGGA |
| PRKAR1A | GCAGCCACTGTCAAAGCAAA | GGTTCTCCCTGCACCACAAT |
| E-cadherin | GCTTTGACGCCGAGAGCTA | CTTTGTCGACCGGTGCAATC |
| N-cadherin | AGGCTTCTGGTGAAATCGCA | TGGAAAGCTTCTCACGGCAT |
| Snail | GCTGCAGGACTCTAATCCAGAGTT | GACAGAGTCCCAGATGAGCATTG |
| Slug | AGATGCATATTCGGACCCAC | CCTCATGTTTGTGCAGGAGA |
| Vimentin | CGAAAACACCCTGCAATCTT | TCCAGCTTCCTGTAGGT |
| Sox2 | GCTACAGCATGATGCAGGACCA | TCTGCGAGCTGGTCATGGAGTT |
| Oct4 | CCTGAAGCAGAAGAGGATCACC | AAAGCGGCAGATGGTCGTTTGG |
| Nanog | CTCCAACATCCTGAACCTCAGC | CGTCACACCATTGCTATTCTTCG |
| Cyclin D1 | AGCTGTGCATCTACACCGAC | GAAATCGTGCGGGGTCATTG |
| MDR1 | CCCATCATTGCAATAGCAGG | GTTCAAACTTCTGCTCCTGA |
Disclaimer/Publisher’s Note: The statements, opinions and data contained in all publications are solely those of the individual author(s) and contributor(s) and not of MDPI and/or the editor(s). MDPI and/or the editor(s) disclaim responsibility for any injury to people or property resulting from any ideas, methods, instructions or products referred to in the content. |
© 2024 by the authors. Licensee MDPI, Basel, Switzerland. This article is an open access article distributed under the terms and conditions of the Creative Commons Attribution (CC BY) license (http://creativecommons.org/licenses/by/4.0/).
Copyright: This open access article is published under a Creative Commons CC BY 4.0 license, which permit the free download, distribution, and reuse, provided that the author and preprint are cited in any reuse.


