1. Introduction
In the context of dual-carbon, renewable energy generation has increased steadily, the proportion of coal power installed capacity has continued to decline, the role of coal-fired power plants as a foundational and system-regulating power source is also becoming increasingly clear[
1]. However, from the perspective of security and energy security, it is difficult to fundamentally change the energy structure dominated by coal in a short time. The new energy structure needs to take into account energy security and dual carbon goals[
2], The effective collaborative development of coal power and new energy is the key to build a new power system and ensure energy security and stability, which brings major challenges to coal-fired power plants, mainly including frequent start-up and large load change, deep peak regulation, biomass blending [
3,
4,
5].
In response to these challenges, coal-fired power plants have adopted a series of measures, including optimizing operation mode, improving energy utilization efficiency, and developing carbon capture and storage technology[
6]. as the main device for PM removal, ESP directly affect the effectiveness of pollution reduction and carbon emissions reduction in coal-fired power plants. Since the ESP achieves dust removal by consuming electric energy, the higher the high-voltage power supply parameter and the higher the energy consumption, the higher the dust removal efficiency[
7,
8,
9], and the energy consumption of the ESP in coal-fired power plants is generally high[
10]. In addition, considering the factors such as biomass blending, deep peak regulation and cost, the fuel composition and operating conditions are more complex, which poses new requirements for the long-term stable and efficient operation of ESP. Therefore, it is urgent to develop the optimization operation technology of ESP to reduce pollution and carbon emissions, so as to achieve ultra-low emissions of PM under complex working conditions while reducing energy consumption.
The common control method for the optimization operation of ESP operation is the negative feedback of outlet dust concentration, this control method cannot take into account the differences and mutual influences of each electric field. and cannot achieve the optimal solution. For the optimization operation of ESP, a large number of scholars have carried out relevant research. Li Dazhong[
11] et al. proposed a least square fitting model to identify the corona power of ESP, using neural network model to predict the outlet dust concentration, and using genetic algorithm to achieve optimal control. Chen Weiguang[
12] built a mathematical model for ESP and proposed an optimization control method based on fuzzy logic and multi-objective programming. Grass[
13]et al. proposed a fuzzy control strategy to adjust the ESP by boiler load dynamically. Liu Xipu[
14] et al. studied the influence of different high-voltage power supply and power supply mode on outlet dust concentration, analyzed power consumption under different working conditions, and proposed optimization operation strategies under different working conditions. In order to achieve the optimal control, power consumption and outlet dust concentration must be accurately obtained. However, most of ESP of coal-fired power plants is a multi-chamber and multi-electric field structure, considering the factors such as the structural differences, electrode wear, operation condition changes, flue gas flow field, and fuel characteristics, the voltage-current characteristic of each electric field is independent and related, so there are still some problems in accurately calculating power consumption. Moreover, the movement of flue gas from the inlet to the outlet of the ESP takes time, and the outlet dust concentration has a time delay relative to the flue gas parameters and power parameters. The outlet dust concentration is the result of the combined effects of relevant parameters in the electrostatic precipitator over a period of time, few studies have correlated the outlet dust concentration with the previous parameters.
In this paper, the affecting factors are analyzed, the optimization control method is proposed, and the voltage-current characteristic model and outlet dust concentration prediction model are established based on the working mechanism and historical data. In order to optimize the operation of ESP, this article combines voltage-current characteristic model and outlet dust concentration prediction model, and uses PSO to obtain the optimal solution for the secondary voltage under the condition of satisfying the outlet dust concentration. Finally, an optimization experiment is carried out in a 330MW coal-fired power plant.
The rest of this paper is as follows.
Section 1 proposes an optimization control method and discusses the affecting factors;
Section 2 analyzes the results of the optimization control method;
Section 3 is the conclusion of this paper.
2. Main affecting factors and control methods
The optimization control of ESP is a complex engineering system with multiple input and multiple output, strong coupling, strong nonlinear, variable parameters, hysteresis and variable load (dynamic changes of inlet flue gas flow and dust concentration)[
15]. The ESP consists of multiple chambers connected in parallel and multiple electric fields connected in series, which is highly sensitive to multiple variables.
2.1. Main affecting factors
Load and coal. The load is dynamically variable, and the current coal composition is relatively complex. Due to the fixed mechanical structure of ESP, inlet flue gas volume varies with load and coal type. High flue gas volume and fast flue gas flow rate result in short flue gas residence time in the chamber, which reduces the overall dust removal efficiency. Therefore, the input power of the electric field of ESP can be adjusted according to changes in load and coal.
Mechanical structure. ESP consists of multiple chambers connected in parallel and multiple electric fields connected in series. Under normal circumstances, the deviation between the chambers of ESP is very small, and they are completely independent of each other. After the flue gas enters the ESP, only a single chamber needs to be considered. The dust removal efficiency of a single chamber depends on the dust removal efficiency of each electric field within the chamber, and the overall dust removal efficiency is the average of the dust removal efficiencies of all chambers. The dust removal efficiency is closely related to each electric field. The dust removal efficiency of ESP can be calculated as follows:
where
is dust removal efficiency of ESP.
is dust removal efficiency for chamber i.
is number of chambers.
is dust removal efficiency for chamber
and electric field
.
is number of electric fields in single chamber.
High voltage: High voltage is applied to the discharge electrode to generate a strong electric field and the gas can be ionized. Electrons are emitted into the gas layer near the corona electrode surface, the dust particles in the flue gas gain charge through collision and diffusion and become charged particles. Under the influence of the electric field force, these charged particles move towards the collecting electrode, depositing and adhering to the anode plate, thus separating the dust particles from flue gas[
16]. The charging of particles and the driving speed of charged particles are both related to the voltage of the power supply. However, maintaining excessively high voltage will result in significant corona current and energy waste. Therefore, different electric fields require a reasonable distribution of secondary voltage.
Rapping system: charged particles lose charge after reaching collecting electrode which is grounded, and become neutral particles and adhere to the surface of collecting electrode, then the collecting electrode is cleaned through mechanical rapping, the particles will fall off. Therefore, setting a reasonable rapping time can better remove particulate matter. In addition, in order to ensure that the outlet dust concentration is up to standard, two electric fields cannot be simultaneously rapped in common chamber.
2.2. Control methods
The ESP is highly sensitive to multiple variables, and electric fields in the chamber are connected in series, and the front-stage electric field will have an impact on the rear-stage electric field, it is difficult to achieve accurate description using mechanisms and mathematical formulas. In order to achieve efficient pollutant reduction and low-cost operation, an optimization control method for ESP is designed, including voltage-current characteristic model, outlet dust concentration prediction model, and optimization model. The voltage-current characteristic model is based on the dust charging mechanism and the actual operating conditions of ESP. Since the main energy consumption of ESP is generated by the power supply, the energy consumption can be calculated through voltage-current characteristic model. The outlet prediction model is based on the energy consumption model and the dust removal mechanism, then builds a neural network to achieve outlet dust concentration prediction by historical data. The optimization model introduces real-time parameters under the condition of emission target limit, and obtains the optimal secondary voltage value of the power supply through PSO. By this method, it is possible to achieve optimal energy consumption while maintaining a stable outlet dust concentration that meets the standards.
2.2.1. Voltage-current characteristic model
During the operation process, the operating cost of the ESP mainly considers the power consumption of power supply. Therefore, it is only necessary to consider the power consumption of power supply. The variation of the secondary voltage and secondary current causes changes of power consumption, and the variation of the secondary voltage and secondary current is coupled according to the characteristics of corona discharge. Under different secondary voltages, the current density is affected by parameters such as flue gas composition and electrode configuration, the secondary current can be obtained from the following equation[
17]:
where
is dielectric constant in vacuum.
is ion mobility, cm
2/(V·s).
is total length of wire, m.
is wire-plate distance, m.
is effective electric strength, V/m.
is secondary voltage, V.
is onset voltage, V.
is radius of wire, m.
is Electric strength of spark discharge under standard conditions, V/m.
is surface roughness of discharge electrode.
is relative density of flue gas.
is effective cylinder radius, m.
is wire-wire distance, m.
In the actual operation of ESP, factors that affect corona discharge include the accumulation of dust on the electrode plates and wires, wear and tear, corona enclosure, etc. The corona discharge process deviates from the ideal process described by the formula, there is a certain deviation between effective secondary voltage and operating secondary voltage. Therefore, it is necessary to modify the discharge mechanism model to improve its accuracy. This article introduces a correction parameter into the corona discharge mechanism, and calculates the effective discharge voltage using the following formula based on the research results of Guo[
18]:
where
is effective secondary voltage, V.
is load, MW.
and
are correction factors.
The surface roughness of the discharge electrode, relative density of the flue gas, and ion migration rate all vary with the theoretical design parameters, which are also set as trainable variables. Subsequently, basing on the historical data set, TensorFlow is used to construct the voltage-current characteristic correction model. This model takes inputs such as coal, secondary voltage of the power supply, and temperature, and outputs the secondary current. The model accuracy is improved through gradient descent training.
The energy consumption of ESP can be described by the following formula:
where
is the efficiency of energy conversion from the primary side to the secondary side, ≥90%.
2.2.2. Outlet dust concentration prediction model
The migration and removal processes of particles are affected by some factors, such as the mechanical parameters, flue gas parameters, and operational parameters of the power supply. It is generally believed that the removal of particles with different particle sizes is independent of each other, and there is no conversion between particle sizes. the outlet dust concentration can be described by the following equation[
19]:
where
is particle diameter, μm.
is outlet dust concentration with a diameter of
, mg/Nm
3.
is inlet dust concentration with a diameter of
, mg/Nm
3.
is the charge of
in electric field
, particle charge decided by particle diameter and secondary voltage, C.
is electric strength of field
, V/m.
is cunningham correction factor for different particle diameter.
is collecting plate area of single field, m
2.
is flue gas flux, m
3/s.
is flue gas viscosity, Pa·s.
Considering the deviation of the mechanism model, according to the research results of Li Dongyang[
20] et al. proportional and exponential factors are applied to correct the Deutsch number in the mechanistic equations. The corrected outlet dust concentration expression is given as:
where
is proportional factor.
is exponential factor.
The prediction performance of the model can be improved by adding modification to the model, but it still has some defects due to the limitations of the model itself. Therefore, the modeling of data fusion is further developed. By utilizing mechanistic model, the difference between the predicted outlet dust concentration and the measured outlet dust concentration can be obtained, and the prediction deviation can be used as target value to train the neural network.
The outlet dust concentration is obtained by using the mechanism model, and the difference is made with the measured data of the historical outlet dust concentration. The prediction deviation is used as the target value to train the neural network. Finally, mechanism and data coupling modeling are used to obtain the outlet dust concentration prediction value with strong generalization ability and high prediction accuracy.
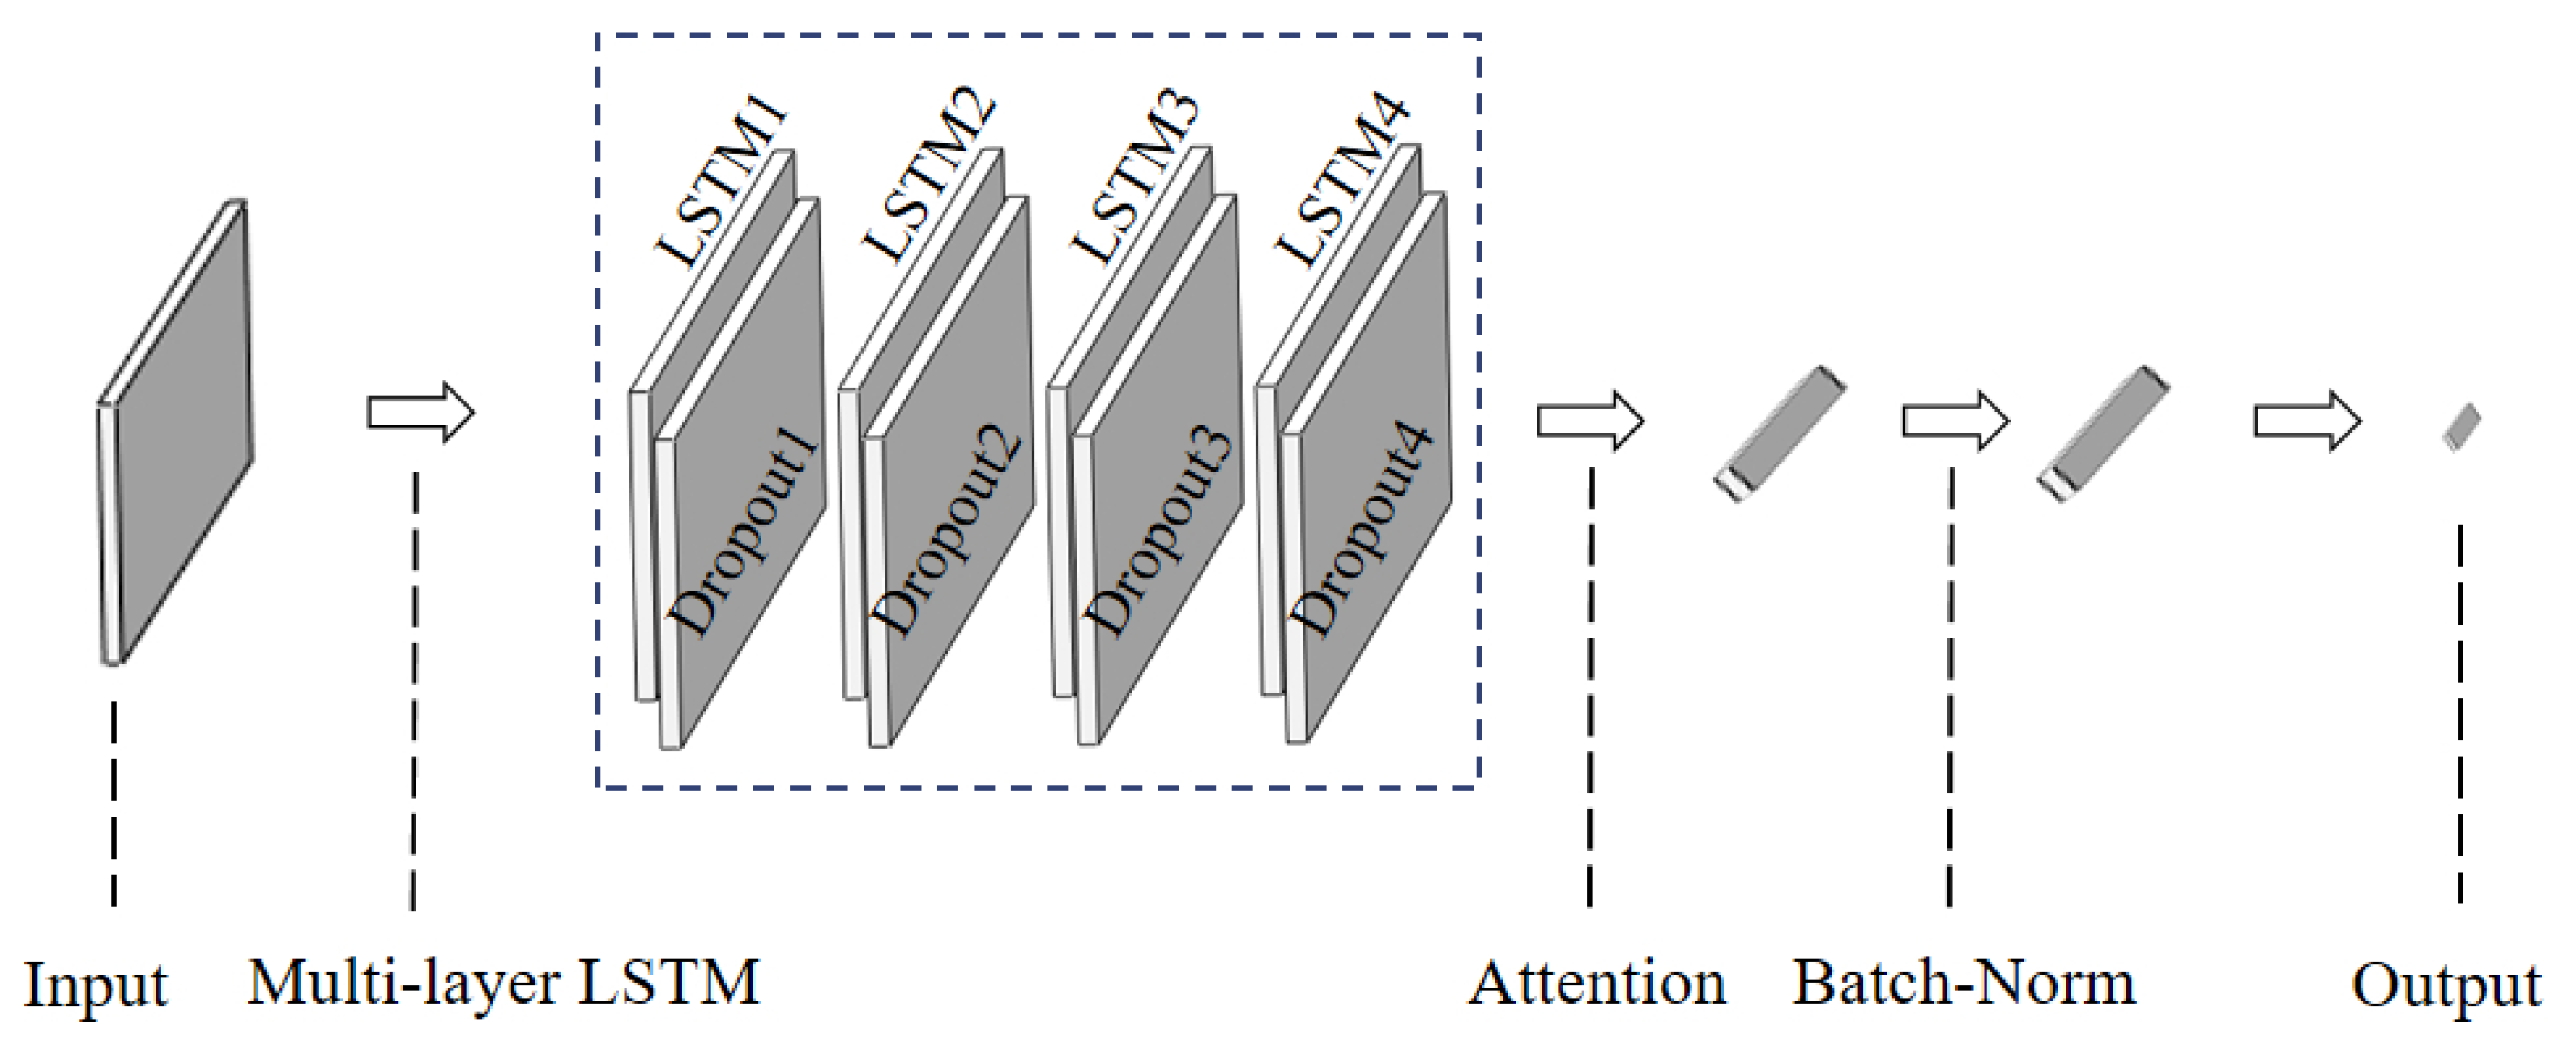
Due to the time required for the flue gas to flow from the inlet to the outlet, the historical data of coal, flue gas, and power-related parameters are refreshed in seconds. The outlet dust concentration is lagging behind, which is the result of the effects of relevant parameters during the period from the inlet to the outlet of flue gas. When using time series data for regression modeling, it is possible to consider the impact of input data from multiple time steps on the output data. Therefore, a Long Short-Term Memory (LSTM) neural network with autoregressive variables is adopted, and an Attention mechanism is introduced to compensate for parameter identification errors, the accuracy and generalization ability of the model can be improved[
21]. In this model, air volume, secondary voltage of the power supply, inlet temperature of ESP, and coal are used as inputs, while dust concentration deviation is used as output, and Root Mean Square Error (RMSE) is used as the evaluation function for the model, the neural network structure is shown in
Figure 1.
2.2.3. Optimization model
The optimization goal of ESP is to minimize the operational cost by providing each electric field with a secondary voltage while meeting the outlet dust concentration standards. The optimization operation is a multi-variable nonlinear programming problem, which can be effectively solved by PSO due to its advantages in searching and optimizing multi-variable nonlinear systems in multiple dimensions. PSO is suitable for the optimization of ESP. When using PSO to construct the optimization control problem, the total energy consumption of ESP should be minimized while meeting the emission limit, which can be expressed as:
where
is the total number of electric fields.
is the power of field
, kW.
and
are prediction value and limit value of outlet dust concentration, mg/Nm
3.
,
and
are the secondary voltage, minimum secondary voltage and maximum secondary voltage of field
, kV.
There are constraints in this optimization problem. Generally, the way to solve constrained optimization problems is to construct penalty functions, which incorporate the boundary conditions into the objective function of the optimization problem, thereby creating a new objective function. The solution to the original optimization problem is obtained by solving the new optimization problem. There are several penalty functions that can be used when particles are outside the boundary conditions, for instance, the dead penalty function that sets the fitness of particles to infinity directly, the static penalty function gives particles a fixed punishment, and hierarchical penalty function is adopts different penalty coefficients based on the degree of violation of the penalty function[
22]. In this article, the LSTM is used to correct the dynamic characteristics of ESP, the trend of dust concentration changes at the outlet within a few steps can be calculated. Therefore, the following form of hierarchical penalty function is adopted:
where
is the total step.
is penalty coefficient.
is symbolic function.
is prediction value of outlet dust concentration at step
, mg/Nm
3.
This form of penalty function imposes a higher penalty on particles that exceed the limit many times, the optimization problem can then be formulated as:
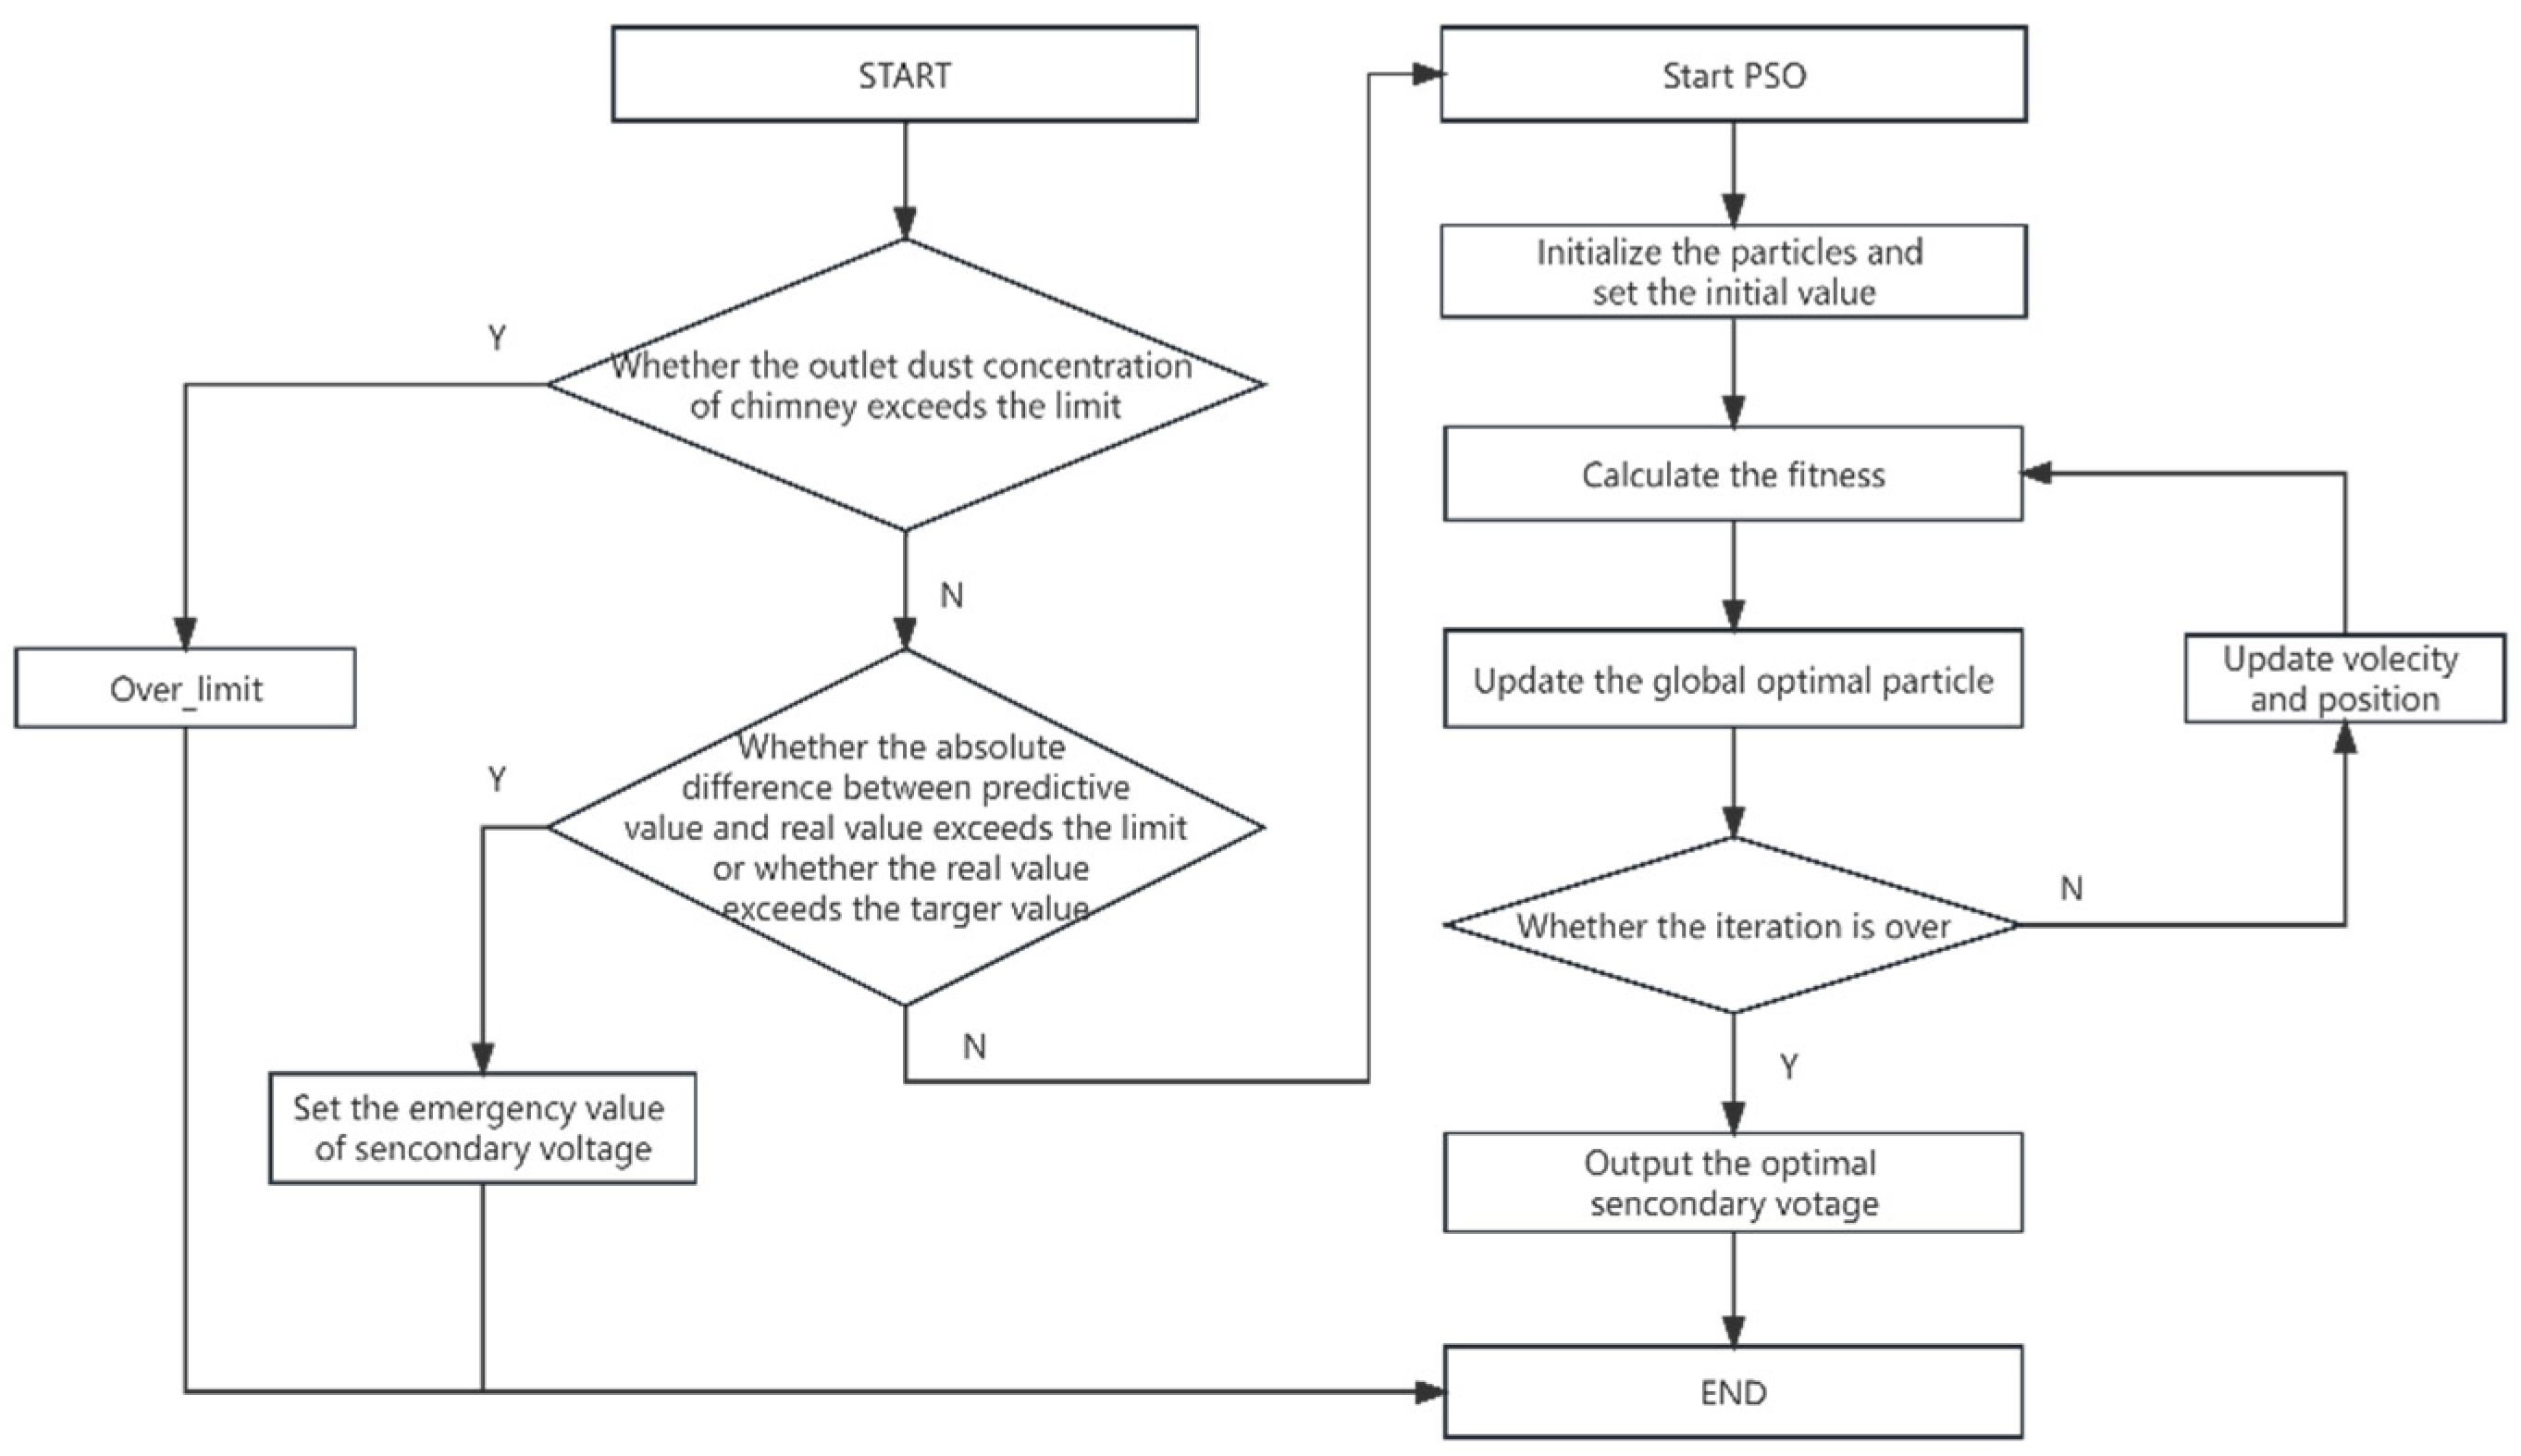
the problem can be solved directly by PSO now, the PSO optimization flow is shown in
Figure 2.
For ESP, the information contained in the particle corresponds to the secondary voltage of each electric field. The specific tasks of the optimization model can be described as follows: (1) Logical judgment, which ensures that the emissions are controlled within the limit values under various operating conditions, it is reasonable to set the target value at 80% of the limit value. (2) Particle initialization, the purpose of particle initialization is to set the initial secondary voltage for the particle swarm, and the secondary voltage value must be within the allowable range of the device; (3) Fitness calculation; (4) Updating the global best particle, and continue to calculate fitness and update the particle until the end of iteration; (5) End the current optimization. This process needs to be called repeatedly in practical work, in order to ensure the reliable and stable operation of the system, it is also necessary to consider factors such as severe fluctuations in operating conditions, secondary dust caused by rapping and distortion of turbidity meter.
3. Results
In order to validate the effectiveness of the optimization control, the research is conducted on the ESP of 330MW power plants. The ESP adopts a structure with 4-chamber and 5-field, and each field is equipped with an independent high-voltage power supply. The detailed design parameters are shown in
Table 1.
3.1. Prediction results and analysis of voltage-current characteristic model
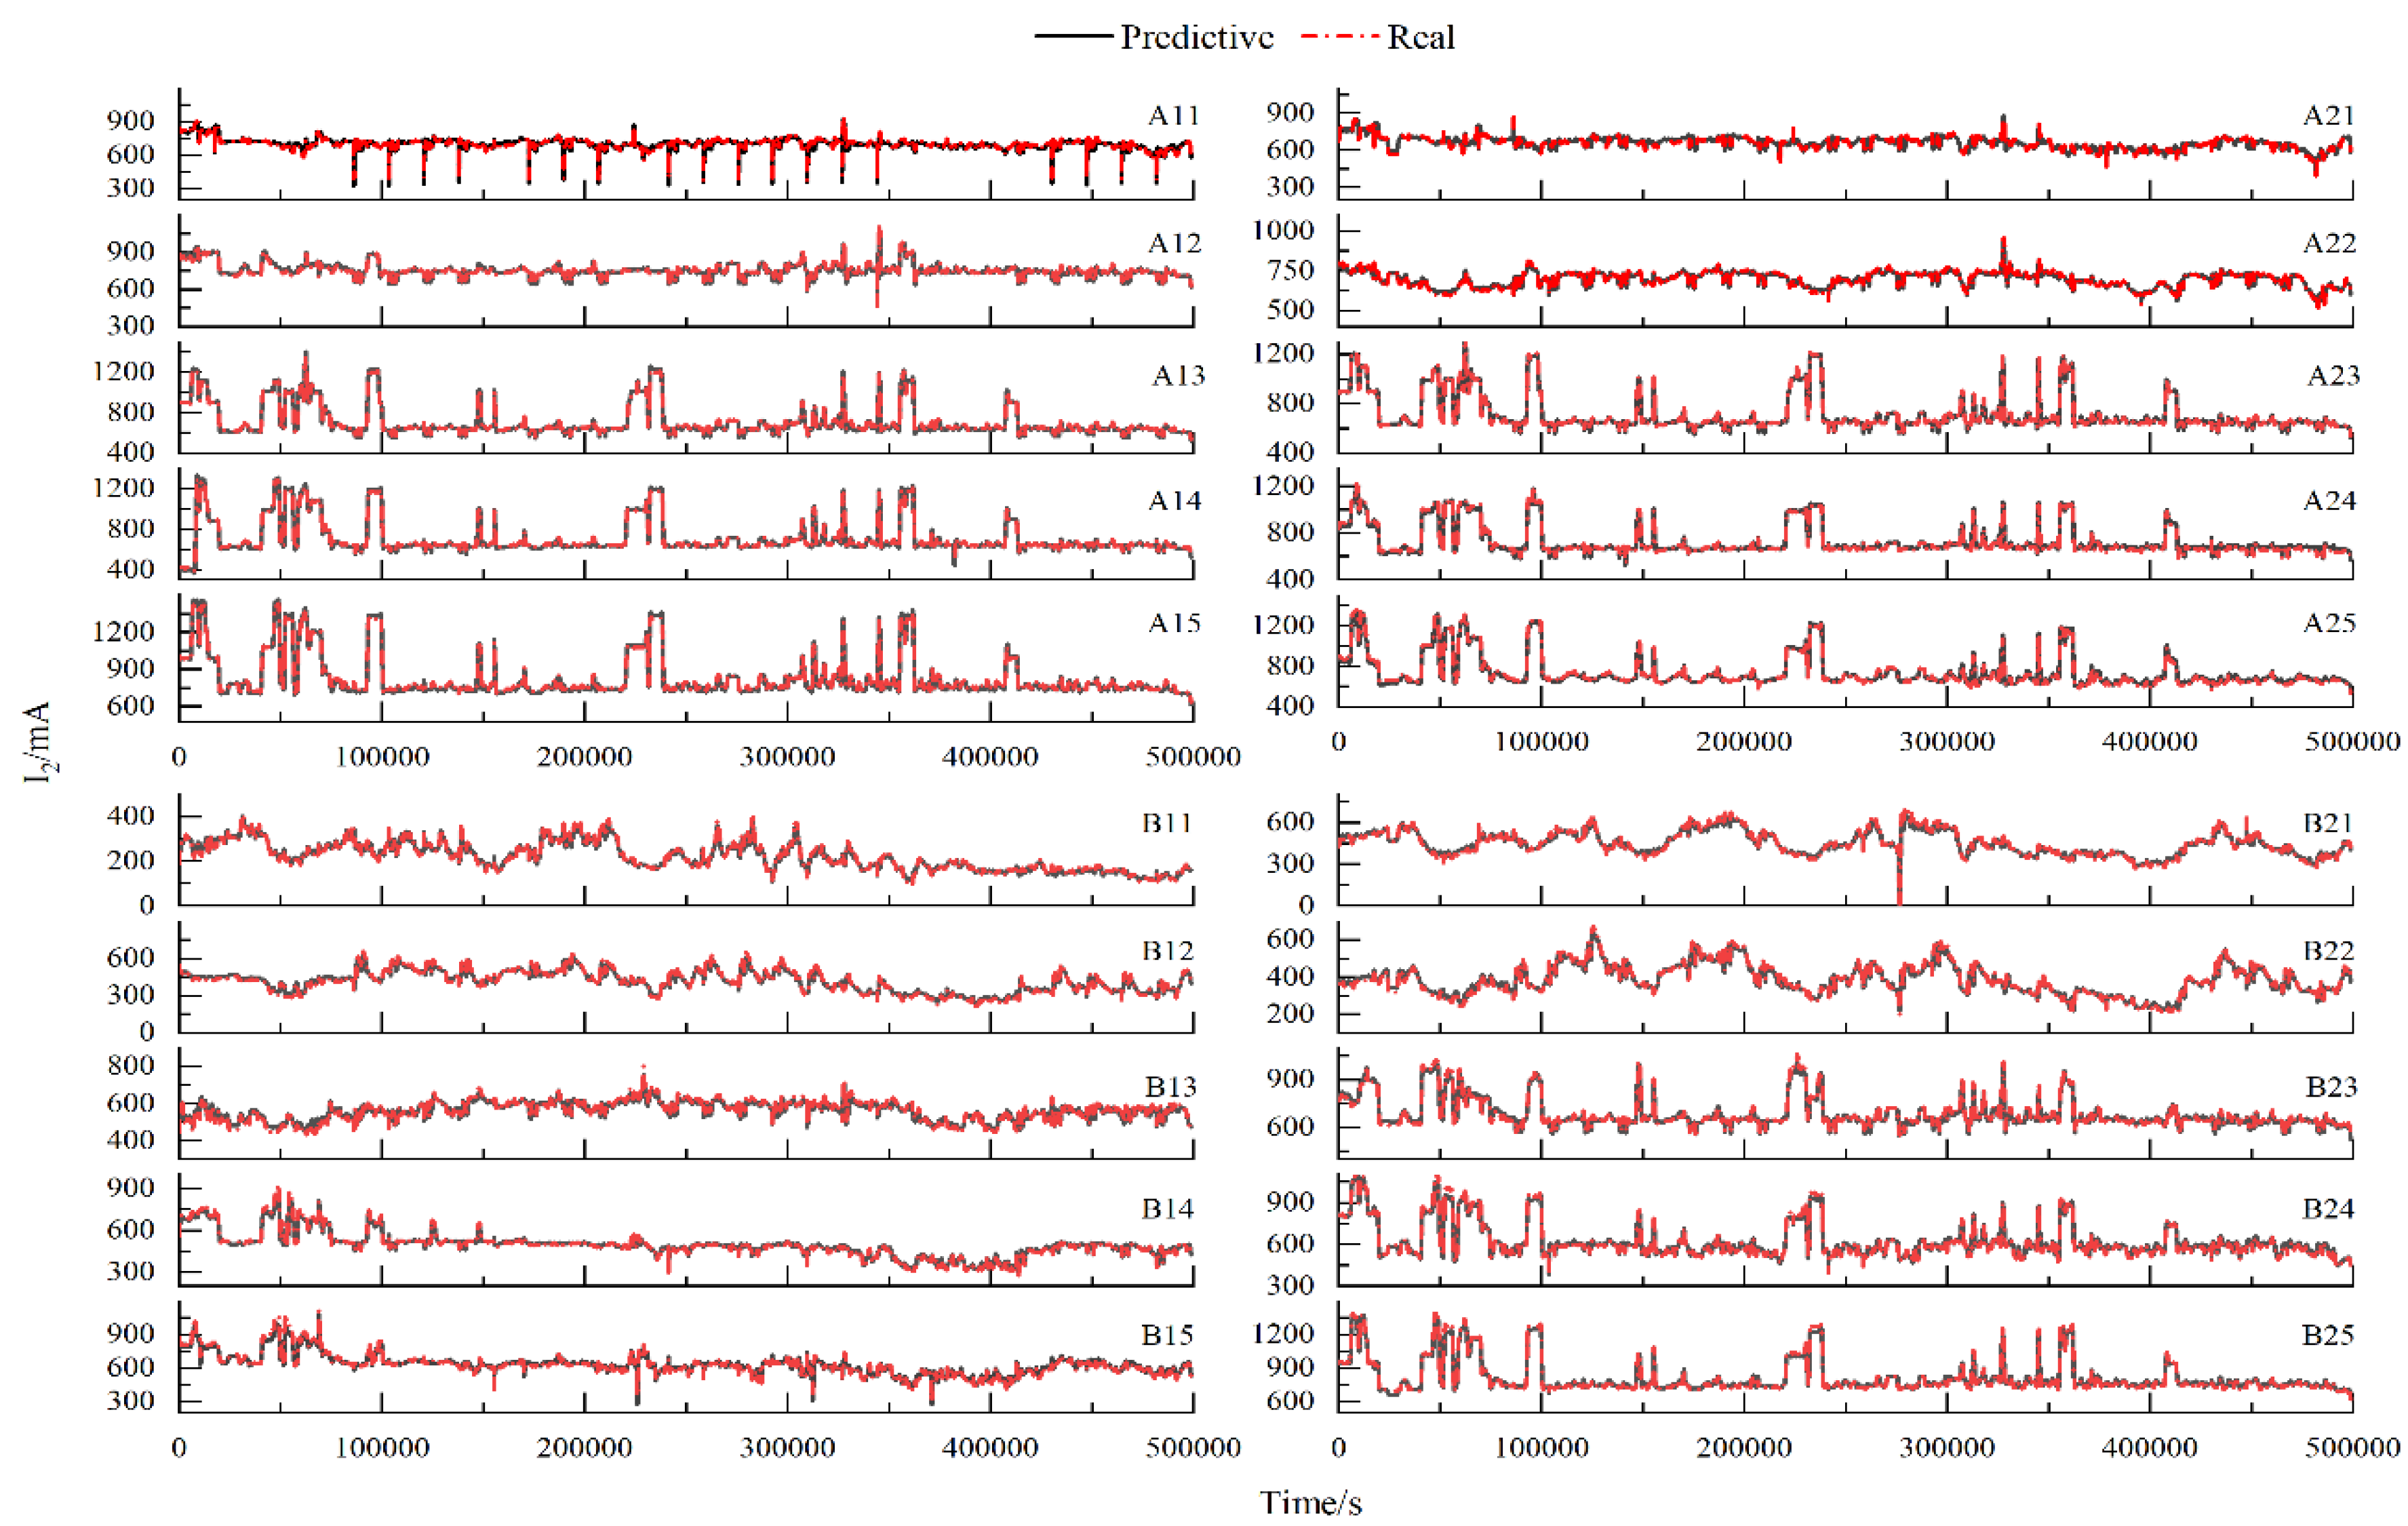
For the research on the performance of secondary current prediction based on the voltage-current characteristic model, we collected historical data from on-site for training. The comparison is shown in
Figure 3.
During the sampling period, the actual secondary current ranged from 100mA to 1500mA, covering almost all operation conditions, the average value of the secondary current is 631mA, with Mean Absolute Error(MAE) of 9mA and maximum predictive deviation of 86mA, the MAPE of the model predictions is 1.43%. Compared to the preceding electric field, the relative deviation of the fourth and fifth electric fields is larger, with MAE of 11mA. This is because the discharge electrode type of the fourth and fifth electric fields is spiral line and adopts a single-board double-line form, which can produce larger secondary current under the same secondary voltage, the average value of last two electric fields is 701mA. As shown in figure 3, it can be observed that the volt-ampere characteristic model can accurately follow the change of secondary current.
3.2. Prediction results and analysis of outlet dust concentration prediction model
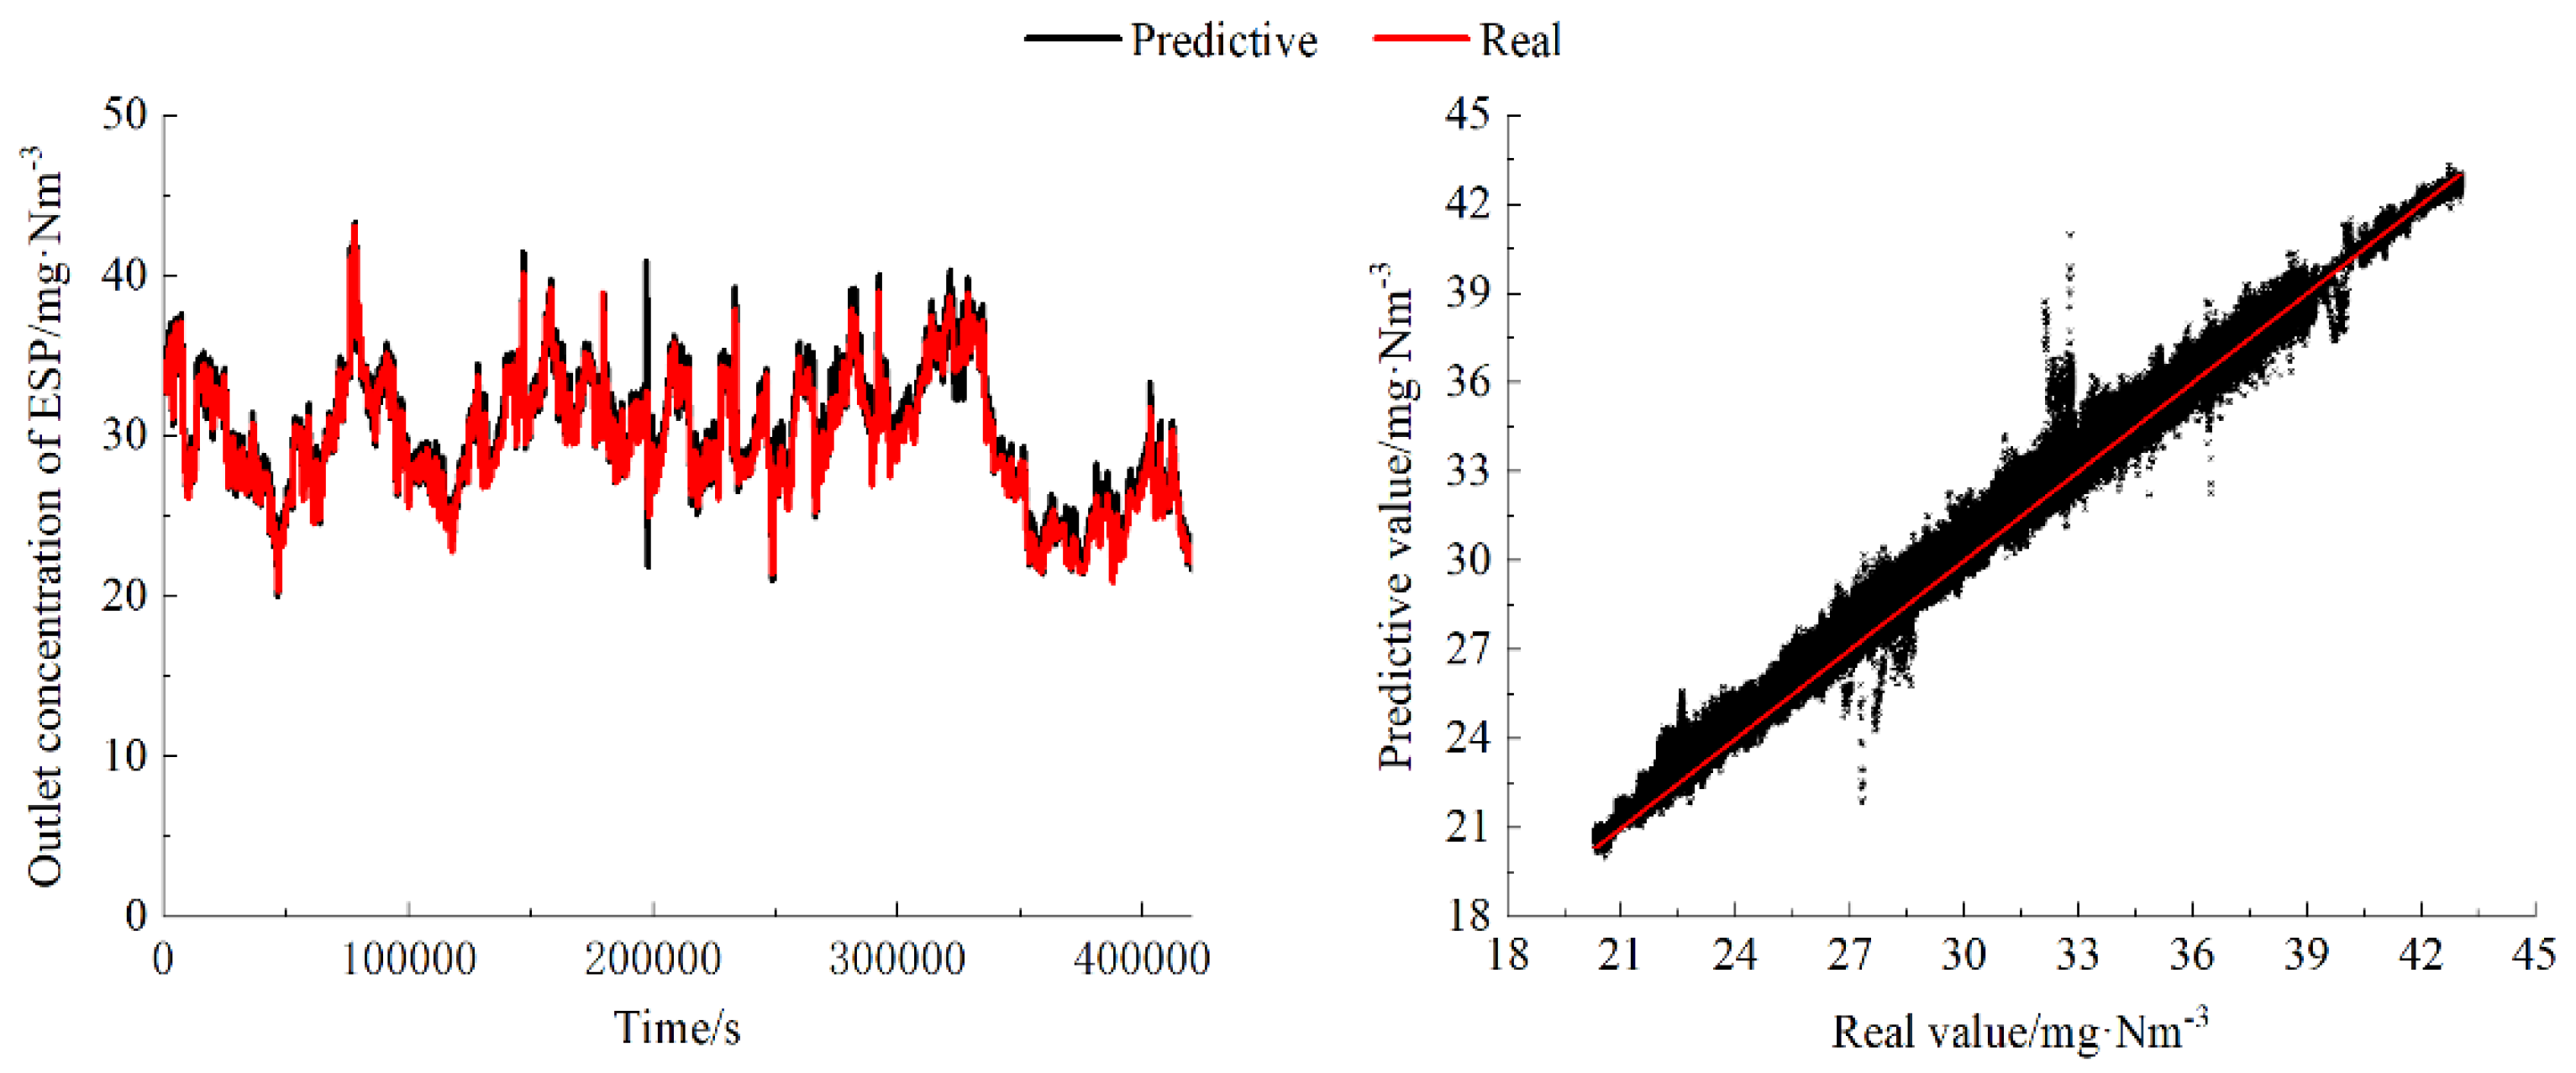
The mechanistic model is difficult to eliminate uncontrollable disturbance factors such as airflow distribution and wear. The model adopts the method of mechanism and data fusion, and firstly predicts the outlet dust concentration by using the modified mechanism model. At first, using the modified mechanism model to predict the outlet dust concentration. Then deviation values of predictive values and real values are adopted as the target value to construct data model. Finally the outlet dust concentration prediction results of mechanism and data coupling are obtained. We constructed a dataset using 500,000 historical data from the ESP, and after purging, 85% of the data is selected as the training set, and the remaining 15% is used as the testing set. The result of dust concentration prediction model on the training set is shown in
Figure 4.
The outlet dust concentration of the training set is distributed in the range of 20-45 mg/Nm
3, and the average outlet dust concentration is 30.1mg/Nm
3. As shown in figure 4, the prediction performance of the outlet dust concentration prediction model is outstanding, the MAE of the prediction is 0.43mg/Nm
3, and MAPE is only 1.4%. The prediction accuracy is high across the entire range of data, the predictive values align with the real values in terms of trends. The Root Mean Square Error (RMSE) is only 0.546mg/Nm
3, and the R-squared (R
2) is 0.98. However, a well-fitted performance on the training set often leads to overfitting, which will reduce the model's generalization ability. Therefore, it is necessary to observe the performance of the data model on test set. The result of outlet dust concentration prediction model on the test set is shown in
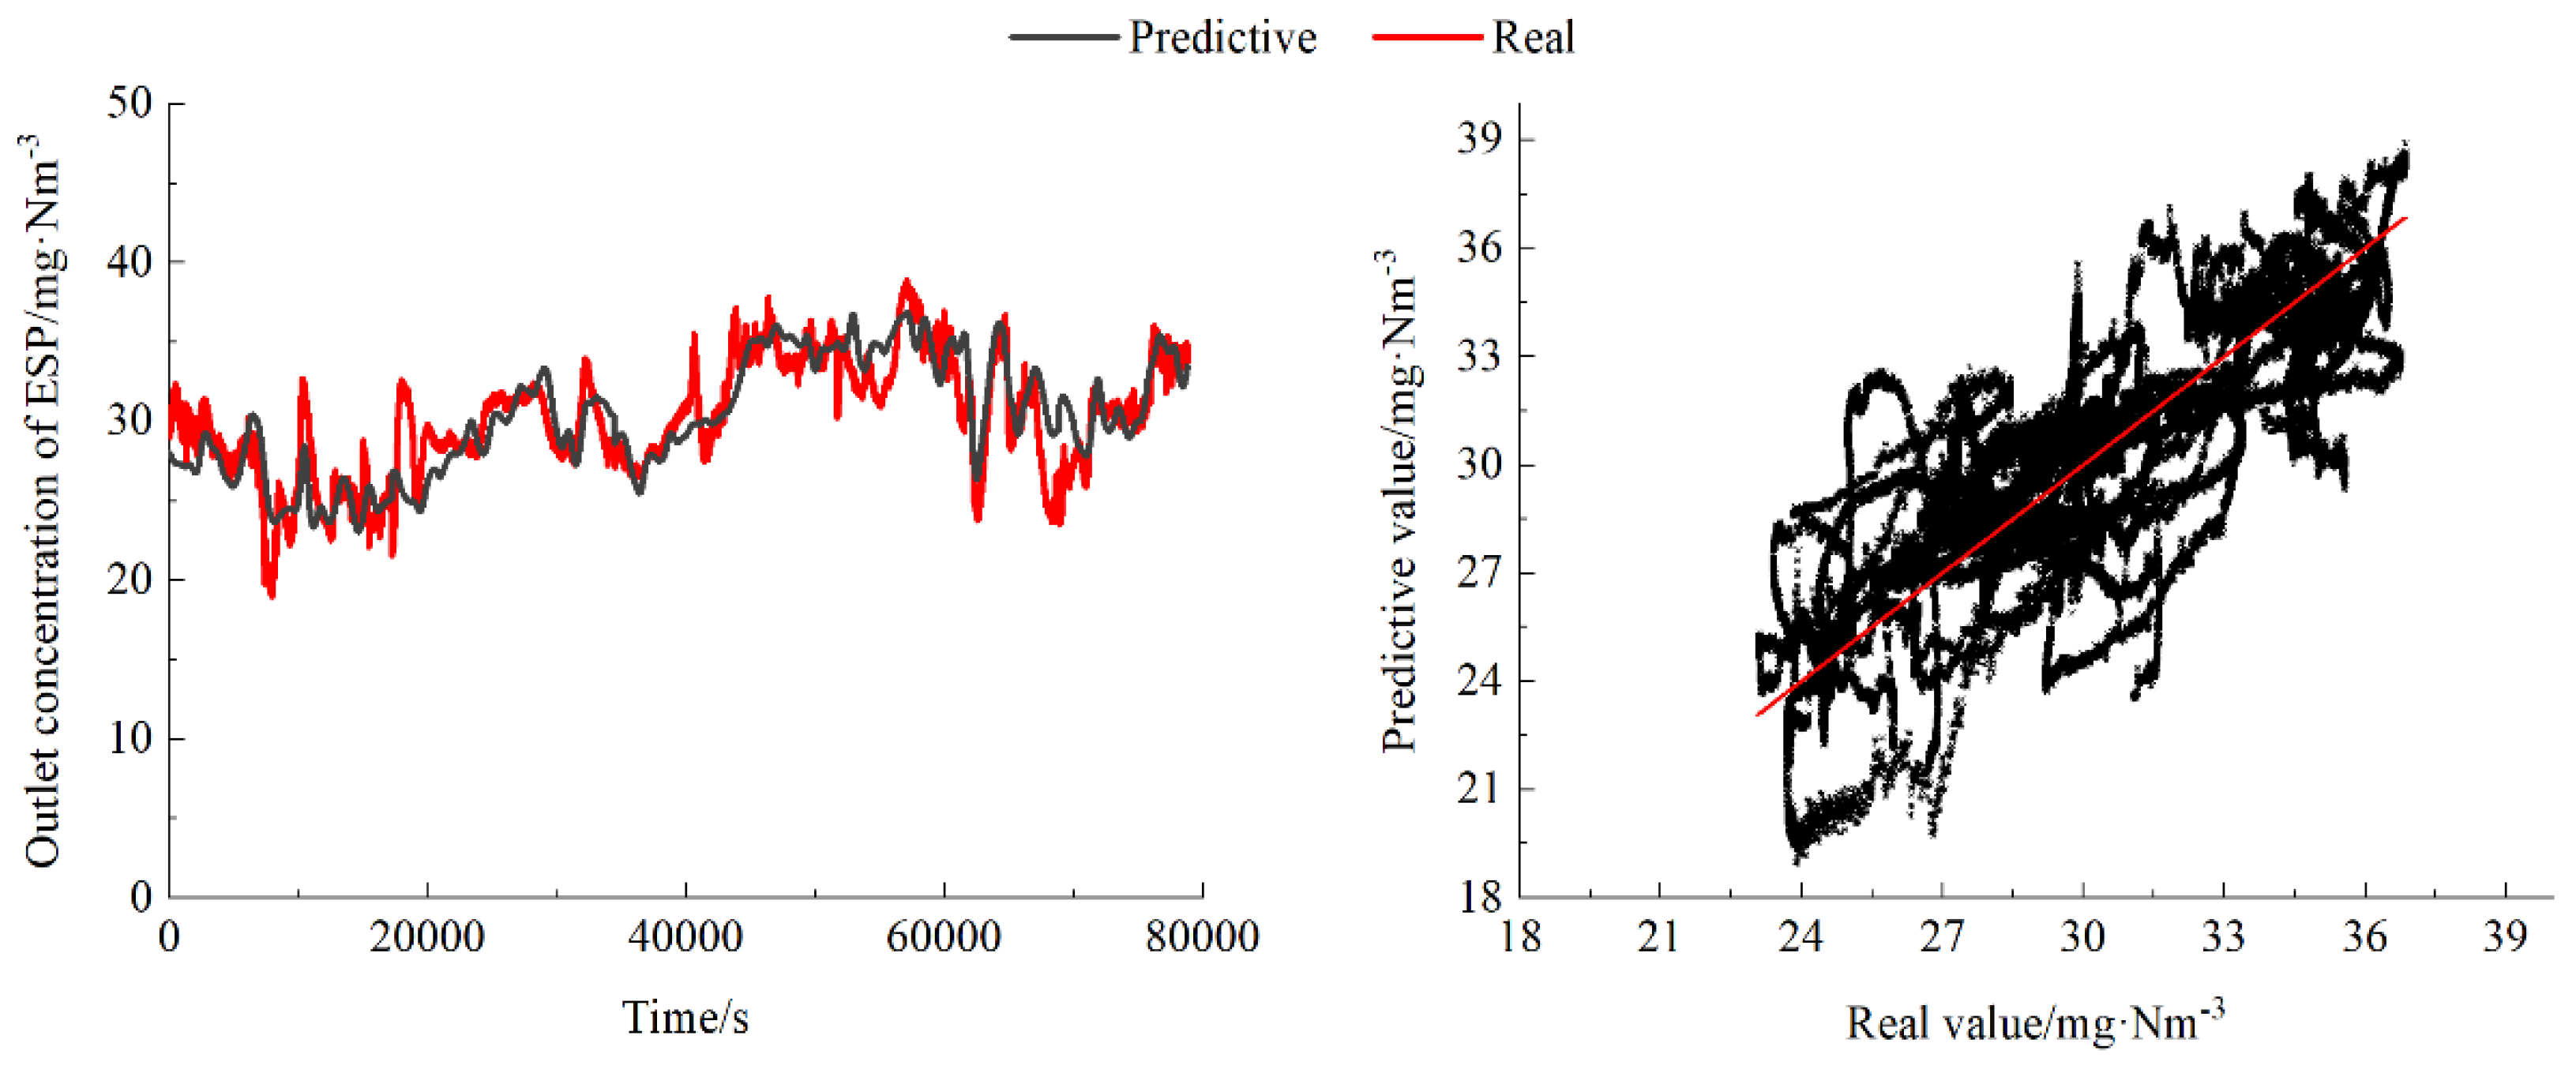
Figure 5.
Figure 5 presents the performance of the outlet dust concentration prediction model on the test set. The average value of the outlet dust concentration is 30.19 mg/Nm
3, the MAE is 1.57 mg/Nm
3, MAPE is 5.2%, RMSE is 2.08 mg/Nm
3 and the R
2 is 0.66. This model can accurately predict the outlet dust concentration of ESP.
3.3. Prediction results and analysis of optimization model
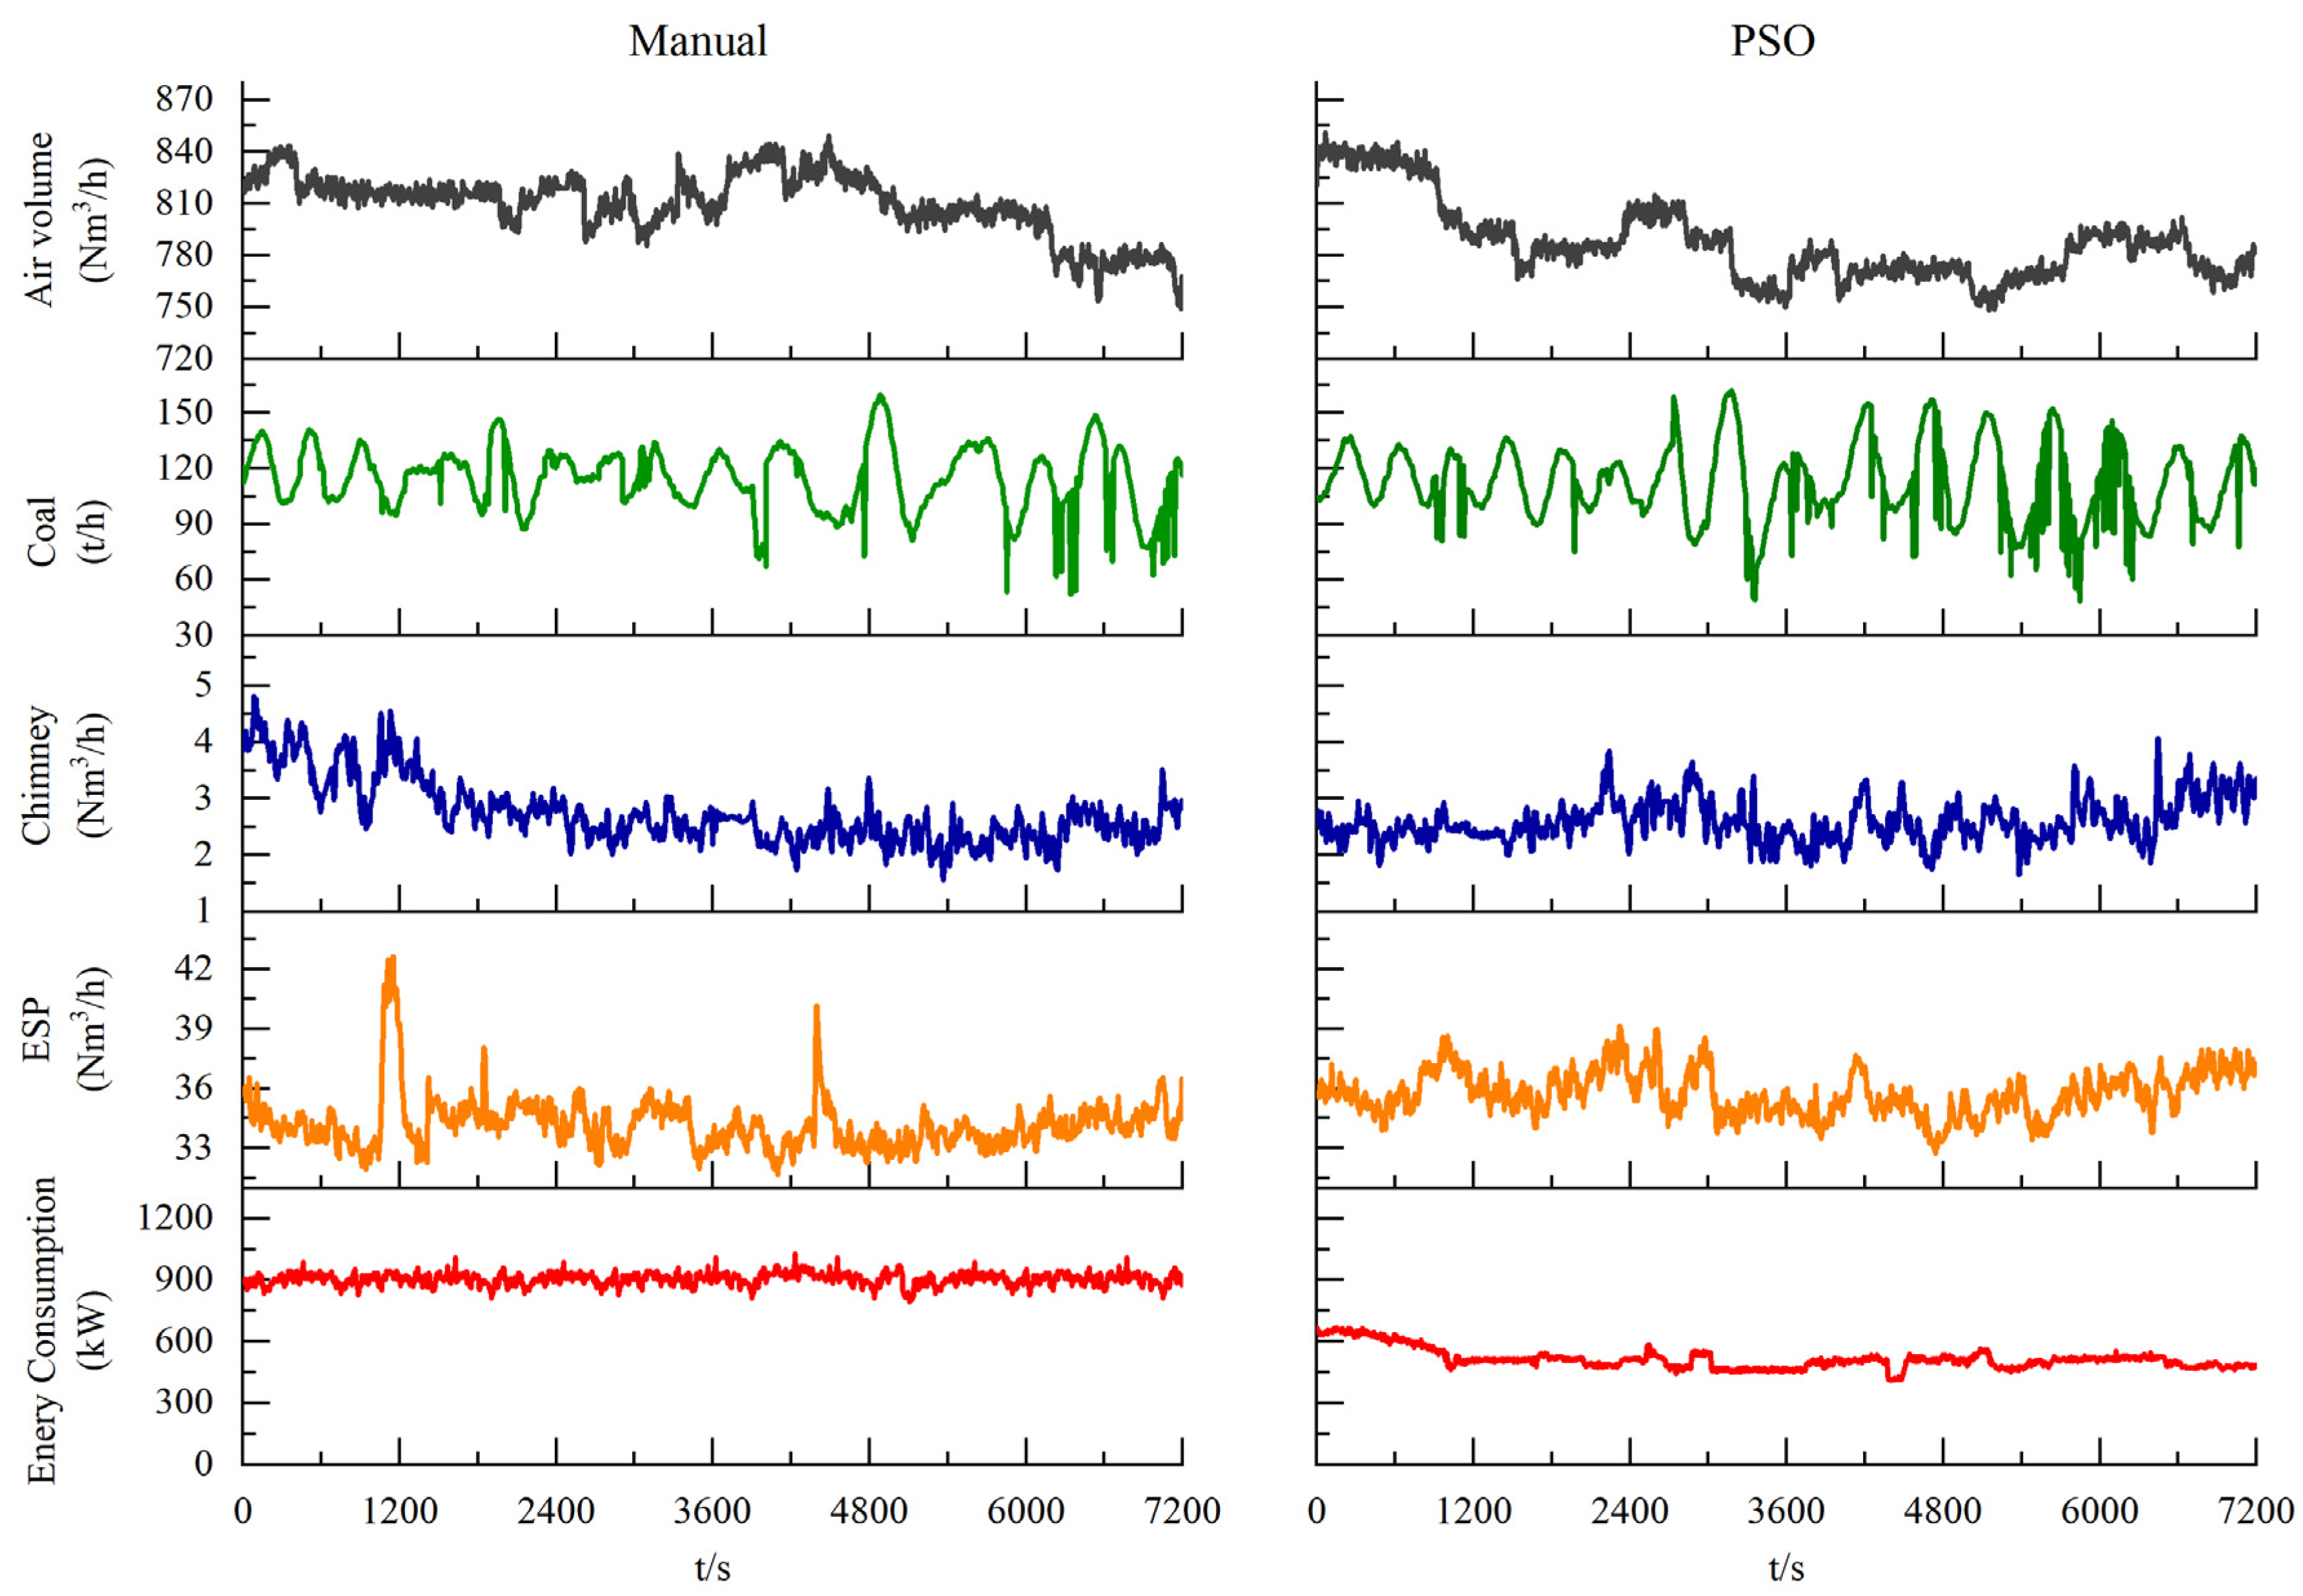
In order to validate the optimized operational performance of ESP, a comparative experiment is conducted on-site through manual and PSO optimization control under the similar conditions. The coal feeding quantity, total air volume, outlet dust concentration of ESP, outlet dust concentration of chimney and energy consumption are shown in
Figure 6.
When operating manually, in order to ensure the stable compliance of the outlet dust concentration, all secondary voltage of electric field are near the flashover point. At this moment, the overall energy consumption of ESP is relatively high, with an average consumption of 904.46 kW. At the same time, the phenomenon of flashover coexists simultaneously, which can lead to unstable outlet dust concentration, the average outlet dust concentration is 34.2 mg/Nm3, maximum value is 42.6 mg/Nm3, minimum value is 31.6 mg/Nm3. After optimization, the energy consumption of the ESP significantly decreases, with an average energy consumption of 514.75 kW. Meanwhile, since the secondary voltage is much lower than the flashover voltage, there is almost no flashover, and the outlet dust concentration becomes more stable, fluctuating within ±3 mg/Nm3. the energy saving is about 43% after optimization, according to the annual operation of 300 days, the annual average carbon reduction is approximately 2621.34 tons.
4. Conclusions
This paper proposes an optimization control method for ESP, and establishes voltage-current characteristic model, outlet dust concentration prediction model and optimization model. Finally, optimization comparative experiment is conducted on a 330MW power plants to verify the proposed method, and the following conclusions can be drawn:
- (1)
constructing the voltage-current characteristic model based on the charging mechanism and historical operation data of the high-voltage power supply, the model performances well in tracking the changes of the secondary current, with MAE of 9mA, and MAPE is less than 1.5%.
- (2)
Based on the modified mechanism model, outlet dust concentration prediction model is constructed by LSTM with attention mechanism. The RMSE of the training set and the testing set are 0.546mg/Nm3 and 2.08mg/Nm3, and the MAPE are 1.4% and 5.2%. This model achieves accurate prediction of the outlet dust concentration.
- (3)
The PSO is used to achieve dynamic optimization and obtain the optimal secondary voltage set value, which can minimize the power consumption of the ESP while meeting the stable outlet dust concentration standard.
- (4)
Compared to manual control, this optimization can achieve a reduction in energy consumption of 43%, with an annual average carbon reduction of approximately 2621.34t, and the fluctuation of the outlet dust concentration is more stable.
Author Contributions
Conceptualization, J.Z.; Methodology, C.F.; Software, Z.Z.; Validation, C.F. and H.Y.; Formal analysis, C.F.; Data curation, C.F. and Y.L.; Writing—original draft preparation, J.Z.; Writing—review & editing, C.F.; Supervision, J.Z. All authors have read and agreed to the published version of the manuscript.
Funding
This research received no external funding.
Data Availability Statement
The data used to support the findings of this study are available from the corresponding author upon request.
Conflicts of Interest
The authors declare no conflict of interest.
References
- Huang, X. Annual development report on world energy (2022); Social Science Academic Press: Beijing, 2022. [Google Scholar]
- Tang, J.; Wang, J. Coal development and countermeasures under the carbon peaking and carbon neutrality goals. China Mining Mag. 2023, 32, 22–31. [Google Scholar] [CrossRef]
- Guo, H.N.; Wu, Y.; Wang, X.B; Zhang, M.; Huang, Z. Current status of power generation technology of the agriculture and forest biomass co-firing in coal—fired power plants. Clean Coal Technol. 2022, 28, 12–22. [Google Scholar] [CrossRef]
- Yang, M.L.; Sun, L.J.; Dai, B.; Wu, W.L.; Cai, M.; Li, S. Research on mixed coals combustion strategy of thermal power unit basedon deep peak shaving. Coal Quality Tech. 2022, 37, 46–51. [Google Scholar]
- Shuai, Y.; Zhao, B.; Jiang, D.F.; He, S.Y.; Lyu, J.F.; Yue, G.Y. Status and prospect of coal-fired high efficiency and clean power generation technology in China. Therm. Power Gener. 2022, 51, 1–10. [Google Scholar]
- Ma, S.C.; Fan, S.J.; Wu, K.; Yang, P.W.; Chen, L.T. CCUS technology development of coal-fired power plant under the back ground of Dual Carbon Strategy: Challenges and countermeasures. Clean Coal Technol. 2022, 28, 1–13. [Google Scholar] [CrossRef]
- Liu, H.X. Energy saving and carbon reduction analysis of electrostatic precipitator under double carbon background. Power Gener. Tech. 2023, 44, 738–744. [Google Scholar] [CrossRef]
- Liu, H.X.; Li, J.G.; Yao, Y.P.; Zhong, J.F.; Du, Y.J.; Du, Y.Q. Evaluation on the energy efficiency of electrostatic precipitators in coal-fired power plants. Electric Power 2017, 50, 22–27. [Google Scholar]
- Li, W.H.; Bai, L.; Yu, S.C. Numerical simulation of flow field particle field and electric field for ESP. Power Gener. Tech. 2021, 42, 336–342. [Google Scholar] [CrossRef]
- Wang, Z.G.; Zhang, C.; Li, D.Y.; Bai, Y.G.; Chen, J.Y. Experiment of energy saving and optimization on electrostatic precipitator system in ultra-low emission coal-fired power plants. Therm. Power Gener. 2018, 47, 109–114. [Google Scholar]
- Li, D.Z.; Tian, L.; Liu, S.P.; Wang, R. Optimized control of the working voltage for electrostatic precipitator based on intellective method. Energy Conserv. Technol. 2006, 24, 538–541. [Google Scholar]
- Chen, W.G. Mathematical Model and Fuzzy Multi-objec Optimization Design of Electrostatic Precipitator. M.S. thesis, Zhejiang University, Hangzhou, China, 2006.
- Grass, N.; Zintl, A.; Hoffmann, E. Electrostatic Precipitator Control Systems. IEEE Ind. App. Mag. 2010, 16, 28–33. [Google Scholar] [CrossRef]
- Liu, X.P.; Li, Q.Y.; Li, D.Y.; Guo, M.; Li, J.G. Energy-saving optimization on the dust collection system of a 330 MW power plant. Electric Power 2019, 52, 165–169. [Google Scholar]
- Li, D.Z.; Tian, L.; Zhang, Z.W.; Liu, S.P. The causes of efficiency decrease for boiler electrostatic precipitator and its improvements. Ind. Sfty. Environmental Prot. 2005, 31, 32–34. [Google Scholar]
- Yang, Z.D. Mechanism and Application for Simultaneous Removal of PM and SOx from Wet Flue Gas Enhanced by External Fields. ph.D. dissertation, Zhejiang University, Hangzhou, China, 2018.
- Cooperman, G. A New Current-Voltage Relation for Duct Precipitators Valid for Low and High Current Densities. IEEE Trans. Ind. Appl. 1981, IA-17, 236-239. -17. [CrossRef]
- Guo, Y.S. Mechanism and Application for Modeling and Coordinated High Efficiency Removal of PM/SO3 in Coal Fired Flue Gas. ph.D. dissertation, Zhejiang University, Hangzhou, China, 2020.
- Deutsch, W. Clean Coal TechnologyBewegung und Ladung der Elektrizititätsträger in Zylinderkondensator. Annalen der Physik 1922, 373, 335–344. [Google Scholar] [CrossRef]
- Li, D.Y.; Liu, X.P.; Zhang, C. Correction of the dust removal efficiency formula on low-low temperature electrostatic precipitator. Proc. CSEE 2022, 42, 2623–2629. [Google Scholar]
- Luong, T.; Pham, H.; Manning, C.D. Effective Approaches to Attention-based Neural Machine Translation. ArXiv 2015, abs/1508.04025, 1412-1421. [CrossRef]
- Huang, Y.Q. Research on Simultaneous Removal of Multi-pollutants and Global Optimization for Ultra-low Emission System in Coal-fired Unit. M.S. thesis, Zhejiang University, Hangzhou, China, 2020.
|
Disclaimer/Publisher’s Note: The statements, opinions and data contained in all publications are solely those of the individual author(s) and contributor(s) and not of MDPI and/or the editor(s). MDPI and/or the editor(s) disclaim responsibility for any injury to people or property resulting from any ideas, methods, instructions or products referred to in the content. |
© 2024 by the authors. Licensee MDPI, Basel, Switzerland. This article is an open access article distributed under the terms and conditions of the Creative Commons Attribution (CC BY) license (http://creativecommons.org/licenses/by/4.0/).
