Submitted:
23 January 2024
Posted:
24 January 2024
You are already at the latest version
Abstract
Keywords:
1. Introduction
2. Materials and Methods
2.1. Synthesis of Au/V NPs
2.2. Structural Characterization of Au NPs and Au/V NPs
2.3. Electrochemical Characterization of Au/V NPs
3. Results and Discussion
3.1. Structural Characterization of Au NPs and Au/V NPs

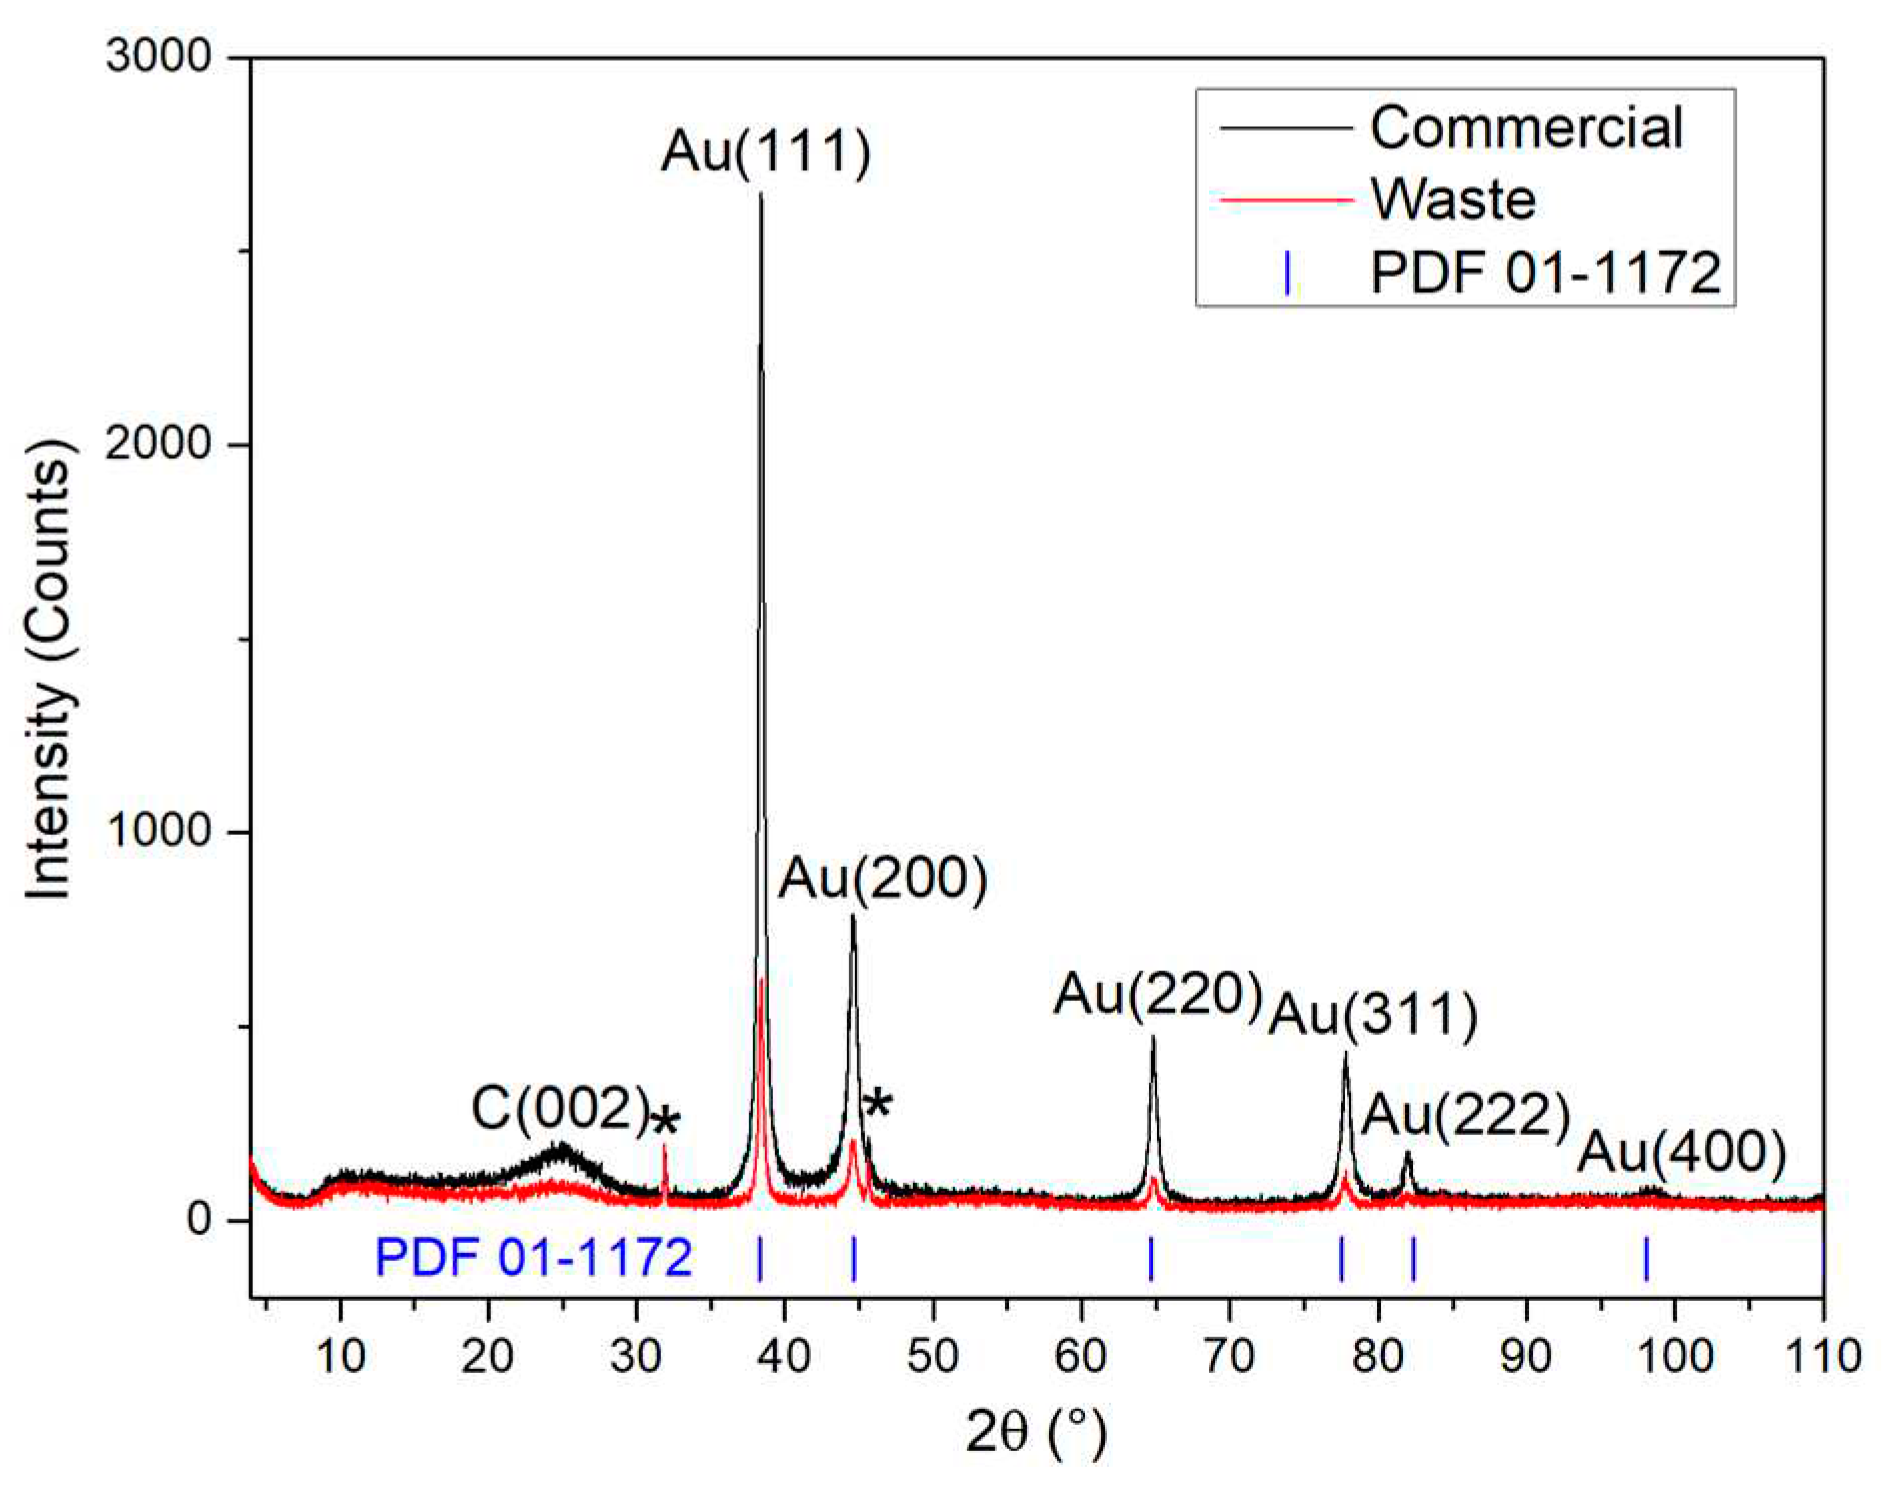
3.1. Electrochemical Characterization of Au/V NPs
4. Conclusions
Author Contributions
Funding
Institutional Review Board Statement
Informed Consent Statement
Data Availability Statement
Acknowledgments
Conflicts of Interest
References
- Abhishek, K.A.; Eleni, I.; Mrigendra, K.A.; Michael, J.; Keshav, P.; Min, Z.; Saket, M.; Akhilesh, K.P. Assessing Strategic Management of E-Waste in Developing Countries. Sustainability 2023, 15, 1–11. [Google Scholar] [CrossRef]
- Kasi, S.; Sami, N.; Farhana, H.; Arafat, D.; Motaharul, I. Easy E-Waste: A Novel Approach Toward Efficient and Sustainable E-Waste Management. In Intelligent Sustainable Systems, 1st ed.; Jennifer, S.R., Isidoros, P., Valentina, E.B., Eds.; Springer: Singapore, Singapore, 2023; Volume 665, pp. 557–571. [Google Scholar]
- Deepak, P.; Tenzin, D.; Somvir, B.; Anita, S. Electronic Waste Management: Challenges and Opportunities. In Environmental Microbiology and Biotechnology, 1st ed.; Anoop, S., Shaili, S., Dheeraj, R., Deepak, P., Eds.; Springer: Singapore, Singapore, 2020; Volume 1, pp. 69–90. [Google Scholar]
- Liou, T.H.; Liu, S.M.; Chen, G.W. Utilization of e-wastes as a sustainable silica source in synthesis of ordered mesostructured titania nanocomposites with high adsorption and photoactivity. Miner. Eng. 2023, 191, 107977. [Google Scholar] [CrossRef]
- Charu, G.; Ranjana, C.; Anju, C.; Atul, K.; Aprajita, S.; Anamika, T. Assessment of air pollution caused by illegal e-waste burning to evaluate the human health risk. Environ. Int. 2019, 125, 191. [Google Scholar] [CrossRef]
- Ramachandran, R.; Dharmaraj, K.; Natarajan, P. Electronic waste: A critical assessment on the unimaginable growing pollutant, legislations and environmental impacts. Environ. Challenges 2022, 7, 100507. [Google Scholar] [CrossRef]
- Sabah, M.A.; Chakinaz, T.E.; Dina, M.A. Green Processes for Electronic Waste Recycling: A Review. J. Sustain. Metall. 2018, 4, 295–311. [Google Scholar] [CrossRef]
- Minh, H.D.; Giang, T.N.; Ut, D.T.; Trung, H.B. Advances in hydrometallurgical approaches for gold recovery from E-waste: A comprehensive review and perspectives. J. Environ. Chem. Eng. 2022, 10, 107283. [Google Scholar] [CrossRef]
- Teresa, C.; Zhaojing, G.; Christophe, C.; Anthony, C.; Andrew, K.; Oliver, G.; Clara, S. Recovery of gold from e-waste via food waste by products. Nanotechnology 2023, 34, 065203. [Google Scholar] [CrossRef]
- Qinqin, X.; Du, X.H.; Dan, L.; Maria, S.; Zhang, Q.; Chao, X. Gold recovery from E-waste using freestanding nanopapers of cellulose and ionic covalent organic frameworks. Chem. Eng. J. 2023, 458, 141498. [Google Scholar] [CrossRef]
- Waristha, P.; Ampira, C.; Sutha, K. The environmental impact assessment of gold extraction processes for discarded computer RAM: a comparative study of two leaching chemicals. J. Mater. Cycles Waste Manage. 2021, 23, 1412. [Google Scholar] [CrossRef]
- H, W.; Giuseppe, P.; Anna, M.V.; Leonarda, F.L. Mesoporous Silica Based Gold Catalysts: Novel Synthesis and Application in Catalytic Oxidation of CO and Volatile Organic Compounds (VOCs). Catalysts 2013, 3, 774. [Google Scholar] [CrossRef]
- Viacheslav, S.; Sergey, A.D.; Mehran, M. Selective Oxidation of Transient Organic Radicals in the Presence of Gold Nanoparticles. Nanomaterials 2021, 11, 727. [Google Scholar] [CrossRef]
- Xiaopei, H.; Yuting, Z.; Tingting, D.; Jiang, L.; Hang, Z. Multifunctional Gold Nanoparticles: A Novel Nanomaterial for Various Medical Applications and Biological Activities. Front. Bioeng. Biotechnol. 2020, 8, 1. [Google Scholar] [CrossRef]
- Krzysztof, S.; Michal, G.; Barbara, K.M. Gold Nanoparticles in Cancer Treatment. Mol. Pharmaceutics 2019, 16, 1. [Google Scholar] [CrossRef]
- Muqaddas, N.; Ahmad, I.; Robina, B.; Zahoor, H.F. One step biogenic sugarcane bagasse mediated synthesis of gold nanoparticles and their catalytic applications in removing environmental pollutants. Z. Phys. Chem. 2023, 237(6), 675. [Google Scholar] [CrossRef]
- Huifeng, Q.; Lori, A.P.; Juan, C.V.; Zhun, Z.; Michael, S.W. Gold nanoparticles for cleaning contaminated water. J Chem Technol Biotechnol 2013, 88, 735. [Google Scholar] [CrossRef]
- Lee, M.J.; Choi, J.H.; Shin, J.H.; Jiung, Y.; Taehwan, K.; Kim, Y.J. Gold Nanoclusters with Two Sets of Embedded Enzyme Nanoparticles for Applications as Electrochemical Sensors for Glucose. ACS Appl. Nano Mater. 2023, 6, 12567. [Google Scholar] [CrossRef]
- Jared, T.S.; Vladimir, B.G.; Bernt, J.; Aaron, T.M. Electrochemical stability of carbon-supported gold nanoparticles in acidic electrolyte during cyclic voltammetry. Electrochim. Acta 2016, 187, 593. [Google Scholar] [CrossRef]
- Anu, R.; V, L. One step preparation of ‘ready to use’ Au@Pd nanoparticle modified surface using deep eutectic solvents and a study of its electrocatalytic properties in methanol oxidation reaction. J. Mater. Chem. A 2015, 3, 3019. [Google Scholar] [CrossRef]
- E, D.; Kinkelin, S.J.; Michael, B. Comparative Study of the Synthesis of sub-10 nm Carbon-Supported Gold Nanoparticles and their Suitability for Methanol Electrooxidation in Alkaline Media. ChemNanoMat 2022, 8, e202200098. [Google Scholar] [CrossRef]
- Shaohui, Y.; Shichao, Z.; Ye, L.; Guanrao, L. Electrocatalytic Performance of Gold Nanoparticles Supported on Activated Carbon for Methanol Oxidation in Alkaline Solution. J. Phys. Chem. C 2011, 115, 6986. [Google Scholar] [CrossRef]
- Emil, D.; Kinkelin, S.J.; Michael, B. Comparative Study of the Synthesis of sub-10 nm Carbon- Supported Gold Nanoparticles and their Suitability for Methanol Electrooxidation in Alkaline Media. ChemNanoMat 2022, 8, e202200098. [Google Scholar] [CrossRef]
- Jin, L.; Peter, N.N.; Yan, L.; Derrinck, M.; Lingyan, W.; Zhong, C.J. Characterization of Carbon-Supported AuPt Nanoparticles for Electrocatalytic Methanol Oxidation Reaction. Langmuir 2006, 22, 2892. [Google Scholar] [CrossRef]
- Yeh, Y.C.; Brian, C.; Vincent, M.R. Gold nanoparticles: preparation, properties, and applications in bionanotechnology. Nanoscale 2012, 4, 1871. [Google Scholar] [CrossRef] [PubMed]
- Olivier, P.; Yoann, P.; William, W. A complete explanation of the plasmonic colours of gold nanoparticles and of the bichromatic effect. J. Mater. Chem. C 2023, 11, 15824. [Google Scholar] [CrossRef]
- Gold Nanoparticles: Properties and Applications. Available online: https://www.sigmaaldrich.com/MX/es/technicaldocuments/technical-article/materials-science-and-engineering/biosensors-and-imaging/gold-nanoparticles (accessed on 20 December 2023).
- Shalmali, B.; Christopher, G.; Sebastian, K.; Volker, P. On the state and stability of fuel cell catalyst inks. Adv. Powder Technol. 2021, 32, 3845. [Google Scholar] [CrossRef]
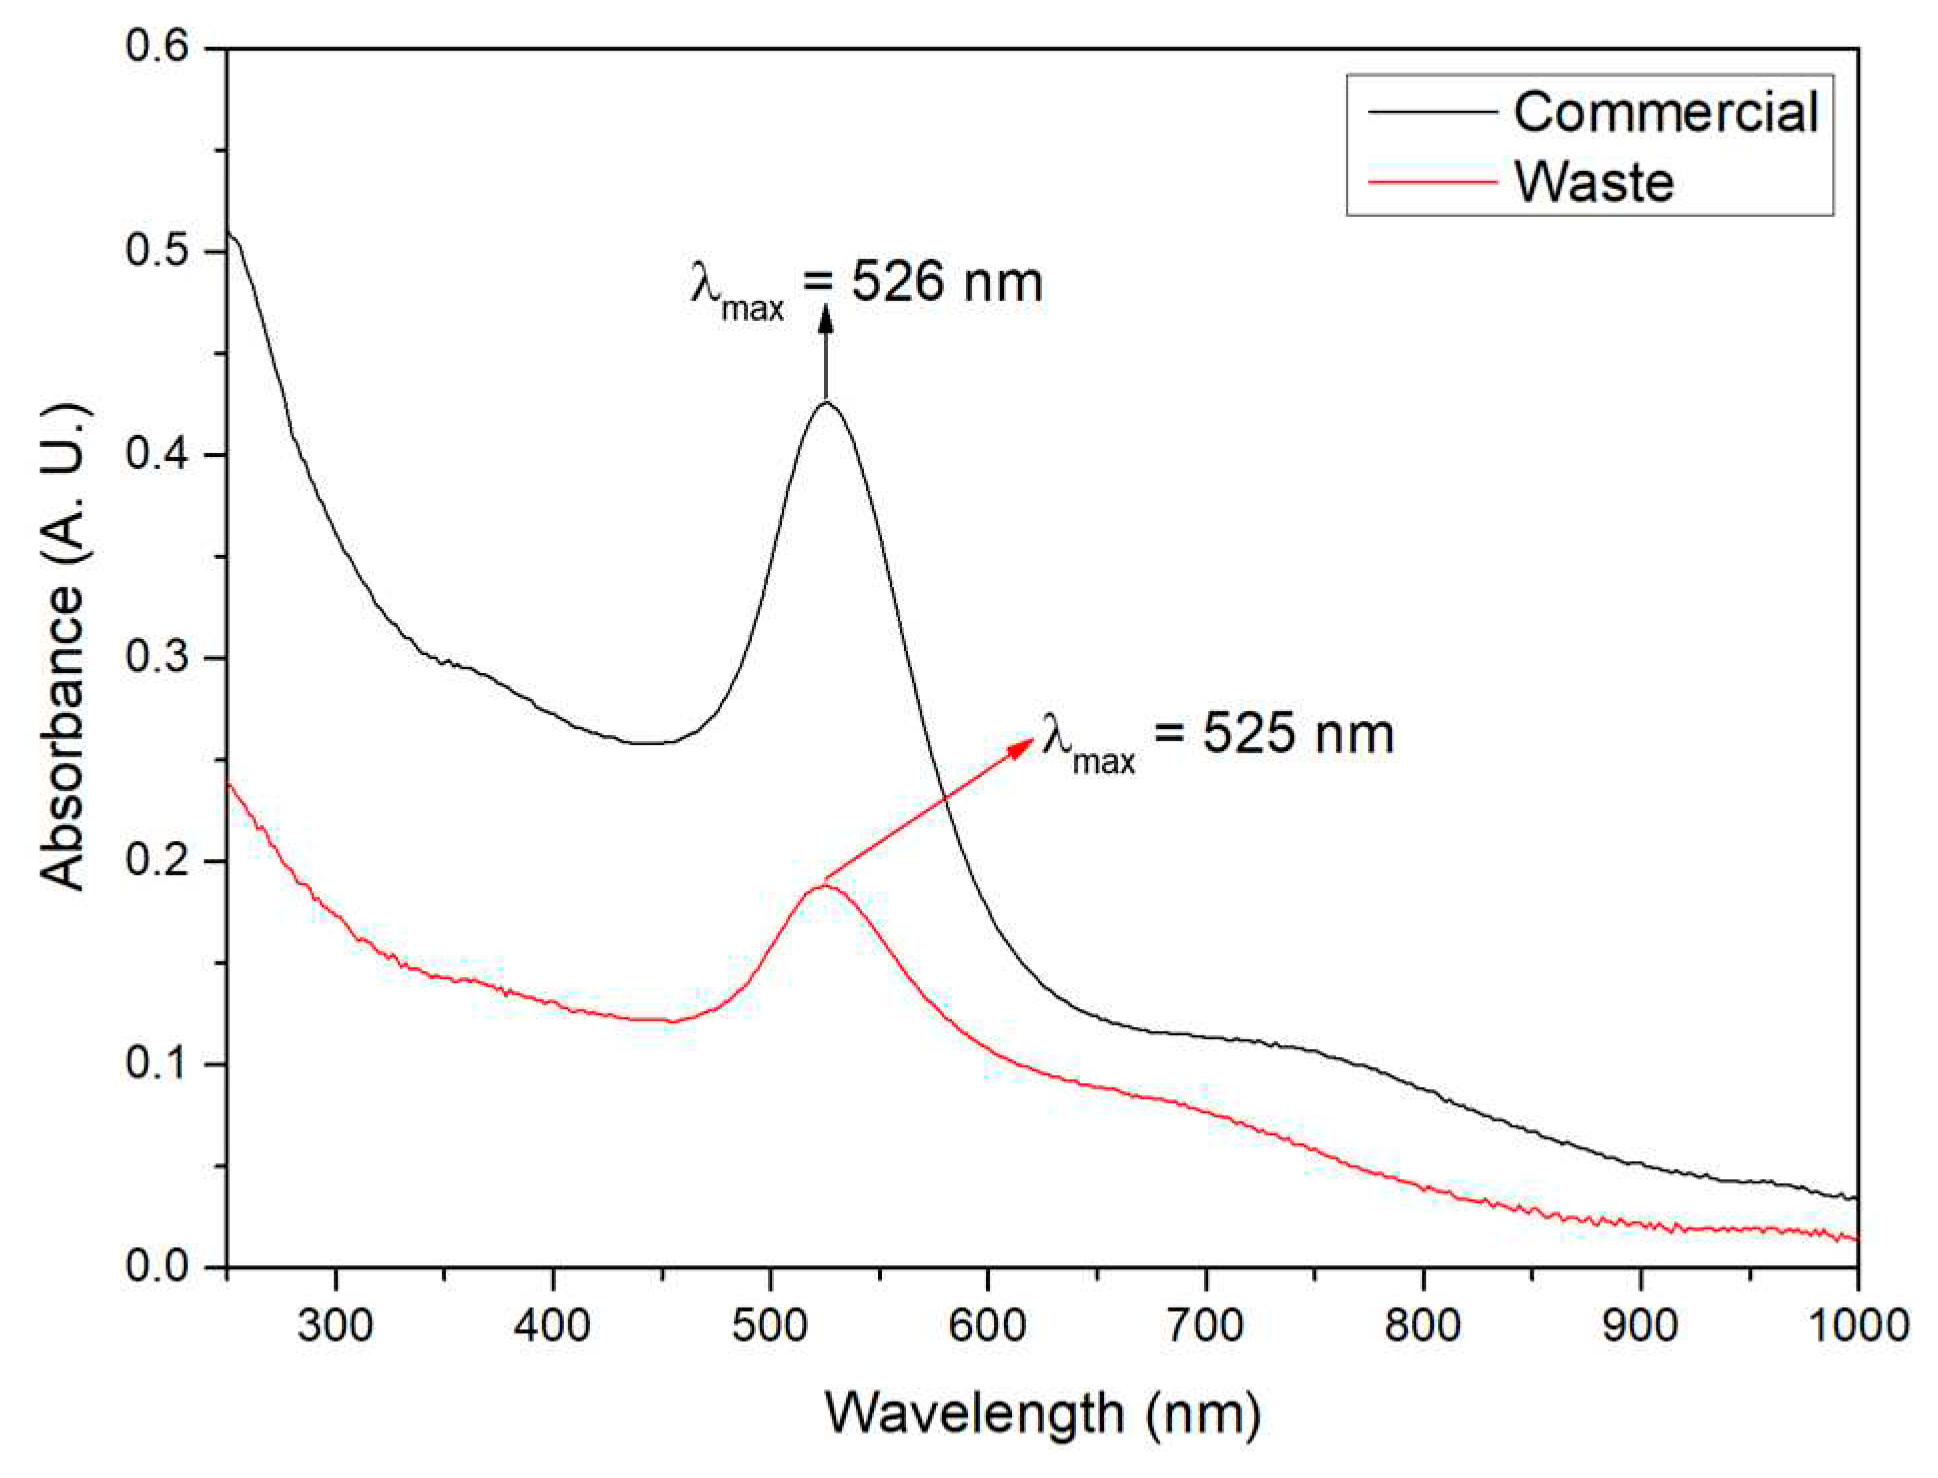
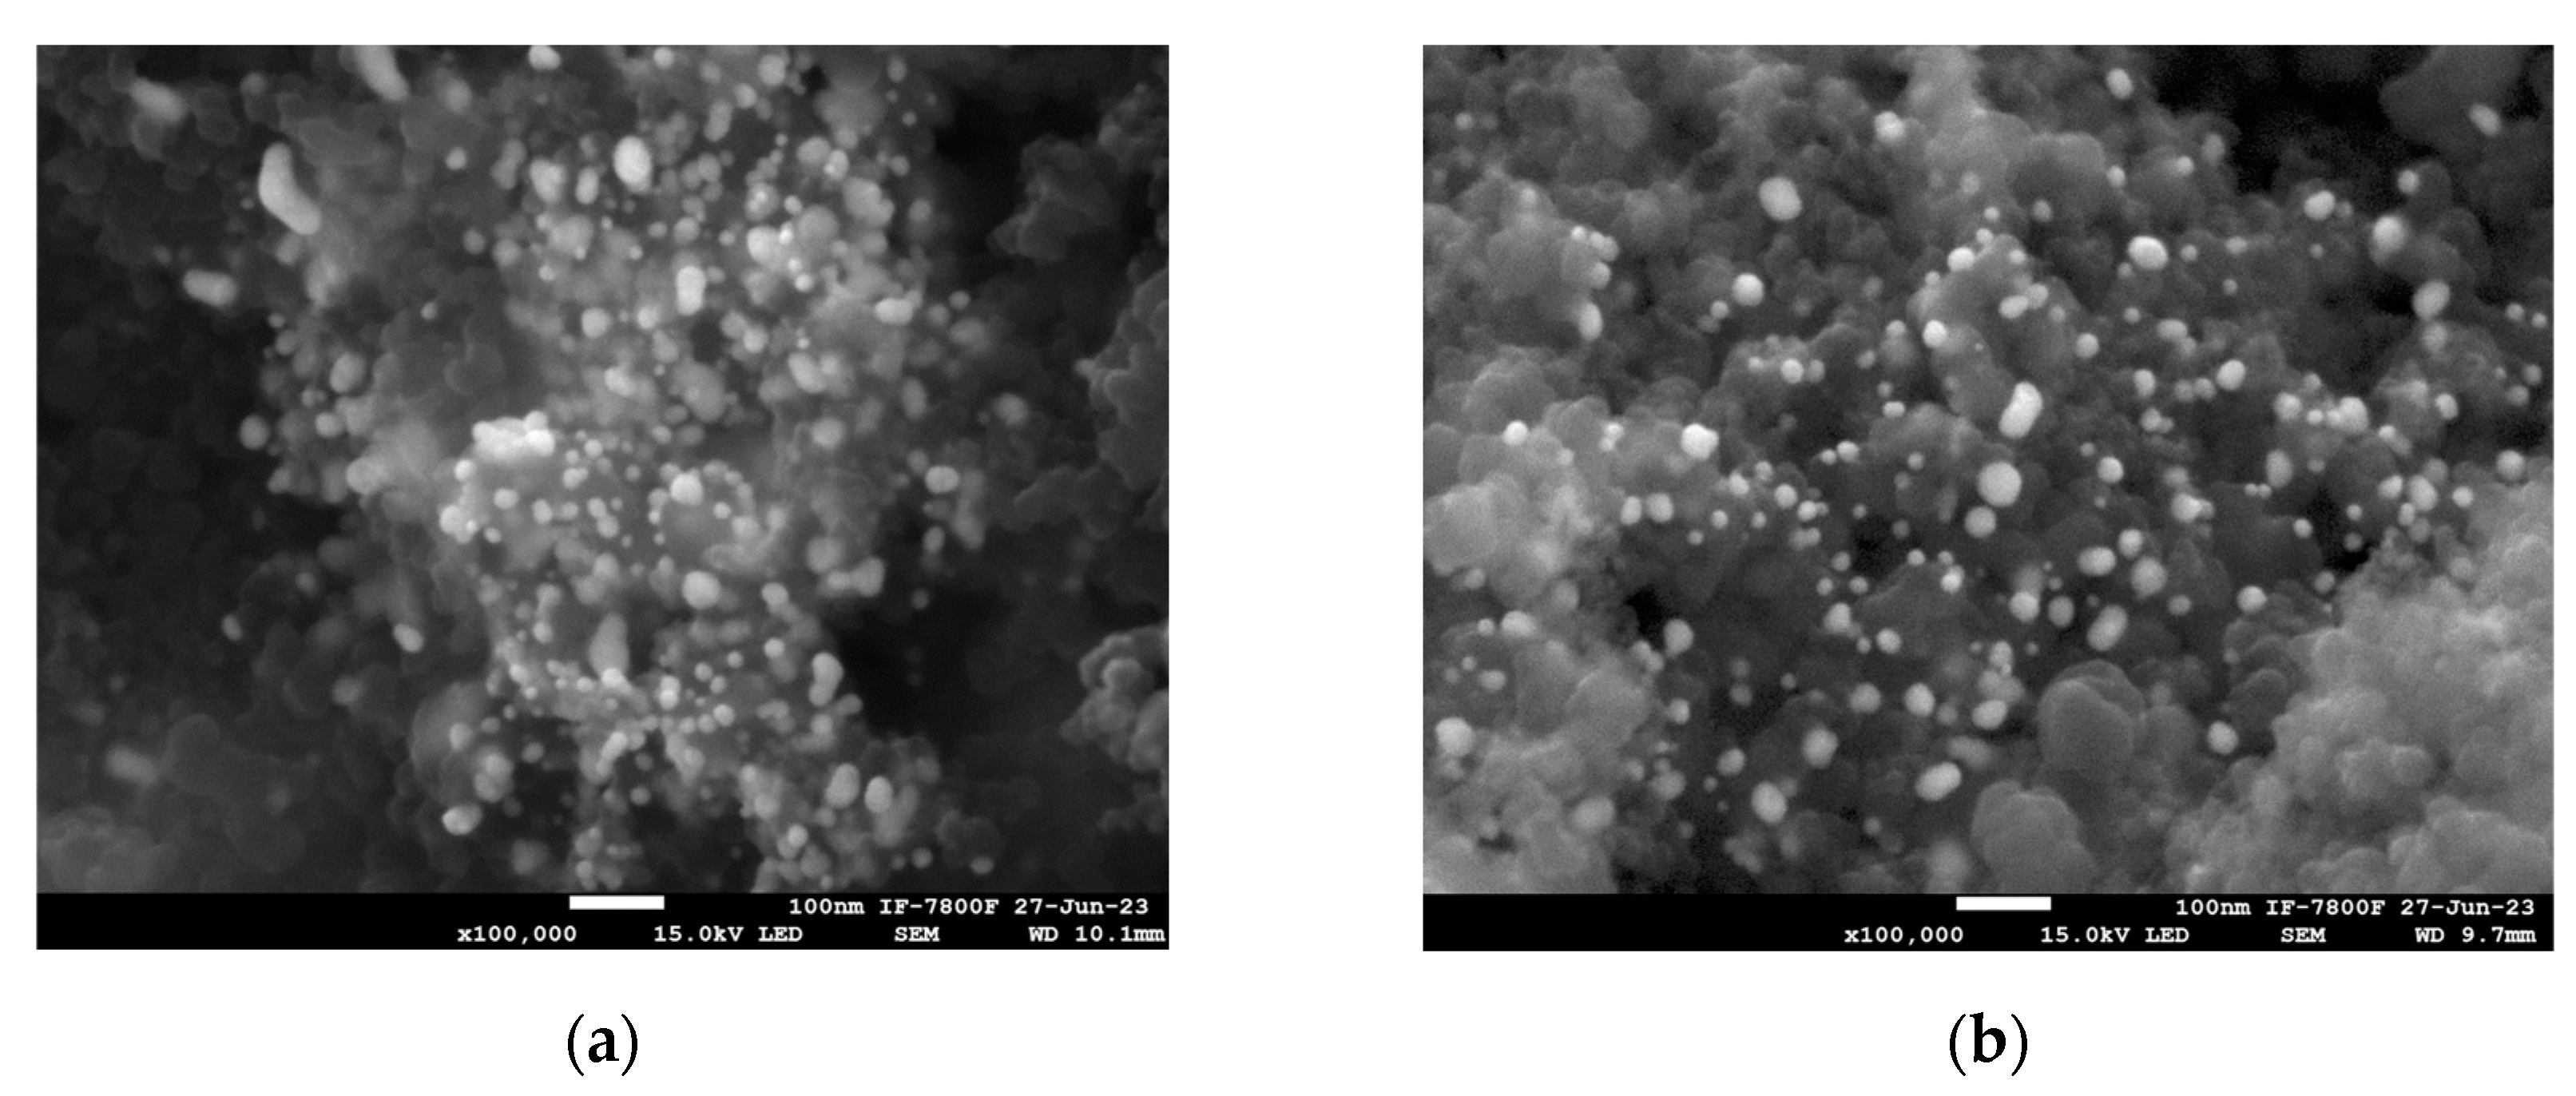
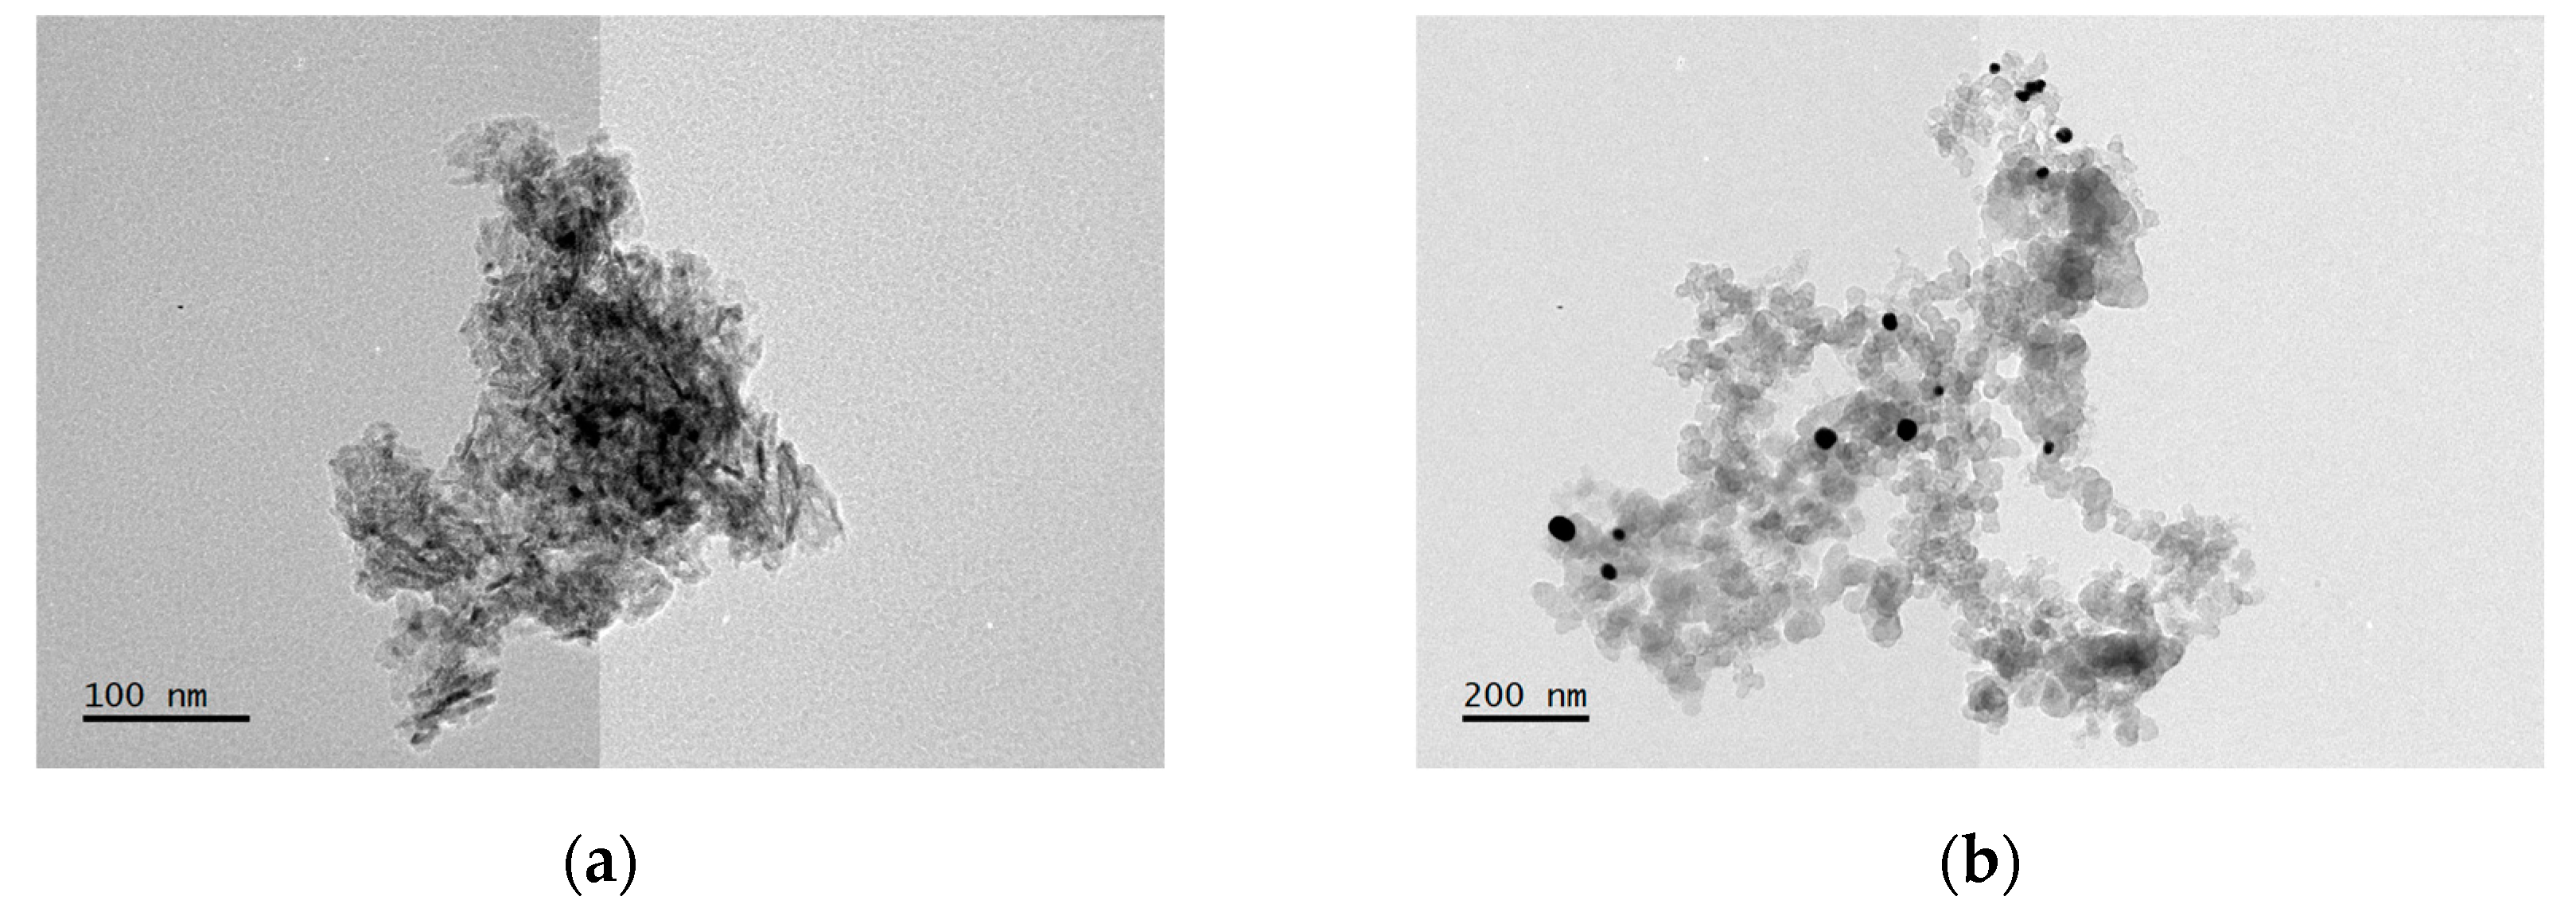
| Element | wt% (Aue-w NPs) | wt% (Aucom NPs) |
|---|---|---|
| Au | 16.40 | 27.29 |
| Na | 31.84 | 19.95 |
| Cl | 43.55 | 18.12 |
| O | 8.21 | 34.64 |
Disclaimer/Publisher’s Note: The statements, opinions and data contained in all publications are solely those of the individual author(s) and contributor(s) and not of MDPI and/or the editor(s). MDPI and/or the editor(s) disclaim responsibility for any injury to people or property resulting from any ideas, methods, instructions or products referred to in the content. |
© 2024 by the authors. Licensee MDPI, Basel, Switzerland. This article is an open access article distributed under the terms and conditions of the Creative Commons Attribution (CC BY) license (http://creativecommons.org/licenses/by/4.0/).


