1. Introduction
The construction sector contributes significantly to the socioeconomic progress of a nation resulting from human and economic growth that requires housing conditions and civil infrastructure. The construction industries are heavily reliant on the use of cement, which is widely manufactured, and its production causes significant environmental impacts [
1]. Cement is produced from the limestone calcination, which releases substantial amount of carbon dioxide, and the production process is energy-intensive [
2]. Resource extraction such as limestone and the associated waste generation during production also impact the ecosystem. To address these challenges, the industry is exploring the use of alternative fuels in cement production and environmentally friendly cementitious materials.
Geopolymer presents a promising solution to address the environmental concerns associated with cement production [
3]. Unlike conventional cement manufacturing, geopolymer does not rely on the carbon and energy intensive calcination process. Instead, geopolymer utilizes industrial by-products like fly ash or slag, which reduces the reliance on virgin materials for cement production and so mitigates the environmental impact by using recycled waste materials. Geopolymer production involves an alkaline activation process that reacts with these by-products to produce a binder similar to traditional cement [
4]. This process requires less energy and may significantly reduce the carbon footprint associated with the manufacturing of cementitious binders. Alternatively, it diverts the industrial byproducts from the residue areas, which is avoiding land use changes.
A range of industrial by-products and mineral deposits, like Metakaolin, fly ash, GGBFS, ferronickel slag, and ultrafine slag, have been used as geopolymer precursors. Among these materials, fly ash is particularly noteworthy for its wider availability and its high silica (SiO
2) and alumina (Al
2O
3) content, exceeding 70% [
5]. Fly ash is often combined with various industrial by-products, such as GGBFS, to improve both the fresh and hardened properties of the geopolymer binder. The combination of fly ash and GGBFS in geopolymer demonstrated excellent mechanical and durability properties [
6]. GGBFS, characterized by its high calcium content, complements the very low calcium content of fly ash when used together as binary precursors. While curing at room temperature, GGBFS contributes to improved mechanical and microstructural properties due to its elevated calcium content and enhances binding properties when activated by an alkali [
6]. By replacing silicon rich materials that has low calcium with a small proportion of GGBFS, the setting time can be reduced and mechanical properties in both the early and later stages of geopolymer development can be enhanced [
6].
The production of fly ash, a by-product from coal combustion, has been gradually decreasing due to several factors. The shift towards decarbonization processes, such as natural gas and renewable energy, will gradually reduce the reliance on coal-fired power plants [
7], which will result in the decrease in fly ash generation. Additionally, advancements in pollution control technologies in these plants have resulted in the reduction of fly ash generation. Furthermore, as a part of decarbonization process, the iron production process is switching from blast furnace to an electric arc furnace, which will result in the reduction of GGBFS [
8]. As a result, it is crucial to discover a substitute material for these industrial byproducts with high pozzolanic properties to produce geopolymer binder. The solution lies in the waste that is generated within the construction industry.
Globally, approximately 25-30% of the solid waste generated is attributed to the construction industry, posing an escalating threat to the environment in recent times [
9]. Australia’s construction industry contributes to a substantial portion of the waste annually (i.e., 76 million tons). Despite a relatively higher recovery rate within the sector, about 24% of total construction waste remains unrecycled, leading to landfill disposal [
10]. For every million dollars contributed to the economy, the construction sector produces about 87 tons of waste, which is could be eco-efficient [
11]. The expenses allocated to waste services have surged since 2016, now exceeding
$17 billion annually, with
$2 billion attributed to the construction industry. This increase, amounting to a 35% rise from 2016-2017, underscores the concerning the annual growth of waste production [
11].
The bulk of waste, around 80%, generated from construction and demolition waste includes concrete and brick waste [
12]. Recycling these concrete and brick wastes in concrete production not only alleviates waste disposal issues but also decreases the construction industry’s reliance on natural raw materials. Currently, researchers have made significant strides in utilizing recycled concrete aggregate and are initiating large-scale recycling efforts [
13,
14,
15]. Regarding brick waste utilization, the usual practice involves crushing it and then utilizing it as fractional replacements for fine or coarse aggregates in concrete. Limited research has explored the utilization of this brick waste in the creation of the geopolymer binder [
16]. To address this research void, the authors had previously examined the integration of waste clay brick into the geopolymer binder as a partial substitute for fly ash. However, it is crucial to assess the environmental sustainability and techno-eco-efficiency level, along with technical feasibility, to validate the geopolymer mix design employed in the prior study.
Salas et al. [
17], Kastiukas et al. [
18] and Kul et al. [
19] demonstrated that geopolymer binders offer a more sustainable and environmentally friendly alternative to conventional cement, contributing to the reduction in greenhouse gas emissions by 27-64%. Life cycle assessment has been undertaken widely as a sustainability assessment tools for civil and construction engineers [
20].
Only a few studies [
21,
22,
23] have conducted LCA for geopolymer binders based on waste clay brick powder. Migunthanna et al. [
21] performed a Life Cycle Assessment, comparing the environmental impact of conventional cement -based concrete and geopolymer concrete in rigid pavement construction, assessing CO
2 emissions and energy consumption across different stages of the LCA. The substitution of conventional concrete with geopolymer binders resulted in a nearly 50% reduction in total CO
2 emissions and a 72% decrease in energy consumption. This study used waste clay bricks, slag, and fly ash as precursors, with anhydrous sodium silicate as the activator, to produce one-part geopolymer concrete. Mir et al. [
22] performed LCA using GaBi software and followed ISO 14040-44 guidelines to assess the environmental implications of the use of geopolymers made from red brick waste and red ceramic waste. The study had considered three optimized mixtures and curing methods for assessing environmental impacts including Global Warming Potential (GWP), Eutrophication Potential (EP), Ozone Depletion Potential (ODP), Acidification Potential (AP), among others. In Phase I, using a binary composition, sodium silicate and electricity made significant contributions to environmental consequences. In Phase II, a ternary mixture, that slightly increased the use of sodium silicate but exhibited lower overall environmental effects compared to binary compositions. In Phase III, it resulted in similar environmental performance as Phase I, by producing higher GWP from additional curing. An environmental LCA conducted by Fořt et al. [
23] found that the CO
2 was reduced by 112% due to the replacement of a standard cement paste with the geopolymer paste sample. Despite other factors being considered, the analysis specifically focused on the embodied energy, highlighting that the substantial impact observed was directly associated with the utilization of alkaline activators in the studied context. They found that the manufacturing of sodium silicate requires significant energy inputs, resulting in a larger environmental impact compared to conventional binders. For instance, producing one tonne of 48% Na
2SiO
3 consumes about 11.2 MJ of non-renewable energy, representing a substantial portion of energy utilized in geopolymer production.
However, the above-mentioned studies did not consider either life cycle costing or eco-efficiency portfolio analysis, particularly in the context of geopolymer concrete. These analyses are crucial in the engineering decision making process as environmentally friendly materials are not always eco-efficient or economically feasible. Dynan et al. [
24] followed the ISO framework, encompassing several stages from goal and scope to creating an eco-efficiency portfolio, to assess geopolymer concrete as an eco-friendly alternative to traditional cement. While it proved effective in reducing emissions, particularly in terms of global warming potential, it encountered challenges in other environmental impact aspects. Nevertheless, this study did not consider techno-eco-efficiency portfolio analysis. Hence, there is inadequate research examining the techno-eco-efficiency performance of geopolymer binders to compare them against conventional ones, that evaluates the economic and environmental implications of engineering or technical strategies.
The research significance lies in its comprehensive approach. Initially, it studied a detailed LCA, specifically exploring the fly ash-GGBFS-WCBP binder to evaluate WCBP’s environmental viability within the geopolymer mix. Additionally, the study investigated Life Cycle Costing (LCC) analysis for the geopolymer mortar mixes. The primary focus was on optimizing their cost-effectiveness. Through a meticulous hotspot analysis of these mixes, the research identified the specific areas characterized by the highest energy consumption. Lastly, the study utilized a techno-eco-efficient analysis to determine the eco-efficiency performance of the structurally sound fly ash-GGBFS-WCBP mixes as the techno-environmental benefits could be outweighed by the increased recycling costs.
4. Conclusion
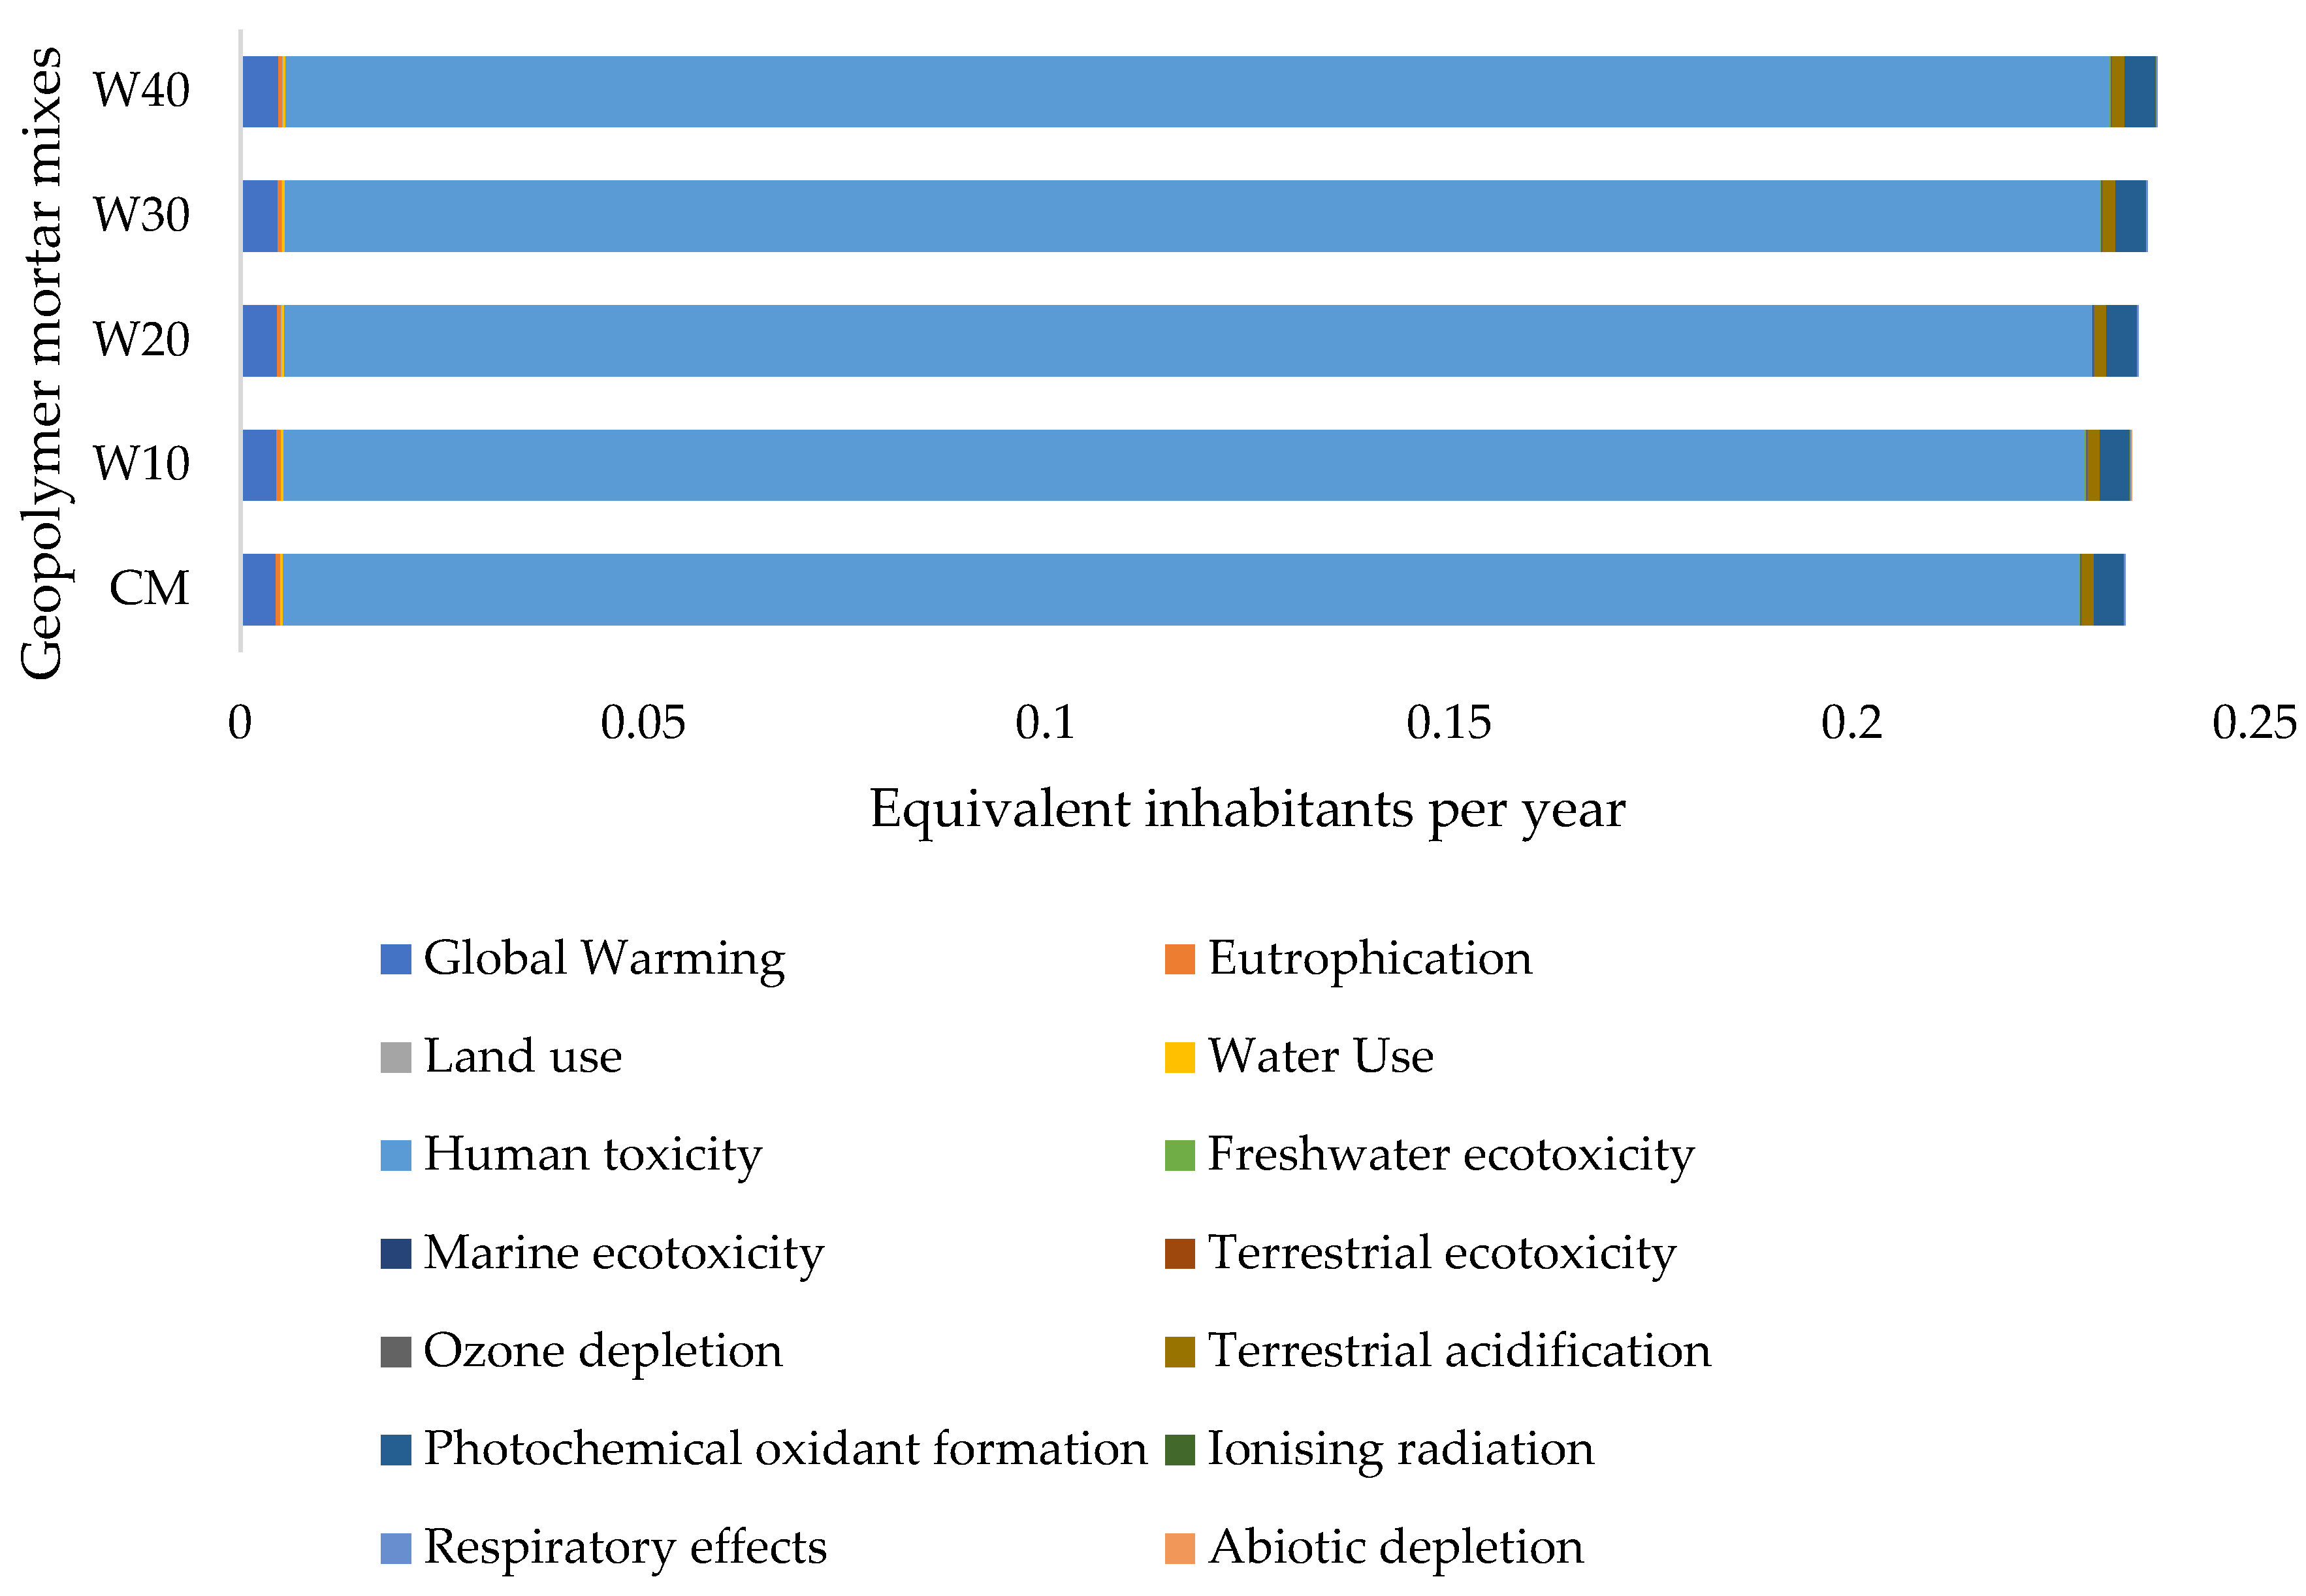
This study was undertaken to assess the techno-eco-efficiency of WCBP-based geopolymer mortar, particularly focusing on the substitution of fly ash with WCBP in ambient cured conditions. The environmental impact was higher for the WCBP rich sample (up to a maximum of 1.7% for W40) compared to the CM containing 0% WCBP. Among the fourteen impacts studied, human toxicity emerged as the dominant environmental impact, accounting for around 95% of the impact across all the mixes, followed by global warming at (2%). Similar outcomes have been demonstrated in prior studies on glass aggregate based geopolymer concrete [
24].
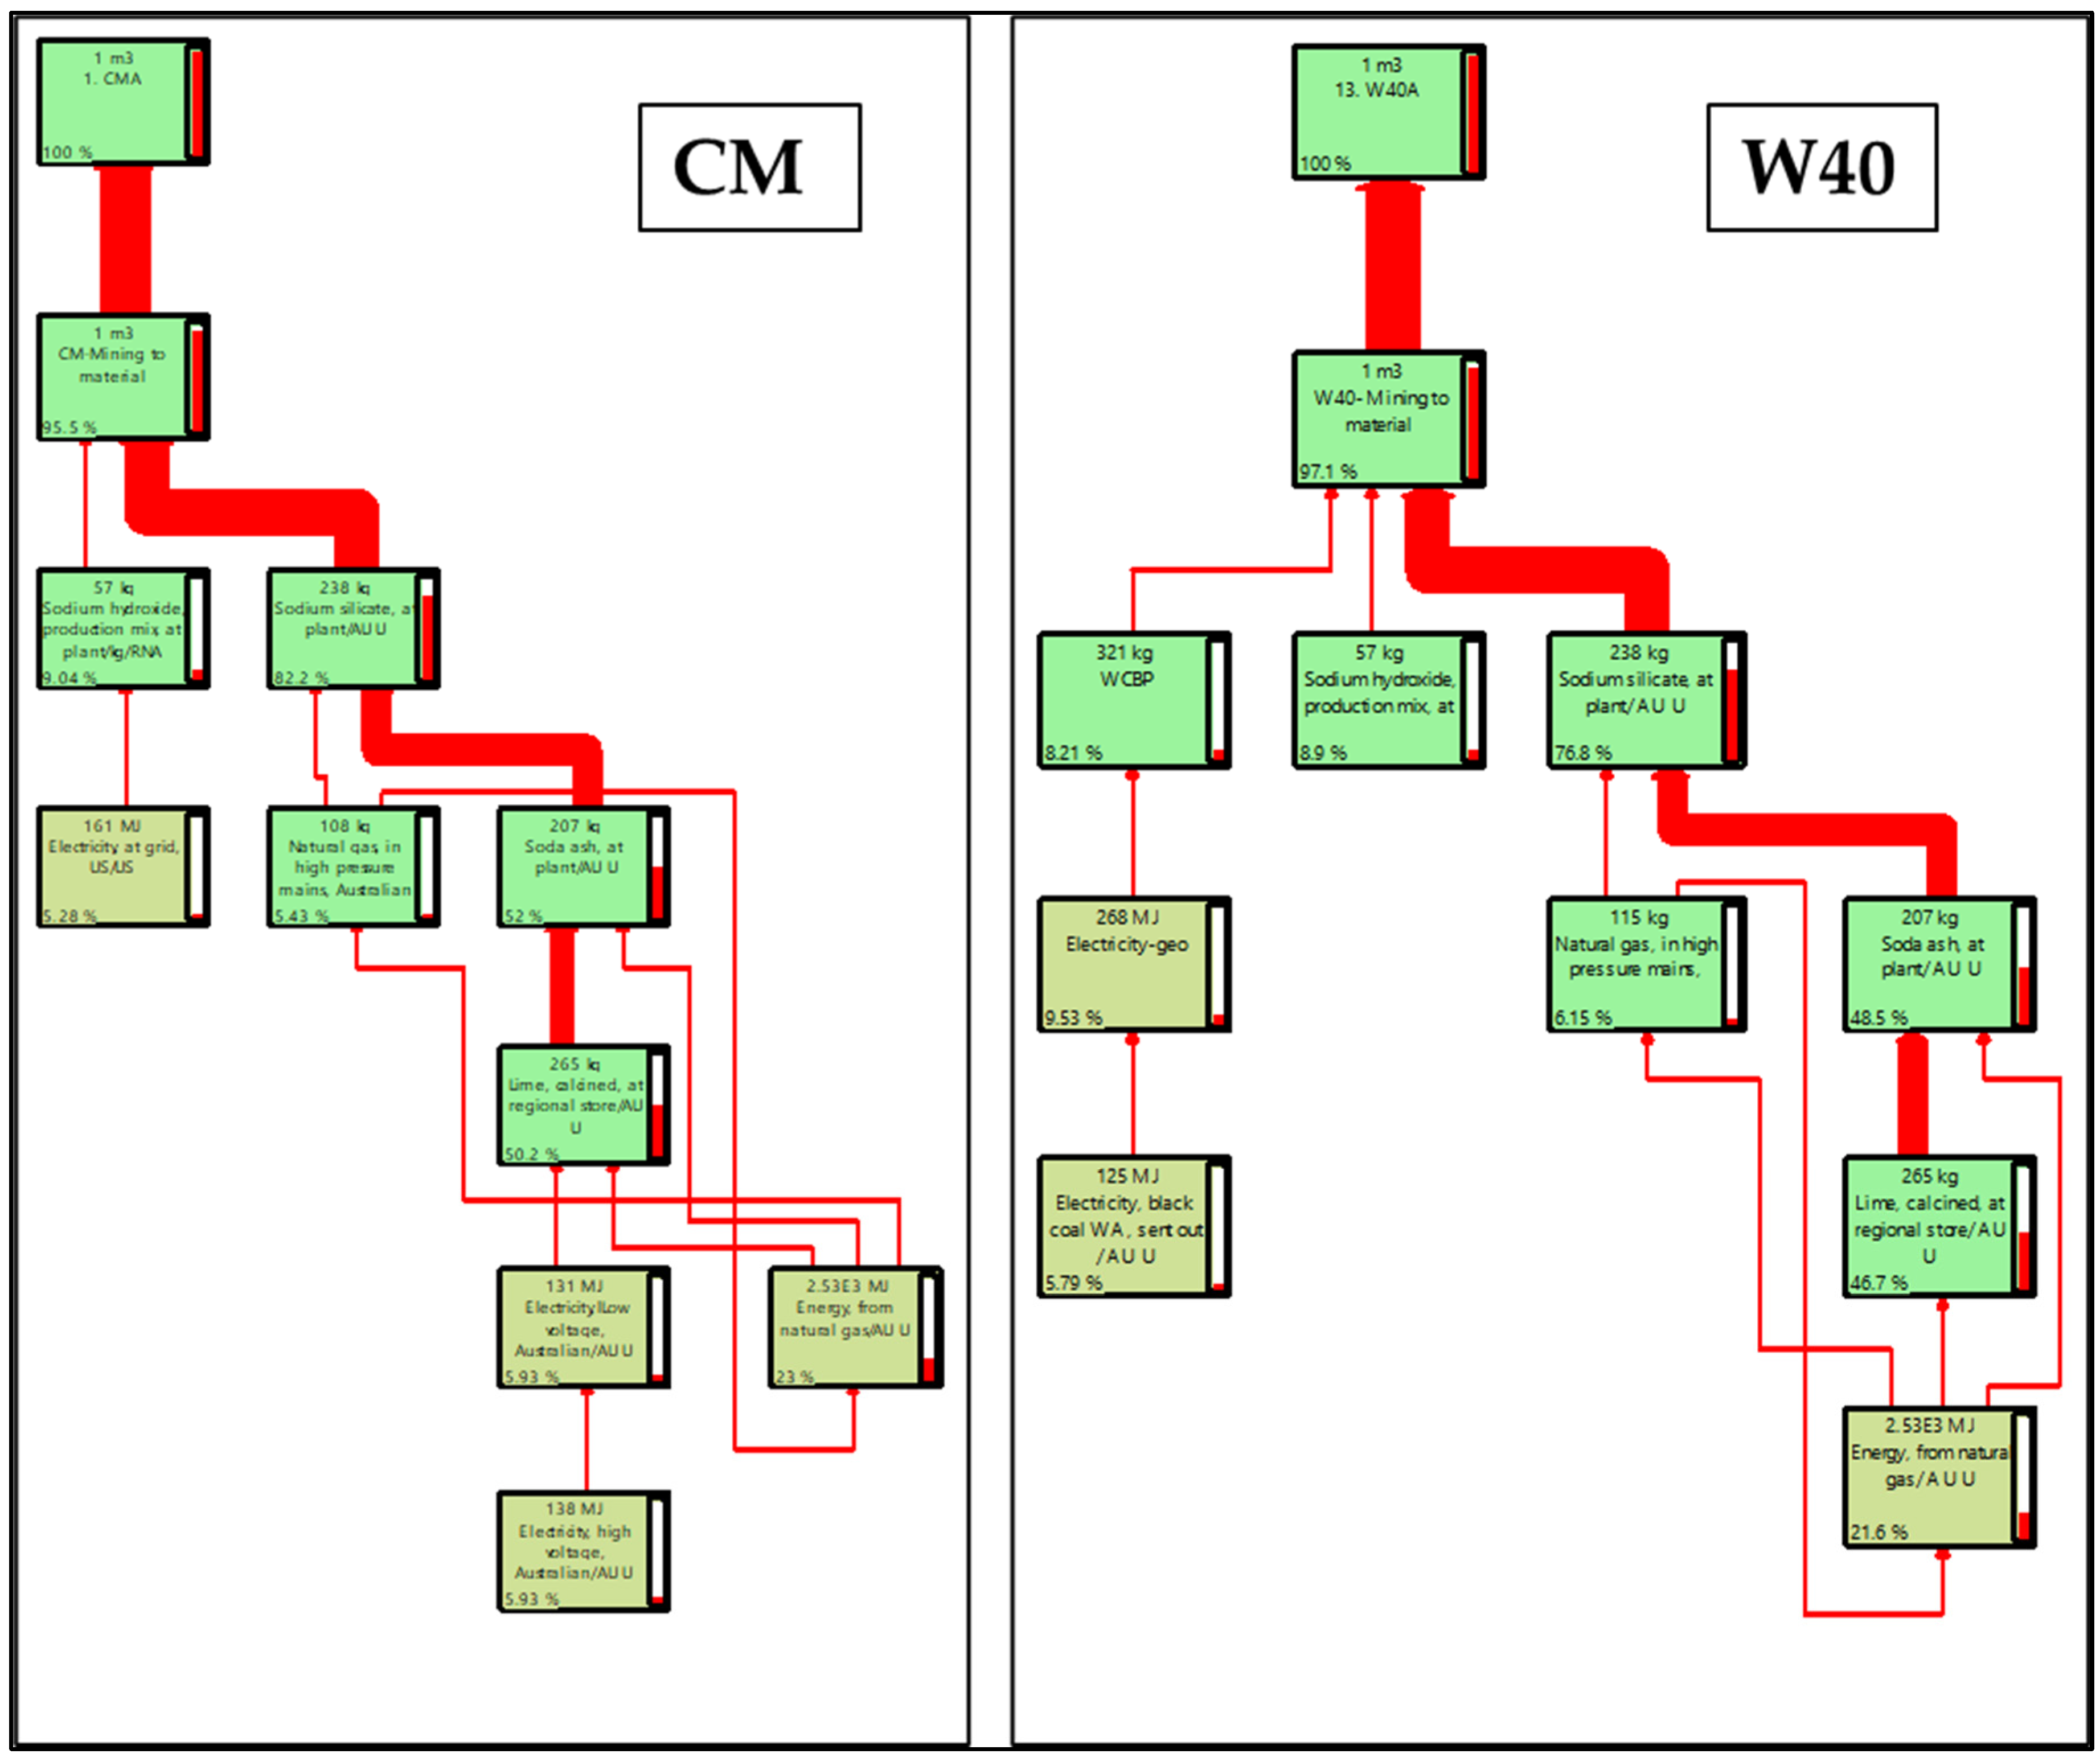
Next, the primary area of concern was pinpointed, specifically the energy utilized in the production of alkaline activators at the batching plant, which emerged as a significant factor across all geopolymer mixes. Simultaneously, the activity of grinding brick aggregate into WCBP consistently stood out as a crucial hotspot in the geopolymer mortar mixes that incorporated WCBP. These findings emphasize the critical role of these processes in the overall energy consumption and environmental impact of geopolymer production. Prior research has demonstrated analogous findings for alkali-activated geopolymer mix [
23].
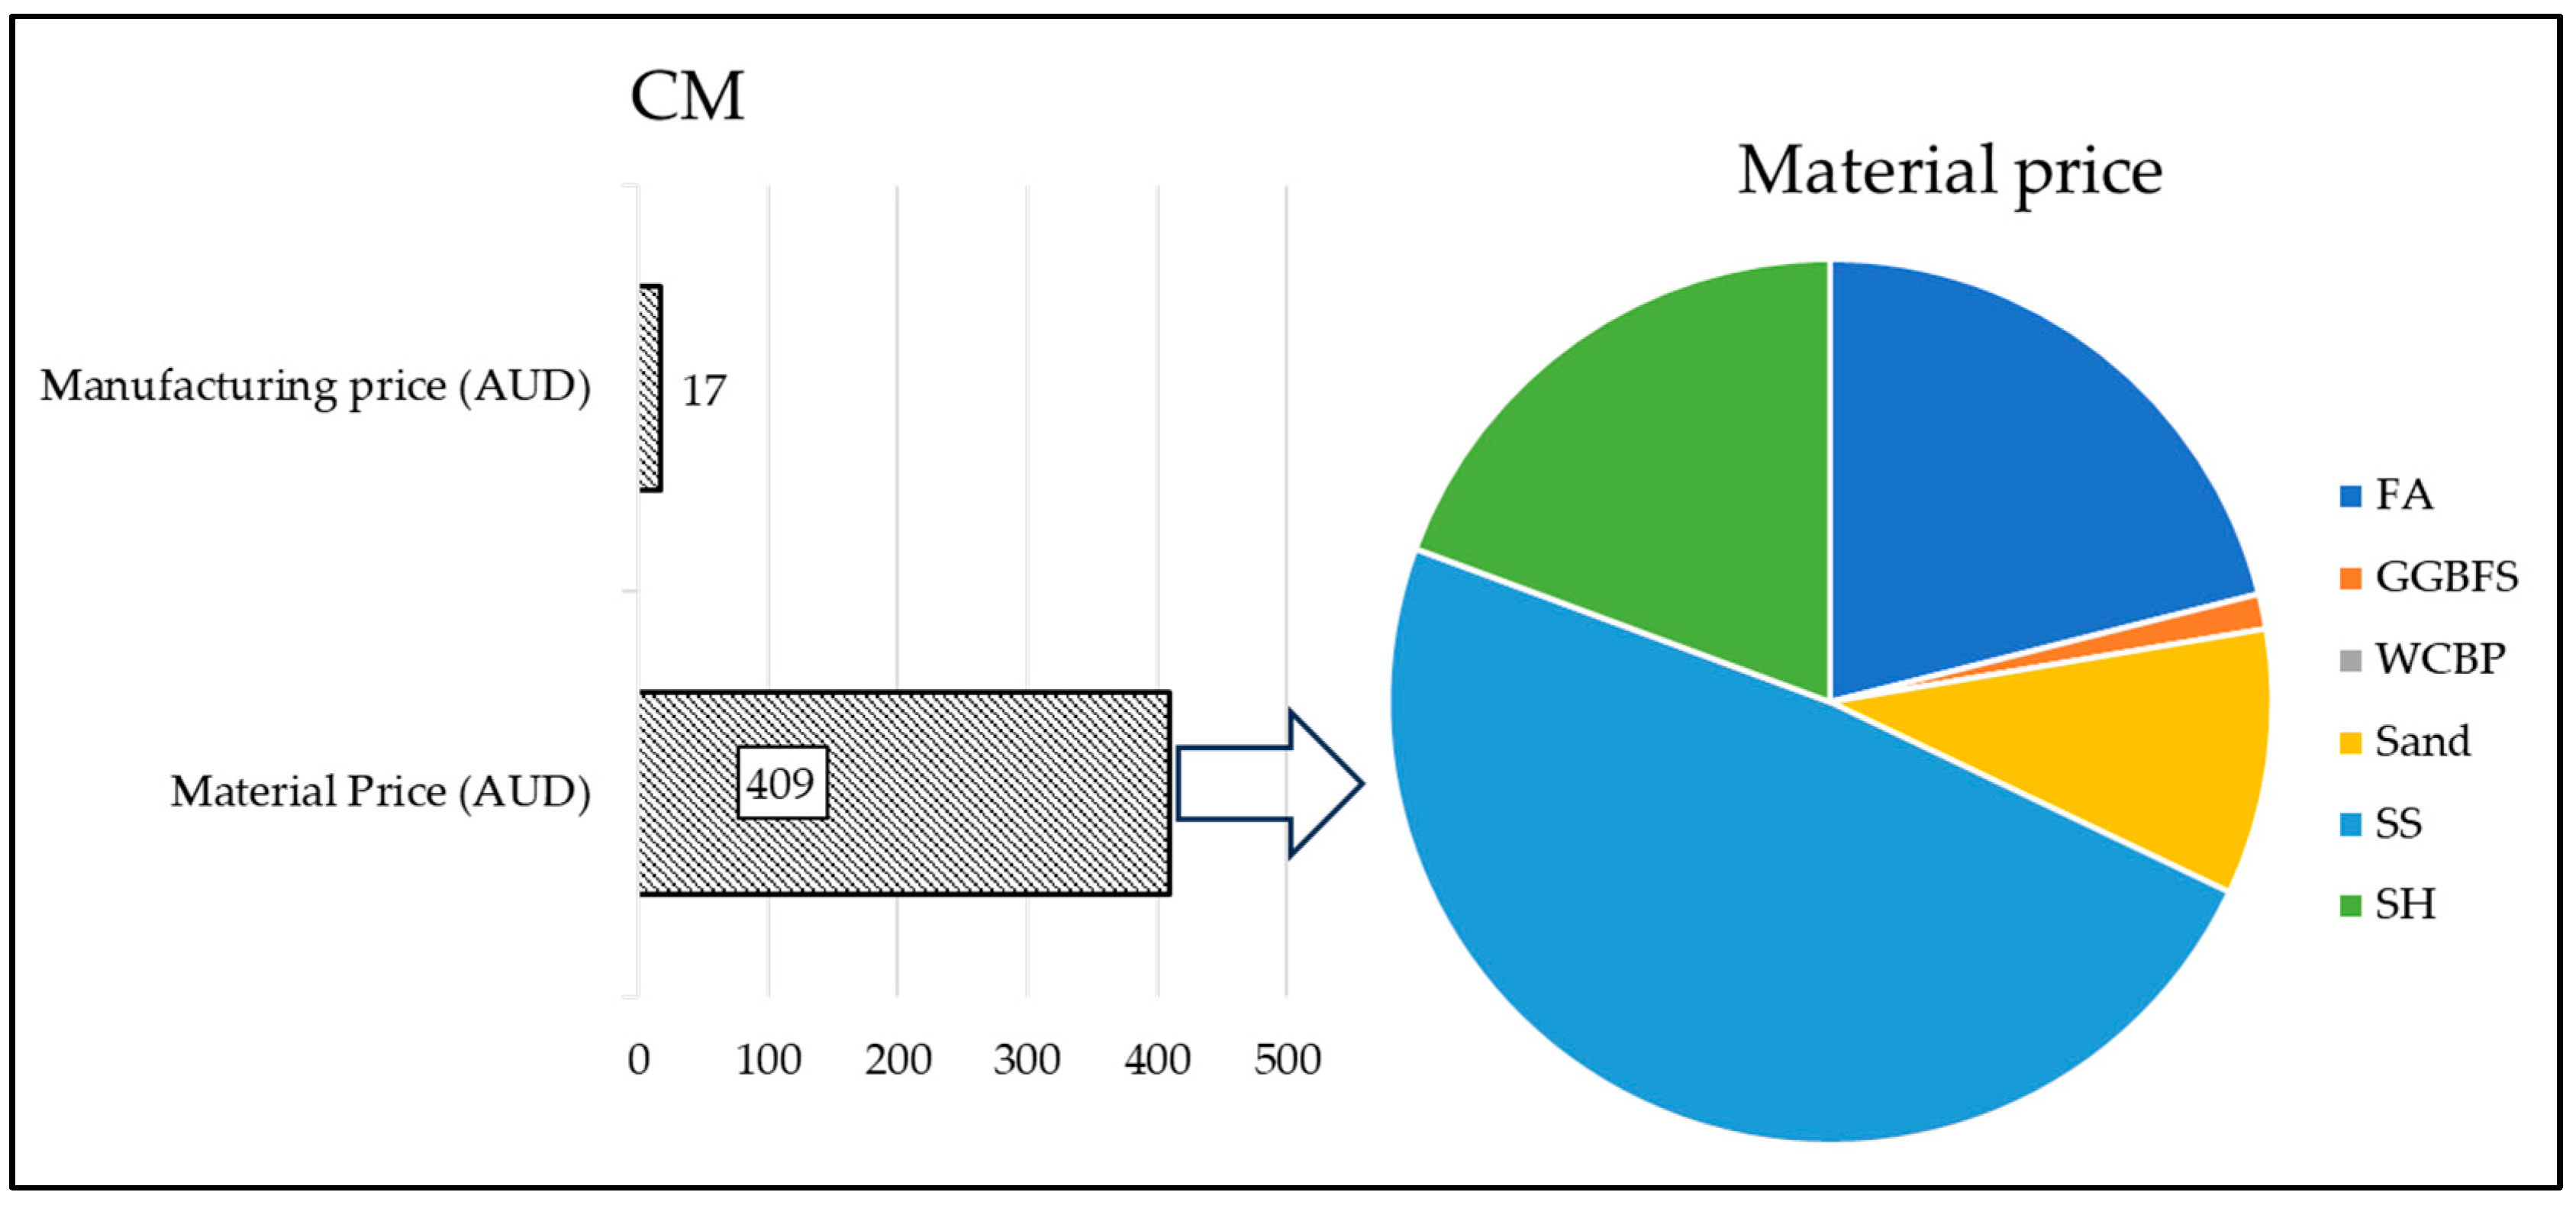
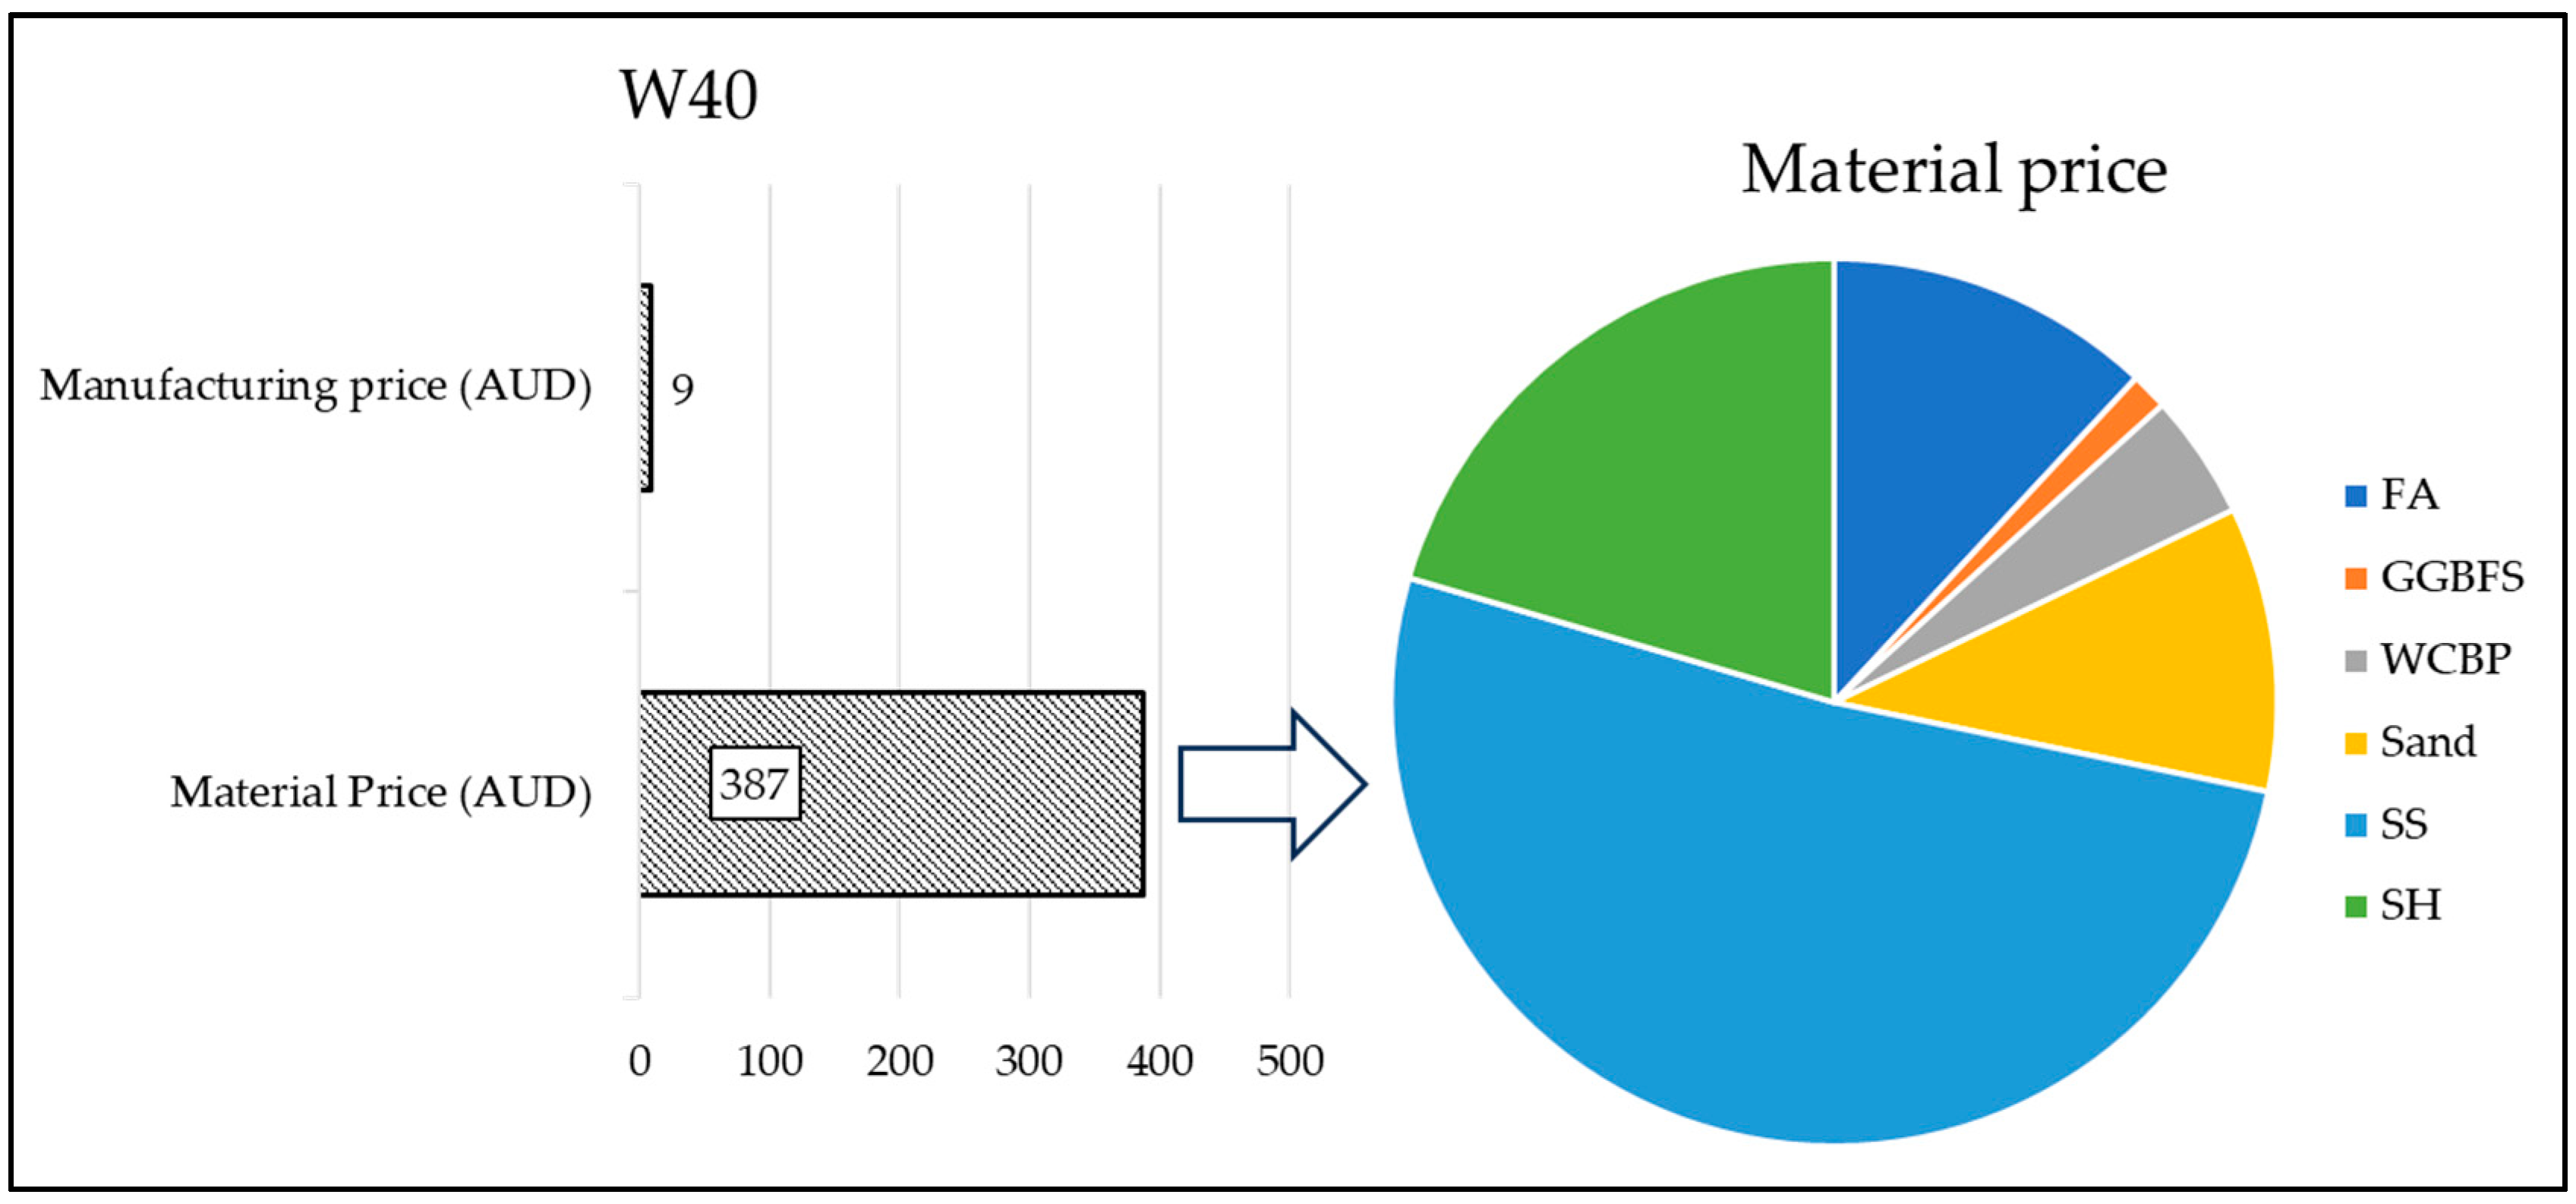
In the case of LCC, the examination revealed that the greatest cost contributor for all geopolymer mortar samples was associated with alkaline activators, specifically sodium silicate and sodium hydroxide. These components stood out as the primary factors influencing the economic aspects of the geopolymer production process. Furthermore, in the case of WCBP-rich samples, the total cost was found to be lower than that of the CM. This cost reduction is attributed to the economical pricing of WCBP, signifying its potential as a cost-effective alternative in the formulation of geopolymer mortars.
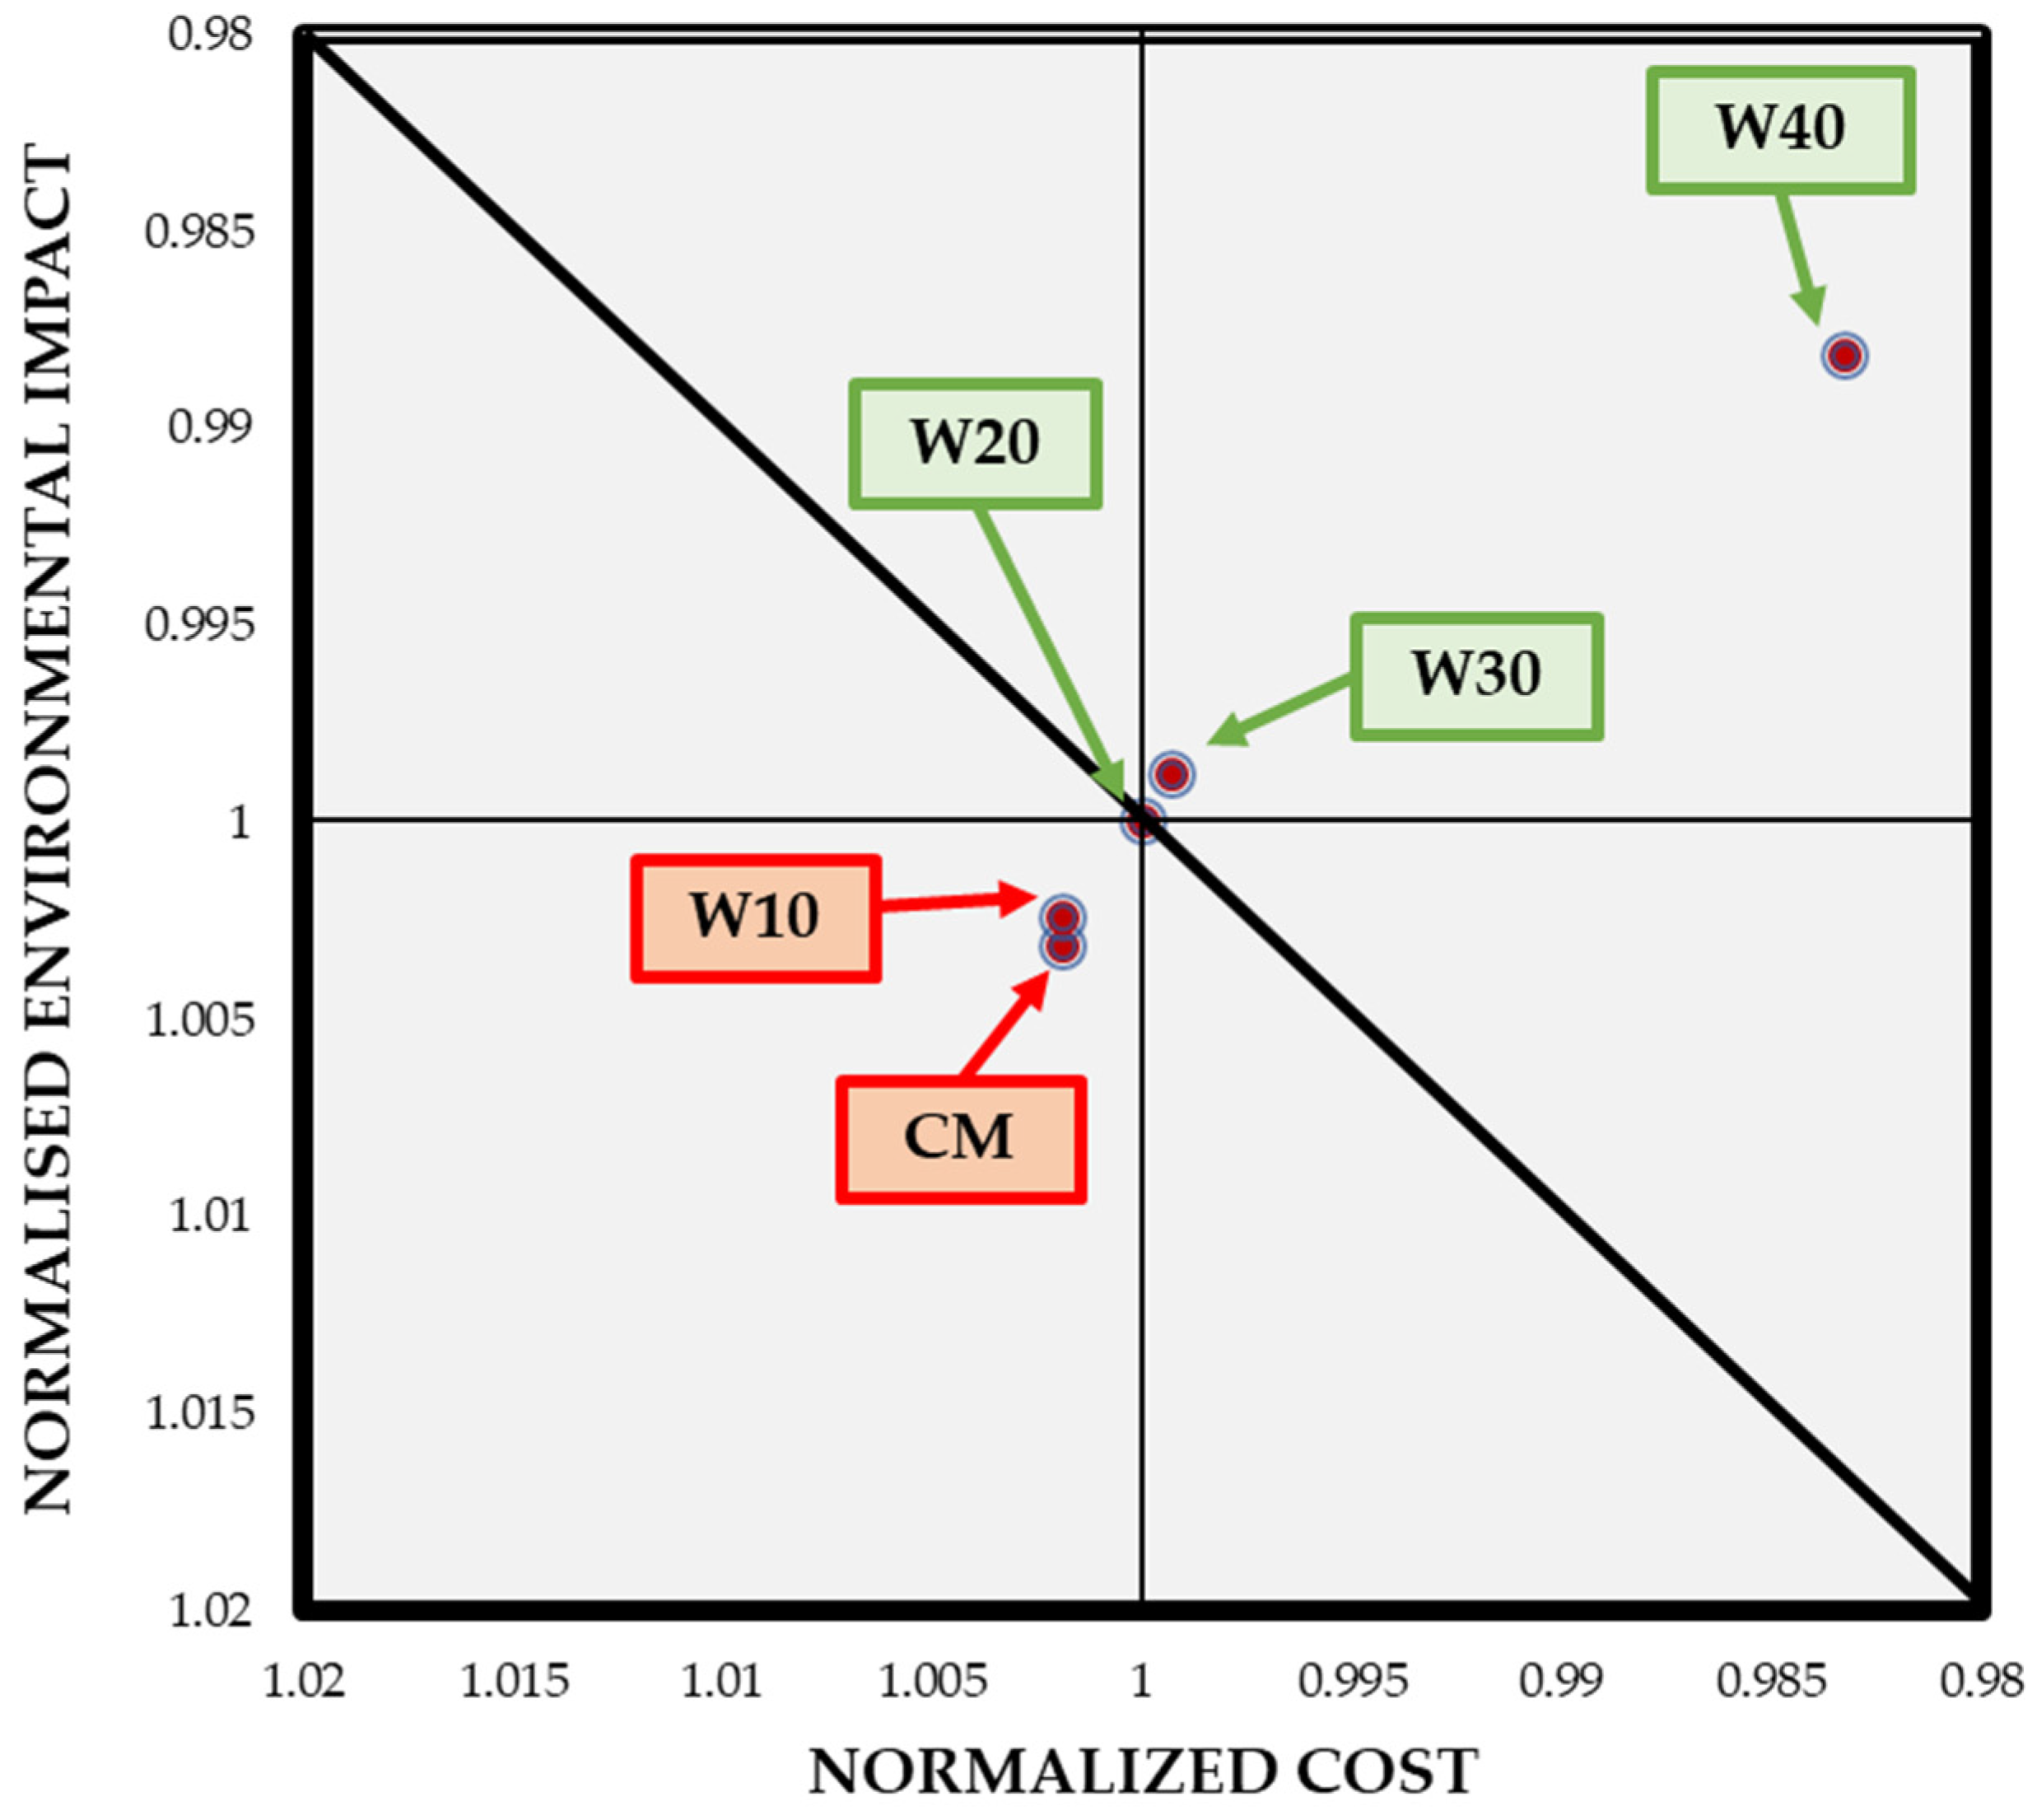
Eventually, the geopolymer mixes enriched with WCBP—namely W40, W30, and W20—were recognized as technologically and economically efficient (techno-eco-efficient). This designation is attributed to their favorable combination of higher compressive strength and lower costs. On the contrary, both the CM and W10 mixes were not considered eco-efficient due to their lower compressive strength and higher associated costs. This conclusion underscores the importance of both mechanical performance and economic considerations in determining the overall efficiency of geopolymer mixes. Future studies should integrate solutions to treat the hotspots to further enhance the techno-eco-efficiency of geopolymer mixes.
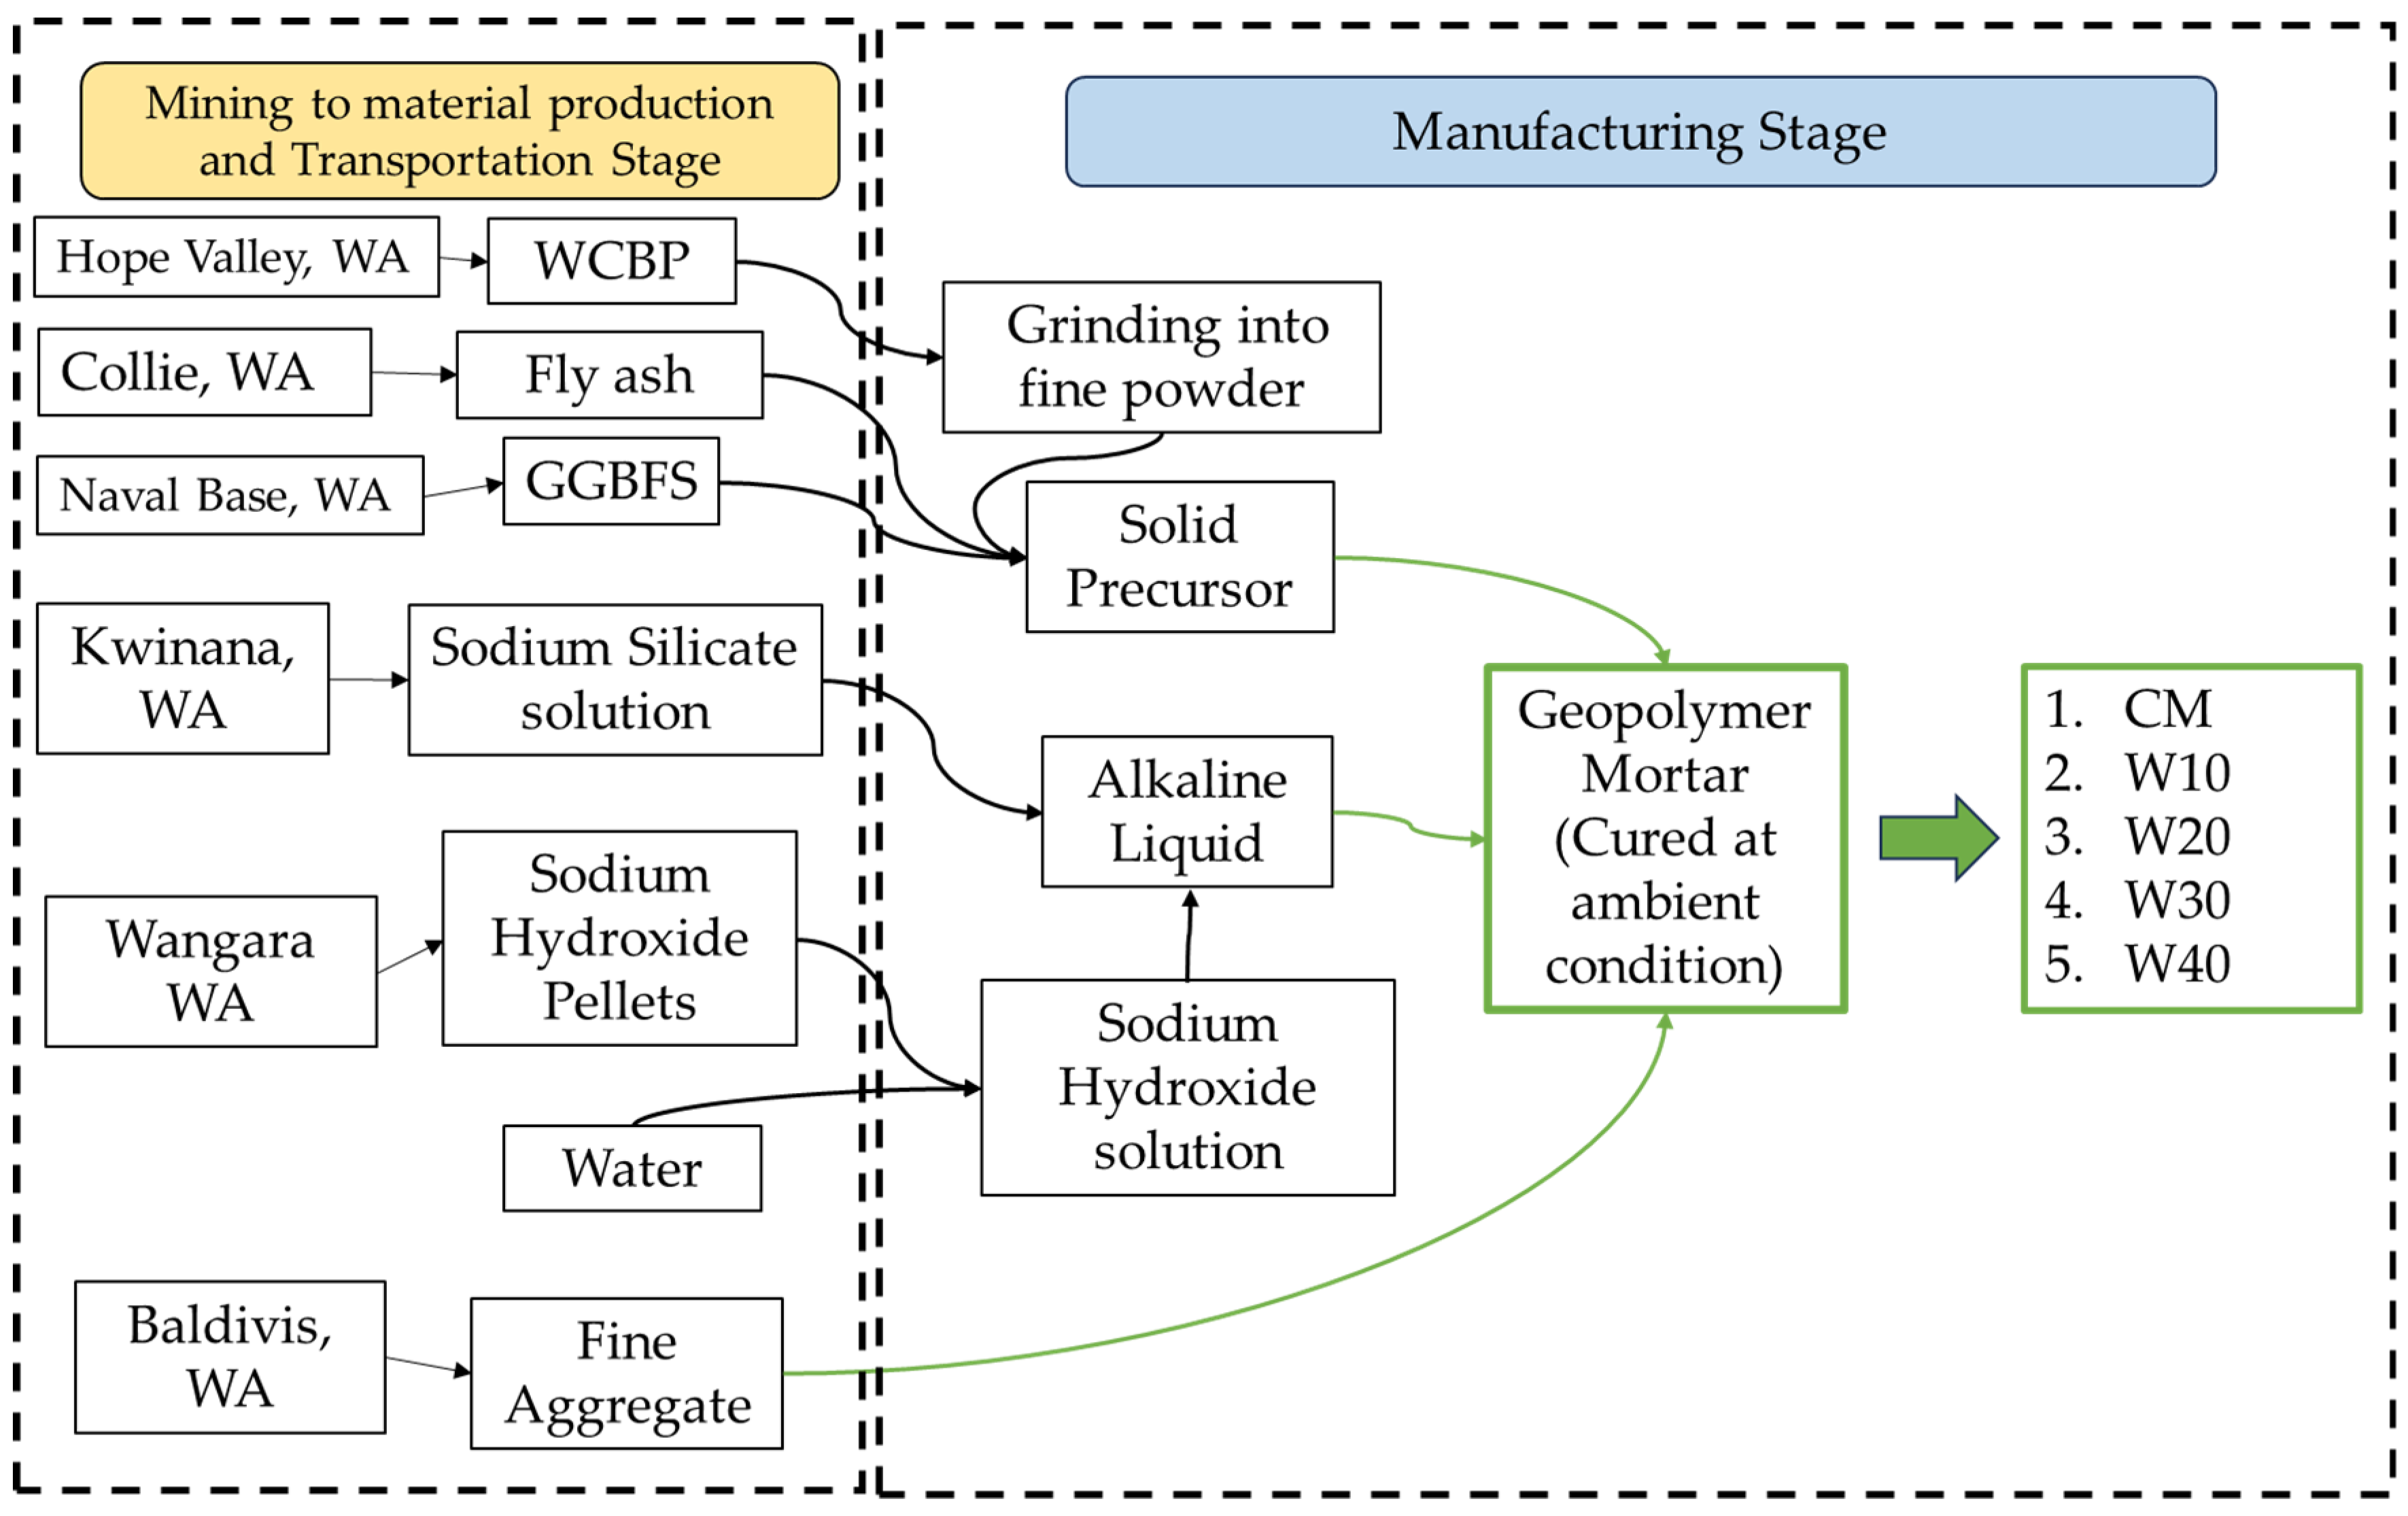
Figure 1.
System boundary for conducting the LCA of 1 cubic meter geopolymer mortar.
Figure 1.
System boundary for conducting the LCA of 1 cubic meter geopolymer mortar.
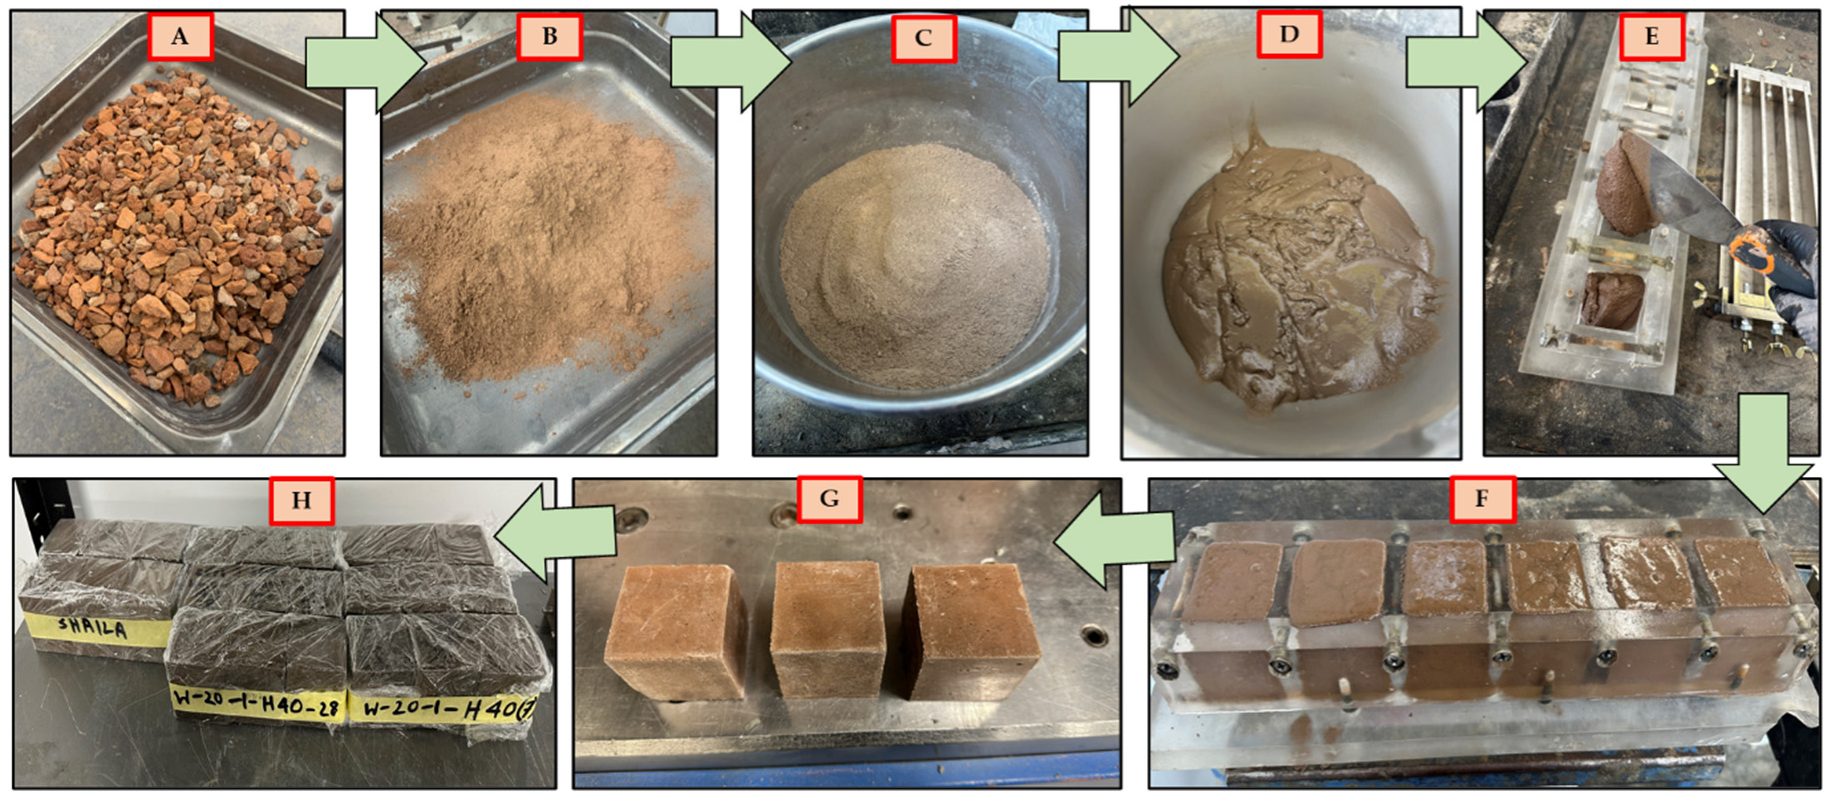
Figure 2.
Manufacturing and curing process of WCBP-based geopolymer mortar (W40) (A-Brick aggregate, B-WCBP, C-Dry mixing, D-Geopolymer mortar mix, E- pouring the mortar mix into mold, F – After finishing casting, G- 50mm cube mortar sample after demolding, H- Curing).
Figure 2.
Manufacturing and curing process of WCBP-based geopolymer mortar (W40) (A-Brick aggregate, B-WCBP, C-Dry mixing, D-Geopolymer mortar mix, E- pouring the mortar mix into mold, F – After finishing casting, G- 50mm cube mortar sample after demolding, H- Curing).
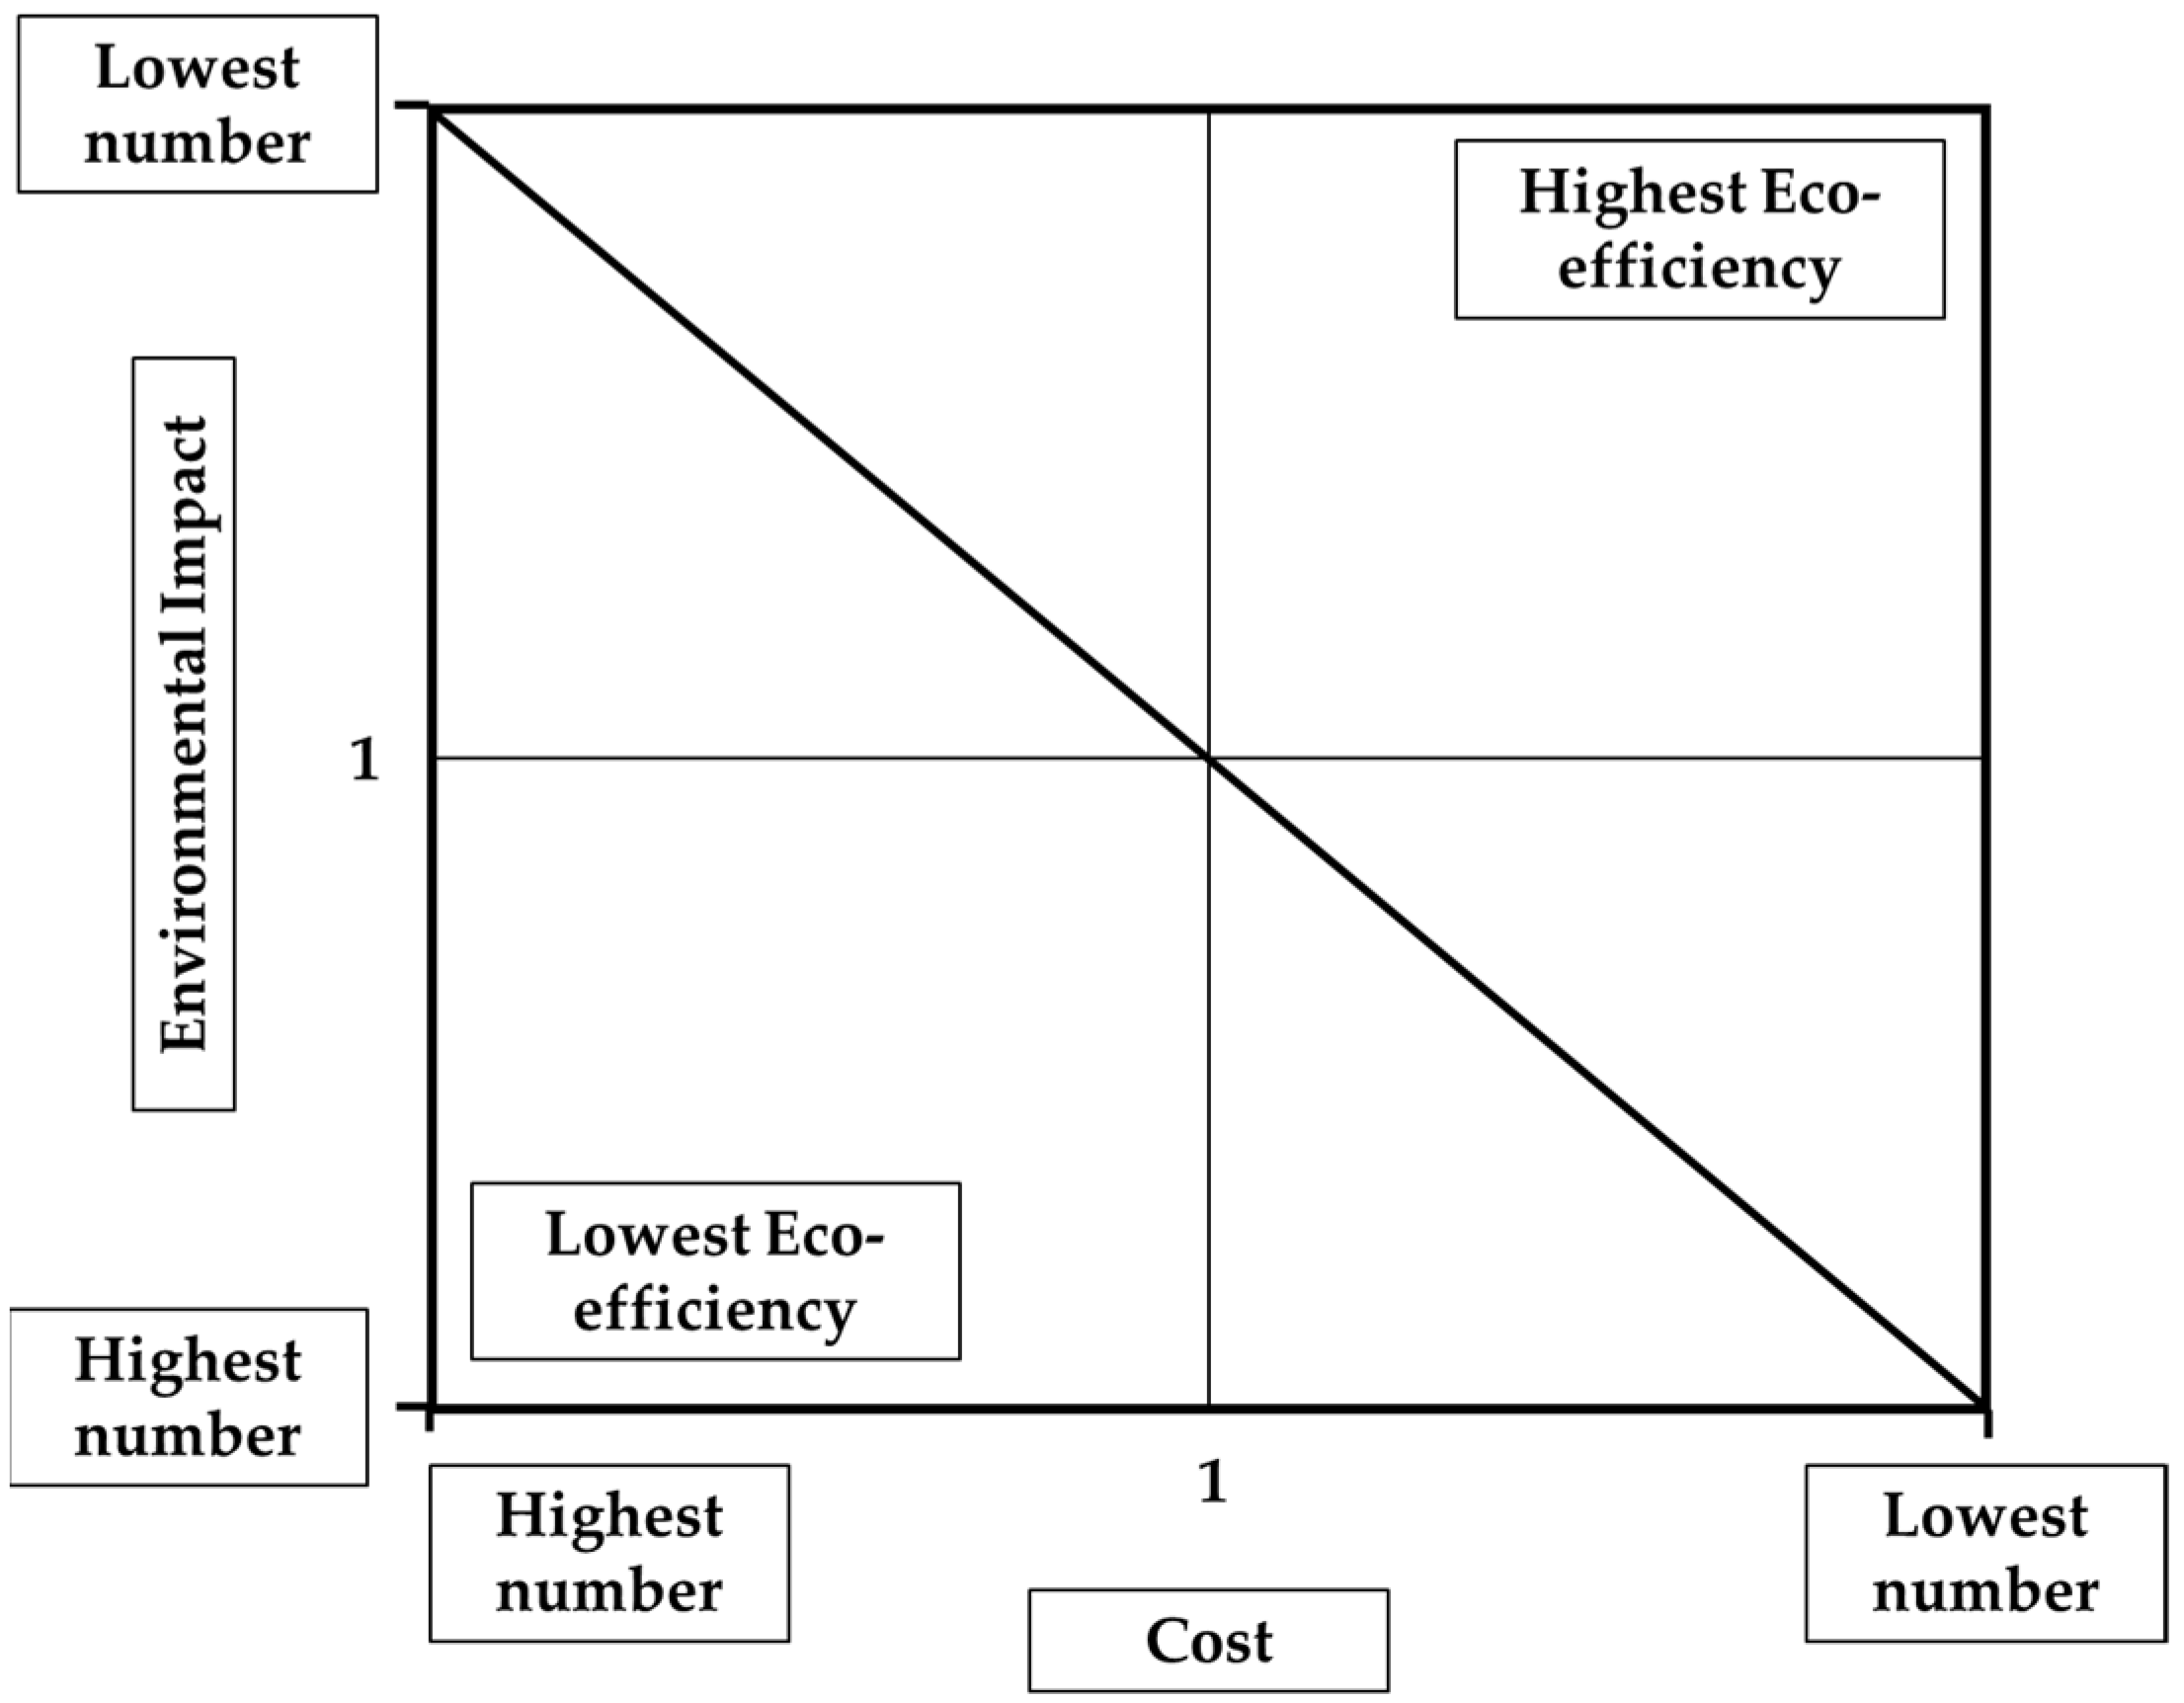
Figure 3.
Eco-efficiency portfolio developed by Kicherer et al. [
33].
Figure 3.
Eco-efficiency portfolio developed by Kicherer et al. [
33].
Figure 4.
Environmental impacts per inhabitant equivalent of geopolymer mortar mixes.
Figure 4.
Environmental impacts per inhabitant equivalent of geopolymer mortar mixes.
Figure 5.
Hotspot analysis of geopolymer mortar mixes (CM and W40 – left to right).
Figure 5.
Hotspot analysis of geopolymer mortar mixes (CM and W40 – left to right).
Figure 6.
Monte Carlo simulation for human toxicity for CM.
Figure 6.
Monte Carlo simulation for human toxicity for CM.
Figure 7.
Monte Carlo simulation for human toxicity for W40 mix.
Figure 7.
Monte Carlo simulation for human toxicity for W40 mix.
Figure 8.
Breakdown of LCC analysis of CM geopolymer mix.
Figure 8.
Breakdown of LCC analysis of CM geopolymer mix.
Figure 9.
Breakdown of LCC analysis of W40 geopolymer mix.
Figure 9.
Breakdown of LCC analysis of W40 geopolymer mix.
Figure 10.
Techno eco-efficiency portfolio for geopolymer mixes.
Figure 10.
Techno eco-efficiency portfolio for geopolymer mixes.
Table 1.
Life cycle inventory of geopolymer mortar samples.
Table 1.
Life cycle inventory of geopolymer mortar samples.
| Ingredients |
Source Address |
Distance (Km) |
| GGBFS |
BGC CEMENT, Address 32 Beard St, Naval Base, WA, 6155, AUSTRALIA |
33 |
| Fly ash |
Collie, WA |
152 |
| WCBP |
192 Hope Valley Rd, Hope Valley, WA 6165 |
31 |
| Sand |
Baldivis sand quarry, WA |
55 |
| Sodium hydroxide pellets |
Coogee Chemicals Pty Ltd, KWINANA BEACH WA 6167 |
36 |
| Sodium silicate solution |
11 Challenge Boulevard Wangara WA 6065 Australia |
35 |
| Constituents |
Mortar Mixes
|
| CM |
W10 |
W20 |
W30 |
W40 |
| Fly ash (kg/m3) |
673 |
596 |
518 |
440 |
361 |
| GGBFS (kg/m3) |
119 |
119 |
119 |
119 |
119 |
| WCBP (kg/m3) |
0 |
80 |
160 |
240 |
321 |
| Fine aggregate - sand (Kg/m3) |
1268 |
1271 |
1275 |
1279 |
1282 |
| Sodium hydroxide pellets (Kg/m3) |
57 |
57 |
57 |
57 |
57 |
| Sodium silicate solution (Kg/m3) |
238 |
238 |
238 |
238 |
238 |
| Total kg/m3
|
2355 |
2361 |
2367 |
2373 |
2378 |
| Transportation (t-km) |
187.35 |
148.66 |
121.98 |
106.99 |
100.79 |
| Manufacturing (kWh) |
10 |
10.03 |
10.06 |
10.08 |
10.11 |
Table 2.
Impact category to evaluate environmental impact.
Table 2.
Impact category to evaluate environmental impact.
| Impact Assessment Method |
Impact category |
Unit |
| Australian indicator set V2.01 / Australian per capita |
Global warming |
kg CO2
|
| Eutrophication |
kg PO43- eq |
| Land use |
Ha a |
| Water use |
M3 H2O |
| ReCiPe Midpoint (E) V1.12 / Europe Recipe E |
Ozone depletion |
kg CFC-11 eq |
| Terrestrial acidification |
kg SO2 eq |
| Human toxicity |
kg 1,4-DB eq |
| Photochemical oxidant formation |
kg NMVOC |
| Terrestrial ecotoxicity |
kg 1,4-DB eq |
| Freshwater ecotoxicity |
kg 1,4-DB eq |
| Marine ecotoxicity |
kg 1,4-DB eq |
| Ionising radiation |
kBq U235 eq |
| CML-IA baseline V3.03 / EU25 |
Abiotic depletion |
kg Sb eq |
| TRACI 2.1 V1.03 / Canada 2005 |
Respiratory effects |
kg PM2.5 eq |
Table 3.
Prices of raw materials.
Table 3.
Prices of raw materials.
| Raw materials |
Cost (AUD) per ton material |
| FA |
135 |
| GGBFS |
300 |
| WCBP |
55 |
| Sand |
31.3 |
| SS |
834 |
| SH |
800 |
Table 4.
Total cost of 1 m3 geopolymer mortar sample.
Table 4.
Total cost of 1 m3 geopolymer mortar sample.
| Geopolymer mortar mix |
Material price (AUD) |
Life Cycle Cost (AUD) |
| CMA |
408 |
426 |
| W10A |
403 |
417 |
| W20A |
397 |
409 |
| W30A |
392 |
402 |
| W40A |
386 |
396 |
Table 5.
The gross domestic environmental impact and weighting factor for environmental impact.
Table 5.
The gross domestic environmental impact and weighting factor for environmental impact.
| Impact category |
GDEI per Inh |
WF |
| Global Warming |
28,690 |
20% |
| Eutrophication |
19 |
3% |
| Land use |
26 |
21% |
| Water Use |
930 |
6% |
| Ozone depletion |
0.002 |
3% |
| Terrestrial acidification |
123 |
7% |
| Human toxicity |
3,216 |
8% |
| Photochemical oxidant formation |
75 |
10% |
| Terrestrial ecotoxicity |
88 |
4% |
| Freshwater ecotoxicity |
172 |
3% |
| Marine ecotoxicity |
12,117,106 |
3% |
| Ionising radiation |
1,306 |
2% |
| Abiotic depletion |
300 |
3% |
| Respiratory effects |
45 |
8% |
Table 6.
Monte-Carlo simulation outcome of LCA for three major impact categories in ambient cured geopolymer mixes.
Table 6.
Monte-Carlo simulation outcome of LCA for three major impact categories in ambient cured geopolymer mixes.
| Geopolymer mix |
Impact category |
Unit |
Mean |
CV (%) |
| CM |
IPCC GWP 100a |
kg CO2 eq |
635.27 |
0.89 |
| CM |
Human toxicity |
kg 1,4-DB eq |
8951.7 |
1.85 |
| W10 |
IPCC GWP 100a |
kg CO2 eq |
643.52 |
0.82 |
| W10 |
Human toxicity |
kg 1,4-DB eq |
8979.66 |
1.75 |
| W20 |
IPCC GWP 100a |
kg CO2 eq |
653.12 |
0.83 |
| W20 |
Human toxicity |
kg 1,4-DB eq |
9010.23 |
1.69 |
| W30 |
IPCC GWP 100a |
kg CO2 eq |
664.2 |
0.84 |
| W30 |
Human toxicity |
kg 1,4-DB eq |
9048.77 |
1.71 |
| W40 |
IPCC GWP 100a |
kg CO2 eq |
675.5 |
0.84 |
| W40 |
Human toxicity |
kg 1,4-DB eq |
9091.85 |
1.67 |
Table 7.
Compressive strength of geopolymer mortar mix [
26].
Table 7.
Compressive strength of geopolymer mortar mix [
26].
| Geopolymer mix |
28 days compressive strength (MPa) |
| CM |
72.38 |
| W10 |
72.73 |
| W20 |
78.86 |
| W30 |
81.41 |
| W40 |
91.87 |
Table 8.
Techno-eco-efficiency outcome of 1 m3 geopolymer mixes.
Table 8.
Techno-eco-efficiency outcome of 1 m3 geopolymer mixes.
| Geopolymer mix |
EI/MPa |
Costs ($)/MPa |
PP’e,g |
PP’c,g |
| CM |
0.0032 |
5.89 |
1.0019 |
1.0031 |
| W10 |
0.0032 |
5.74 |
1.0019 |
1.0024 |
| W20 |
0.0029 |
5.19 |
0.9999 |
0.9999 |
| W30 |
0.0029 |
4.95 |
0.9993 |
0.9988 |
| W40 |
0.0025 |
4.32 |
0.9832 |
0.9881 |
