Preprint
Article

Influence of Edible Potato Production Technologies With the Use of Soil Conditioner on the Nutritional Value of Tubers

Altmetrics

Downloads

83

Views

27

Comments

0

A peer-reviewed article of this preprint also exists.

Submitted:

25 January 2024

Posted:

26 January 2024

You are already at the latest version

Alerts
Abstract
The aim of the study was to determine the effect of the application of different organic matter, UGmax soil conditioner and simplifications in potato cultivation on the content of dry matter, starch, sugars in tubers of the medium-early edible cultivar 'Satina' after harvest and after long-term storage. The highest dry matter (173.4 g kg-1) and starch (124.6 g kg-1 f. m.) content was ob-tained with the simultaneous application of a manure with soil conditioner at 100% mineral fer-tilization. In the case of sugars, the withdrawal of the soil conditioner from the crop proved most beneficial, for total sugars on the stubble intercrop (5.06 g kg-1 f. m.) and for reducing sug-ars (1.99 g kg-1 f. m.) on the straw. Each protection reduction applied resulted in a significant re-duction in starch content. In this regard, the withdrawal of herbicides with simultaneous appli-cation of manure and UGmax proved most beneficial. Long-term storage of tubers caused a sig-nificant reduction in their quality in terms of dry matter and starch content (average by -3.6 and -2.3%, respectively) and an increase in total and reducing sugars (average by 11.8 and 9.6%, re-spectively). The decrease in dry matter and starch content was significantly influenced by the 50% reduction in NPK fertilization applied during the growing season, while the application of soil conditioner with full protection contributed to the increase in reducing sugars after storage at 28.9 pts%. Our research is in line with current trends of used potato cultivation technologies focused mainly on environmental protection, so the results of this study can provide a basis for validation for researchers currently engaged in such evaluation.
Keywords: 
Subject: Environmental and Earth Sciences  -   Environmental Science

1. Introduction

Along with wheat, corn and rice, the potato is the world's most important food security crop [1,2]. Its good market position is due to the high nutritional value of its tubers, its high consumption, its suitability for processing and its membership in the group of durable, storable vegetables [3,4,5,6].
In recent years, the strongest factors influencing food choices have been taste, healthiness and price [7,8]. Today, however, environmental considerations are also important determinants of food choices, especially for certain groups of consumers [8,9,10]. Consequently, there is great interest in producing food by methods with minimal negative impact on the environment. This can be achieved by introducing controlled production systems including organic farming. According to consumers, organic products are healthier, tastier and safer for the environment compared to those produced by conventional agriculture [11,12]. Environmental and consumer protection prompts the search for new opportunities through simplifications in crop production or the use of various agents such as immune stimulants, bacterial vaccines, algae extracts and effective preparations containing microorganisms [10,13,14,15,16]. Such substances include the soil conditioner UGmax, which, thanks to the microorganisms and elements contained in its composition, has the effect of processing, composting and mummifying natural and organic fertilizers to create humus [17,18,19].
The production of edible potatoes should be based on natural fertilizers (manure, slurry), organic fertilizers (straw), or the use of catch crops, as well as balanced mineral fertilization [20,21,22]. Natural and organic fertilizers improve the condition of the soil and increase the use and efficiency of mineral fertilizers as a result of which the quality of the crop increases in terms of nutritional value, health-promoting value and safety [23,24]. In addition, due to the large number of weeds and pathogens present, the potato is a difficult crop to cultivate. An important aspect in potato cultivation is therefore the use of chemical protection during its growth.
For many years, researchers' efforts on potato production have focused on increasing yields while overlooking the improvement of tuber quality in terms of nutritional value [13]. For this reason, solutions are being sought to eliminate at least some of the crop protection products [25,26,27,28]. Proper selection and correct use of chemicals reduces the negative effects of simplifications introduced in potato cultivation [29,30,31,32].
Current challenges facing the potato industry include measures to preserve the quality of tubers during storage, ensuring their marketability and high nutritional value. It should be remembered that the appearance of tubers is the main factor that induces consumers to purchase fresh potatoes. Achieving these goals requires monitoring not only the impact of storage factors (temperature, humidity, storage time), but also the agrotechnical factors used during potato cultivation [33,34].
Taking into account the aforementioned aspects, a study was conducted to determine the effect of reduction in mineral fertilization, use of diversified organic material, partial elimination of crop protection products and application of soil conditioner on the quality characteristics of tubers after harvest and after storage.

2. Materials and Methods

2.1. Material and field experiment

The material for the study was a medium-early potato variety (Solanum tuberosum L.) 'Satina N'. Three-factor field experiments carried out in 2009/2010, 2010/2011, 2011/2012 were established at the Faculty Research Station of Agriculture and Biotechnology of the Bydgoszcz University of Science and Technology in Mochełek (53°13′ N, 17°51′ E). The experiments were located on a flat soil made of till classified as good rye complex, class IV b in 3 replications. The experiment was carried out in plots of 35 m2 with a row spacing of 0.75 × 0.35 m. The forecrop was cereals.
Two parallel experiments were conducted according to the schemes:
Experiment I:
Factor A - organic matter application (manure, straw, stubble intercrop, no additional matter - control, factor B - NPK fertilization (100% and 50%), factor C - soil conditioner application (UGmax application, no UGmax application - control)
Experiment II
Factor A - chemical protection (full protection, no herbicides, no fungicides, no insecticides), factor B - organic matter application (manure, straw, stubble intercrop, no additional matter - control), factor C - soil conditioner application (UGmax application, no UGmax application - control)

2.2. Treatment details

Application of NPK mineral fertilizers was carried out in the spring before planting potatoes at doses of: 100 kg N ha-1 (ammonium nitrate - 34%), 100 kg P2O5 ha-1 (triple superphosphate - 46%), 150 kg K2O ha-1 (potassium sulfate - 50%). The soil fertilizer UGmax was applied at three doses: in autumn at the rate of 0.6 L ha-1, in spring at the rate of 0.3 L ha-1 and foliarly during vegetation at the rate of 0.3 L ha-1. The UGmax fertilizer includes lactic acid bacteria, photosynthetic bacteria, Azotobacter, Pseudomonas and radicles, as well as elements: potassium (3500 mg L-1), nitrogen (1200 mg L-1), sulfur (100 mg L-1), phosphorus (500 mg L-1), sodium (200 mg L-1), magnesium (100 mg L-1), zinc (20 mg L-1), manganese (0.3 mg L-1). During cultivation, the following were applied: herbicide - Afalon 50WP (2 L ha-1), fungicides - Helm-cymi (2 kg ha-1) and Ridomil (2 L ha-1), and insecticide - Nurelle D 550 EC (0.6 L ha-1).
Potatoes were harvested at full maturity. Tuber samples were taken from each experimental site for analytical tests immediately after harvest (10 kg) and for long-term storage (10 kg). Potatoes were stored in chambers (Thermolux Chłodnictwo Klimatyzacja, Raszyn, Poland) with controlled atmosphere for 6 months (October-March). A constant temperature of +4 ℃ and a relative humidity of 95% recommended for edible potato were maintained throughout the storage period.

2.3. Potato tuber quality characteristics

2.3.1. Procedure for dry matter determination

The dry matter content of potato tubers was determined according to AACC international methods [35]. The tubers were washed, dried, diced and homogenized in a Retsch 169 ZM 100 Ultra-Centrifuge laboratory blender (Retsch, Haan, Germany) until a homogeneous pulp was obtained. 10 g of pulp was weighed into a Petri dish and then dried using a dryer (WAMED, model SUP-100, Warsaw, Poland) at 60 °C for 24 h. The temperature in the dryer was then raised to 105 °C and dried for another 3 h. After the drying process was completed, the samples were cooled in desiccators to room temperature and weighed. The total dry matter content of the potato tubers was calculated from the weight difference and expressed in g kg-1.
Calculation:
DM = SWA SWB × 1000
DM – dry matter content (g kg-1)
SWB – sample weight before drying (g)
SWA – sample weight after drying (g)

2.3.2. Procedure for starch determination

Starch was determined according to ICC Standard No. 123 [36]. A 10 g of crushed potato tubers were weighed into an Erlenmayer flask. Then 50 mL of 1.124% HCl solution (Chempur, Piekary Śląskie, Poland) was added to the flask. The whole mixture was heated in a water bath for 25 minutes to hydrolyze the starch. After heating, the samples were cooled to room temperature. The suspension was then transferred to a 100 mL volumetric flask and 1.5 mL of 14.4% ammonium molybdate solution (Roth, Karlsruhe, Germany) was added. The flask was made up with distilled water, stirred and then the suspension was filtered with filter paper No. 593 1/2 (Schleicher & Schuell, Taufkirchen, Germany). The filtrate was placed in a polarimeter (Krüss, type P 1000, Hamburg, Germany) and the optical rotation of the solution was determined. Starch content was expressed in g kg-1 f. m. The starch content of potato tubers was then calculated according to Biot's formula, assuming that the specific rotation of starch dissolved in HCl is 183.7°.
Calculation:
SC = 513   ×   α   L   ×   a
SC – starch content (g kg-1 f. m.)
a – weight of analysed material (g)
L – length of polarimeter tube (dm)
α – measured rotation in degrees

2.3.3. Procedure for total sugars and reducing sugars determination

The content of total and reducing sugars was measured using a spectrophotometric method [37]. A 10 g homogeneous sample of shredded potato was placed in a 250 mL volumetric flask and distilled water was added. The entire sample was shaken for 60 minutes, and then strained through Whatman filter paper (International Limited, Kent, UK). For the determination of reducing sugars, 1 mL of the filtrate was transferred to a tube and 3 mL of DNP (Sigma Aldrich, St. Louis, MO, USA) was added. The whole tube was shaken on a vortex (Grand-bio, Shepreth Cambridgeshire, England) and then heated for 6 minutes in a boiling water bath. Absorption was then measured at 600 nm in 1×1 cm thick cuvettes using a SHIMADZU UV-1800 spectrophotometer (Nishinokyo Kuwabara-cho, Nakagyo-ku, Kyoto, Japan).
The content of total sugars was determined by measuring 40 mL of the filtrate into an Erlenmeyer flask and acidified with a concentrated HCl solution (Chempur, Piekary Śląskie, Poland). The content of the flask was heated in a boiling water bath for 30 min. After cooling, the flask content was neutralized with concentrated NaOH solution (POCH S.A., Gliwice, Poland). For the determination of total sugars, 1 mL of the neutralized solution was taken and further followed the procedure for the determination of reducing sugars. The results were given in g kg-1 f. m. using the standard curve for glucose solution.

2.3.4. Statistical Analysis

The results were analyzed using Statistica 13.1 software (StatSoft, Tulsa, OK, USA). Values were presented as means with standard deviations. Data were checked for normality of distribution by the Shapiro-Wilk test and homogeneity of variance. The mean values obtained in each group were then subjected to a multivariate analysis of variance ANOVA, at a significance level of 0.05 using Tukey's method. Spearman's rank correlation coefficients were determined at α = 0.05 to determine the relationship between the qualitative characteristics studied.

3. Results and Discussion

3.1. Dry matter

The post-harvest dry matter content in tubers of the tested Satina variety, regardless of factors, averaged 152.0 and 146.9 g kg-1 for Experiment I and Experiment II, respectively (Table 1 and Table 2). The varying dry matter content of tubers of edible varieties is reported by Koch et al. [38], Mystkowska [39] and Naeem and Caliskan [40], among others. According to the authors, the dry matter content of tubers depending on the variety and the cultivation technology and can vary within very large limits from 183 g kg-1 in the study of Mystkowska [39] to 350 g kg-1 in the study of Naeem and Caliskan [40]. In our study, the application of organic matter had a significant effect on the change in dry matter content (Table 1 and Table 2).
The highest dry matter content of 154.2 and 151.7 g kg-1 was obtained after the application of manure and the lowest of 150.0 and 143.4 g kg-1 on the control object (for Experiment I and II, respectively) (Table 1 and Table 2). The positive effect of natural fertilization in the cultivation of edible potato especially in the context of dry matter content has been reported by many researchers [5,41,42]. The authors indicate that the increase in dry matter content after the application of natural fertilizers is the result of a better supply of nutrients to plants and the gradual availability of nutrients during the growing season. This is closely related to the type and rate of application of these fertilizers. In addition, it was observed that reducing mineral fertilization to 50% resulted in a significant decrease in dry matter content by 7.1% (Table 1). Manolov et al. [43] and Bărăscu et al. [44] report that regardless of variety for dry matter content, the most important thing is to maintain the ratio of fertilizer application rates (N:P:K). Any change in the N:P:K proportion results in a reduction in dry matter content [45,46,47,48]. However, it is important to remember that a key component of potato production systems is nitrogen management [45,49]. Kazimierczak et al. [5] and Lombardo et al. [25], report that the use of excessively high doses of nitrogen fertilization in conventional agriculture affects excessive vegetative growth of plants which leads to a decrease in the dry matter content of agricultural crops. The negative effect of high doses of nitrogen fertilization on the dry matter content of potato tubers is also reported by Bombik et al. [50] and Milroy et al. [51].
In addition, it was observed that the dry matter content was determined by the interaction of the tested organic material and mineral fertilization. In Experiment I at 100% mineral fertilization rate, a significant increase in dry matter content compared to the control was obtained after the application of manure (9.5%) and stubble intercrop (4.5%). On the other hand, when the NPK rate was reduced to 50%, a significant decrease in dry matter content was obtained only after the application of manure (4.1%) (Table 1).
After inoculation of soil and plants with soil conditioner, regardless of the factors studied, a significant increase in dry matter content was found, on average by 4.3 and 1.4% for Experiment I and II, respectively, compared to facilities where UGmax was not applied (Table 1 and Table 2). The use of a soil conditioner in potato production reduces tuber infestation by pathogens, which contributes to improving the quality of the tubers in terms of nutrients [52,53,54].
There was also a positive interaction between the soil conditioner and organic matter and a statistically significant increase in dry matter was obtained only with manure (8.5%) in Experiment I (Table 1). On the other hand, in Experiment II after the application of stubble intercrop in the form of peas and manure (Table 2). Simultaneous application of UGmax and mineral fertilization caused an increase in the dry matter content of potato tubers, while a significant increase was obtained on 100% NPK fertilization (in Experiment I) (Table 1).
There was a statistically significant effect on dry matter content, of the protection applied regardless of the other experimental factors (Table 2). The application of protection devoid of fungicides and insecticides caused the greatest decrease in dry matter content by an average of 12.9 and 11.1%, respectively (Table 2). This is confirmed by the study of Zarzecka et al. [55], who proved that although there was no significant effect of insecticides on dry matter content, there was a tendency for this component to decrease under their influence compared to the control object. Other results were obtained in the study by Sayuk et al. [56], who proved that in the variants with fungicide application there is an increase in the dry matter content of tubers by 0.1-0.6%.
Taking into account the interaction of all experimental factors, the highest dry matter content was characterized by potatoes grown on manure and soil conditioner. It was noted that in Experiment I the increase in dry matter was most favorable after the application of 100% NPK and in Experiment II with full protection (Table 1 and Table 2). Obtaining such an effect may have been due to a faster release of compounds and an increase in plant resistance to disease under the influence of microorganisms contained in UGmax [17,18,19].

3.2. Starch

The most important component of dry matter is starch [57,58,59,60], as evidenced by the significantly positive correlation coefficients between dry matter and starch in Experiments I and II, equal to r = 0.509 and 0.716 (p≥0.05), respectively (Table 3). In the studies conducted, the starch content averaged from 100.6 g kg-1 f. m. for Experiment II to 104.0 g kg-1 f. m. for Experiment I (Table 1 and Table 2). Many authors point to the influence of variety, agrotechnical and storage conditions on the content of this component, the value of which varies between 11-21% [39,61,62,63,64,65,66]. However, it should be remembered that with proper agrotechnology, varieties with lower starch content can yield starch at a comparable or higher level than lower-yielding varieties, but with higher starch content [67,68].
Each of the applied factors in the experiments had a significant effect on the starch content of the tubers of the tested cultivar Satina (Experiments I and II) (Table 1 and Table 2). The application of organic material generally had a significant effect on the increase in starch content compared to the control. Only in Experiment II was there no significant effect of applied straw on the content of this parameter. Murawska et al. [69], Koireng et al. [70] and Demidenko et al. [60] showed that potato tubers grown on manure had the highest starch content, as in our experiments. In the study of Murawska et al. [69], the average starch content was higher by an average of 3.8%, while in our study an increase of as much as 14.1% was observed (Table 1 and Table 2).
In the study conducted, reducing the NPK fertilization rate by 50% resulted in a significant decrease of 4.4% in the starch content of potato tubers. The decrease in starch content was almost twice that of dry matter. This is due to the fact that most potato traits are genetically determined and subject to high phenotypic variability [71].
El-Zehery [72] reports that limitations on mineral fertilization in potato cultivation should be implemented with the simultaneous application of organic fertilization, which is consistent with the results of our study (Table 1 and Table 2). The starch content of the tubers of the tested Satina variety was the highest on both 100 and 50% NPK fertilization with manure (Table 1). It was noted that the starch content on the objects where 50% mineral fertilization and manure were applied was higher compared to the object where 100% NPK fertilization was applied. El-Zehery [72] obtained the highest quality of potato tubers in terms of starch after applying organic and biological fertilization with reduced levels of mineral fertilization by 25%. Thus, reducing the dose of mineral fertilization supplemented with organic matter has an effect on limiting the reduction of starch content [72,73].
As for dry matter content, the application of UGmax resulted in an increase in starch content in potato tubers. This is due to the fact that starch content in potato tubers is closely correlated with starch content (r = 0.51, r = 0.72, p≤0.05 for Experiment I and II, respectively) (Table 3). However, it was noted that the increase was significantly higher for starch, with 12.6 and 5.8% for Experiment I and II, respectively (Table 1 and Table 2). El Zehery [72] using biofertilizer obtained an increase in starch content equal to 14.6%, comparable to our study. The positive effect of using biostimulants on the starch content of potato tubers has been reported by many authors [10,39,74]. Such an effect is due to the microorganisms contained in the soil conditioner [52,53,54]. On the other hand, a study by Maciejewski et al. [75] showed no effect of biostimulant application on the starch content of potatoes, which may be due to the application of biostimulants only in foliar form.
The application of the fertilizer UGmax in Experiment I resulted in a significant increase in starch content on average from 12.2% for the object with stubble intercrop to 15.9% for the object with manure in Experiment I (Table 1), and from 1.1% after the withdrawal of fungicides to 7.3% after the withdrawal of herbicides in Experiment II (Table 2). This is due to an increase in plant resistance to diseases and pathogens under the application of biostimulants [76,77].
Each protection reduction applied resulted in a significant reduction in starch content compared to the control, which was 3.4, 13.8 and 7.0% after the withdrawal of herbicides, fungicides and insecticides, respectively (Table 2). The withdrawal of certain herbicide and fungicide protective treatments in potato cultivation leads to a decrease in the nutritional value of potato tubers. Withdrawal of fungicides increases the risk of plant infection with dangerous pathogens [78]. On the other hand, the withdrawal of herbicides leads to excessive weed infestation of the crop and an increase in the proportion of fine tubers in the yield and, consequently, a decrease in starch content [79,80].
In our study, significantly the highest starch content of 112.7 g kg-1 f. m. was obtained after simultaneous application of a soil conditioner and full protection (Experiment II) (Table 2). Zarzecka et al. [59] showed that the highest starch yield compared to the control object was obtained after application of the biostimulant together with plant protection in the form of herbicide. Baranowska [74] also obtained a 16.3% increase in starch content with the simultaneous application of a biostimulant and herbicides. Kaliyeva et al. [81] report that the starch content of tubers is also affected by the use of insecticides in potato cultivation. The authors report that the starch content of potato tubers in the control variant ranged from 10.1 to 10.3%, while in the variant with insecticide protection the content ranged from 15.0 to 16.4%. The resulting increase over the control ranged from 4.9 to 6.1% [81].

3.3. Total and reducing sugars

In the conducted studies, the content of total and reducing sugars was at the level of 4.62 and 1.52 g kg-1 f. m. for Experiment I and 4.97 and 2.15 g kg-1 f. m. for Experiment II, respectively (Table 4 and Table 5). For nutritional value, higher sugar contents in tubers are desirable, while specific standards are set for potatoes intended for processing [28,62,82].
In the studies conducted, organic matter had a significant effect on the content of total sugars and reducing sugars in Experiments I and II (Table 4 and Table 5). The highest content of total sugars was recorded for the control object, and the lowest for the object with manure (5.22 and 3.56 g kg-1 f. m. for Experiment I and 5.60 and 4.44 g kg-1 f. m. for Experiment II, respectively) (Table 4 and Table 5). Similar trends occurred for reducing sugars in Experiment II (Table 5). These contents were 2.38 and 1.79 g kg-1 f. m. for the control and manure objects, respectively (Table 5). A different relationship was observed for Experiment I, where the highest content of reducing sugars was found for the control object and the lowest for the object for which straw was used, 1.81 and 1.28 g kg-1 f. m., respectively.
In our study, reducing mineral fertilization to 50% resulted in a significant decrease in the content of reducing sugars only. The decrease in the content of reducing sugars was 0.54 g kg-1 f. m. (Table 4). As reported by Mona et al. [83], AbdEl-Nabi et al. [84] and Jatav et al. [85], the content of reducing sugars was significantly lower on sites where reduced mineral fertilization was applied. Similar results were obtained by El-Ghamriny and Saeed [86] for other plants. This may be due to a decrease in the intensity of polysaccharide hydrolysis processes, the conversion of organic acids into soluble sugars, and a decrease in the solubilization of insoluble starch under reduced mineral fertilization [47].
The application of UGmax had a significant effect on reducing the content of total and reducing sugars (Table 4 and Table 5). Thus, it is necessary to use a soil conditioner in the cultivation of potatoes for the production of refined products. The average decrease in total sugars for Experiment I and II was 13.4 and 6.7% and reducing sugars was 57.6 and 67.8%, respectively (Table 4 and Table 5). This is confirmed by the results obtained by Haider et al. [87]. On the other hand, in the studies by Maciejewski et al. [75], Zarzecka and Gugała [88] and Głosek-Sobieraj et al. [27], the results on the effect of biostimulants on the content of sugars in potato tubers are not so clear. Maciejewski et al. [75] after foliar application of biostimulants Asahi SL and Atonik Sl obtained both an increase and decrease in the content of reducing sugars in tubers of different varieties, but these differences were not statistically proven. Trawczynski [89] using one biostimulant found no significant effect of its action on the content of reducing sugars in potatoes during the years of the study. On the other hand, Zarzecka and Gugala [88] obtained a significant increase in the content of reducing sugars for the Gawin and Honorata varieties, while the authors found no effect of the tested biostimulants in the Bartek variety. Głosek-Sobieraj et al. [27] using four different biostimulants and five varieties obtained a decrease in the content of reducing sugars for two varieties. However, Karak et al. [90] using six different biostimulants observed an unambiguous increase in total and reducing sugars. It should be noted, however, that this study involved only one variety. The results discussed here indicate that the sugar content of potatoes is influenced by many factors: variety, environmental conditions, type of formulation, application rate and frequency of application [28]. Ezzat et al. [91] and Arafa and Hussien [92] indicate that the effect of soil conditioners also depends on the dose and type of mineral fertilization. In addition, foliar application of biostimulants affects plant metabolism and improves plant growth within the leaves, which increases the carbohydrate content of these organs. Due to transport, these compounds enter the tuber from where they are partially released into the rhizosphere. Thus, soil microorganisms release various organic substances and increase the availability of nutrients for potato tubers [91,93].
In our study in Experiment I, there was a significant interaction of organic matter and soil fertilizer on the content of reducing sugars (Table 4). In contrast, in Experiment II, the content of total sugars was significantly affected by the simultaneous application of chemical protection with soil fertilizer and organic matter with UGmax (Table 5). The highest content of reducing sugars was characterized by tubers from the object where organic matter and soil conditioner were not applied, and the lowest by tubers grown using manure with conditioner (Table 4). In addition, the highest total sugar content was characterized by tubers without the use of fungicides and fertilizer (Table 5). Starch, sucrose and simple sugars play an important role in the formation of potato tubers, and the mechanism of starch metabolism is the dominant pathway. Sucrose is the main form of carbohydrate transport and in potato tubers it is subject to degradation to reducing sugars, which are the substrate for starch metabolism [94]. This is confirmed by the negative significant correlation coefficients, obtained in our study, between starch content and total sugars and reducing sugars of r = - 0.569 and r = - 0.407 (’p ≤ 0.05) for Experiment I and r = - 0.587 r = - 0.449 (p ≤ 0.05) for Experiment II, respectively (Table 3).
The study found that, regardless of the pesticide withdrawn, there was generally a significant increase in total sugars and reducing sugars in tubers by an average of 7.3 and 26.4%, respectively, compared to the content obtained in tubers from a facility where full pesticide protection was applied (Table 5). The greatest increase in total sugars was obtained by withdrawing fungicides, and in reducing sugars by withdrawing insecticides (Table 5). Such results were caused by the stress induced by improper plant protection against pathogens. Kumar et al. [95] note that sugars content is influenced by abiotic factors. In addition, the authors state that each genotype requires proper cultivation technology, and stress, regardless of the type, increases sugar accumulation. On the other hand, Zarzecka et al. [96] and Baranowska and Mystkowska [97] report that the content of sugars in potato tubers depends on the type of pesticide used. Biotic stresses caused by improper chemical protection intensify the defense response of plants by producing a greater amount of secondary metabolites, the production of which is associated with a change in the sugar balance by plants [98,99].

3.4. Storage

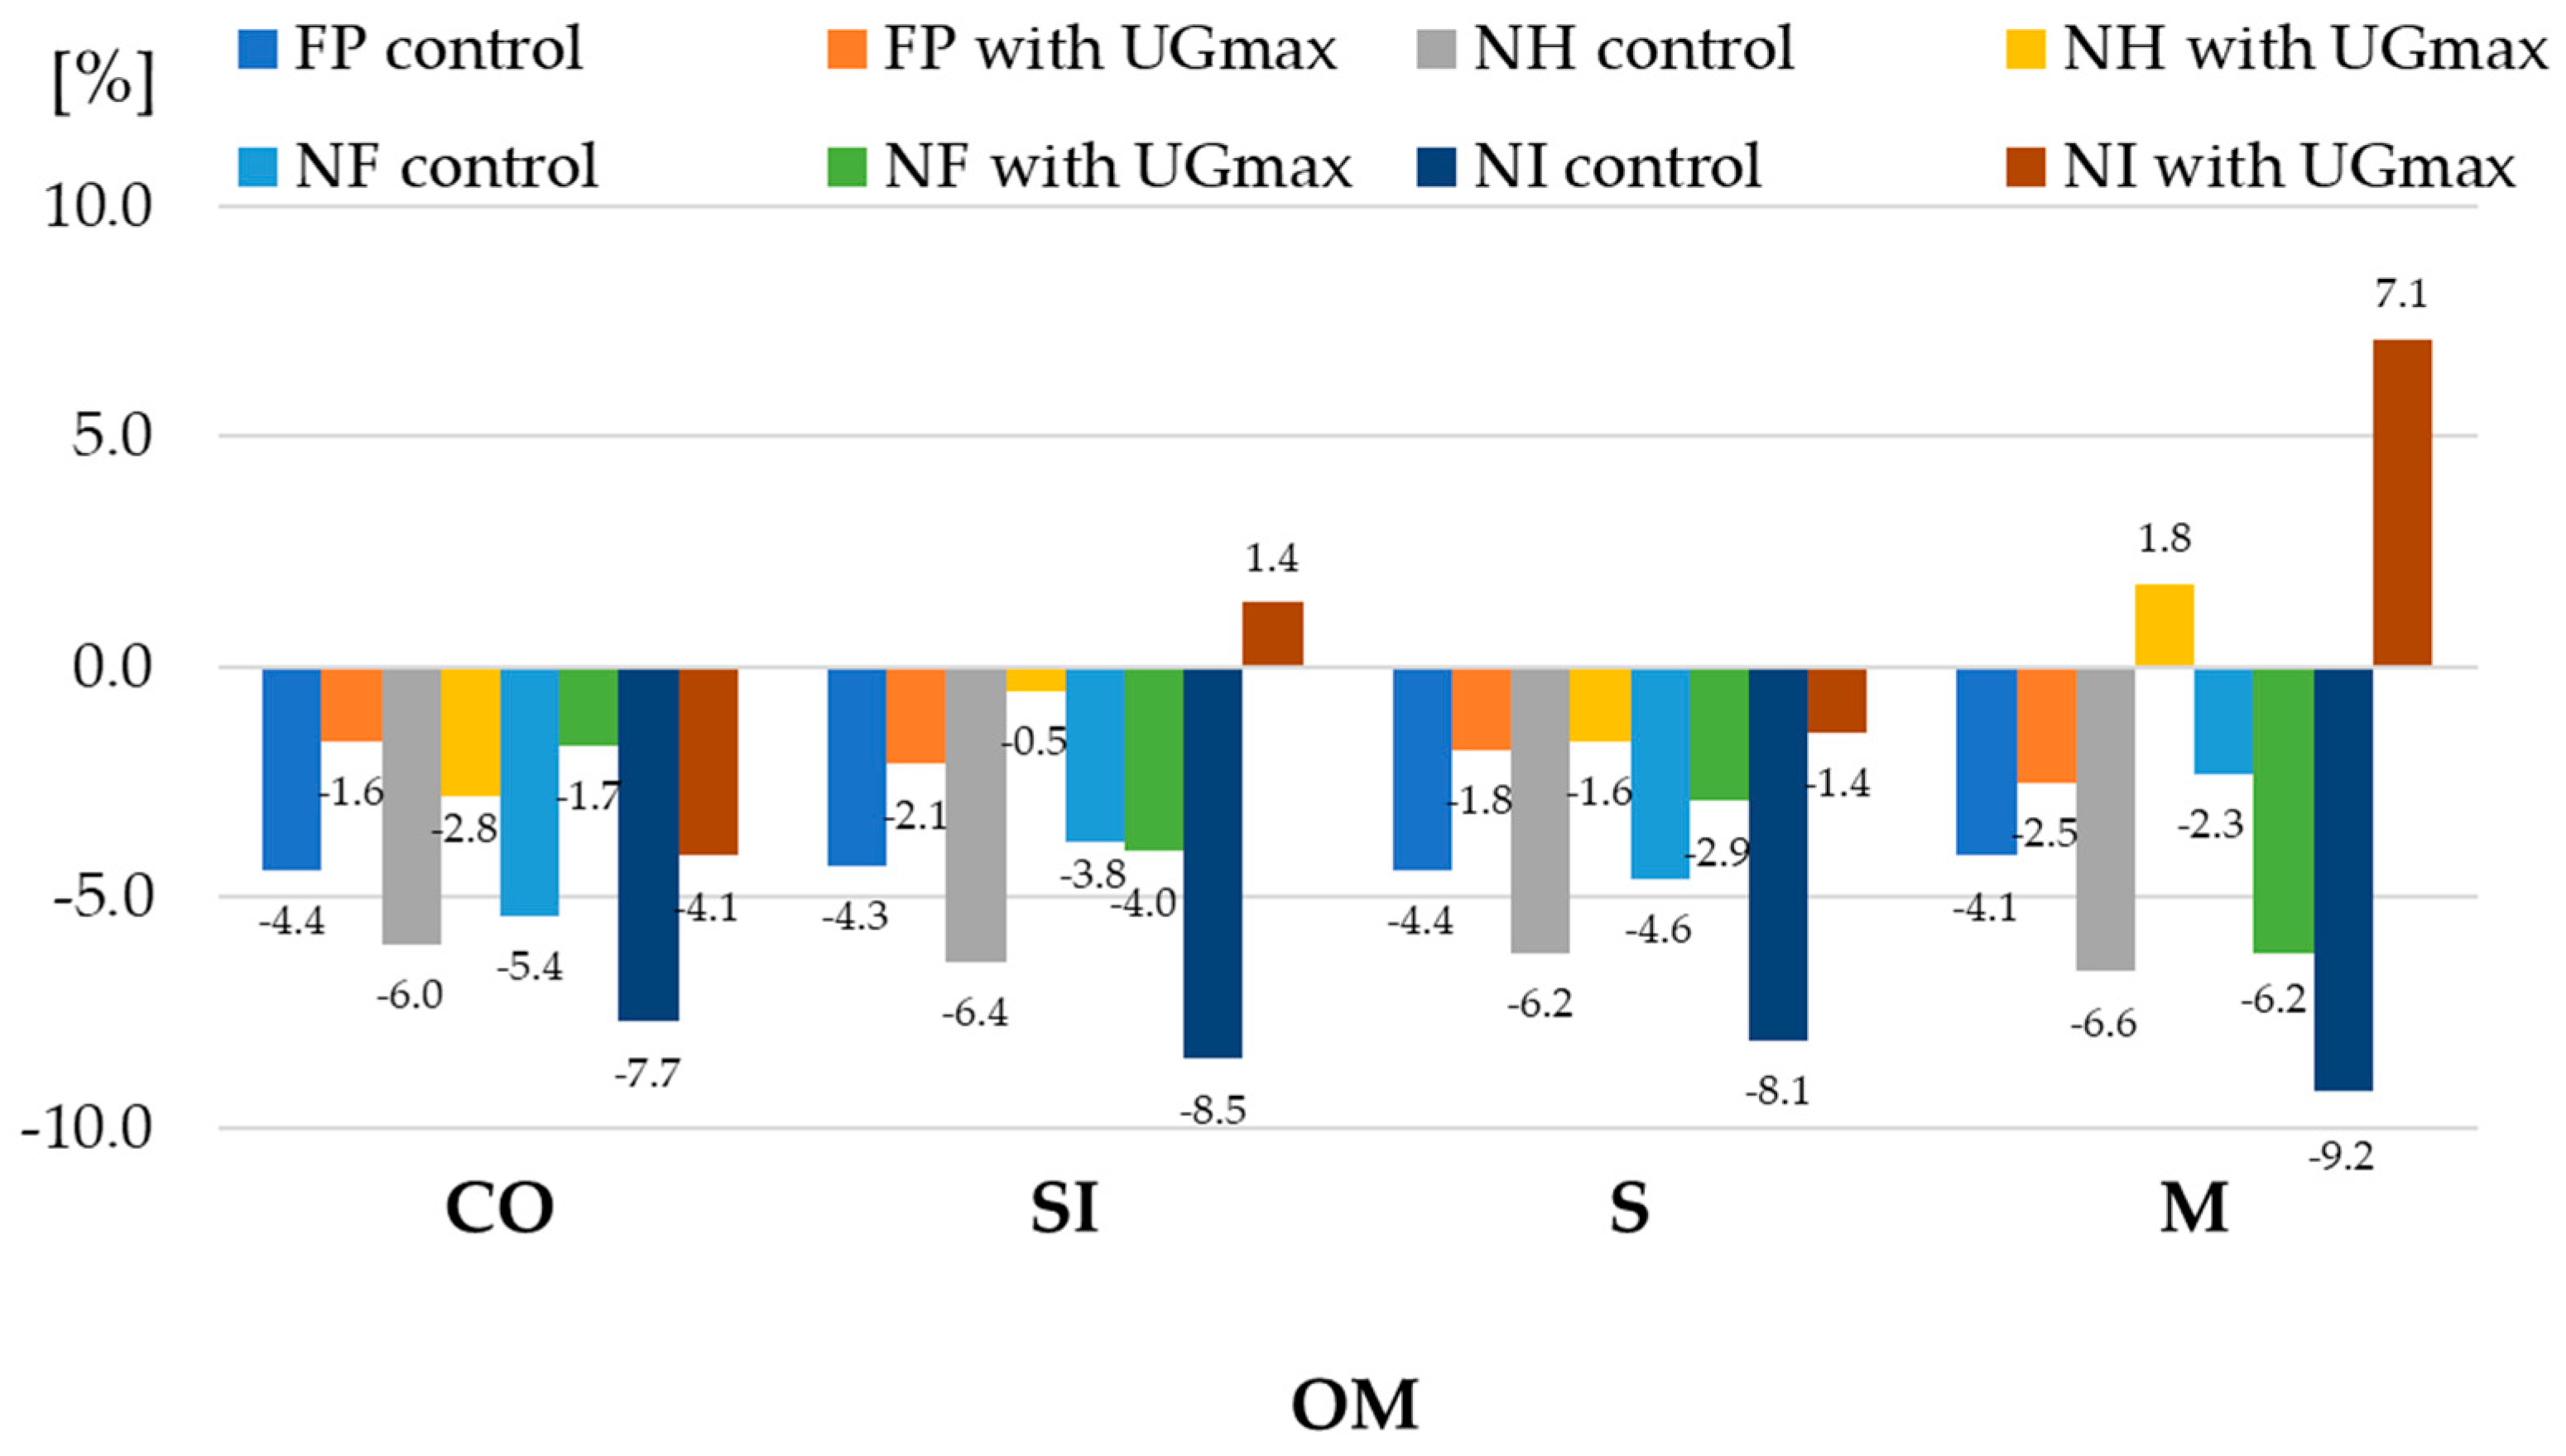
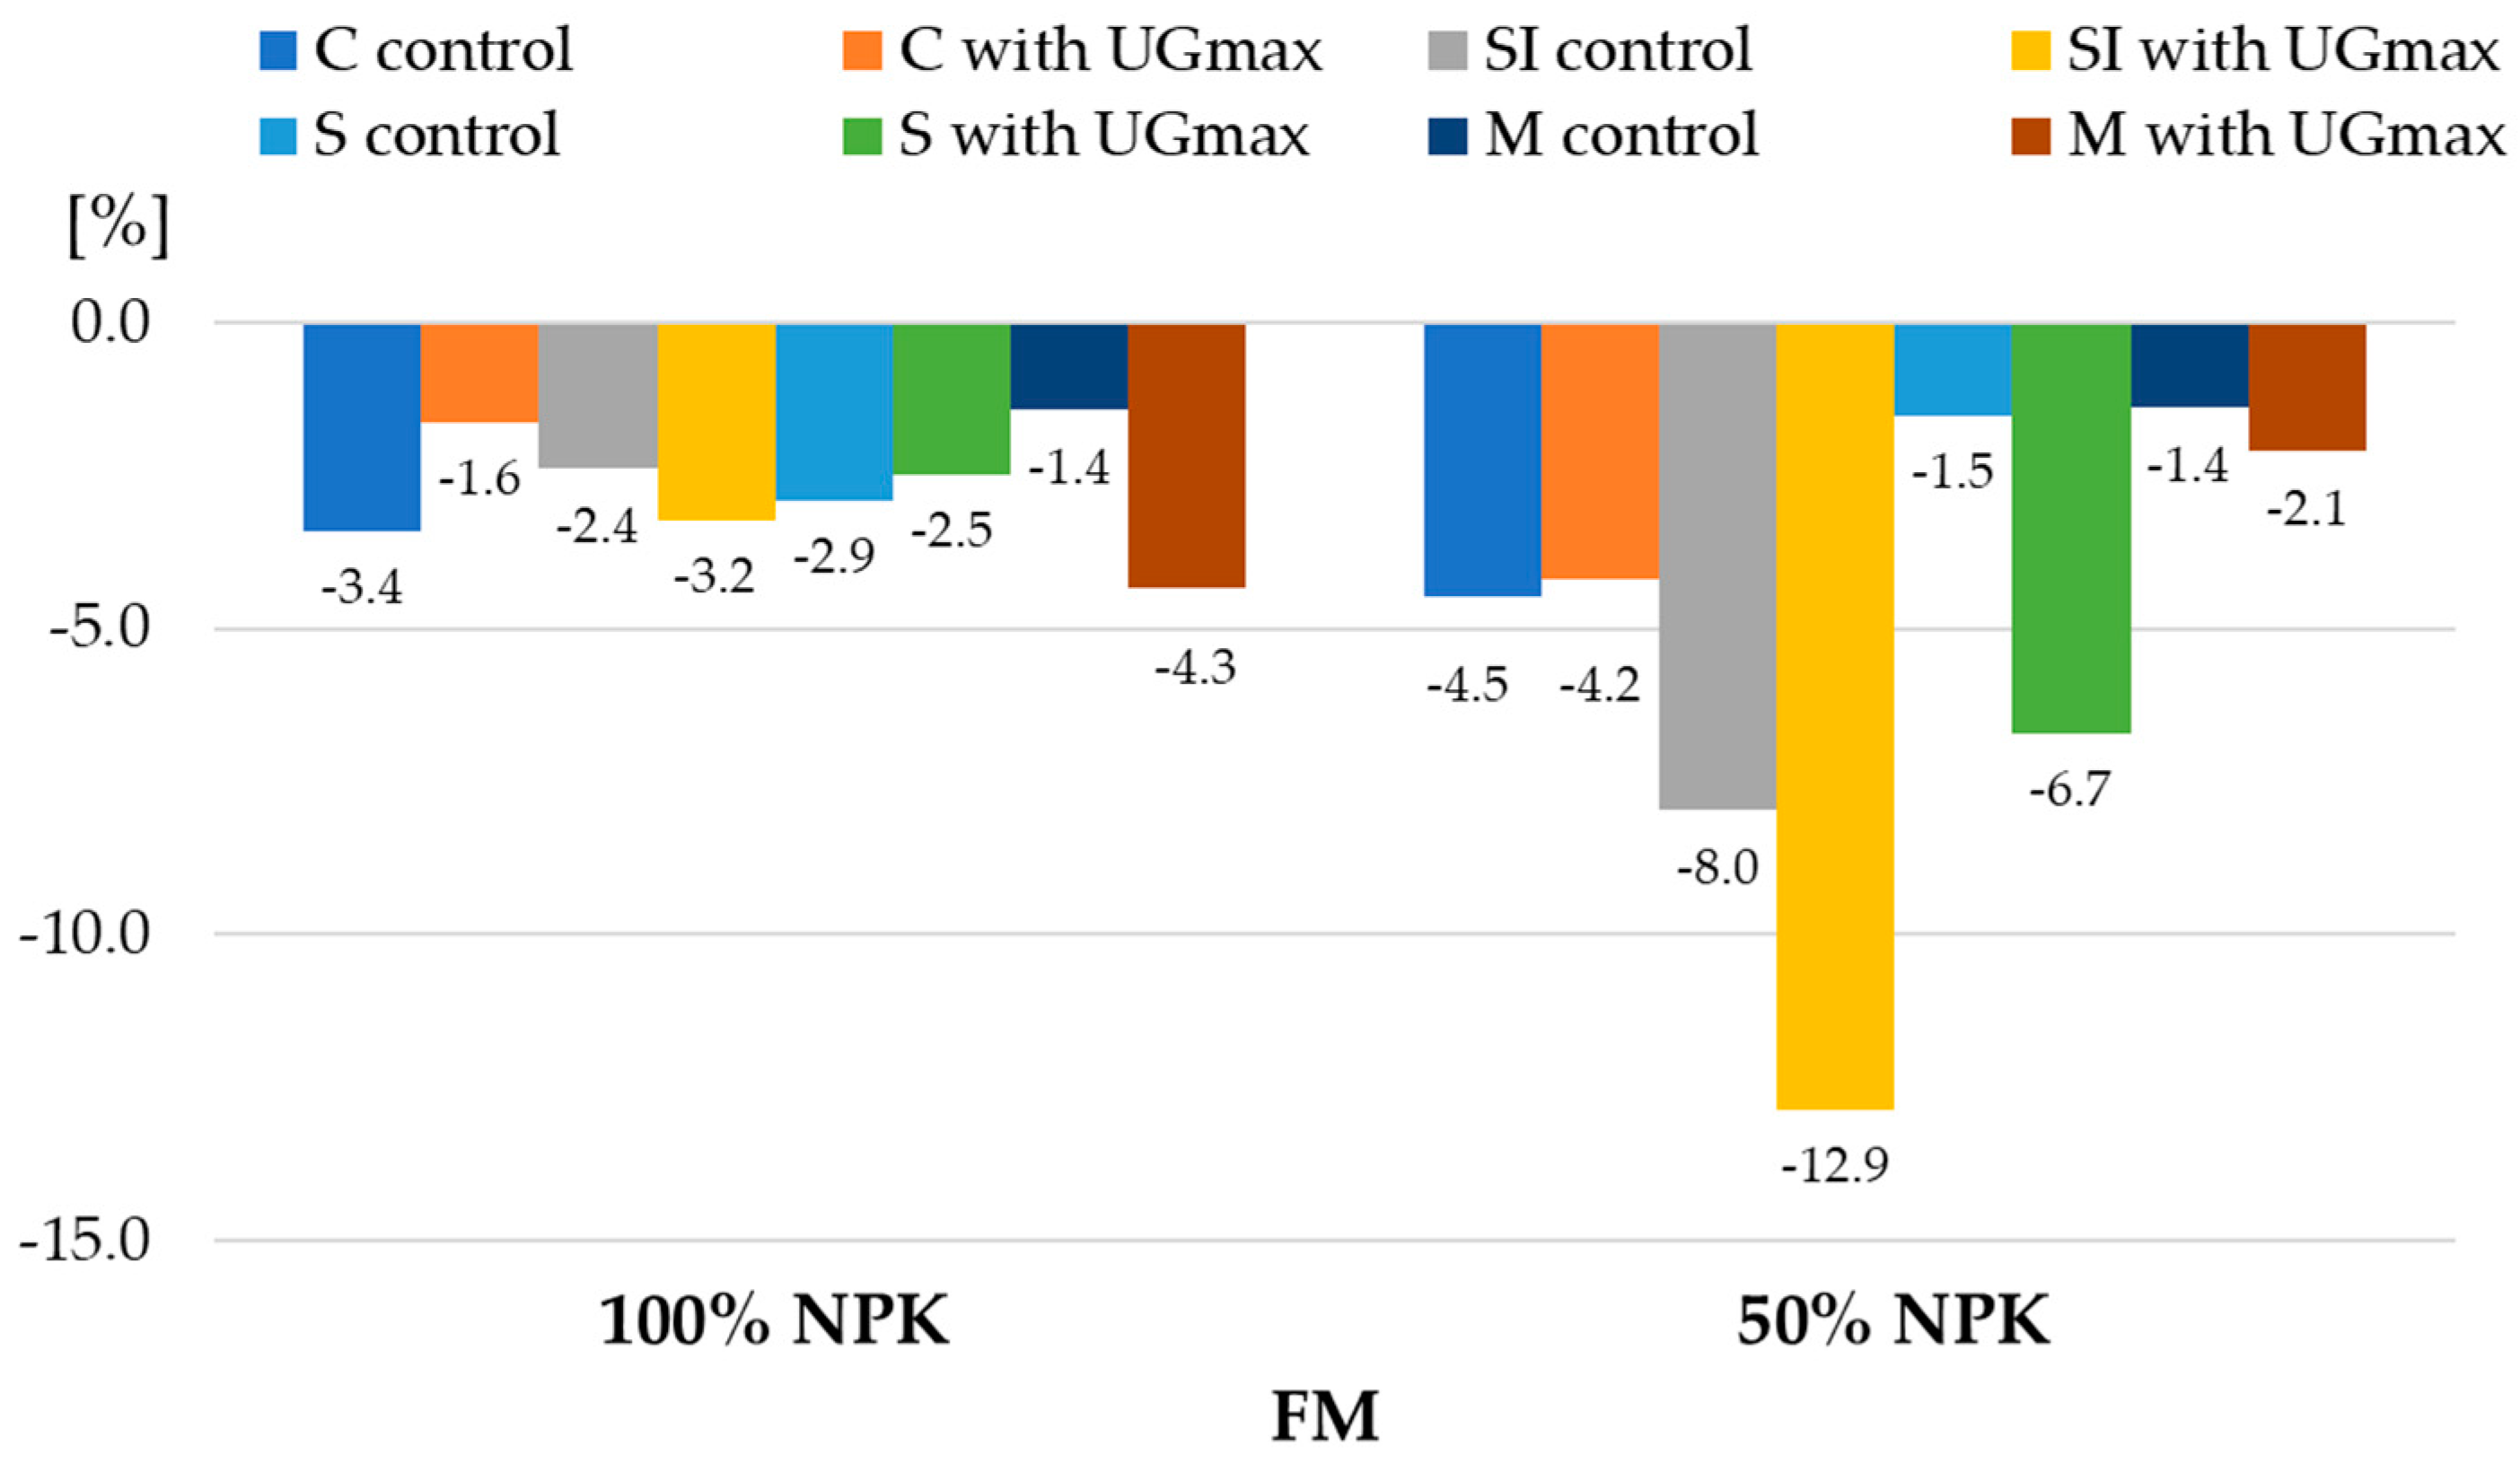
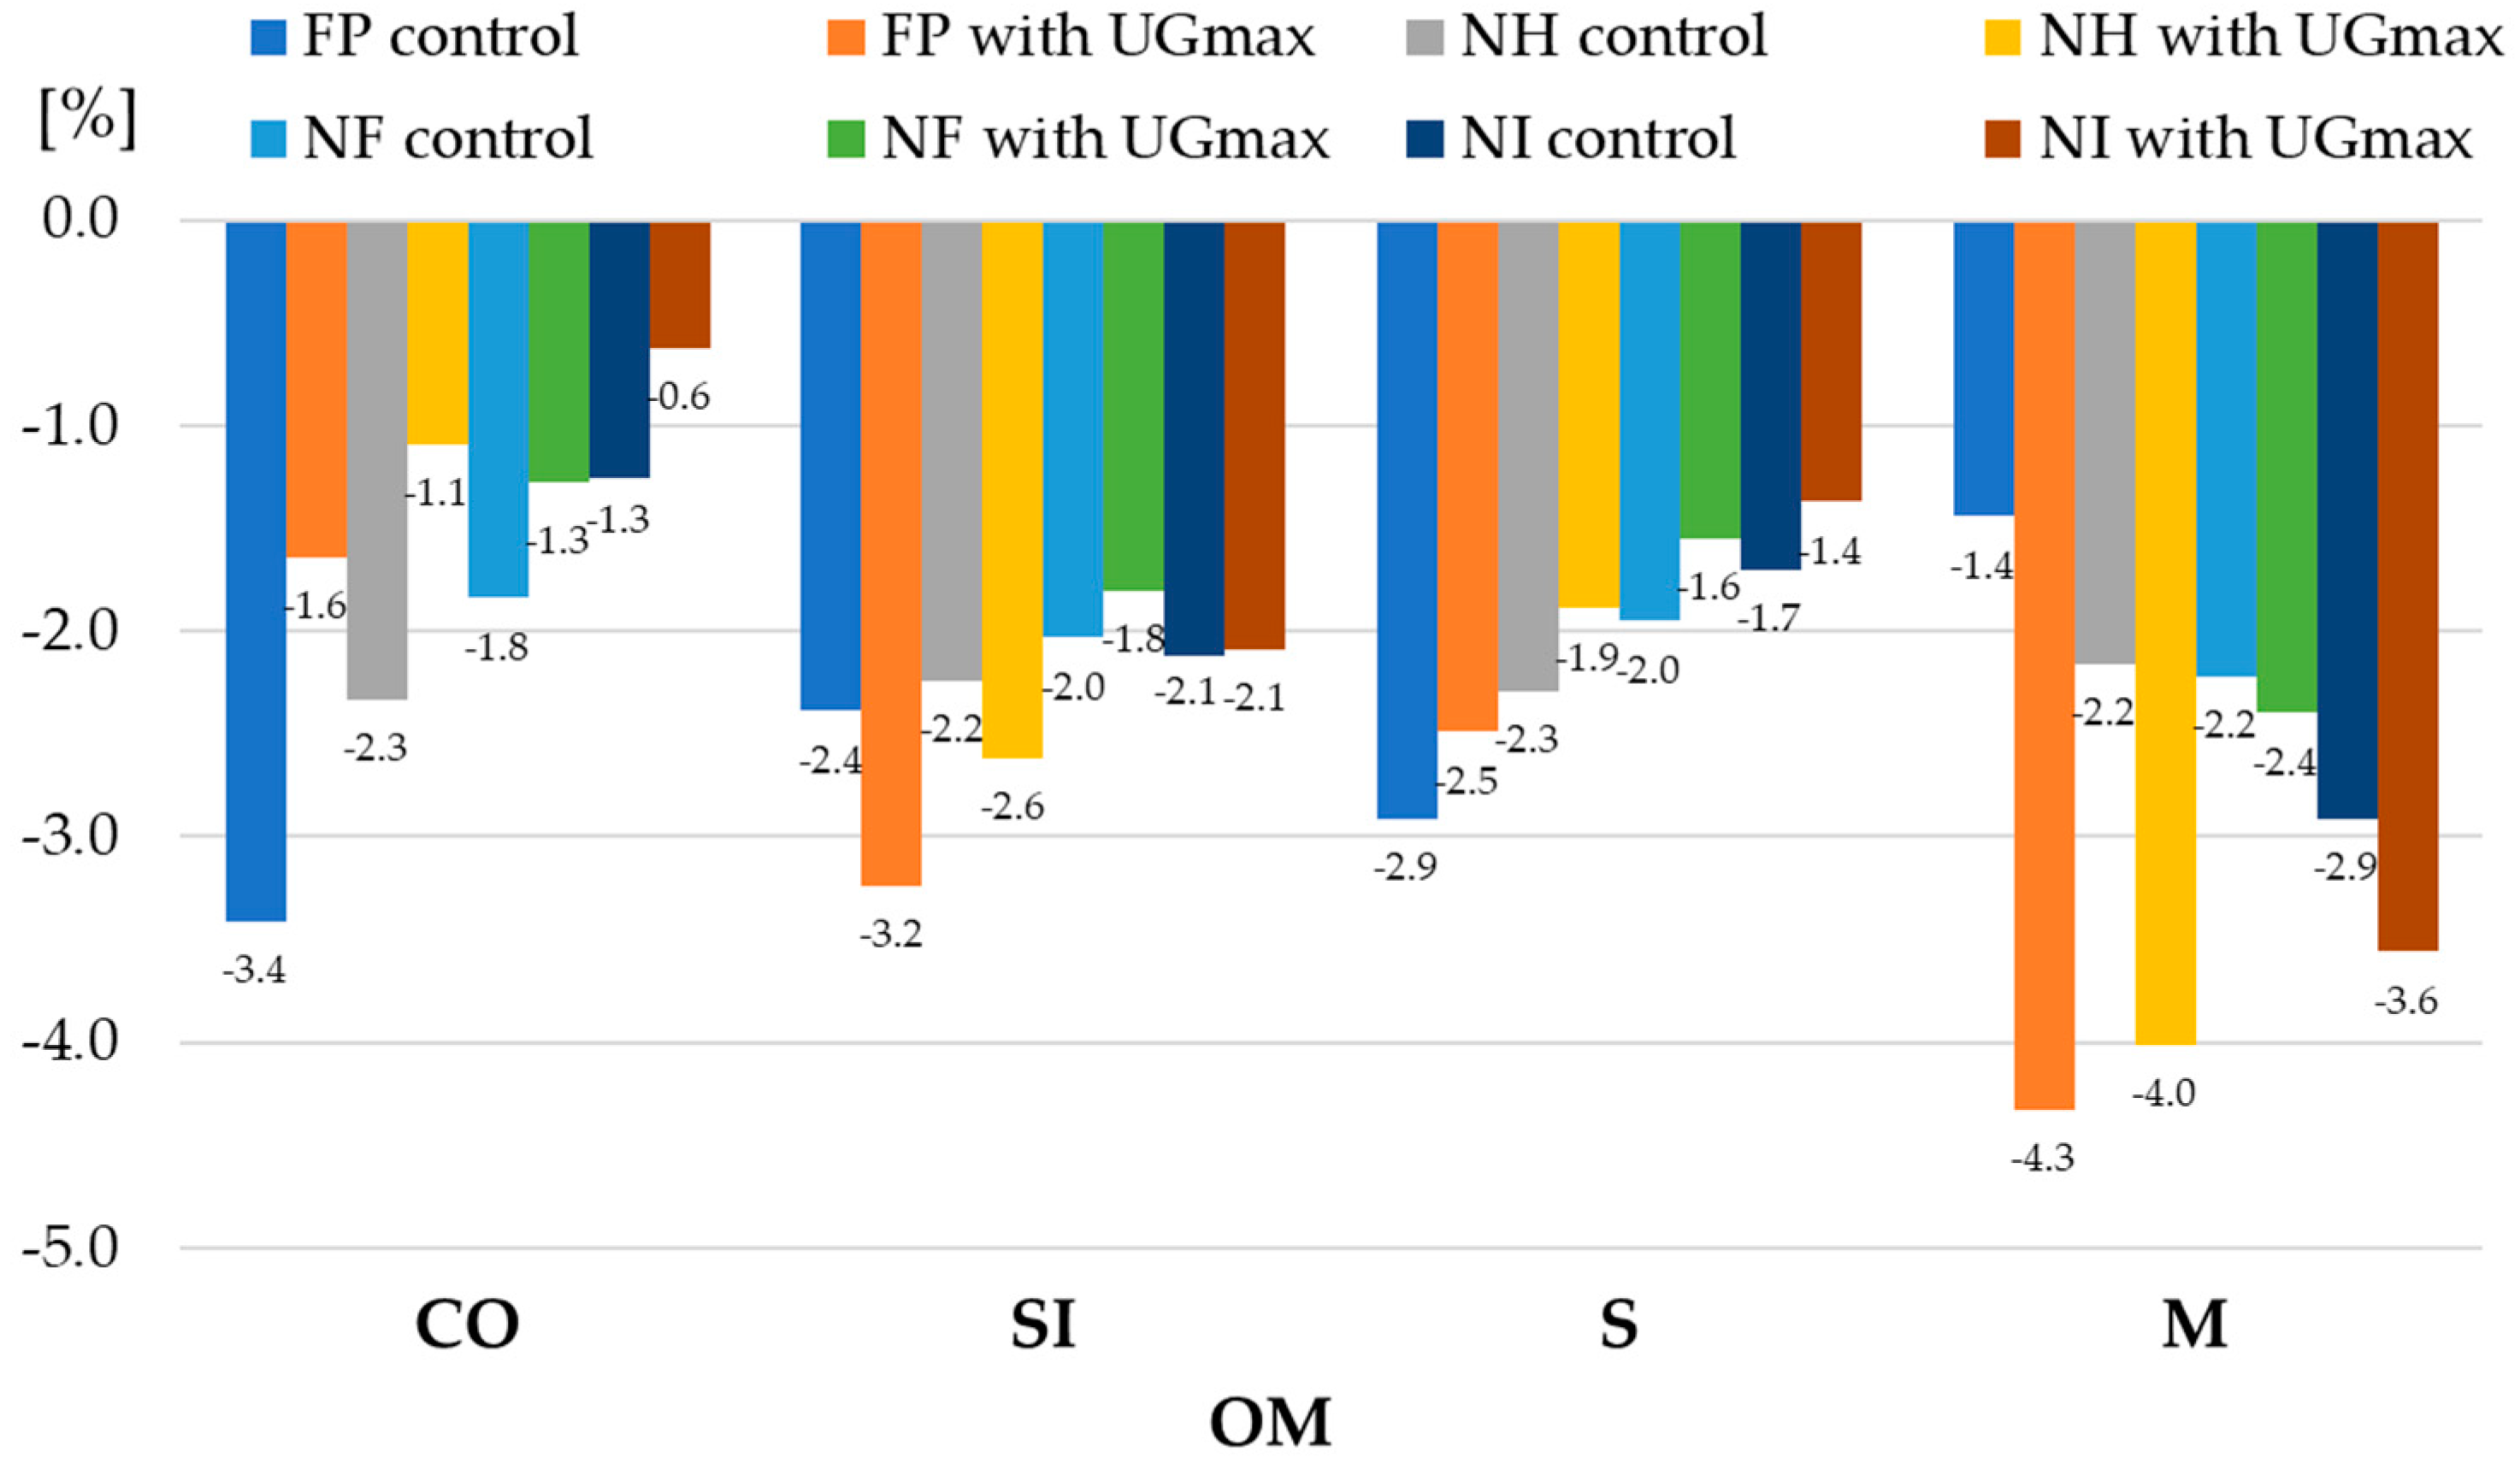
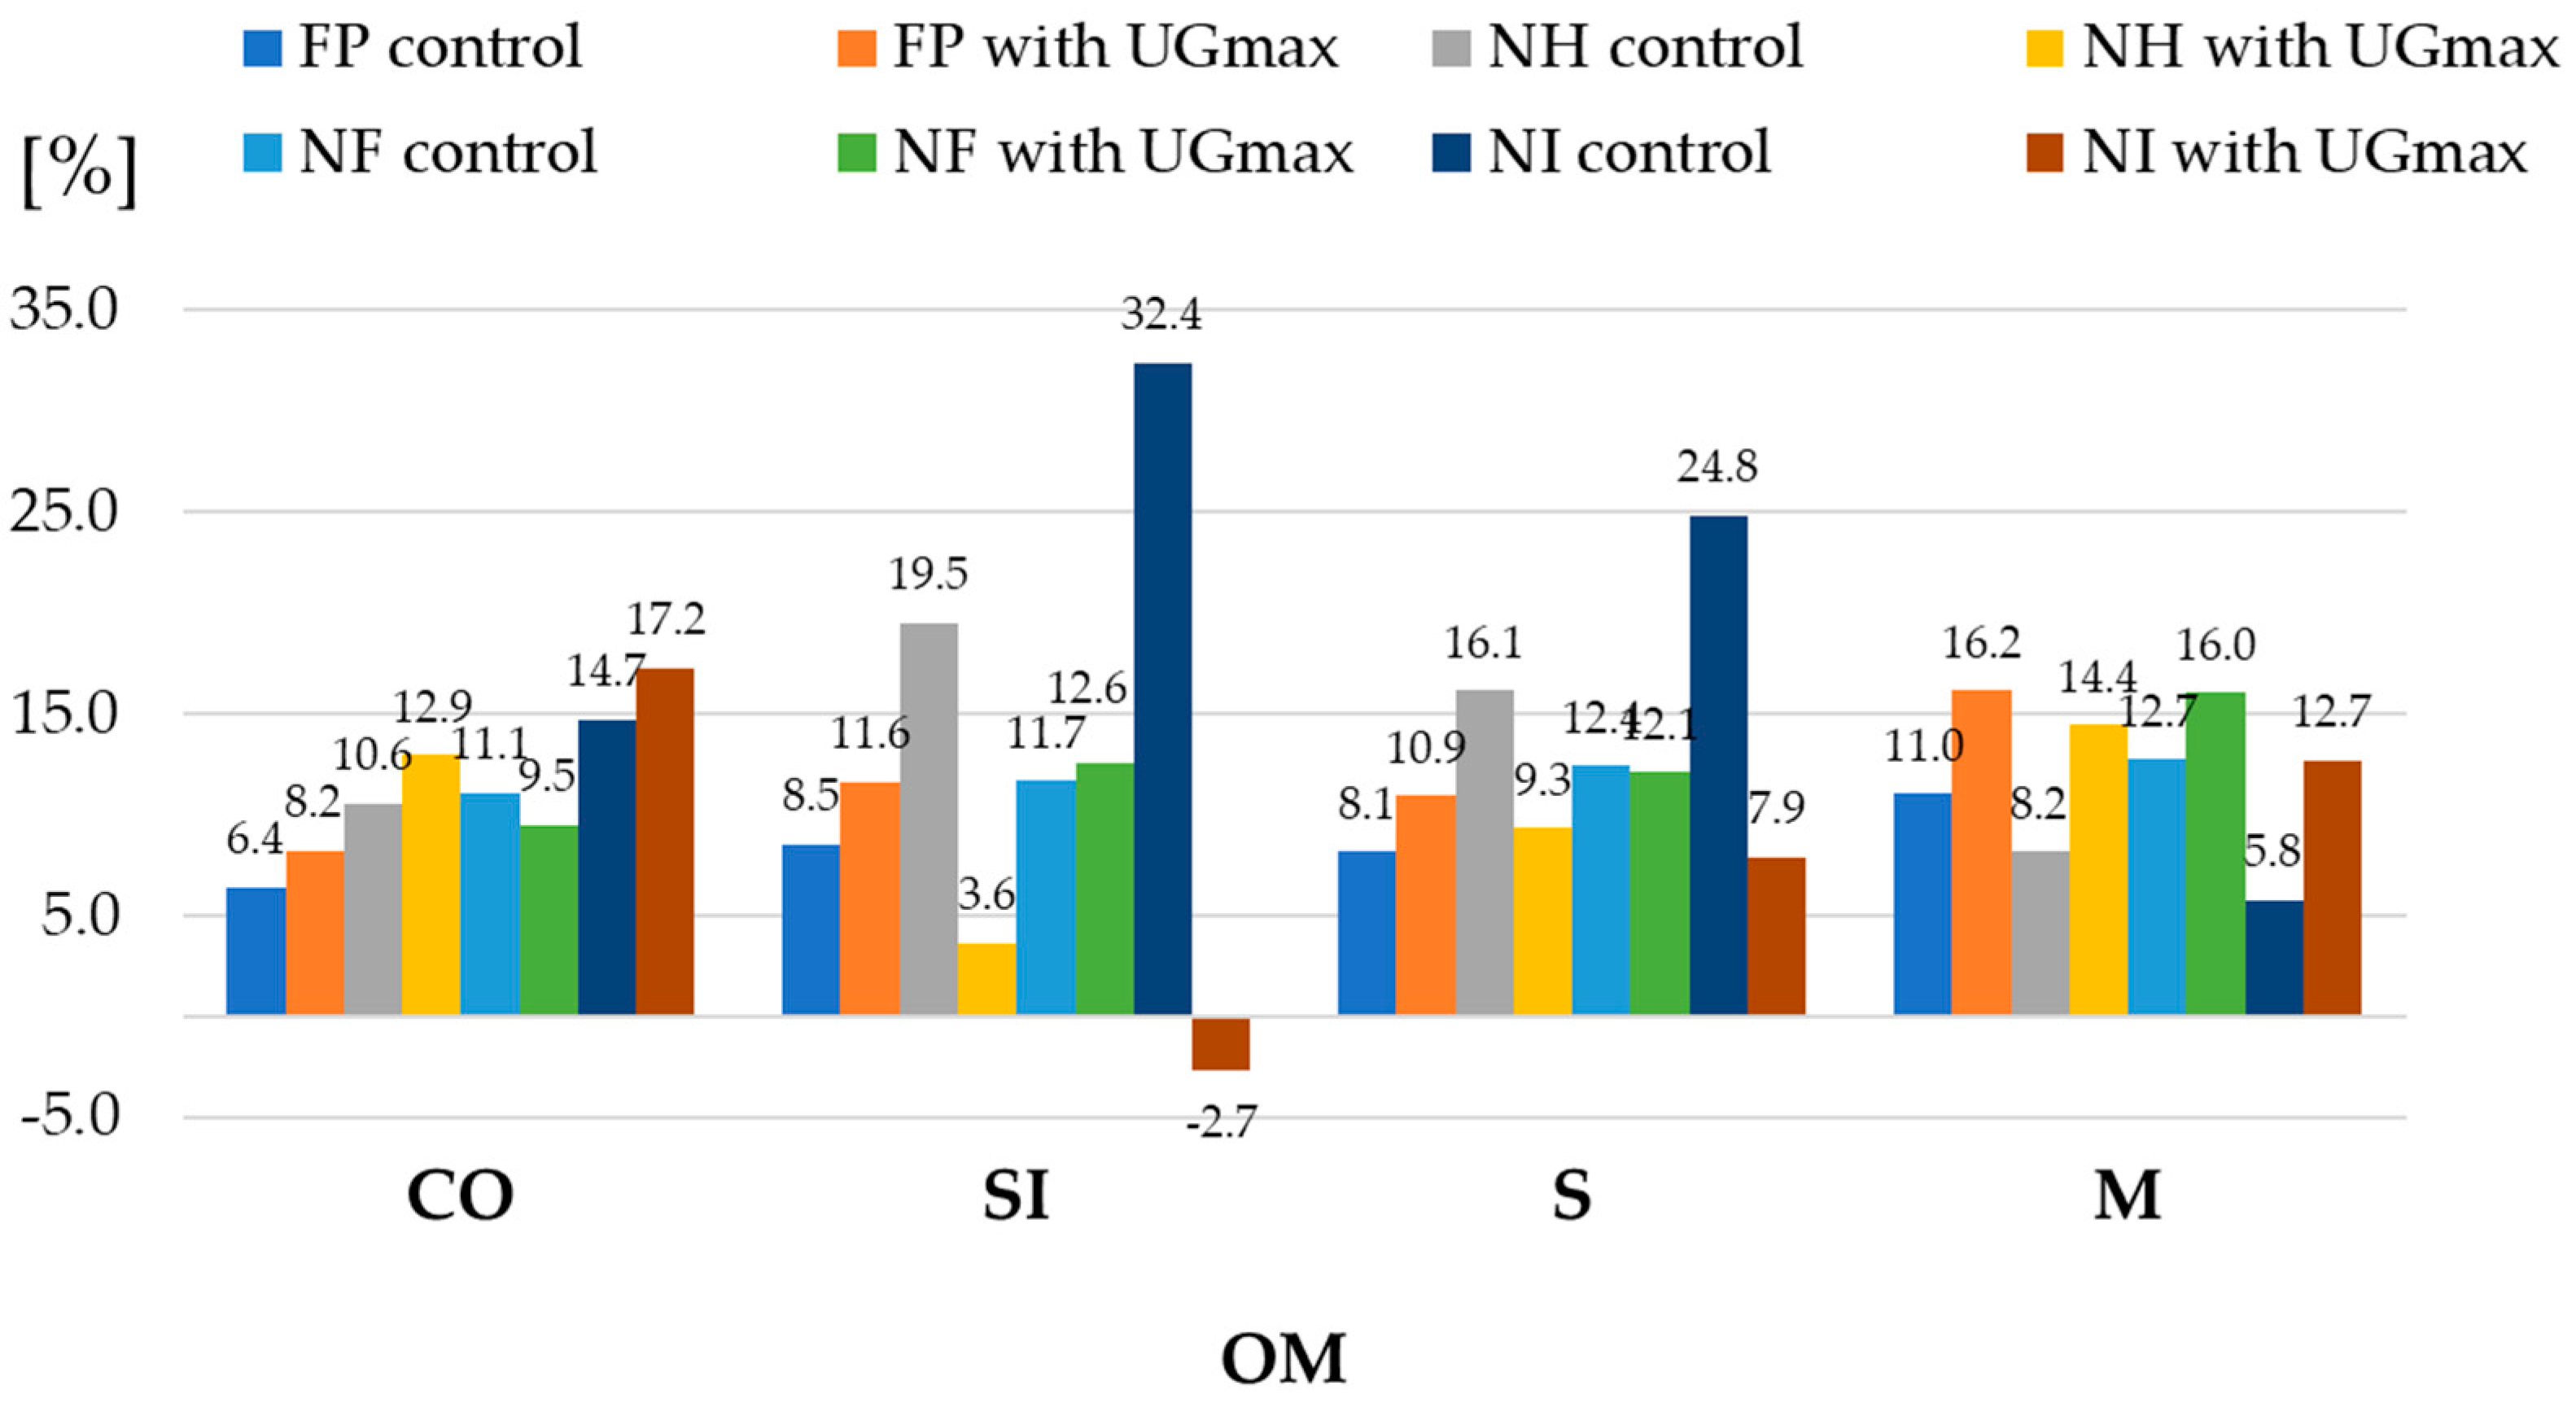
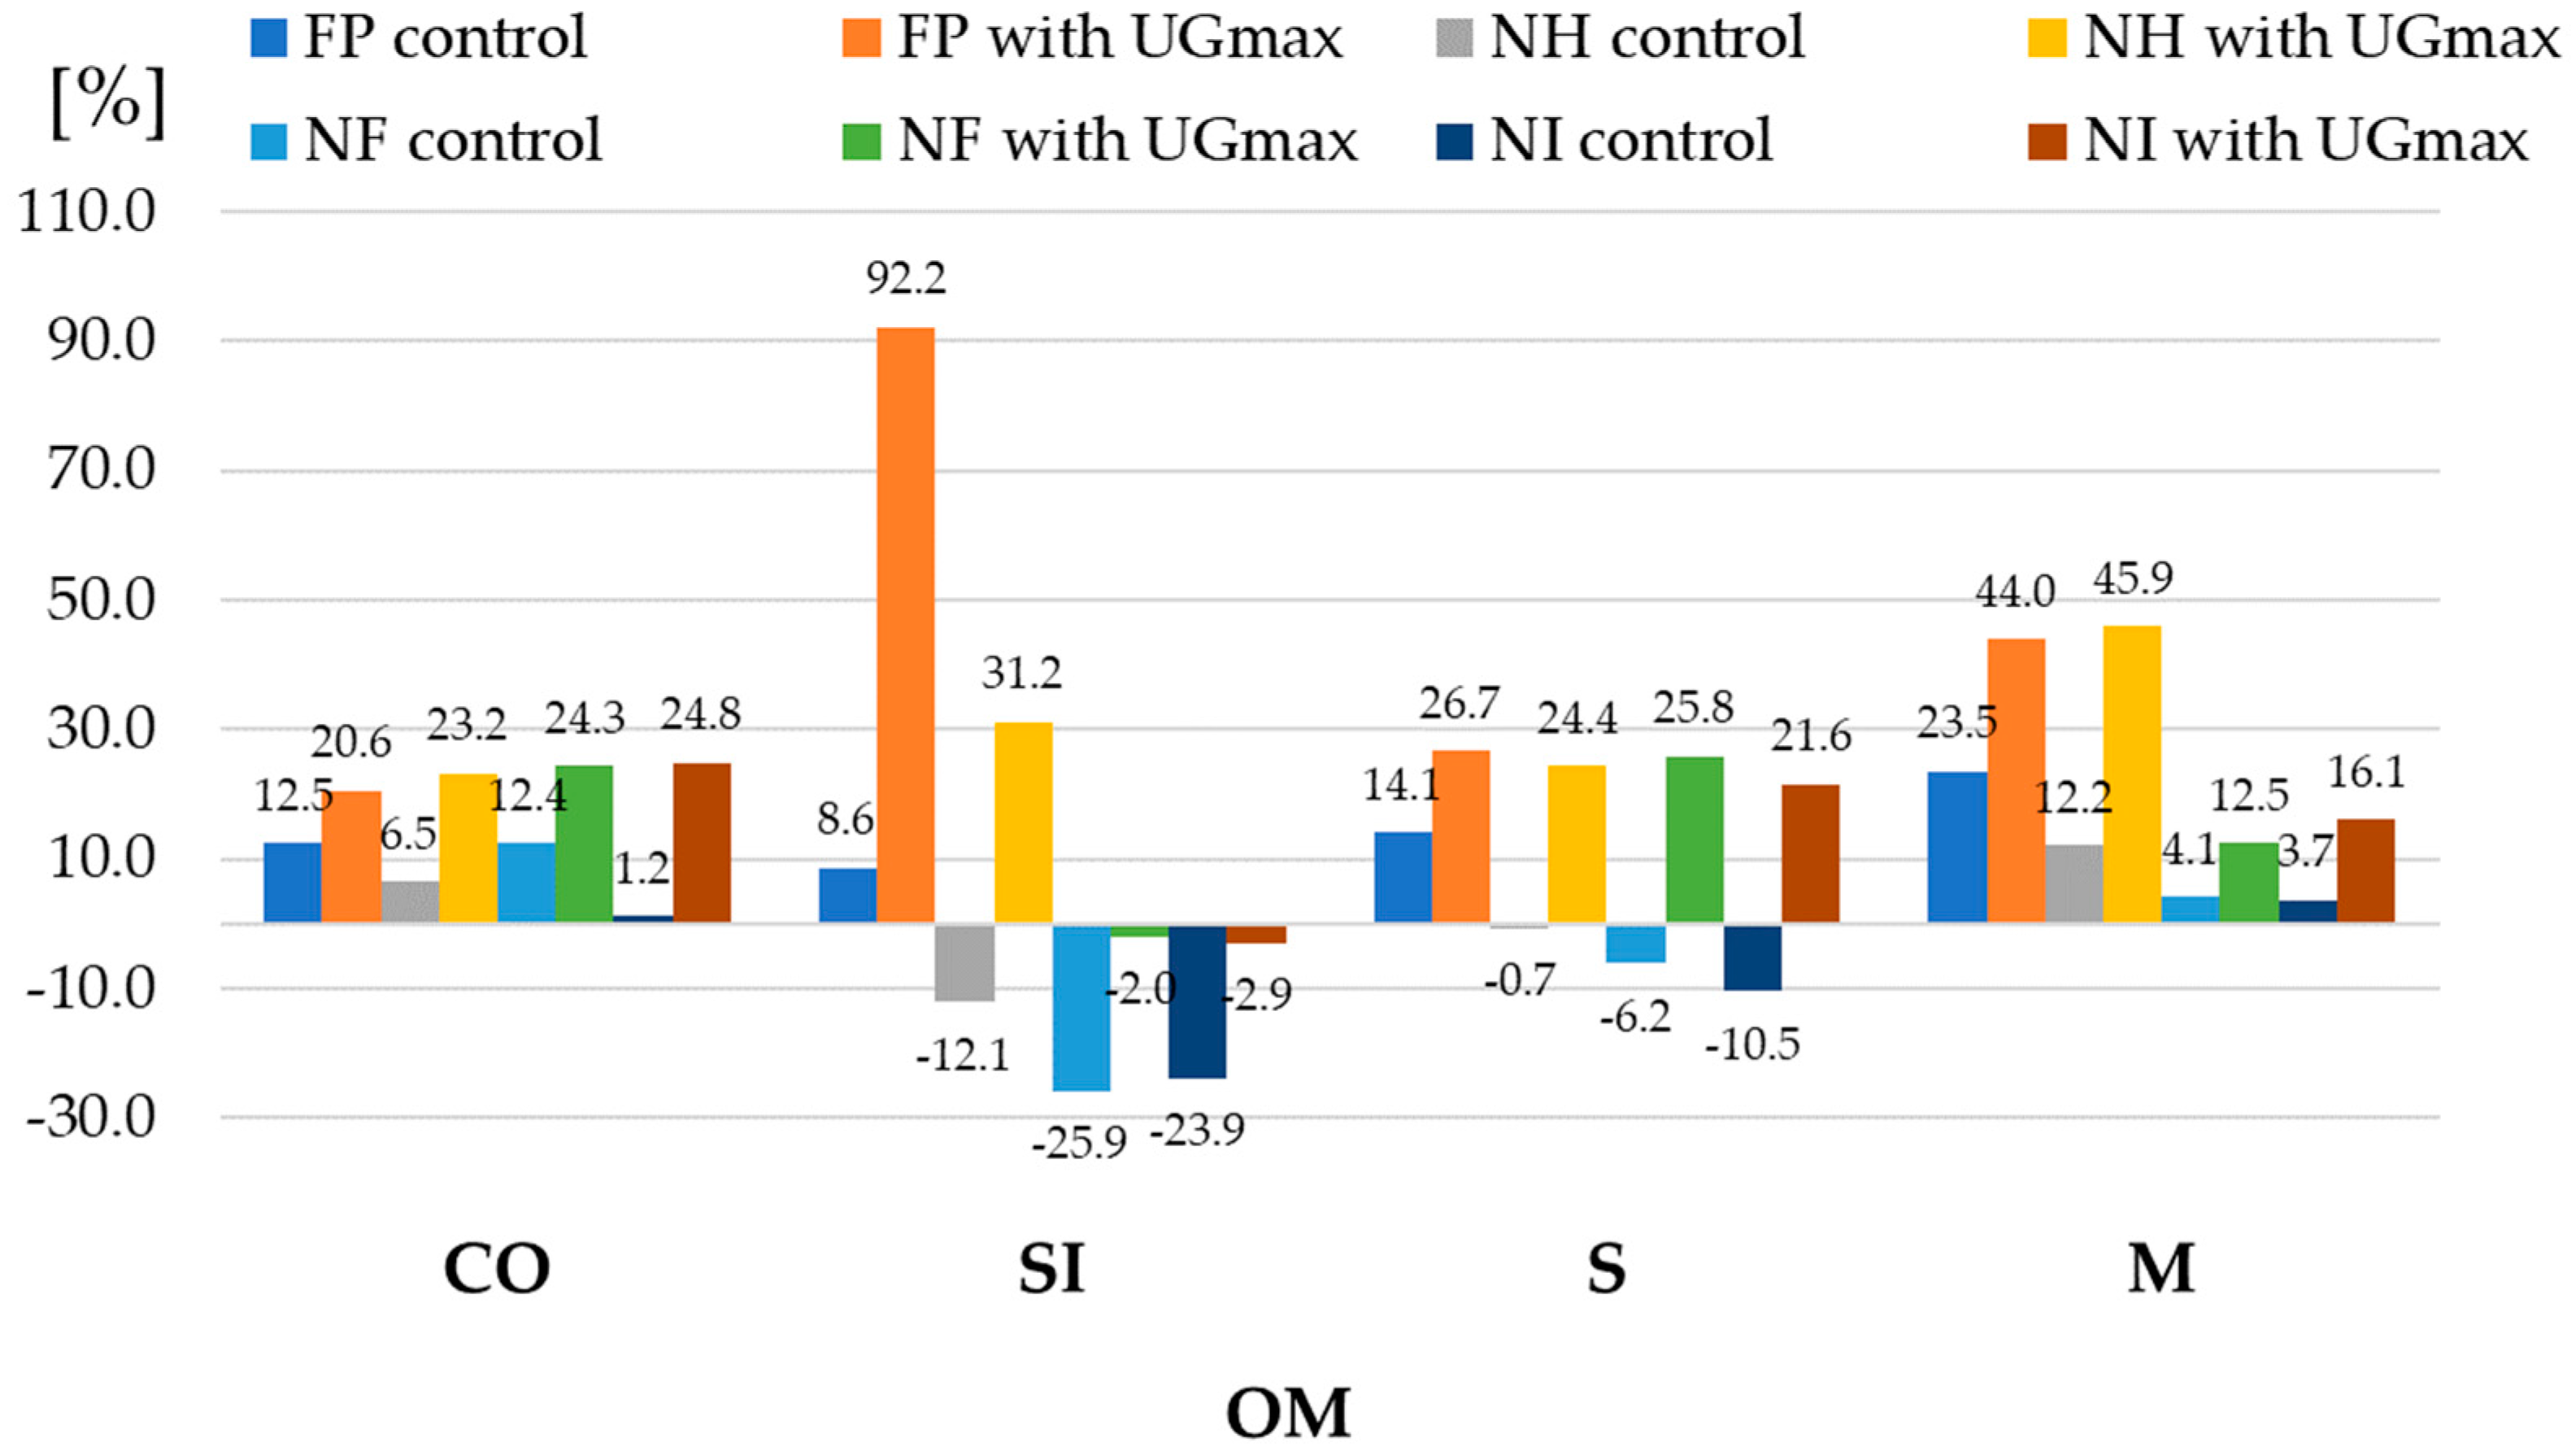
In order to preserve the quality of the tubers and increase their availability throughout the year, long-term storage is necessary. In the tests conducted after 6 months of storage, the dry matter content of the tubers decreased at comparable levels for Experiment I and II, by 3.2 and 3.6%, respectively (Figure 1 and Figure 2). A decrease in starch content, whose content is closely related to dry matter content, was also obtained in tubers after long-term storage [100] (Figure 3 and Figure 4). This is confirmed by the highly significant correlation coefficients between dry matter and starch content obtained in our study, amounting to r = 0.667 (p ≤ 0.05) for Experiment I and r = 0.884 (p ≤ 0.05) for Experiment II, respectively (Table 3). It should be noted that the decrease in starch content was almost twice as high in Experiment I compared to Experiment II (Table 3 and Table 4). Pandey et al. [101] and Siddiqui et al. [102] report that the starch content of potatoes decreases during storage due to the conversion of starch to sugar and its use in respiration. Ozturk and Polat [3] report a decrease and increase in dry matter and starch content in potato tubers after storage (6 months). The authors, storing 7 varieties under controlled conditions, obtained a decrease in dry matter content of 1.5% on average and an increase in starch content of 3% on average. At the same time, in the case of two varieties they recorded an increase in dry matter content by an average of 8.2% while starch content increased by as much as 17.4%. The authors clearly indicate that potato genotype has the greatest impact on losses in dry matter and starch content. Potato varieties differ in the thickness of the periderm and the amount of deposited suberin, which is a natural barrier to water transport and so different varieties carry out vital processes with different intensity under the same conditions. On the other hand, Sahin et al. [103] and Pobereżny and Wszelaczyńska [104] point out that losses of dry matter and starch content are highly dependent on storage time. The authors report that extending the storage period increases losses.
In addition, it was shown that the effect of factors applied during the potato growing season on the dry matter and starch content of tubers after storage was the same as after harvest (Table 1 and Table 2, Figure 1, Figure 2, Figure 3 and Figure 4).
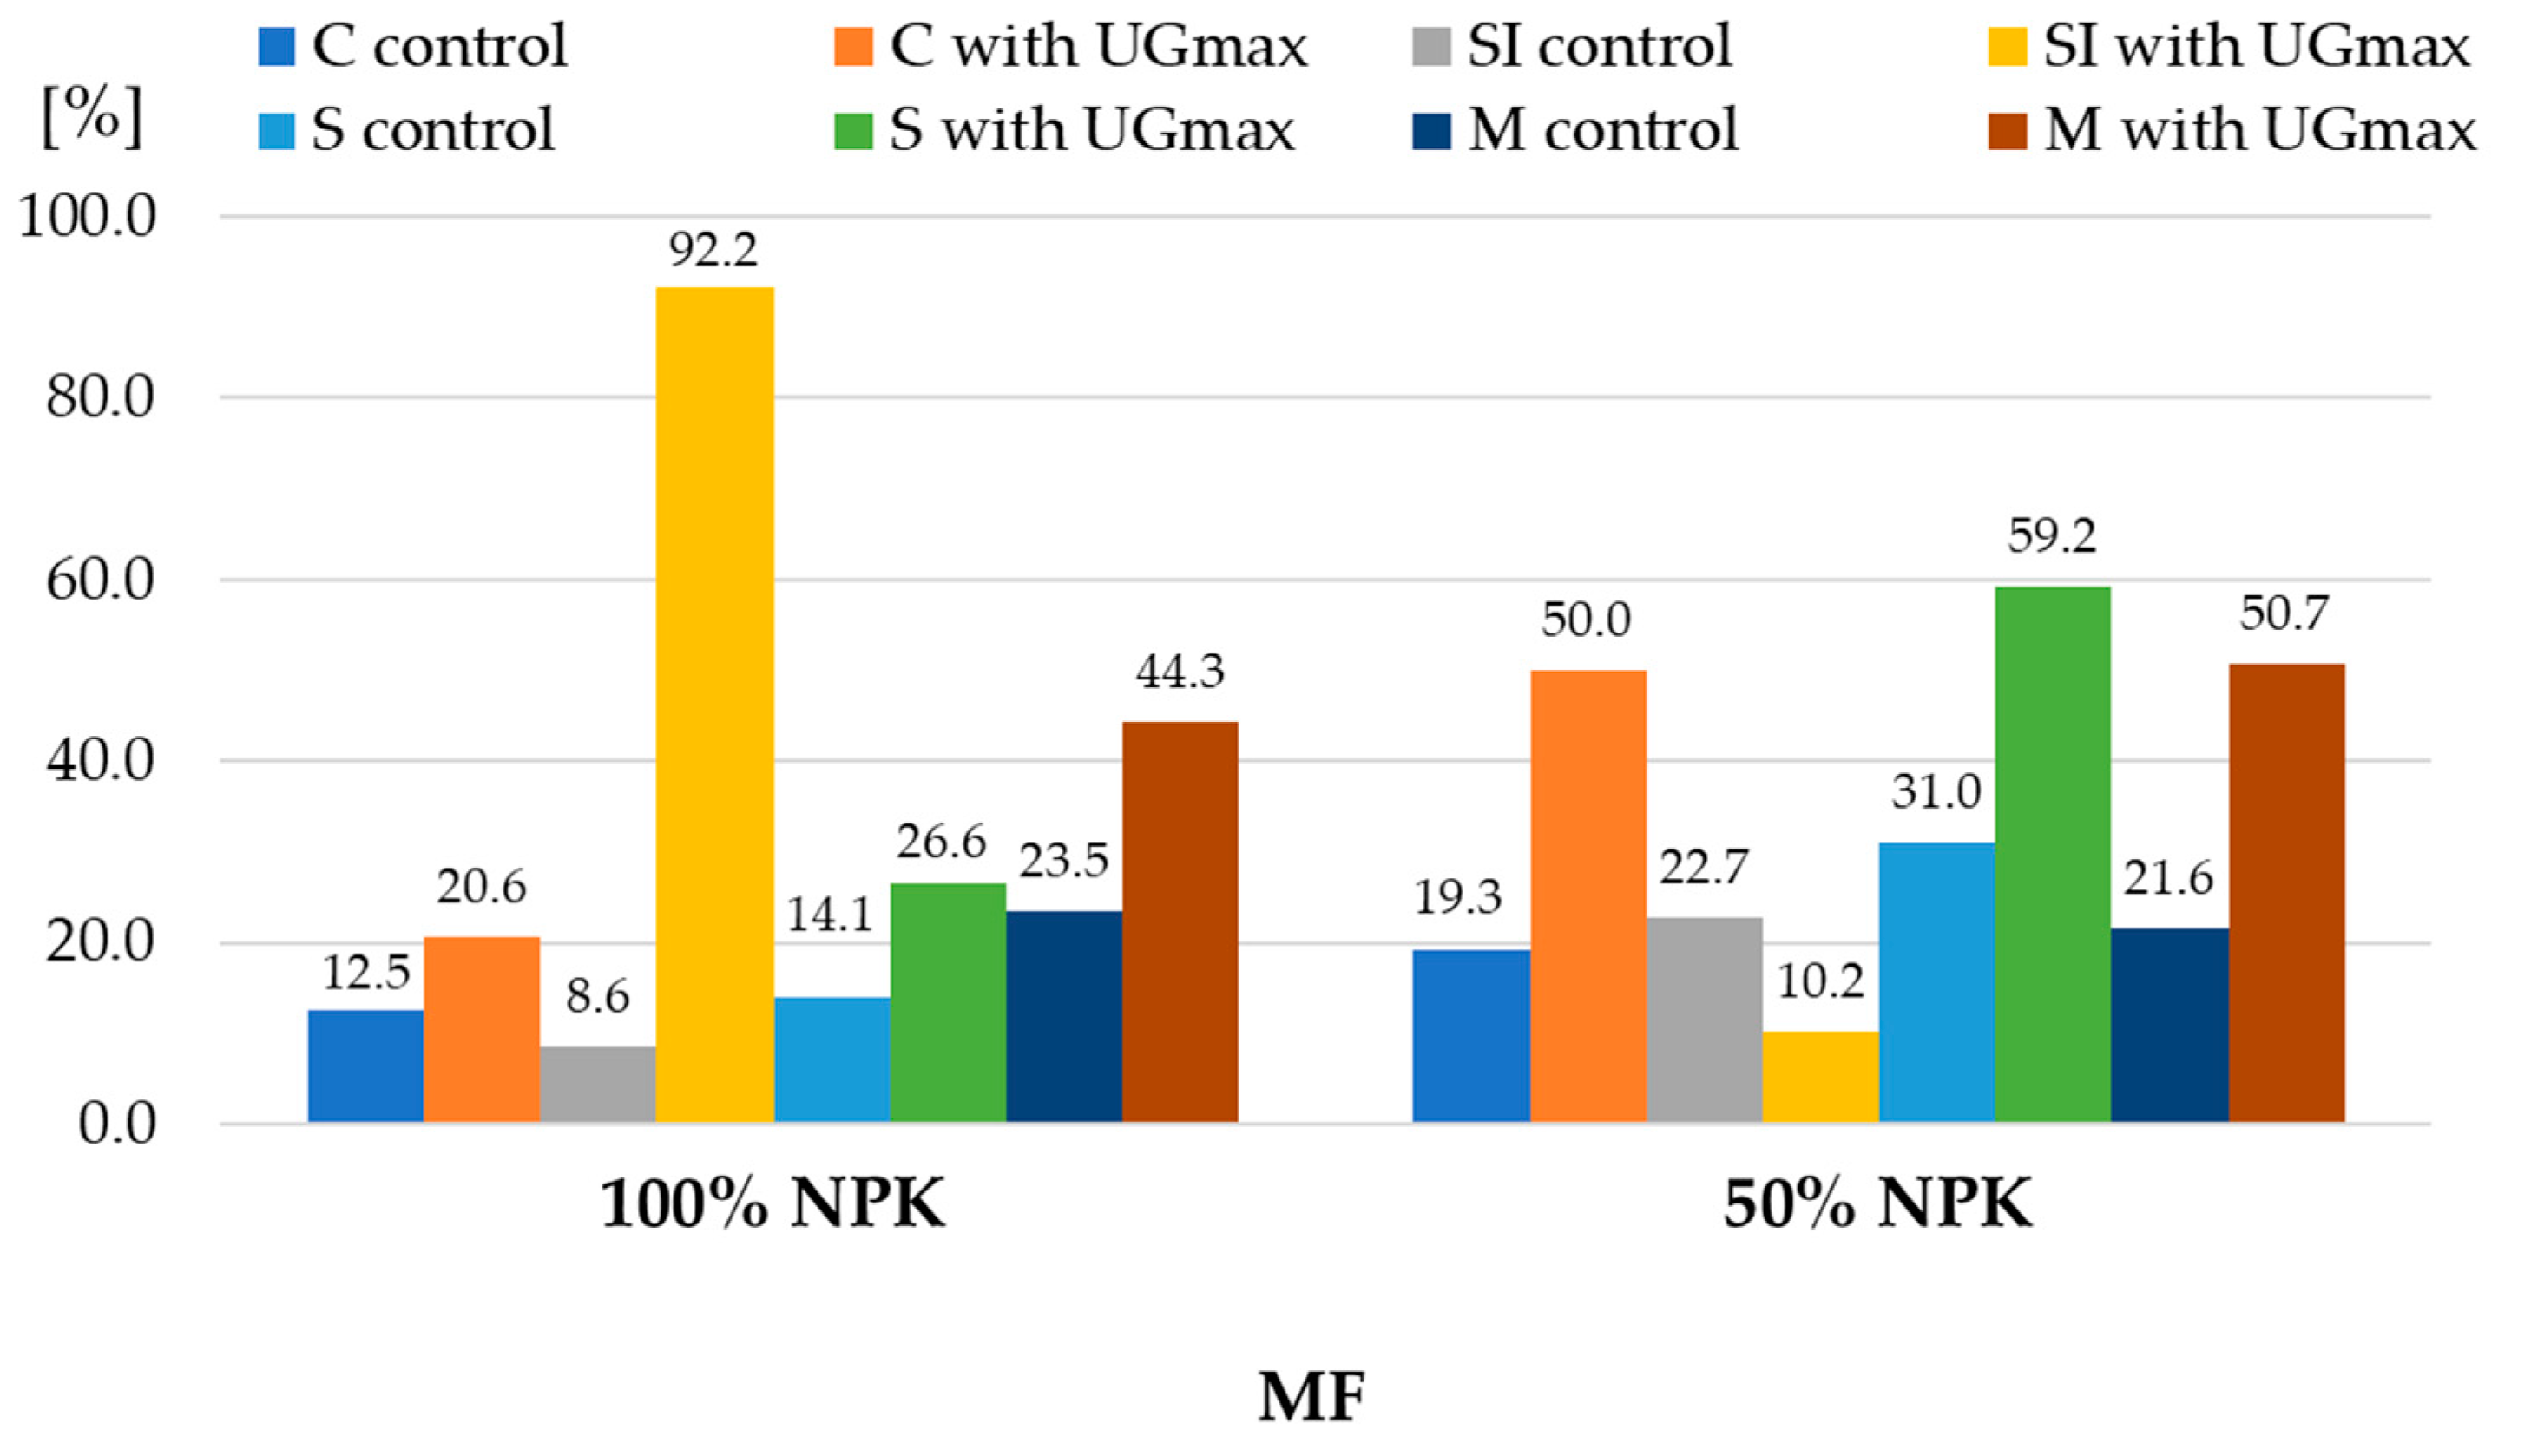
After long-term storage, there was an increase in total sugars and reducing sugars in the tubers. For Experiment I, the increase in total sugars was 8.2% and reducing sugars was 27.6% (Figure 5 and Figure 6). In contrast, for Experiment II, an increase of 11.8% in total sugars and 8.6% in reducing sugars was achieved (Figure 7 and Figure 8). According to many authors, the accumulation of sugars during long-term storage is mainly due to genetic conditions [100,105,106], so the storage period should be determined taking into account the varietal characteristics of the potato [107]. A similar view is presented by Alamar et al. [34] and Wszelaczyńska et al. [108]. In the study of Wszelaczyńska et al. [108], a higher increase in sugar content (54.3%) was obtained after 6 months of storage for the Denar variety compared to the Gardena variety (43.6%). Stress factors such as moisture deficiency or temperature changes during storage are also important determinants of sugar content in tubers [66]. As indicated by Amjad et al. [105] and Zhang and Zhen-Xiang [106], low temperatures of 2-4 ℃ can contribute to the accumulation of reducing sugars due to so-called cold-induced sweetening. The sweetening process is a natural process that occurs as a result of tuber aging. It is irreversible and involves cellular breakdown. After cellular breakdown, structural and non-structural carbohydrates are depolymerized by hydrolytic enzymes [34]. Therefore, maintaining appropriate storage conditions, including temperature, can contribute to reducing weight loss and sweetening of potatoes.
Considering the field factors applied during potato cultivation, it was found that in Experiment II, the effect of these factors on the content of total sugars and reducing sugars in tubers after storage was the same as after harvest (Table 5, Figure 7 and Figure 8). In contrast, in Experiment I, it was shown that the field factors had the same effect only on the content of total sugars after storage (Table 4, Figure 5).
The highest increase in total sugars and reducing sugars in tubers after storage in Experiment I was obtained in potatoes after cultivation on manure and straw along with soil conditioner (Figure 5 and Figure 6). In contrast, reducing NPK fertilization to 50% resulted in the highest increase in reducing sugars (Figure 8).
In Experiment II, the withdrawal of insecticides and fungicides resulted in the largest increase in total sugars and, at the same time, the smallest increase in reducing sugars (Figure 7 and Figure 8). In contrast, the application of UGmax similarly to that in Experiment I caused an increase in the content of reducing sugars (by 24.4% on average). It should be noted, however, that after potato cultivation without the application of soil conditioner, a slight decrease in the content of reducing sugars was obtained (-0.8%) after storage (Figure 6).

4. Conclusions

Najwyższa zawartość suchej masy I skrobi w bulwach ziemniaka odmiany Satina uzyskano stosując 100% NPK, obornik i użyźniacz glebowy. Studies have shown that after the introduction of mineral fertilization limitation of up to 50% (50kg N, 50kg P2O5, 75kg K2O kg ha-1) in the cultivation of edible potatoes, the highest dry matter and starch content in tubers can be obtained after the simultaneous application of soil conditioner with stubble intercrop in the form of fodder peas. On the other hand, with the introduction of crop protection limitations, the best results were obtained after the withdrawal of herbicides with the simultaneous application of manure and UGmax. In addition, in the case of total sugars, the use of stubble intercrop without fertilizer proved to be the most beneficial, and in the case of reducing sugars, the use of straw also without fertilizer.
Long-term storage under constant conditions resulted in a decrease in dry matter and starch content. Limiting mineral fertilization in the crop to 50% resulted in increased dry matter and starch losses after storage. Regardless of the field factors used, long-term storage generally resulted in an increase in total sugars and reducing sugars in the tubers. In contrast, the lack of fertilizer application while reducing insecticides and fungicides, however, contributed to a decrease in the content of reducing sugars after storage.

Author Contributions

Conceptualisation, E.W., J.P.; methodology, E.W., J.P.; validation E.W., J.P.; formal analysis, E.W., J.P.; investigation, E.W., J.P; writing–original draft preparation, K.G., K.R., E.W., J.P.; writing–review and editing, K.G., K.R., E.W., J.P ; visualisation, K.G., K.R.; project administration, K.G., K.R., E.W., J.P. All authors have read and agreed to the published version of the manuscript.

Funding

This research was funded by nr Grant-0863/B/P01/2009/36.

Institutional Review Board Statement

Not applicable.

Informed Consent Statement

Not applicable.

Data Availability Statement

When requested, the authors will make available all data used in this study.

Acknowledgments

The authors would like to thank the Faculty of Agriculture and Biotechnology, Bydgoszcz University of Science and Technology for their support in this research work.

Conflicts of Interest

The authors declare no conflict of interest.

References

  1. Devaux, A.; Goffart, J.P.; Petsakos, A.; Kromann, P.; Gatto, M.; Okello, J.; Hareau, G. Global food security, contributions from sustainable potato agri-food systems. The potato crop: Its agricultural, nutritional and social contribution to humankind, 2020; 3–35. [Google Scholar] [CrossRef]
  2. Wijesinha-Bettoni, R.; Mouillé, B. The contribution of potatoes to global food security, nutrition and healthy diets. Am. J. Potato Res. 2019, 96, 139–149. [Google Scholar] [CrossRef]
  3. Ozturk, E.; Polat, T. The effect of long term storage on physical and chemical properties of potato. Turk. J. Field Crops. 2016, 21, 218–223. [Google Scholar] [CrossRef]
  4. Drami´canin, A.M.; Andri´c, F.L.; Pošti´c, D.; Momirovi´c, N.M.; Milojkovi´c-Opsenica, D.M. Sugar profiles as a promising tool in tracing differences between potato cultivation systems, botanical origin and climate conditions. J. Food Compos. Anal. 2018, 72, 57–65. [Google Scholar] [CrossRef]
  5. Kazimierczak, R.; Średnicka-Tober, D.; Hallmann, E.; Kopczyńska, K.; Zarzyńska, K. The Impact of Organic vs. Conventional Agricultural Practices on Selected Quality Features of Eight Potato Cultivars. Agronomy 2019, 9, 799. [Google Scholar] [CrossRef]
  6. Ierna, A.; Parisi, B.; Melilli, M.G. Overall Quality of “Early” Potato Tubers as Affected by Organic Cultivation. Agronomy 2022, 12, 296. [Google Scholar] [CrossRef]
  7. Lang, T. Sustainable Diets: Hairshirts or a better food future? Development 2014, 57, 240–256. [Google Scholar] [CrossRef]
  8. Baudry, J.; Peneau, S.; Alles, B.; Touvier, M.; Hercberg, S.; Galan, P.; Amiot, M.J.; Lairon, D.; Mejean, C.; Kesse-Guyot, E. Food choice motives when purchasing in organic and conventional consumer clusters: Focus on sustainable concerns (The NutriNet-Sante Cohort Study). Nutr. 2017, 9, 88. [Google Scholar] [CrossRef]
  9. Grunert, K.G. Sustainability in the food sector: A consumer behaviour perspective. Int. J. Food Syst. Dyn. 2011, 2, 207–218. [Google Scholar] [CrossRef]
  10. Caradonia, F.; Ronga, D.; Tava, A.; Francia, E. Plant Biostimulants in Sustainable Potato Production: an Overview. Potato Res. 2022, 65, 83–104. [Google Scholar] [CrossRef]
  11. Ordóñez-Santos, L.E.; Arbones-Maciñeira, E.; Fernández-Perejón, J.; Lombardero-Fernández, M.; Vázquez-Odériz, L.; Romero-Rodríguez, A. Comparison of physicochemical, microscopic and sensory characteristics of ecologically and conventionally grown crops of two cultivars of tomato (Lycopersicon esculentum Mill.). J. Sci. Food Agric. 2009, 89, 743–749. [Google Scholar] [CrossRef]
  12. Pobereżny, J.; Wszelaczyńska, E.; Wichrowska, D.; Jaskulski, D. Content of nitrates in potato tubers depending on the organic matter, soil fertilizer, cultivation simplifications applied and storage. Chilean J. Agric. Res. 2015, 75, 42–49. [Google Scholar] [CrossRef]
  13. Bulgari, R.; Cocetta, G.; Trivellin, A.; Martinetti, L.; Ferrante, A. Prodotti biostimolanti ed effetti sulle colture ortofloricole. Acta Ital. Horts. 2015, 15, 55–63. [Google Scholar]
  14. Jolayemi, O.L.; Malik, A.H.; Ekblad, T.; Fredlund, K.; Olsson, M.E.; Johansson, E. Protein-Based Biostimulants to Enhance Plant Growth–State-of-the-Art and Future Direction with Sugar Beet as an Example. Agronomy 2022, 12, 3211. [Google Scholar] [CrossRef]
  15. Kumari, M.; Swarupa, P.; Kesari, K.K.; Kumar, A. Microbial inoculants as plant biostimulants: A review on risk status. Life, 2023, 13, 12. [Google Scholar] [CrossRef] [PubMed]
  16. Kumar, T.S.; Mithra, R.S.; Shiyal, V.N. Biostimulants for Sustainable Crop Production. In Advances in Agriculture Sciences Chief Editor Dr. RK Naresh AkiNik Publications, New Delhi 2023, 42, 39–65. [Google Scholar] [CrossRef]
  17. Hara, P.  The role of biostimulators in potato cultivation . Pol. Potato 2019, 29, 18–24. [Google Scholar]
  18. Głosek-Sobieraj, M.; Cwalina-Ambroziak, B.; Wierzbowska, J.; Waśkiewicz, A. The influence of biostimulants on the content of P, K, Ca, Mg, and Na in the skin and flesh of potato tubers. Pol. J. Environ. Stud. 2019, 28, 1–8. [Google Scholar] [CrossRef]
  19. Zarzecka, K.; Gugała, M.; Grzywacz, K.; Domański, Ł. Changes in carbohydrate contents in table potato tubers under the influence of soil conditioner UGmax. Appl. Ecol. Environ. Res. 2019, 17, 2315–2324. [Google Scholar] [CrossRef]
  20. Wierzbicka, A.; Pietraszko, M.; Jankowska, J.; Grudzinska, M.; Boguszewska-Mankowska, D. Integrated production of early potato varieties: Cyprian, Michalina and Viviana harvested in two dates. Acta Agrophys. 2016, 23, 129–142. [Google Scholar]
  21. Trawczyński, C. The influence of slow-release nitrogen fertilizer on the yield and quality tubers potato. Fragm. Agron. 2017, 34, 94–102. [Google Scholar]
  22. Shao, Z.; Mwakidoshi, E.R.; Muindi, E.M.; Soratto, R.P.; Ranjan, S.; Padhan, S.R.; Wamukota, A.W.; Sow, S.; Wasonga, D.O.; Nasar, J.; Seleiman, S.M; Gitari, H.I. Synthetic fertilizer application coupled with bioslurry optimizes potato (Solanum tuberosum) growth and yield. Agronomy 2023, 13, 2162. [Google Scholar] [CrossRef]
  23. Łagocka, A.; Kamiński, M.; Cholewiński, M.; Pospolita, W. Health and environmental benefits of utilization of post-fermentation pulp from agricultural biogas plants as a natural fertilizer. Kosmos 2016, 65, 601–607. [Google Scholar]
  24. Średnicka-Tober, D.; Kopczyńska, K.; Góralska-Walczak, R.; Hallmann, E.; Barański, M.; Marszałek, K.; Kazimierczak, R. Are organic certified carrots richer in health-promoting phenolics and carotenoids than the conventionally grown ones? Molecules 2022, 27, 4184. [Google Scholar] [CrossRef] [PubMed]
  25. Lombardo, S.; Pandino, G.; Mauromicale, G. Optimizing Nitrogen Fertilization to Improve Qualitative Performances and Physiological and Yield Responses of Potato (Solanum tuberosum L.). Agronomy 2020, 10, 352. [Google Scholar] [CrossRef]
  26. Wadas, W.; Dziugieł, T. Quality of new potatoes (Solanum tuberosum L.) in response to plant biostimulants application. Agriculture 2020, 10, 265. [Google Scholar] [CrossRef]
  27. Głosek-Sobieraj, M.; Wierzbowska, J.; Cwalina-Ambroziak, B.; Waśkiewicz, A. Protein and sugar content of tubers in potato plants treated with biostimulants. J. Plant Protect. Res. 2022, 370–384. [Google Scholar] [CrossRef]
  28. Zarzecka, K.; Gugała, M.; Domański, Ł. Changes in sugars content in potato tubers under the effect of herbicide and biostimulants. Agron. Sci. 2022, 77, 1. [Google Scholar] [CrossRef]
  29. Göldel, B.; Lemic, D.; Bažok, R. Alternatives to synthetic insecticides in the control of the Colorado potato beetle (Leptinotarsa decemlineata Say) and their environmental benefits. Agriculture. 2020, 10, 611. [Google Scholar] [CrossRef]
  30. Bisht, N.; Chauhan, P.S. Excessive and disproportionate use of chemicals cause soil contamination and nutritional stress. Soil contamination-threats and sustainable solutions. Edit. by Larramendy M.L. and Soloneski S. 2020; 1–10. [Google Scholar] [CrossRef]
  31. Pietraszko, M. Profitability of fungicides application in control of potato late and early blight. Ziemn. Polski 2021, 31, 3–10. [Google Scholar]
  32. Ahmad, U.; Sharma, L. A review of Best Management Practices for potato crop using Precision Agricultural Technologies. Smart Agricultural Technol. 2023, 4, 100220. [Google Scholar] [CrossRef]
  33. Terry, L. A.; Medina, A.; Foukaraki, S.; Whitehead, P. Review of Factors Affecting Fruit and Vegetable Demand. 0438. [Google Scholar]
  34. Alamar, M.C.; Tosetti, R.; Landahl, S.; Bermejo, A.; Terry, L.A. Assuring potato tuber quality during storage: a future perspective. Front. Plant Sci. 2017, 8, 2034. [Google Scholar] [CrossRef] [PubMed]
  35. American Association of Cereal Chemistry (AACC), Approved Method 44-15 A (Moisture-Air Oven Methods). The Association, St. Paul. MN 1993.
  36. Arbeitsgemeinschaft Getreideforschung e.V. 1994. Standard Methoden für Getreide Mehl und Brot, 7th ed. Verlag Moritz Schäfer: Detmold, Germany.
  37. Talburt, W.; Smith, O. Potato processing (No 6648 T3 1987) New York: Van Nostrand Reinhold. 1987, 1–796.
  38. Koch, M.; Naumann, M.; Pawelzik, E. Cracking and fracture properties of potato (Solanum tuberosum L.) tubers and their relation to dry matter, starch, and mineral distribution. J. Sci. Food Agric. 2019, 99, 3149–3156. [Google Scholar] [CrossRef] [PubMed]
  39. Mystkowska, I. The effect of the use of biostimulators on dry matter and starch content of tuber potatoes. Fragm. Agron. 2019, 36, 45–53. [Google Scholar] [CrossRef]
  40. Naeem, M.; Caliskan, M. Comparison of methods for dry matter content determination in potato using multi-environments field data and stability statistics. Turkish J. Field Crop. 2020, 25, 197–207. [Google Scholar] [CrossRef]
  41. Cieciura-Olczyk, M. Potato yielding on the effect of organic, natural and nitrogen fertilization. Fragm. Agron. 2019, 36, 7–17. [Google Scholar] [CrossRef]
  42. Djaman, K.; Sanogo, S.; Koudahe, K.; Allen, S.; Saibou, A.; Essah, S. Characteristics of organically grown compared to conventionally grown potato and the processed products: A review. Sustainability. 2021, 13, 6289. [Google Scholar] [CrossRef]
  43. Manolov, I.; Neshev, N.; Chalova, V. Tuber quality parameters of potato varieties depend on potassium fertilizer rate and source. Agric Sci Procedia. 2016, 10, 63–66. [Google Scholar] [CrossRef]
  44. Bărăscu, N.; Ianoşi, M.; Duda, M.M.; Muntean, E. The NPK fertilization effects of tubers starch, dry matter and reducing sugar content. Sci. Papers. Series A. Agron. 2016, 59, 194–199. [Google Scholar] [CrossRef]
  45. Koch, M.; Naumann, M.; Pawelzik, E.; Gransee, A.; Thiel, H. The importance of nutrient management for potato production Part I: Plant nutrition and yield. Potato Res. 2020, 63, 97–119. [Google Scholar] [CrossRef]
  46. Torabian, S.; Farhangi-Abriz, S.; Qin, R.; Noulas, C.; Sathuvalli, V.; Charlton, B.; Loka, D. A. Potassium: A vital macronutrient in potato production - A review. Agronomy 2021, 11, 543. [Google Scholar] [CrossRef]
  47. Devi, S.; Sharma, P.K.; Trivedi, J.; Kumar, L.; Shrivastava, S.A.; Kharshan, P.G.M. Effect of different levels of NPK fertilizer on quality parameters of potato (Solanum tuberosum L.). Pharm. Innov. J. 2023, 12, 5028–5032. [Google Scholar]
  48. Li, H.; Yang, X.; Kang, Y.; Li, W.; Li, H.; Qin, S. Effects of nitrogen, phosphorus and potassium combined fertilisation on the dry matter accumulation, distribution and yield of potato under ridge and furrow film mulch cropping. Potato Res. 2023, 66, 851–8718. [Google Scholar] [CrossRef]
  49. Kelling, K.A.; Stevenson, W.R.; Speth, P.E.; James, R.V. Interactive effects of fumigation and fungicides on potato response to nitrogen rate or timing. Am. J. Potato Res. 2016, 93, 533–542. [Google Scholar] [CrossRef]
  50. Bombik, A.; Rymuza, K.; Markowska, M.; Stankiewicz, C. Variability analysis of selected quantitative characteristics in edible potato varieties. Acta Sci. Pol. Agric. 2007, 6, 5–15. [Google Scholar]
  51. Milroy, S.P.; Wang, P.; Sadras, V.O. Defining upper limits of nitrogen uptake and nitrogen use efficiency of potato in response to crop N supply. Field Crops Res. 2019, 239, 38–46. [Google Scholar] [CrossRef]
  52. Zarzecka, K.; Gugała, M.; Milewska, A. Effect of soil fertilizer UGmax on potato yielding and plant health. Prog. Plant Prot. 2011, 51, 153–157. [Google Scholar]
  53. Sosnowski, J. Reaction of Dactylis glomerata L., Festuca pratensis Huds. and Lolium perenne L. to microbiological fertilizer and mineral fertilization. Acta Sci. Pol. Agric. 2012, 11, 91–98. [Google Scholar]
  54. Zarzecka, K.; Gugała, M. Performance of one potato plant as influenced by soil conditioner UGmax. J. Ecol. Eng. 2013, 14, 45–49. [Google Scholar] [CrossRef]
  55. Zarzecka, K.; Gugała, M.; Dołęga, H.; Zadrożniak, B. Modification of chemical composition of potato tubers as affected by insecticides. Fragm. Agron. 2014, 31, 129–137. [Google Scholar]
  56. Sayuk, O.; Plotnytska, N.; Troyachenko, R.; Ovezmyradova, O. Effect of fungicides on mycosis progression and potato yields. J. Agric. Sci. 2022, 33, 139–145. [Google Scholar] [CrossRef]
  57. Reyniers, S.; Ooms, N.; Gomand, S. V.; Delcour, J. A. What makes starch from potato (Solanum tuberosum L.) tubers unique: A review. Compr. Rev. Food Sci. Food Saf. 2020, 19, 2588–2612. [Google Scholar] [CrossRef] [PubMed]
  58. Dupuis, J.H.; Liu, Q. Potato Starch: a Review of Physicochemical, Functional and Nutritional Properties. Am. J. Potato Res. 2019, 96, 127–138. [Google Scholar] [CrossRef]
  59. Zarzecka, K.; Gugała, M.; Mystkowska, I.; Sikorska, A. Changes in dry weight and starch content in potato under the effect of herbicides and biostimulants. Plant, Soil and Environ. 2021, 67, 202–207. [Google Scholar] [CrossRef]
  60. Demidenko, G.A.; Turygina, O.V.; Martynova, O.V. The quality of potato tubers and yield by using fertilizer systems. In: IOP Conference Series: Earth Environ. Sci. 981, 2022, 022059. [CrossRef]
  61. Mareček, J.; Frančáková, H.; Bojňanská, T.; Fikselová, M.; Mendelová, A.; Ivanišová, E. Carbohydrates in varieties of stored potatoes and influence of storage on quality of fried products. J. Microbiol. Biotechnol. Food Sci. 2013, 2, 1744–1753. [Google Scholar]
  62. Leonel, M.; do Carmo, E.L.; Fernandes, A.M.; Soratto, R.P.; Ebúrneo, J.A.M.; Garcia, E.L.; dos Santos, T.P.R. Chemical composition of potato tubers: the effect of cultivars and growth conditions. J. Food Sci. Technol. 2017, 54, 2372–2378. [Google Scholar] [CrossRef] [PubMed]
  63. Pszczółkowski, P.; Sawicka, B; Danilčenko, H. Effect of biopreparates on the dry matter, starching and vitamin C in potato tubers. Agron. Sci. 2019, 74, 47–56. [Google Scholar] [CrossRef]
  64. Liszka-Skoczylas, M. Effect of potato plants (Solanum tuberosum L.) fertilization on content and quality of starch in tubers. Food. Sci. Technol. Qual. 2020, 27, 31–46. [Google Scholar] [CrossRef]
  65. Yu, Y.; Han, F.; Huang, Y.; Xiao, L.; Cao, S.; Liu, Z.; Han, L. Physicochemical properties and molecular structure of starches from potato cultivars of different tuber colors. Starch-Stärke. 2022, 74, 2200096. [Google Scholar] [CrossRef]
  66. Grudzińska, M.; Boguszewska-Mańkowska, D; Zarzyńska K. Drought stress during the growing season: Changes in reducing sugars, starch content and respiration rate during storage of two potato cultivars differing in drought sensitivity. J. Agron. Crop Sci. 2022, 208, 609–620. [Google Scholar] [CrossRef]
  67. Turska, E.; Wielogórska, G.; Rymuza, K. The influence of some agricultural factors on the quality of potato tubers. Fragm. Agron. 2009, 26, 156–161. [Google Scholar]
  68. Krzysztofik, B. Impact of soil cultivation on the extent of potato tuber size equalisation and starch yield. Acta Agrophys. 2009, 14, 355–365. [Google Scholar]
  69. Murawska, B.; Spychaj-Fabisiak, E.; Majcherczak, E.; Kozera, W.; Gaj, R.; Rozanski, S.; Jachymska, J. Importance of catch crops end microelements in potato cultivation. Zesz. Probl. Postęp. Nauk Rol. 2015, 580, 75–83. [Google Scholar]
  70. Koireng, R.J.; Singh, L.N.; Devi, K.P. Integration of different sources of organic manure and micro-nutrients on growth, yield and quality of potato (Solanum tuberosum L.) grown under new alluvial soil condition. Indian J. Agric. Res. 2018, 52, 172–176. [Google Scholar] [CrossRef]
  71. Sawicka, B.; Danilčenko, H.; Jariene, E.; Krochmal-Marczak, B. The phenotypic changeability of features of foreign cultivars of the potato in the Poland. Zesz. Probl. Post. Nauk Rol. 2009, 542, 447–463. [Google Scholar] [CrossRef]
  72. El-Zehery, T.M. Incorporated use impact of organic, bio and mineral fertilizers on potato (Solanum tuberosum L) productivity and quality. J. Soil Sci. Agric. Eng. 2019, 10, 857–865. [Google Scholar] [CrossRef]
  73. Hlisnikovský, L; Menšík, L. ; Kunzová, E. The effect of soil-climate conditions, farmyard manure and mineral fertilizers on potato yield and soil chemical parameters. Plants 2021, 10, 2473. [Google Scholar] [CrossRef]
  74. Baranowska, A. Influence of pluvio-thermal conditions, growth biostimulators and herbicide on dry matter content and starch in edible potato tubers. Appl Ecol Environ Res. 2019, 17, 1547–1557. [Google Scholar] [CrossRef]
  75. Maciejewski, T.; Szukała, J.; Jarosz, A. Influence of biostymulator Asahi SL i Atonik SL on qualitative tubers of potatoes. J. Res App. Agric. Eng. 2007, 52, 109–112. [Google Scholar]
  76. Pereira, R. V.; Filgueiras, C. C.; Dória, J.; Peñaflor, M. F. G.; Willett, D. S. The effects of biostimulants on induced plant defense. Front agron. 2021, 3, 630596. [Google Scholar] [CrossRef]
  77. Monteiro, E.; Gonçalves, B.; Cortez, I.; Castro, I. The Role of Biostimulants as Alleviators of Biotic and Abiotic Stresses in Grapevine: A Review. Plants 2022, 11, 396. [Google Scholar] [CrossRef]
  78. Shailbala, M.; Pundhir, V.S. Integration of host resistance and fungicides for management of late blight of potato. Potato J. 2008, 35, 97–99. [Google Scholar]
  79. Gugala, M.; Zarzecka, K.; Dolega, H.; Baranowska, A. Efficacy of herbicides in potato crop. Ann. Univ. Mariae Curie-Sklodowska Sect. E. Agricultura 2012, 67, 45–51. [Google Scholar]
  80. El-Ganainy, S.M.; Abbas, A.O.; El-Hefny, D.; Abdallah, I.S. Efficacy of the New Herbicide Clomazone Against Weeds in Potato (Solanum tuberosum L.), Its Effect On Quality and Its Residues in Tubers and Soil. Gesunde Pflanz. 2023, 75, 67–75. [Google Scholar] [CrossRef]
  81. Kaliyeva, L.T.; Kushenbekova, A.K.; Tulegenova, D.K.; Kuanaliyeva, M.K. Influence of insecticides on the harvest and quality of potato stubs in the conditions of West Kazakhstan region. In: IOP Conference Series: Earth Environ. Sci. 2022, 979, 012041. [Google Scholar] [CrossRef]
  82. Rady, A.; Guyer, D.; Lu, R. Evaluation of sugar content of potatoes using hyperspectral imaging. Food Bioproc. Tech. 2015, 8, 995–1010. [Google Scholar] [CrossRef]
  83. Mona, E.E.; Ibrahim, S.A.; Manal, F.M. Combined effect of NPK levels and foliar nutritional compounds on growth and yield parameters of potato plants (Solanum tuberosum L.). Afr. J. Microbiol. Res. 2012, 6, 5100–5109. [Google Scholar] [CrossRef]
  84. AbdEl-Nabi, H.M.E.; El-Gamily, E.; Keshta, N.A. Response of potato plants to organic, bio and mineral fertilization. J. Plant Prod. 2016, 7, 861–867. [Google Scholar] [CrossRef]
  85. Jatav, A.; Kushwah, S.; Naruka, I. Performance of potato varieties for growth, yield, quality and economics under different levels of nitrogen. Adva. Res. 2017, 9, 1–9. [Google Scholar] [CrossRef]
  86. El-Ghamriny, EA.; Saeed, MNA. Effect of irrigation intervals, Mineral fertilizers and biofertilizers on potato plants grown under sandy soil conditions. I-Growth, water relations, chemical contents and leaf anatomy. Egypt. J. Appl. Sci. 2007, 22, 480–511. [Google Scholar]
  87. Haider, M. W.; Ayyub, C. M.; Pervez, M. A.; Asad, H. U.; Manan, A.; Raza, S. A.; Ashraf, I. Impact of foliar application of seaweed extract on growth, yield and quality of potato (Solanum tuberosum L.). Soil & Environ., 2012, 31, 157–162. [Google Scholar]
  88. Zarzecka, K.; Gugała, M. The effect of herbicides and biostimulants on sugars content in potato tubers. Plant Soil Environ. 2018, 64, 82–87. [Google Scholar] [CrossRef]
  89. Trawczyński, C. The impact of amino acid-based biostimulant – tecamin – on the yield and quality of potatoes. Pol. Potato. 2014, 3, 29–34. [Google Scholar]
  90. Karak, S.; Thapa, U.; Hansda, N. N. Impact of Biostimulant on Growth, Yield and Quality of Potato (Solanum tuberosum L.). Biological Forum – An Internationa Journal 2023, 15, 297–302. [Google Scholar] [CrossRef]
  91. Ezzat, A.S.; Asfour, H. El-S.; Tolba M.H. Improving yield and quality of some new potato varieties in winter plantation using organic stimulators. J. Plant Prod. 2011, 2, 653–671. [Google Scholar] [CrossRef]
  92. Arafa, A.A.; Hussien, S.F.M. Response of tuber yield quantity and quality of potato plants and its economic consideration to certain bioregulators or effective microorganisms under potassium fertilization. J. Plant Prod. 2012, 3, 131–150. [Google Scholar] [CrossRef]
  93. Nardi, S.; Schiavon, M.; Francioso, O. Chemical structure and biological activity of humic substances define their role as plant growth promoters. Mol. 2021, 26, 2256. [Google Scholar] [CrossRef] [PubMed]
  94. Thompson, A.L.; Love, S.L.; Sowokinos, J.R.; Thornton, M.K.; Shock, C.C. Review of the sugar end disorder of potato (Solanum tuberosum, L.). Am. J. Potato Res. 2008, 85, 375–386. [Google Scholar] [CrossRef]
  95. Kumar, D.; Singh, B. P.; Kumar, P. An overview of the factors affecting sugar content of potatoes. Ann. Appl. Biol. 2004, 145, 247–256. [Google Scholar] [CrossRef]
  96. Zarzecka, K.; Gugała, M.; Mystkowska, I.; Baranowska, A.; Sikorska, A. Effect of herbicides on the content dry matter and sugars in edible potato tubers. Rom. Agric. Res. 2017, 34, 371–375. [Google Scholar]
  97. Baranowska, A.; Mystkowska, I. The effect of growth biostimulators and herbicide on the content of sugars in tubers of edible potato (Solanum tuberosum L.). Appl Ecol Environ Res. 2019, 17, 3457–3468. [Google Scholar] [CrossRef]
  98. Kogovšek, P.; Pompe-Novak, M.; Petek, M.; Fragner, L.; Weckwerth, W.; Gruden, K. Primary metabolism, phenylpropanoids and antioxidant pathways are regulated in potato as a response to Potato virus Y infection. PLoS One 2016, 11, e0146135. [Google Scholar] [CrossRef] [PubMed]
  99. Křížkovská, B.; Viktorova, J.; Lipov, J. Approved genetically modified potatoes (Solanum tuberosum) for improved stress resistance and food safety. J. Agric. Food Chem. 2022, 70, 11833–11843. [Google Scholar] [CrossRef] [PubMed]
  100. Islam, M.M.; Naznin, S.; Naznin, A.; Uddin, M.N.; Amin, M.N.; Rahman, M.M.; Tipu, M.M.H.; Alsuhaibani, A.M.; Gaber, A.; Ahmed, S. Dry matter, starch content, reducing sugar, color and crispiness are key parameters of potatoes required for chip processing. Horticulturae 2022, 8, 362. [Google Scholar] [CrossRef]
  101. Pandey, V.; Kumar, V. A.; Brar, A. Biochemical behaviour of potato tubers during storage. Chem. Sci. Rev. Lett. 2017, 6, 1818–1822. [Google Scholar]
  102. Siddiqui, S.; Ahmed, N.; Phogat, N. Potato Starch as Affected by Varieties, Storage Treatments and Conditions of Tubers. Starch - Evolution and Recent Advances. In M. Ochubiojo Emeje (Ed.) Biochemistry. IntechOpen. 2021. [CrossRef]
  103. Sahin, U.; Kiziloglu, F. M.; Angin, I. Changes in Some Quality Properties after Different Storage Periods of Potato Tubers Grown under Well and Deficit Irrigation Conditions. Bulg. J. Agric. Sci. 2006, 12, 673–682. [Google Scholar]
  104. Poberezny, J.; Wszelaczynska, E. Effect of bioelements (N, K, Mg) and long-term storage of potato tubers on quantitative and qualitative losses Part II. Content of dry matter and starch. J. Elem. 2011, 16. [Google Scholar] [CrossRef]
  105. Amjad, A.; Javed, MS.; Hameed, A.; Hussain, M.; Ismail, A. Changes in sugar contents and invertase activity during low temperature storage of various chipping potato cultivars. Food Sci. Technol. 2019, 40, 340–345. [Google Scholar] [CrossRef]
  106. Zhang, Y.; Zhen-Xiang, L. Effects of storage temperature and duration on carbohydrate metabolism and physicochemical properties of potato tubers. J Food Nutr. 2021, 7, 1–8. [Google Scholar] [CrossRef]
  107. Özcan, S.; Șanlı, A.; Ok, F. Z. (2019). Determination of storage responses and quality changes of some potato (Solanum tuberosum L.) cultivars during storage. TURJAF, 2019, 7, 59–66. [Google Scholar]
  108. Wszelaczyńska, E.; Pobereżny, J.; Gościnna, K.; Szczepanek, M.; Tomaszewska-Sowa, M.; Lemańczyk, G.; Lisiecki, K.; Trawczyński, C.; Boguszewska-Mańkowska, D.; Pietraszko, M. Determination of the effect of abiotic stress on the oxidative potential of edible potato tubers. Sci. Rep. 2023, 13, 9999. [Google Scholar] [CrossRef]
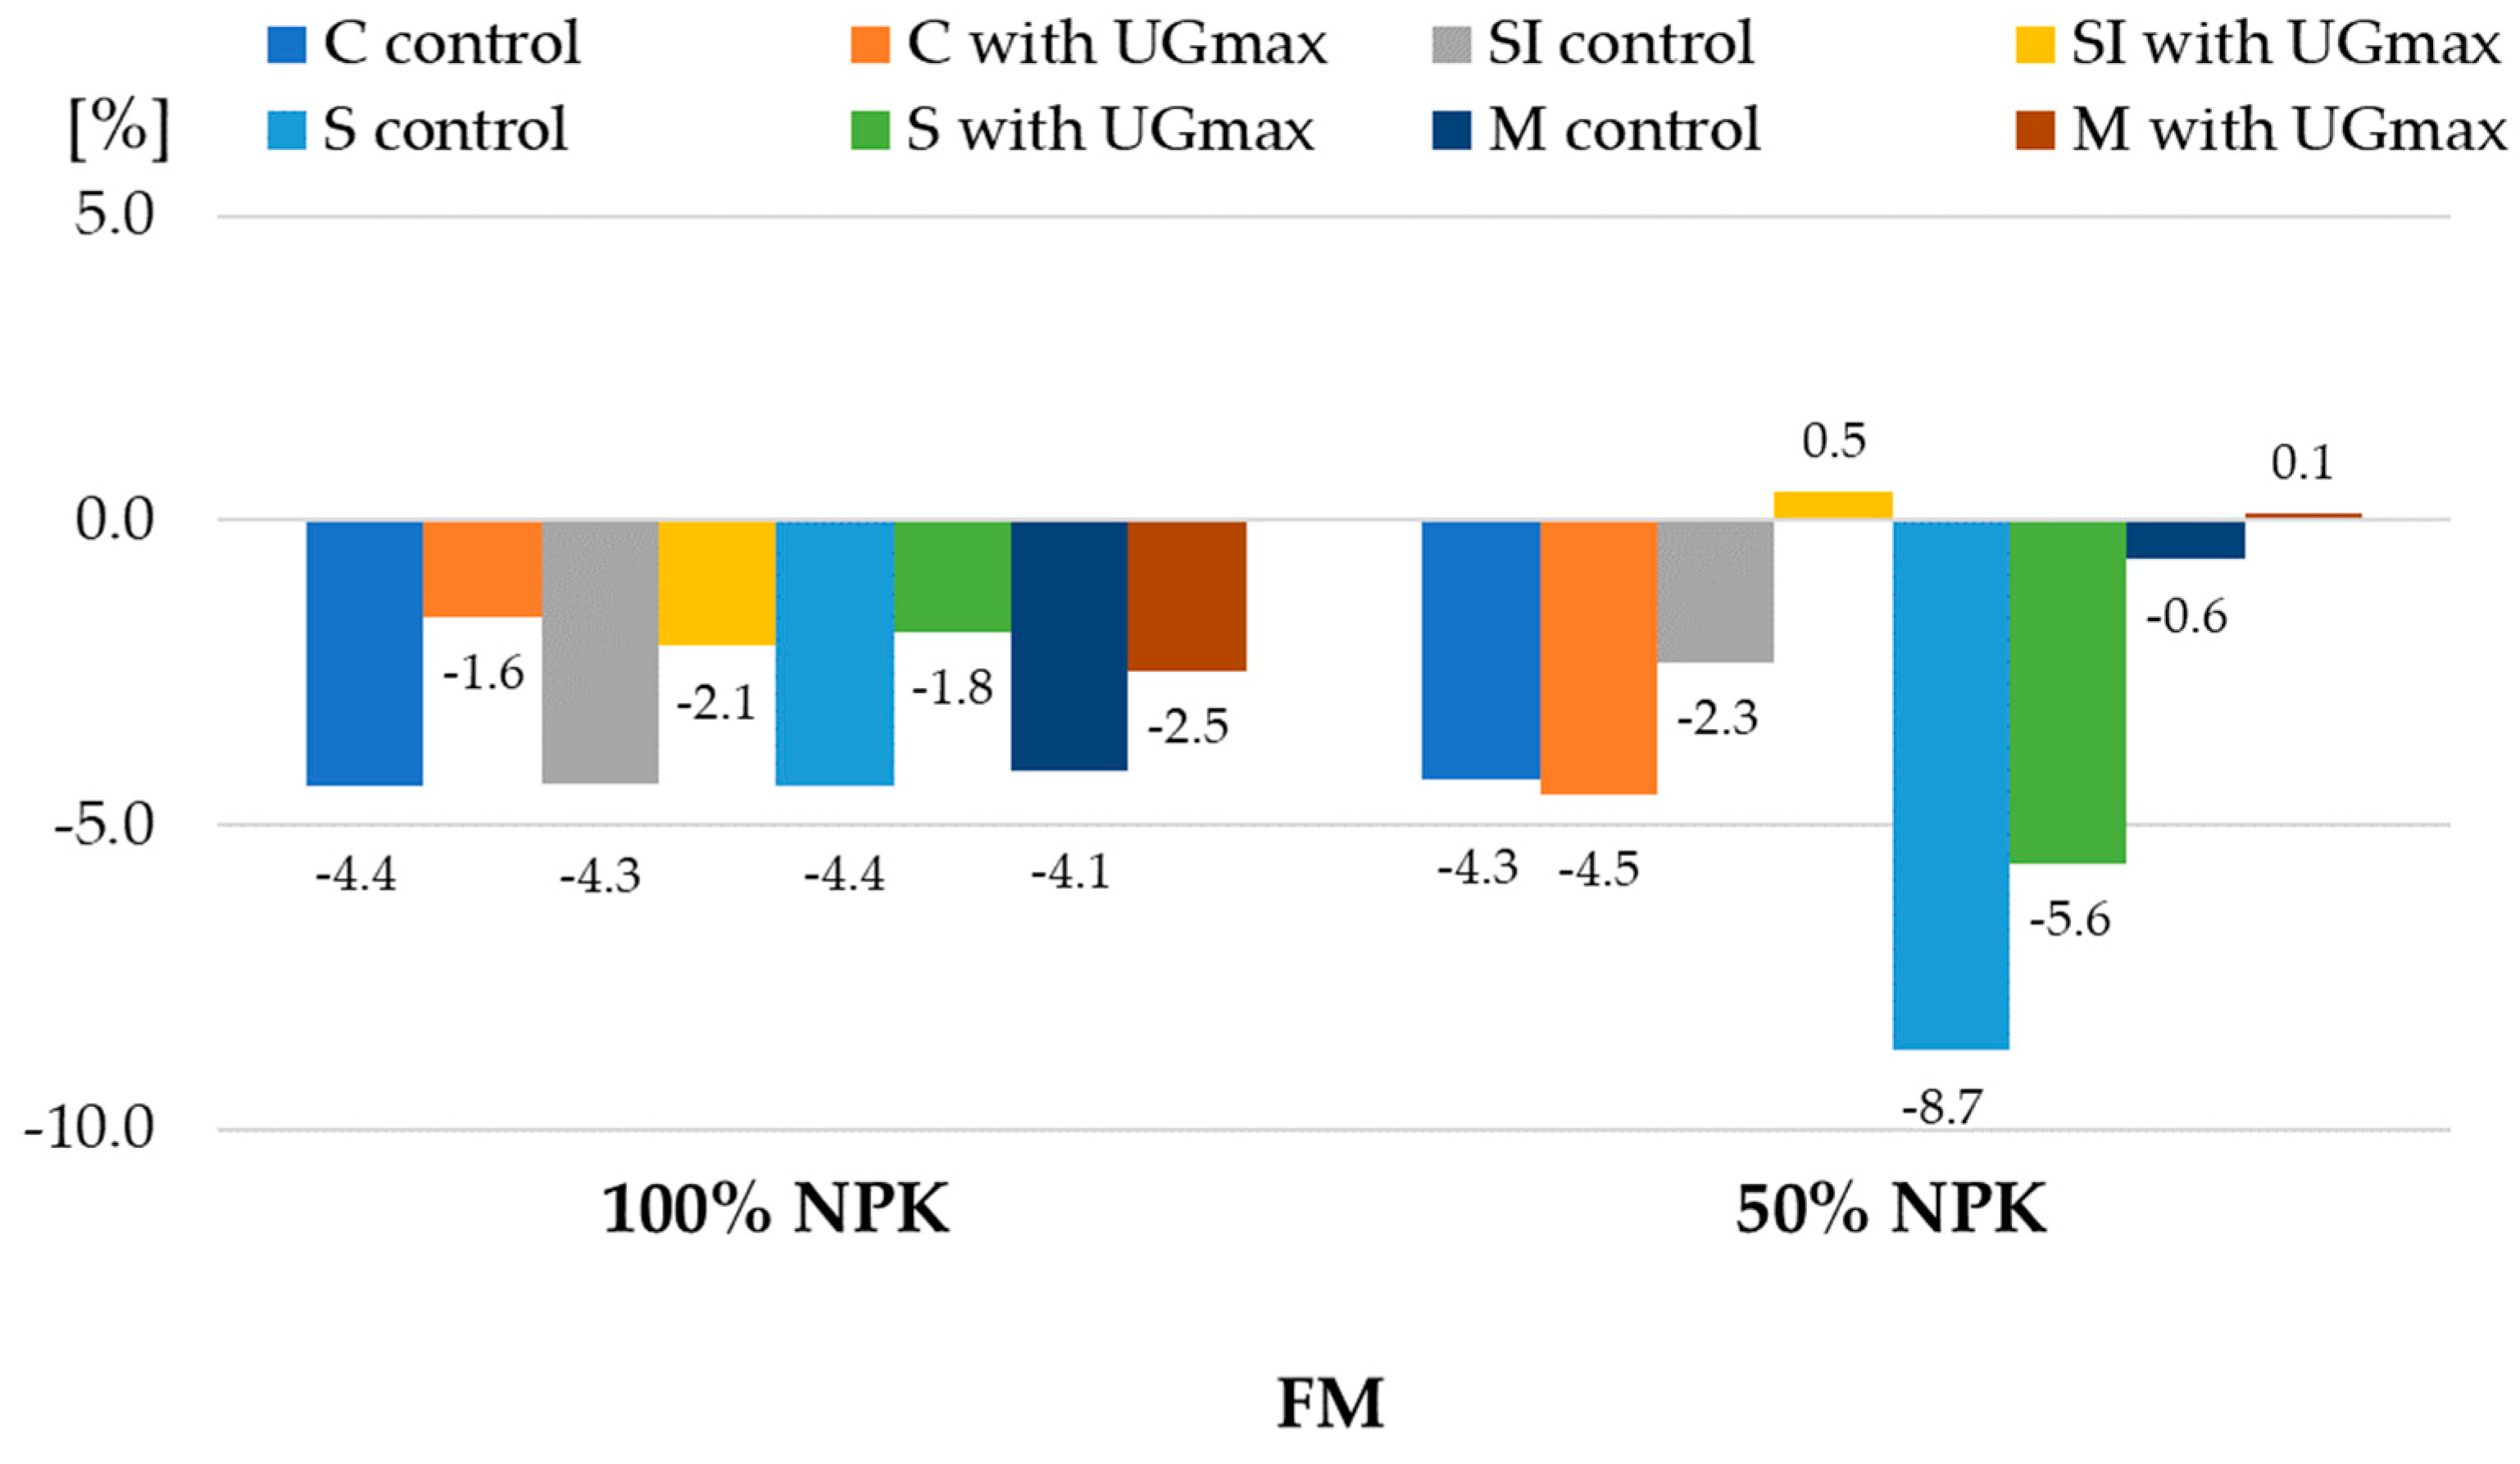
Figure 1. Percentage changes of dry matter content depending on the applied organic matter, mineral fertilization and use of biostimulant after storage. OM - organic matter, C - control, SI - stubble intercrop, S - straw, M – manure.
Preprints 97295 g001
Figure 2. Percentage changes of dry matter content depending on the use of chemical protection, organic matter and biostimulant after storage. OM - organic matter, FP - full protection, NH - no herbicides, NF - no fungicides, NI - no insecticides, CO - control, SI - stubble intercrop, S - straw, M – manure.
Preprints 97295 g002
Figure 3. Percentage changes of starch content depending on the applied organic matter, mineral fertilization and use of biostimulant after storage. OM - organic matter, C - control, SI - stubble intercrop, S - straw, M – manure.
Preprints 97295 g003
Figure 4. Percentage changes of starch content depending on the use of chemical protection, organic matter and biostimulant after storage. OM - organic matter, FP - full protection, NH - no herbicides, NF - no fungicides, NI - no insecticides, CO - control, SI - stubble intercrop, S - straw, M - manure.
Preprints 97295 g004
Figure 5. Percentage changes of total sugars content depending on the applied organic matter, mineral fertilization and use of biostimulant after storage. OM - organic matter, C - control, SI - stubble intercrop, S - straw, M – manure.
Preprints 97295 g005
Figure 6. Percentage changes of reducing sugars content depending on the applied organic matter, mineral fertilization and use of biostimulant after storage. OM - organic matter, C - control, SI - stubble intercrop, S - straw, M – manure.
Preprints 97295 g006
Figure 7. Percentage changes of total sugars content depending on the use of chemical protection, organic matter and biostimulant after storage. OM - organic matter, FP - full protection, NH - no herbicides, NF - no fungicides, NI - no insecticides, CO - control, SI - stubble intercrop, S - straw, M – manure.
Preprints 97295 g007
Figure 8. Percentage changes of reducing sugars content depending on the use of chemical protection, organic matter and biostimulant after storage. OM - organic matter, FP - full protection, NH - no herbicides, NF - no fungicides, NI - no insecticides, CO - control, SI - stubble intercrop, S - straw, M – manure.
Preprints 97295 g008
Table 1. Dry matter [g kg-1] and starch content [g kg-1 f. m.] in potato tubers after harvest depending on applied organic matter, mineral fertilization and use of biostimulant [Experiment I].
1Experiment factors Dry matter Starch
MF (NPK)
OM SC 100% 50% Mean 100% 50% Mean
CO control 149.1±2.9 145.2±2.8 147.2±3.2 96.7±2.3 91.3±1.2 94.0±3.3
with
UGmax
153.0±3.4 152.9±2.8 153.0±2.8 103.7±2.4 100.2±2.6 102.0±2.9
Mean 151.0±3.6 149.0±4.8 150.0±4.2 100.2±4.4 95.8±5.2 98.0±5.1
SI control 153.3±2.9 146.0±4.1 149.7±5.1 100.4±1.6 99.0±3.0 99.7±2.2
with
UGmax
163.2±2.5 150.0±3.3 156.6±7.6 114.2±2.4 109.6±3.2 111.9±3.6
Mean 158.2±5.9 148.0±4.0 153.1±7.2 107.3±7.8 104.3±6.5 105.8±7.0
S control 150.7±2.9 148.5±3.0 149.6±2.9 98.1±1.9 96.0±0.9 97.0±1.7
with
UGmax
157.6±2.9 145.9±1.2 151.8±6.7 108.5±2.3 111.7±3.0 110.1±3.0
Mean 154.1±4.6 147.2±2.5 150.7±5.1 103.3±6.0 106.3±8.8 104.8±7.2
M control 157.5±3.1 139.92.3 148.7±9.9 104.1±1.1 97.4±1.9 100.7±3.9
with
UGmax
173.4±1.7 145.9±1.2 159.7±15.1 124.6±3.2 108.8±1.7 116.7±9.0
Mean 165.4±9.0 142.9±3.7 154.2±13.5 114.3±11.5 103.1±6.5 108.7±10.6
Mean control 152.7±4.1 144.9±4.2 148.8±5.7 99.8±3.3 95.9±3.4 97.9±3.8
with
UGmax
161.8±8.3 148.7±3.7 155.2±9.2 112.7±8.4 107.6±5.1 110.2±7.3
Mean 157.2±7.9 146.8±4.3 152.0±8.2 106.3±9.1 101.7±7.3 104.0±8.5
2LSD α=0.05 A - 6.83; B - 3.71; C - 4.42 A - 6.37; B - 4.80; C - 3.39
A/B - 3.85; A/C - 3.26; B/C - 2.46; A/B/C - 2.58 A/B - 3.47; A/C - 2.57; B/C - n. s.;
A/B/C - 2.62
1Experiment factors: OM - organic matter [A], MF - mineral fertilization [B], SC - soil conditioner [C]. CO - control, SI - stubble intercrop, S - straw, M - manure. 2LSD - least significant difference, n. s.- no significant.
Table 2. Dry matter [g kg] and starch [g kg-1 f. m.] content in potato tubers after harvest depending on the applied chemical protection, organic matter and use of biostimulant [Experiment II].
Dry matter Starch
1Experiment factors OM
ChP SC CO SI S M Mean CO SI S M Mean
FP control 149.1±16.8 153.3±2.9 150.7±2.9 157.5±3.1 152.7±4.1 96.7±10.5 100.4±1.6 98.1±1.9 104.1±1.1 99.8±3.3
with UGmax 153.0±3.4 163.2±2.5 157.6±2.9 173.4±1.7 161.8±8.3 103.7±2.4 114.2±2.4 108.5±2.3 124.6±3.2 112.7±8.4
Mean 151.0±3.6 158.2±5.9 154.1±4.6 165.4±9.0 157.2±7.9 100.2±4.4 107.3±7.8 103.3±6.0 114.3±11.5 106.3±9.1
NH control 146.4±3.3 150.3±2.9 147.8±3.0 154.3±3.3 149.7±4.1 96.0±2.0 99.8±1.3 97.4±1.6 103.5±1.2 99.2±3.2
with UGmax 147.0±3.5 151.5±2.6 148.7±3.1 156.1±2.0 150.8±4.3 100.5±0.9 107.4±1.8 103.5±1.2 114.2±2.9 106.4±5.6
Mean 146.7±3.1 150.9±2.6 148.3±2.8 155.2±2.6 150.3±4.2 98.3±2.8 103.6±4.4 100.4±3.6 108.9±6.2 102.8±5.8
NF control 132.4±2.4 135±1.4 133.2±1.9 137.5±0.5 134.5±2.5 92.5±1.2 93.51±.8 92.5±1.4 94.6±2.6 93.3±1.8
with UGmax 134.9±3.0 140.1±2.6 137.0±2.6 145.2±3.4 139.3±4.8 93.5±3.2 94.6±3.2 93.6±3.2 95.7±3.4 94.3±2.9
Mean 133.6±2.8 137.5±3.3 135.1±2.9 141.4±4.8 136.9±4.6 93.0±2.2 94.1±2.4 93.1±2.3 95.1±2.8 93.8±2.4
NI control 143.6±3.8 147.4±2.9 145.0±3.2 151.1±3.6 146.8±4.1 95.4±2.7 99.2±1.6 96.8±2.1 103.0±1.4 98.6±3.4
with UGmax 140.9±3.6 139.8±2.8 139.9±3.2 138.7±2.3 139.8±2.7 97.4±3.0 100.6±1.7 98.5±2.2 103.8±2.6 100.1±3.3
Mean 142.3±3.7 143.6±4.9 142.5±4.0 144.9±7.3 143.3±4.9 96.4±2.8 99.9±1.7 97.7±2.1 103.4±1.9 99.3±3.4
Mean control 142.9±7.1 146.5±7.6 144.2±7.4 150.1±8.3 145.9±7.9 95.2±2.5 98.2±3.2 96.2±2.7 101.3±4.3 97.7±3.9
with UGmax 143.9±7.6 148.7±10 145.8±8.8 153.3±13.8 147.9±10.7 98.8±4.5 104.2±7.9 101.0±6.1 109.6±11.7 103.4±8.8
Mean 143.4±7.3 147.6±8.9 145.0±8.0 151.7±11.3 146.9±9.4 97.0±4.0 101.2±6.6 98.6±5.2 105.4±9.6 100.6±7.3
2LSD α=0.05 A - 3.20; B - 5.16; C - 3.81 A - 3.32; B - 3.84; C - 2.75
A/B - 4.65; A/C - n. s.; B/C - 3.77;
A/B/C - 2.65
A/B - 3.34; A/C - 2.85; B/C - 3.11;
A/B/C - 3.02
1Experiment factors: ChP - chemical protection [A], OM - organic matter [B], SC - soil conditioner [C]. FP - full protection, NH - no herbicides, NF - no fungicides, NI - no insecticides, CO - control, SI - stubble intercrop, S - straw, M - manure. 2LSD - least significant difference, n. s.- no significant.
Table 3. The correlation coefficients (r) according to the rank order of Spearman between the studied parameters.
PARAMETERS Starch Total sugars Reducing sugars
Experiment 1Assesment date


Dry matter I ah **0.509
**0.667

as
II ah **0.716
**0.884
**-0.551
**-0.774
*-0.262
**-0.426
as
Starch I ah **-0.569
**-0.561
**-0.407
as
II ah **0.587
**-0.768
**-0.449
**-0.364
as
Total sugars I ah *0.354
**0.521
as
II ah
as
**0.418
**0.600
1ah - after harvest, as - after storage, Significance levels are represented as ‘*’p ≤ 0.05; ‘**’p ≤ 0.01.
Table 4. Total [g kg-1 f. m.] and reducing content [g kg-1 f. m.] in potato tubers after harvest depending on applied organic matter, mineral fertilization and use of biostimulant [Experiment I].
1Experiment factors Total sugars Reducing sugars
MF (NPK)
OM SC 100% 50% Mean 100% 50% Mean
CO control 5.77±0.47 5.19±0.44 5.48±0.51 2.88±0.15 2.07±0.06 2.48±0.47
with
UGmax
5.13±0.06 4.77±0.50 4.95±0.38 1.31±0.02 0.98±0.10 1.15±0.68
Mean 4.73±0.46 4.98±0.48 4.86±0.51 1.63±1.09 1.04±0.57 1.34±0.88
SI control 5.06±0.12 5.19±0.44 5.13±0.29 2.10±0.10 1.28±0.47 1.69±0.64
with
UGmax
4.39±0.06 4.77±0.50 4.58±0.37 1.16±0.30 1.01±0.06 1.09±0.45
Mean 4.73±0.36 4.98±0.48 4.86±0.42 1.63±0.67 1.04±0.30 1.34±0.58
S control 4.92±0.25 4.61±0.42 4.76±0.35 1.99±0.10 1.29±0.06 1.64±0.41
with
UGmax
4.26±0.06 4.21±0.01 4.23±0.05 1.75±0.12 1.11±0.20 1.43±0.39
Mean 4.92±0.40 4.61±0.35 4.76±0.37 1.99±0.16 1.29±0.16 1.64±0.40
M control 4.35±0.59 4.210.17 4.28±0.40 1.83±0.06 1.48±0.26 1.65±0.25
with
UGmax
3.65±0.12 3.48±0.10 3.56±0.13 1.32±0.19 0.77±0.01 1.05±0.36
Mean 4.00±0.54 3.84±0.40 3.92±0.46 1.58±0.34 1.12±0.42 1.35±0.43
Mean control 5.02±0.62 4.80±0.55 4.91±0.51 2.20±0.42 1.53±0.44 1.86±0.47
with
UGmax
4.36±0.55 4.31±0.62 4.33±0.38 1.39±0.60 0.97±0.15 1.18±0.20
Mean 4.69±0.67 4.55±0.63 4.62±0.64 1.79±0.25 1.25±0.20 1.52±0.61
2LSD α=0.05 A – 0.369; B – n. s.; C – 0.339 A – 0.499; B – 0.320; C – 0.307
A/B – n. s.; A/C – n. s.; B/C – n. s.;
A/B/C – n. s.
A/B – n. s.; A/C – 0.355; B/C – n. s.;
A/B/C – n. s.
1Experiment factors: OM - organic matter [A], MF - mineral fertilization [B], SC - soil conditioner [C]. CO - control, SI - stubble intercrop, S - straw, M - manure. 2LSD - least significant difference, n. s.- no significant.
Table 5. Total [g kg-1 f. m.] and reducing content [g kg-1 f. m.] content in potato tubers after harvest depending on the applied chemical protection, organic matter and use of biostimulant [Experiment II].
Total sugars Reducing sugars
1Experiment factors OM
ChP SC CO SI S M Mean CO SI S M Mean
FP control 5.77±0.49 5.06±0.14 4.91±0.24 4.35±0.62 5.02±0.64 2.88±0.04 2.10±0.06 1.99±0.09 1.83±0.06 2.20±0.43
with UGmax 5.13±0.03 4.39±0.07 4.26±0.04 3.65±0.13 4.36±0.55 1.31±0.06 1.16±0.08 1.75±0.11 1.32±0.11 1.39±0.66
Mean 5.45±0.47 4.73±0.38 4.59±0.39 4.00±0.56 4.69±0.68 2.10±0.18 1.63±0.67 1.37±0.16 1.58±0.59 1.67±0.71
NH control 5.78±0.42 4.76±0.20 4.77±0.22 4.61±0.19 4.98±0.54 3.13±0.13 2.92±0.14 2.53±0.02 2.19±0.01 2.69±0.39
with UGmax 5.32±0.49 5.02±0.19 4.67±0.34 3.84±0.34 4.71±0.65 1.69±0.06 1.62±0.23 1.66±0.17 1.27±0.22 1.56±0.30
Mean 5.55±0.48 4.89±0.23 4.72±0.26 4.23±0.49 4.84±0.60 2.41±1.08 2.27±0.67 2.09±0.16 1.73±0.59 2.12±0.67
NF control 6.04±0.72 5.66±0.15 5.35±0.37 5.27±0.29 5.58±0.49 2.74±0.10 3.40±0.21 2.57±0.35 2.21±0.23 2.73±0.55
with UGmax 5.49±0.46 5.18±0.36 4.84±0.37 4.87±0.56 5.09±0.47 1.85±0.25 1.98±0.13 1.42±0.25 1.44±0.17 1.67±0.39
Mean 5.78±0.62 5.42±0.31 5.10±0.41 5.07±0.46 5.34±0.52 2.29±0.52 2.69±0.94 1.99±0.69 1.83±0.46 2.20±0.71
NI control 5.78±0.35 4.45±0.27 4.62±0.20 4.87±0.26 4.93±0.59 3.39±0.27 3.73±0.33 3.06±0.12 2.54±0.08 3.18±0.50
with UGmax 5.51±0.99 5.65±0.44 5.08±0.70 4.03±0.71 5.07±0.91 2.06±0.47 2.09±0.30 1.58±0.37 1.55±0.25 1.82±0.41
Mean 5.65±0.68 5.05±0.73 4.85±0.53 4.45±0.67 5.00±0.75 2.72±0.80 2.91±0.95 2.32±0.85 2.04±0.57 2.50±0.83
Mean control 5.84±0.46 4.98±0.45 4.91±0.34 4.78±0.48 5.13±0.60 3.04±0.30 3.04±0.71 2.54±0.43 2.19±0.29 2.70±0.57
with UGmax 5.36±0.53 5.06±0.54 4.71±0.48 4.10±0.64 4.81±0.71 1.73±0.60 1.71±0.56 1.60±0.25 1.40±0.37 1.61±0.48
Mean 5.60±0.54 5.02±0.49 4.81±0.42 4.44±0.65 4.97±0.67 2.38±0.81 2.38±0.92 2.07±0.59 1.79±0.55 2.15±0.77
2LSD α=0.05 A – 0.369; B – 0.306; C – 0.267 A – 0.420; B – 0.422; C – 0.215
A/B – n. s.; A/C – 0.294; B/C – 0.362;
A/B/C – n. s.
A/B – n. s.; A/C – n. s.; B/C – n. s;
A/B/C – n. s.
1Experiment factors: OM - organic matter [A], MF - mineral fertilization [B], SC - soil conditioner [C]. CO - control, SI - stubble intercrop, S - straw, M - manure. 2LSD - least significant difference, n. s.- no significant.
Disclaimer/Publisher’s Note: The statements, opinions and data contained in all publications are solely those of the individual author(s) and contributor(s) and not of MDPI and/or the editor(s). MDPI and/or the editor(s) disclaim responsibility for any injury to people or property resulting from any ideas, methods, instructions or products referred to in the content.
Copyright: This open access article is published under a Creative Commons CC BY 4.0 license, which permit the free download, distribution, and reuse, provided that the author and preprint are cited in any reuse.
Prerpints.org logo

Preprints.org is a free preprint server supported by MDPI in Basel, Switzerland.

Subscribe

© 2024 MDPI (Basel, Switzerland) unless otherwise stated