1. Introduction
Neuroblastoma (NB) is one of the most common solid tumors affecting children, and it accounts for 15% of cancer-related deaths [
1]. It is an embryonal malignancy of the autonomic nervous system. NB may present with heterogeneous phenotype and clinical outcome with some tumors exhibiting (relative) good prognosis even not requiring intervention (as for neonatally diagnosed ones) and others exhibiting an early aggressive and metastatic behavior with multiple organ dysfunction and high mortality [
1]. In individuals with high-risk disease the 5-year survival rate is less than 50%; even after radiation therapy the loco-regional relapse is still high (50%), and these patients have a 5-year survival of only 8% [
2]. The hyperactivation of oncogenic signaling pathways, such as epidermal growth factor receptor/mitogen-activated protein kinase (EGFR/MAPK), as well as the overexpression of EGF family ligands, exert an important role in NB growth and progression [
3,
4,
5]. Since the high expression of EGFR has been associated with enhanced tumor growth and chemoresistance in neuroblastoma, the pharmacologic inhibition of EGFR is a clinical approach widely used for cancer treatment. However, some tyrosine kinase inhibitors are not effective on MAPK pathway [
6], leaving uncovered an important issue to solve. Recently, we demonstrated that lysosomal cathepsin D (CD), a ubiquitous soluble aspartic endopeptidase, contrasts neuroblastoma cell proliferation [
7]. The high expression of CD reduced the sensitivity to EGF stimulation and diminished ERK 1/2 activation in human SH-SY5Y NB cells cultured in 2D condition. Accordingly, data retrieved from
in silico transcriptome analysis showed a better prognosis and longer overall survival in NB patients with high
EGFR and high
CTSD levels [
7]. NB is prone to metastasize, a process that involves the transition from adherent to a “suspended” condition where the circulating cancer cells eventually revert to the adherent phenotype at the metastatic site. Uncovering the role of EGF and CD in the growth of NB cells in adherent and suspended conditions could help understand how NBs form metastases and lead to the discovery of new therapeutic targets. Multicellular 3D models more accurately resemble the in vivo tumor condition, and neurospheres may mimic clusters of circulating metastatic cells which disseminate in secondary sites [
8].
We found different levels of CD in 2D and 3D NB culture systems. EGF stimulation downregulated CD expression in SH-SY5Y (non-
MYCN amplified) cells but it did not induce the same effect in other NB (
MYCN-amplified) cell lines analyzed, IMR-32, LAN-5, and SK-N-BE(2). Cancer shows a wide genetic heterogeneity and during tumor evolution different clones compete for survival and overtake each other. To understand the mechanistic role of CD, we used engineered SH-SY5Y NB cells in which CD was overexpressed (Over CD clone) or knocked-down (KD-CD clone) [
7] cultured either alone or in mixed proportion to mimic the intrinsic tumor heterogeneity. High expression of CD suppressed the proliferation of adherent NB cells, yet it conferred a survival and growth advantage to free-floating spheroids. Intriguingly, when the mixed Over CD and KD-CD spheroids were switched to grow on solid substrate, mimicking the adhesion in a metastatic site, the KD-CD clone grew faster and acquired the proliferative advantage over the other. Thus, high CD expression favors the survival of floating spheroids, but it is detrimental for the growth in adherent condition. Noteworthy, in Sham-transfected clone, which retains the ability to modulate protein expression, the cellular level of CD increased when grown in suspension and decreased when grown in adhesion.
These findings highlight a dual role of CD in NB cell growth and suggest that this lysosomal protease is epigenetically regulated during the reversible transition for adherent-to-suspended-to-adherent growth of metastatic clones.
2. Materials and Methods
2.1. Cell culture and treatments
Human neuroblastoma cell lines SH-SY5Y, IMR-32 and SK-N-BE(2) were obtained from the American Type Culture Collection (ATCC, Rockville, MD, cod. CRL-2266, cod. CCL-127, cod. CRL-2271, respectively). Human neuroblastoma cell line LAN-5 was obtained from DSMZ (German Collection of Microorganisms and Cell Cultures GmbH, cod. ACC673, Germany). IMR-32, LAN-5, and SK-N-BE(2) cell lines were maintained under standard conditions (37°C, 95 v/v% air: 5 v/v% CO2) in RPMI-1640 medium (cod. R8758; Sigma-Aldrich Corp., St. Louis, MO, USA) supplemented with 10% heat-inactivated fetal bovine serum (FBS, cod. ECS0180L; Euroclone, Milan, Italy), 1% glutamine (cod. G7513; Sigma-Aldrich Corp.), 1% penicillin/streptomycin (PES, cod. P0781; Sigma-Aldrich Corp.), 1% non-essential amino acids (cod. M7145; Sigma-Aldrich Corp.), and 1% sodium pyruvate (cod. S8636; Sigma-Aldrich Corp.). SH-SY5Y cells were maintained in standard conditions as previously described [
7]. Treatments included 20 ng/ml Epidermal Growth Factor (EGF, cod. E5036; Sigma-Aldrich Corp.), dissolved in 10 mM acetic acid, and 100 μM Pepstatin A, inhibitor of aspartic proteases including cathepsin D (PstA, cod. P4265; Sigma-Aldrich Corp.). SH-SY5Y stable transfectant clones (Sham, knock-down CD (KD-CD), and overexpressing CD (Over CD) were generated in our laboratory [
7] and have been cultivated alone or in combination for co-culture experiments both in 2D and 3D systems, in different proportions: 50% KD-CD + 50% Over CD cells (ratio 1:1), 25% KD-CD + 75% Over CD (ratio 1:3) and 75% KD-CD + 25% Over CD cells (ratio 3:1). In two-dimensional system (2D), cells were plated at a density of 40,000 cells/cm
2 in Petri P60, whereas for 3D cultures 1,000,000 cells were seeded in non-adherent Petri dishes for each experimental condition.
2.2. Cell counting and doubling time calculation
Cells were seeded in 12-well plates (2,000 - 20,000 - 50,000 cells/cm
2 depending on the experiment), let adhere at least 24 hours and then treated with 20 ng/ml EGF and/or 100 μM Pepstatin A, as indicated. Medium was refreshed every 24 or 48 hours, as indicated in figure legends. At each time point, cells were collected and counted in triplicate with Trypan blue solution. Cell counting was performed following the protocol previously described [
7]. Doubling time (Dt) was calculated through the free software Doubling Time Online Calculator (
http://www.doubling-time.com/compute.php).
2.3. Clonogenic assay
Cells were seeded in 6-well plates at the density of 2,000 cells/well, treated with EGF and cultivated for 10 days to allow colony formation [
9]. Newly colonies were stained with 0.5% crystal violet solution as previously described [
7]. Images of each experimental condition were acquired, and the number of colonies formed was estimated by photometric measurements with CellCounter software (v2.0.1).
2.4. Antibodies
The following primary antibodies were employed for western blotting: mouse anti-β-tubulin (1:1000, cod. T5201; Sigma-Aldrich Corp.), mouse anti-β-actin (1:2000, cod. A5441; Sigma-Aldrich Corp.), rabbit anti-GAPDH (1:1000, cod. G9545, Sigma-Aldrich Corp.), mouse anti-cathepsin D (1:100, cod. IM03; Calbiochem, St. Louis, MO, USA), mouse anti-histone H3 (1:500, cod. 61475; Active Motif, Carlsbad, CA, USA). Secondary antibodies used for western blot analysis were the following: horseradish peroxidase-conjugated goat anti-mouse IgG (1:10,000, cod. 170–6516; Bio-Rad, Hercules, CA, USA), horseradish peroxidase-conjugated goat anti-rabbit IgG (1: 10,000, cod. 170–6515: Bio-Rad, Hercules, CA, USA). The primary antibodies employed for immunofluorescence staining are listed below: mouse anti-cathepsin D (1:100, cod. IM03; Calbiochem), rabbit anti-p27 (1:100, cod. 2552; Cell Signaling, Danvers, MA, USA), rabbit anti-Ki-67 (1:100, cod. HPA001164; Sigma-Aldrich). The secondary antibodies were goat-anti rabbit IgG Alexa Fluor Plus 488 (1:1000, cod. A32731; Invitrogen, Waltham, MA, USA) and goat-anti mouse IgG Alexa Fluor Plus 555 (1:1000, cod. A32727; Invitrogen).
2.5. Western blotting
SH-SY5Y, IMR-32, LAN-5, SK-N-BE(2), SH-SY5Y Sham, KD-CD and Over CD transfectant clones were seeded at a density of 40,000 cells/cm
2 on sterile P60 Petri dishes and let adhere. For the experiment with SH-SY5Y Sham grown in two-dimensional condition, cells were plated at a density of 4,000 cells/cm
2 and cultivated for 7 days. At the end, cells were collected in RIPA Buffer (0.5% deoxycholate, 1% NP-40, 0.1% sodium dodecyl sulfate in PBS solution) supplemented with protease inhibitor cocktail and phosphatase inhibitors (0.5 M sodium fluoride and 0.2 M sodium orthovanadate) and homogenized, as previously reported [
7]. Protein content concentration was determined by Bradford assay and samples were denatured with 5X Leammli sample buffer at 95 °C for 10 minutes [
7]. The bands were detected using Enhanced Chemiluminescence reagents (ECL, cod. NEL105001EA; Perkin Elmer, Waltham, MA, USA) and developed with the ChemiDoc XRS instrument (BioRad, Hercules, CA, USA). Western blotting data were reproduced three times independently. The intensity of the bands was estimated by densitometry using Quantity One software (BioRad, Hercules, CA, USA).
2.6. Immunofluorescence
SH-SY5Y transfectants clones were plated on sterile coverslips at the density of 30,000 cells/cm
2, let adhere and grow at least 24 hours before treatment. Cells were treated with 20 ng/ml EGF for 72 hours, where indicated. The coverslips were fixed and processed for immunofluorescence staining as previously described [
7]. After the incubation with primary antibodies, the coverslips were washed three times with 0.1% Triton-PBS and incubated for 1 hour at room temperature with goat-anti rabbit IgG Alexa Fluor Plus 488 or goat-anti mouse IgG Alexa Fluor Plus 555 secondary antibodies, as appropriate. Nuclei were stained with the UV fluorescent dye DAPI (4,6-diamidino-2-phenylindole). Secondary antibodies and DAPI were dissolved in 0.1% Triton-PBS + 10% FBS. Lastly, coverslips were mounted onto glasses using SlowFade reagent (cod. S36936; Life Technologies, Paisley, UK) and data acquired by fluorescence microscopy (Leica DMI6000, Leica Microsystems, Wetzlar, Germany). Different microscopic fields were randomly chosen, and representative pictures of selected fields were shown.
2.7. 3D spheroid forming assay
3D multicellular spheroids were cultured based on our previous work [
10]. Cells were cultured in specific P35 Petri dishes coated with 5 mg/mL Poly 2-hydroxyethyl methacrylate (Poly-HEMA, cod. P3932; Sigma-Aldrich) to prevent cell adhesion. Poly-HEMA stock solution (120 mg/mL) was prepared in 95% ethanol and dissolved under rotation overnight at 50 °C. The day after, the stock solution was diluted in 95% ethanol. Petri dishes were coated with 1.3 mL of diluted Poly-HEMA and left under the biological hood to completely dry. 1,000,000 cells/Petri were seeded and maintained in culture for 7 days after treatment. Fresh medium was added every 48 hours and supplemented with 20 ng/ml EGF and/or 100 μM PstA, as indicated. Spheroid’s growth was monitored by taking pictures at phase contrast microscope (magnification 20x, Zeiss AXIOVERT 40 CFL) at each time-point. The 3D culture quantification was performed through ImageJ software, which calculates the area of spheroids, indicated as Arbitrary Unit (A.U.). In a 3D-to-2D experiment, 500,000 cells were initially plated in Poly-HEMA-coated Petri and let grow as neurospheres until the third day, and then 3D cell aggregates were collected, centrifuged, and reseeded in adherent Petri dishes. The adhesion and growth capacity of SH-SY5Y transfectant clones, IMR-32, LAN-5, SK-N-BE(2) were monitored up to 72 hours by imaging. The area of the secondary colonies grown on plastic was determined in several random fields using ImageJ software. Finally, after 72 hours of culture in adherent condition, cells were harvested in RIPA Buffer and processed for western blot analysis.
2.8. Mimicking in vitro tumor heterogeneity of CD expression
To mimic in vitro tumor heterogeneity of CD expression we cultured in 2D or in 3D mixture of Over CD and KD-CD clones in different proportion, as indicated. Briefly, we co-cultured the Over CD and KD-CD clones at different ratios of 1:1, 1:3 and 3:1, respectively.
2.9. Statistical analysis
Statistical analysis was performed with GraphPad Prism 6.0 software (San Diego, CA, USA). Bonferroni’s multiple comparison test after one-way/two-way ANOVA analysis (unpaired, two-tailed) was employed. Unpaired t-test analysis was also employed. Significance was considered as follow: **** p <0.0001; *** p < 0.001; ** p < 0.01; * p < 0.05. Data are reported as average ± S.D.
3. Results
3.1. EGF reduces cathepsin D levels in non-MYCN-amplified SH-SY5Y cells
Our previous work showed an EGF-induced reduction of cathepsin D levels in non-
MYCN-amplified SH-SY5Y neuroblastoma (NB) cells [
7]. Here, we compared cathepsin D expression in this latter cell line with that of
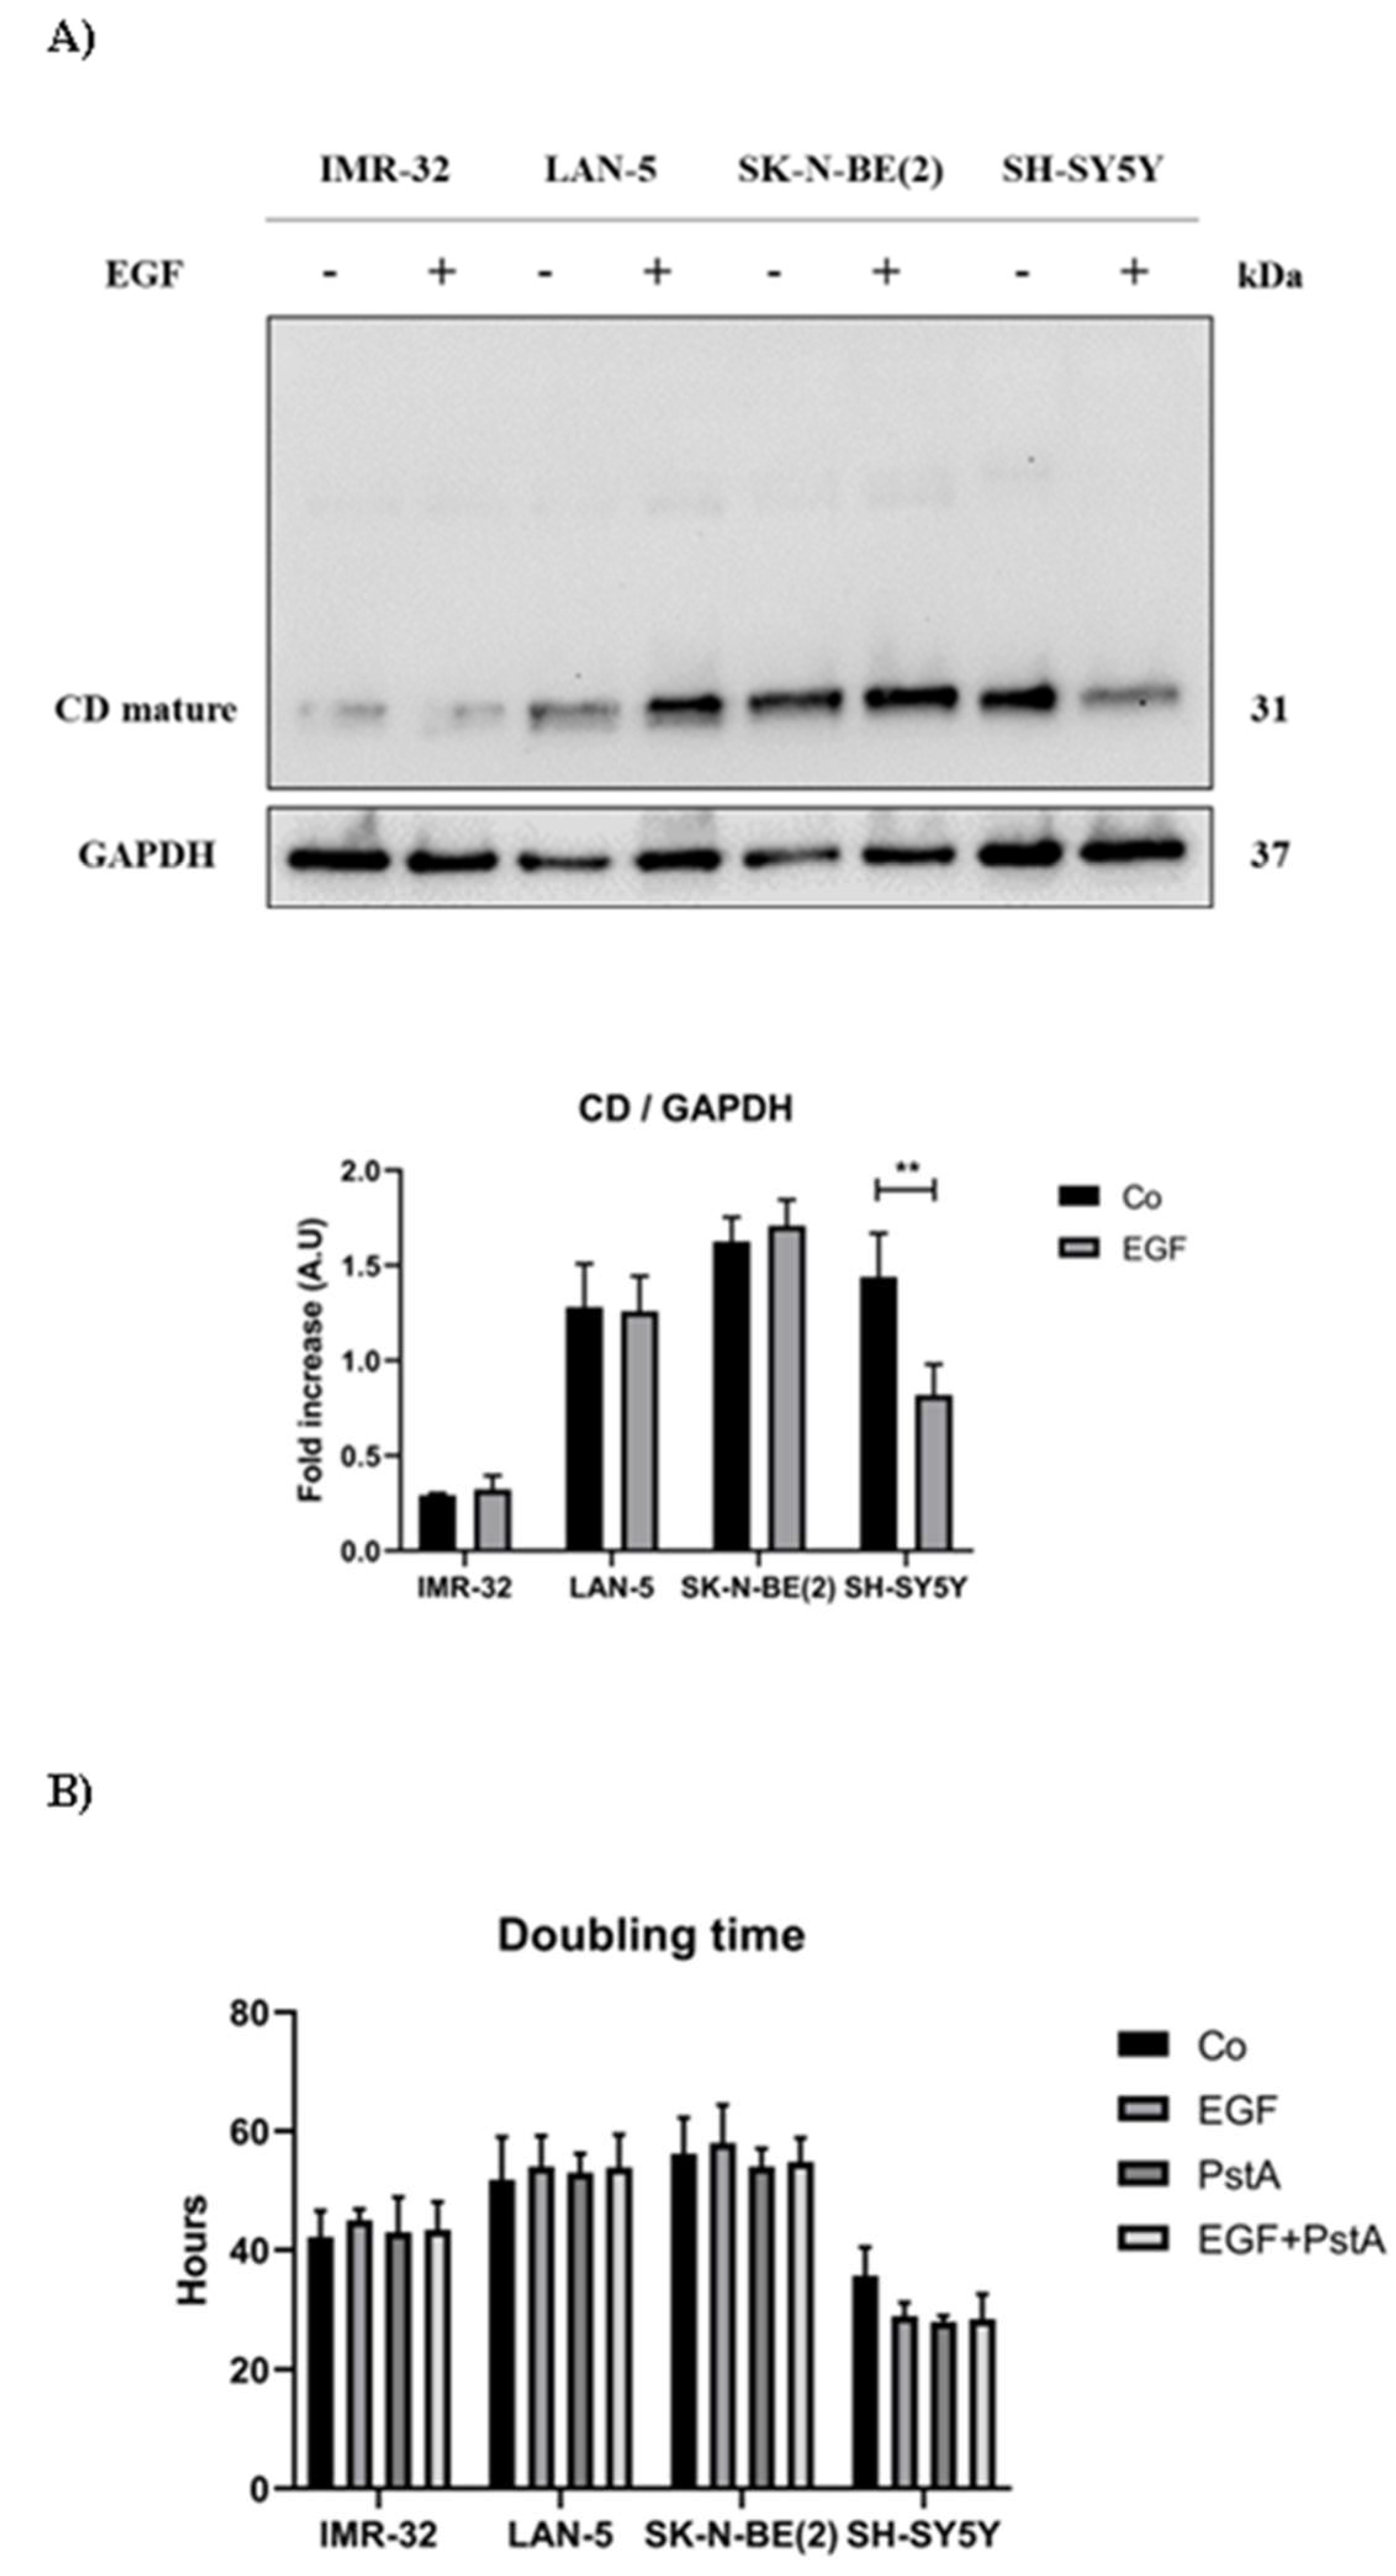
MYCN-amplified IMR-32, LAN-5, SK-N-BE(2) NB cells in the presence or absence of EGF. IMR-32 showed the lowest, while SK-N-BE(2) the highest, basal expression of CD. Moreover, we observed that EGF stimulation did not affect cathepsin D levels in IMR-32, LAN-5 and SK-N-BE(2). In line with our previous findings, we found a significant reduction (around 50%) of cathepsin D expression in EGF-treated SH-SY5Y cells (
Figure 1A). In addition, to assess their proliferative potential we calculated the doubling time (Dt) of these NB cell lines treated with EGF and/or Pepstatin A (PstA), a specific inhibitor of aspartic proteases including CD (
Figure 1B). In the co-treatment condition, PstA was added before EGF administration to inhibit the enzymatic activity of CD. SH-SY5Y showed a doubling time (Dt) of 36 hours which was reduced to 29 hours by EGF, to 28 hours by PstA and to 28.5 hours by EGF+PstA. Conversely, IMR-32, LAN-5, SK-N-BE(2) displayed a lower proliferation rate by showing a Dt of 42, 52 and 56 hours, respectively. The addition of EGF and PstA did not affect the Dt in these latter NB cell lines.
3.2. SH-SY5Y cells grown as 2D or 3D express different level of cathepsin D
Above data indicate that MYCN-amplified NB cells are not responsive to EGF, and that SH-SY5Y cells (non MYCN-amplified) cultivated in 2D proliferate at higher rate (the Dt was reduced by 30%) when CD is either reduced by EGF or inhibited by PstA. The latter two treatments show no synergistic or additive effect, pointing to the role of CD proteolytic activity for limiting NB cell growth.
To investigate the role of cathepsin D in determining neuroblastoma growth, we continued our experiments in SH-SY5Y cell line. We exploited SH-SY5Y Sham transgenic clone previously engineered in our laboratory [
7]. The choice of this cell line was due to the fact that we observed a downregulation of CD expression levels following EGF treatment. We checked whether CD expression is differently modulated in SH-SY5Y cells depending on whether growing adherent in 2D or in suspension in 3D culture conditions. By western blotting it was shown that CD protein content was upregulated up to 5-times in NB spheroids compared to the cells grown as 2D (
Figure 2A). We employed PstA to determine its contribution to NB growth in both anchorage-dependent and anchorage-independent conditions (
Figure 2A-B-C). The enzymatic inhibition of CD increased the growth (cell number) of adherent SH-SY5Y cells compared to untreated control, as shown in
Figure 2B. In contrast, in 3D cultures CD inhibition reduced the size of multicellular spheroids. In fact, their size was 4-times smaller compared to that of untreated neurospheres with active CD (
Figure 2C). Thus, in the absence of adhesion signals CD confers survival and growth advantage, which is nullified by PstA, indicating that this advantage is dependent on the proteolytic activity of CD. From these data we conclude that CD is differently modulated in SH-SY5Y cells cultured in anchorage-dependent and anchorage-independent conditions and its activity is necessary for the growth in the latter condition.
3.3. Cathepsin D expression differentially affects the 2D and 3D growth of SH-SY5Y cells
To better assess the role of CD in anchorage-dependent and anchorage-independent growth of neuroblastoma, we took advantage of human neuroblastoma SH-SY5Y stable transfectant clones engineered in our laboratory that are silenced for (knocked-down, KD-CD) or overexpress (Over CD) this protease [
7]. The effectiveness of such genetic manipulations is here confirmed by the immunofluorescence staining of CD shown in
Figure 3A. It appears obvious that CD is highly expressed in Over CD clone while it is barely detectable in KD-CD clone. Next, we examined their proliferative potential in 2D cultures. KD-CD clone displayed the highest while Over CD clone displayed the lowest proliferation rate, compared to Sham-transfected clone (
Figure 3B). Accordingly, the doubling time of Over CD clone was approximately 50% increased (from 38 hours to 56 hours) while the Dt of KD-CD was approximately 30% reduced (from 38 hours to 29 hours; as observed when wild-type cells are cultivated in the presence of EGF or of PstA; see
Figure 1B) compared to that reported for Sham-transfected counterpart (
Table 1).
Then, we assayed the growth rate of these clones cultured as 3D spheroids for up to 7 days. CD-overexpressing cells showed a greater ability to survive and grow in suspension, forming spheroids that are 12-times larger than those of KD-CD (
Figure 3C).
3.4. Cathepsin D overexpression contrasts while cathepsin D silencing enhances EGF-induced clonogenic growth in 2D system
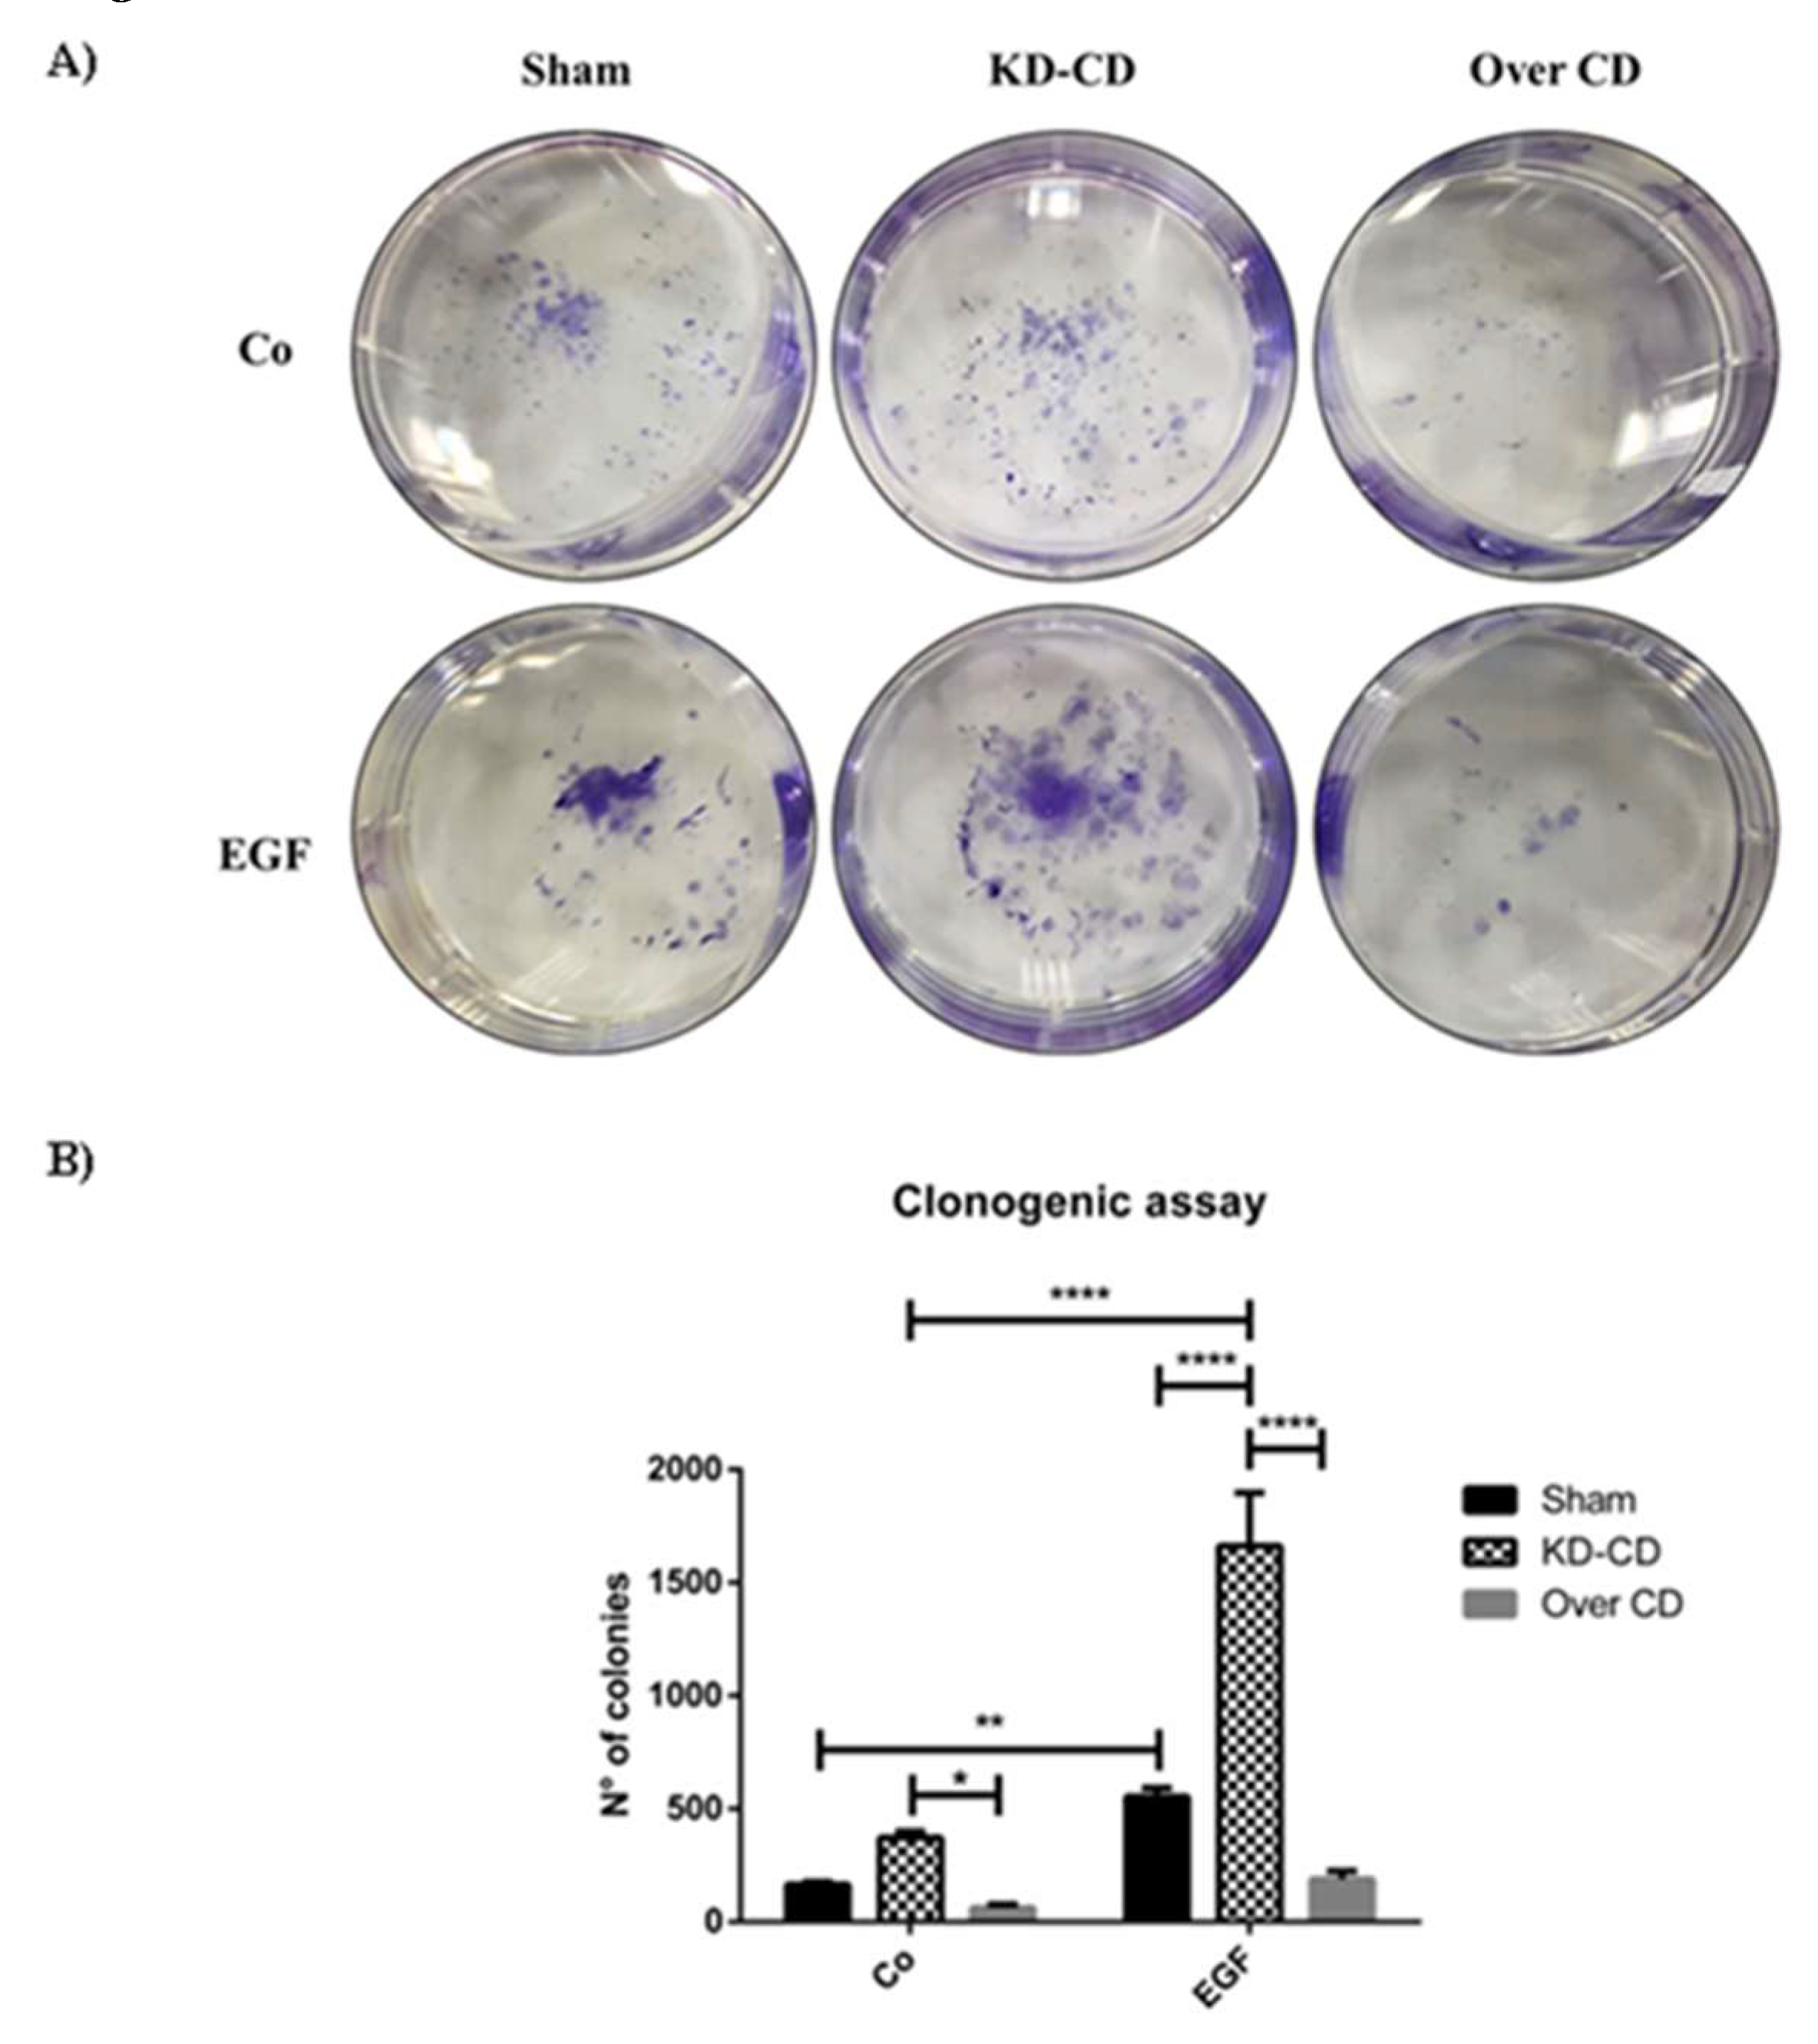
Clonogenic assay confirmed that transgenic SH-SY5Y KD-CD cells had higher while those overexpressing CD had lower proliferation rate compared to Sham-transfected counterpart (
Figure 4A-B). EGFR stimulation exacerbates the growth and aggressive behavior of NBs [
4,
5]. The administration of 20 ng/ml EGF, which is in the range of cell growth stimulation [
11], markedly increased the colony forming ability of CD knockdown cells (
Figure 4A). When stimulated with EGF, the colony formation increased differently in the three clones, with an increment of 3.4-folds, of 4.5-folds, and of 3-folds for Sham-transfected, KD-CD, and Over CD, respectively (
Figure 4A-B). Particularly, the number of newly formed colonies in EGF-treated KD-CD clone was 3- and 8.8- times higher compared to Sham and Over CD, respectively, especially in presence of EGF. To substantiate this effect, we assayed the activation of the cell proliferation pathway downstream to EGFR. We focused on the ERK pathway as this is the main mitogenic signaling triggered by EGF [
7]. KD-CD cells, that are highly proliferating, showed a high sensitivity to EGF, as demonstrated by the increased phosphorylation of ERK 1/2 (more than 2-folds increase) compared to that of Over CD clone (data not shown). These data definitively confirm that in adherent 2D condition low or null expression of CD favors NB cell growth.
3.5. Knocked-down CD clone overtakes Over CD clone in EGF-stimulated growth of mixed cultures in 2D system
Tumor evolution is characterized by the presence of multiple cancer clones with different genetic background and these clones compete for survival and overtake each other. We hypothesized that during malignant progression NB could develop subclones expressing different levels of CD, which then would respond differently to EGF. To mimic such tumor heterogeneity, we have mixed at different ratios clones overexpressing or silenced for CD and tested which one would take advantage to grow over the other in the absence or in the presence of EGF stimulation. In pure 2D cultures, EGF greatly stimulated the growth of KD-CD and to a much lesser extent that of Over CD, as expected (
Figure 5A). When the clones were mixed in different proportion of KD-CD and of Over CD at 1:1 or 1:3 or 3:1 ratio, the co-cultures stimulated with EGF showed a higher growth rate when the KD-CD clone was highly represented (
Figure 5A). Immunofluorescence staining of Ki-67, a proliferative nuclear marker, and of p27Kip1, a cyclin-dependent kinase inhibitor that prevents entering the cell cycle, corroborated these findings. To distinguish the two populations of KD-CD and Over CD in the mixed cultures, we co-stained the cells with an anti-CD antibody. In pure cultures, EGF strongly increased the expression of nuclear Ki-67 and decreased the levels of p27 in KD-CD cells, and conversely high level of p27 and low level of Ki-67 were observed in Over CD cells (
Figure 5B-C). In co-cultures, especially in 1:1 and 3:1 ratio of KD-CD vs Over CD, we observed high expression of Ki-67 and decreased expression of p27 in KD-CD cells that were the most represented ones, indicating that these cells took advantage to grow over the other. The high percentage of CD-silenced cells on the total number of Ki-67+ cells, in both EGF-treated and untreated conditions, essentially confirmed the prevalence of KD-CD clone in the mixed co-cultures (
Figure 5B). The percentages of Ki-67+ and p27+ cells relative to the total cell population corroborated the above findings (
Supplementary Figure S1A-B).
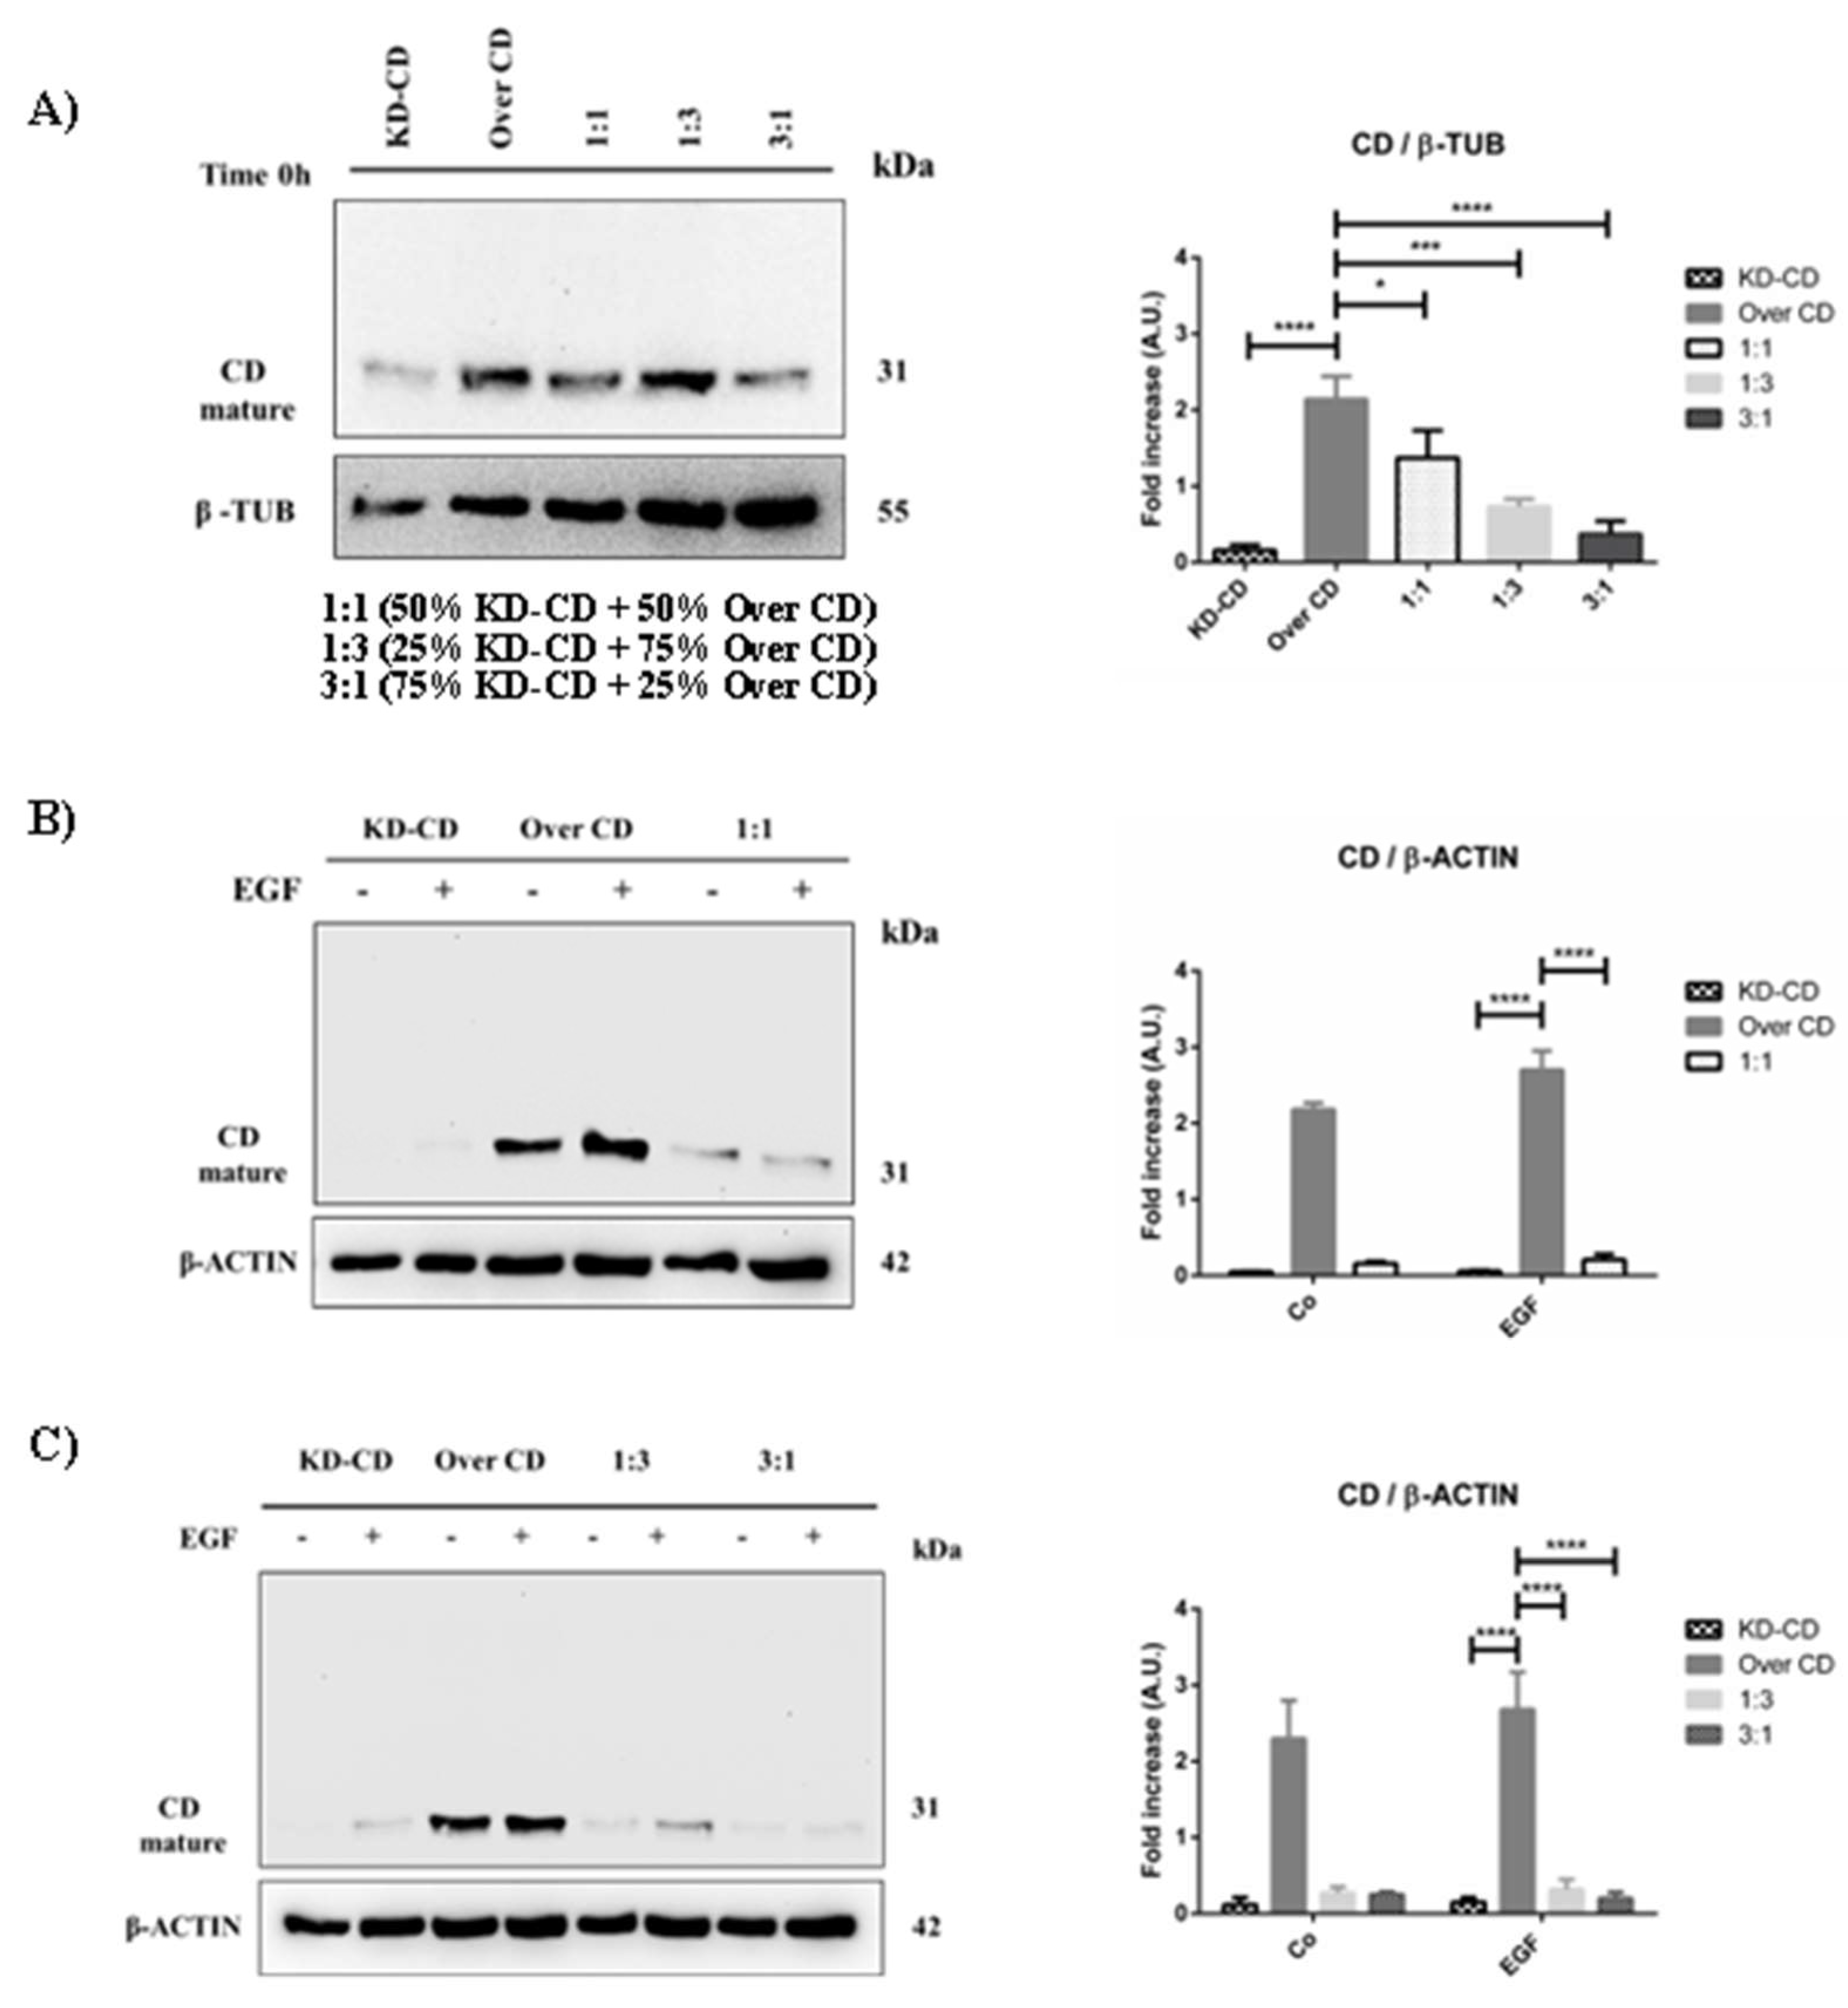
We further assessed the level of cellular CD expressed in the mixed clones, first at time zero (0h) (
Figure 6A), which reflects the CD levels according to the proportion of the clones, and after 72 hours of culture in the presence/absence of EGF (
Figure 6B, C). Over CD clone expresses approximately 25-folds more CD than KD-CD clone, where CD is indeed barely expressed. In the absence of EGF stimulation, after 72 hours the mixed culture of the two clones at (KD-CD vs Over CD) 1:1, 1:3 and 3:1 ratio demonstrated a progressive reduction of the total content of CD. However, at 1:1 ratio the total content of CD is reduced by some 30% and not by 50% as one would expect. Also, comparing the two opposite proportion of the clones (1:3 versus 3:1) it appears that the reduction of CD in the whole homogenate is not reflecting the proportion of the clones (
Figure 6A). Together with data in
Figure 5 and in agreement with our previous findings [
7], the possible explanation is that in the mixed co-cultures Over CD cells are viable though in a resting phase while the KD-CD cells are proliferating. This supposes that with time the latter clone would overtake the former. To accelerate this process, we exposed the clones to EGF. We previously reported [
7] that Over CD cells resist while KD-CD cells respond to the growth promoting effect of EGF. In fact, EGF greatly stimulated the growth of KD-CD clone which overtook that of CD-overexpressing cells in the cultures mixed at any ratio (
Figure 6B, C). It is worth noting that this effect is now evident at the 1:1 ratio and even more strikingly at the 1:3 ratio in which the number of Over CD seeded at time zero was 3-times more that of KD-CD cells.
3.6. Cathepsin D overexpression increases the survival of NB spheroids cultivated in suspension
Neurospheres can be assumed as clusters of cells representing metastatic clones at the step of detachment from the primary tumor and, possibly, circulating in body fluids. At this point, it was necessary to determine the role of CD in the EGF-induced proliferation of the two clones expressing CD at different levels cultivated in suspension. To mimic tumor heterogeneity for CD expression, we co-cultured the two clones KD-CD and Over CD in different proportion as detailed above. Representative images and quantification of the spheroid’s growth are shown in
Figure 7. In pure cultures at the endpoint of 7 days, the dimension of Over CD neurospheres was larger (about 2-folds) compared to that of KD-CD-deriving spheroids. The addition of EGF stimulated the growth of Over CD neurospheres to a larger extent, and it strongly increased their size. On measurement, Over CD spheroids were approximately 2-times larger than KD-CD spheroids.
This effect was observed also in mixed clones at the ratio 1:1 and 1:3, but not at the ratio 3:1 in which the Over CD clone is less represented compared to those formed by KD-CD. The growth curves of each condition (shown in
Figure 7C) suggest that as the Over CD cell population overcomes the other, the spheroid’s size increases as well. In addition, we evaluated the capacity of
MYCN-amplified neuroblastoma cells (IMR-32, LAN-5 and SK-N-BE(2) to form 3D spheroids in the presence of EGF and/or PstA. As demonstrated by the quantification of spheroid’s size at day 7, the addition of EGF and/or PstA did not significantly modulate the 3D spheroid growth of these latter neuroblastoma cells (
Supplementary Figure S2).
To have a more objective measure of spheroids, in term of cell number, we assayed the expression of histone H3 in an equal volume of cell homogenate for each condition. The H3 protein is one of the main histones composing chromatin structure and can be assumed as an indirect readout of cell number. The western blotting (
Supplementary Figure S3) shows high level of histone H3 in pure Over CD culture and in the mixed cultures at the ratio 1:1 and 1:3, particularly in EGF condition. In EGF-treated pure cultures, the level of histone H3 in Over CD was 3-folds that in KD-CD cells.
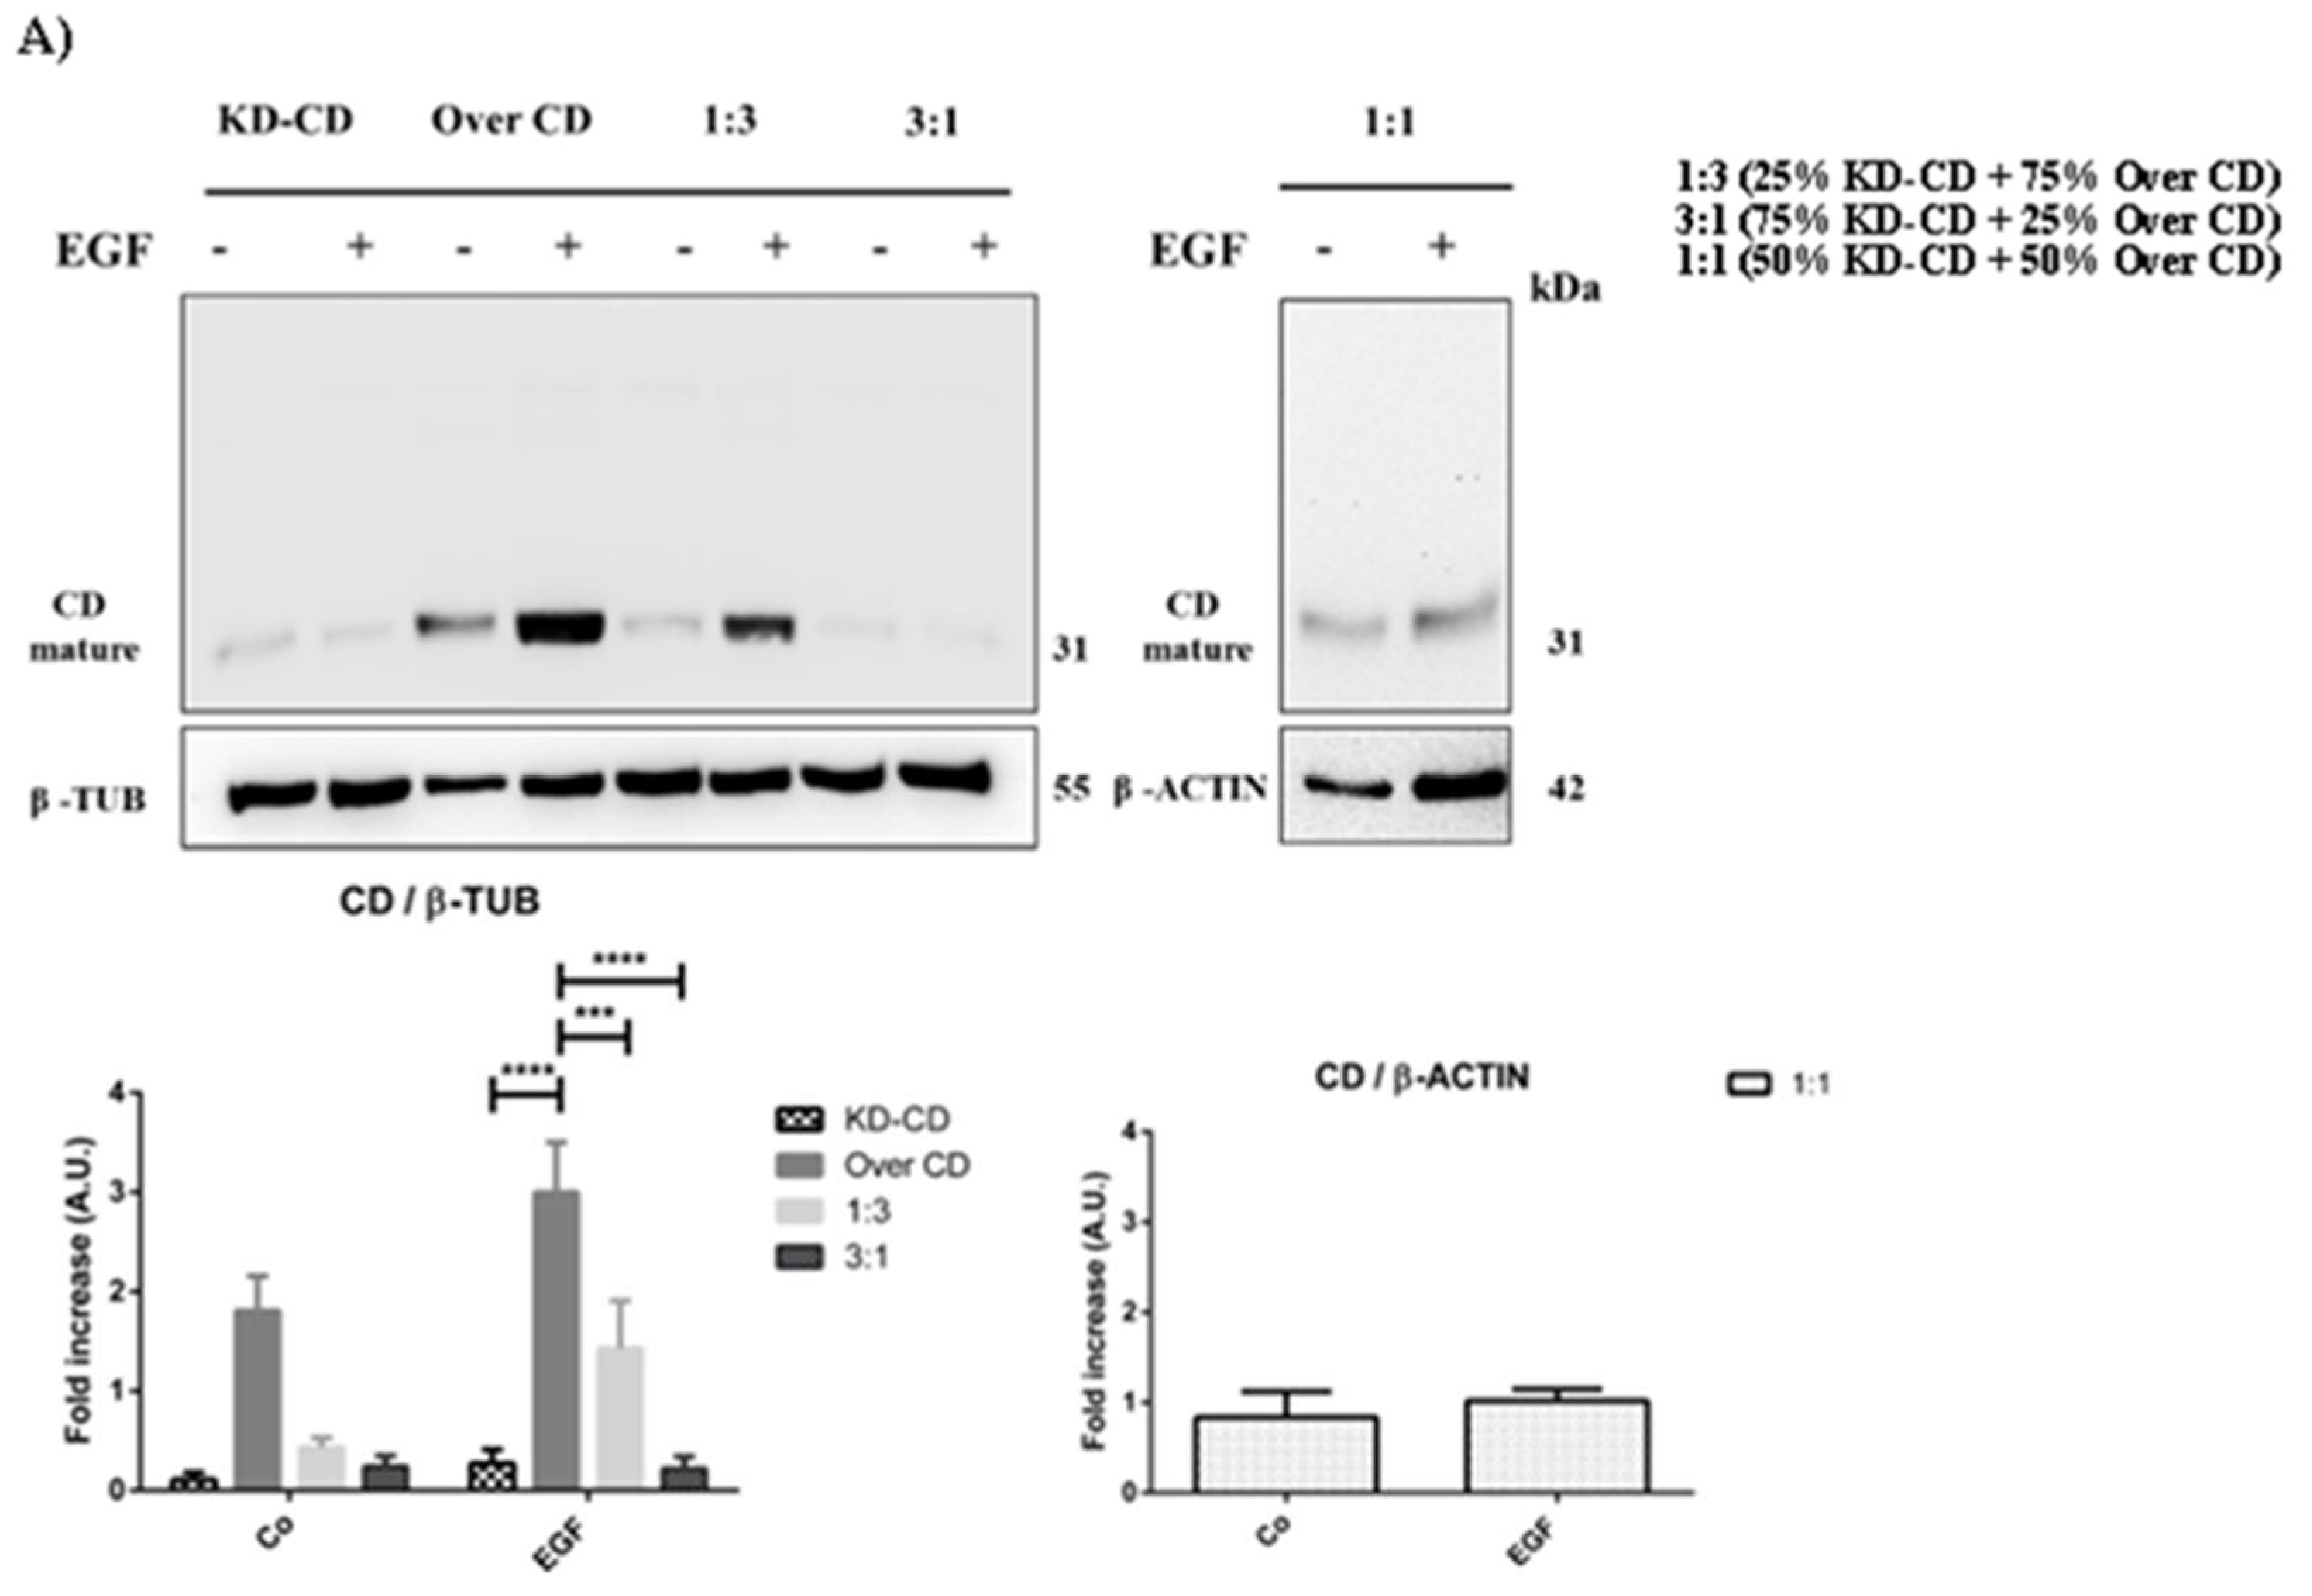
As a confirmation of which subpopulation gained growth advantage in the mixed cultures, we assayed the CD protein content in spheroid’s homogenates (
Figure 8). In pure KD-CD culture as well as in mixed 3:1 culture (where the KD-CD clone is predominant), and to a lesser extent in the mixed 1:1 ratio, it is not observed an increase of CD content upon stimulation with EGF, indicating that the absence of CD may reduce the ability of KD-CD clone to grow in suspension, remaining in a resting phase. By contrast, in the pure and in the 1:3 mixed culture (containing the Over CD in higher proportion), it is appreciable the increase of CD content upon EGF stimulation, indicating that this subclone took advantage for growth in suspension.
3.7. Suspended SH-SY5Y clone knocked-down for cathepsin D rescues the ability to grow in adherent condition
In vivo, small clusters of circulating tumor cells can reach distant organs where they must attach and grow for forming secondary metastasis. To mimic in vitro such situation, the spheroids of suspended cells, from either pure or mixed clones, were placed in culture Petri dishes for attachment and let them grow for 72 hours. This corresponds to a switch from 3D to 2D culture condition. The cultures were imaged at 24, 48 and 72 h (
Figure 9A-B).
It is apparent that KD-CD cells, either cultured as pure clone or mixed with Over CD cells, displayed the greatest ability to adhere and grow onto a solid matrix, giving rise to secondary colonies. By contrast, Over CD cells which were the most actively proliferating in suspension were less prone to attach and rescue the growth as adherent colonies. The area of the neo-formed secondary colonies was calculated, and it was higher in pure KD-CD and in the mixed 3:1 culture (
Figure 9C), confirming that CD knocked-down cells rescued the ability to proliferate in adherent condition. We measured the CD content in the attached colonies as an indirect marker of the prominent subclone in the pure and mixed populations (
Figure 9D). Whatever the relative proportion in the starting co-culture of spheroids (i.e., at either 1:1, 1:3 and 3:1 ratio), the KD-CD clone became prevalent in the adherent colonies, as indicated by the very low content of CD in the whole homogenates. This confirms that overexpression of CD limits the anchorage-dependent growth of neuroblastoma cells, as also reported in [
7].
Accordingly, in IMR-32 cells expressing low CD levels, the calculated area of neo-formed secondary colonies was higher compared to that of LAN-5 and SK-N-BE(2) characterized by high CD expression (
Figure 10).
4. Discussion
Neuroblastoma is the most common extracranial solid tumor of childhood responsible for over 15% of cancer-related deaths [
2,
12]. Despite recent advances in multimodal therapeutic strategy, including EGFR targeting, NB continues to cause high mortality. NB tumorigenesis and metastasization are driven by the abnormal activity of oncogenic signaling pathways driving cell proliferation, cell survival, and cell motility. A better understanding of the regulatory mechanisms downstream growth factor receptors may help the development of novel targets and effective therapeutics.
The conventional 2D cellular model often does not adequately resemble the complexity of the tumor mass. Neuroblastoma cells grown as 3D aggregates (multicellular spheroids) much closer recapitulate the in vivo structure of cancers and possess features in common with primary tumors, including cells in different proliferative and metabolic state, also due to growth factor, nutrient, and oxygen availability [
8,
13,
14]. Important phenotypic and metabolic differences, including migration, proliferation, and response to toxic drugs, have been reported when comparing the neuroblastoma cells cultured in adhesion as 2D monolayer or in suspension as 3D spheroids [
15,
16,
17]. The type of culture system influences the proteome [
16]. Changing in signaling cascades, like PI3K/AKT/mTOR and EGFR/MAPK, two central regulators of cell growth, survival, and metabolism, have been well documented [
17,
18,
19,
20]. We have previously demonstrated that high expression of the lysosomal protease CD is a predictor of good prognosis in neuroblastoma patients bearing high levels of
EGFR [
7].
In silico transcriptome analysis was corroborated by in vitro studies revealing that high intracellular CD reduces ERK 1/2 activation and inhibits EGF-induced cell growth. In the present work, we confirmed the effect of EGF in reducing cathepsin D expression in non-
MYCN-amplified SH-SY5Y neuroblastoma cells [
7]. However, this effect was no longer evident in
MYCN-amplified neuroblastoma cell lines IMR-32, LAN-5, SK-N-BE(2). To metastasize, tumor cells detach from the basement membrane but not all survive in the fluid environment. We sought to understand whether and how CD impacts differentially on the growth of attached (2D) or suspended (3D) neuroblastoma cells under EGF stimulation. For this purpose, we took advantage of transgenic neuroblastoma SH-SY5Y cells either knocked-down for (KD-CD) or overexpressing CD (Over CD) available in our laboratory to address this issue. Strikingly, we found that overexpression of CD while inhibiting NB growth in 2D cultures it was instead beneficial for the growth in 3D. Accordingly, SH-SY5Y cells enhanced the expression of CD when the culture was switched from adherent to suspended condition. We exploited our CD-engineered clones for understanding the role of CD in culture conditions that recapitulate in vitro the steps of metastatic spreading, that is the transition from adherent to suspended to adherent growth. Additionally, to mimic the tumor heterogeneity arising from clonal evolution that could lead to clones expressing CD at different levels, we tested the growth ability under EGF stimulation of mixtures at different ratio of the two clones. Briefly, we found that upregulation of CD expression is necessary to guarantee the survival and proliferation of the cells in suspension while it is necessary to downregulate its expression for allowing adherence and anchorage-dependent growth of the tumor cells.
Whether CD modulation is mechanistically linked to cell migration and to EMT and MET remains to be determined.
To our knowledge, this is the first evidence for such a role of CD in neuroblastomas. Another important novelty of the present work is the use of mixed clones expressing CD at different level. This is the first experimental model for mimicking in vitro tumor heterogeneity as a possible result of clonal evolution and/or epigenetic modulation.
Within the tumor context, normal and cancer cells with different genetic and epigenetic background dynamically compete for space and survival, metabolic substrates, and the fittest clones will eventually expand by eliminating the less fitting ones [
21,
22]. In our model, CD-silenced clones showed better fitting for adherent growth while CD-overexpressing clones were better fitting for suspended (non-adherent) growth. Interestingly, when the mixed neurospheres were put back to grow as adherent cells again the CD-silenced cells gained advantage for growth.
It is likely that tumors can epigenetically regulate CD depending on whether the cells must survive in the mesenchymal space and body fluids, as in the early step of metastasis, or must grow adherent to the matrix, as in the late step of colony formation.
5. Conclusions
Collectively, we have uncovered a novel function of CD in the metastatic spreading of tumors. This finding may have translational relevance, and we propose CD as a biomarker for metastatic neuroblastomas and for the stratification of patients in view of personalized medicine.
Supplementary Materials
The following supporting information can be downloaded at:
Preprints.org, Supplementary Figure S1: CD knockdown clone expressing high levels of Ki-67 and reduced levels of p27 overtakes Over CD clone in EGF-stimulated growth of mixed cultures; Supplementary Figure S2: Monitoring of spheroid’s formation in
MYCN-amplified neuroblastoma cell lines IMR-32, LAN-5 and SK-N-BE(2) in the presence of EGF and/or PstA; Supplementary Figure S3: Analysis of histone H3 expression in SH-SY5Y 3D spheroids of pure and mixed clones cocultured in the absence or presence of EGF.
Author Contributions
Conceptualization, E.S. and C.I.; methodology, formal analysis and investigation, E.S., G.C., C.V., A.E., A.S., L.V. and A.F.; visualization, E.S., A.E., A.S. and G.C.; writing-original draft preparation, E.S., A.E. and A.S.; supervision, writing-review and editing, C.I. All authors have read and agreed to the published version of the manuscript.
Funding
This research received no external funding.
Institutional Review Board Statement
Not applicable.
Informed Consent Statement
All authors have read and agreed to the published version of the manuscript.
Data Availability Statement
Not applicable.
Acknowledgments
E.S., A.E., and A.S. are recipients of a PhD fellowship granted by the Italian Ministry of Education, University and Research (MIUR, Rome, Italy). A.F. is recipient of a post-doctoral fellowship from Fondazione Umberto Veronesi (FUV2023). L.V. is recipient of a post-doctoral fellowship granted by the Università del Piemonte Orientale (Novara, Italy). The fluorescence microscope was donated by Comoli, Ferrari & SpA (Novara, Italy). Thanks to Associazione per la Ricerca Medica Ippocrate-Rhazi (ARM-IR, Novara, Italy) for the support. Authors are grateful to Prof. Barbara Marengo and Prof. Cinzia Maria Domenicotti (Università degli Studi di Genova, Italy) for providing us the IMR-32 and LAN-5 cell lines. Authors thank the Cell Culture Unit of IEO (Milano, Italy) for providing us the SK-N-BE(2) cell line. Authors are grateful for the support of the Consorzio Interuniversitario per le Biotecnologie (CIB, Trieste, Italy).
Conflicts of Interest
The authors declare no conflicts of interest.
References
- Davidoff AM. Neonatal Neuroblastoma. Clin Perinatol. 2021 Mar;48(1):101-115. [CrossRef]
- Siegel RL, Miller KD, Fuchs HE, Jemal A. Cancer Statistics, 2021. CA Cancer J Clin. 2021 Jan;71(1):7-33. https://doi.org/10.3322/caac.21654. Epub 2021 Jan 12. Erratum in: CA Cancer J Clin. 2021 Jul;71(4):359. PMID: 33433946. Zhao Q, Liu Y, Zhang Y, Meng L, Wei J, Wang B, Wang H, Xin Y, Dong L, Jiang X. Role and toxicity of radiation therapy in neuroblastoma patients: A literature review. Crit Rev Oncol Hematol. 2020 May;149:102924. [CrossRef] [PubMed]
- Tang CK, Lippman ME. EGF family receptors and their ligands in human cancer. In: O’Malley BW, editor. Hormones and signaling. vol. I. San Diego (CA): Academic Press; 1998. p. 113–65. [CrossRef]
- Sasaki T, Hiroki K, Yamashita Y. The role of epidermal growth factor receptor in cancer metastasis and microenvironment. Biomed Res Int. 2013;2013:546318. [CrossRef]
- Ho R, Minturn JE, Hishiki T, Zhao H, Wang Q, Cnaan A, Maris J, Evans AE, Brodeur GM. Proliferation of human neuroblastomas mediated by the epidermal growth factor receptor. Cancer Res. 2005 Nov 1;65(21):9868-75. [CrossRef]
- Memarzadeh K, Savage DJ, Bean AJ. Low UBE4B expression increases sensitivity of chemoresistant neuroblastoma cells to EGFR and STAT5 inhibition. Cancer Biol Ther. 2019;20(12):1416-1429. [CrossRef]
- Secomandi E, Salwa A, Vidoni C, Ferraresi A, Follo C, Isidoro C. High Expression of the Lysosomal Protease Cathepsin D Confers Better Prognosis in Neuroblastoma Patients by Contrasting EGF-Induced Neuroblastoma Cell Growth. Int J Mol Sci. 2022 Apr 26;23(9):4782. [CrossRef]
- Aveic S, Seidelmann M, Davtalab R, Corallo D, Vogt M, Rütten S, Fischer H. Three-dimensional in vitro model of bone metastases of neuroblastoma as a tool for pharmacological evaluations. Nanotheranostics. 2024 Jan 1;8(1):1-11. [CrossRef]
- Thongchot S, Vidoni C, Ferraresi A, Loilome W, Khuntikeo N, Sangkhamanon S, Titapun A, Isidoro C, Namwat N. Cancer-Associated Fibroblast-Derived IL-6 Determines Unfavorable Prognosis in Cholangiocarcinoma by Affecting Autophagy-Associated Chemoresponse. Cancers (Basel). 2021 Apr 28;13(9):2134. [CrossRef]
- Ferraresi A, Esposito A, Girone C, Vallino L, Salwa A, Ghezzi I, Thongchot S, Vidoni C, Dhanasekaran DN, Isidoro C. Resveratrol Contrasts LPA-Induced Ovarian Cancer Cell Migration and Platinum Resistance by Rescuing Hedgehog-Mediated Autophagy. Cells. 2021 Nov 17;10(11):3213. [CrossRef]
- Chiu B, Mirkin B, Madonna MB. Mitogenic and apoptotic actions of epidermal growth factor on neuroblastoma cells are concentration-dependent. J Surg Res. 2006 Oct;135(2):209-12. [CrossRef]
- Matthay KK, Maris JM, Schleiermacher G, Nakagawara A, Mackall CL, Diller L, Weiss WA. Neuroblastoma. Nat Rev Dis Primers. 2016 Nov 10;2:16078. [CrossRef]
- Chilamakuri R, Agarwal S. Dual Targeting of PI3K and HDAC by CUDC-907 Inhibits Pediatric Neuroblastoma Growth. Cancers (Basel). 2022 Feb 20;14(4):1067. [CrossRef]
- Zingales V, Torriero N, Zanella L, Fernández-Franzón M, Ruiz MJ, Esposito MR, Cimetta E. Development of an in vitro neuroblastoma 3D model and its application for sterigmatocystin-induced cytotoxicity testing. Food Chem Toxicol. 2021 Nov;157:112605. [CrossRef]
- Hall MK, Burch AP, Schwalbe RA. Functional analysis of N-acetylglucosaminyltransferase-I knockdown in 2D and 3D neuroblastoma cell cultures. PLoS One. 2021 Nov 8;16(11):e0259743. [CrossRef]
- Hartwig F, Köll-Weber M, Süss R. Preclinical In Vitro Studies with 3D Spheroids to Evaluate Cu(DDC)2 Containing Liposomes for the Treatment of Neuroblastoma. Pharmaceutics. 2021 Jun 17;13(6):894. [CrossRef]
- Riedl A, Schlederer M, Pudelko K, Stadler M, Walter S, Unterleuthner D, Unger C, Kramer N, Hengstschläger M, Kenner L, Pfeiffer D, Krupitza G, Dolznig H. Comparison of cancer cells in 2D vs 3D culture reveals differences in AKT-mTOR-S6K signaling and drug responses. J Cell Sci. 2017 Jan 1;130(1):203-218. [CrossRef]
- Pickl M, Ries CH. Comparison of 3D and 2D tumor models reveals enhanced HER2 activation in 3D associated with an increased response to trastuzumab. Oncogene. 2009 Jan 22;28(3):461-8. [CrossRef]
- Weigelt B, Lo AT, Park CC, Gray JW, Bissell MJ. HER2 signaling pathway activation and response of breast cancer cells to HER2-targeting agents is dependent strongly on the 3D microenvironment. Breast Cancer Res Treat. 2010 Jul;122(1):35-43. [CrossRef]
- Ekert JE, Johnson K, Strake B, Pardinas J, Jarantow S, Perkinson R, Colter DC. Three-dimensional lung tumor microenvironment modulates therapeutic compound responsiveness in vitro implication for drug development. PLoS One. 2014 Mar 17;9(3):e92248. [CrossRef]
- Wölfl B, Te Rietmole H, Salvioli M, Kaznatcheev A, Thuijsman F, Brown JS, Burgering B, Staňková K. The Contribution of Evolutionary Game Theory to Understanding and Treating Cancer. Dyn Games Appl. 2022;12(2):313-342. [CrossRef]
- Greaves M, Maley CC. Clonal evolution in cancer. Nature. 2012 Jan 18;481(7381):306-13. [CrossRef]
Figure 1.
EGF differentially modulates cathepsin D levels and cell proliferation in MYCN-amplified and non-MYCN-amplified neuroblastoma cell lines. IMR-32, LAN-5, SK-N-BE(2) and wild-type SH-SY5Y cells were cultured for 72 hours, medium was renewed and EGF re-added every day. Samples were collected after 72 hours and processed for western blot analysis of cathepsin D. A) Western blotting analysis of CD expression in neuroblastoma cells homogenates. The membrane was probed with GAPDH as loading control. The blot is representative of three independent experiments. Densitometry of the bands is reported in the histogram. Significance was considered as follow: ** p < 0.01. B) Doubling time (Dt) of the four cell lines.
Figure 2.
Cathepsin D expression differs in 2D and 3D SH-SY5Y cell cultures. SH-SY5Y cells were seeded both in adherent and non-adherent Petri dishes, at 4,000 cells/cm2 and 1,000,000 cells/Petri, respectively, and let grow for 48 hours. Medium was refreshed every 48 hours, supplemented with 100 μM PstA where indicated. A) Western blotting analysis of CD expression in 2D and 3D cell homogenates. The membrane was probed with β-tubulin as loading control. The blot is representative of three independent experiments. Densitometry of the bands is reported in the histogram. B) Cell growth was monitored at the phase-contrast microscope and images were acquired at the time point indicated (time 0 h, 2-,5- and 7-days). Scale bar = 25 μm; magnification = 5x. Viable SH-SY5Y cells grown in adherent condition were counted, and data from triplicate for each experimental condition are shown in the graph. C) The spheroid’s growth was monitored at the phase-contrast microscope and images were acquired at the time point indicated (time 0 h, 2-,5- and 7-days). Scale bar = 100 μm; magnification = 20x. The quantification of 3D spheroid’s size was performed with ImageJ software. The area is indicated as Arbitrary Unit (A.U.). Data represent the average ± S.D. calculated for at least 5 to 10 spheroids for each condition in three separate experiments. Significance was considered as follows: **** p < 0.0001; *** p < 0.001; ** p < 0.01.
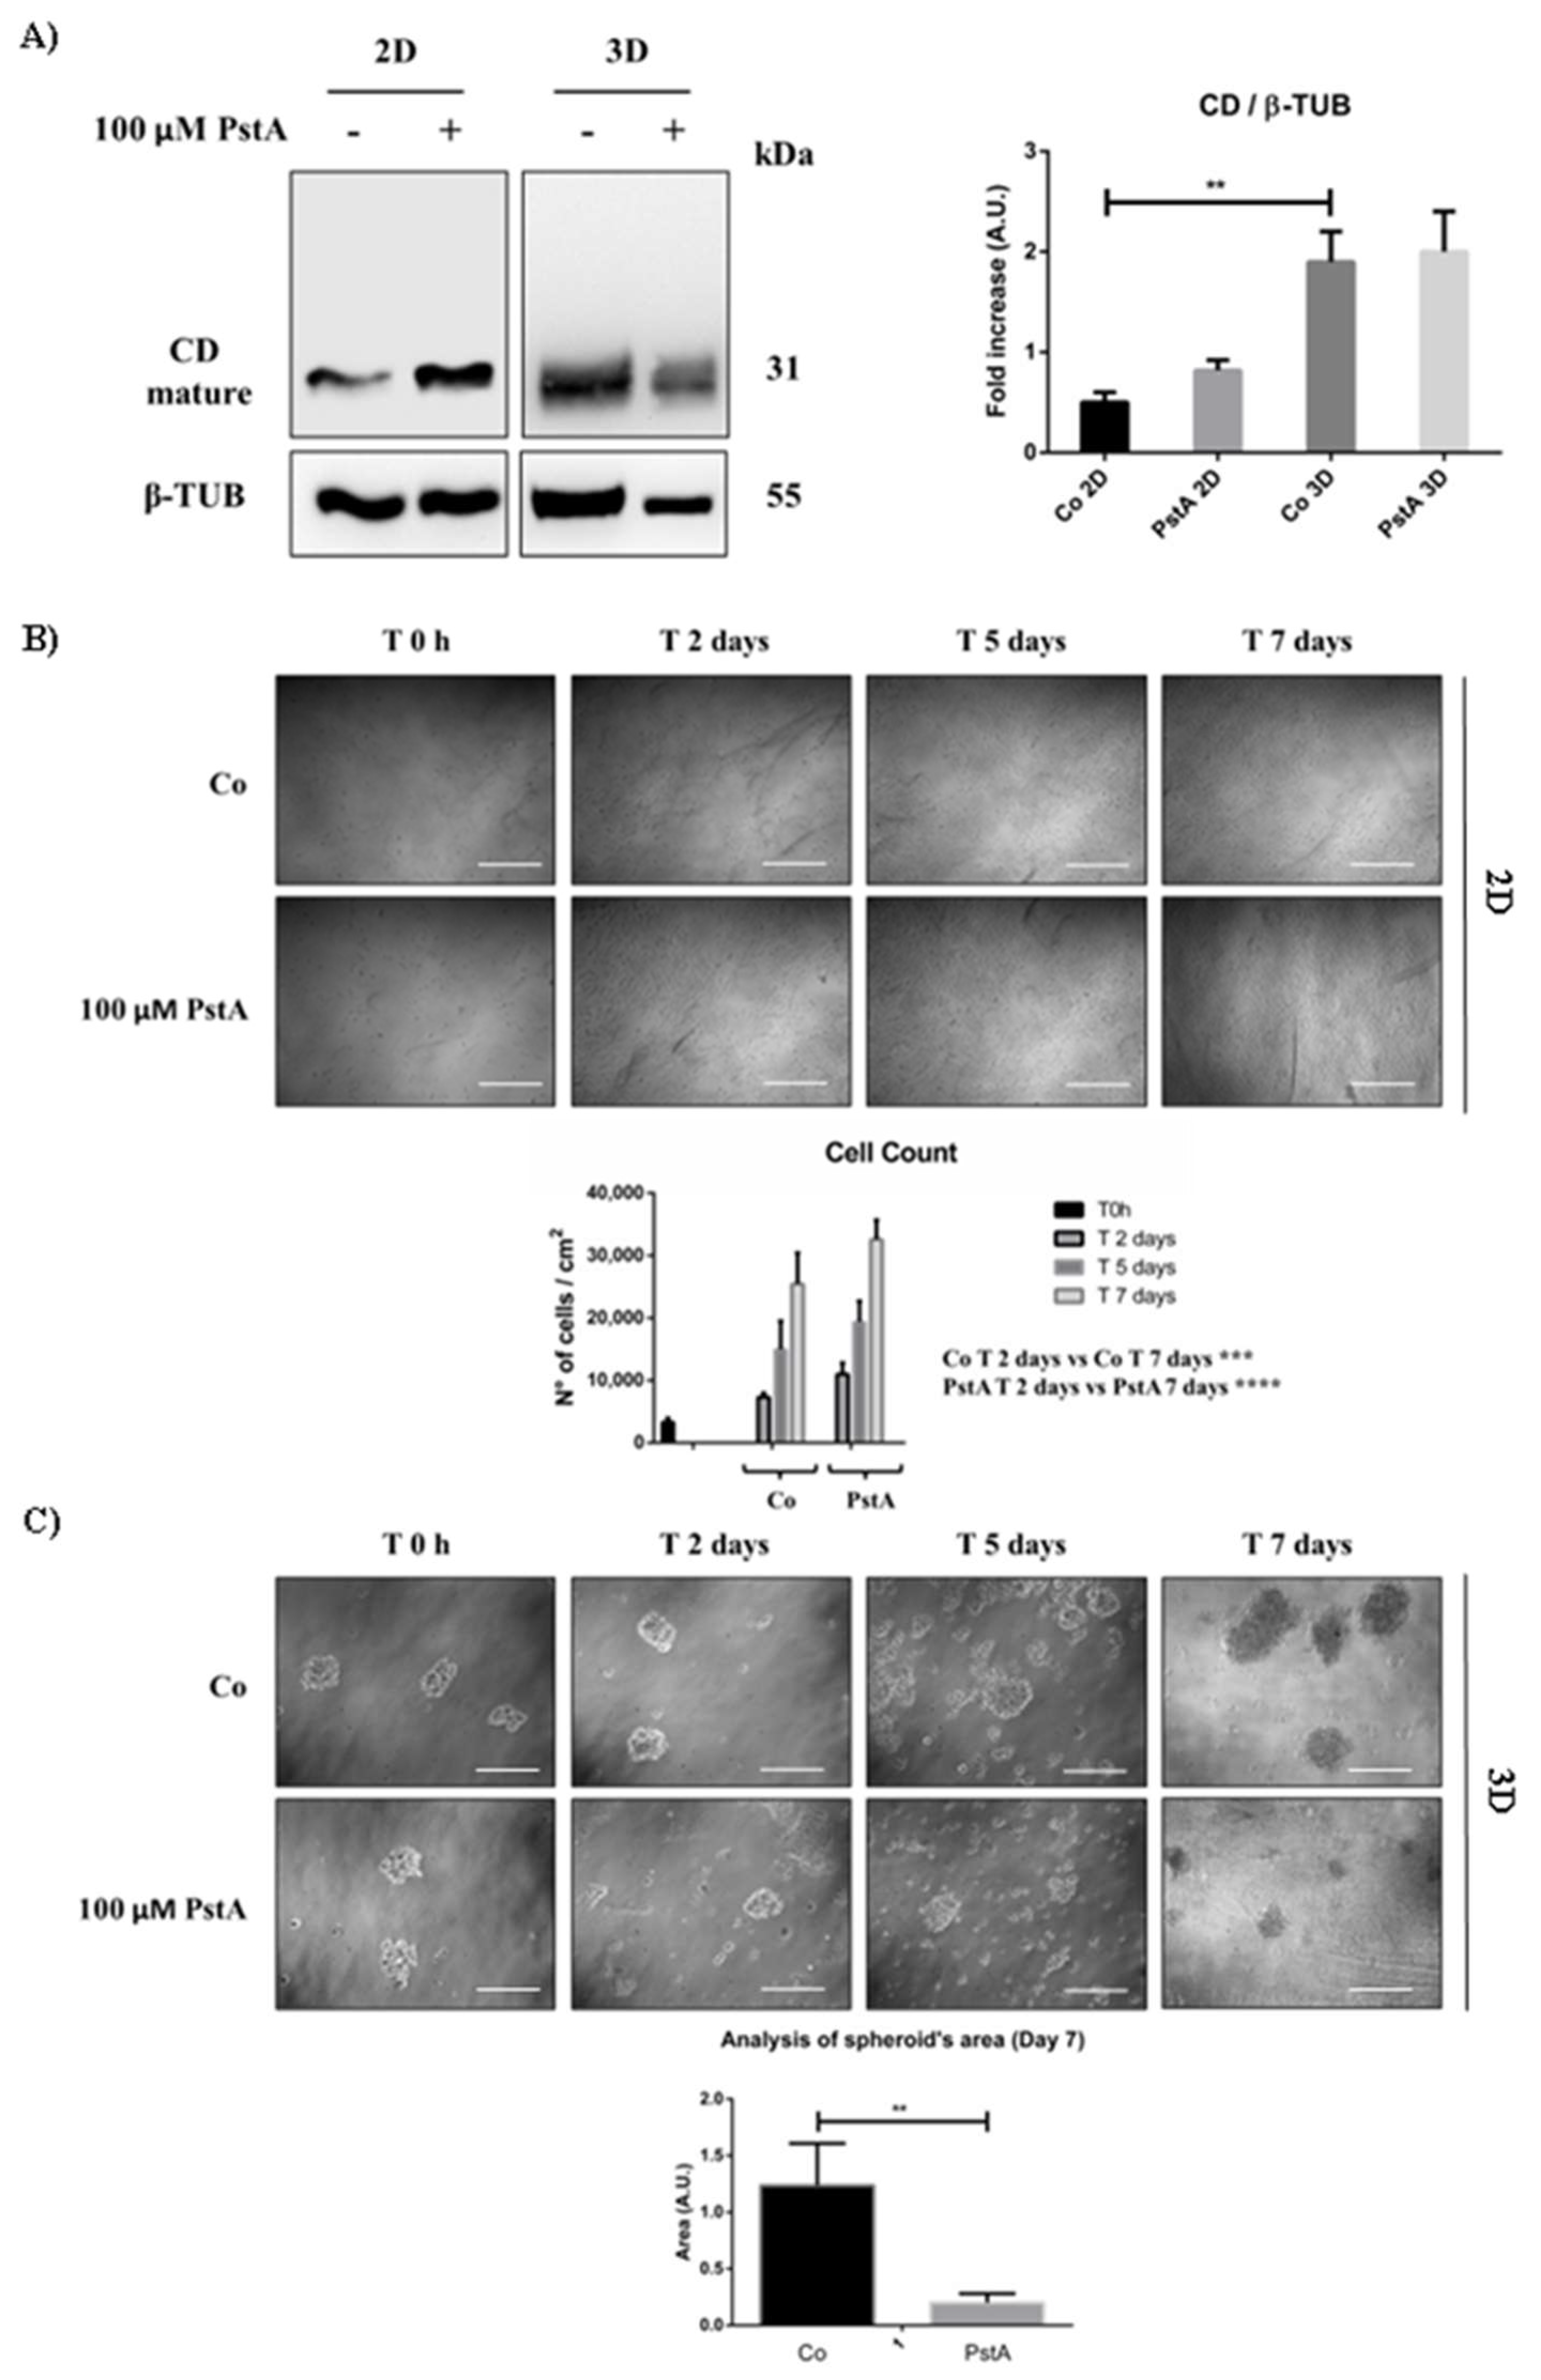
Figure 3.
SH-SY5Y Sham, KD-CD and Over CD clones show different growth rates. A) Immunofluorescence performed on SH-SY5Y clones. Cells were seeded on sterile coverslips and then fixed and stained for CD (red); nuclei were marked with the UV fluorescent dye DAPI. Scale bar = 20 µm; magnification = 63x. B) Graph representing cell count. Cell counting was performed in triplicate for each experimental condition. C) 3D cultures of neuroblastoma clones. SH-SY5Y Sham, KD-CD and Over CD cells were seeded on non-adherent Petri dishes and maintained in culture for 7 days. New fresh medium was replaced every 48 hours. The 3D spheroid’s growth was monitored at the phase-contrast microscope and pictures were acquired. Scale bar = 100 μm; magnification = 20x. The quantification of 3D spheroid’s size was performed with ImageJ software. The area was indicated as Arbitrary Unit (A.U.). Data represent the average ± S.D. calculated for at least 5 to 10 spheroids for each condition in three separate experiments. Significance was considered as follow: **** p < 0.0001; ** p < 0.01.
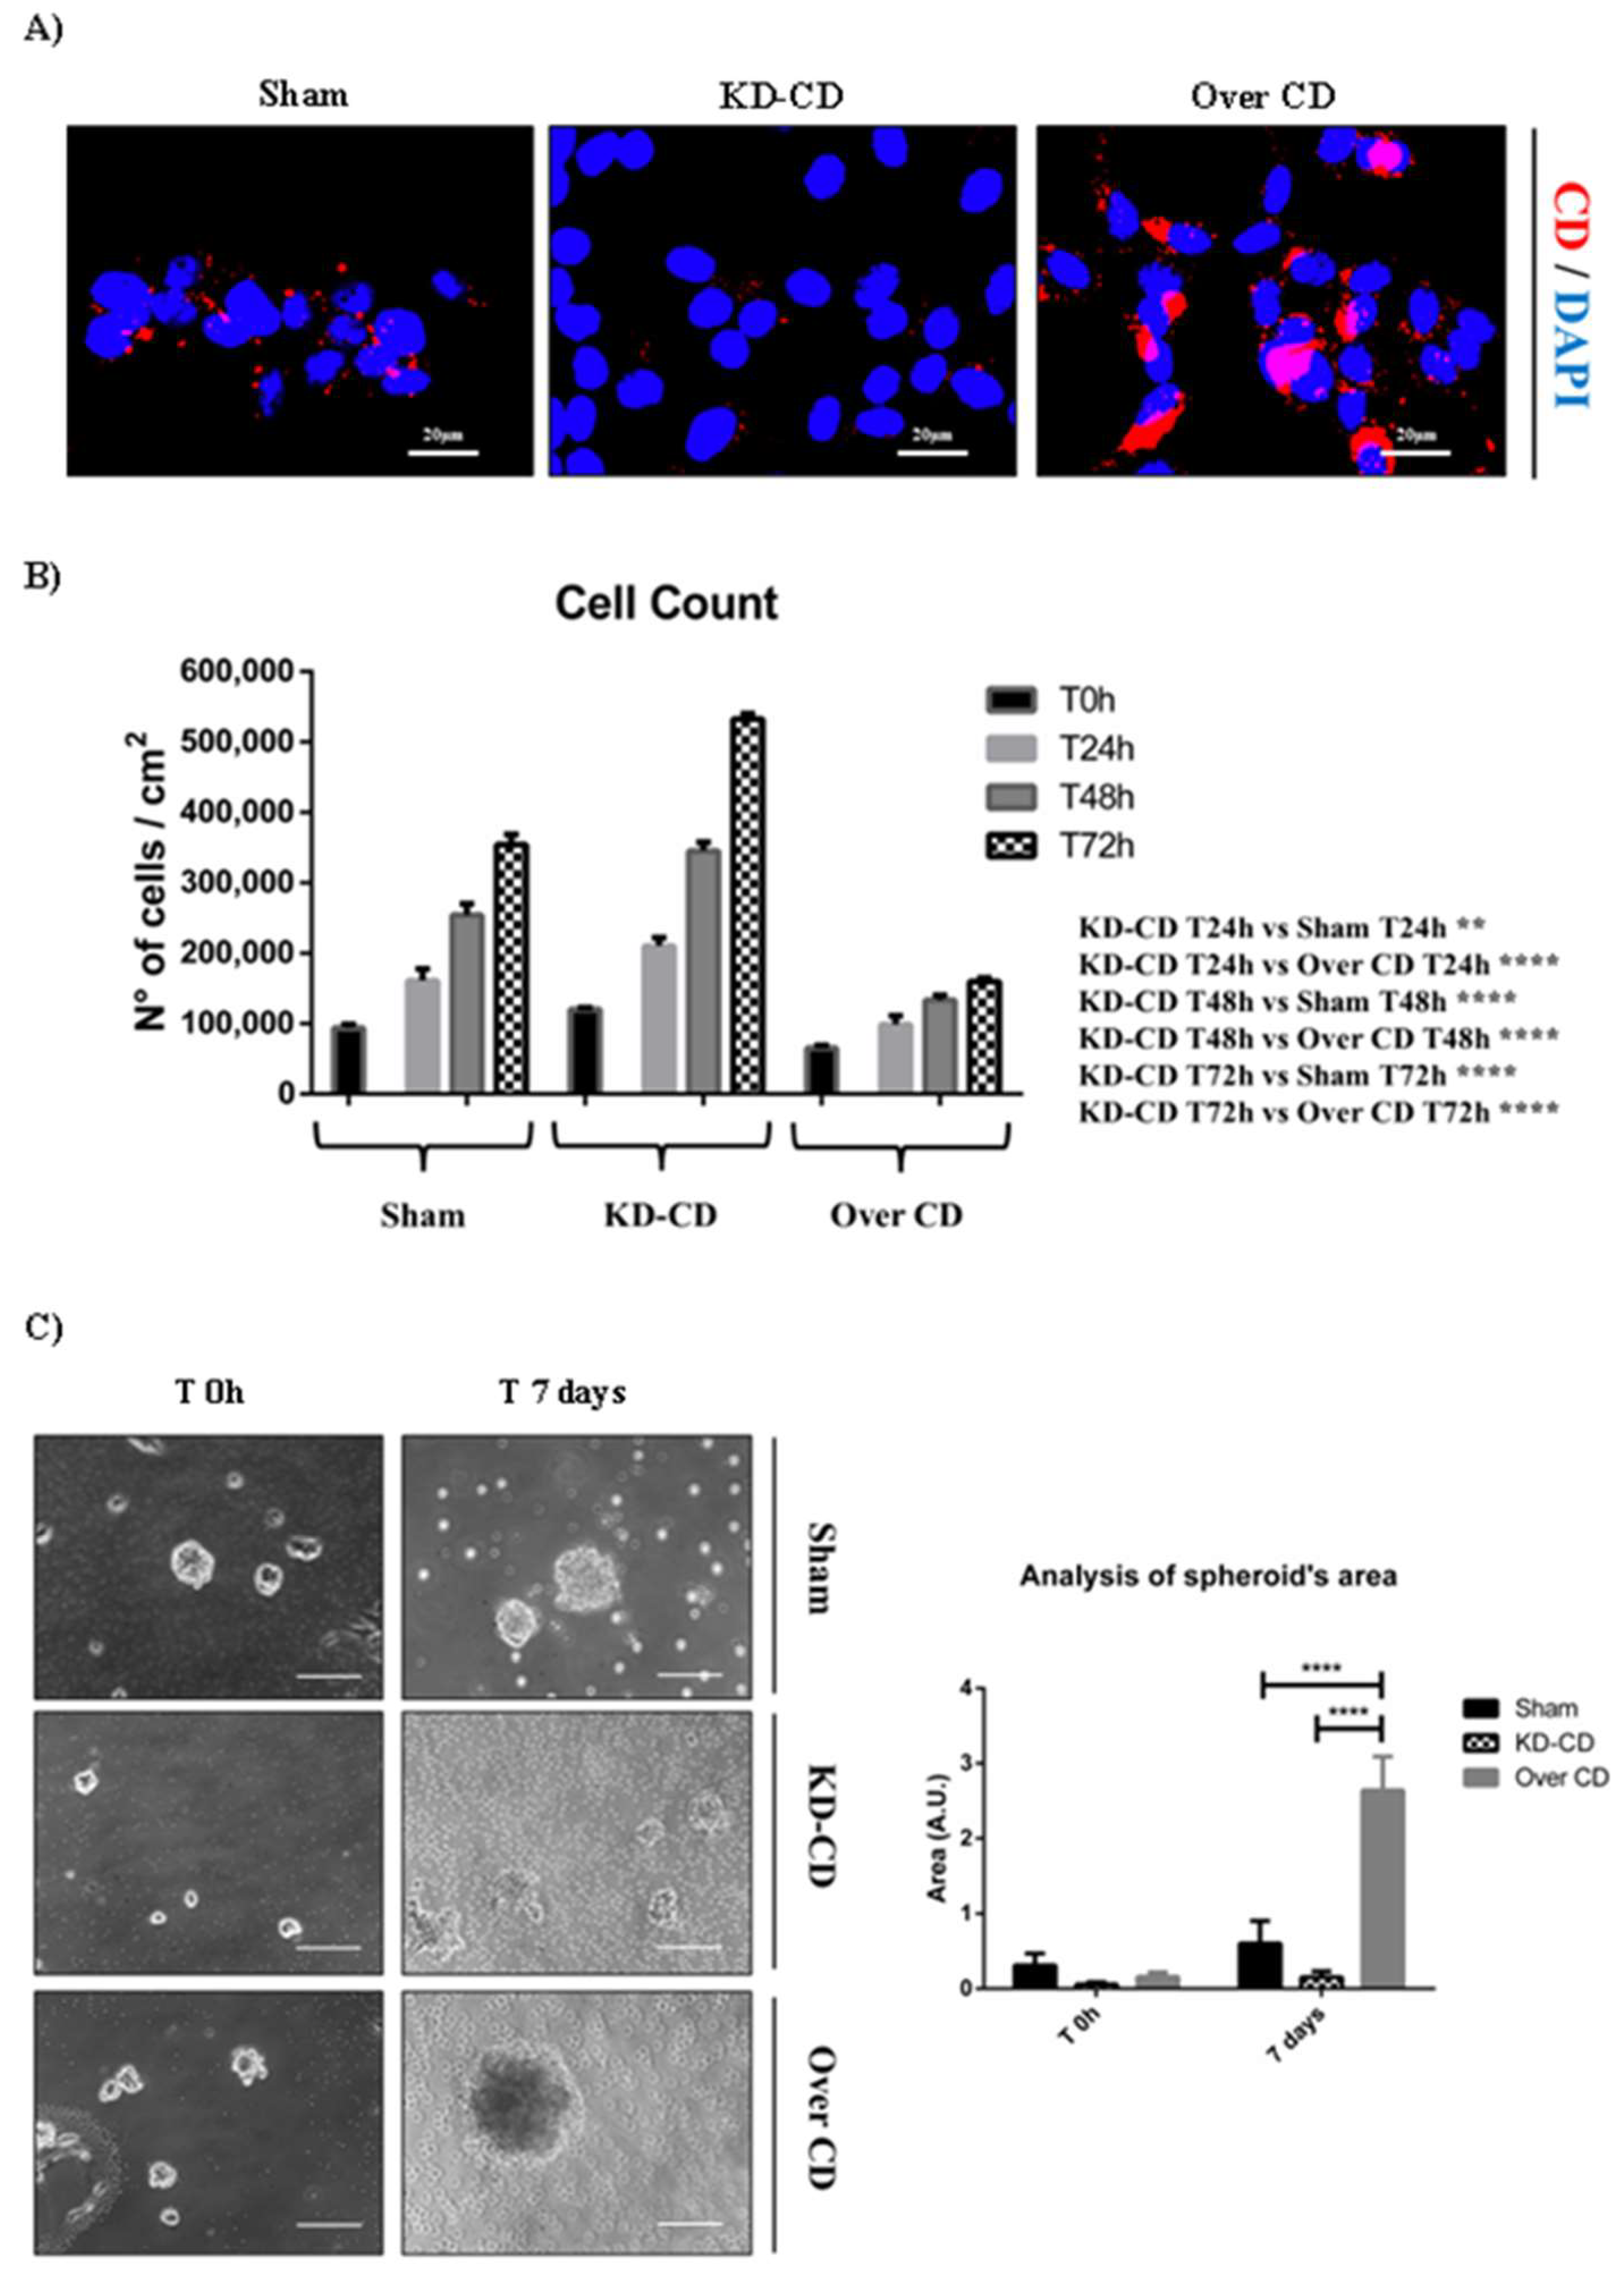
Figure 4.
EGF stimulation of neuroblastoma growth depends on cellular level of cathepsin D. A) Clonogenic assay performed on SH-SY5Y transgenic clones upon stimulation with 20 ng/ml EGF. Colonies were stained as described in the Materials and methods section. B) Cell growth and number of colonies were estimated through photometric measurements and CellCounter Software and are shown in the graph. Data ± S.D. are representative of three independent replicates. Significance was considered as follow: **** p < 0.0001; ** p < 0.01; * p < 0.05.
Figure 5.
CD knockdown clone expresses high level of nuclear Ki-67 proliferation marker and reduced p27 cell cycle inhibitor. A) Cell counting of viable cells of KD-CD or Over CD or a mix of both at the ratio indicated, in the absence or the presence of EGF. Medium was renewed and EGF added every 24 h. The cells were cultivated for 24, 48 and 72 h. B-C) Immunofluorescence double staining of CD and Ki-67 or p27 in SH-SY5Y KD-CD, Over CD and mixed cultures at different ratio: 50% KD-CD + 50% Over CD cells (1:1), 25% KD-CD + 75% Over CD (1:3) and 75% KD-CD + 25% Over CD cells (3:1). Fresh medium was replaced every day and EGF was added as indicated. After 72h of treatment, cells were fixed and stained for Ki-67 (green) / CD (red) and p27 (green) / CD (red) (B-C). Scale bar = 20 µm; magnification = 63x. Representative images of three independent experiments are shown. Quantification of Ki-67 and p27 fluorescent signal was performed by ImageJ software (B-C). The percentages of CD negative and CD positive cells relative to the total number of Ki-67 positive cells, calculated in random fields, are shown in graph (B). D-E) Percentages of CD negative and CD positive cells relative to the total cell population, calculated in random fields, are shown in the graphs. Significance was considered as follow: **** p < 0.0001; *** p < 0.001; ** p < 0.01; * p < 0.05.
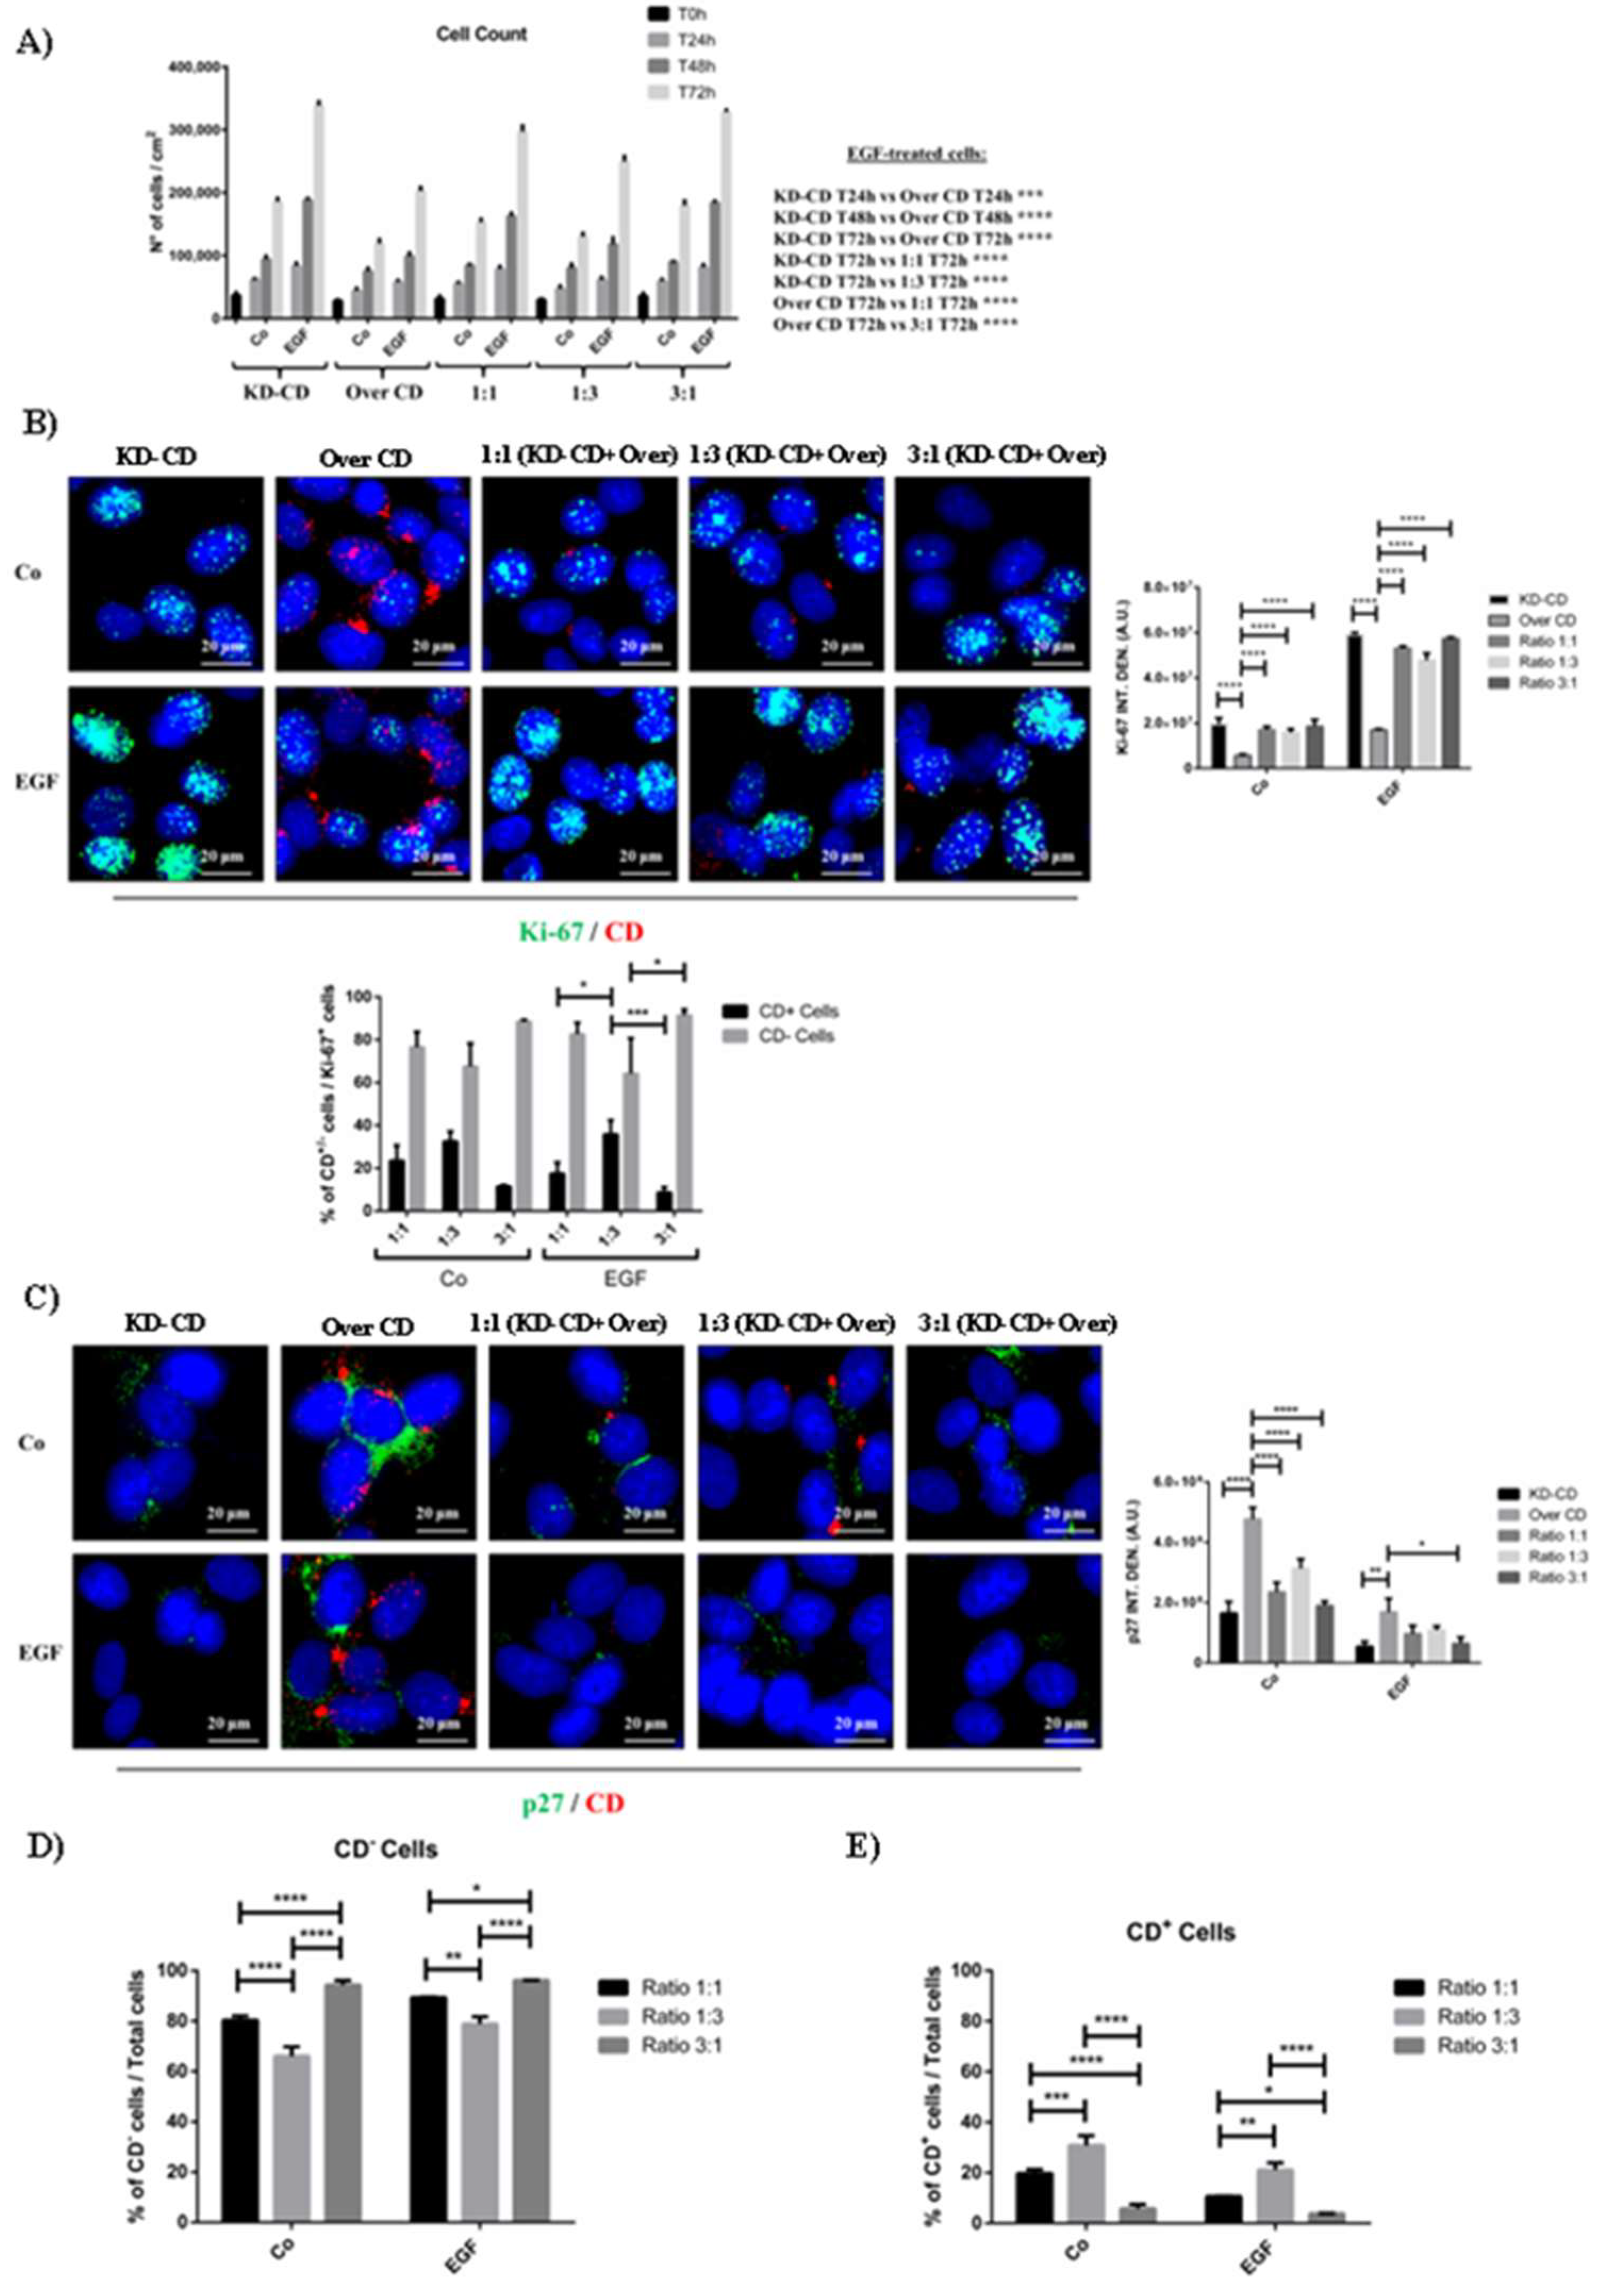
Figure 6.
Analysis of cathepsin D content in SH-SY5Y mixed clones. Western Blotting showing the expression of cathepsin D in pure cultures (KD-CD and Over CD) and in mixed co-cultures: 50% KD-CD + 50% Over CD cells (1:1), 25% KD-CD + 75% Over CD (1:3) and 75% KD-CD + 25% Over CD cells (3:1). A) Samples were collected at time 0h, before EGF treatment, and processed for western blot analysis of CD expression. B-C) Cells were cultured for 72 hours, medium was renewed and EGF re-added every day. Samples were collected after 72 hours and processed for western blot analysis of cathepsin D. Membranes were probed with β-actin as loading control. All blots are representative of three independent experiments. Densitometry of the bands is reported in the histogram. Significance was considered as follow: **** p < 0.0001; ***p < 0.001; * p < 0.05.
Figure 7.
Monitoring of spheroid’s formation in pure and mixed clones co-cultured in the absence or presence of EGF. SH-SY5Y KD-CD, Over CD and co-cultures (50% KD-CD + 50% Over CD cells (1:1), 25% KD-CD + 75% Over CD (1:3) and 75% KD-CD + 25% Over CD cells (3:1)) were plated on non-adherent Petri dishes and let grow for 48 hours to allow spheroid’s formation. Cells were cultured for 7 days after the first treatment. At time 0h, cells were incubated with EGF and re-treated in fresh medium at day 2 and 5 until the endpoint of 7 days. A) The 3D spheroid’s growth was monitored at the phase-contrast microscope and images were acquired at different time points (time 0h, 2-, 5- and 7-days). Scale bar = 100 μm; magnification = 20x. B) Quantification of spheroid’s size was obtained through ImageJ software. The area is indicated as Arbitrary Unit (A.U.). Data represent the average ± S.D. calculated for at least 5 to 10 spheroids for each condition in three separate experiments. The graphs show the statistically significant differences of spheroid’s area detected at time day 7 (endpoint). Significance was considered as follow: * p < 0.05. C) Graphs representing the increasing growth of spheroids in control and EGF-treated conditions. The area is indicated as Arbitrary Unit (A.U).
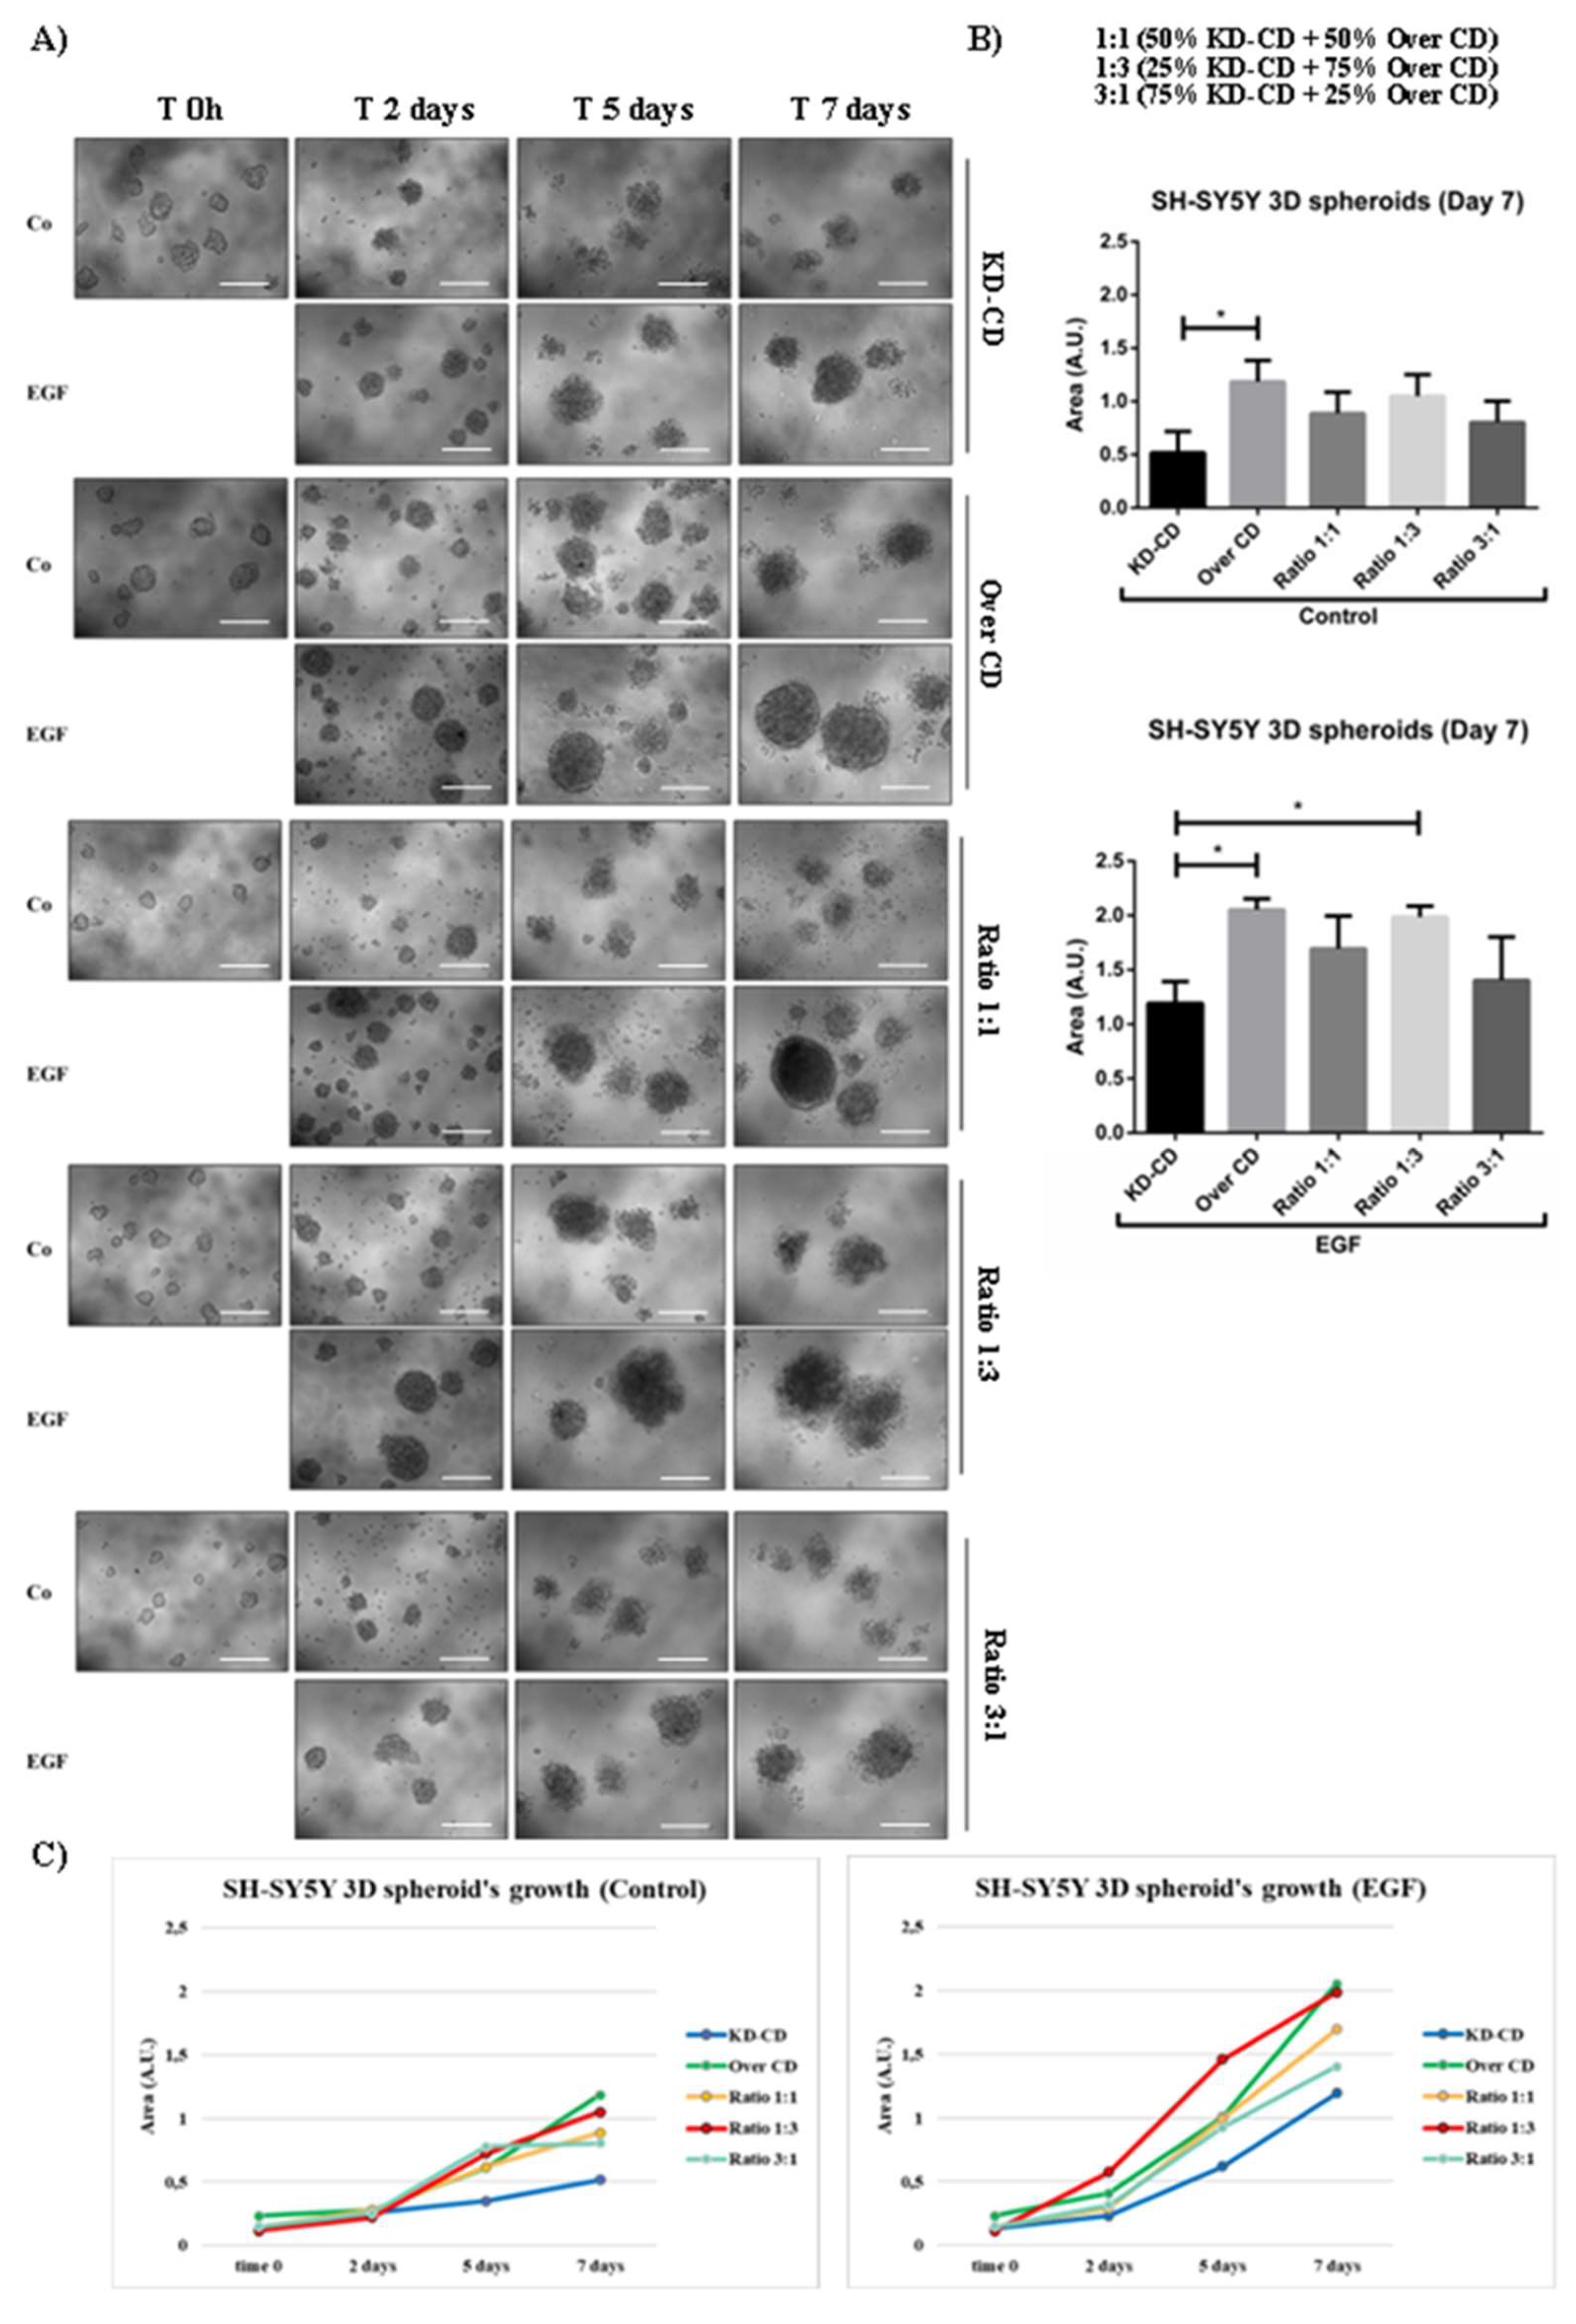
Figure 8.
SH-SY5Y Over CD shows a greater ability to grow in suspension compared to KD-CD cells. SH-SY5Y 3D spheroids of pure clones or clones mixed at the indicated ratio were cultured for 7 days in the absence or presence of EGF, samples were collected and then homogenates were assayed by western blotting for cathepsin D. The filter was stripped and re-probed for β-tubulin as loading control. Densitometry of the bands is reported in the histograms. Significance was considered as follow: **** p < 0.0001; ***p < 0.001.
Figure 9.
CD knocked-down SH-SY5Y cells rescue the ability to grow in adherent condition. SH-SY5Y Sham, KD-CD, Over CD and mixed co-cultures, 50% KD-CD + 50% Over CD cells (1:1), 25% KD-CD + 75% Over CD (1:3) and 75% KD-CD + 25% Over CD cells (3:1) were seeded in non-adherent Petri dishes and let grow for 72 hours to allow spheroid’s formation (500,000 cells/Petri). On the third day (indicated in Figure as Time 0h), neurospheres were collected, resuspended in fresh medium, plated in adherent Petri dishes, and maintained in culture for other 72 hours. New fresh medium was replaced every day. Cell homogenates were processed for western blot analysis. A-B) Images were acquired at the phase-contrast microscope every day to monitor cell attachment and growth. Scale bar = 100 μm; magnification = 20x (T0h), 5x (T24h, 48h, 72h). C) Graph representing the area of secondary colonies calculated in different representative fields of three separate experiments (at the endpoint of 72 hours). D) Western blot analysis of CD in cell homogenates. The membrane was stripped and re-probed for β-tubulin as loading control. The blot is representative of three independent experiments. Densitometry of the bands is reported in the histogram. Significance was considered as follow: **** p < 0.0001; ***p < 0.001; ** p < 0.01; * p < 0.05.
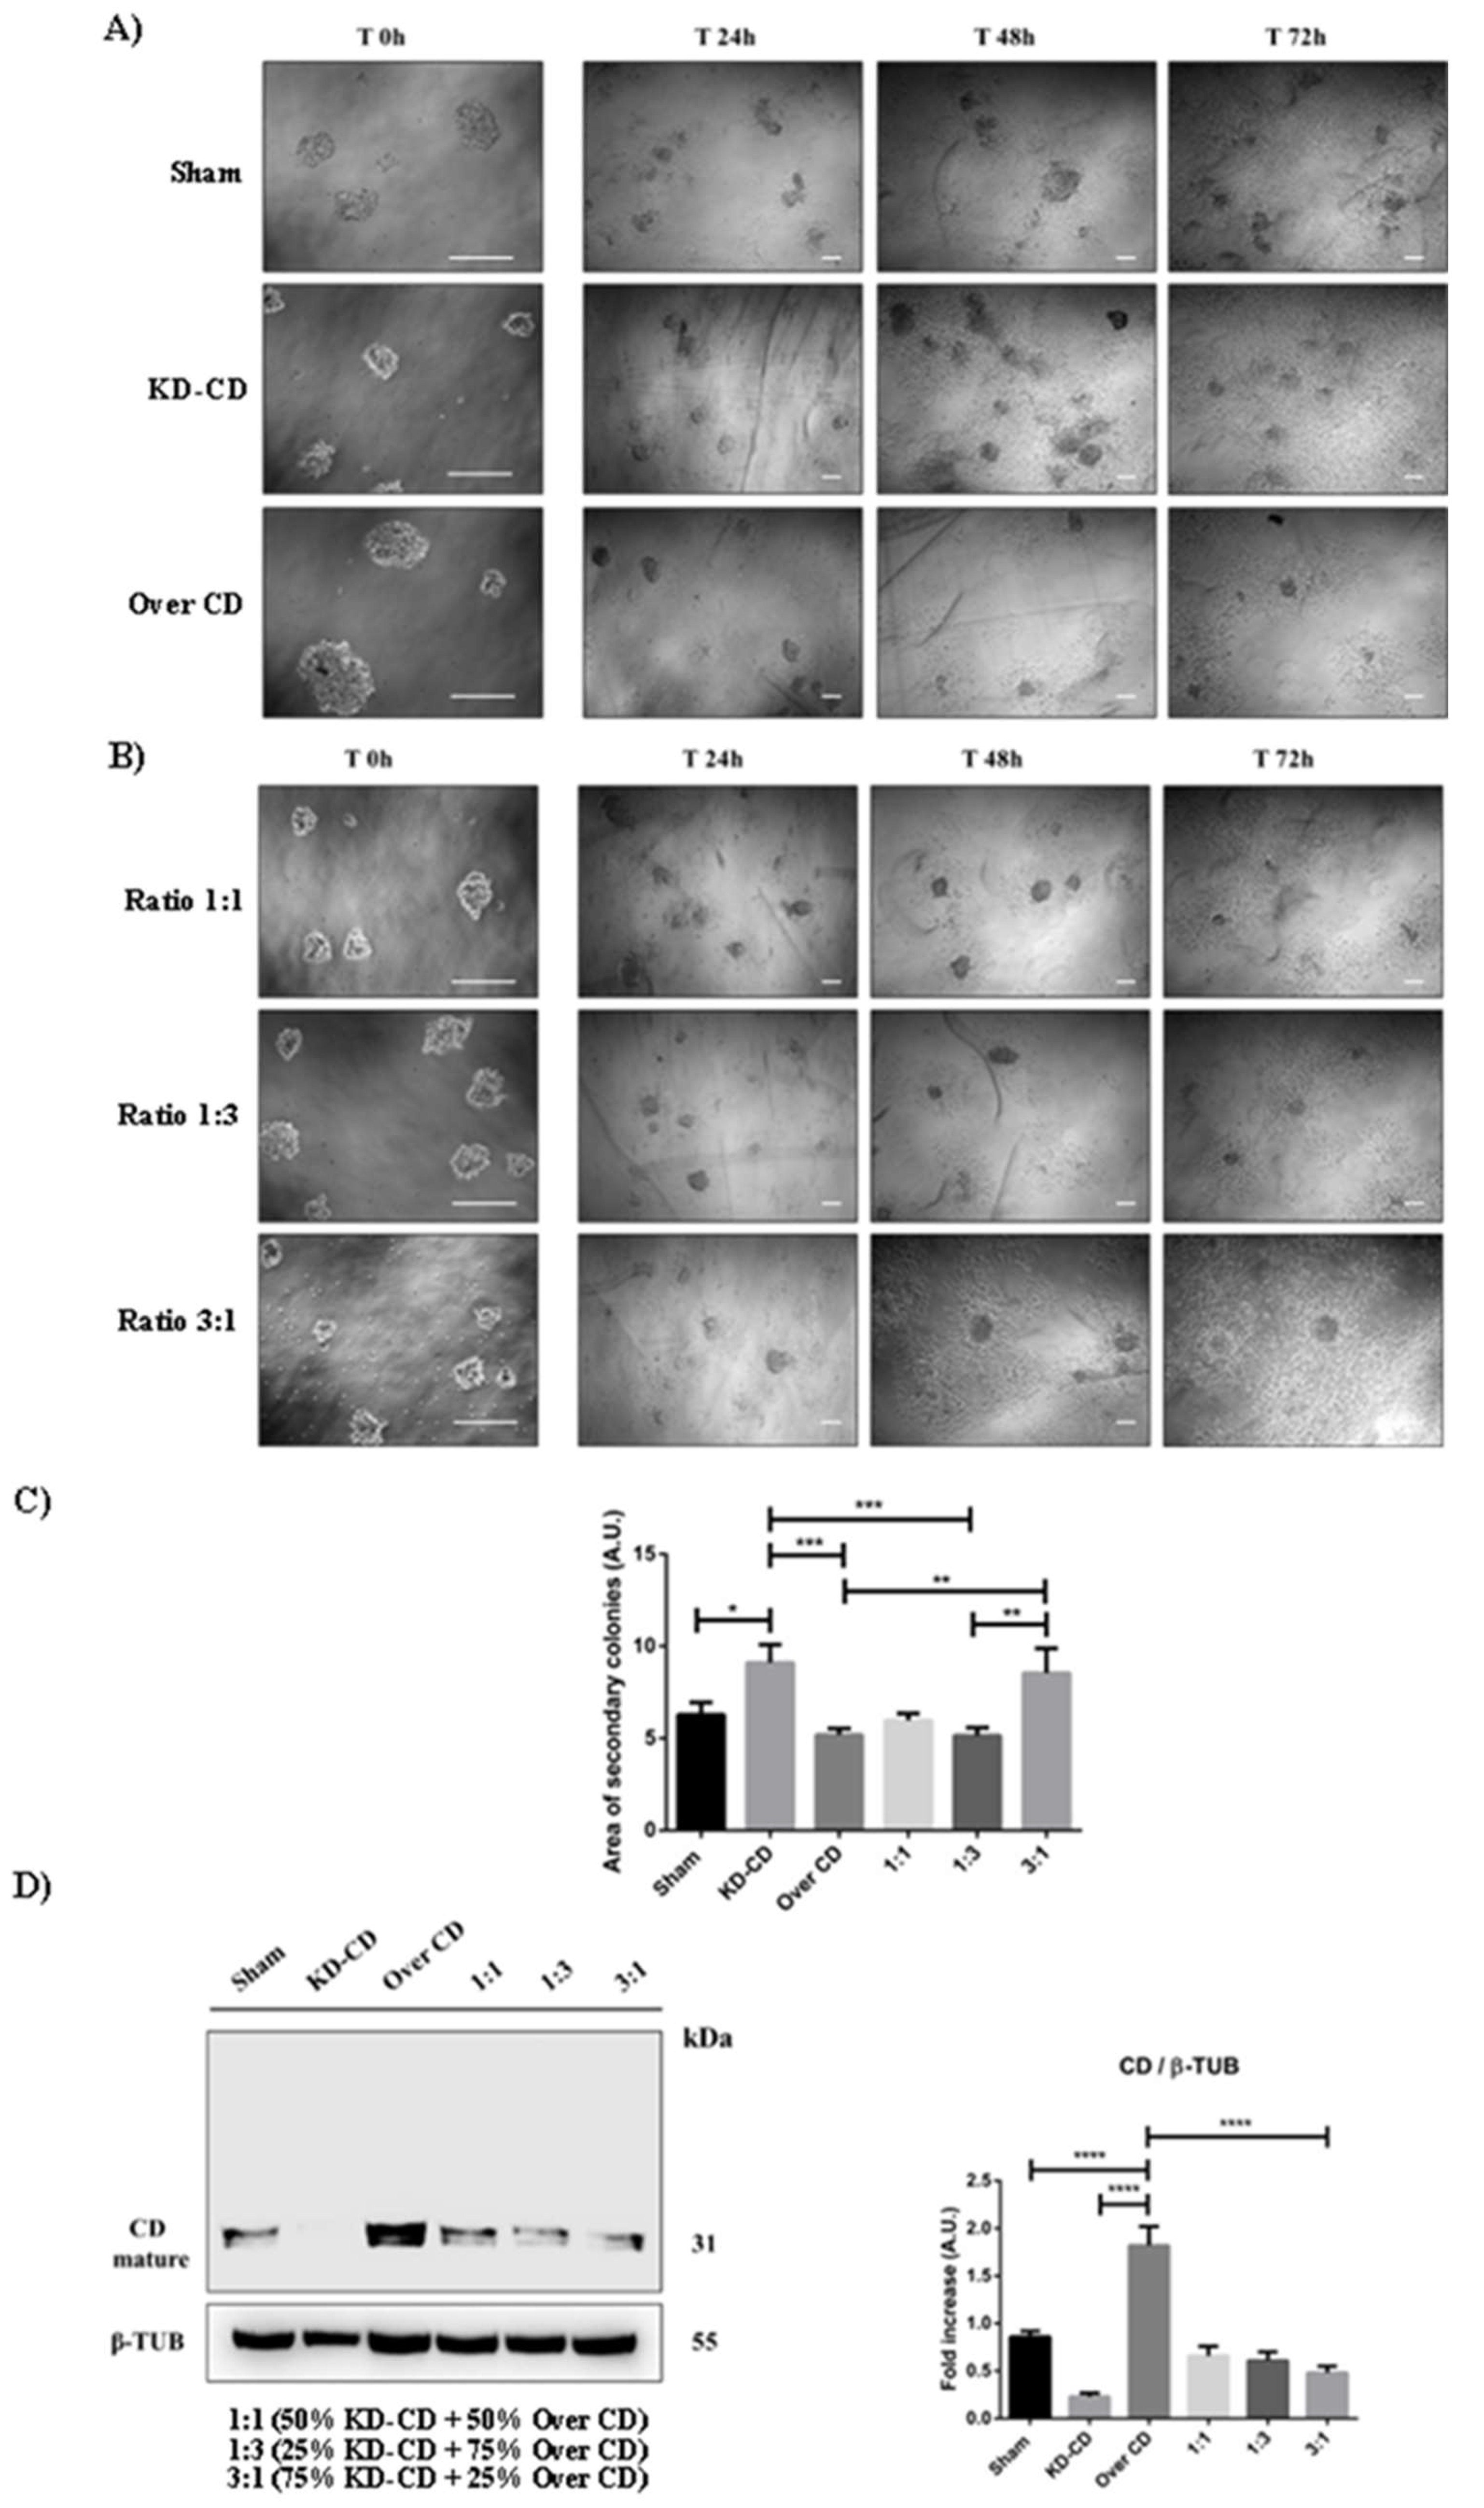
Figure 10.
IMR-32 cells expressing low CD levels show a greater ability to grow in adherent condition. IMR-32, LAN-5 and SK-N-BE(2) cells were seeded in non-adherent Petri dishes and let grow for 72 hours to allow spheroid’s formation (500,000 cells/Petri). On the third day (indicated in Figure as Time 0h), neurospheres were collected, resuspended in fresh medium, plated in adherent Petri dishes, and maintained in culture for other 72 hours. New fresh medium was replaced every day. Cell homogenates were processed for western blot analysis. A) Images were acquired at the phase-contrast microscope every day to monitor cell attachment and growth. Scale bar = 100 μm; magnification = 20x (T0h), 5x (T24h, 48h, 72h). B) Graph representing the area of secondary colonies calculated in different representative fields of three separate experiments (at the endpoint of 72 hours). C) Western blot analysis of CD expression in cell homogenates. The membrane was re-probed for β-tubulin as loading control. The blot is representative of three independent experiments. Densitometry of the bands is reported in the histogram. Significance was considered as follow: ***p < 0.001; ** p < 0.01; * p < 0.05.
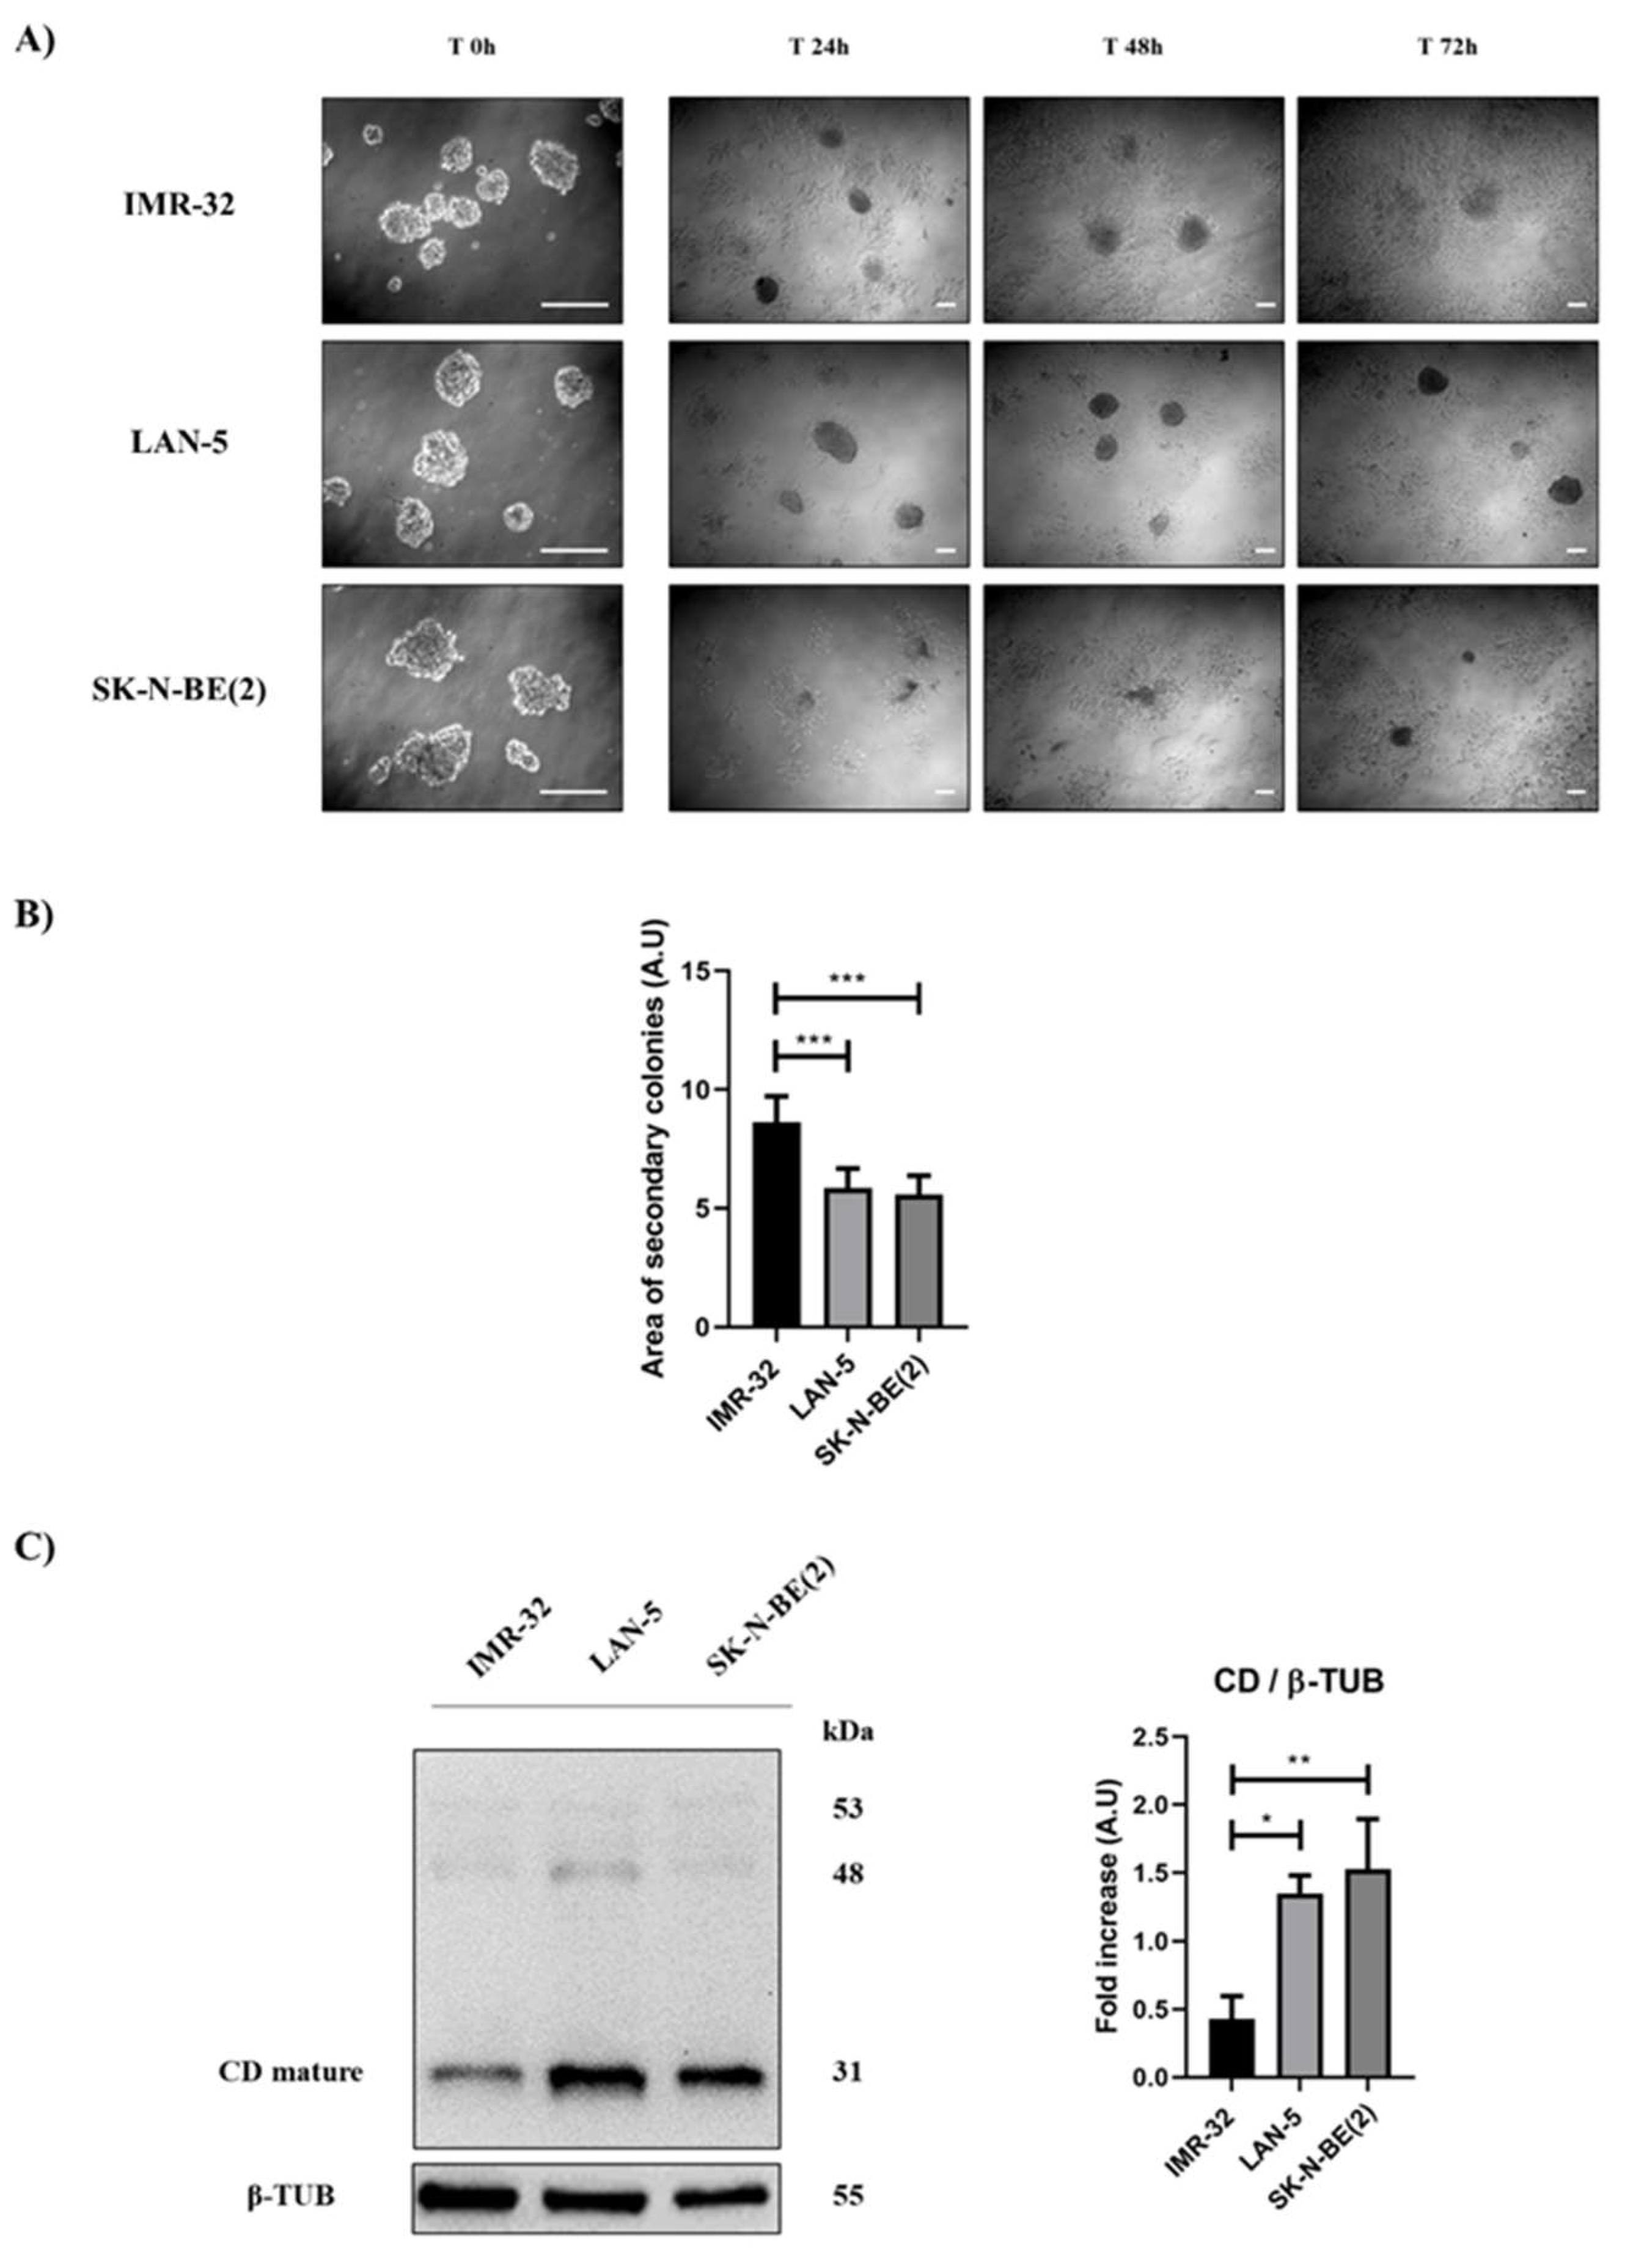
Table 1.
Doubling time calculated for SH-SY5Y Sham, KD-CD and Over CD clones.
Table 1.
Doubling time calculated for SH-SY5Y Sham, KD-CD and Over CD clones.
| Clone |
Doubling Time |
| Sham |
37.6 ± 1.7 |
| KD-CD |
29.3 ± 1.2 |
| Over CD |
55.6 ± 1.1 |
|
Disclaimer/Publisher’s Note: The statements, opinions and data contained in all publications are solely those of the individual author(s) and contributor(s) and not of MDPI and/or the editor(s). MDPI and/or the editor(s) disclaim responsibility for any injury to people or property resulting from any ideas, methods, instructions or products referred to in the content. |
© 2024 by the authors. Licensee MDPI, Basel, Switzerland. This article is an open access article distributed under the terms and conditions of the Creative Commons Attribution (CC BY) license (http://creativecommons.org/licenses/by/4.0/).
