Preprint
Article

Crack Detection of Concrete Based on Improved CenterNet Model

Altmetrics

Downloads

88

Views

30

Comments

0

A peer-reviewed article of this preprint also exists.

This version is not peer-reviewed

Submitted:

25 January 2024

Posted:

26 January 2024

You are already at the latest version

Alerts
Abstract
Cracks on concrete surfaces are vital factors affecting construction safety. Accurate and efficient crack detection can prevent safety accidents. Using drones to photograph cracks on a concrete surface and detect them through computer vision technology has the advantages of accurate target recognition, simple practical operation, and low cost. To solve this problem, an improved CenterNet concrete crack-detection model is proposed. First, a channel-space attention mechanism is added to the original model to enhance the ability of the convolution neural network to pay attention to the image. Second, a feature selection module is introduced to scale the feature map in the downsampling stage to a uniform size and combine it in the channel dimension. In the upsampling stage, the feature selection module adaptively selects the combined features and fuses them with the output features of the upsampling. Finally, the target size loss is optimised from a Smooth L1 Loss to IoU Loss to improve its inability to adapt to targets of different sizes. The experimental results show that the improved CenterNet model reduces the FPS by 123.7, increases the GPU memory by 62MB, increases the FLOPs by 3.81, and increases the AP by 0.154 compared with the original model. The GPU memory occupancy remained stable during the training process and exhibited good real-time performance and robustness.
Keywords: 
Subject: Engineering  -   Civil Engineering

1. Introduction

With the rapid development of China's economy, civil engineering construction projects are increasing, and as one of the pillar industries of the economy, the construction industry has played an irreplaceable role in national construction. With the increasing number of buildings, roads, bridges, tunnels, and other infrastructures, maintaining them in good working conditions is extremely important for public safety. Concrete cracks are usually caused by internal stress and environmental action, leading to the internal fatigue of the material and resulting in cracks and fractures on the surface of the concrete [1]. The occurrence of cracks often represents a change in the structure where the cracks occur. Over time, further cracking and falling off often occur, and water seepage occurs. Therefore, crack detection is of great significance for the healthy operation of construction projects [2]. Based on the location of cracks in the material, they can be divided into surface and internal cracks. The main research object of this study was the surface cracks in construction engineering concrete.
Surface crack detection methods include eye observation, ultrasonic detection [3], eddy current detection [4], speckle interference [5], penetration detection [6], laser holography [7], X-ray detection [8], computer vision detection [9]. Most of the aforementioned methods have formed a relatively complete detection system that can perform surface crack detection well; however, they also have their adaptation scenarios and shortcomings. For example, although ultrasonic detection is sensitive to planar defects, it is difficult to detect nonplanar structures owing to acoustic coupling, and the surface crack detection effect of arch structures facing some projects could be better. Although the detection accuracy is high, optical detection is significantly affected by ambient light interference and vibrations during actual operation. The infrared detection method has a fast detection speed; however, the detection environment is limited due to the equipment's large size. Current computer vision detection technology often obtains the surface image or video of the research object through a camera and other sensing equipment; then, the obtained image or video is pre-processed and feature extracted, and different algorithm models are trained and tested to finally achieve the purpose of target recognition or positioning [10].
Wang Fan [11] studied the problem of crack detection using mathematical morphology and image fusion. Chambon [12] conducted a study on road crack detection and evaluation using computer vision. Tongji University studied an MTI-100 tunnel-detection system and achieved crack detection and location [13]. Soukup [14] used convolutional neural networks to detect the surface cracks. Yaping et al. applied the SegNet network to surface crack detection and achieved satisfactory results. Using an adaptive iterative method, Peng [15] used an improved Otsu threshold segmentation algorithm to study crack images. Yang [16] proposed a new image analysis method for concrete crack detection and conducted a detailed study on a detection method based on edge cracks. Fernandez [17] studied a decision-tree heuristic algorithm for crack detection and achieved satisfactory simulation results. Li [18] studied a concrete surface crack detection method by combining the improved C-V model with the Canny iterative operator; however, the operation time was relatively long, and there were certain limitations.
In summary, current methods for solving the surface crack detection problem based on computer vision technology can be divided into three categories: image classification, object detection, and pixel segmentation. With the continuous development of computer technology and machine learning algorithms, concrete crack detection based on computer vision technology is expected to be increasingly applied in various scenarios. Crack pictures on the surface of concrete were collected by UAV shooting technology. Then the cracks on the surface of construction concrete were detected using computer vision detection technology, which has the characteristics of simple principle, convenient operation, strong flexibility, high precision, low cost, and no contact.

2. CenterNet

The CenterNet algorithm is a single-stage model without an anchor frame and was first proposed in 2019 [19]. CenterNet algorithm has the characteristics of high precision, fast training speed, and simple network structure. The principle of the CenterNet model is as follows: the center point of the target is used to replace the anchor frame, the peak value of the thermal map is used as the center point of the detection object, and then the threshold is set for screening and comparison of the target center point, and finally the category information is obtained by regression using the image features. The training process of CenterNet does not need to consider the anchor mechanism, nor does it need to set or postprocess hyperparameters in advance, significantly reducing the computational load on the entire network.
The original CenterNet uses ResNet18, DLA-34, and Hourglass convolutional networks for feature extraction and then transfers the feature map to the detection module for processing. Finally, the target centre point and category, target length and width prediction, and centre point bias are transferred through the convolution operation [20]. A schematic of the CenterNet algorithm is shown in Figure 1.
The CenterNet algorithm model makes predictions through three convolution blocks: target centre point and category, target length and width prediction, and centre point bias. The loss function of the CenterNet algorithm consists of the loss function of the centre point and classification, loss function of the target frame size, and loss function of the centre point bias [21].
The loss function Lk of the centre point and classification is the focal loss function, and the calculation formula is shown in Equation (1) [22].
L k = 1 N x y c ( 1 Y ^ x y c ) α l g ( Y ^ x y c ) , Y x y c = 1 ( 1 Y ^ x y c ) β ( Y ^ x y c ) α × l g ( g Y ^ x y c ) , o t h e r s
In the above formula, the subscript k in the centre point and classification loss function Lk represent the kth input image, N represents the number of keypoints in the image, subscript xyc represents the positive and negative samples of the image, and Yxyc is the label of the true value.
The centre point bias loss function Loffset adopts the Lloss function, and the calculation formula is shown in Equation (2) [23]:
L o f f s e t = 1 N p O ^ p ˜ - ( p R - P ˜ )
In the above formula, P is the coordinate of the true value of the original image target, and R represents the subsampling multiple.
The Lloss function is used for the target frame size loss function Lsize. The calculation formulas are shown in Equations (3) [24], where Sk represents the size of the original target frame.
L s i z e = 1 N k = 1 N S ^ p k S k
The final loss function was obtained by multiplying the loss function of the centre point by the classification, the loss function of the target frame size, and the loss function of the centre point bias by the corresponding coefficients, as shown in Equation (4).
L = L k + λ s i z e L s i z e + λ o f f L o f f

3. CenterNet Optimisation

The improvement of the original CenterNet model includes three aspects: adding a new channel space attention mechanism, adding a feature selection module, and optimising the loss function.

3.1. Addition of Channel Space Attention Mechanism

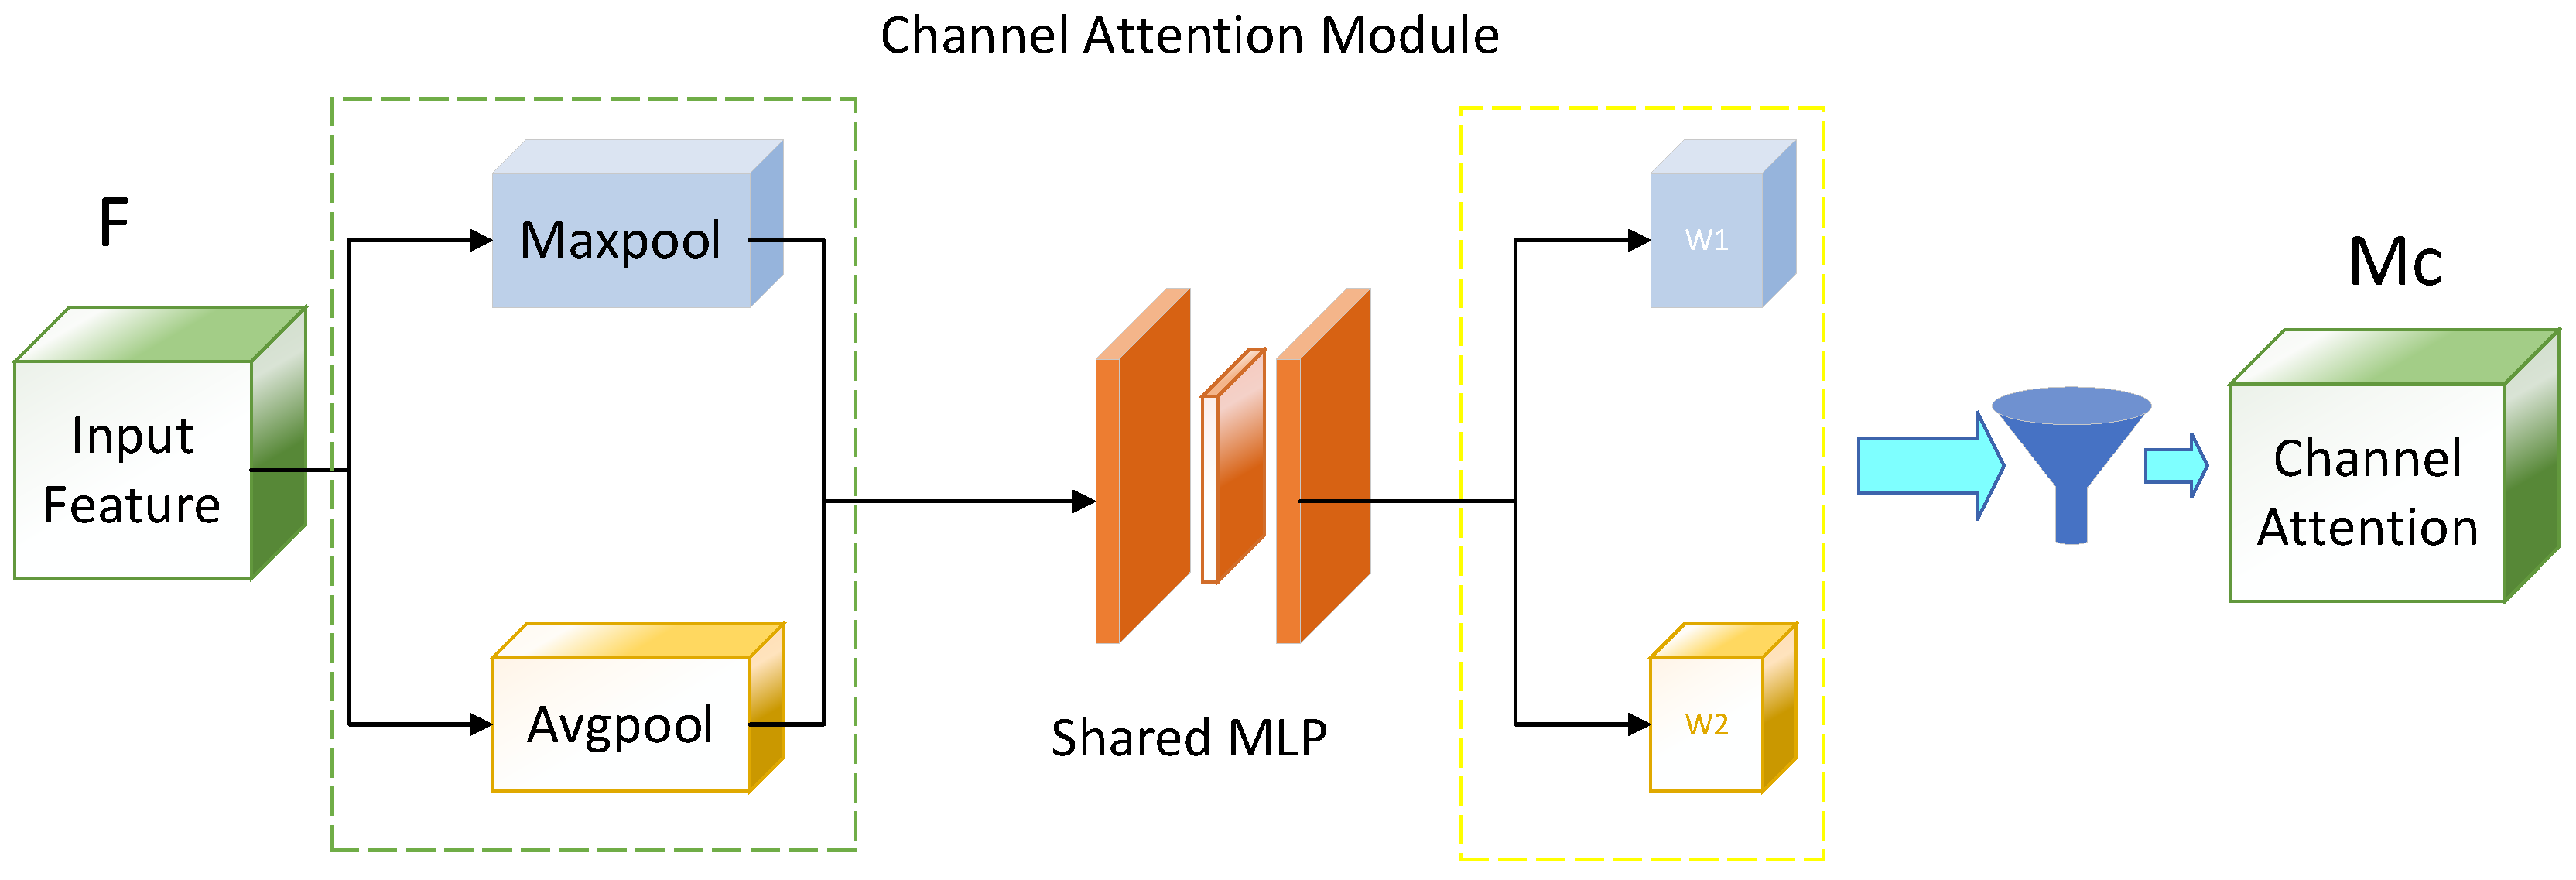
In the convolutional block attention module (CBAM), the channel attention uses global average pooling and global maximum pooling to obtain the global statistics of each channel, and learns the weight of the channel through two fully connected layers. Each channel was scaled using a sigmoid function to normalise the weights between 0 and 1. Finally, the scaled channel features are multiplied by the original features to produce features with enhanced channel importance [25,26].
The function of the channel attention mechanism is to continuously enhance the importance of the channel during the training process to improve the training effect on the network. The attention mechanism diagram of the CenterNet channel used in this study is shown in Figure 2.
The spatial attention module in the CBAM uses maximum and average pooling to obtain the maximum and average values for each spatial position. Because more channels are generated after convolution, the function of the spatial attention mechanism is to perform maximum pooling and average pooling operations on the channels of each feature point, obtain two different results, concatenate them, and then learn the weight of each spatial position through a convolution layer and sigmoid function. Finally, weights were applied to each spatial position on the feature map to produce features with enhanced spatial importance.
By introducing an attention module, the spatial attention mechanism enables the model to learn the attention weights of different regions adaptively so that it can pay more attention to important image regions while ignoring unimportant ones [27]. The spatial attention mechanism of CenterNet added in this study is shown in Figure 3.
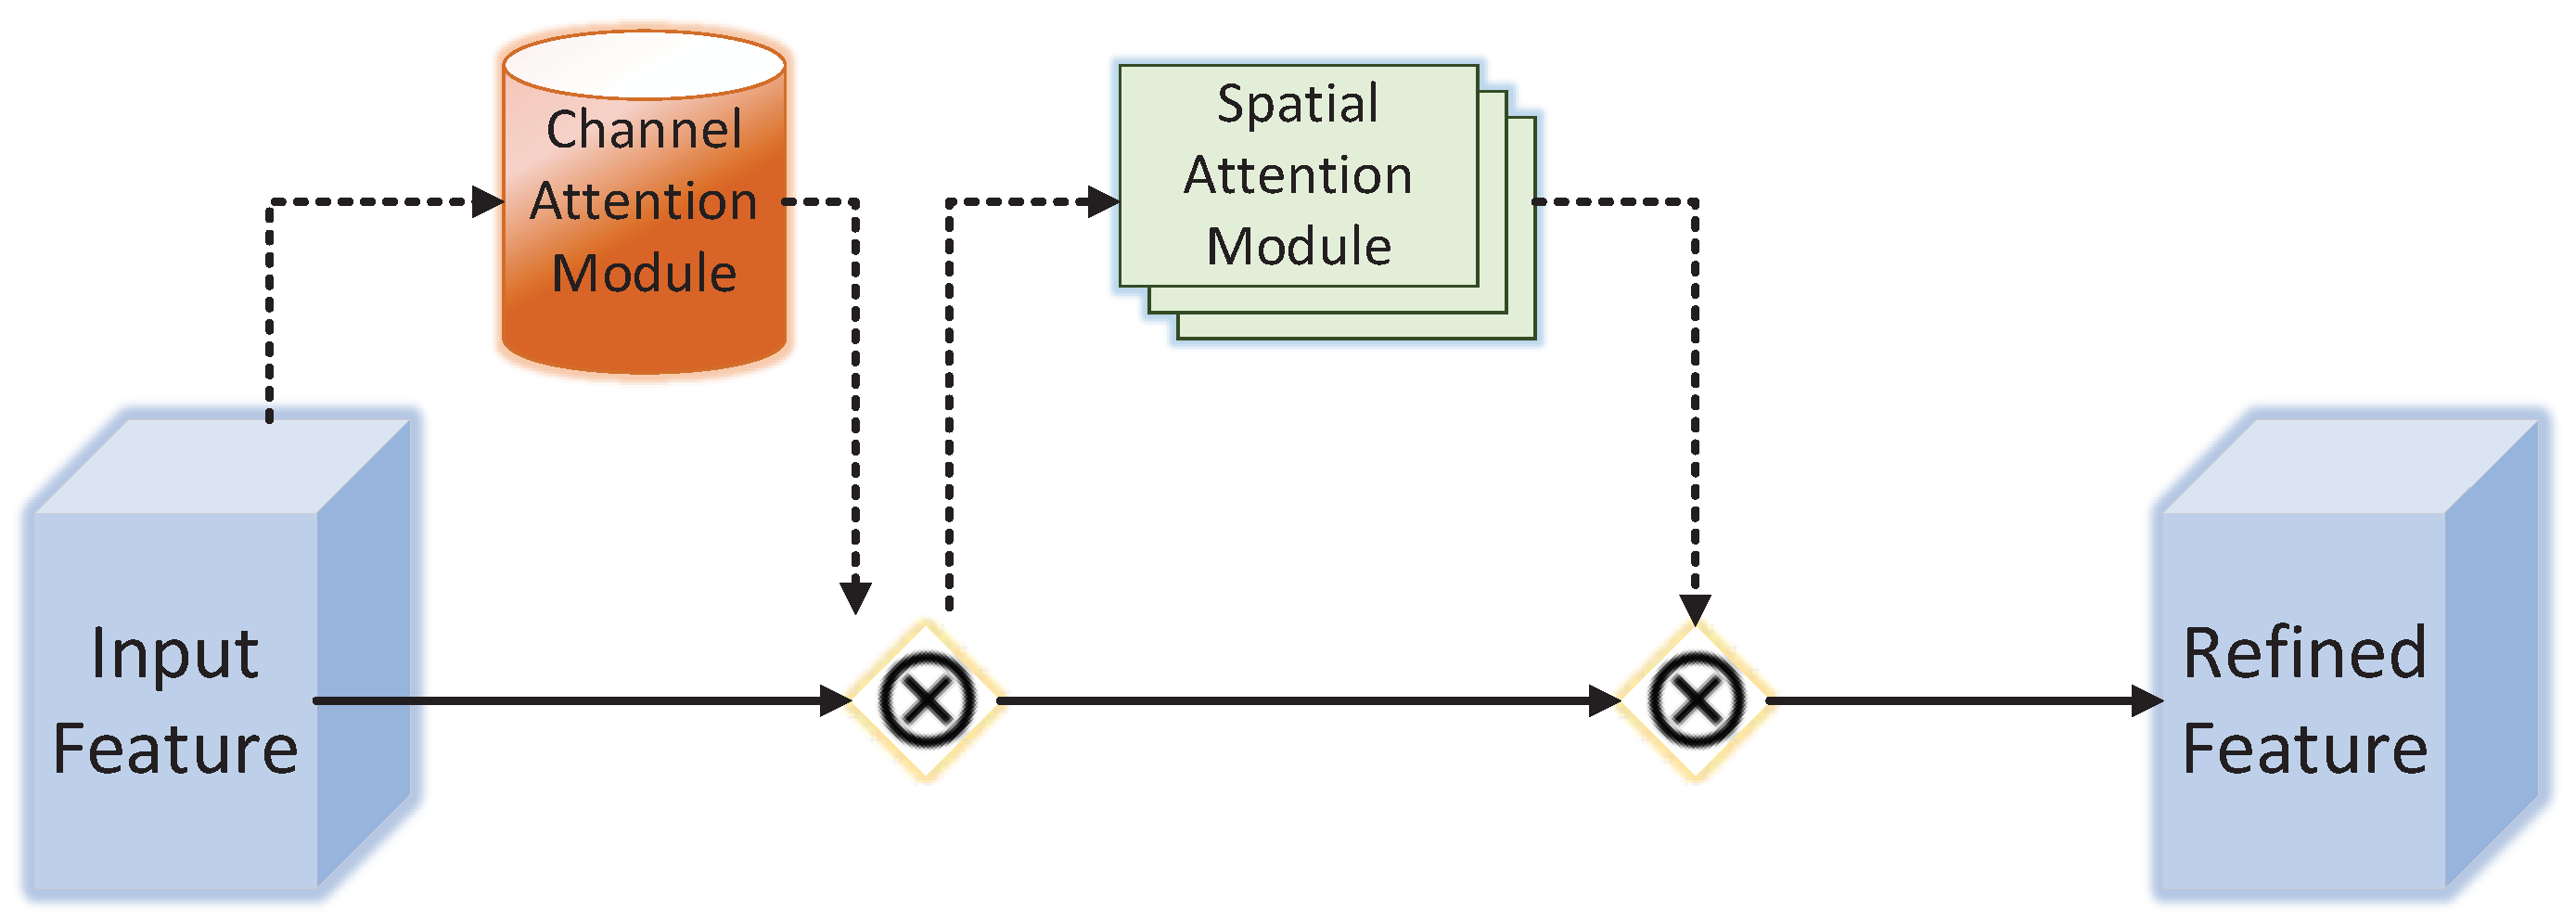
In this study, a channel space attention mechanism was added, and a model combining channel and space attention was constructed to enhance the focus of convolutional neural networks on images and improve the algorithm's performance. The original network joining the CBAM mechanism is illustrated in Figure 4.

3.2. Addition of Feature Selection Module

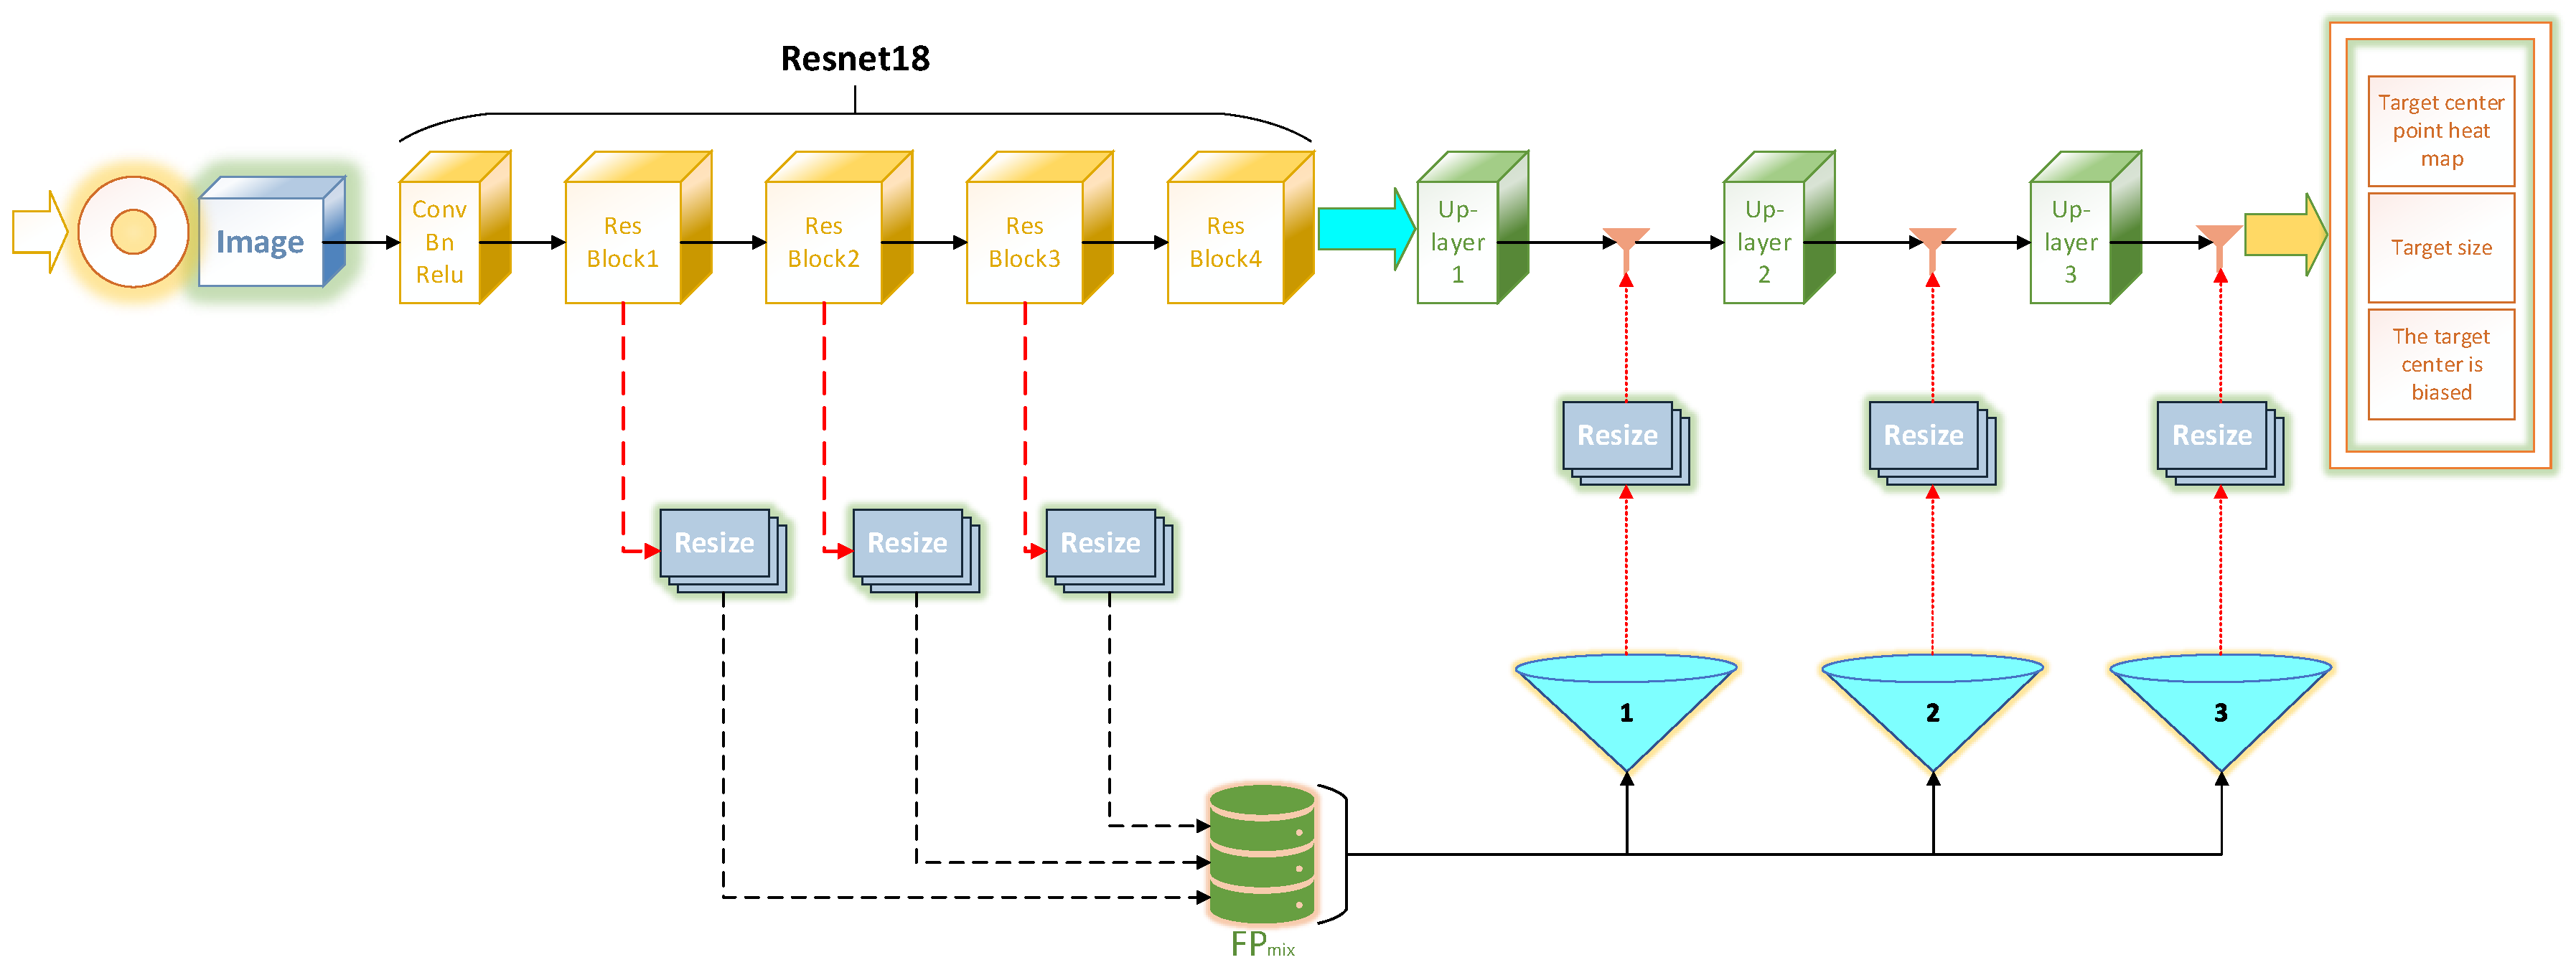
After adding the feature selection module, the feature map in the downsampling stage was scaled to a unified size and combined with the channel dimensions. In the upsampling stage, the feature selection module adaptively selects the combined features and then adds them to the output features. The structure of the feature selection module is illustrated in Figure 5.
When the CenterNet model was proposed, the original network only extracted the most profound feature map for detection, which led to poor retention of deep and shallow semantic information in the entire network during training, ultimately leading to a decline in the accuracy of the entire network. The feature selection module added in this study can effectively enhance the network extraction of target features and has a stronger ability to capture effective features. The details of the feature selection module are shown in Figure 6.

3.3. Optimization of the Loss Function

The target size loss changes from Smooth L1 Loss to IoU Loss because Smooth L1 Loss cannot adapt to targets of different sizes. The calculation formula is shown in Eq (5). When calculating the IoU Loss, it is assumed that the centre point is the same, and the calculation formula is shown in Equation (6).
L I o u = 1 A B A B
L I O U = ln ( I O U ( b o x 1 , b o x 2 ) )
The IoU Loss is an indicator used to evaluate the distance between two rectangular boxes. This indicator has all the distance characteristics, including symmetry, nonnegativity, identity, and triangular inequality. The advantages of using the IOU Loss include the following:
1. It can more accurately measure the matching degree between the prediction box and the real box;
2. It has scale invariance, which means that regardless of the size of the prediction box and the actual box, as long as they are located near each other, their IoU values will be similar. This helps the model to have a better generalisation ability when dealing with objects of different scales and sizes.

4. Experiment and Result Analysis

4.1. Experimental Environment

The experimental environment used in this paper was an Ubuntu18.04 64-bit operating system, 754GB running memory, a Tesla V100S graphics card, 32GB graphics memory, and an Intel(R) Xeon(R) Gold 6240 CPU. The PyTorch deep learning framework was used to build the model with CUDA version 10.1 and cudnn version 7.6.0.

4.2. Evaluation Index

Generally, current mainstream computer vision algorithm model evaluation indicators include accuracy and performance [28]. The index used to measure the accuracy of the target detection algorithm is generally the AP, and the performance index includes the FLOPs, FPS, and video memory occupations.
Table 1. Evaluation index and meaning interpretation.
Index Implication
FLOPs The number of floating-point operations used to measure the computational complexity of the model
FPS The number of images the algorithm processes per second, the higher the value, the faster the algorithm processes
p The size of the video memory occupied by the algorithm in the inference stage. The smaller the video memory occupation, the less resources are required
Average Precision (AP) was obtained by calculating the area of the PR curve. The calculation formula is shown in Equation (7) [29]:
A P = 0 1 p ( τ ) d ( τ )

4.3. Data

The experimental dataset in this study consisted of 3000 crack pictures captured by the UAV, which were divided into training and test sets in a 9:1 ratio.
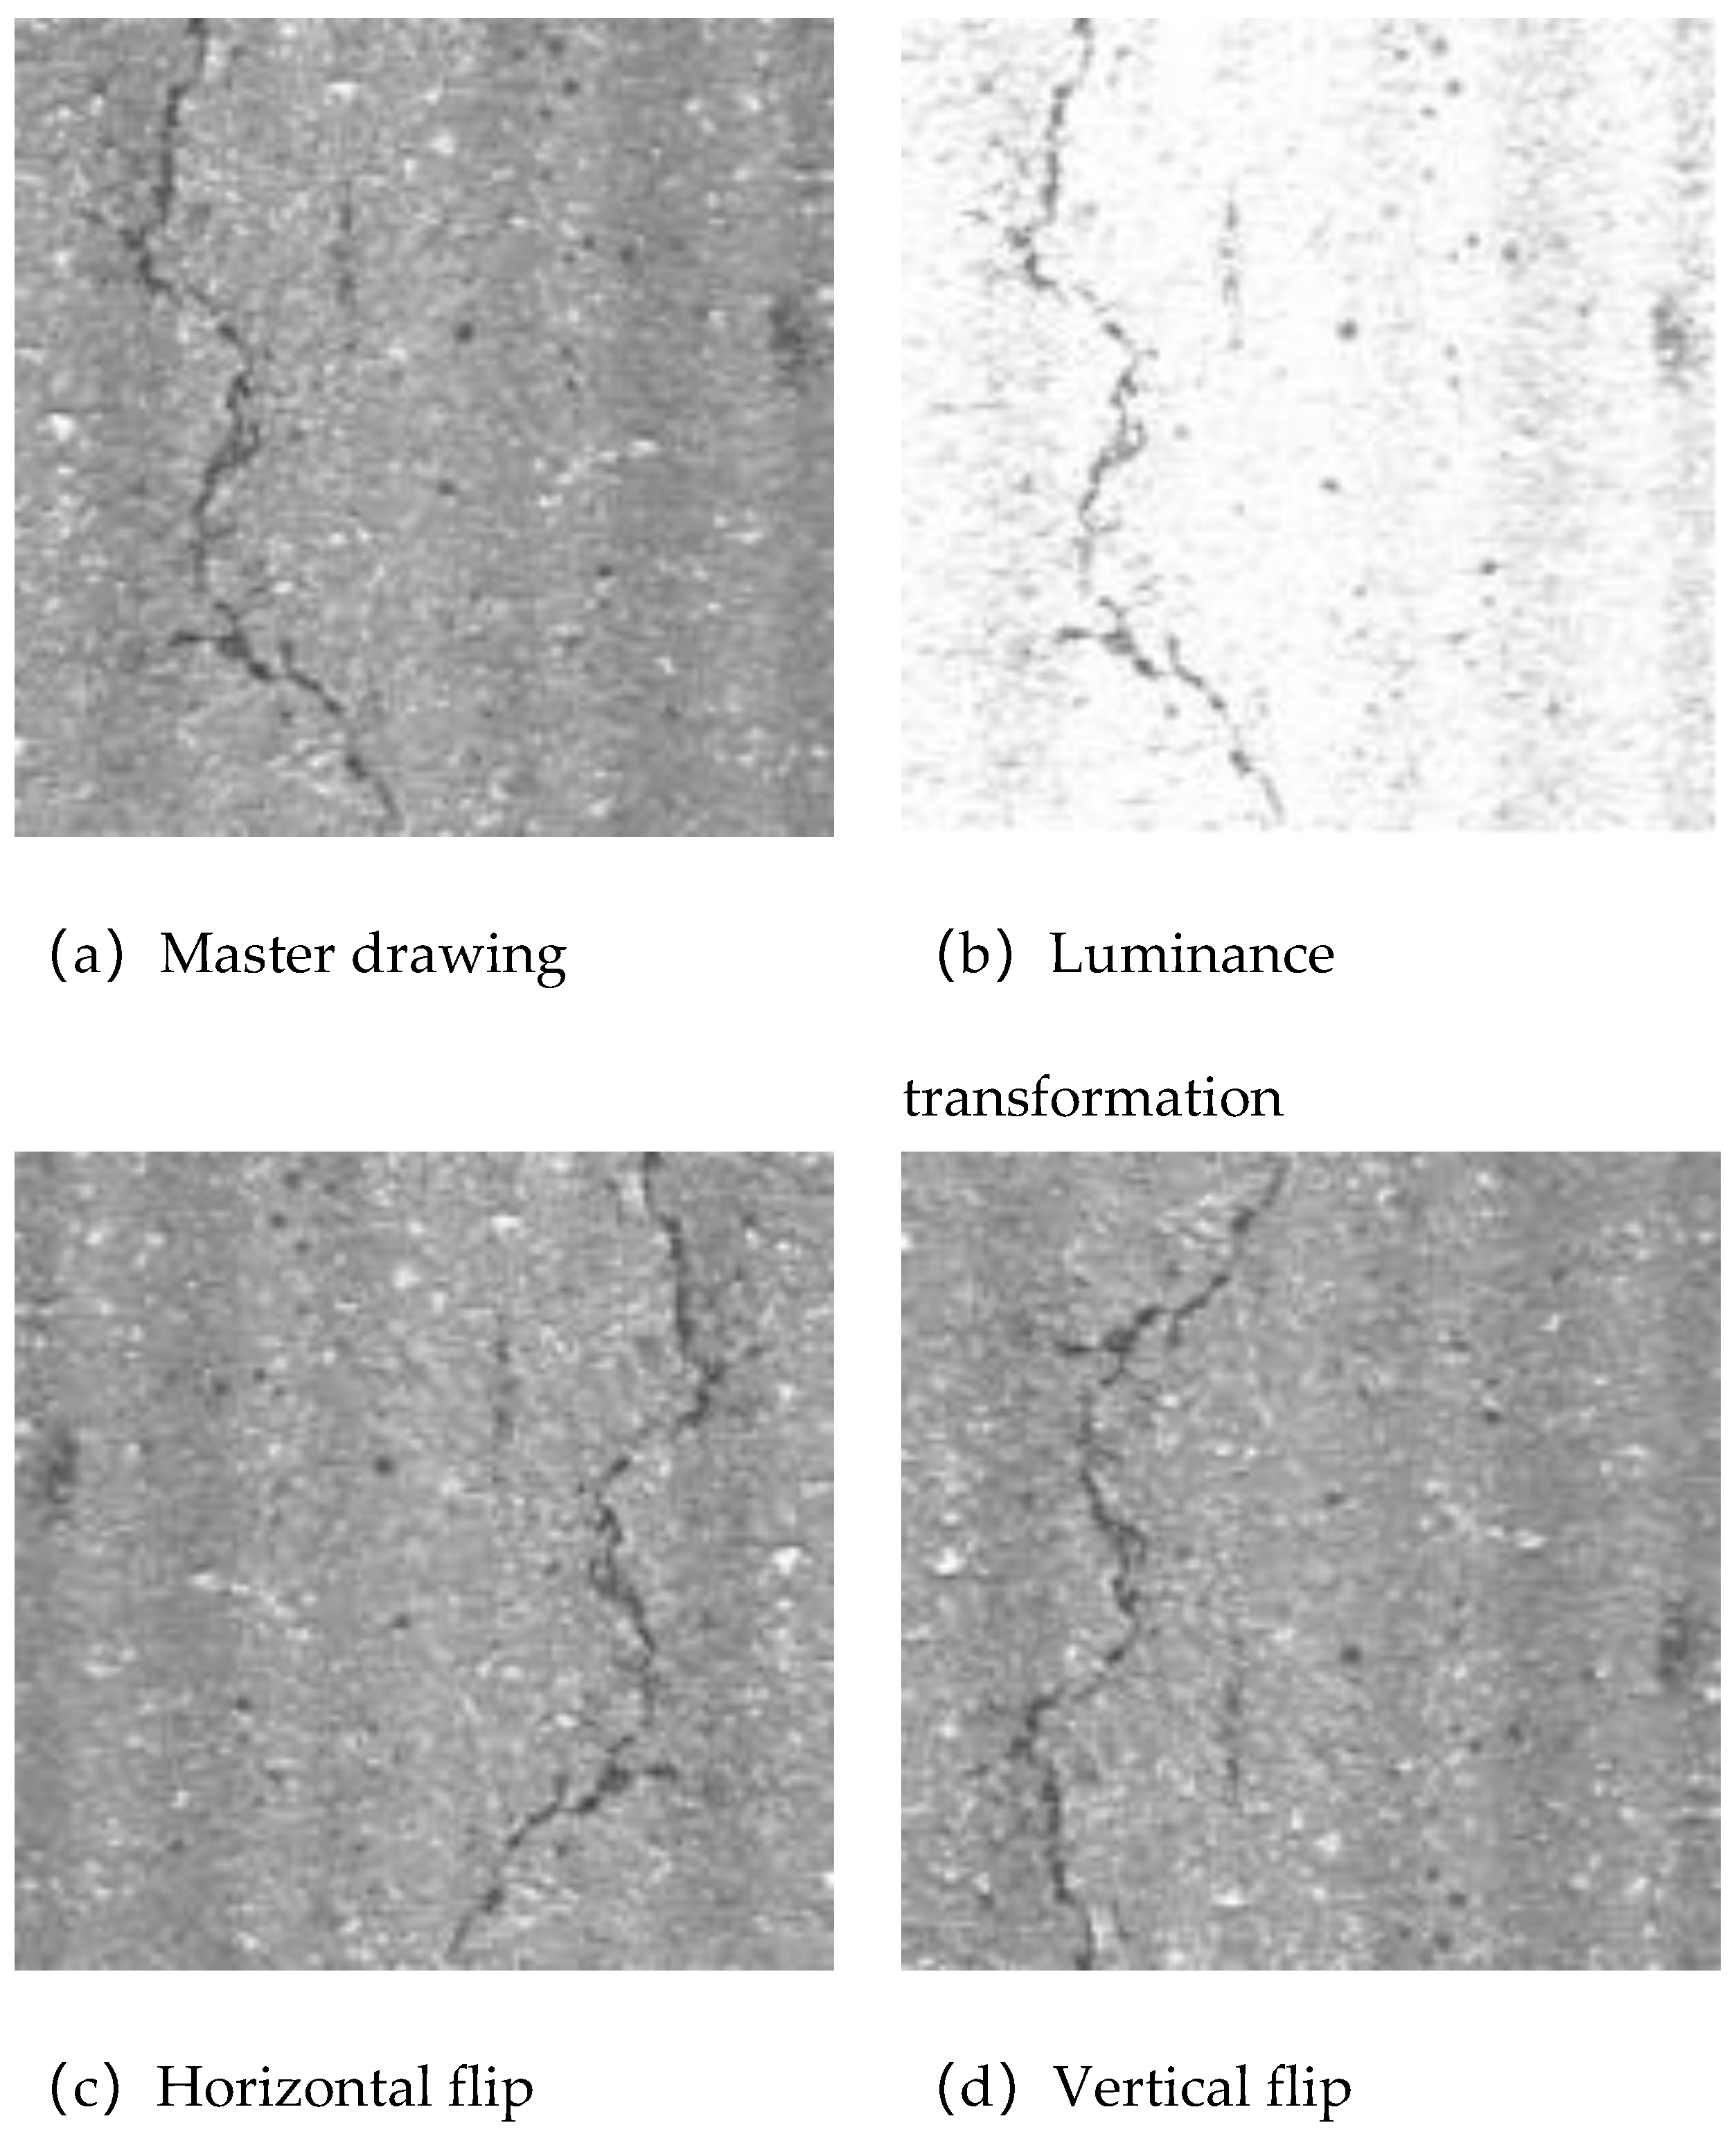
In the preprocessing stage, part of the training set was augmented to improve the generalisation ability of the algorithm model. The image transformation method adopted in the dataset enhancement was still close to the tunnel crack image collected after image processing, including random brightness transformation, random horizontal flipping, and random vertical flipping. The transformation results after processing are shown in Figure 7.
The image was scaled and standardised before being input into the network. The widths and heights of the scaled images were 512. The mean values of the standardized RGB three-channel are (123.675,116.28,103.53), and the standard deviation is (58.395,57.12,57.375).
CenterNet determines the target's location by predicting the target centre point, target centre point bias, and target size. Therefore, the corresponding labels of the image include the target centre-point Gaussian heat map, target centre-point bias, and target size, which are represented by a tensor of the same size as the network output.

4.4. Training Process and Experimental Results

To ensure the real and effective results of the comparative experiments, the training parameters used in all the experiments involved in this study were completely consistent. The initial learning rate of the training was 0.0001. The cosine annealing learning rate adjustment method was adopted, and the minimum learning rate was 0.00001. The batch size was set to 8 during the training process. A total of 300 epochs were trained using the SGD optimisation algorithm.
The training experiments were conducted in five groups: original CenterNet with the backbone network of ResNet18, CenterNet with the channel space attention mechanism, CenterNet with the feature selection module, CenterNet with target size loss improvement, and CenterNet with the above three improvements. Table 2 compares the performance of CenterNet with the addition of CBAM and feature-selection modules, including FLOPS, FPS, and video memory.
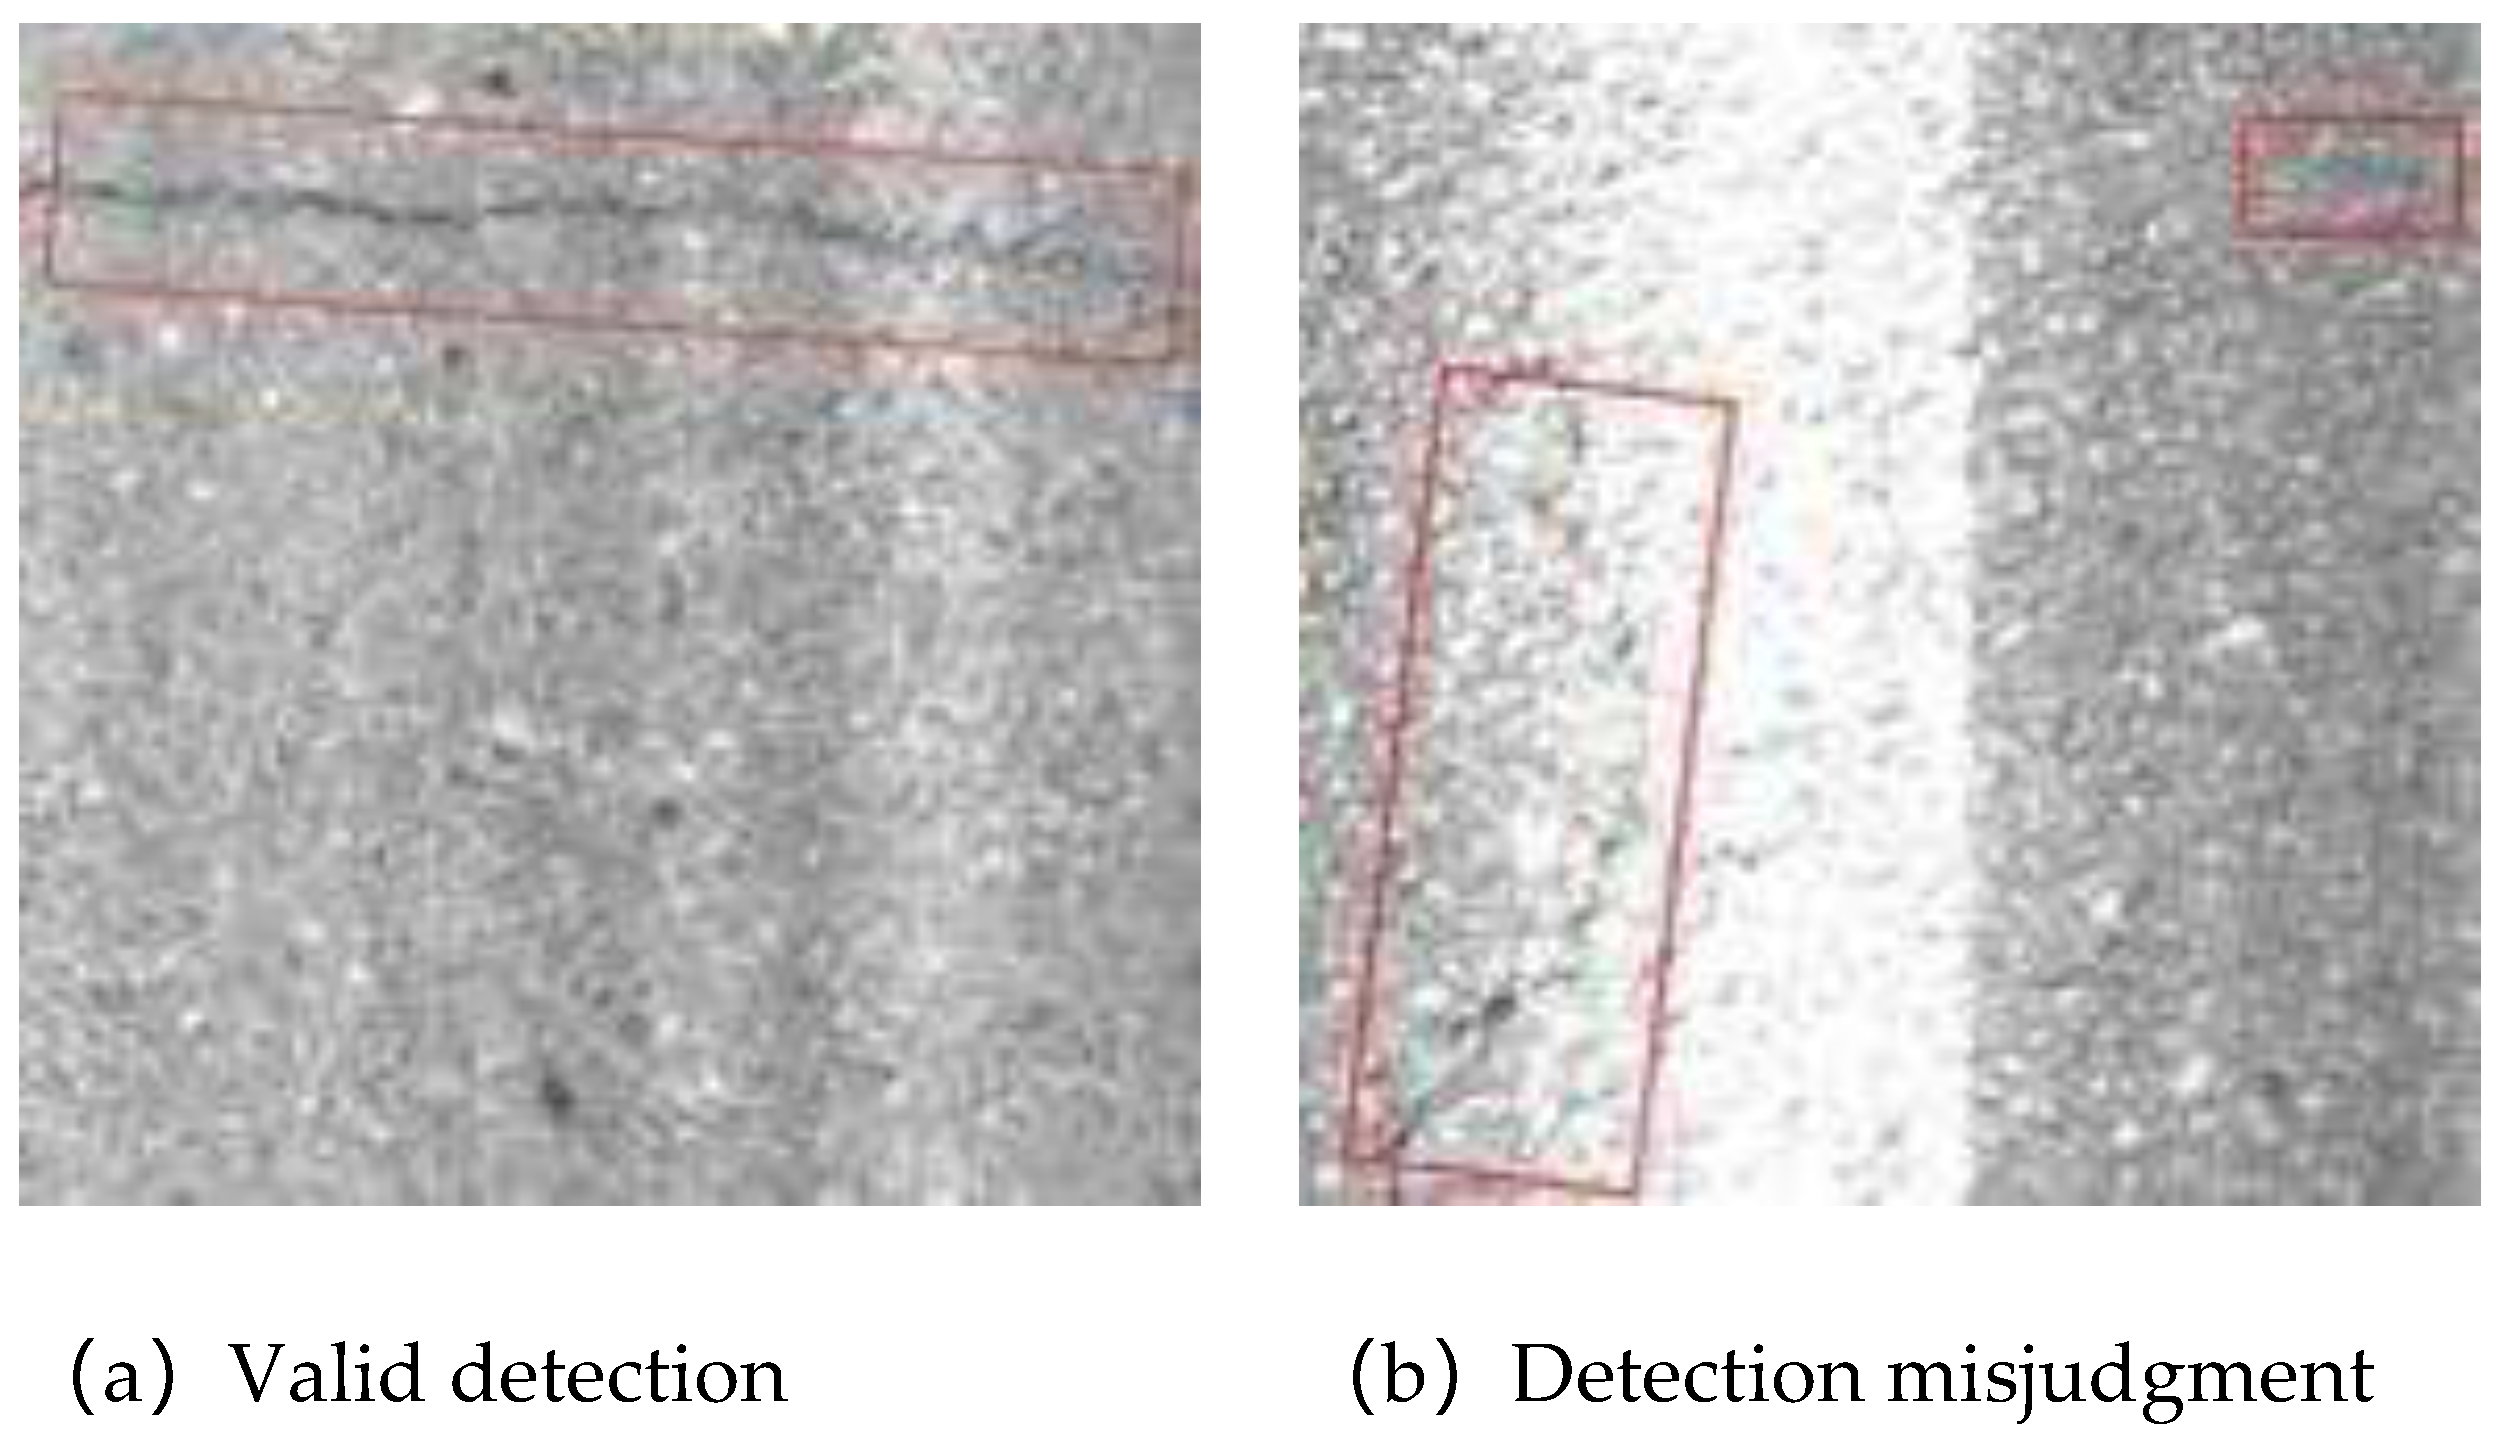
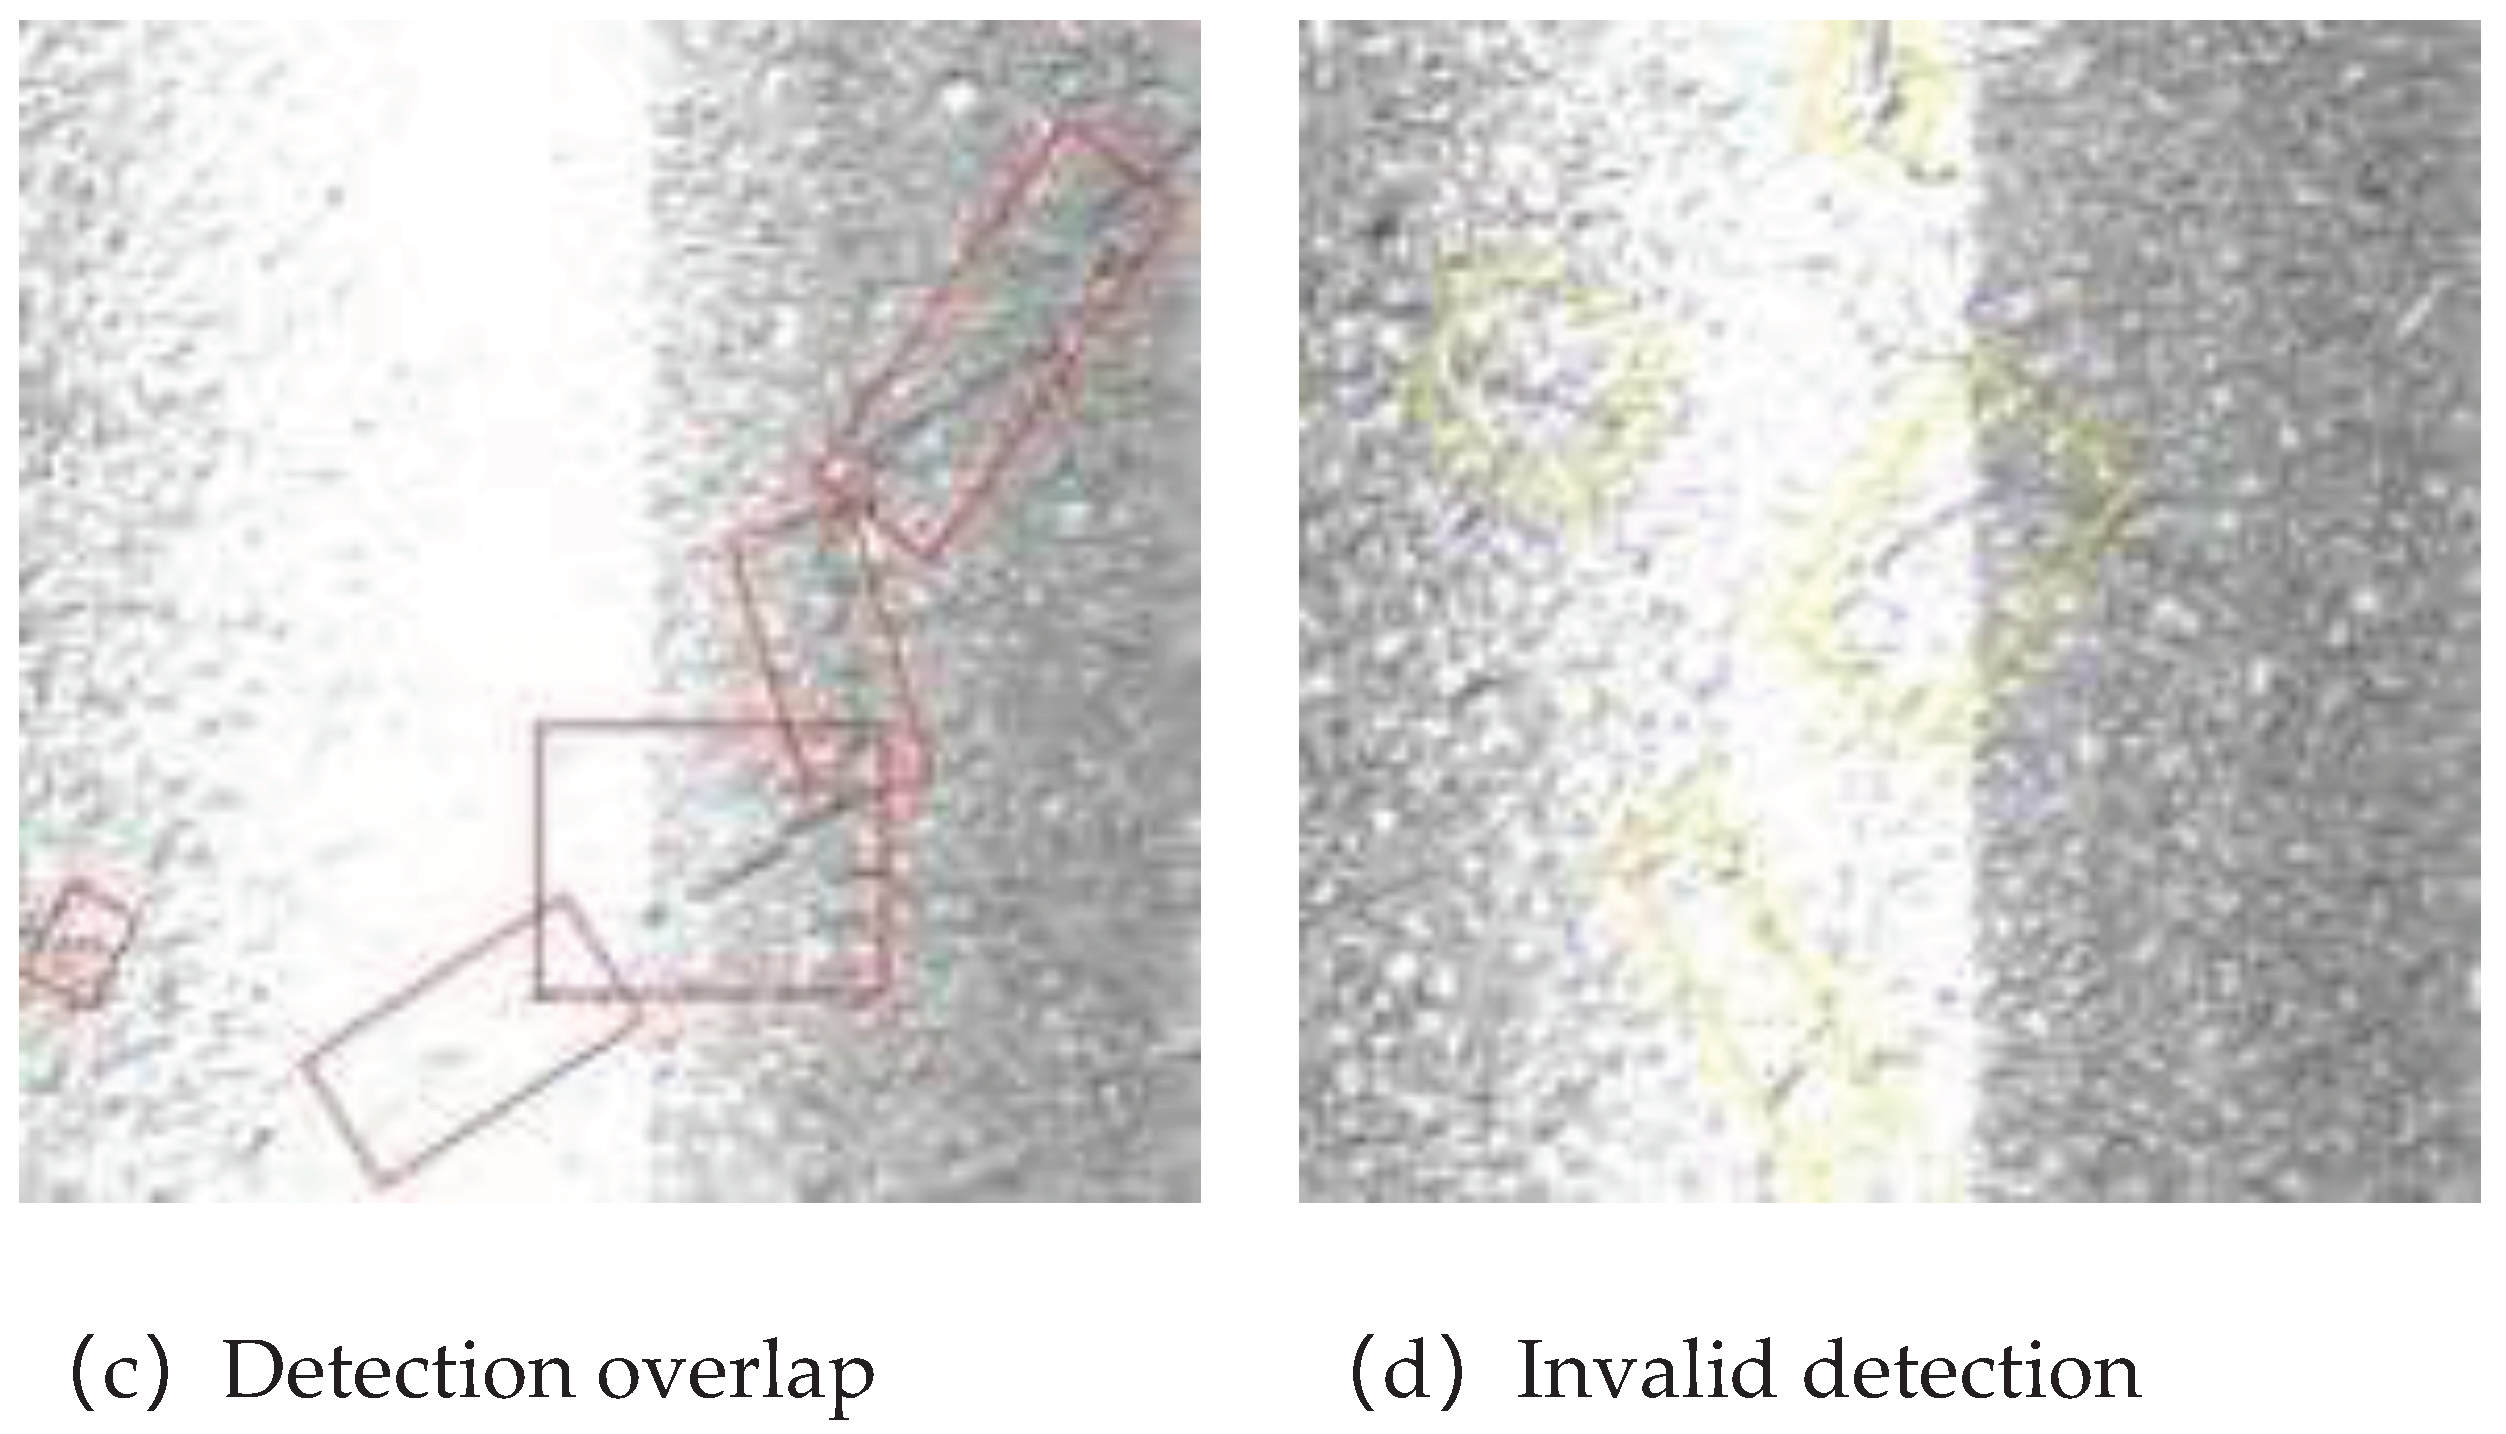
In the data training process, owing to the different difficulties in data feature extraction, there are overlaps and omissions in some data, as shown in Figure 8. Given this situation, the optimised model in this study adopts the method of strengthening the feature extraction. This situation changed significantly after adding the feature extraction module, and the data processing accuracy was effectively improved.
When the test environment of the controlled experiment was the same as that of the training environment, the batch size of the experiment was set to one. The ablation experiments are summarised in Table 3. From the ablation experiment, the following results were obtained:
After the CBAM module was added, the model size increased by 1.4MB, FPS decreased by 106.6, video memory increased by 2MB, FLOPs remained unchanged, and AP increased by 0.072.
After adding the feature selection module, the model size increased by 0.8MB, FPS decreased by 46.3, video memory increased by 58MB, FLOPs increased by 3.29, and AP increased by 0.101 compared with the original model.
After IOU optimization in the original model, the size increased by 0.5MB, FPS decreased by 123.7, video memory increased by 31MB, FLOPs increased by 2.2, and AP increased by 0.021 compared with the original model.
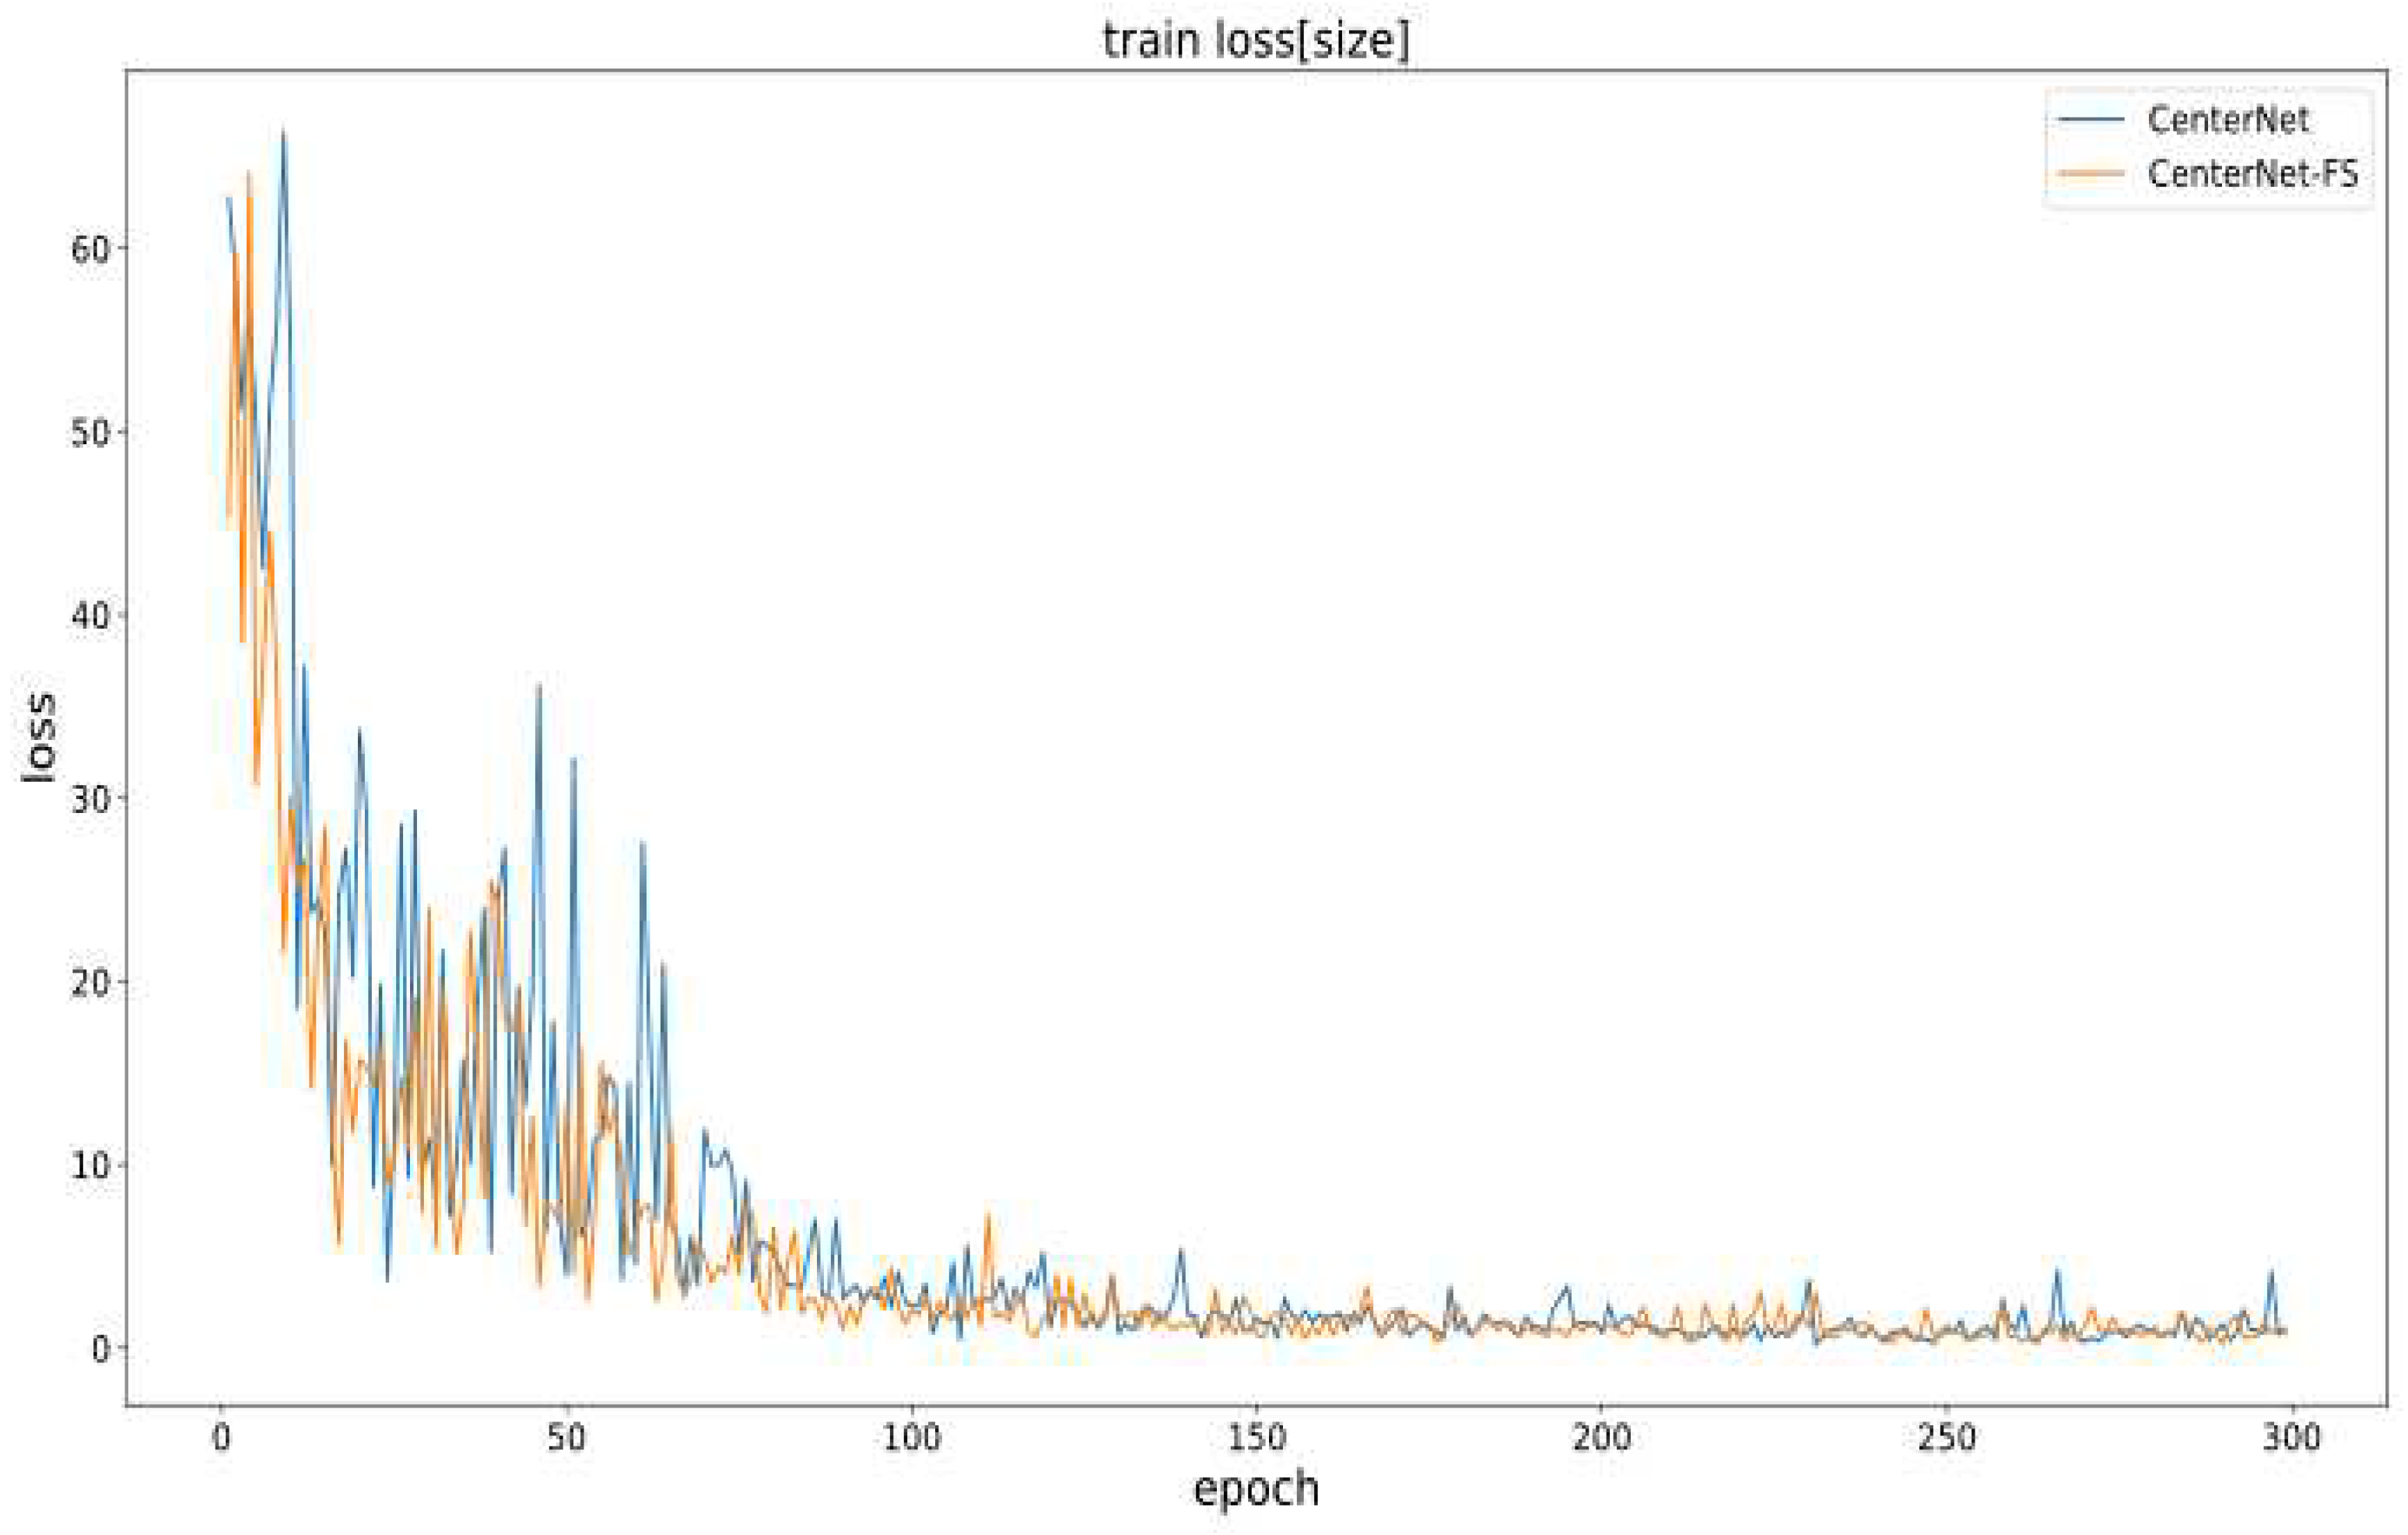
After the addition of the feature selection module, the optimised model decreased the target size loss faster than the original CenterNet because the feature selection module can adaptively select the underlying features (such as the target texture and edge information) in the downsampling process and add them to the feature map in the upsampling process. Thus, the target size can be learned more quickly.
The change curve of the CenterNet target size loss after the original CenterNet and the addition of the feature selection module are shown in Figure 9.
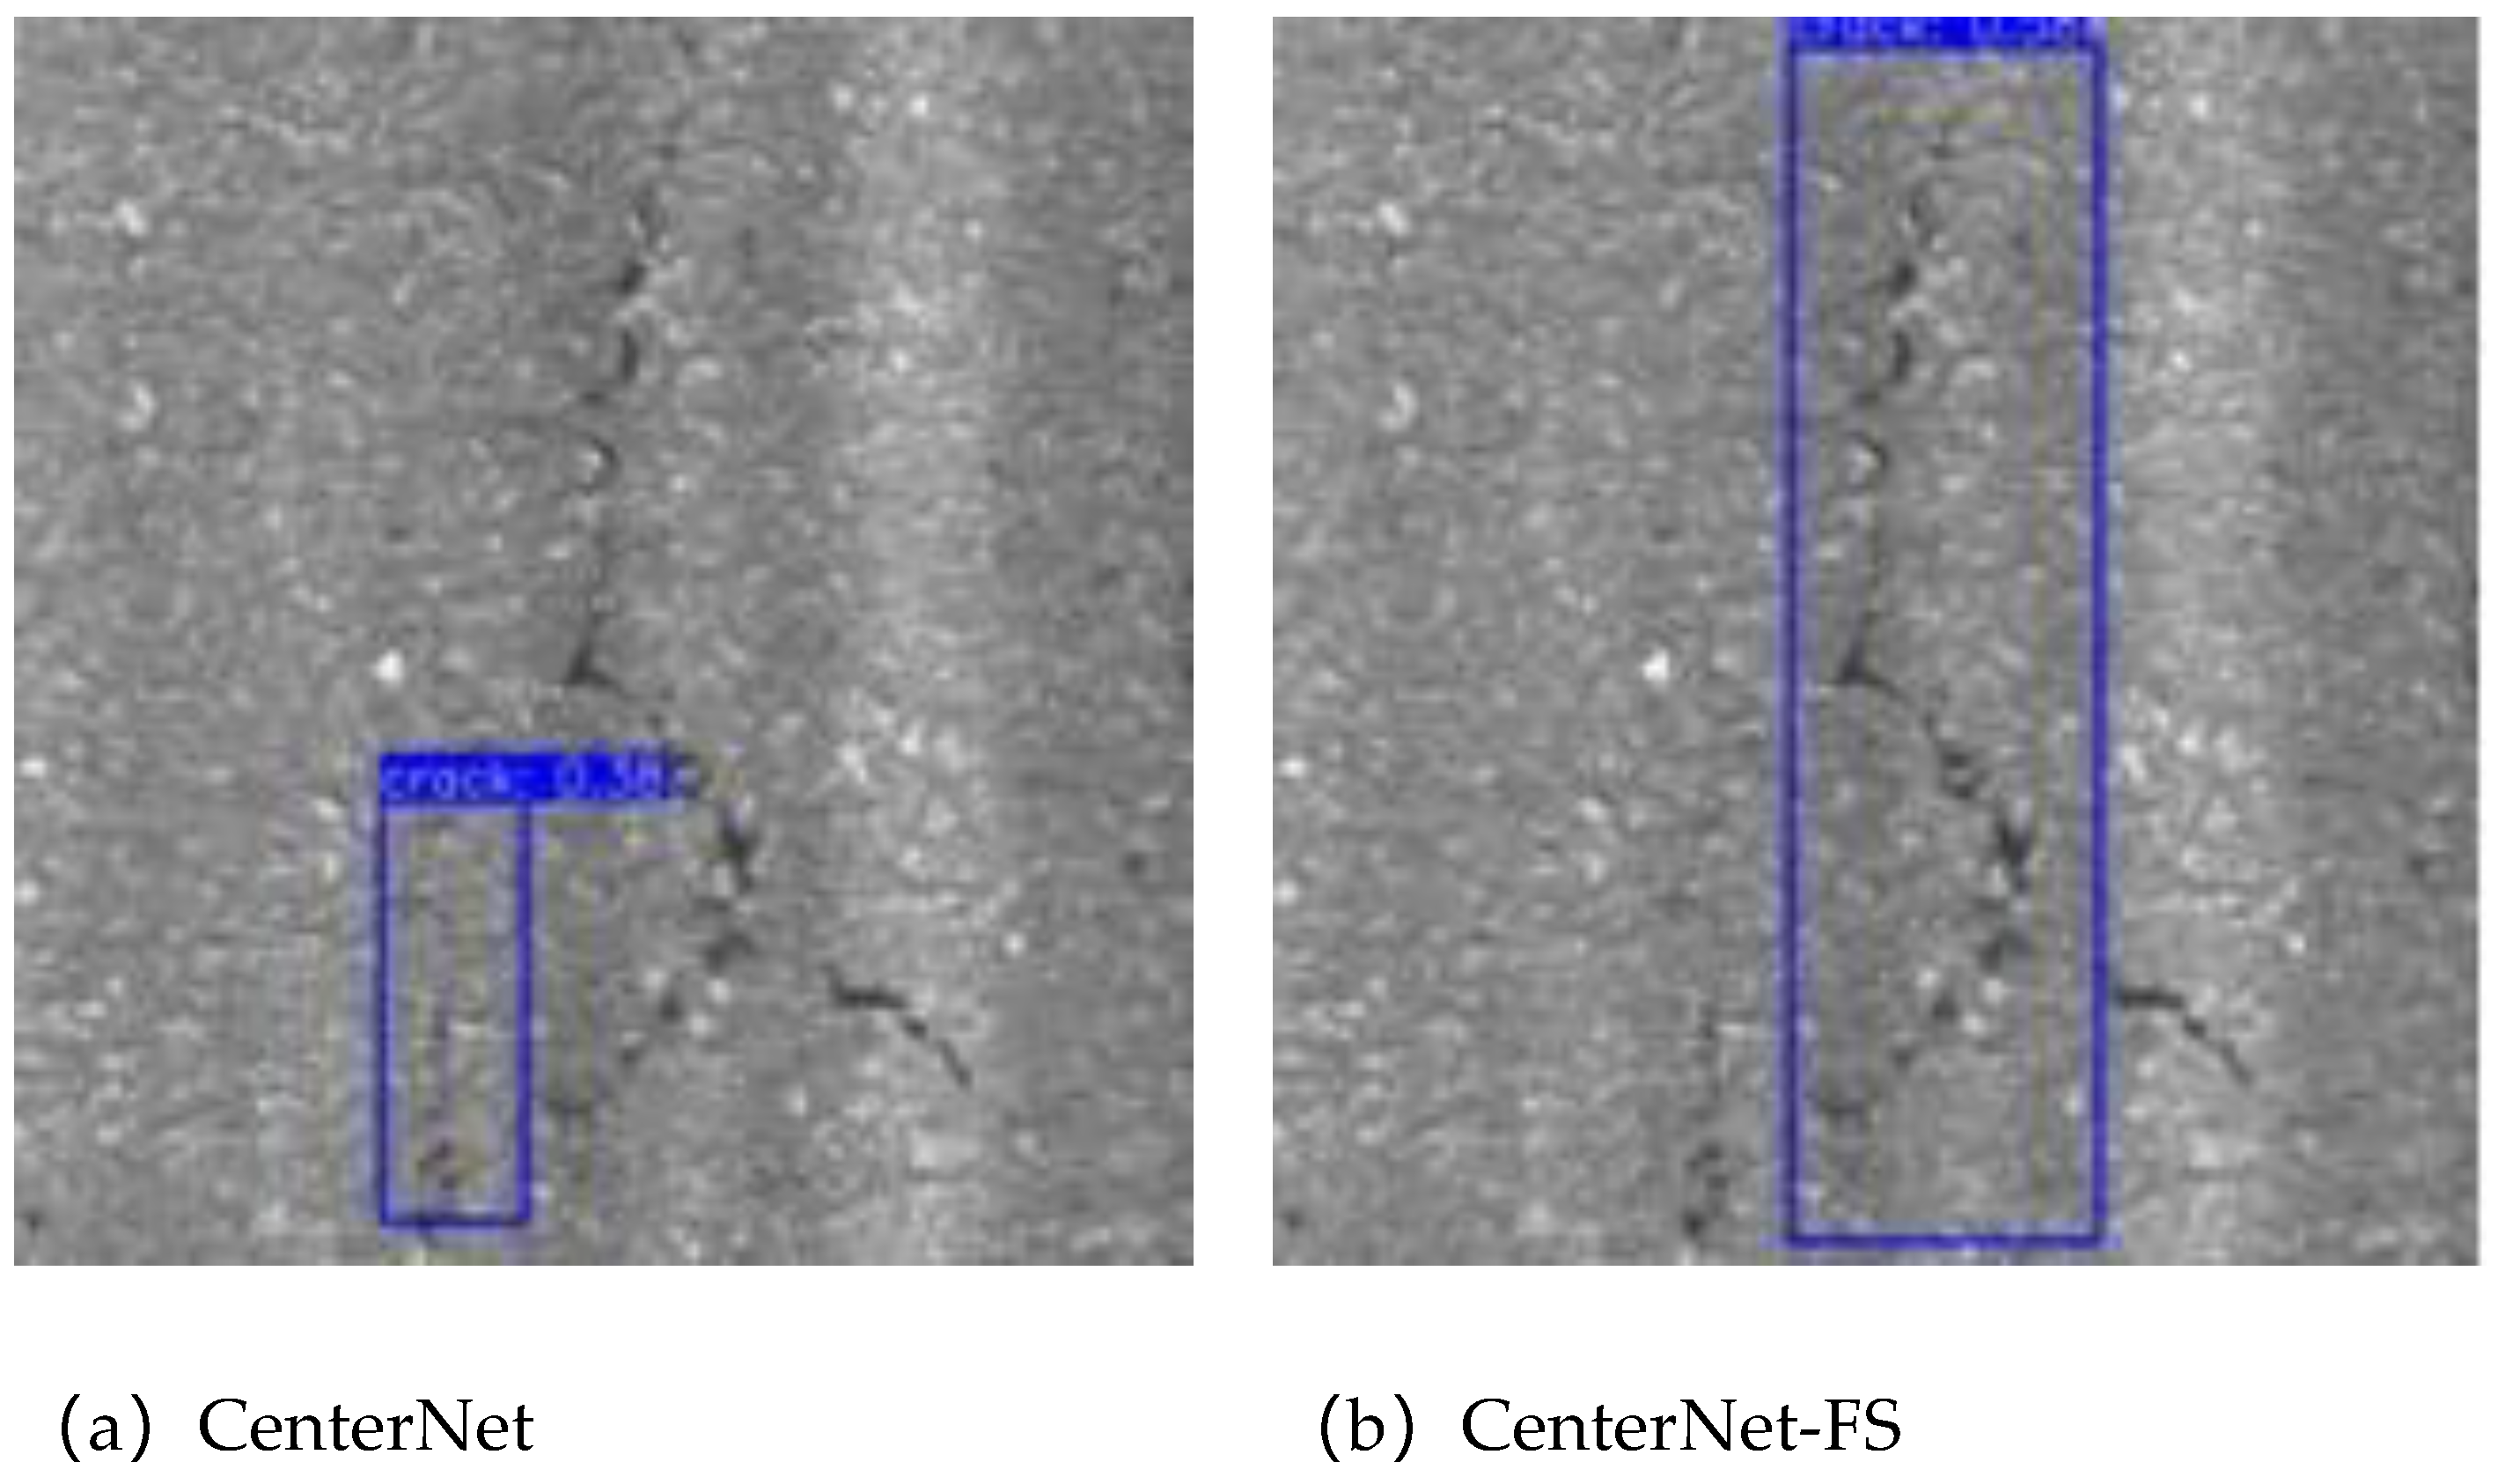
The feature selection module can adapt to underlying features, which is also evident in the actual detection effect. As shown in Figure 10, after adding the feature selection module, the optimised model can predict the crack size more accurately owing to the inclusion of information such as the crack edge.
The CBAM and feature selection modules, particularly the CBAM module, significantly impact the reasoning speed of the network. This is because, after the CBAM module is added to each ResBlock, the FPS of the network decreases overall, whereas the feature selection module reduces the FPS. Regarding the video memory usage, the impact of the two additional modules was relatively small.
The feature information of the entire network is compressed by the subsampling module, which reduces the workload of subsequent network training and increases the reasoning speed of the entire network. The input information in the upper layer of the network is enhanced after the feature extraction module, and the upsampling stage uses fewer convolutional layers to improve the running speed of the network. The information on each input and output layer of the overall network optimised in this study is shown in Table 4.
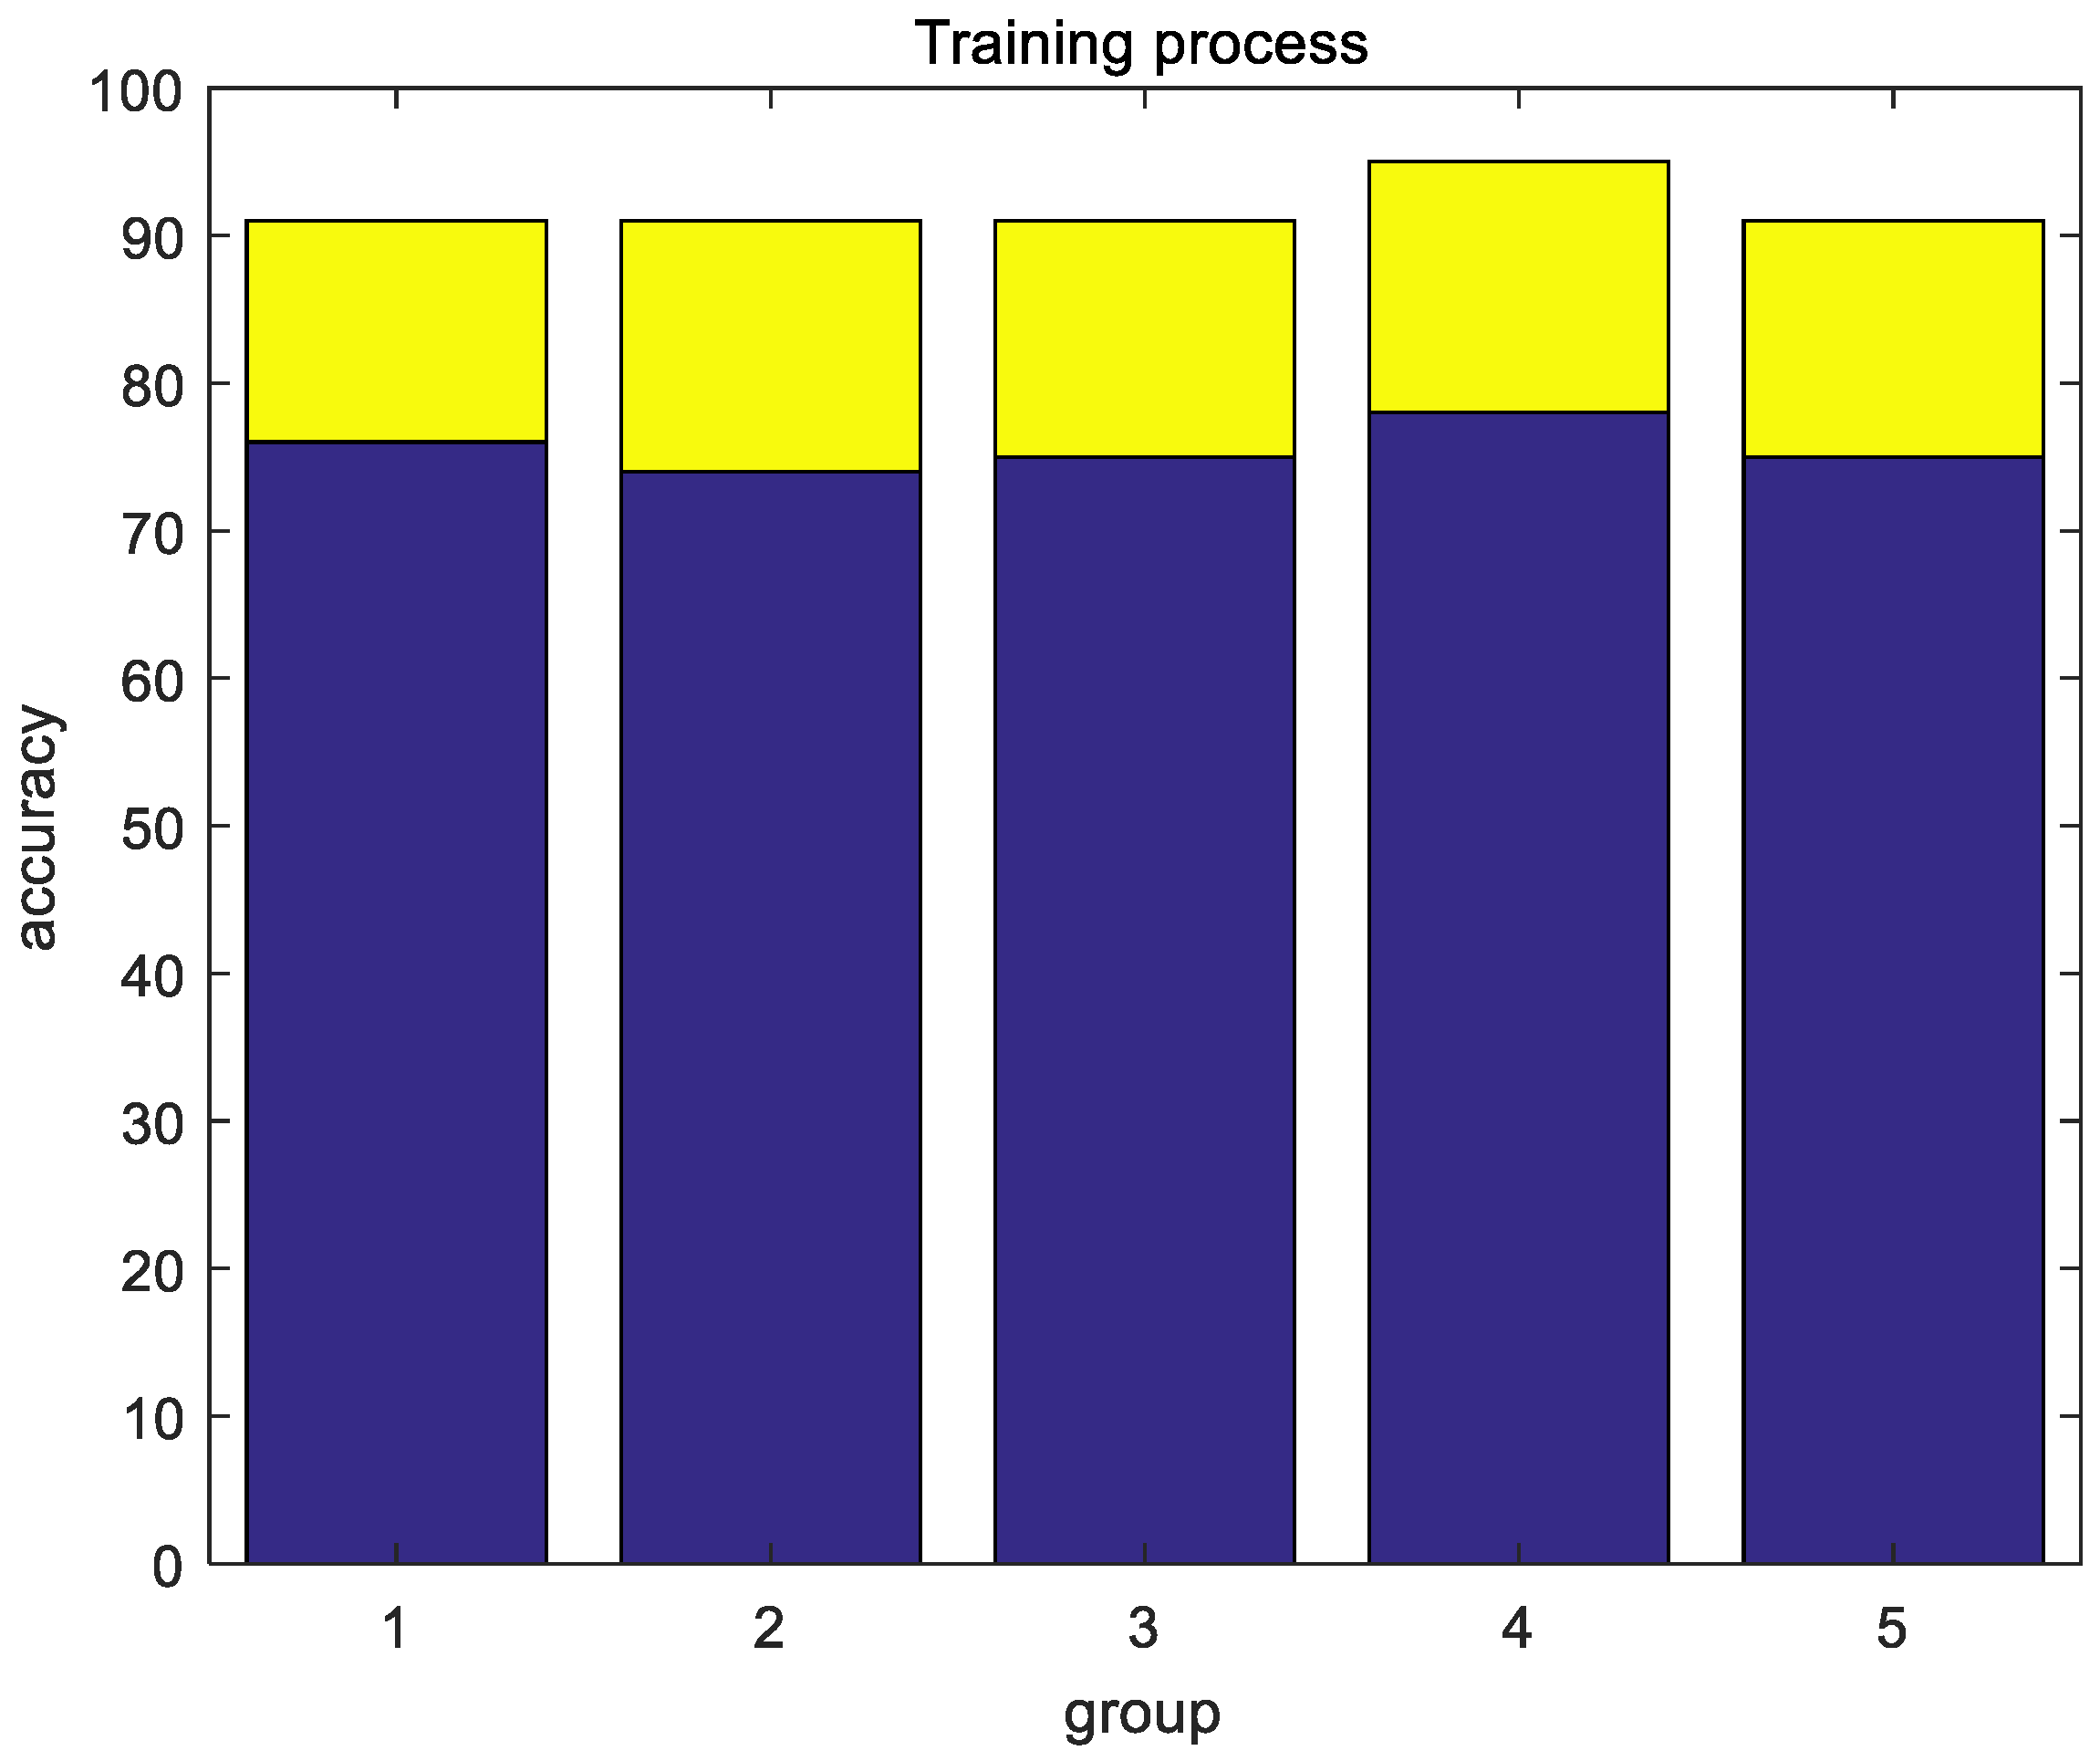
To demonstrate the performance improvement of the model before and after optimisation more intuitively, five groups of training processes were randomly selected for comparison, as shown in Figure 11. Dark blue represents the data processing accuracy of the original CenterNet model, and yellow represents the improvement in accuracy brought about by the optimised CenterNet-CBAM-FS-IOU model.
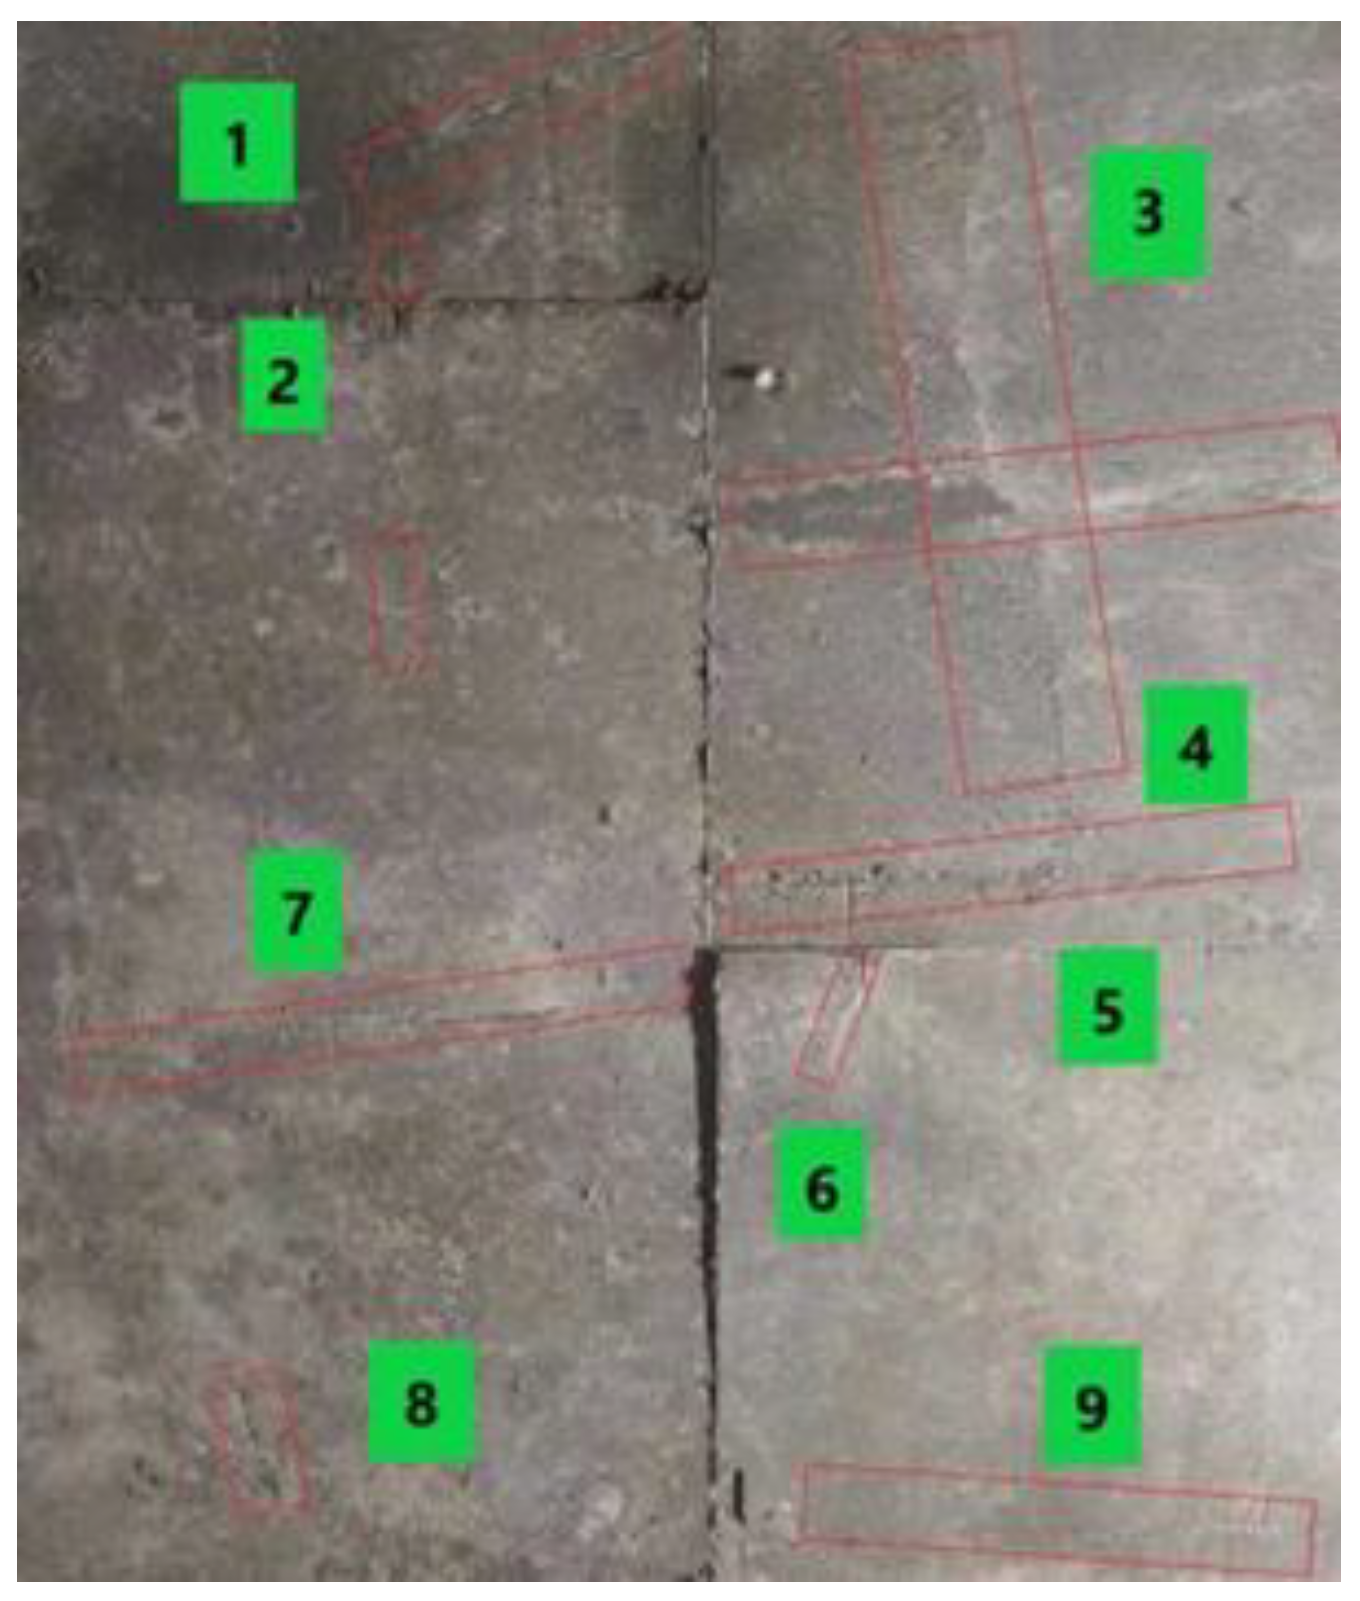
After optimisation, the overall processing accuracy of CenterNet improved to a certain extent, and it could effectively identify cracks in construction concrete with less training time. The actual detection effect is shown in Figure 12, where the red box represents the detection crack prompts, and the number represents the detection number.
As a classic anchor-free model in the field of computer vision, the CenterNet model has a wide range of applications and optimisations in various disciplines. Table 5 lists the AP values of CenterNet and the improved model structure for the dataset. The improvement in the AP values also verifies the effectiveness of the proposed algorithm model optimisation scheme.

5. Conclusions

Based on the original network of CenterNet, a detailed algorithm model optimisation experiment was carried out for the problem of concrete crack detection in construction engineering using pictures of concrete cracks taken by drones, including the addition of a double-attention mechanism, introduction of a feature selection module, and optimisation of the loss function.
The experimental results show that the FPS of the improved CenterNet model is reduced by 123.7, the memory is increased by 62MB, FLOPs are increased by 3.81, and AP is increased by 0.154. The proposed method for detecting cracks in construction projects based on the improved CenterNet network has good robustness and accuracy for the processed datasets and has the potential to be applied to target detection and recognition methods in relevant practical scenarios.

Author Contributions

Fengjun Zhou: Finishing the paper check work; Huaiqiang Kang: Mainly completed the key data collection, model construction, data processing and paper framework construction of the experiment, and completed the main writing of the paper; Shen Gao: Assisted modeling and experimental data acquisition; Xu Qizhi: Data collection, model construction, and paper polishing have made great contributions in data processing.

Funding

This research received no external funding.

Informed Consent Statement

Informed consent was obtained from all subjects involved in the study.

Data Availability Statement

Not applicable.

Acknowledgments

Thanks to Beijing University of Civil Engineering and Architecture for your support.

Conflicts of Interest

The authors declare no conflicts of interest.

References

  1. Ling, Y. Crack Detection and Recognition Based on DeepLearning. Master’s Thesis, Lanzhou Jiaotong University: Gansu, China, Gansu.
  2. Wang, Y.; Jin, Y.; Li, Y.; Yang, Y. Research on Concrete Surface Crack Detection Based on SqueezeNet. J. Dalian Minzu Univ. 2021, 23, 458–462. [Google Scholar] [CrossRef]
  3. Liu, Y.; Yang, S.; Liu, X. Micro-crack quantitative detection technique for metal component surface based on laser ultrasonic. J. Vib. Shock 2019, 38, 14–19. [Google Scholar] [CrossRef]
  4. Che, J.; Hou, Q.; Yu, J. Contrast analysis of testing methods for tiny crack in parts of weapon. Ordnance Mater. Sci. Eng. 2005, 28, 44–47. [Google Scholar] [CrossRef]
  5. Yan, H.; Long, J.; Liu, C.; Pan, S.; Zuo, C.; Cai, P. Review of the development and application of deformation measurement based on digital holography and digital speckle interferometry. Infrared Laser Eng. 2019, 48, 154–166. [Google Scholar] [CrossRef]
  6. Shi, J. Application of Penetration testing in Nondestructive testing of pressure vessels and Pipelines. China CIO News 2023, 58–60. [Google Scholar] [CrossRef]
  7. Li, G.; Yu, S.; Zhang, F.; Guo, Y. Application of Nondestructive Testing Technology in Detecting Crack of Special Vehicle. Comput. Meas. Control 2011, 19, 2676–2678. [Google Scholar]
  8. Wang, Q. Research on Aircraft Panel Crack Measurement System Based on Machine Vision. Master’s thesis, Xi’an Engineering University: Shaanxi, China, 2020.
  9. Mohammadkhorasani, A.; Malek, K.; Mojidra, R.; Li, J.; Bennett, C.; Collins, W.; Moreu, F. Augmented Reality-Computer Vision Combination for Automatic Fatigue Crack Detection and Localization. Comput. Ind. 2023, 149, 103936. [Google Scholar] [CrossRef]
  10. Paramanandham, N.; Rajendiran, K.; Poovathy J, F.G.; Premanand, Y.S.; Mallichetty, S.R.; Kumar, P. Pixel Intensity Resemblance Measurement and Deep Learning Based Computer Vision Model for Crack Detection and Analysis. Sensors 2023, 23, 2954. [Google Scholar] [CrossRef] [PubMed]
  11. Wang, F.; Peng, G.; Xie, H. Strip steel defect detection based on morphological enhancement and image fusion. Laser Infrared 2018, 48, 124–128. [Google Scholar] [CrossRef]
  12. Chambon, S.; Moliard, J.-M. Automatic Road Pavement Assessment with Image Processing: Review and Comparison. Int. J. Geophys. 2011, 2011, e989354. [Google Scholar] [CrossRef]
  13. Wang, P.; Huang, H.; Xue, Y. Development and Application of Machine Vision Inspection system for cracks in Tunnel lining. Highway 2022, 67, 439–446. [Google Scholar]
  14. Soukup, D.; Huber-Mörk, R. Convolutional Neural Networks for Steel Surface Defect Detection from Photometric Stereo Images. In Advances in Visual Computing; Bebis, G., Boyle, R., Parvin, B., Koracin, D., McMahan, R., Jerald, J., Zhang, H., Drucker, S.M., Kambhamettu, C., El Choubassi, M., Deng, Z., Carlson, M., Eds.; Lecture Notes in Computer Science; Springer International Publishing: Cham, 2014; Vol. 8887, pp. 668–677; ISBN 978-3-319-14248-7. [Google Scholar]
  15. Peng, L.; Chao, W.; Shuangmiao, L.; Baocai, F. Research on Crack Detection Method of Airport Runway Based on Twice-Threshold Segmentation. In Proceedings of the 2015 Fifth International Conference on Instrumentation and Measurement, Computer, Communication and Control (IMCCC); September 2015; pp. 1716–1720. [Google Scholar]
  16. Yang, Y.-S.; Yang, C.-M.; Huang, C.-W. Thin Crack Observation in a Reinforced Concrete Bridge Pier Test Using Image Processing and Analysis. Adv. Eng. Softw. 2015, 83, 99–108. [Google Scholar] [CrossRef]
  17. Cubero-Fernandez, A.; Rodriguez-Lozano, F.J.; Villatoro, R.; Olivares, J.; Palomares, J.M. Efficient Pavement Crack Detection and Classification. EURASIP J. Image Video Process. 2017, 2017, 1–11. [Google Scholar] [CrossRef]
  18. Li, G.; He, S.; Ju, Y. Image-Based Method for Concrete Bridge Crack Detection. J. Inf. Comput. Sci. 2013, 10, 2229–2236. [Google Scholar] [CrossRef]
  19. Fan, F. Deep Learning Based Animal Detection and Multipleobject Tracking in Modern Livestock Farms. Master’s thesis, Beijing University of posts and Telecommunications: Beijing, China, 2023.
  20. Wang, Z.; Ye, X.; Han, Y.; Guo, S.; Yan, X.; Wang, S. Improved Real-Time Target Detection Algorithm for Similar Multiple Targets in Complex Underwater Environment Based on YOLOv3. In Proceedings of the Global Oceans 2020: Singapore – U.S. Gulf Coast; October 2020; pp. 1–6. [Google Scholar]
  21. Wang, X.; Zhang, Z.; Dai, H. Detection of Remote Sensing Targets with Angles via Modified CenterNet. Comput. Electr. Eng. 2022, 100, 107979. [Google Scholar] [CrossRef]
  22. Yu, P.; Wang, H.; Zhao, X.; Ruan, G. An Algorithm for Target Detection of Engineering Vehicles Based on Improved CenterNet. Comput. Mater. Contin. 2022, 73. [Google Scholar] [CrossRef]
  23. Wang, Y.; Liu, R. Small Object Detection of Improved Lightweight CenterNet. Comput. Eng. Appl. 2023, 59, 205–211. [Google Scholar] [CrossRef]
  24. Liu, Y.; Yan, J. Research on Detection Algorithm of Wheel Position Based on CenterNet. J. Phys. Conf. Ser. 2021, 1802, 032126. [Google Scholar] [CrossRef]
  25. Chen, H.; Gao, J.; Zhao, D.; Wu, J.; Chen, J.; Quan, X.; Li, X.; Xue, F.; Zhou, M.; Bai, B. LFSCA-UNet: liver fibrosis region segmentation network based on spatial and channel attention mechanisms. J. Image Graph. 2021, 26, 2121–2134. [Google Scholar] [CrossRef]
  26. Yang, X.; Zhang, Q.; Wang, S.; Zhao, Y. Detection of Solar Panel Defects Based on Separable Convolution and Convolutional Block Attention Module. Energy Sources Part Recovery Util. Environ. Eff. 2023, 45, 7136–7149. [Google Scholar] [CrossRef]
  27. Zhang, Z.; Wang, M. Convolutional Neural Network with Convolutional Block Attention Module for Finger Vein Recognition Comput. Vis. Pattern Recognit. 2022. (submitted).
  28. Chakraborty, S.K.; A., S.; Dubey, K.; Jat, D.; Chandel, N.S.; Potdar, R.; Rao, N.R.N.V.G.; Kumar, D. Development of an Optimally Designed Real-Time Automatic Citrus Fruit Grading–Sorting Machine Leveraging Computer Vision-Based Adaptive Deep Learning Model. Eng. Appl. Artif. Intell. 2023, 120, 105826. [CrossRef]
  29. Yao, J.; Li, Y.; Yang, B.; Wang, C. Learning Global Image Representation with Generalized-Mean Pooling and Smoothed Average Precision for Large-Scale CBIR. IET Image Process. 2023, 17, 2748–2763. [Google Scholar] [CrossRef]
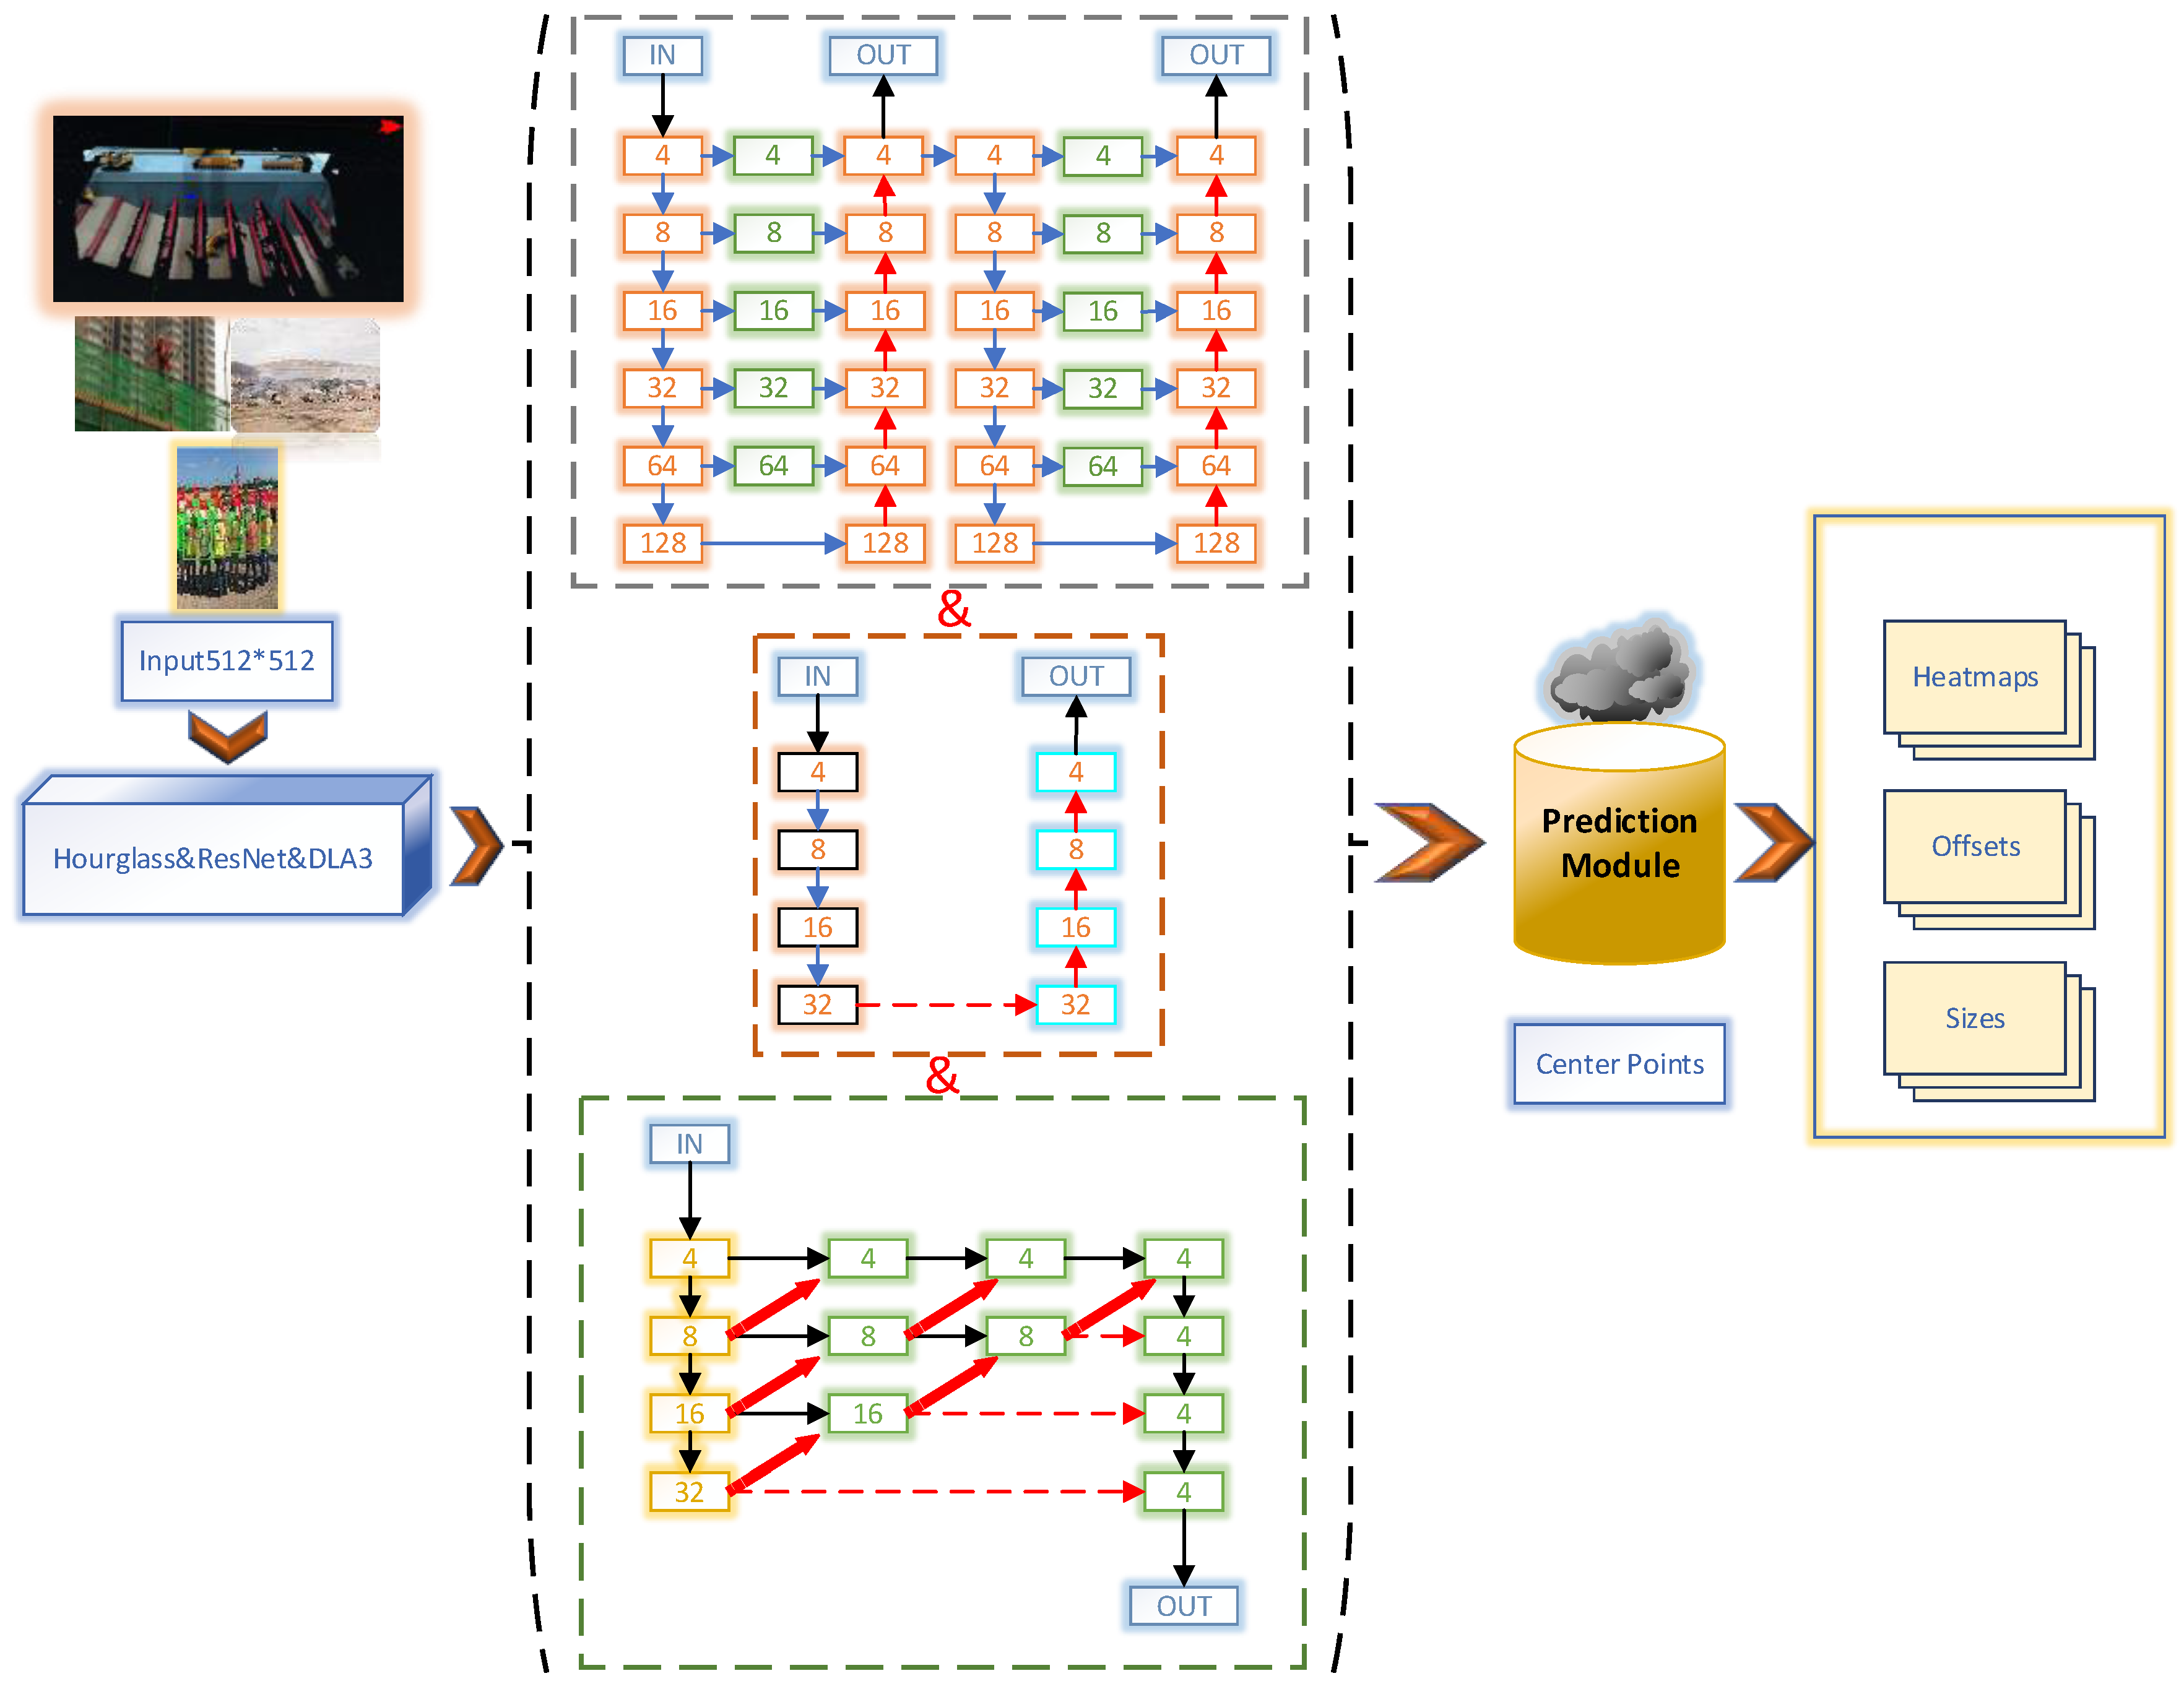
Figure 1. Schematic diagram of CenterNet algorithm model.
Preprints 97323 g001
Figure 2. CenterNet channel attention mechanism diagram.
Preprints 97323 g002
Figure 3. CenterNet Schematic diagram of spatial attention mechanism.
Preprints 97323 g003
Figure 4. CenterNet Overall CBAM mechanism schematic.
Preprints 97323 g004
Figure 5. Feature selection module diagram.
Preprints 97323 g005
Figure 6. Feature selection module adds detail.
Preprints 97323 g006
Figure 7. Random transformation used in training.
Preprints 97323 g007
Figure 8. Detection detail.
Preprints 97323 g008aPreprints 97323 g008b
Figure 9. Loss curve of network target size between CenterNet and feature selection module.
Preprints 97323 g009
Figure 10. Comparison of detection results between CenterNet and feature selection module.
Preprints 97323 g010
Figure 11. Performance improvement after CenterNet optimization demonstration.
Preprints 97323 g011
Figure 12. Actual detection.
Preprints 97323 g012
Table 2. Comparison of network performance before and after CenterNet optimization.
Network FLOPs Memory footprint/MB FPS Video memory/MB
CenterNet 13.06 50.3 296.5 1347
CenterNet-CBAM 13.06 51.7 189.9 1349
CenterNet-FS 16.35 51.1 250.2 1405
Table 3. CenterNet optimized process ablation experiment.
Serial number CenterNet CBAM FS Iou Memory footprint/MB FPS Video memory/MB FLOPs AP
1 × × × 50.3 296.5 1347 13.06 0.751
2 × × 51.7 189.9 1349 13.06 0.823
3 × × 51.1 250.2 1405 16.35 0.852
4 × × 50.8 172.8 1378 15.26 0.772
5 52.4 270.9 1409 16.87 0.905
Table 4. CenterNet Improved network layer input and output.
Net Input size Input channel Output size Output channel
Convolution 1 512×512 3 128×128 64
Res-Block1 128×128 64 128×128 64
CBAM1 128×128 64 128×128 64
Res-Block2 128×128 64 64×64 128
CBAM2 64×64 128 64×64 128
Res-Block3 64×64 128 32×32 256
CBAM3 32×32 256 32×32 256
Res-Block4 32×32 256 16×16 512
CBAM4 16×16 512 16×16 512
Upper sampling layer 1 16×16 512 32×32 256
Upper sampling layer 2 32×32 256 64×64 128
Upper sampling layer 3 64×64 128 128×128 64
Target center point 128×128 64 128×128 1
The target center is biased 128×128 64 128×128 2
Target size 128×128 64 128×128 2
Table 5. AP values for CenterNet and its improved network on the test set.
Network AP
CenterNet 0.751
CenterNet-IOU 0.772
CenterNet-CBAM 0.823
CenterNet-FS 0.852
CenterNet-CBAM-FS-IOU 0.905
Disclaimer/Publisher’s Note: The statements, opinions and data contained in all publications are solely those of the individual author(s) and contributor(s) and not of MDPI and/or the editor(s). MDPI and/or the editor(s) disclaim responsibility for any injury to people or property resulting from any ideas, methods, instructions or products referred to in the content.
Copyright: This open access article is published under a Creative Commons CC BY 4.0 license, which permit the free download, distribution, and reuse, provided that the author and preprint are cited in any reuse.
Prerpints.org logo

Preprints.org is a free preprint server supported by MDPI in Basel, Switzerland.

Subscribe

© 2024 MDPI (Basel, Switzerland) unless otherwise stated