Preprint
Article

Deciphering the Dose-Dependent Effects of Thymoquinone on Transcriptomic Changes and Cellular Proliferation in Glioblastoma

Altmetrics

Downloads

164

Views

178

Comments

0

Submitted:

25 January 2024

Posted:

26 January 2024

You are already at the latest version

Alerts
Abstract
Glioblastoma multiforme (GBM), the most prevalent primary malignant brain tumor in adults, exhibits a dismal 6.9% five-year survival rate post-diagnosis. Thymoquinone (TQ), the most abundant bioactive compound in Nigella Sativa, has been extensively researched for its anti-cancer properties across various human cancers. Yet, its specific anticancer mechanisms and pathways in glioblastoma remain to be elucidated. In this study, we assessed the impact of different TQ concentrations on the viability of A172 cells using WST-8 and Toluidine blue assays, followed by RNA sequencing (RNA-seq) to identify differentially expressed genes (DEGs). We confirmed their expression levels through quantitative RT-PCR and performed Gene Ontology and Kyoto Encyclopedia of Genes and Genomes (KEGG) pathway enrichment analyses for these DEGs. RNA-seq revealed no significant gene expression changes at 2.5 µM and 5 µM TQ concentrations. However, at 25 µM and 50 µM, TQ significantly reduced cell viability in a dose-dependent manner. We identified 1548 DEGs at 25 µM TQ (684 upregulated, 864 downregulated) and 2797 DEGs at 50 µM TQ (1528 upregulated, 1269 downregulated), with 1202 DEGs common to both concentrations. TQ inhibited key pathways such as PI3K-Akt signaling, calcium signaling, focal adhesion, and ECM-receptor interaction in A172 cells. It downregulated several potential oncogenes (e.g., AEBP1, MIAT) and genes linked to GBM proliferation and migration (e.g., SOCS2, HCP5), while modulating Wnt signaling and upregulating tumor suppressor genes (e.g., SPRY4, BEX2). TQ also affected p53 downstream targets, maintaining p53 levels. This study elucidates the anticancer mechanisms of TQ in A172 GBM cells, underscoring its effects on multiple signaling pathways and positioning TQ as a promising candidate for innovative glioblastoma treatment strategies.
Keywords: 
Subject: Biology and Life Sciences  -   Neuroscience and Neurology

1. Introduction

Approximately 1.9 million cases of cancer are estimated to be diagnosed in 2023, with over 600,000 individuals expected to die from the disease. Brain and other nervous system tumors account for 3% of all cancer-related deaths in both sexes. Glioblastoma multiforme, the most common primary malignant brain tumor in adults, has an incidence rate of 3.26 per 100,000 populations. The term 'glioblastoma' is reserved for the IDH-wildtype diffuse gliomas grade 4, as defined by Louis et al. in 2021 [1]. These tumors are characterized by rapid proliferation and poor differentiation. Genomic mutational studies, including those by The Cancer Genome Atlas (TCGA) Research Network in 2008, show that 80–90% of glioblastoma tumors harbor mutations affecting the PI3K, AKT, RAS, MAPK, p53, and/or RB signaling pathways. Glioblastomas are also highly angiogenic cancers with markedly increased VEGF expression, as noted by Reardon and Wen in 2015 [2]. However, the therapeutic outcome following antiangiogenic therapy is highly variable in improving overall survival, according to studies by Chinot et al. in 2014 and Gilbert et al. in 2014 [3,4]. The current standard of care for glioblastoma patients, as outlined by Batash et al. in 2017 [5] and the National Comprehensive Cancer Network (NCCN) in 2015, includes surgical resection, radiotherapy, and adjuvant chemotherapy with temozolomide. Despite recent advances in diagnosis and treatment, the overall survival for patients with glioblastomas is very poor, with a median overall survival of 13.5 months, as reported by Marenco-Hillembrand et al. in 2020 [6] and Ostrom et al. in 2022 [7]. Treatment outcomes in GBM patients are hindered by several factors, including high rates of de novo and acquired resistance, incomplete surgical resection due to the tumor's highly infiltrative nature, low selective cytotoxicity, serious side effects, an immunosuppressive microenvironment, redundancy in aberrantly activated cell signaling pathways, and the challenge of effectively delivering therapeutics due to the blood–brain barrier. These challenges are highlighted in studies by Davis in 2016 [8] and Reardon & Wen in 2015 [2].
In recent years, there has been a surge of interest in exploring the therapeutic potential of medicinal plants for anticancer agents within the scientific community. Many conventional anticancer drugs are derived from bioactive constituents, including Vinca alkaloids (vinblastine and vincristine), cytotoxic podophyllotoxins, and Taxol [9]. Nigella sativa Linn., commonly known as Blackseed or Black cumin, is an annual flowering plant native to South and Southwest Asia, and is prevalent in Northern Africa, the Middle East, and Southern Europe [10]. It is one of the most promising and extensively studied medicinal plants for anticancer agents. Phytochemical studies have identified several bioactive compounds in Nigella sativa, including sterols, saponins, phenolic compounds, alkaloids, novel lipid constituents, fatty acids, and volatile oils [11]. The most pharmacologically active constituent of Nigella Sativa's volatile oil is Thymoquinone (TQ) (2-methyl-5-isopropyl-1,4-benzoquinone) [12,13]. TQ is extracted from the essential oil of Nigella Sativa seeds using supercritical fluid extraction [14] and has been found to possess antimicrobial, antihistaminic, antidiabetic, anti-inflammatory, antioxidant, hypolipidemic, and anticancer properties [15,16,17]. Several in vitro and in vivo studies have illustrated the cytotoxic effects of TQ on various cancer cell lines, including breast adenocarcinoma, leukemia, lung cancer, colorectal carcinoma, pancreatic cancer, osteosarcoma, prostate cancer, and glioblastoma [17]. TQ affects multiple pathways and processes relevant to cancer, exhibiting anticancer activity through numerous mechanisms, specifically by showing selective antioxidant and oxidant activity, interfering with DNA structure, affecting carcinogenic signaling molecules/pathways, and immunomodulation [18]. In vivo studies on mice have suggested that TQ can cross the blood-brain barrier due to its size and lipophilicity [19]. Although some underlying mechanisms for the anticancer activities of TQ in glioblastoma cells have been identified, many potential pathways and targets remain to be fully elucidated. Research on the exact molecular pathways of its anticancer activities in glioblastoma cells is still in its early stages. Most research on TQ in glioblastoma cells has been conducted using the U-87 MG cell lines, with other glioma cell lines yet to be extensively studied. The aim of this study was to use RNA sequencing to examine changes in the expression of genes in A172 glioma cells in response to treatment with TQ at concentrations where significant cell death occurs. We then explored the pathways associated with those differentially expressed genes.

2. Materials and Methods

2.1. Cell Culture, Treatment and Cell Viability Assays

The glioblastoma cell line, A172, was purchased from the American Type Culture Collection (ATCC #CRL-1620) (Manassas, VA, USA). Cells were maintained in Dulbecco's modified Eagle medium (DMEM) (ATCC, Manassas, VA) containing 4,500 mg/L D-glucose, L-glutamine, and 110 mg\L sodium pyruvates in 75 or 175 cm2 cell culture flasks. The media was supplemented with 10% (v/v) Fetal bovine serum (FBS) (Atlas Biologicals, Fort Collins, CO). Additionally, an antibiotic-antimycotic mixture: of penicillin (10 000 U/mL), streptomycin (10mg/ mL), and amphotericin (25µg/mL) (Millipore Sigma Life Sciences, Burlington, MA) was also supplemented to the media. All cell lines were maintained in a humidified incubator at 37oC with 5% atmospheric CO2. For passaging the cells, trypsin-EDTA (ATCC, Manassas, VA) was used. 50mM stock solution of thymoquinone (Sigma Aldrich, MA) was prepared in filter sterilized DMSO (Millipore Sigma). Using the complete DMEM medium, suitable working concentrations were prepared from the stock solution. The final concentration of DMSO was 0.1% for all treatments. Cells were treated with different concentrations of thymoquinone ranging from 0 to 50 µM for 48 hours. After overnight attachment of cells, the media was removed and replaced with the corresponding volume of TQ-containing and untreated media. To test the effect of different concentrations of thymoquinone on cell viability, Toluidine blue staining Assay and Cell Counting Kit-8 was used.

2.2. Toluidine Blue Staining

A172 cells were seeded into 96 well plates and incubated overnight. 24 hours after incubation the media was removed, 100µl of thymoquinone-treated and untreated media was added to each well. Cells were treated with 0, 10, 25, and 50µM concentrations of TQ for 48 hours. Following the TQ treatments, the media was removed from each well. Cells were washed once with phosphate-buffered saline (PBS) (ATCC). 100µl of toluidine blue staining solution (1% toluidine blue (LabChem Inc, Zelienople, PA) and 1% borax (LabChem)) was added to each well and incubated for 20 minutes at room temperature. After 20-25 minutes, the staining solution was directly discarded to the sink. The remaining unbound solution was washed by immersing the plate in water. The plate was inverted and left to dry. The next day, the cells absorbance at 600nm was measured using SpectraMax iD3 Multi-Mode Microplate Reader (Molecular Devices, San Jose, CA).

2.3. Cell Counting Kit-8

Cell Counting Kit-8 (CCK-8) is a highly sensitive colorimetric assay widely used for the determination of a number of viable cells in cell viability and cytotoxicity assays. CCK-8 utilizes Dojindo's highly water-soluble tetrazolium salt, WST-8. The WST-8 assay was performed according to the manufacturer's protocol (Dojindo Laboratories, Gaithersburg, MD). A172 cells were seeded into 96 well plates at a density of not more than 5000 cells per well. Cells were incubated overnight for reattachment to the culture plate. The next day, the media was removed and replaced with fresh thymoquinone-treated and untreated media. Control, 10µM, 25µM, and 50µM of thymoquinone were used as treatment. After 48 hours of treatment, 10 µL of CCK-8 solution (Dojindo Laboratories) was added to each 96 wells and incubated for 3 hours at 37°C and 5% CO2. After incubation, the absorbance was measured at 450nm using SpectraMax iD3 Multi-Mode Microplate Reader (Molecular Devices).

2.4. RNA Extraction, Library Preparation, and RNA-Sequencing

A172 cells were seeded in 60mm culture dishes and incubated overnight. After 24 hours of incubation, the cells were treated with 25 and 50 µM concentrations of thymoquinone for 48 hours. Total RNA was extracted using Qiagen RNeasy Total RNA Isolation Kit (QIAGEN, Valencia, CA). The concentration and integrity of RNA samples were evaluated using a Nanodrop spectrophotometer (Thermo Fisher Scientific) and 0.7% % agarose gel electrophoresis. RNA was quantified using Qubit 3.0 (Thermo Fisher Scientific, USA). Then, the next-generation sequencing libraries were constructed as per the manufacturer's protocol ((NEBNext®Ultra™ RNA Library Prep Kit for Illumina®; Illumina, New England Biolabs Inc., Ipswich, MA, USA, Cat #E7770S/L, #E7775S/L). 1 µg of total RNA from each of the three biological replicates were used for the library preparation. The Poly(A) mRNA isolation was performed using NEBNext Poly(A) mRNA Magnetic Isolation Module (NEB #E7490). Similarly, NEBNext First-Strand Synthesis Reaction Buffer and NEBNext Random Primers mix were used for the fragmentation and priming of mRNA. First-strand cDNA was synthesized using NEBNext First Strand Synthesis Enzyme Mix, and the second-strand cDNA was synthesized using NEBNext Second Strand Synthesis Enzyme Mix. The double-stranded cDNA was purified using SPRIselect Beads. Thus, purified double-stranded DNA was treated with an End Prep Enzyme Mix to repair any broken or damaged ends and add a single A-base to the 3' end of the DNA. This was followed by the adapter ligation on both ends of cDNA. The size selection of the adapter-ligated DNA was performed using SPRIselect Beads to remove any DNA fragments that are too short or too long for efficient sequencing. PCR enrichment of size-selected DNA was performed using i5 and i7 primers. Purification of PCR products was performed using SPRIselect beads. The final library quality and insert size were determined using a bioanalyzer (Invitrogen, USA), and the library was quantified using a Qubit fluorometer (Invitrogen, USA). The library was diluted to 4nM concentration and sequenced using Illumina's NextSeq 500 platform with paired-end sequencing chemistry. The resulted image files in the BCL format were converted to FASTQ with 2x150 bp reads using the bcl2fastq tool (Illumina, USA).

2.5. Differential Gene Expression and Pathway Analysis

The raw data was obtained in FASTQ format. The quality of the raw data was assessed using the tool FastQC. For quality control, these raw reads were processed by Trimmomatic (v0.30) to remove low-quality bases (Quality Score <30) and those containing the adapter sequences (Bolger et al., 2014). Clean data obtained after quality trim was used for downstream analysis. The reference human genome sequences (GRCh38.p13) and the gene annotation files were then downloaded from gencode website (https://www.gencodegenes.org/human/). STAR (version 2.7.3a) [20] was used to index the reference human genome sequences in order to create the necessary data structures for efficient alignment. After creating the reference genome indexed file, the clean data were aligned to them via STAR aligner [20]. In the next step, the aligned transcriptomic data in SAM format was converted into BAM format using SAMTools. The aligned BAM file was indexed using the SAMtools. The read count table was generated from the BAM alignment file and general feature format (GFF) of genome annotation using the HTSeq R package [21]. The Differentially expressed genes (DEGs) among different experimental pair-wise combinations were identified using the DESeq2 [22]. The DEGs were filtered based on the minimum Log2 Fold-Change (Log2FC) greater than 1 or less than -1 with a false discovery rate (FDR)⩽0.05. GO and Pathway Enrichment analyses were performed using ShinyGO [23]. Similarly, heatmap was generated using statistical package pheatmap in RStudio, venn-diagram using Venny 2.1, and volcano plot was generated using online tool Galaxy Bioinformatics.

2.6. Real-time reverse transcription polymerase chain reaction (qRT-PCR)

Briefly, cells were treated with control, 10, 25, and 50µM concentrations of TQ for 48 hours. Total RNA was isolated and purified. Then, 500ng of total RNA was reverse transcribed into cDNA using random primers in a ImProm-II Reverse Transcription System (Promega, Madison, WI) following the manufacturer protocol. The RT reaction was carried out in a total volume of 20 µl. The quality and quantity of cDNA were assessed using a Nanodrop spectrophotometer (Thermo Fisher Scientific). cDNA from 27ng of RNA template and 100μM of each target genes primers was used. The mRNA expression level of the target gene was normalized to 18S rRNA mRNA expression. Fold change in the mRNA expression relative to the control was calculated using the RQ Study component of the ABI SDS v1.2.3 software and the comparative method based on 2-ΔΔCt values [24].

2.7. Statistical Analysis

To test for significance, a one-way analysis of variance (ANOVA) was used. This test was used to determine whether there were statistically significant differences among the means of control and treatment groups. Data were presented as means + SEM. The confidence interval was 95%, and the P<0.05 was considered significant. For the multiple comparisons of the means, Tukey HSD post hoc test was conducted on R Studio.

3. Results

3.1. TQ treatment for 24 hours had no significant inhibitory effect on A172 cell viability.

Since, the gene expression fold changes were not statistically significant at lower concentrations (2.5 µM and 5 µM) of TQ, we increased the TQ treatment concentration as well as the treatment time. We treated the A172 cells with increasing concentrations of thymoquinone (10, 25, and 50 µM) and treated to 24 hours as well as 48 hours. We then used WST-8 and Toluidine Blue assay to determine the effect of TQ on A172 cell viability. As determined by the WST-8 assay in Figure 1, no significant growth inhibitory effect of TQ on A172 cells were observed across control, 10 µM, 25 µM, and 50 µM TQ treatment for 24 hours. If anything, TQ was observed to increase the numbers of viable cells in all the treatments, although any differences were small. Among the different concentrations, the proliferative response of A172 cells was higher at 25 µM. The 25 µM treatment significantly increased the viability of cells when used for 24 hours. In contrast, the 10 and 50 µM treatments did not significantly increase the proliferation or number of A172 cells.

3.2. TQ treatment for 48 hours inhibited the viability of A172 cells in dose dependent manner.
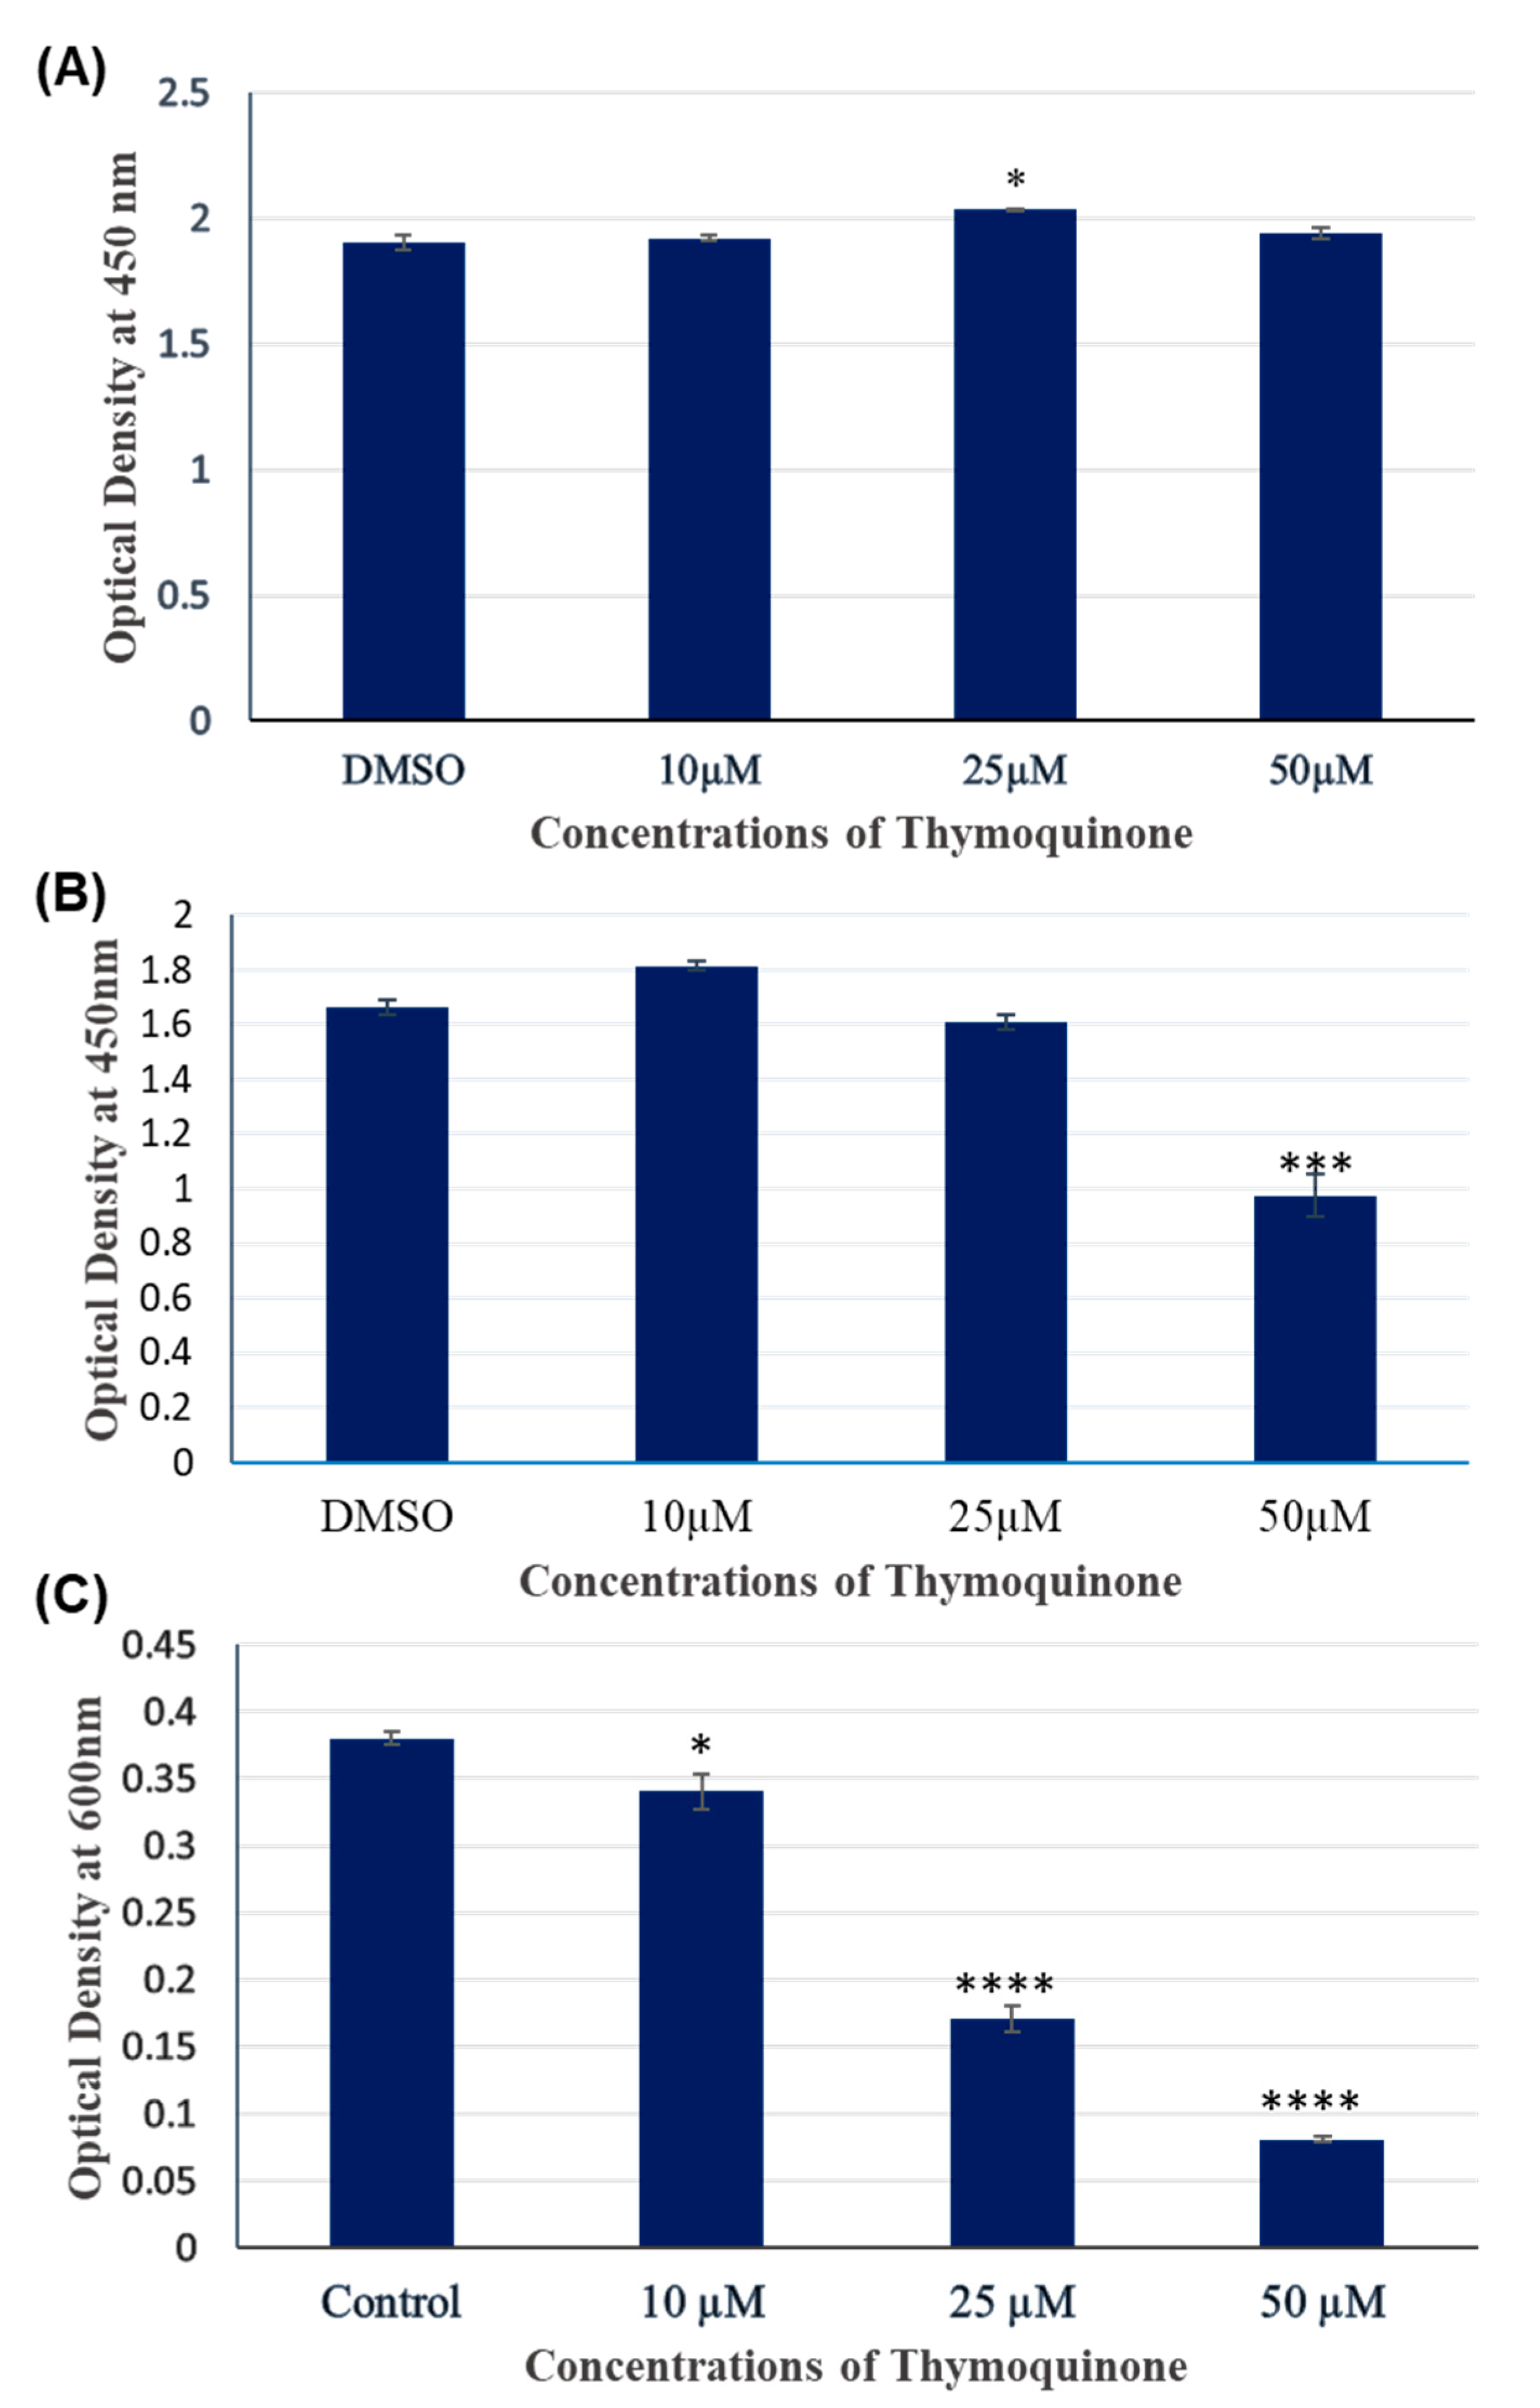
We further investigated the cytotoxic effects of 10, 25, and 50 µM TQ on A172 cells for 48 hours using WST-8 and Toluidine Blue assay. As shown in Figure 1, thymoquinone treatment for 48 hours inhibited and increased numbers of viable cells as analyzed by WST-8 assay. The addition of 10 µM TQ numerically, but not significantly, increased the viability of A172 cells. In contrast, 25 and 50 µM treatment for 48 hours resulted in dose-dependent inhibition of cell viability, with this being statistically significant at 50 µM. The colorimetric assay using Cell Counting Kit-8 is not cell permeable, so it is much less cytotoxic to the cells than other cytotoxic assays. Therefore, it is possible to continue further experiments with the same cells (Dojindo Molecular Technologies, Inc., 2020). Hence, after performing the WST-8 assay, we used the same cell and proceeded directly to the toluidine blue cell viability assay. We simultaneously fixed and stained the cells with 100µl of toluidine blue staining solution and measured the absorbance at 600 nm. As shown in Figure 1, TQ decreased the number of viable cells in a dose-dependent manner. The growth inhibition at all concentration (10 µM, 25 µM, and 50 µM) was statistically significant. The greatest decrease in the viability of A172 cells was observed at the TQ concentration of 50 µM.
Overall, the results obtained from both assays were similar except for the 10 µM treatment. The results of the toluidine blue assay were more dramatic, although other cytotoxic assays like MTT and WST-8 are generally recognized as more sensitive. We took the result obtained from our WST-8 assay as a reference for our further experiment. One limitation of the toluidine blue assay is there are chances of experimenter error, like rigorous washing of plates with water. This might have washed out some living cells attached to the cell plate and affected our readings perhaps due to changes in cell adhesion. Our results indicated that TQ inhibits cell viability and/or proliferation of A172 cells at higher concentrations for a longer exposure (48 hours).
Figure 1. Viability of A172 cells after treatment with control, 10, 25, and 50 µM concentrations of TQ for 24 hours (A) and 48 hours (B and C). Cell viability was measured using WST-8 assay (A and B) and Toluidine Blue assay(C). The data are presented as the mean ±Standard Error of mean. 0.1% DMSO was used for each treatment including control. (n=3 for each treatment, *p<0.05, **p<0.01, ***p<0.001).
Preprints 97337 g001

3.3. 2.5 µM and 5 µM TQ for 24 hours did not cause differential gene expression in A172 cells.

Initially we treated A172 cells with control, 2.5 µM and 5 µM TQ for 24 hours. We then extracted the RNA, inspected quality and quantity using Agilent 2100 Bioanalyzer and Qubit 4 Fluorometer respectively, prepared library, and performed RNA-seq. In this case, we wanted to check for gene expression changes at concentrations of TQ that did not cause significant differences in the numbers of viable cells. Altogether 352854966 raw reads were obtained. After removing the low-quality reads (Phred score QV<30) using a read trimming tool Trimmomatic, quality-filtered reads were mapped to the Human reference genome (GRCh38.p13) https://www.gencodegenes.org/human [25]. Using the DESeq2 in R, we quantified the gene expression changes. We found that 2.5 µM, and 5 µM TQ for 24 hours didn't cause any significant changes in the expression of genes in A172 cells. More details of this RNA-seq data are presented in Table 1.

3.4. TQ treatment for 48 hours induced differentially expressed genes in A172 cells.

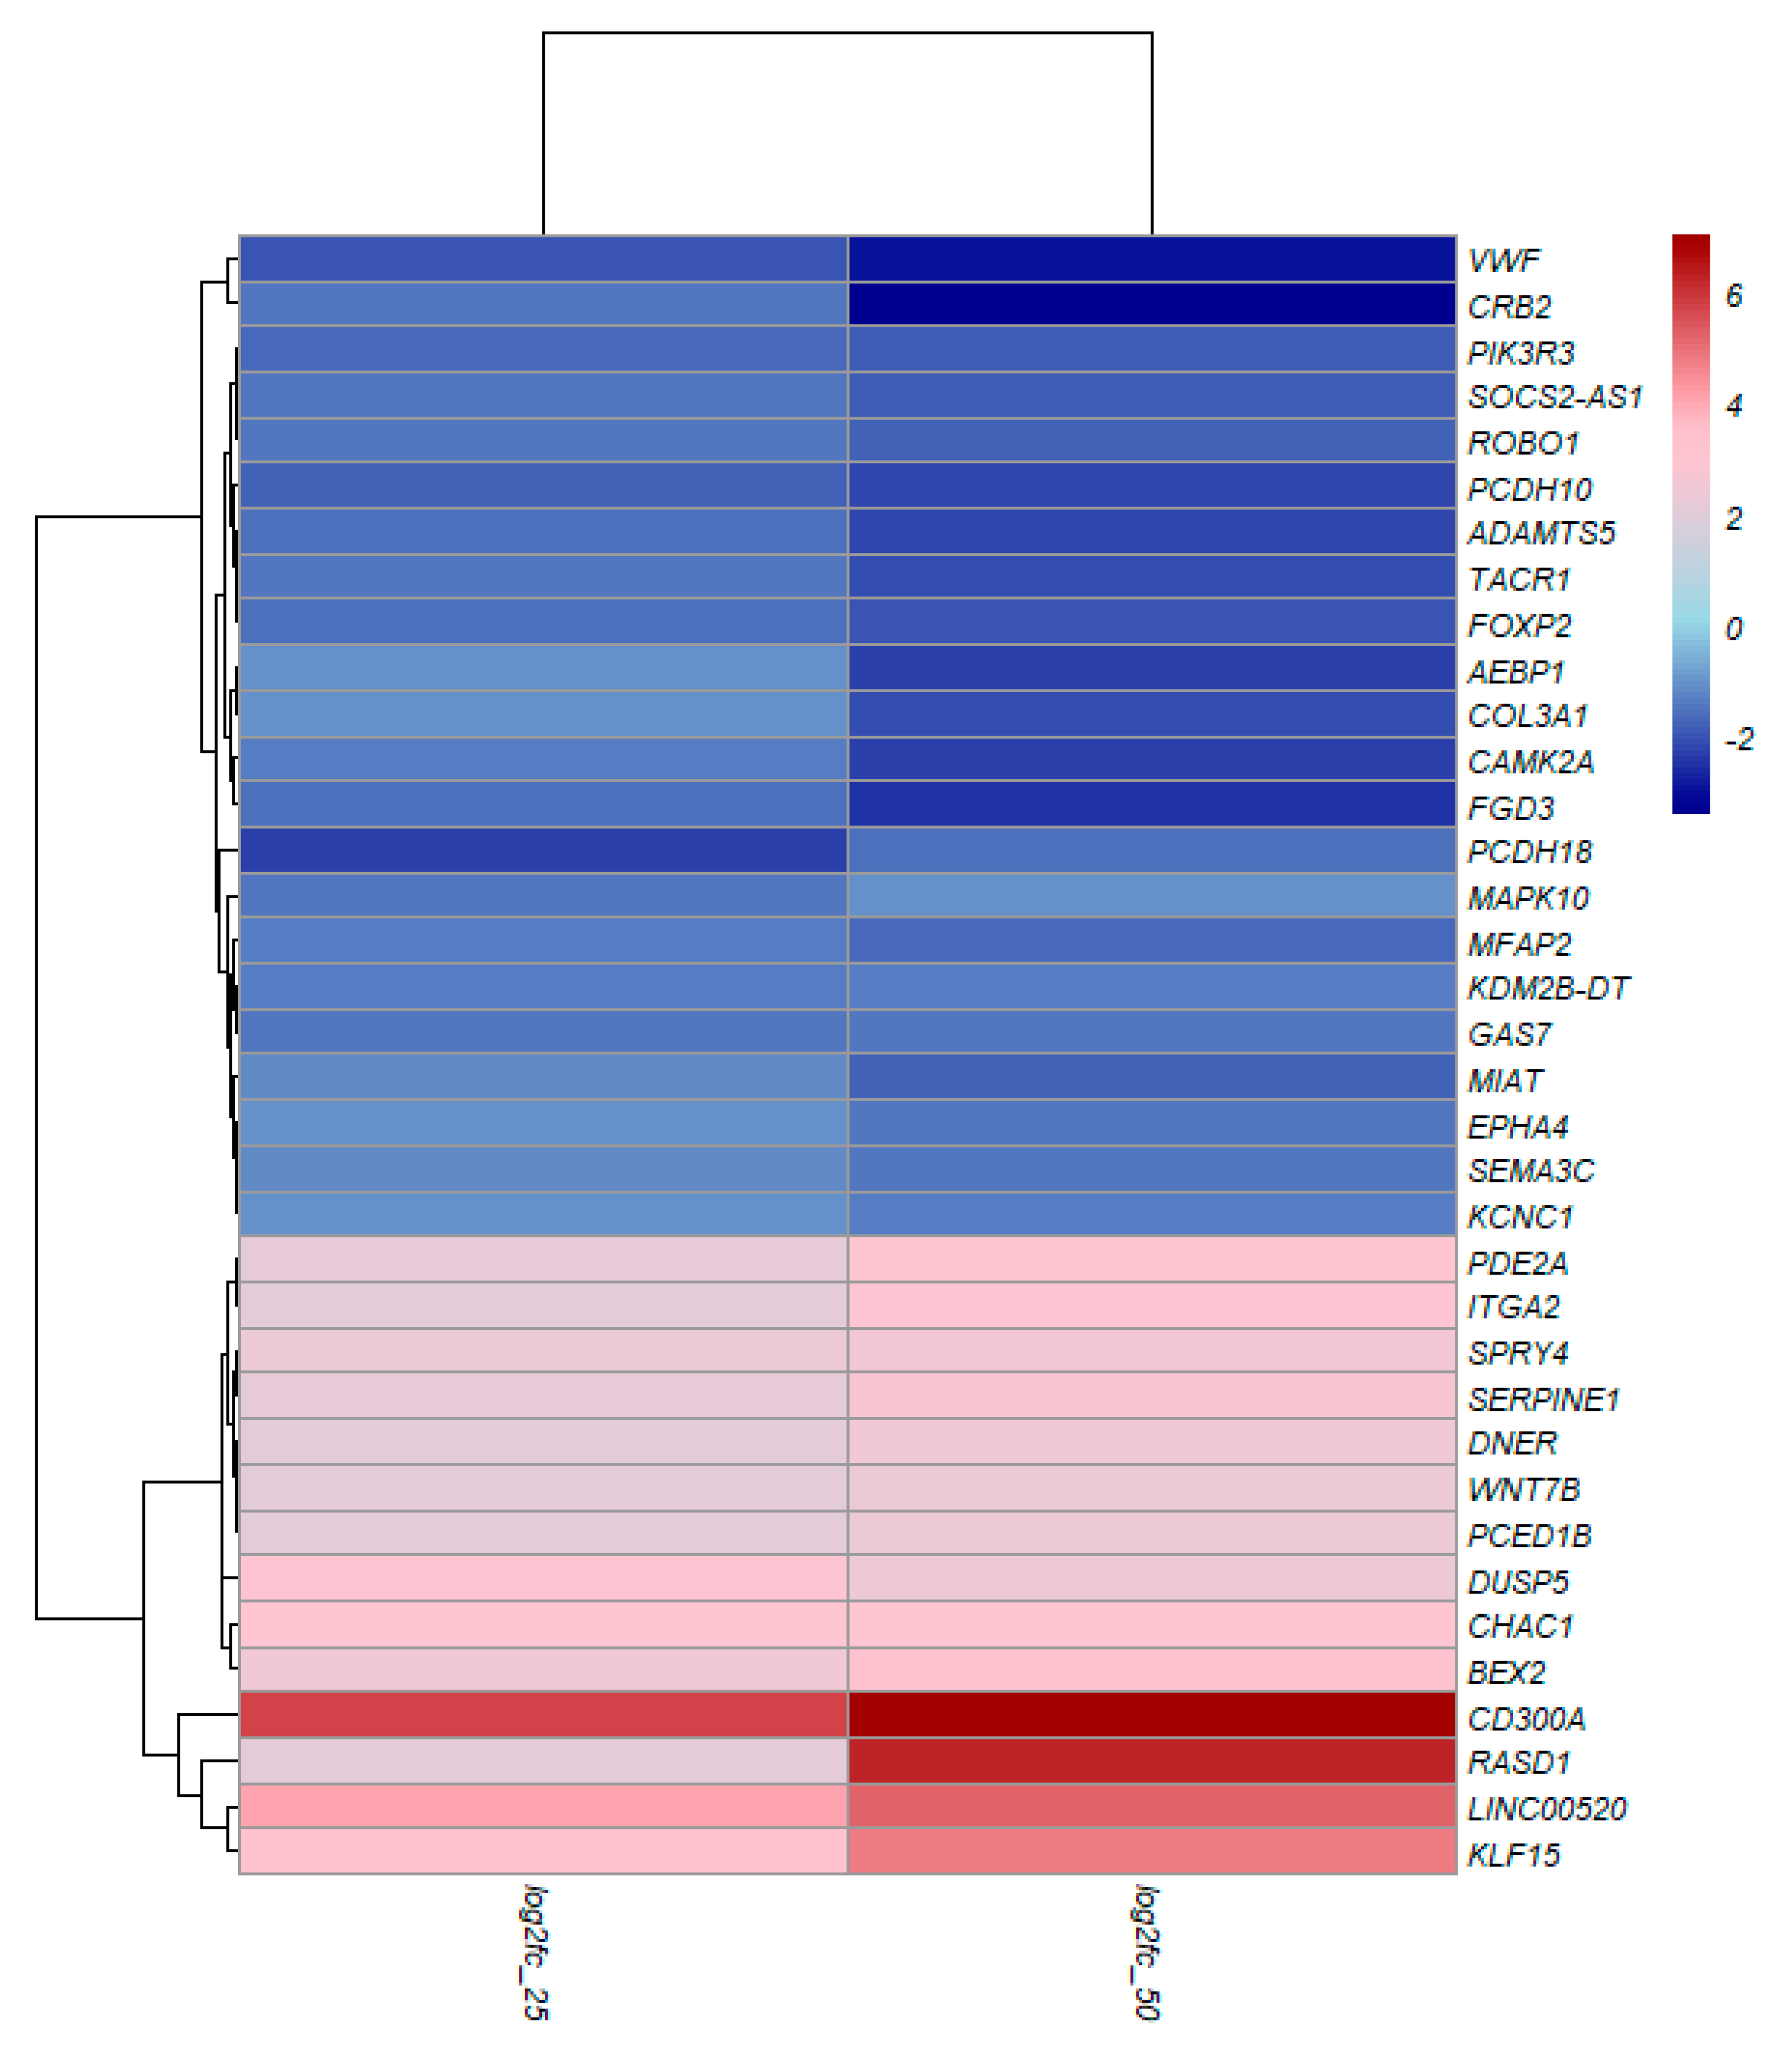
A172 cells were treated with control (0.1% DMSO), 25 µM, and 50 µM TQ concentration for 48 hours, RNA was extracted, and RNA-sequencing was performed as described in materials and method section. A total of 332,999,712 raw reads were primarily generated from RNA-seq. After removing the low-quality reads (Phred score QScore<30) and those containing sequencing adapters, 321,194,991 clean reads were remained. We then mapped the remaining clean reads to the reference human genome https://www.gencodegenes.org/human. The details of data quality, filtration, mapping percentage are presented in Table 2. Using DESeq2 in RStudio version 3.0., we determined the genes with significant differential gene expression profiles between the control and different treatment conditions (Control vs. 25µM and control vs. 50 µM). Differential gene expressions were determined as the Log2 Fold-Change (Log2FC) greater than 1 or less than -1 with a false discovery rate (FDR)⩽0.05. Compared to the control, 1548 genes were differentially expressed in 25 µM TQ for 48 hours in which 684 genes were upregulated and 864 were downregulated. These 1548 DEGs are visually represented in a volcano plot in Figure 2. In 50 µM TQ for 48 hours, 2797 genes were differentially expressed, of which 1528 were upregulated and 1269 were downregulated. Volcano plots for 2797 DEGs in 25 µM treatment are represented in Figure 2. We also determined the common significant DEGs in 25 and 50 µM treatment for 48 hours. In total, we found 1202 common differentially expressed genes. This includes 580 common significantly upregulated genes and 622 common significantly downregulated genes. Similarly, 104 genes were found to be significantly upregulated only on 25 µM for 48 hours. Also, 948 genes displayed significant upregulation solely on 50 µM treatment for 48 hours. Furthermore, 242 and 647 genes exhibited significant downregulation exclusively on 25 µM and 50 µM treatment for 48 hours, respectively. Venn diagram representing common and unique significantly upregulated genes and common and unique significantly downregulated genes on two treatment conditions are presented in Figure 3. Heat map of significant DEGs in 25 µM and 50 µM TQ treatment is presented in Figure 4.

3.5. KEGG Pathway Enrichment Analysis

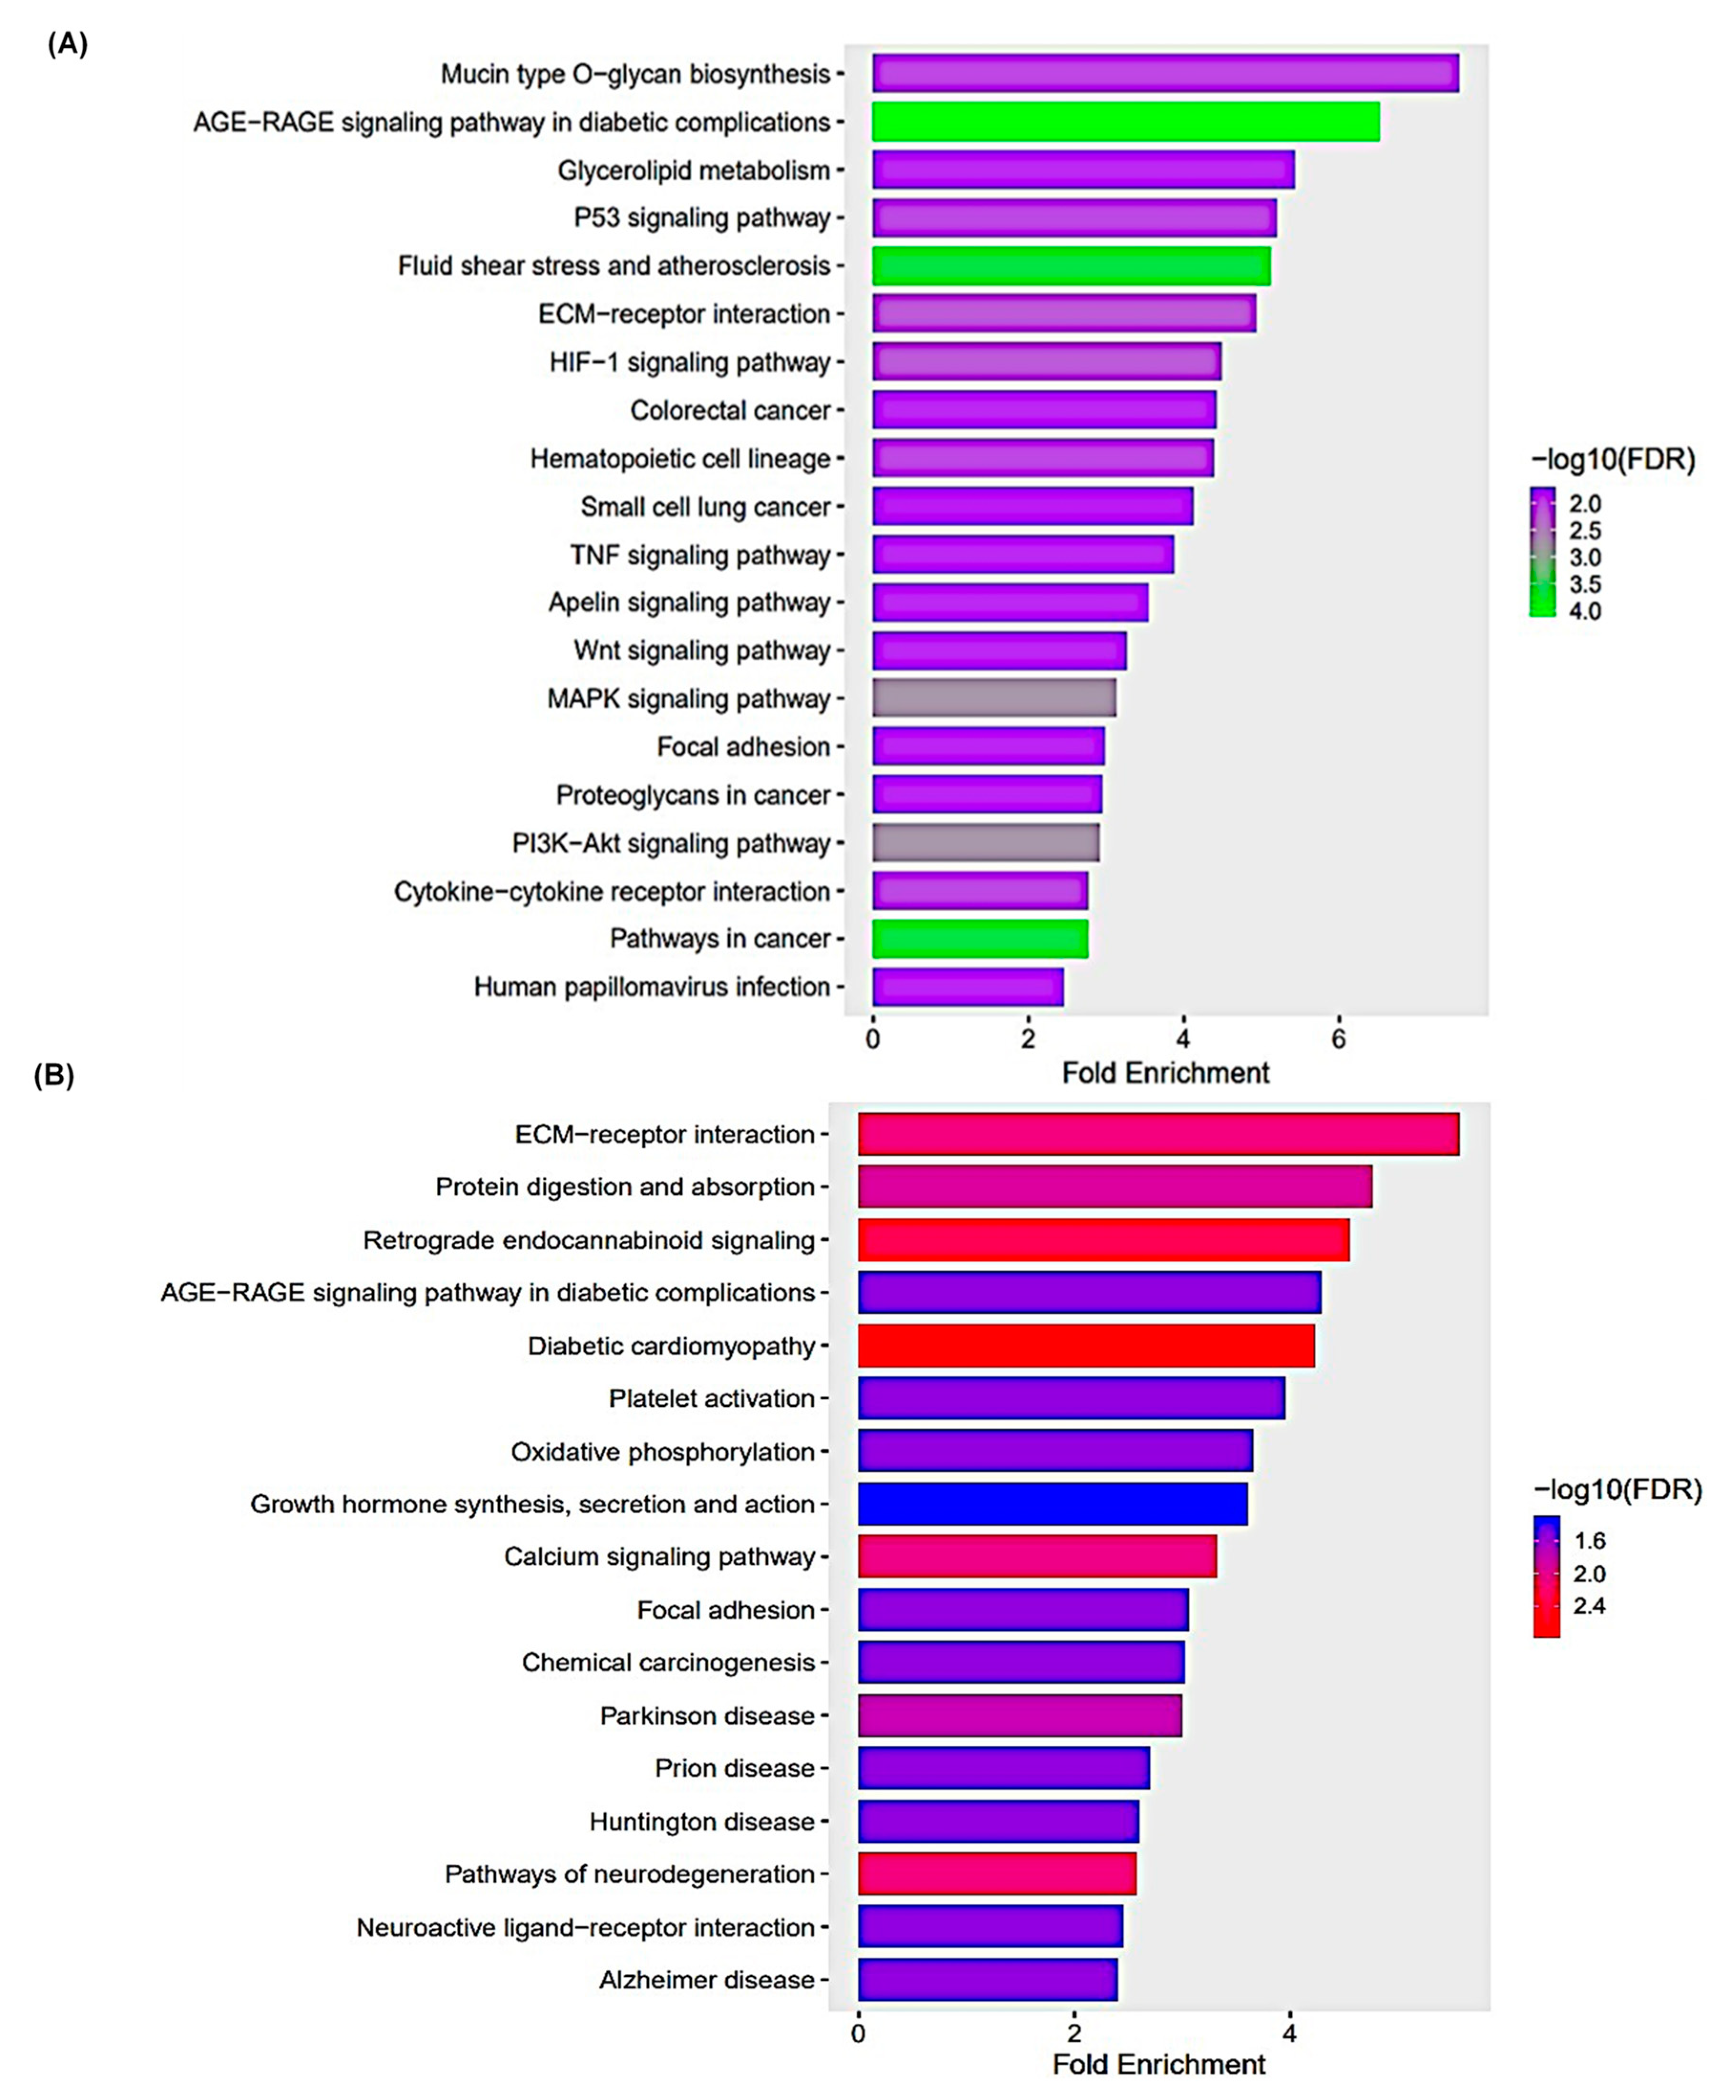
We performed KEGG pathway enrichment analysis for common significant DEGs in 25 µM and 50 µM TQ Treatment for 48 hours. We determined the important enriched biochemical, metabolic, and signal transduction pathways related to the activity of thymoquinone on human glioblastoma cells (A172). Using p<0.05 and a pathway size minimum of 15, we found that the common upregulated genes were primarily enriched in 85 pathways. The top 20 highly enriched pathways are shown in Figure 5. In summary, those common upregulated genes were enriched in several pathways known to be involved in tumorigenesis and the progression of glioblastoma. Some of these pathways are P53 signaling pathway, ECM-receptor interactions, HIF-1 signaling pathway, TNF signaling pathway, WNT signaling pathway, MAPK signaling pathway, PI3-AKT signaling pathway, pathways in cancer, focal-adhesions, and cytokine-cytokine interactions.
Similarly, KEGG pathway analysis revealed that the common downregulated genes were enriched in the pathways related to ECM-receptor interaction, AGE-RAGE signaling pathway in diabetic complications, protein digestion and absorption, oxidative phosphorylation, calcium signaling pathway, focal adhesion, chemical carcinogenesis, and growth hormone synthesis, secretion, and action. Top 20 significantly enriched pathways are presented in Figure 5. The details of the enriched pathways, genes and fold changes are presented in Table 3 and Table 4. The KEGG pathways with the identified genes from the current study are presented in the Supplementary Figures 1–5.

3.6. Gene Ontology Enrichment

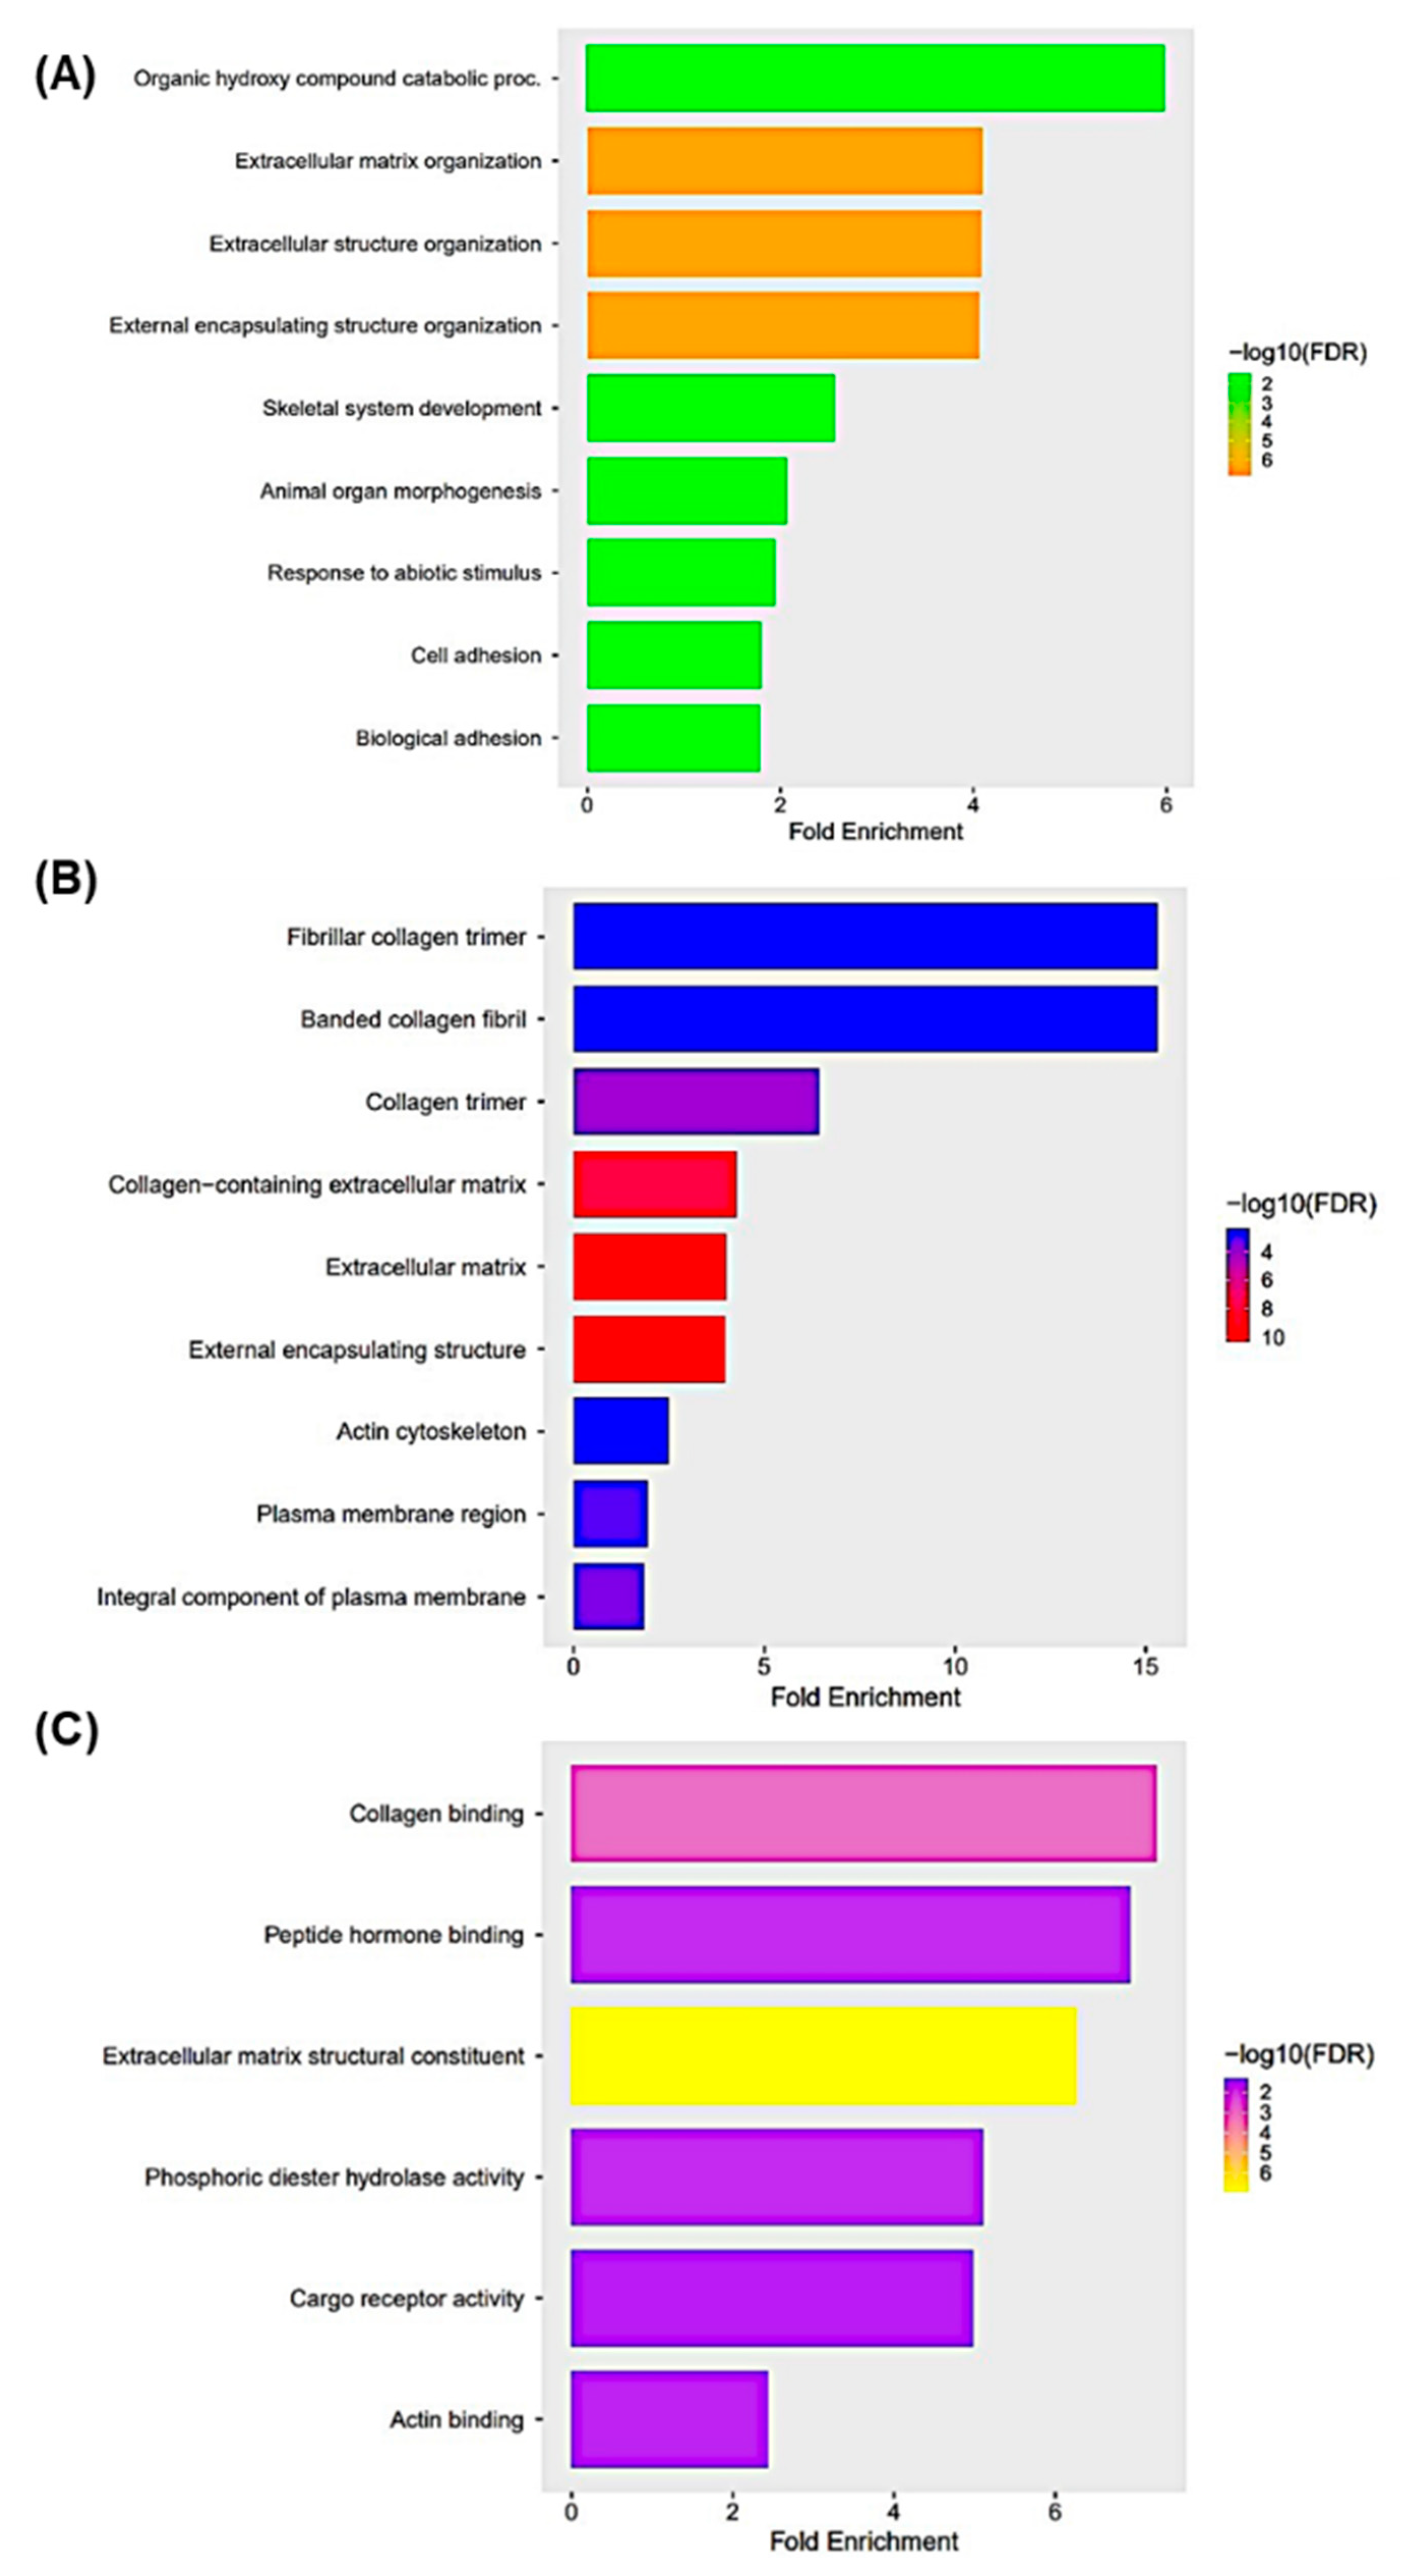
Gene ontology enrichment analysis of common significant DEGs in 25 µM and 50 µM TQ Treatment for 48 hours was conducted in order to explore the functions of those DEGs. The gene functions were categorized into three classes: biological process, cellular components, and molecular functions. The common upregulated genes in the category of the biological process are the genes related to MAPK cascade, blood vessel development, cell migration, negative regulation of signal transduction, regulation of programmed cell death, and regulation of protein phosphorylation. Similarly, some cellular components highly enriched in those common downregulated genes include the intrinsic component of synaptic vesicle membrane, anchored component of membrane, extracellular matrix, and external encapsulating structure. Furthermore, the predominantly enriched molecular function terms were DNA binding, bending, insulin-like growth factor binding, extracellular matrix binding, growth factor activity, and cytokine activity.
Similarly, the common downregulated genes were significantly enriched in the biological process related to an extracellular matrix organization, extracellular structure organization, external encapsulating structure organization, cell adhesion, and focal adhesion. Similarly, the markedly enriched cellular components were fibrillar collagen trimer, collagen-containing extracellular matrix, actin cytoskeleton, extracellular matrix, external encapsulating structure, and integral component of postsynaptic density membrane. Similarly, the common downregulated genes are enriched in the molecular functions related to collagen binding, peptide hormone binding, and extracellular matrix structural constituents. The 10 most significantly enriched biological processes, cellular components, and molecular functions are presented in Figure 6.
3.7. qRT-PCR Verification
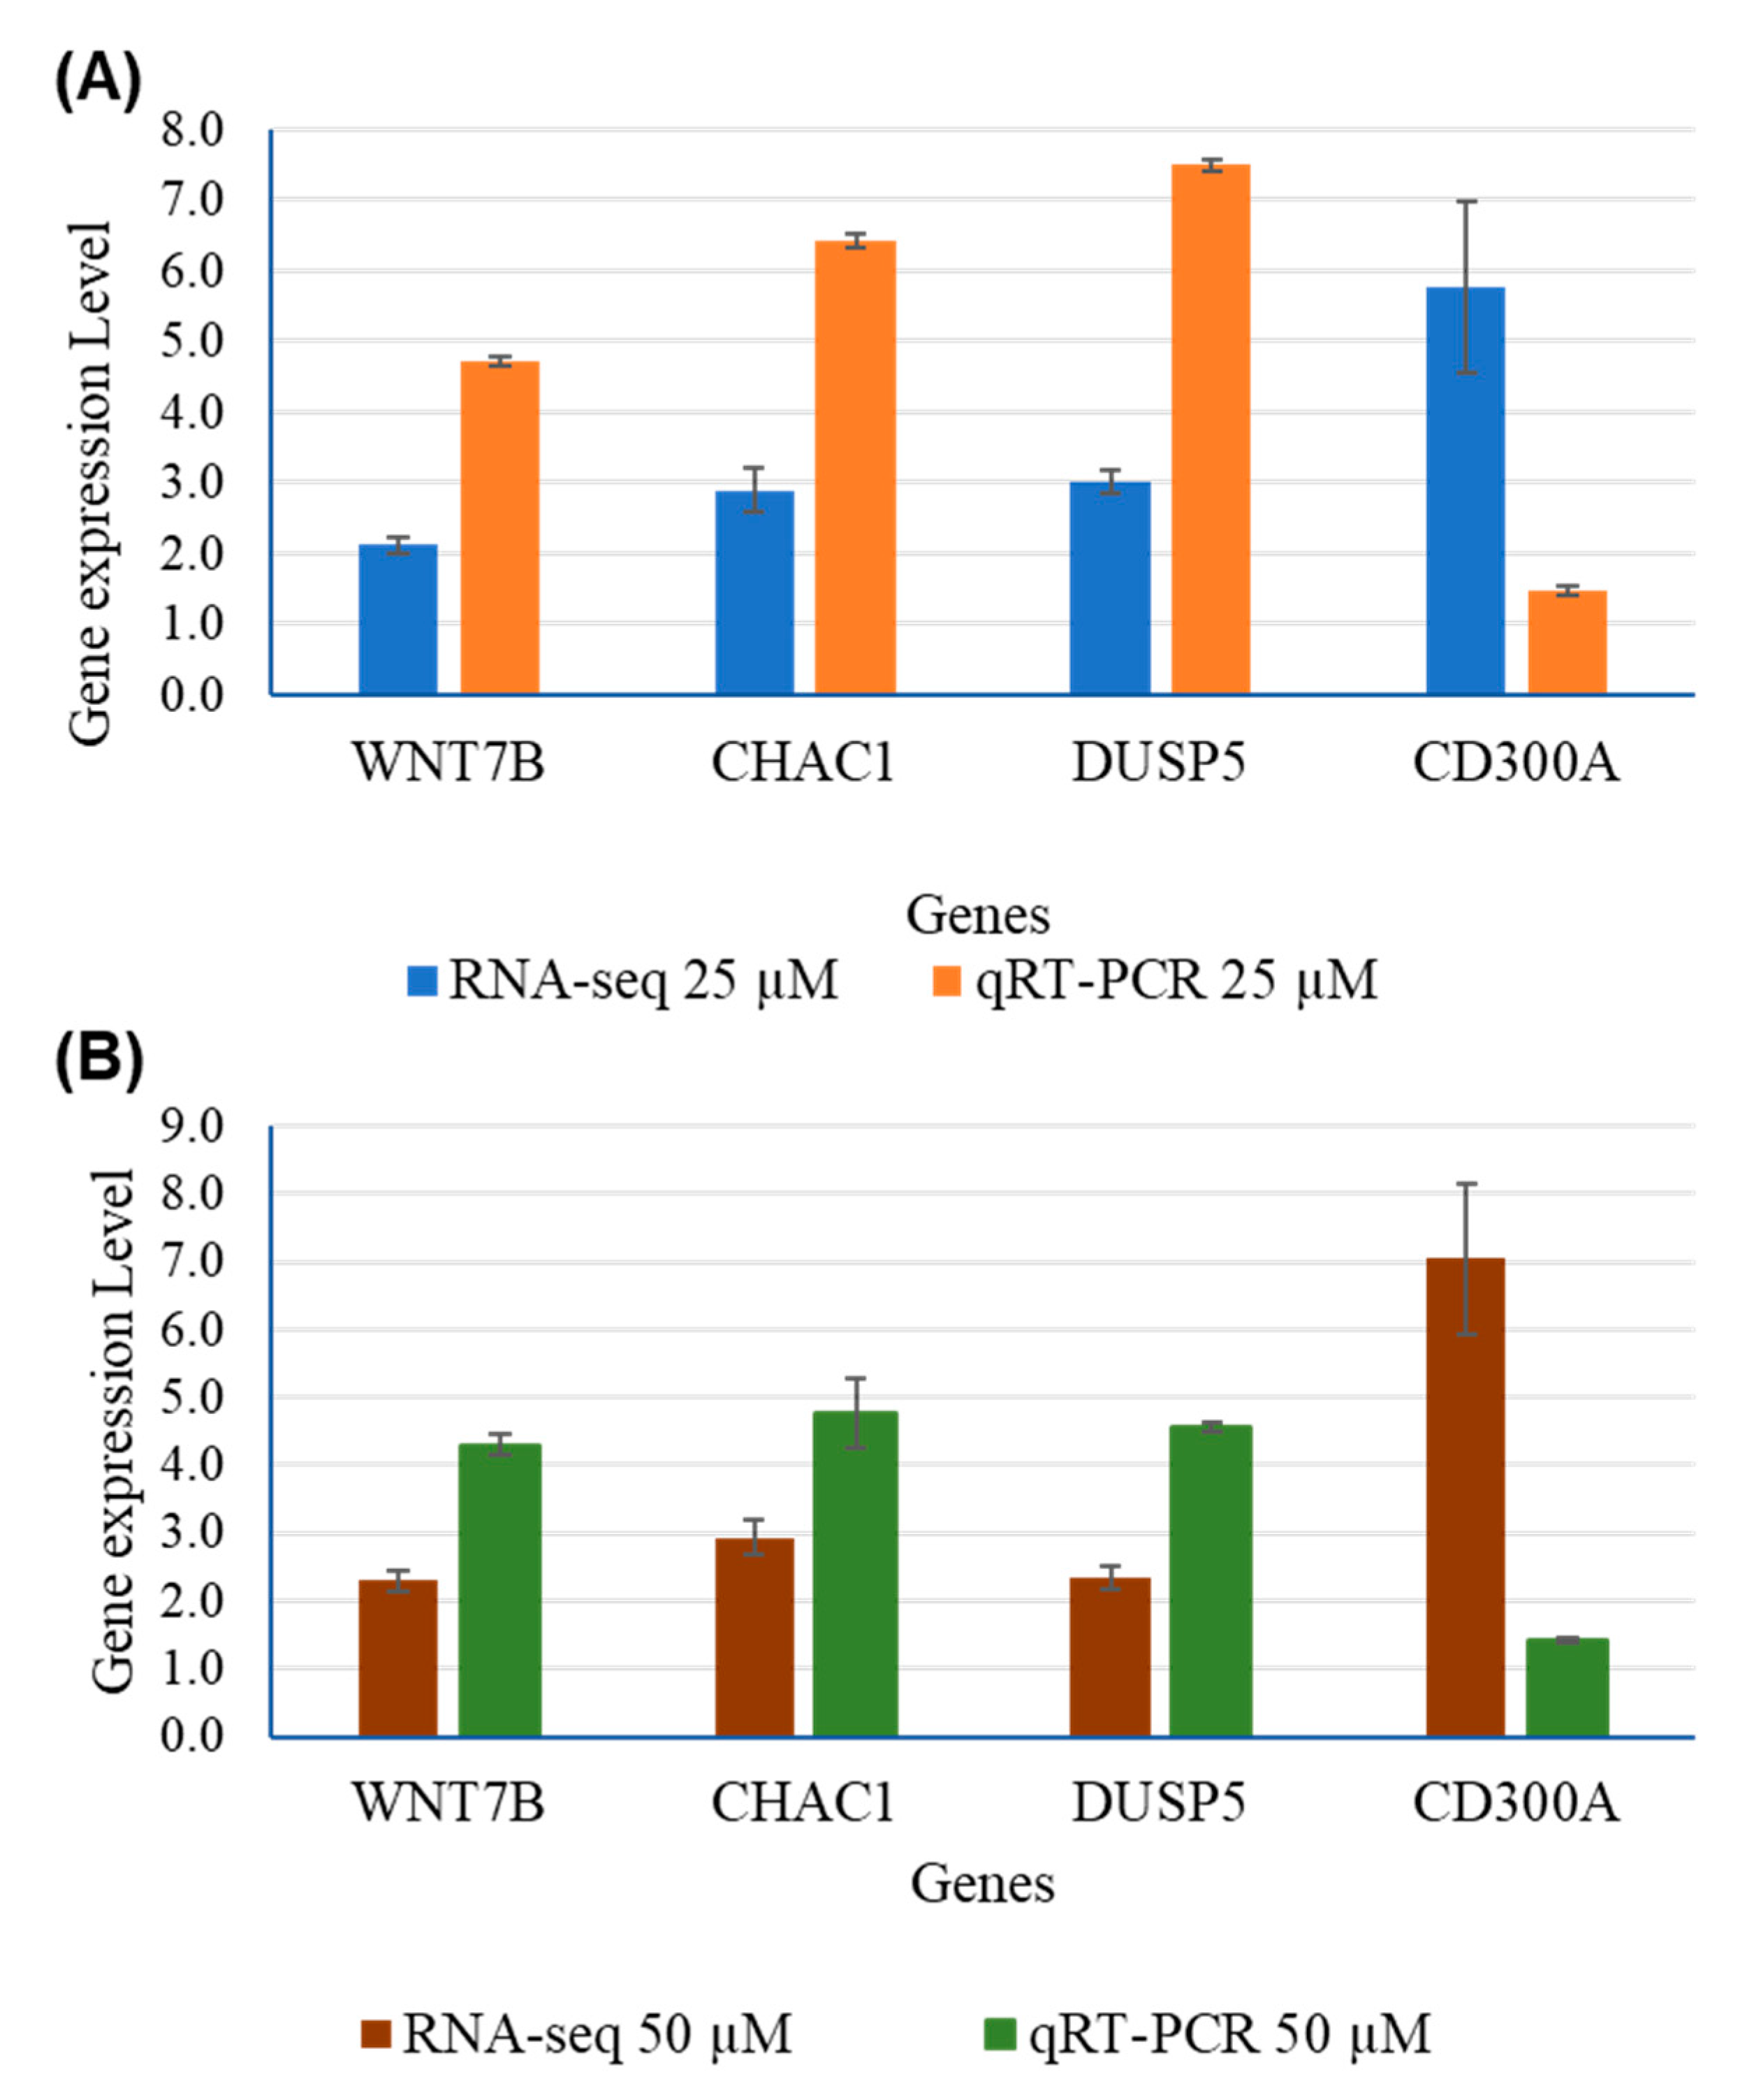
To further validate the gene expression results from Illumina RNA-Sequencing data, qRT-PCR was performed to investigate the mRNA expression of the gene WNT7B, CHAC1, DUSP5, and CD300A in TQ treated A172 cells. Briefly, the same total RNA used for the RNA-seq was used for qRT-PCR. The details of the primers and sequences are presented in the Supplementary Table S1. All these genes are shown to be significantly upregulated by qRT-PCR result which is consistent with the RNA-seq findings. Gene expression fold change in NGS and qRT-PCR is presented in Table 5. qRT-PCR results are shown graphically in Figure 7. These findings demonstrate that the expression pattern of all genes is consistent with Illumina RNA-Sequencing data, confirming the validity of our experimental results.

4. Discussion

In our study investigating the impact of thymoquinone (TQ) on A172 glioma cell viability, we observed a dose-dependent inhibition of cell growth at higher concentrations, particularly after 48 hours of treatment. These results are consistent with existing literature, such as Ballout and Gali-Muhtasib, 2020 [26], who reported similar time and concentration-dependent effects of TQ in neuroblastoma cells, and Racoma et al. (2013) [27], who noted TQ's dose-dependent apoptotic induction in cancer cells. The dual role of TQ in modulating cell proliferation, as seen in our findings and echoed by Fatfat et al. (2021) [28], highlights its complex biological activity. Our reliance on the WST-8 assay for its reliability, as also suggested by Eid et al. (2023) [29], helped mitigate potential experimental errors common in assays like Toluidine Blue, as discussed by Adilovic et al. (2020) [30]. Additionally, our observation of TQ's selective cytotoxicity aligns with Mokashi 2004 [31], who emphasized its potential as a cancer therapeutic due to its ability to selectively target cancer cells.
In this study, TQ was found to inhibit the extracellular matrix-receptor (ECM-receptor) interaction pathway in A172 glioblastoma cells, affecting 8 differentially expressed genes. The ECM, which forms the cellular microenvironment and consists of glycoproteins, proteoglycans, and glycosaminoglycans [32], is often overexpressed in glioma cells. Components such as hyaluronic acid, brevican, tenascin-C, fibronectin, thrombospondin, and specific integrins and receptors are known to promote cell adhesion and migration [33]. These components, particularly HA and collagens, also act as barriers that limit drug diffusion and penetration into tumors [34]. Additionally, collagen can inhibit T cell migration at tumor sites, impairing immune surveillance [35]. TQ treatment's downregulation of several ECM components suggests potential therapeutic effects, such as decreased cell adhesion, impaired cancer cell migration, and hindered invasion through the basement membrane.
Further we noted, TQ inhibited the calcium signaling pathway in A172 glioblastoma cells, as evidenced by the downregulation of genes associated with this pathway following treatment with 25 and 50 µM TQ for 48 hours. Calcium signaling, crucial in controlling diverse cellular functions and linked with the progression of GBMs and other cancers [36,37], saw notable gene expression changes. CAMK2A, a key kinase in Ca2+-induced signaling and cell cycle progression, was significantly downregulated, aligning with findings by Colomer & Means (2007) [38] and Takemoto-Kimura et al. (2017) [39] on its role in proliferation. Studies by Wang et al. (2022) [40] and Yu et al. (2021) [41] further emphasize its impact on glioma cell functions. The TACR1 gene, encoding a receptor linked to various cancers [42], also showed decreased expression, highlighting TQ's potential in cancer cell apoptosis. Moreover, the reduced expression of GRM1, involved in cell cycle arrest and apoptosis in glioma [43,44], and the downregulation of PLCG2, known for its overexpression in glioma and role in intracellular Ca2+ signaling [45,46], further underscore TQ's multifaceted impact on glioblastoma cell signaling and tumor progression.
In our study, KEGG pathway analysis indicated that higher concentrations of Thymoquinone (TQ) (50 µM) significantly downregulated genes in the PI3K-Akt signaling pathway in A172 glioblastoma cells, involving 18 differentially expressed genes like LPAR2, FGF10, COL9A3, PDGFB, IL2RB, IL7, PDGFRB, ITGB6, PPP2R2B, COL1A2, THBS3, PDGFD, GNG7, ERBB4, COL4A5, LAMA2, COL6A6, ITGA1. This pathway, crucial in processes like proliferation, differentiation, migration, metabolism, and survival, is often dysregulated in GBM due to RTK gene mutations and PI3K pathway activation. Genes like PDGFB, ERBB4, and IL-7, which play roles in activating PI3K-Akt signaling [47,48,49,50], were also downregulated. Interestingly, we observed the upregulation of RASD1, a gene that inhibits glioma cell migration and invasion by deactivating the AKT/mTOR signaling pathway [51]. This might contribute to the observed inhibition of the AKT pathway. Additionally, PPP2R2B, often downregulated and methylated in GBM, was also downregulated in TQ-treated cells, correlating with shorter survival in GBM patients [52]. These findings suggest TQ's potential as a therapeutic target in GBM by influencing key pathways and gene expressions.
In our study, we observed that 25 and 50 µM TQ treatments for 48 hours upregulated the P53 signaling pathway in A172 glioblastoma cells, without altering the level of p53 itself. This suggests TQ modulates the p53 pathway by influencing the expression of its downstream target genes. Specifically, TQ upregulated genes like PMAIP1 (NOXA), GADD45A, BBC3 (PUMA), and DUSP5. PMAIP1 and BBC3, transcription targets of p53 involved in DNA damage-induced apoptosis [53,54,55,56], are pro-apoptotic proteins of the Bcl-2 family, which, when activated, bind and inhibit anti-apoptotic proteins. The downregulation of the anti-apoptotic protein Bcl-XL was also noted. GADD45A, rapidly induced in response to DNA damage [57,58], and studies have shown its importance in apoptosis induction by anticancer agents [59,60,61]. DUSP5, a dual-specificity phosphatase, deactivates protein kinases and its overexpression has been linked to suppressed growth in various cancer cells [62]. The increase in proapoptotic proteins and decrease in anti-apoptotic proteins in TQ-treated cells suggest TQ may enhance mitochondrial membrane permeability, potentially activating the intrinsic pathway of apoptosis in glioblastoma cells.
In our study, TQ treatment of A172 glioblastoma cells with 25 and 50 µM concentrations for 48 hours significantly upregulated two candidate tumor suppressor genes: Sprouty RTJ Signaling Antagonist 4 (SPRY4) and Brain Expressed X-Linked 2 (BEX2). SPRY4, upregulated by 2.5-fold, is part of the Spry protein family, known to be repressed in GBM and often missing or deleted in gliomas [63]. As a negative regulator of MAPK activation, its ectopic expression has been shown to inhibit proliferation and migration in GBM cells, suggesting its role as a tumor suppressor [64]. BEX2, on the other hand, showed an upregulation by 3.2-fold in 50 µM TQ treatment and 2.5-fold in 25 µM treatment. Part of the BEX gene family, it was found to be silenced in U-87 and primary glioma cell lines, with its re-expression increasing sensitivity to chemotherapy-induced apoptosis and demonstrating tumor suppressor effects [65]. However, some studies show contrasting results about BEX2, such as its high expression in glioma tissue and its role in inhibiting glioma cell migration and invasion by affecting β-catenin levels [66]. These findings suggest that TQ may play a role in modulating tumor suppressor gene expression, contributing to its potential therapeutic effects in glioblastoma treatment.
In our study on A172 glioblastoma cells, TQ regulated the expression of key components and regulators of the Wnt signaling pathway. TQ increased the expression of Wnt Family Member 7B (Wnt7B) by 2.2-fold and decreased WNT6 expression by 1.6-fold. The Wnt pathway, known for its activation in glioblastoma, plays a crucial role in processes like cell proliferation, apoptosis, migration, and invasion. Studies have indicated varied expression levels of Wnt pathway components in gliomas, such as elevated WNT3A and 5A and decreased WNT7B [67], and the oncogenic role of overexpressed WNT6 [68]. In our study, Phophodiesterase 2A (PDE2A) was upregulated, a gene known to suppress Wnt/β-catenin signaling in glioma stem-like cells by modulating cAMP accumulation and GSK-3β phosphorylation [69]. Additionally, TQ treatment led to downregulation of Sema3C, an overexpressed gene in most GBMs that activates the canonical Wnt pathway [70]. Our findings suggest that TQ modulates Wnt signaling by altering the expression of its core components (WNT7B and WNT6) and regulators (PDE2A and Sema3C), thereby potentially downregulating this oncogenic pathway and contributing to its anticancer mechanism in vitro.
In our study on A172 glioblastoma cells, TQ treatment led to the upregulation of important genes like CHAC1 and DNER, known for their roles in GBM development. CHAC1, a cytosolic protein, typically downregulated in GBM cell lines, was identified as a key gene upregulated by TMZ treatment, enhancing glioma apoptotic death and inhibiting Notch3-mediated pathways [71]. DNER, a noncanonical Notch ligand, was found to suppress glioma growth by inhibiting the oncogene TOR4A [72] and hindered the growth and induced differentiation of GBM-derived neurospheres [73]. Conversely, TQ treatment resulted in the downregulation of several genes overexpressed in GBM cells, including potential oncogenes like AEBP1, MIAT, GHR, LMO1, ELF3 [74,75,76,77,78], and genes involved in tumor proliferation and migration such as EPHA4, COL3A1, PCDH10, ROBO1, ADAMTS5, PCDH18, ST8SIA1 [79,80,81,82,83,84]. Additionally, TQ significantly downregulated genes associated with poor GBM prognosis, including PCSK5, KCNC1, MXRA5, SEMA3C, MFAP2, MTERF2, KDM2B, FOXP2 [85,86,87,88,89,90,91], indicating TQ's potential in targeting key molecular pathways in GBM.

5. Conclusions

The primary aim of our research was to determine the effective concentration of Thymoquinone (TQ) on glioblastoma multiforme (GBM) cell viability and to utilize RNA sequencing (RNA-seq) at this concentration to identify differentially expressed genes and associated pathways. We discovered that low TQ concentrations (below 10 µM) did not significantly alter gene expression in glioblastoma cells within the exposure times tested. However, a decrease in viable cell numbers was observed at higher concentrations (25 and 50 µM). RNA-seq analysis revealed numerous differentially expressed genes, and pathway enrichment analysis showed that TQ exerts its anticancer effects by modulating pathways such as PI3K-AKT, calcium signaling, focal adhesion, ECM-receptor interaction, and by downregulating potential oncogenes and upregulating the P53 signaling pathway and tumor suppressor genes. TQ also influenced the expression of core components and regulators of Wnt signaling in GBM cells. Our study provides valuable insights into TQ's anticancer mechanisms and supports its potential as a therapeutic agent in glioblastoma treatment. However, these findings are specific to A172 cells and might not directly translate to other cell lines or clinical settings. Future research should include in vitro experiments with different GBM cell lines and in vivo studies to validate these results. Investigating the functional consequences of downregulated genes and identifying specific molecular targets of TQ within the affected pathways will enhance understanding. While we initially hypothesized that TQ would inhibit pathways like HIF-1, TNF, and MAPK, our findings showed upregulation, warranting further investigation. The study also suggests the need to consider factors like the interaction of TQ with serum proteins and the potential influence of albumin in FBS on our results, indicating the value of conducting future experiments in serum-free media.

Supplementary Materials

The following supporting information can be downloaded at the website of this paper posted on Preprints.org, Figure S1–S5, Table S1.

Author Contributions

Conceptualization, G.R.H, M.S, W.D, U.K.R; methodology, R.P, G.R.H, P.N, C.S, U.K.R; software, R.P, P.N; validation, R.P, G.R.H; formal analysis, R.P, P.N, G.R.H; writing—original draft preparation, RP; writing—review and editing, P.N, U.K.R, G.R.H; supervision, G.R.H, P.N, U.K.R, W.D; project administration, G.R.H; funding acquisition, G.R.H, C. S, U. K. R. All authors have read and agreed to the published version of the manuscript.

Funding

Research reported in this publication was supported by the National Institute of General Medical Sciences of the National Institutes of Health under Award Number 2U54GM104942-07. The content is solely the responsibility of the authors and does not necessarily represent the official views of the National Institutes of Health. This material is based upon work supported by the National Science Foundation under Award No. 1920920 and 224277.

Data Availability Statement

The RNA sequencing data generated in this study are available in the NCBI database under the BioProject accession number PRJNA1068643.

Conflicts of Interest

The authors declare no conflicts of interest.

References

  1. Louis, D.N.; Perry, A.; Wesseling, P.; Brat, D.J.; Cree, I.A.; Figarella-Branger, D.; Hawkins, C.; Ng, H.; Pfister, S.M.; Reifenberger, G. The 2021 WHO classification of tumors of the central nervous system: a summary. Neuro-oncology 2021, 23, 1231–1251. [Google Scholar] [CrossRef]
  2. Reardon, D.A.; Wen, P.Y. Unravelling tumour heterogeneity—implications for therapy. Nature reviews Clinical oncology 2015, 12, 69–70. [Google Scholar] [CrossRef]
  3. Chinot, O.L.; Wick, W.; Mason, W.; Henriksson, R.; Saran, F.; Nishikawa, R.; Carpentier, A.F.; Hoang-Xuan, K.; Kavan, P.; Cernea, D. Bevacizumab plus radiotherapy–temozolomide for newly diagnosed glioblastoma. New England Journal of Medicine 2014, 370, 709–722. [Google Scholar] [CrossRef]
  4. Gilbert, M.R.; Dignam, J.J.; Armstrong, T.S.; Wefel, J.S.; Blumenthal, D.T.; Vogelbaum, M.A.; Colman, H.; Chakravarti, A.; Pugh, S.; Won, M. A randomized trial of bevacizumab for newly diagnosed glioblastoma. New England Journal of Medicine 2014, 370, 699–708. [Google Scholar] [CrossRef]
  5. Batash, R.; Asna, N.; Schaffer, P.; Francis, N.; Schaffer, M. Glioblastoma multiforme, diagnosis and treatment; recent literature review. Current medicinal chemistry 2017, 24, 3002–3009. [Google Scholar] [CrossRef]
  6. Marenco-Hillembrand, L.; Wijesekera, O.; Suarez-Meade, P.; Mampre, D.; Jackson, C.; Peterson, J.; Trifiletti, D.; Hammack, J.; Ortiz, K.; Lesser, E. Trends in glioblastoma: outcomes over time and type of intervention: a systematic evidence based analysis. Journal of neuro-oncology 2020, 147, 297–307. [Google Scholar] [CrossRef]
  7. Ostrom, Q.T.; Price, M.; Neff, C.; Cioffi, G.; Waite, K.A.; Kruchko, C.; Barnholtz-Sloan, J.S. CBTRUS statistical report: primary brain and other central nervous system tumors diagnosed in the United States in 2015–2019. Neuro-oncology 2022, 24, v1–v95. [Google Scholar] [CrossRef]
  8. Davis, M.E. Glioblastoma: overview of disease and treatment. Clinical journal of oncology nursing 2016, 20, S2. [Google Scholar] [CrossRef]
  9. Raina, H.; Soni, G.; Jauhari, N.; Sharma, N.; Bharadvaja, N. Phytochemical importance of medicinal plants as potential sources of anticancer agents. Turkish Journal of Botany 2014, 38, 1027–1035. [Google Scholar] [CrossRef]
  10. Banerjee, S.; Padhye, S.; Azmi, A.; Wang, Z.; Philip, P.A.; Kucuk, O.; Sarkar, F.H.; Mohammad, R.M. Review on molecular and therapeutic potential of thymoquinone in cancer. Nutrition and cancer 2010, 62, 938–946. [Google Scholar] [CrossRef]
  11. Yimer, E.M.; Tuem, K.B.; Karim, A.; Ur-Rehman, N.; Anwar, F. Nigella sativa L.(black cumin): a promising natural remedy for wide range of illnesses. Evidence-Based Complementary and Alternative Medicine 2019, 2019. [Google Scholar] [CrossRef] [PubMed]
  12. Ali, B.; Blunden, G. Pharmacological and toxicological properties of Nigella sativa. Phytotherapy Research: An international journal devoted to pharmacological and toxicological evaluation of natural product derivatives 2003, 17, 299–305. [Google Scholar] [CrossRef] [PubMed]
  13. Darakhshan, S.; Pour, A.B.; Colagar, A.H.; Sisakhtnezhad, S. Thymoquinone and its therapeutic potentials. Pharmacological research 2015, 95, 138–158. [Google Scholar] [CrossRef] [PubMed]
  14. Goyal, S.N.; Prajapati, C.P.; Gore, P.R.; Patil, C.R.; Mahajan, U.B.; Sharma, C.; Talla, S.P.; Ojha, S.K. Therapeutic potential and pharmaceutical development of thymoquinone: a multitargeted molecule of natural origin. Frontiers in pharmacology 2017, 8, 656. [Google Scholar] [CrossRef] [PubMed]
  15. Randhawa, M.A.; Alghamdi, M.S. Anticancer activity of Nigella sativa (black seed)—a review. The American journal of Chinese medicine 2011, 39, 1075–1091. [Google Scholar] [CrossRef] [PubMed]
  16. Shabana, A.; El-Menyar, A.; Asim, M.; Al-Azzeh, H.; Al Thani, H. Cardiovascular benefits of black cumin (Nigella sativa). Cardiovascular toxicology 2013, 13, 9–21. [Google Scholar] [CrossRef] [PubMed]
  17. Woo, C.C.; Kumar, A.P.; Sethi, G.; Tan, K.H.B. Thymoquinone: potential cure for inflammatory disorders and cancer. Biochemical pharmacology 2012, 83, 443–451. [Google Scholar] [CrossRef] [PubMed]
  18. Khan, M.A.; Tania, M.; Fu, S.; Fu, J. Thymoquinone, as an anticancer molecule: from basic research to clinical investigation. Oncotarget 2017, 8, 51907. [Google Scholar] [CrossRef] [PubMed]
  19. Hosseinzadeh, H.; Parvardeh, S. Anticonvulsant effects of thymoquinone, the major constituent of Nigella sativa seeds, in mice. Phytomedicine 2004, 11, 56–64. [Google Scholar] [CrossRef]
  20. Dobin, A.; Davis, C.A.; Schlesinger, F.; Drenkow, J.; Zaleski, C.; Jha, S.; Batut, P.; Chaisson, M.; Gingeras, T.R. STAR: ultrafast universal RNA-seq aligner. Bioinformatics 2013, 29, 15–21. [Google Scholar] [CrossRef]
  21. Anders, S.; Pyl, P.T.; Huber, W. HTSeq—a Python framework to work with high-throughput sequencing data. bioinformatics 2015, 31, 166–169. [Google Scholar] [CrossRef]
  22. Love, M.; Anders, S.; Huber, W. Differential analysis of count data–the DESeq2 package. Genome Biol 2014, 15, 10–1186. [Google Scholar]
  23. Ge, S.X.; Jung, D.; Yao, R. ShinyGO: a graphical gene-set enrichment tool for animals and plants. Bioinformatics 2020, 36, 2628–2629. [Google Scholar] [CrossRef]
  24. Livak, K.J.; Schmittgen, T.D. Analysis of relative gene expression data using real-time quantitative PCR and the 2− ΔΔCT method. methods 2001, 25, 402–408. [Google Scholar] [CrossRef]
  25. Bolger, A.; Giorgi, F. Trimmomatic: A flexible read trimming tool for Illumina NGS data. Bioinformatics 2014, 30, 2114–2120. [Google Scholar] [CrossRef] [PubMed]
  26. Ballout, F.R.; Gali-Muhtasib, H. Thymoquinone: A Potential Therapy against Cancer Stem Cells. Pharmacognosy Reviews 2020, 14. [Google Scholar] [CrossRef]
  27. Racoma, I.O.; Meisen, W.H.; Wang, Q.-E.; Kaur, B.; Wani, A.A. Thymoquinone inhibits autophagy and induces cathepsin-mediated, caspase-independent cell death in glioblastoma cells. PloS one 2013, 8, e72882. [Google Scholar] [CrossRef]
  28. Fatfat, Z.; Fatfat, M.; Gali-Muhtasib, H. Therapeutic potential of thymoquinone in combination therapy against cancer and cancer stem cells. World Journal of Clinical Oncology 2021, 12, 522. [Google Scholar] [CrossRef]
  29. Eid, E.E.; Alshehade, S.A.; Almaiman, A.A.; Kamran, S.; Lee, V.S.; Alshawsh, M.A. Enhancing the Anti-Leukemic Potential of Thymoquinone/Sulfobutylether-β-cyclodextrin (SBE-β-CD) Inclusion Complexes. Biomedicines 2023, 11, 1891. [Google Scholar] [CrossRef] [PubMed]
  30. Adilovic, A.; Mahmutović, L.; Huseinbegović, E.; Suljagic, M. Characterization of solvents and optimization of stability and solubility of bioactive compounds used in lymphoma cell culture treatments. Periodicals of Engineering and Natural Sciences 2020, 8, 2553–2563. [Google Scholar]
  31. Mokashi, A.A. Thymoquinone: the Evaluation of its Cytotoxic Potential, Effects on P53 Status and the Cell Cycle in Various Cancer Cell Lines. 2004.
  32. Lau, L.W.; Cua, R.; Keough, M.B.; Haylock-Jacobs, S.; Yong, V.W. Pathophysiology of the brain extracellular matrix: a new target for remyelination. Nature Reviews Neuroscience 2013, 14, 722–729. [Google Scholar] [CrossRef]
  33. Mohiuddin, E.; Wakimoto, H. Extracellular matrix in glioblastoma: Opportunities for emerging therapeutic approaches. American Journal of Cancer Research 2021, 11, 3742. [Google Scholar]
  34. Whatcott, C.J.; Han, H.; Posner, R.G.; Hostetter, G.; Von Hoff, D.D. Targeting the tumor microenvironment in cancer: why hyaluronidase deserves a second look. Cancer discovery 2011, 1, 291–296. [Google Scholar] [CrossRef]
  35. Hartmann, N.; Giese, N.A.; Giese, T.; Poschke, I.; Offringa, R.; Werner, J.; Ryschich, E. Prevailing role of contact guidance in intrastromal T-cell trapping in human pancreatic cancer. Clinical cancer research 2014, 20, 3422–3433. [Google Scholar] [CrossRef] [PubMed]
  36. Berridge, M.J.; Bootman, M.D.; Roderick, H.L. Calcium signalling: dynamics, homeostasis and remodelling. Nature reviews Molecular cell biology 2003, 4, 517–529. [Google Scholar] [CrossRef] [PubMed]
  37. Leclerc, C.; Haeich, J.; Aulestia, F.J.; Kilhoffer, M.-C.; Miller, A.L.; Neant, I.; Webb, S.E.; Schaeffer, E.; Junier, M.-P.; Chneiweiss, H. Calcium signaling orchestrates glioblastoma development: Facts and conjunctures. Biochimica et Biophysica Acta (BBA)-Molecular Cell Research 2016, 1863, 1447–1459. [Google Scholar] [CrossRef] [PubMed]
  38. Colomer, J.M.; Illario, M.; Means, A.R. The Roles of CaMKII in the Genesis of Cardiac Hypertrophy. High Blood Pressure & Cardiovascular Prevention 2007, 14, 11–19. [Google Scholar]
  39. Takemoto-Kimura, S.; Suzuki, K.; Horigane, S.i.; Kamijo, S.; Inoue, M.; Sakamoto, M.; Fujii, H.; Bito, H. Calmodulin kinases: essential regulators in health and disease. Journal of neurochemistry 2017, 141, 808–818. [Google Scholar] [CrossRef]
  40. Wang, H.; Zeng, Z.; Yi, R.; Luo, J.; Chen, J.; Lou, J. MicroRNA-3200-3p targeting CAMK2A modulates the proliferation and metastasis of glioma in vitro. Bioengineered 2022, 13, 7785–7797. [Google Scholar] [CrossRef]
  41. Yu, T.-J.; Liu, Y.-Y.; Li, X.-G.; Lian, B.; Lu, X.-X.; Jin, X.; Shao, Z.-M.; Hu, X.; Di, G.-H.; Jiang, Y.-Z. PDSS1-mediated activation of CAMK2A-STAT3 signaling promotes metastasis in triple-negative breast cancer. Cancer Research 2021, 81, 5491–5505. [Google Scholar] [CrossRef]
  42. Guan, L.; Yuan, S.; Ma, J.; Liu, H.; Huang, L.; Zhang, F. Neurokinin-1 receptor is highly expressed in cervical cancer and its antagonist induces cervical cancer cell apoptosis. European Journal of Histochemistry 2023, 67. [Google Scholar] [CrossRef]
  43. Zhang, C.; Yuan, X.-r.; Li, H.-y.; Zhao, Z.-j.; Liao, Y.-w.; Wang, X.-y.; Su, J.; Sang, S.-s.; Liu, Q. Anti-cancer effect of metabotropic glutamate receptor 1 inhibition in human glioma U87 cells: involvement of PI3K/Akt/mTOR pathway. Cellular Physiology and Biochemistry 2015, 35, 419–432. [Google Scholar] [CrossRef] [PubMed]
  44. Tong, L.; Yi, L.; Liu, P.; Abeysekera, I.R.; Hai, L.; Li, T.; Tao, Z.; Ma, H.; Xie, Y.; Huang, Y. Tumour cell dormancy as a contributor to the reduced survival of GBM patients who received standard therapy. Oncology Reports 2018, 40, 463–471. [Google Scholar] [CrossRef] [PubMed]
  45. Moncayo, G.; Grzmil, M.; Smirnova, T.; Zmarz, P.; Huber, R.M.; Hynx, D.; Kohler, H.; Wang, Y.; Hotz, H.-R.; Hynes, N.E. SYK inhibition blocks proliferation and migration of glioma cells and modifies the tumor microenvironment. Neuro-oncology 2018, 20, 621–631. [Google Scholar] [CrossRef]
  46. Pyfrom, S.C.; Quinn, C.C.; Dorando, H.K.; Luo, H.; Payton, J.E. BCALM (AC099524. 1) Is a Human B Lymphocyte–Specific Long Noncoding RNA That Modulates B Cell Receptor–Mediated Calcium Signaling. The Journal of Immunology 2020, 205, 595–607. [Google Scholar] [CrossRef] [PubMed]
  47. Schmutz, J.; Martin, J.; Terry, A.; Couronne, O.; Grimwood, J.; Gordon, L.A.; Scott, D.; Xie, G.; Huang, W.; Hellsten, U. The complete sequence of human chromosome 5. Nature 2004, 431. [Google Scholar] [CrossRef] [PubMed]
  48. Vanlandewijck, M.; Lebouvier, T.; Andaloussi Mäe, M.; Nahar, K.; Hornemann, S.; Kenkel, D.; Cunha, S.I.; Lennartsson, J.; Boss, A.; Heldin, C.-H. Functional characterization of germline mutations in PDGFB and PDGFRB in primary familial brain calcification. PloS one 2015, 10, e0143407. [Google Scholar] [CrossRef] [PubMed]
  49. Bazdar, D.A.; Kalinowska, M.; Panigrahi, S.; Sieg, S.F. Recycled il-7 can be delivered to neighboring t cells. The Journal of Immunology 2015, 194, 4698–4704. [Google Scholar] [CrossRef]
  50. Rochman, Y.; Kashyap, M.; Robinson, G.W.; Sakamoto, K.; Gomez-Rodriguez, J.; Wagner, K.-U.; Leonard, W.J. Thymic stromal lymphopoietin-mediated STAT5 phosphorylation via kinases JAK1 and JAK2 reveals a key difference from IL-7–induced signaling. Proceedings of the National Academy of Sciences 2010, 107, 19455–19460. [Google Scholar] [CrossRef]
  51. Gao, S.; Jin, L.; Liu, G.; Wang, P.; Sun, Z.; Cao, Y.; Shi, H.; Liu, X.; Shi, Q.; Zhou, X. Overexpression of RASD1 inhibits glioma cell migration/invasion and inactivates the AKT/mTOR signaling pathway. Scientific reports 2017, 7, 3202. [Google Scholar] [CrossRef]
  52. Majchrzak-Celińska, A.; Słocińska, M.; Barciszewska, A.-M.; Nowak, S.; Baer-Dubowska, W. Wnt pathway antagonists, SFRP1, SFRP2, SOX17, and PPP2R2B, are methylated in gliomas and SFRP1 methylation predicts shorter survival. Journal of Applied Genetics 2016, 57, 189–197. [Google Scholar] [CrossRef]
  53. Han, J.; Goldstein, L.A.; Hou, W.; Rabinowich, H. Functional linkage between NOXA and Bim in mitochondrial apoptotic events. Journal of Biological Chemistry 2007, 282, 16223–16231. [Google Scholar] [CrossRef]
  54. Yu, J.; Zhang, L.; Hwang, P.M.; Kinzler, K.W.; Vogelstein, B. PUMA induces the rapid apoptosis of colorectal cancer cells. Molecular cell 2001, 7, 673–682. [Google Scholar] [CrossRef]
  55. Zhang, H.; Guttikonda, S.; Roberts, L.; Uziel, T.; Semizarov, D.; Elmore, S.; Leverson, J.; Lam, L. Mcl-1 is critical for survival in a subgroup of non-small-cell lung cancer cell lines. Oncogene 2011, 30, 1963–1968. [Google Scholar] [CrossRef]
  56. Zhao, X.; Liu, X.; Su, L. Parthenolide induces apoptosis via TNFRSF10B and PMAIP1 pathways in human lung cancer cells. Journal of experimental & clinical cancer research 2014, 33, 1–11. [Google Scholar]
  57. Salvador, J.M.; Brown-Clay, J.D.; Fornace Jr, A.J. Gadd45 in stress signaling, cell cycle control, and apoptosis. Gadd45 stress sensor genes 2013, 1–19. [Google Scholar]
  58. E Tamura, R.; F de Vasconcellos, J.; Sarkar, D.; A Libermann, T.; B Fisher, P.; F Zerbini, L. GADD45 proteins: central players in tumorigenesis. Current molecular medicine 2012, 12, 634–651. [Google Scholar] [CrossRef]
  59. Jiang, T.; Soprano, D.R.; Soprano, K.J. GADD45A is a mediator of CD437 induced apoptosis in ovarian carcinoma cells. Journal of cellular physiology 2007, 212, 771–779. [Google Scholar] [CrossRef] [PubMed]
  60. Su, M.-Q.; Zhou, Y.-R.; Rao, X.; Yang, H.; Zhuang, X.H.; Ke, X.-J.; Peng, G.-Y.; Zhou, C.-L.; Shen, B.-Y.; Dou, J. Baicalein induces the apoptosis of HCT116 human colon cancer cells via the upregulation of DEPP/Gadd45a and activation of MAPKs. International journal of oncology 2018, 53, 750–760. [Google Scholar] [PubMed]
  61. Yin, F.; Bruemmer, D.; Blaschke, F.; Hsueh, W.A.; Law, R.E.; Van Herle, A.J. Signaling pathways involved in induction of GADD45 gene expression and apoptosis by troglitazone in human MCF-7 breast carcinoma cells. Oncogene 2004, 23, 4614–4623. [Google Scholar] [CrossRef]
  62. Ueda, K.; Arakawa, H.; Nakamura, Y. Dual-specificity phosphatase 5 (DUSP5) as a direct transcriptional target of tumor suppressor p53. Oncogene 2003, 22, 5586–5591. [Google Scholar] [CrossRef]
  63. Celik-Selvi, B.E.; Stütz, A.; Mayer, C.-E.; Salhi, J.; Siegwart, G.; Sutterlüty, H. Sprouty3 and sprouty4, two members of a family known to inhibit fgf-mediated signaling, exert opposing roles on proliferation and migration of glioblastoma-derived cells. Cells 2019, 8, 808. [Google Scholar] [CrossRef] [PubMed]
  64. Zhao, B.; Sun, J.; Du, K.; Liang, N. Sprouty 4 suppresses glioblastoma invasion by inhibiting ERK phosphorylation and ETS-1-induced matrix metalloproteinase-9. Journal of neurosurgical sciences 2020. [Google Scholar] [CrossRef] [PubMed]
  65. Foltz, G.; Ryu, G.-Y.; Yoon, J.-G.; Nelson, T.; Fahey, J.; Frakes, A.; Lee, H.; Field, L.; Zander, K.; Sibenaller, Z. Genome-wide analysis of epigenetic silencing identifies BEX1 and BEX2 as candidate tumor suppressor genes in malignant glioma. Cancer research 2006, 66, 6665–6674. [Google Scholar] [CrossRef]
  66. Nie, E.; Zhang, X.; Xie, S.; Shi, Q.; Hu, J.; Meng, Q.; Zhou, X.; Yu, R. β-Catenin is involved in Bex2 down-regulation induced glioma cell invasion/migration inhibition. Biochemical and biophysical research communications 2015, 456, 494–499. [Google Scholar] [CrossRef]
  67. Zhang, H.; Qi, Y.; Geng, D.; Shi, Y.; Wang, X.; Yu, R.; Zhou, X. Expression profile and clinical significance of Wnt signaling in human gliomas. Oncology letters 2018, 15, 610–617. [Google Scholar] [CrossRef]
  68. Gonçalves, C.S.; de Castro, J.V.; Pojo, M.; Martins, E.P.; Queirós, S.; Chautard, E.; Taipa, R.; Pires, M.M.; Pinto, A.A.; Pardal, F. WNT6 is a novel oncogenic prognostic biomarker in human glioblastoma. Theranostics 2018, 8, 4805. [Google Scholar] [CrossRef]
  69. Liu, X.; Shan, W.; Li, T.; Gao, X.; Kong, F.; You, H.; Kong, D.; Qiao, S.; Tang, R. Cellular retinol binding protein-1 inhibits cancer stemness via upregulating WIF1 to suppress Wnt/β-catenin pathway in hepatocellular carcinoma. BMC cancer 2021, 21, 1–17. [Google Scholar] [CrossRef] [PubMed]
  70. Hao, J.; Han, X.; Huang, H.; Yu, X.; Fang, J.; Zhao, J.; Prayson, R.A.; Bao, S.; Yu, J.S. Sema3C signaling is an alternative activator of the canonical WNT pathway in glioblastoma. nature communications 2023, 14, 2262. [Google Scholar] [CrossRef]
  71. Chen, P.-H.; Shen, W.-L.; Shih, C.-M.; Ho, K.-H.; Cheng, C.-H.; Lin, C.-W.; Lee, C.-C.; Liu, A.-J.; Chen, K.-C. The CHAC1-inhibited Notch3 pathway is involved in temozolomide-induced glioma cytotoxicity. Neuropharmacology 2017, 116, 300–314. [Google Scholar] [CrossRef]
  72. Wang, Q.; Li, Y.; Li, J.; Yao, Z.; Ma, X.; Ma, J.-w. Delta and Notch-like epidermal growth factor-related receptor suppresses human glioma growth by inhibiting oncogene TOR4A. Journal of Cancer Research and Therapeutics 2022, 18, 1372–1379. [Google Scholar] [PubMed]
  73. Sun, P.; Xia, S.; Lal, B.; Eberhart, C.G.; Quinones-Hinojosa, A.; Maciaczyk, J.; Matsui, W.; DiMeco, F.; Piccirillo, S.M.; Vescovi, A.L. DNER, an epigenetically modulated gene, regulates glioblastoma-derived neurosphere cell differentiation and tumor propagation. Stem cells 2009, 27, 1473–1486. [Google Scholar] [CrossRef] [PubMed]
  74. Bountali, A.; Tonge, D.P.; Mourtada-Maarabouni, M. RNA sequencing reveals a key role for the long non-coding RNA MIAT in regulating neuroblastoma and glioblastoma cell fate. International journal of biological macromolecules 2019, 130, 878–891. [Google Scholar] [CrossRef] [PubMed]
  75. Gao, L.; Wu, J.; Wang, H.; Yang, Y.; Zheng, Z.; Ni, B.; Wang, X.; Peng, Y.; Li, Y. LMO1 Plays an Oncogenic Role in Human Glioma Associated With NF-kB Pathway. Frontiers in oncology 2022, 12, 770299. [Google Scholar] [CrossRef] [PubMed]
  76. Guo, K.; Song, L.; Chang, J.; Cao, P.; Liu, Q. AEBP1 Promotes Glioblastoma Progression and Activates the Classical NF-κB Pathway. Behavioural Neurology 2020, 2020. [Google Scholar] [CrossRef] [PubMed]
  77. Mei, J.-c.; Yang, M.; Zhu, L.; Zhou, Q.; Li, X.; Chen, Z.; Zou, C. On this page. Behavioural Neurology 2020, 2, 3. [Google Scholar]
  78. Verreault, M.; Segoviano Vilchis, I.; Rosenberg, S.; Lemaire, N.; Schmitt, C.; Guehennec, J.; Royer-Perron, L.; Thomas, J.l.; Lam, T.T.; Dingli, F. Identification of growth hormone receptor as a relevant target for precision medicine in low-EGFR expressing glioblastoma. Clinical and Translational Medicine 2022, 12, e939. [Google Scholar] [CrossRef]
  79. Echizen, K.; Nakada, M.; Hayashi, T.; Sabit, H.; Furuta, T.; Nakai, M.; Koyama-Nasu, R.; Nishimura, Y.; Taniue, K.; Morishita, Y. PCDH10 is required for the tumorigenicity of glioblastoma cells. Biochemical and biophysical research communications 2014, 444, 13–18. [Google Scholar] [CrossRef] [PubMed]
  80. Fukai, J.; Yokote, H.; Yamanaka, R.; Arao, T.; Nishio, K.; Itakura, T. EphA4 promotes cell proliferation and migration through a novel EphA4-FGFR1 signaling pathway in the human glioma U251 cell line. Molecular cancer therapeutics 2008, 7, 2768–2778. [Google Scholar] [CrossRef]
  81. Gao, Y.F.; Zhu, T.; Chen, J.; Liu, L.; Ouyang, R. Knockdown of collagen α-1 (III) inhibits glioma cell proliferation and migration and is regulated by miR128-3p. Oncology letters 2018, 16, 1917–1923. [Google Scholar] [CrossRef]
  82. Held-Feindt, J.; Paredes, E.B.; Blömer, U.; Seidenbecher, C.; Stark, A.M.; Mehdorn, H.M.; Mentlein, R. Matrix-degrading proteases ADAMTS4 and ADAMTS5 (disintegrins and metalloproteinases with thrombospondin motifs 4 and 5) are expressed in human glioblastomas. International journal of cancer 2006, 118, 55–61. [Google Scholar] [CrossRef] [PubMed]
  83. Xu, Y.; Wen-Liang, L.; Li, F.; Feng, G.; Yong-Jie, M. Slit2/Robo1 signaling in glioma migration and invasion. Neuroscience bulletin 2010, 26, 474. [Google Scholar] [CrossRef] [PubMed]
  84. Zhang, P.; Ohkawa, Y.; Yamamoto, S.; Momota, H.; Kato, A.; Kaneko, K.; Natsume, A.; Farhana, Y.; Ohmi, Y.; Okajima, T. St8sia1-deficiency in mice alters tumor environments of gliomas, leading to reduced disease severity. Nagoya Journal of Medical Science 2021, 83, 535. [Google Scholar] [PubMed]
  85. Plata-Bello, J.; Fariña-Jerónimo, H.; Betancor, I.; Salido, E. High expression of FOXP2 is associated with worse prognosis in glioblastoma. World Neurosurgery 2021, 150, e253–e278. [Google Scholar] [CrossRef] [PubMed]
  86. Sun, J.-Z.; Zhang, J.-H.; Li, J.-B.; Yuan, F.; Tong, L.-Q.; Wang, X.-Y.; Chen, L.-L.; Fan, X.-G.; Zhang, Y.-M.; Ren, X. MXRA5 is a novel immune-related biomarker that predicts poor prognosis in glioma. Disease Markers 2021, 2021, 1–13. [Google Scholar] [CrossRef] [PubMed]
  87. Wang, Y.; Zang, J.; Zhang, D.; Sun, Z.; Qiu, B.; Wang, X. KDM2B overexpression correlates with poor prognosis and regulates glioma cell growth. OncoTargets and therapy 2018, 201–209. [Google Scholar] [CrossRef] [PubMed]
  88. Yang, J.a.; Yang, Q. Identification of core genes and screening of potential targets in glioblastoma multiforme by integrated bioinformatic analysis. Frontiers in Oncology 2021, 10, 615976. [Google Scholar] [CrossRef] [PubMed]
  89. Yuan, Y.; Qi, P.; Xiang, W.; Yanhui, L.; Yu, L.; Qing, M. Multi-omics analysis reveals novel subtypes and driver genes in glioblastoma. Frontiers in Genetics 2020, 11, 565341. [Google Scholar] [CrossRef] [PubMed]
  90. Zi, J.; Wang, W.; Sun, M.; Mei, W.; Li, S.; Li, B.; Xiao, Y.; Fei, Z.; Zhang, R.; Yu, M. A high expression of MTERF3 correlates with tumor progression and predicts poor outcomes in patients with brain glioma. International Journal of Clinical and Experimental Pathology 2019, 12, 1909. [Google Scholar]
  91. Zhang, H.; Ma, H.; Zhang, W.; Duan, D.; Zhu, G.; Cao, W.; Liu, B. Increased expression of Sema3C indicates a poor prognosis and is regulated by miR-142-5p in glioma. Biological and Pharmaceutical Bulletin 2020, 43, 639–648. [Google Scholar] [CrossRef]
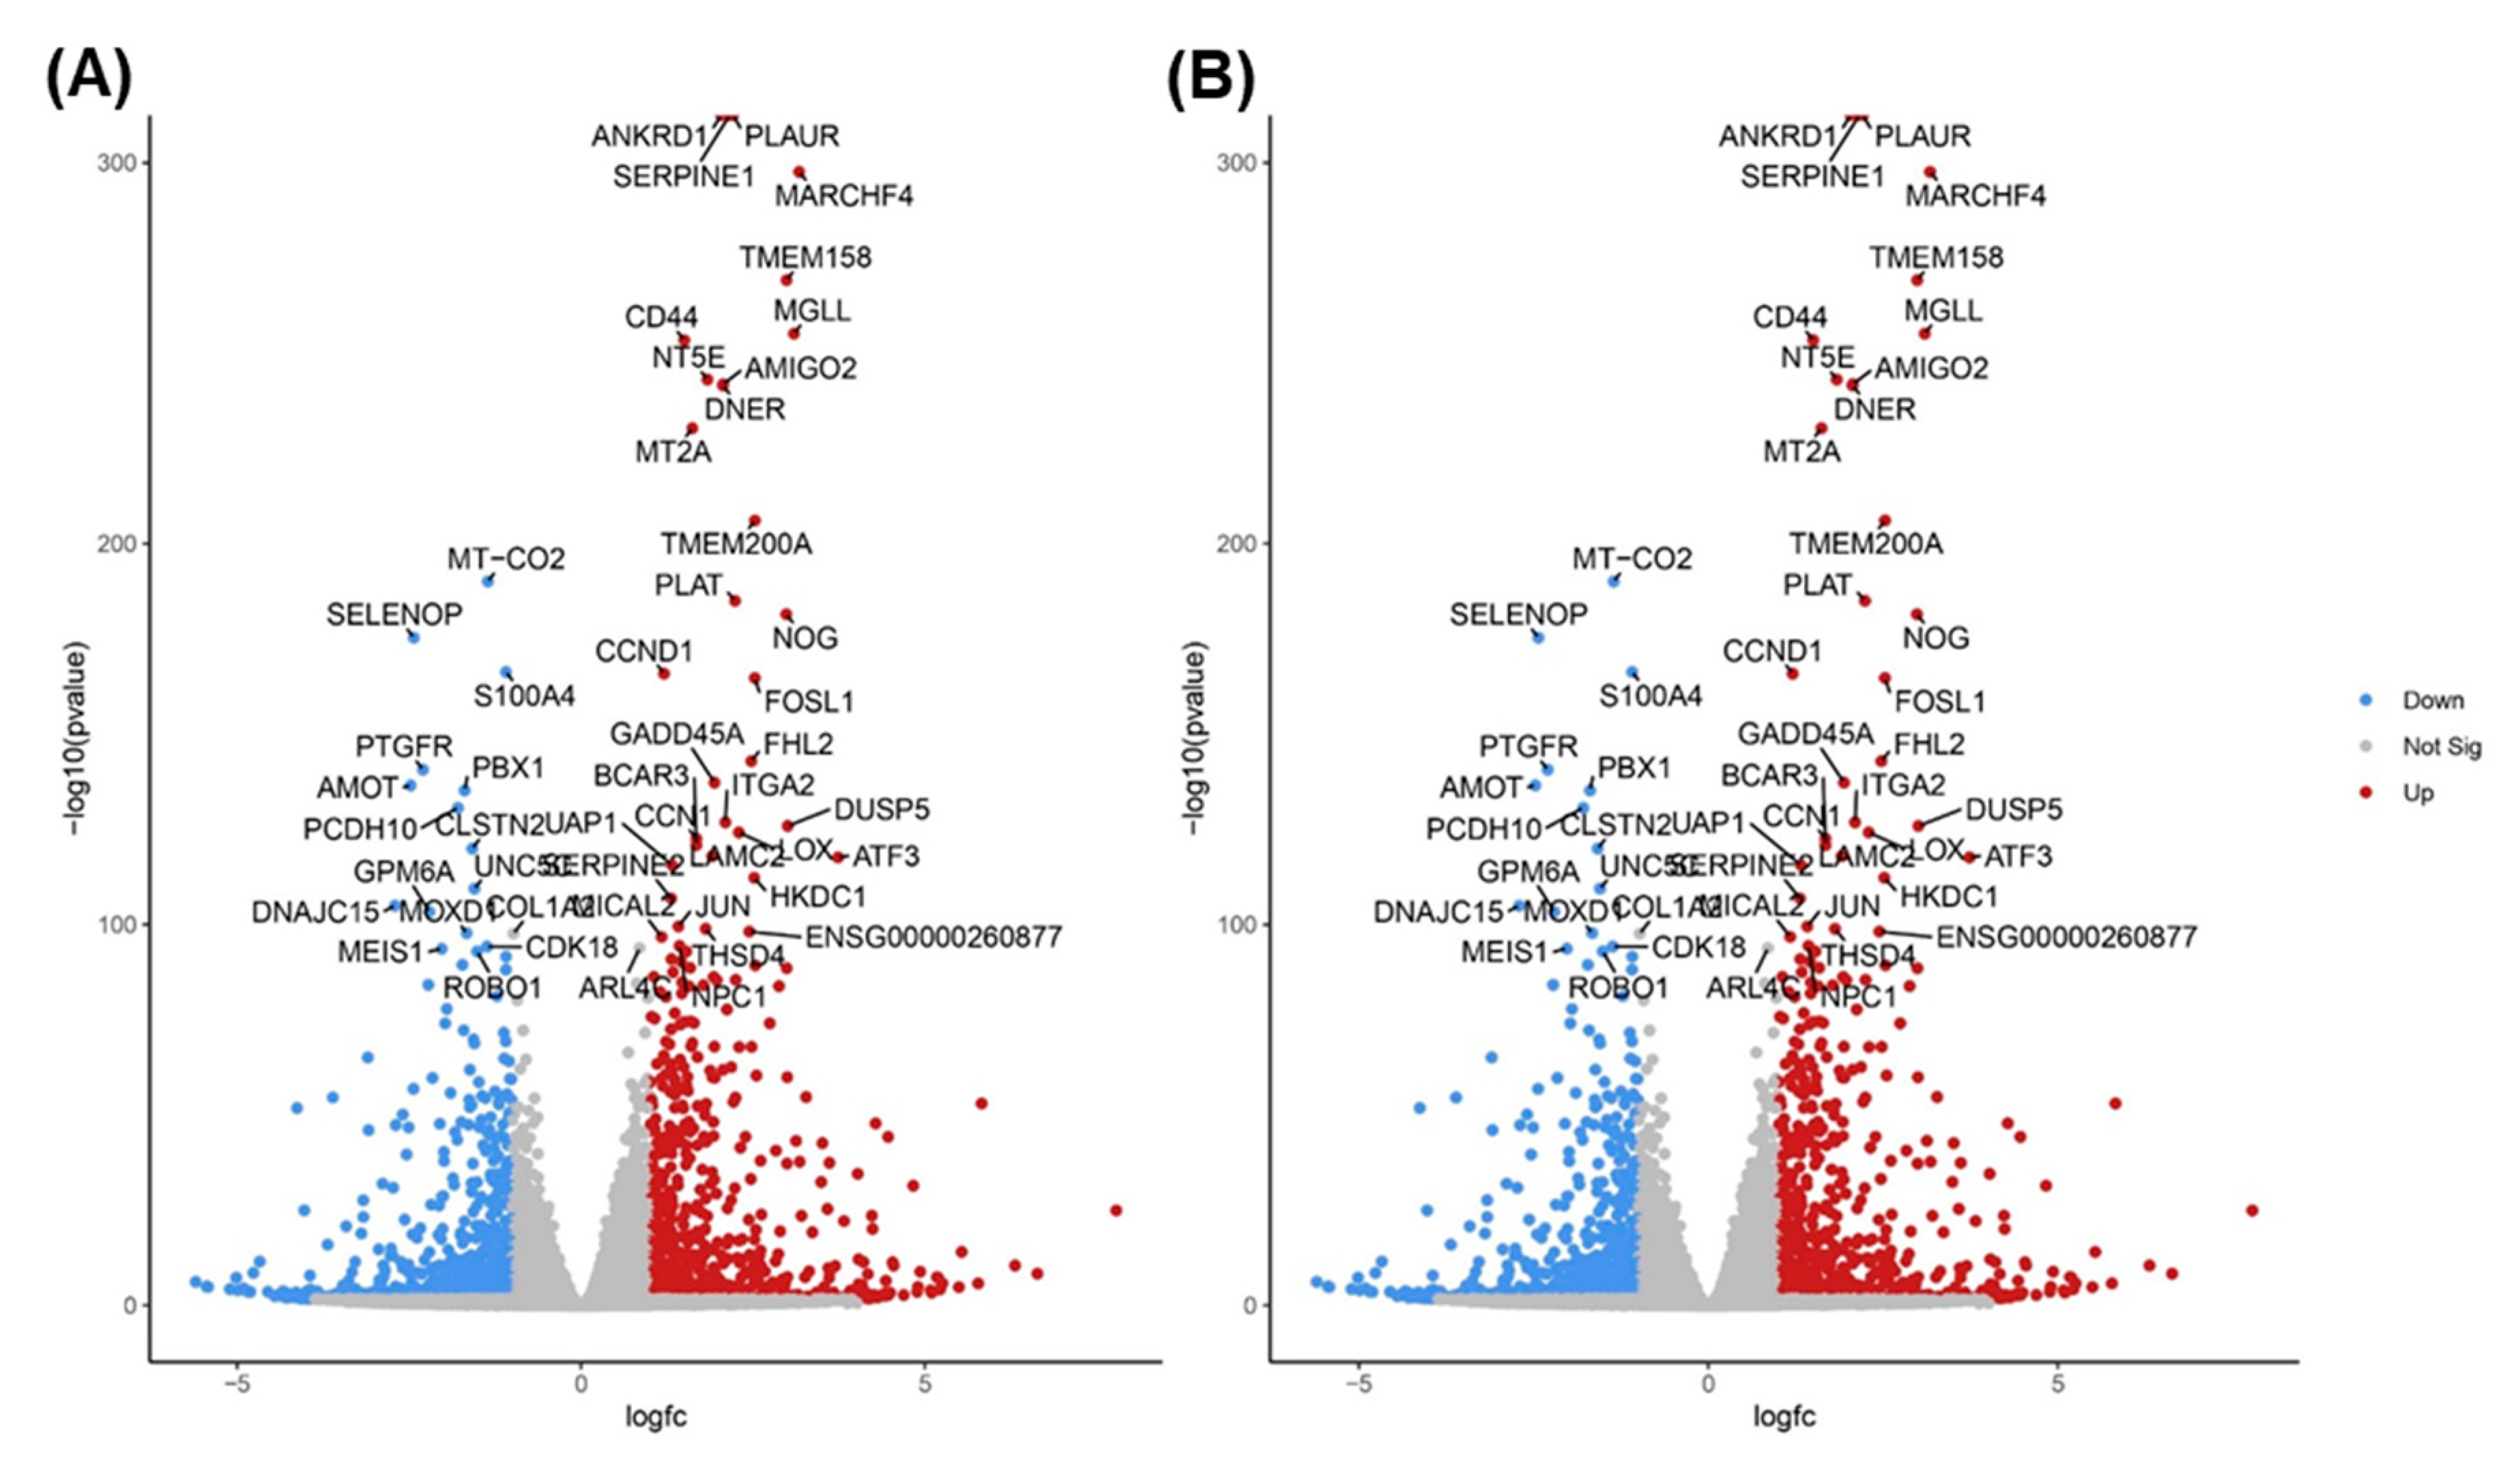
Figure 2. Volcano Plot showing the distribution of all the DEGs identified in 25 µM TQ treatment for 48 hours in A172 cells (A) and 50 µM TQ treatment for 48 hours in A172 cells (B). Top 50 DEGs are labeled. Each dot represents a single gene.
Preprints 97337 g002
Figure 3. Venn-diagram depicting the common and unique significantly up-regulated (A) and down-regulated (B) genes between Control vs 25 µM and Control vs 50 µM treatment.
Preprints 97337 g003
Figure 4. Heat map of significant DEGs in 25 µM and 50 µM TQ treatment showing the corresponding gene expressions. Blue color represent significantly downregulated genes and red color represent significantly upregulated genes.
Preprints 97337 g004
Figure 5. KEGG pathway enrichment bar plot for the common up-regulated (A) and down-regulated (B) genes in 25 and 50 µM TQ treatment for 48 hours on A172 glioblastoma cells. All common DEGs from the treatment were used for pathway analysis.
Preprints 97337 g005
Figure 6. GO enrichment for common DEGs in 25 and 50 µM TQ treatment for 48 hours on A172 glioblastoma cells. GO categories contain three domains: biological process (A), cellular Component (B), and molecular function (C). All common DEG from treatment were used for ontology enrichment.
Preprints 97337 g006
Figure 7. Validation of RNA-seq results by qRT-PCR in 25µM (A) and 50µM (B) TQ treatment condition. mRNA expressions of WNT7B, CHAC1, DUSP5, and CD300A were analyzed using qRT-PCR. The same RNA used for RNA-seq was used for qRT-PCR. RNA was extracted from A172 cells treated with control, 25 µM, and 50 µM TQ for 48 hours. The data are presented as the mean ±Standard Error of mean. (n=3 for each treatment).
Preprints 97337 g007
Table 1. Summary of data quality, filtration, and mapping of A172 glioblastoma cells treated with control, 2.5 µM, and 5 µM TQ for 24 hours.
Sample Name No. of Raw reads Sequence length (bp) No. of Filtered reads GC % No. of Uniquely mapped reads Mapping percentage (uniquely mapped)
Control_1 26712260 75 23196526 49 22218462 95.8
Control_2 31107086 75 26775248 49 25529068 95.3
Control_3 24403444 75 20604284 48 19649734 95.4
Control_4 29783142 75 25852334 49 24565046 95.0
2.5µM_1 31071382 75 27008588 49 25752932 95.4
2.5µM_2 30202594 75 25898660 48 24596670 95.0
2.5µM_3 30964912 75 26766406 49 25440878 95.0
2.5µM_4 32187674 75 27893292 48 26696168 95.7
5µM_1 31265636 75 27148108 48 25957546 95.6
5µM_2 29513348 75 25496706 49 24252558 95.1
5µM_3 23419378 75 18875660 48 18043398 95.6
5µM_4 32224110 75 28173704 49 26907134 95.5
Total 352854966 303689516 289609594
Table 2. Summary of Data Quality, filtration, and mapping of A172 glioblastoma cells under 25 µM and 50 µM treatment for 48 hours.
Sample Name No. of Raw reads Sequence length (bp) No. of Filtered reads GC % No. of Uniquely mapped reads Mapping percentage (uniquely mapped)
Control_1 25130818 150 24290286 49 23565022 97.0
Control_2 25777505 150 24913016 49 24114402 96.8
Control_3 33410551 150 32234977 50 31147688 96.6
Control_4 32672018 150 31528490 51 30598289 97.0
25_1 26172491 150 25239490 51 24503413 97.1
25_2 22745394 150 21912988 51 21237324 96.9
25_3 27897817 150 26923593 51 26150682 97.1
25_4 27645344 150 26669748 51 25939455 97.3
50_1 34224141 150 32984120 51 31931537 96.8
50_2 26024221 150 25093850 51 24287158 96.8
50_3 25164754 150 24237707 51 23445769 96.7
50_4 26134658 150 25166726 49 24347204 96.7
Total 332999712 321194991
Table 3. The KEGG pathway enrichment table for the common downregulated genes in 25 and 50 µM TQ treatment for 48 hours on A172 cells.
Pathways Fold Enrichment No. of Genes Pathway Genes Genes
Beta-Alanine metabolism 7.802 4 31 ALDH3B1 UPB1 CSAD CARNS1
Mineral absorption 6.047 6 60 ATP1A2 ATP2B3 CYBRD1 ATP7B ATP1B2 SLC34A3
ECM-receptor interaction 5.497 8 88 COL9A3 ITGB6 COL1A2 THBS3 COL4A5 LAMA2 COL6A6 ITGA1
Arrhythmogenic right ventricular cardiomyopathy 5.497 7 77 PKP2 ITGB6 CACNA1D SGCD LAMA2 DMD ITGA1
Hypertrophic cardiomyopathy 5.375 8 90 TGFB2 TNNC1 ITGB6 CACNA1D SGCD LAMA2 DMD ITGA1
Protein digestion and absorption 5.284 9 103 ATP1A2 COL11A1 COL9A3 ATP1B2 COL5A1 COL1A2 COL4A5 MME COL6A6
Dilated cardiomyopathy 5.039 8 96 TGFB2 TNNC1 ITGB6 CACNA1D SGCD LAMA2 DMD ITGA1
Cardiac muscle contraction 4.865 7 87 ATP1A2 TNNC1 ATP1B2 CACNA1D COX6B2 MT-CYB MT-CO1
Focal adhesion 4.233 14 200 MYLK COL9A3 PDGFB MYL10 PDGFRB ITGB6 COL1A2 ILK THBS3 PDGFD COL4A5 LAMA2 COL6A6 ITGA1
Hippo signaling pathway 3.466 9 157 TGFB2 WNT5A GDF5 WNT2B GDF7 GDF6 PPP2R2B TGFBR2 FZD4
PI3K-Akt signaling pathway 3.075 18 354 LPAR2 FGF10 COL9A3 PDGFB IL2RB IL7 PDGFRB ITGB6 PPP2R2B COL1A2 THBS3 PDGFD GNG7 ERBB4 COL4A5 LAMA2 COL6A6 ITGA1
Calcium signaling pathway 3.023 12 240 MYLK ATP2B3 FGF10 PDGFB HTR2A P2RX1 PDGFRB HRH2 TNNC1 CACNA1D PDGFD ERBB4
Human papillomavirus infection 2.740 15 331 COL9A3 PDGFRB WNT5A ITGB6 WNT2B PPP2R2B COL1A2 THBS3 STAT2 FZD4 MAML2 COL4A5 LAMA2 COL6A6 ITGA1
Table 4. The KEGG pathway enrichment table for the common upregulated genes in 25 and 50 µM TQ treatment for 48 hours on A172 cells.
Pathway Fold Enrichment No. Genes Pathway Genes Genes
Mucin type O-glycan biosynthesis 7.538 5 36 ST3GAL1 GALNT12 GALNT6 GCNT3 GCNT1
AGE-RAGE signaling pathway in diabetic complications 6.513 12 100 EDN1 SERPINE1 F3 CCND1 VEGFA IL1A EGR1 MAPK13 NOS3 PRKCE JUN THBD
Glycerolipid metabolism 5.428 6 60 DGKG MGLL LIPGGPAT3 PLPP4 PNLIPRP3
P53 signaling pathway 5.205 7 73 CD82 BBC3 CCND1 SFN SERPINE1 PMAIP1 GADD45A
Fluid shear stress and atherosclerosis 5.113 13 138 EDN1 HMOX1 PLAT VEGFA IL1A SDC1 ARHGEF2 KLF2 MAPK13 NOS3 FOS JUN THBD
ECM-receptor interaction 4.934 8 88 CD44 LAMC2 ITGA6 SDC1 TNN COL6A3 ITGA2 LAMB3
HIF-1 signaling pathway 4.482 9 109 EDN1 HMOX1 ANGPT4 SERPINE1 VEGFA HKDC1 HK1 NOS3 EIF4EBP1
Colorectal cancer 4.418 7 86 BBC3 CCND1 GADD45A PMAIP1 TGFA FOS JUN
Hematopoietic cell lineage 4.386 8 99 CD44 KITLG IL4R ITGA6 IL11 IL1A ITGA2 CD55
Small cell lung cancer 4.130 7 92 TRAF1 LAMC2 ITGA6 CCND1 GADD45A ITGA2 LAMB3
TNF signaling pathway 3.877 8 112 TRAF1 EDN1 ATF4 JUN LIFMAPK13 CXCL3 FOS
Apelin signaling pathway 3.540 9 138 PLAT SERPINE1 PRKCE CCND1 NOS3 GNGT2 EGR1 SPHK1 KLF2
Wnt signaling pathway 3.270 10 166 NFATC2 SFRP1 DVL1 CCND1 WNT5B LGR6 TLE3 FOSL1 JUN WNT7B
MAPK signaling pathway 3.138 17 294 KITLG ANGPT4 VEGFA DUSP4 GADD45A PGF IL1A ATF4 JUN DUSP5 FGF5 DUSP6 EPHA2 RASGRP3 MAPK13 TGFA FOS
Table 5. The fold change of some important genes over different treatment conditions in RNA-seq and qRT-PCR.
Genes RNA-Seq qRT-PCR
25 µM 50 µM 25 µM 50 µM
Fold Change P-adj Fold Change P-adj Fold Change P-adj Fold Change P-adj
WNT7B 2.123 4.72E-76 2.2909 5.01E-48 4.7148 0.0003 4.2974 0.0005
CHAC1 2.897 9.1E-19 2.9376 9.89E-31 6.4202 0.0264 4.7567 0.0637
DUSP5 3.006 9.31E-124 2.3411 1.55E-47 7.4982 0.000006 4.5518 0.00022
CD300A 5.776 1,11E-05 7.0351 4.28E-09 1.4704 0.000281 1.4261 0.00049
Disclaimer/Publisher’s Note: The statements, opinions and data contained in all publications are solely those of the individual author(s) and contributor(s) and not of MDPI and/or the editor(s). MDPI and/or the editor(s) disclaim responsibility for any injury to people or property resulting from any ideas, methods, instructions or products referred to in the content.
Copyright: This open access article is published under a Creative Commons CC BY 4.0 license, which permit the free download, distribution, and reuse, provided that the author and preprint are cited in any reuse.
Prerpints.org logo

Preprints.org is a free preprint server supported by MDPI in Basel, Switzerland.

Subscribe

© 2024 MDPI (Basel, Switzerland) unless otherwise stated