Preprint
Article

Performance of An Energy Production System Consisting of Solar Collector, Biogas Dry Reforming Reactor and Solid Oxide Fuel Cell

Altmetrics

Downloads

103

Views

25

Comments

0

A peer-reviewed article of this preprint also exists.

This version is not peer-reviewed

Submitted:

25 January 2024

Posted:

29 January 2024

You are already at the latest version

Alerts
Abstract
This paper aims to study the performance of solar collectors with various sizes under different weather conditions of different Japanese cities, i.e. Kofu city, Nagoya city and Yamagata city. The heat generated from the solar collector was used to conduct a biogas dry reforming reactor in order to produce H2 to feed a solid oxide fuel cell (SOFC). This study has revealed that the output temperature of solar collector, Tfb in April and July was higher than that in January and October irrespective of city. The optimum length of absorber (dx) of the collector was 4 m irrespective of city. It was clarified that Tfb in Yamagata city in January and October, i.e. winter and autumn is lower than that in Kofu city and Nagoya city especially, which is influenced by the tendency of a solar intensity (I) strongly, not velocity of surrounding air (ua). On the other hand, Tfb is almost the same in April and July, i.e. spring and summer, irrespective of city. The amount of produced H2 from the biogas dry reforming reactor and the power generated by SOFC using H2 in spring and summer were higher compared to the other seasons irrespective of city. This study has revealed that the highest available households number per month was 4.7 according to the investigation in this study.
Keywords: 
Subject: Engineering  -   Energy and Fuel Technology

1. Introduction

Global warming is an important issue for the world. One of promising approaches is a renewable energy. According to Energy White Paper [1], the ratio of installment capacity of renewable energy excluding hydropower generation to the whole energy is 20.7 % in the world in 2020. In addition, the ratio of power energy of renewable energy excluding hydropower generation to the whole energy is 12.2 % in the world in 2022. World Energy Outlook 2022 forecasts that the ratio of power energy of renewable energy to the whole energy will increase up to 49 % in 2030 [2]. Therefore, it is necessary to promote the renewable energy utilization more.
To reduce CO2 which is a main chemical to cause the global warming, H2 is paid attention in the world. This study focuses on the H2 production from biogas dry reforming reaction process. Biogas consisting of CH4 (55 - 75 vol%) and CO2 (25 – 45 vol%) [3] is produced from fermentation by the action of anaerobic micro-organisms on raw materials such as garbage, livestock and sewage sludge. According to the International Energy Agency (IEA) [4], 1.46 EJ equivalent biogas has been produced in 2020. The amount of energy of produced biogas in 2020 is approximately five times as large as that in 2000. It can be expected that the produced biogas will increase more. Therefore, the biogas is a promising energy source. Though the biogas is used as a fuel for gas engine or micro gas turbine generally [5], the efficiency of power generation decreases compared to using a natural gas. Since a biogas contains CO2 of approximately 40 vol%, the heating value of biogas is smaller compared to that of natural gas. In this study, biogas is proposed to be used as feedstock to produce H2 through thermally powered biogas dry reforming process. The H2 can be used as a fuel for solid oxide fuel cell (SOFC) [6]. SOFC can also use CO which is a by-product from biogas dry reforming as a fuel, resulting that the effective energy production system can be realized.
This study proposes the system combining the above mentioned energy production system with a solar collector to supply the heat required since the biogas dry reforming is an endothermic reaction. Some studies previously reported the combined system to produce H2 using the solar collector in order to provide the heat for the chemical reaction. The parabolic trough solar collector (PTC) has been investigated for this purpose for CH3OH steam reforming [7,8,9,10,11]. Numerical analysis using the commercial software COMSOL and Fluent has been conducted to evaluate the H2 production performance, the temperature distribution and the thermal efficiency of the combination system [7,8,10,11]. The other numerical thermodynamic analysis has been investigated on the solar CH4 steam reforming with H2 permeation membrane reactors [12]. In this study [12], the PTC was adopted to provide the heat for CH4 steam reforming. The distribution of partial pressure of each gas, conversion rate of CH4 and H2O and thermodynamic efficiency were calculated changing the reaction temperature from 573 K to 873 K, resulting that the amount of produced H2 and the thermodynamic efficiency are the largest at 873 K. The thermodynamic efficiency up to 70 % could be obtained. Regarding the combination system to produce H2 using the solar collector in order to provide the heat for CH4 dry reforming including biogas dry reforming, several studies have been reported [13,14,15]. Zhao et al. [13] has reported the analysis results of the thermodynamic performance, indicating that the conversion rate of CH4 as well as the CO2 emission reduction increase with the reaction temperature. According to the combination of thermodynamic analysis and regression analysis for steam and dry CH4 reforming [14], the CH4 conversion increased with the reaction temperature exponentially from 470 K to 870 K. On the other hand, according to the experimental study on the combination system to produce H2 using the solar collector in order to provide the heat for CH4 dry reforming including biogas dry reforming, the volume percentage of produced H2 increased with the reaction temperature from 623 K to 1273 K. The volume percentage of H2 attained 45 % at 1273 K. It was reported that the lower heating value of produced syngas could exceed that of input biogas over 673 K.
However, there is no study to investigate the impact of size of solar collector on the temperature of biogas which flows through the solar collector and the performance to produce H2 from biogas dry reforming reactor and the power generated by SOFC excluding the authors’ previous study [6]. In addition, the feasibility study using the weather data to investigate the performance of solar collector as well as producing H2 from biogas dry reforming reactor and the power generated by SOFC was not reported excluding the authors’ previous study [6]. However, the authors’ previous study has not investigated the impact of weather data for the different cities in Japan on the performance of solar collector as well as producing H2 from biogas dry reforming reactor and the power generated by SOFC. Since the feasibility study to install the combination system consisting of solar collector, biogas dry reforming reactor and SOFC for the existing city is important, this study focuses on it.
The purpose of this study is to understand the impact of the weather data in various Japanese cities on the performances of solar collector with different sizes, thus the performances of combined system. The cities studied were Kofu city, Nagoya city and Yamagata city. According to the annual ranking on the duration of sunshine for the prefectural capital cities in Japan in 2021 [16], the ranking of Kofu city, Nagoya city and Yamagata city was 1, 24 and 47, respectively. Therefore, this study was thought to cover the most areas in Japan. This study refers the developed heat transfer model investigating PTC [17]. PTC is the most appropriate collector to provide the solar thermal energy at an intermediate temperature range among the several types of concentrating solar collector [18]. The temperature of heat transfer fluid out of the PTC could range approximately 700 K - 873 K [19,20]. The temperature of heat transfer fluid was calculated by the developed heat transfer model [17] with the weather data of Kofu city, Nagoya city and Yamagata city in Japan in 2021 [21]. This study adopted the specific characteristics of a biogas dry reforming reactor developed by authors to estimate the amount of produced H2 [22,23] and the power generated by SOFC with H2 obtained from biogas dry reforming reactor.

2. Heat Transfer Model for Solar Collector Proposed

2.1. Govering Equation

Figure 1 illustrates the schematic drawing for heat transfer model of the PTC proposed in this study. In this model, a solar radiation is mainly absorbed on the outer surface of the absorber tube [17]. Some absorbed heat transports to the heat transfer fluid by conduction through the tube wall and convection from the inner surface of the tube to the fluid (Qh). Other heat transfers as a loss by radiation to the inner surface of the glass tube through the vacuum space (Qr) and then by conduction from the inner surface of the glass tube to the outer surface of the glass tube (Qc). The heat transferred to ambient from the outlet surface of the glass tube by two mechanisms as follows: (i) the convection to the surrounding air (Qa), (ii) the radiation to the surrounding surfaces (Qs), e.g. building and sky.
Figure 2 shows the thermal resistance diagram for the heat transfer process in this model. In this model, R1 indicates the thermal resistance by convection from the heat transfer fluid to the absorber [K/W]. R2 indicates the thermal resistance by conduction through the absorber [K/W]. R3 indicates the thermal resistance by radiation through vacuum [K/W]. R4 indicates the thermal resistance by conduction through the glass tube [K/W]. R5 indicates the thermal resistance by convection to the ambient air [K/W]. R6 indicates the thermal resistance by radiation to the surrounding surfaces (buildings and sky).
This study assumes that the surrounding surface temperature is equal to the ambient air temperature. The model equation for a single glass tube can be expressed as follows [17].
I α τ D π d x = T t o T f b R 1 + T t o T s ( R 5 1 + R 6 1 ) 1
m c d T f b d x = m c T f b , o u t T f b , i n d x = T t o T f b R 1
T t o T g i R 3 = T t o T s R 3 + ( R 5 1 + R 6 1 ) 1
where I is the solar intensity [W/m2], α is the absorptivity of absorber tube [-], τ is the transmissivity of glass tube [-], D is the diameter of absorber [m], dx is the length of absorber [m], m is the mass flow rate of heat transfer fluid which is assumed to be a biogas [kg/s], c is the specific heat of heat transfer fluid [J/(kg・K)], Tfb is the temperature of heat transfer fluid [K], Tfb, out is the temperature of heat transfer fluid at outlet [K] and Tfb, in is the temperature of heat transfer fluid at inlet [K]. Each thermal resistance is defined as following:
R 1 = 1 2 π r t i h
R 2 = 1 2 π k t ln r t o r t i
R 3 = 1 2 π σ r t o [ 1 ε t + 1 ε g ε g ( r t o r g i ) ] [ ( T t o 2 + T g i 2 ) ( T t o + T g i ) ] 1
R 4 = 1 2 π k g ln r g o r g i
R 5 = 1 2 π r g o h o
R 6 = 1 ε g σ 2 π r g o ( T g o + T s ) ( T g o 2 + T s 2 )
where rti is the inner radius of absorber [m], rto is the outer radius of absorber [m], rgi is the inner radius of glass tube [m], rgo is the outer radius of glass tube [m], σ is Stefan-Boltzmann constant [W/(m2・K4)], h is the heat transfer coefficient between the heat transfer fluid and the inner surface of absorber [W/(m2・K)], ho is the heat transfer coefficient from the outer surface of glass tube to atmosphere [W/(m2・K)], kt is the thermal conductivity of absorber [W/(m・K)], kg is the thermal conductivity of glass tube [W/(m・K)], εt is the emissivity of absorber [-], εg is the emissivity of glass tube [-], Tto is the temperature of outer surface of absorber [K], Tgi is the temperature of inner surface of glass tube [K], Tgo is the temperature of outer surface of glass tube [K], Ts is the temperature of surrounding surface [K] and Ta is the temperature of surrounding air [K].

2.2. Estimation of Heat Transfer Coefficient

The convective heat transfer coefficient for the turbulent flow in a tube was estimated by Dittus-Boelter correlations [24] in this study as follows:
N u = 0.023 Re 0.8 Pr 1 3
N u = h D k a
Re = ρ a u a D μ a
Pr = C p , a μ a k a
h o = 0.0191 + 0.006608 u a
where Cp, a is the specific heat of surrounding air [J/(kg・K)], μa is the viscosity [Pa・s], ka is the thermal conductivity of surrounding air [W/(m・K)], ua is the velocity of surrounding air [m/s] and ρa is the density of surrounding air [m/s].1.3. Calculation procedure
According to Equations (1) and (2), the following equation can be drawn:
T f b , o u t = d x m c { I α τ D π d x ( T t o T s ) ( R 5 + R 6 ) R 3 ( R 5 + R 6 ) + R 5 R 6 } + T f b , i n
Moreover, R3 is decided from Equation (3) as follows:
R 3 = ( T t o T g i ) R 5 R 6 ( R 5 + R 6 ) ( T s + T g i )
According to Equations (6) and (16), Tto can be obtained as follows:
T t o = [ ( R 5 + R 6 ) ( T s + T g ) 2 π σ t t o R 5 R 6 × { r g i + r t o ( 1 ε g ) } ε t r g i + T g i 4 ] 1 4
Tfb is calculated by averaging Tfb, in and Tfb, out as follows:
T f b = T f b , i n + T f b , o u t 2
In this study, Tfb is calculated changing dx according to the above equations. This study set D = 1.5 m according to the optimization by the authors’ previous study [6]. The weather data, i.e. I, ua and Ta in Kofu city, Nagoya city and Yamagata city are inputted [21]. The heat transfer fluid is assumed as the mixture of CH4 and CO2. The molar ratio of CH4 : CO2 is 1.5 : 1, which simulates the biogas. The following assumptions are considered in this study:
(i)
The mass flow rate of the heat transfer fluid (m) is 0.05 kg/s.
(ii)
The distance between absorber and glass tube is 1/10 D.
(iii)
Tfb, in is 283 K.
(iv)
Ts equals to Ta.
(v)
The thickness of absorber and glass tube is 0.005 m and 0.010 m, respectively.
(vi)
R2 and R4 are ignored since they are very small compared to the other thermal resistances [17].
(vii)
Tti equals to Tto.
(viii)
Tgi equals to Tgo, which is 373 K.
Table 1 lists the values of physical properties adopted in this study.

3. Proposed Combined Energy System

Figure 3 illustrates the proposed system consisting of solar collector, biogas dry reforming reactor and SOFC proposed [6]. In the proposed system, the heat transfer fluid consisting of CH4 and CO2 flows into solar collector. After heated by solar collector, the heat transfer fluid flows into biogas dry reforming reactor. H2 is produced in the reactor through biogas dry reforming process. The produced H2 is supplied into SOFC as a fuel, resulting that the electricity is generated. The by-product of the process, CO was not considered in this study.
To calculate the amount of H2 produced from the biogas dry reforming reactor, this study follows the reaction scheme of biogas dry reforming as follows:
CH4 + CO2 → 2H2 + 2CO
In this study, the molar flow rate of CO2 and CH4 is 1.67×10⁻² mol/s and 2.51×10⁻² mol/s, respectively. This molar ratio represents CH4 : CO2 of 1.5 : 1 when m is 0.05 kg/s. According to Equation (19) and these molar flow rates, the molar flow rate of produced H2 can be calculated to be 3.34×10⁻² mol/s. From the authors’ previous experimental studies changing the reaction temperature, which corresponds to Tfb in this study, from 673 K to 873 K [22,23], the performance of biogas dry reforming is the best at 873 K. Therefore, this study assumes that H2 can be produced by biogas dry reforming at Tfb over 873 K. The conversion ratio of H2 is assumed to be 100 %. Though the highest conversion ratio of H2 was approximately 10 % according to the authors’ previous experimental studies [22,23], this study assumes that the conversion ratio of H2 is 100 % as the ideal maximum performance case.
To estimate the power generated by SOFC, this study considers the lower heating value of H2 (= 10.79 MJ/m3N) and the power generation efficiency of commercial SOFC of 55 % [25]. When the conversion ratio of H2 is 100 %, the power generated by SOFC can be calculated as follows:
(3.34×10⁻² [mol/s]×22.4 [L/mol])÷(1000 [L/m3]×0.55×(10.79 [MJ/(m3N)] )= 4.44 [kW]
The amount of produced H2 and the power generated by SOFC which are estimated by this study under several conditions are discussed in the next section.

4. Results and Discussion

4.1. Temperature of Heat Transfer Fluid

The weather data of I, ua and Ta in Kofu city, Nagoya city and Yamagata city in 2021 [21] which are adopted for the calculation of Tfb were collected and are shown in Table 2, Table 3 and Table 4. As representative data for each city, the data in January are shown in these tables. The monthly mean value of I, ua and Ta are listed in these tables.
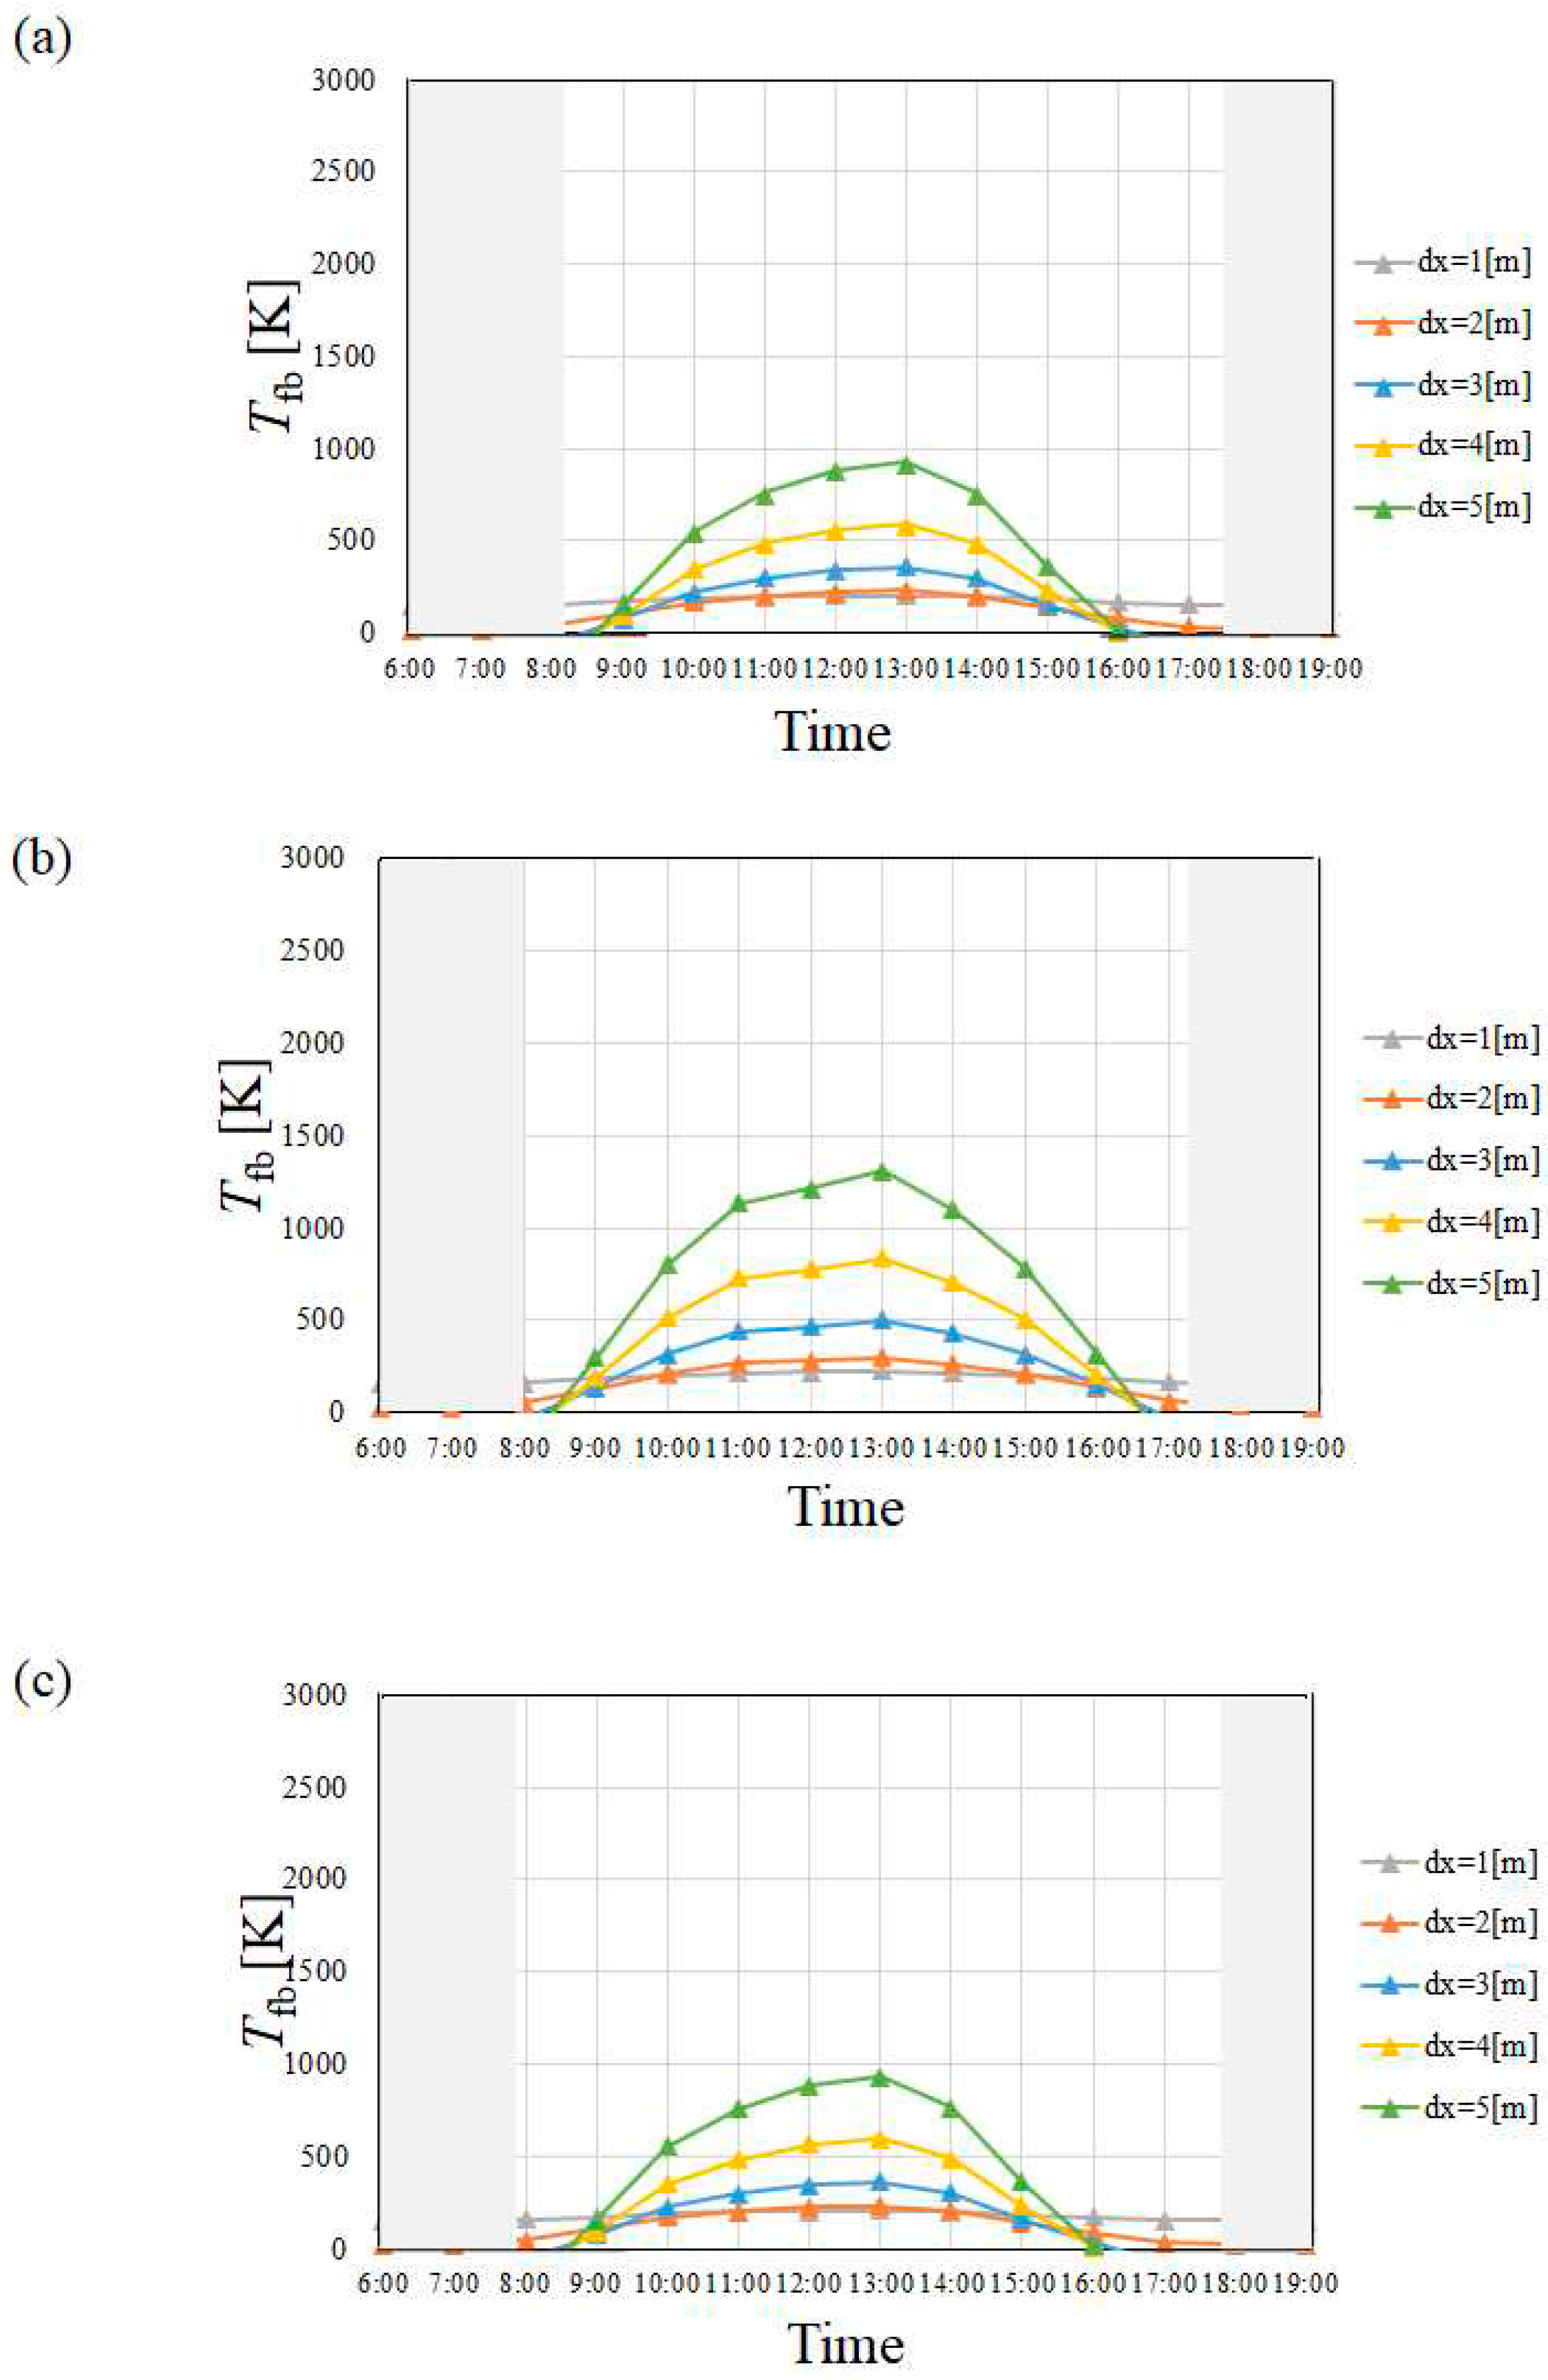
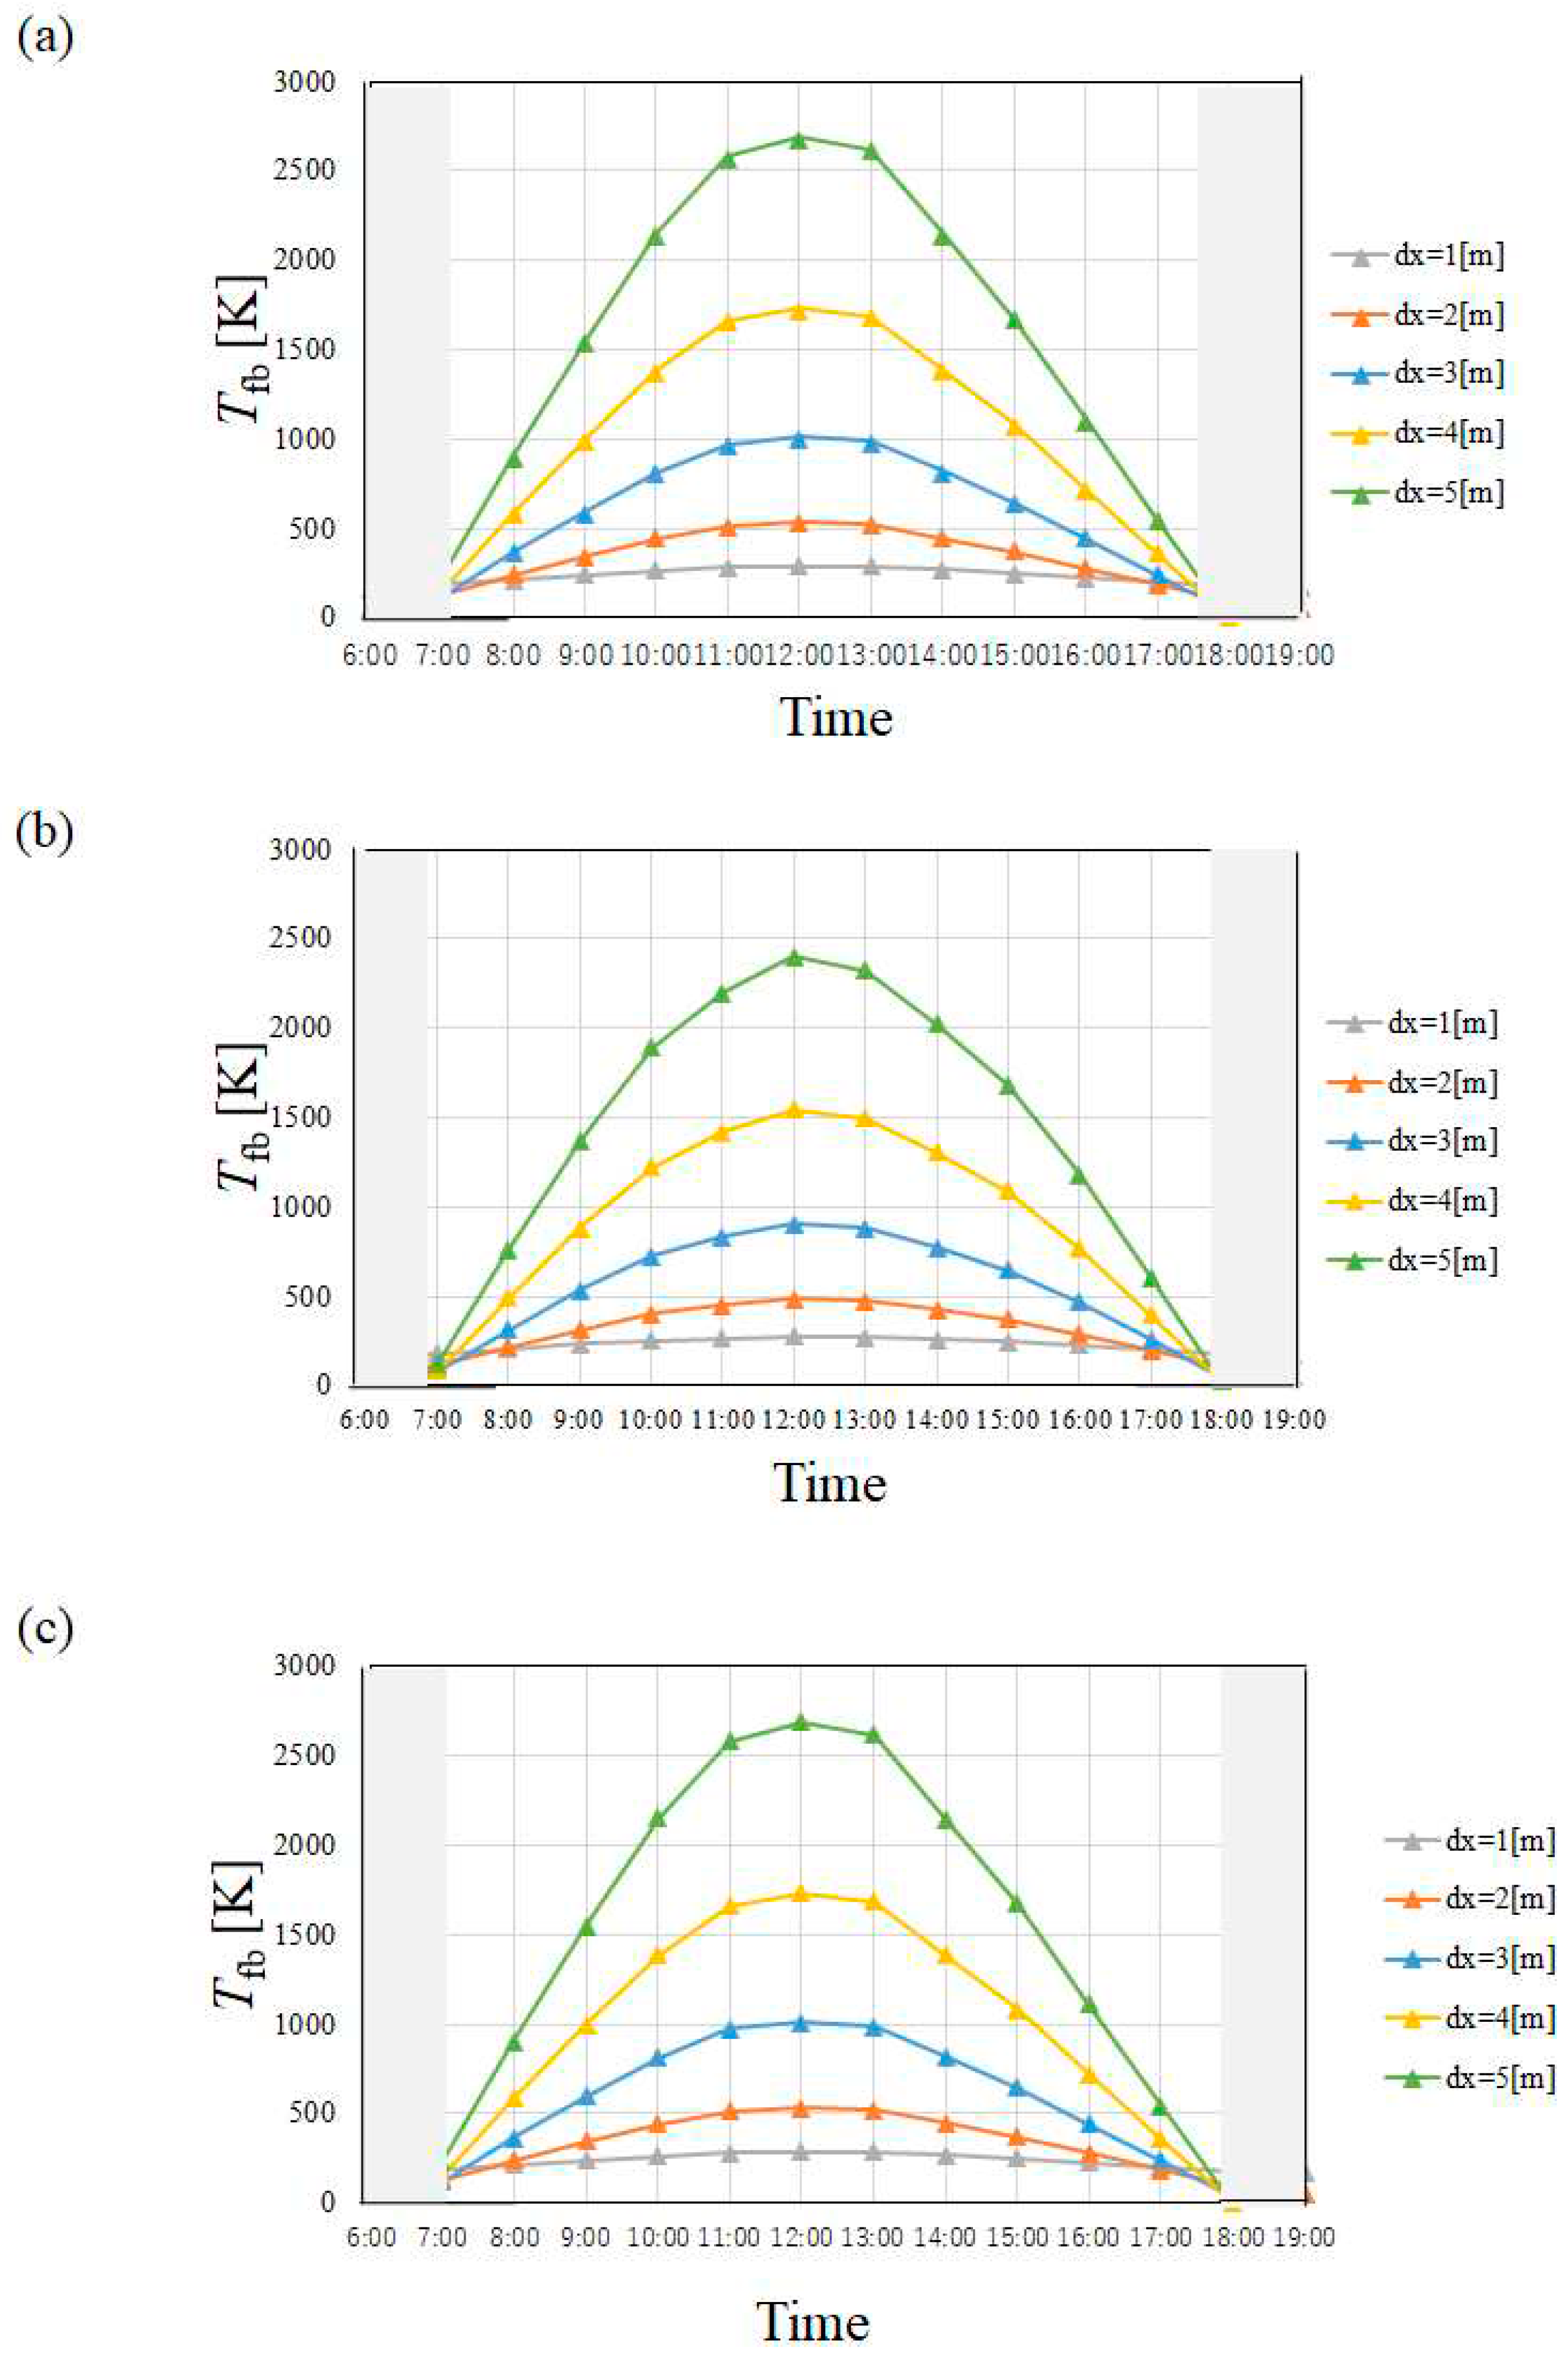
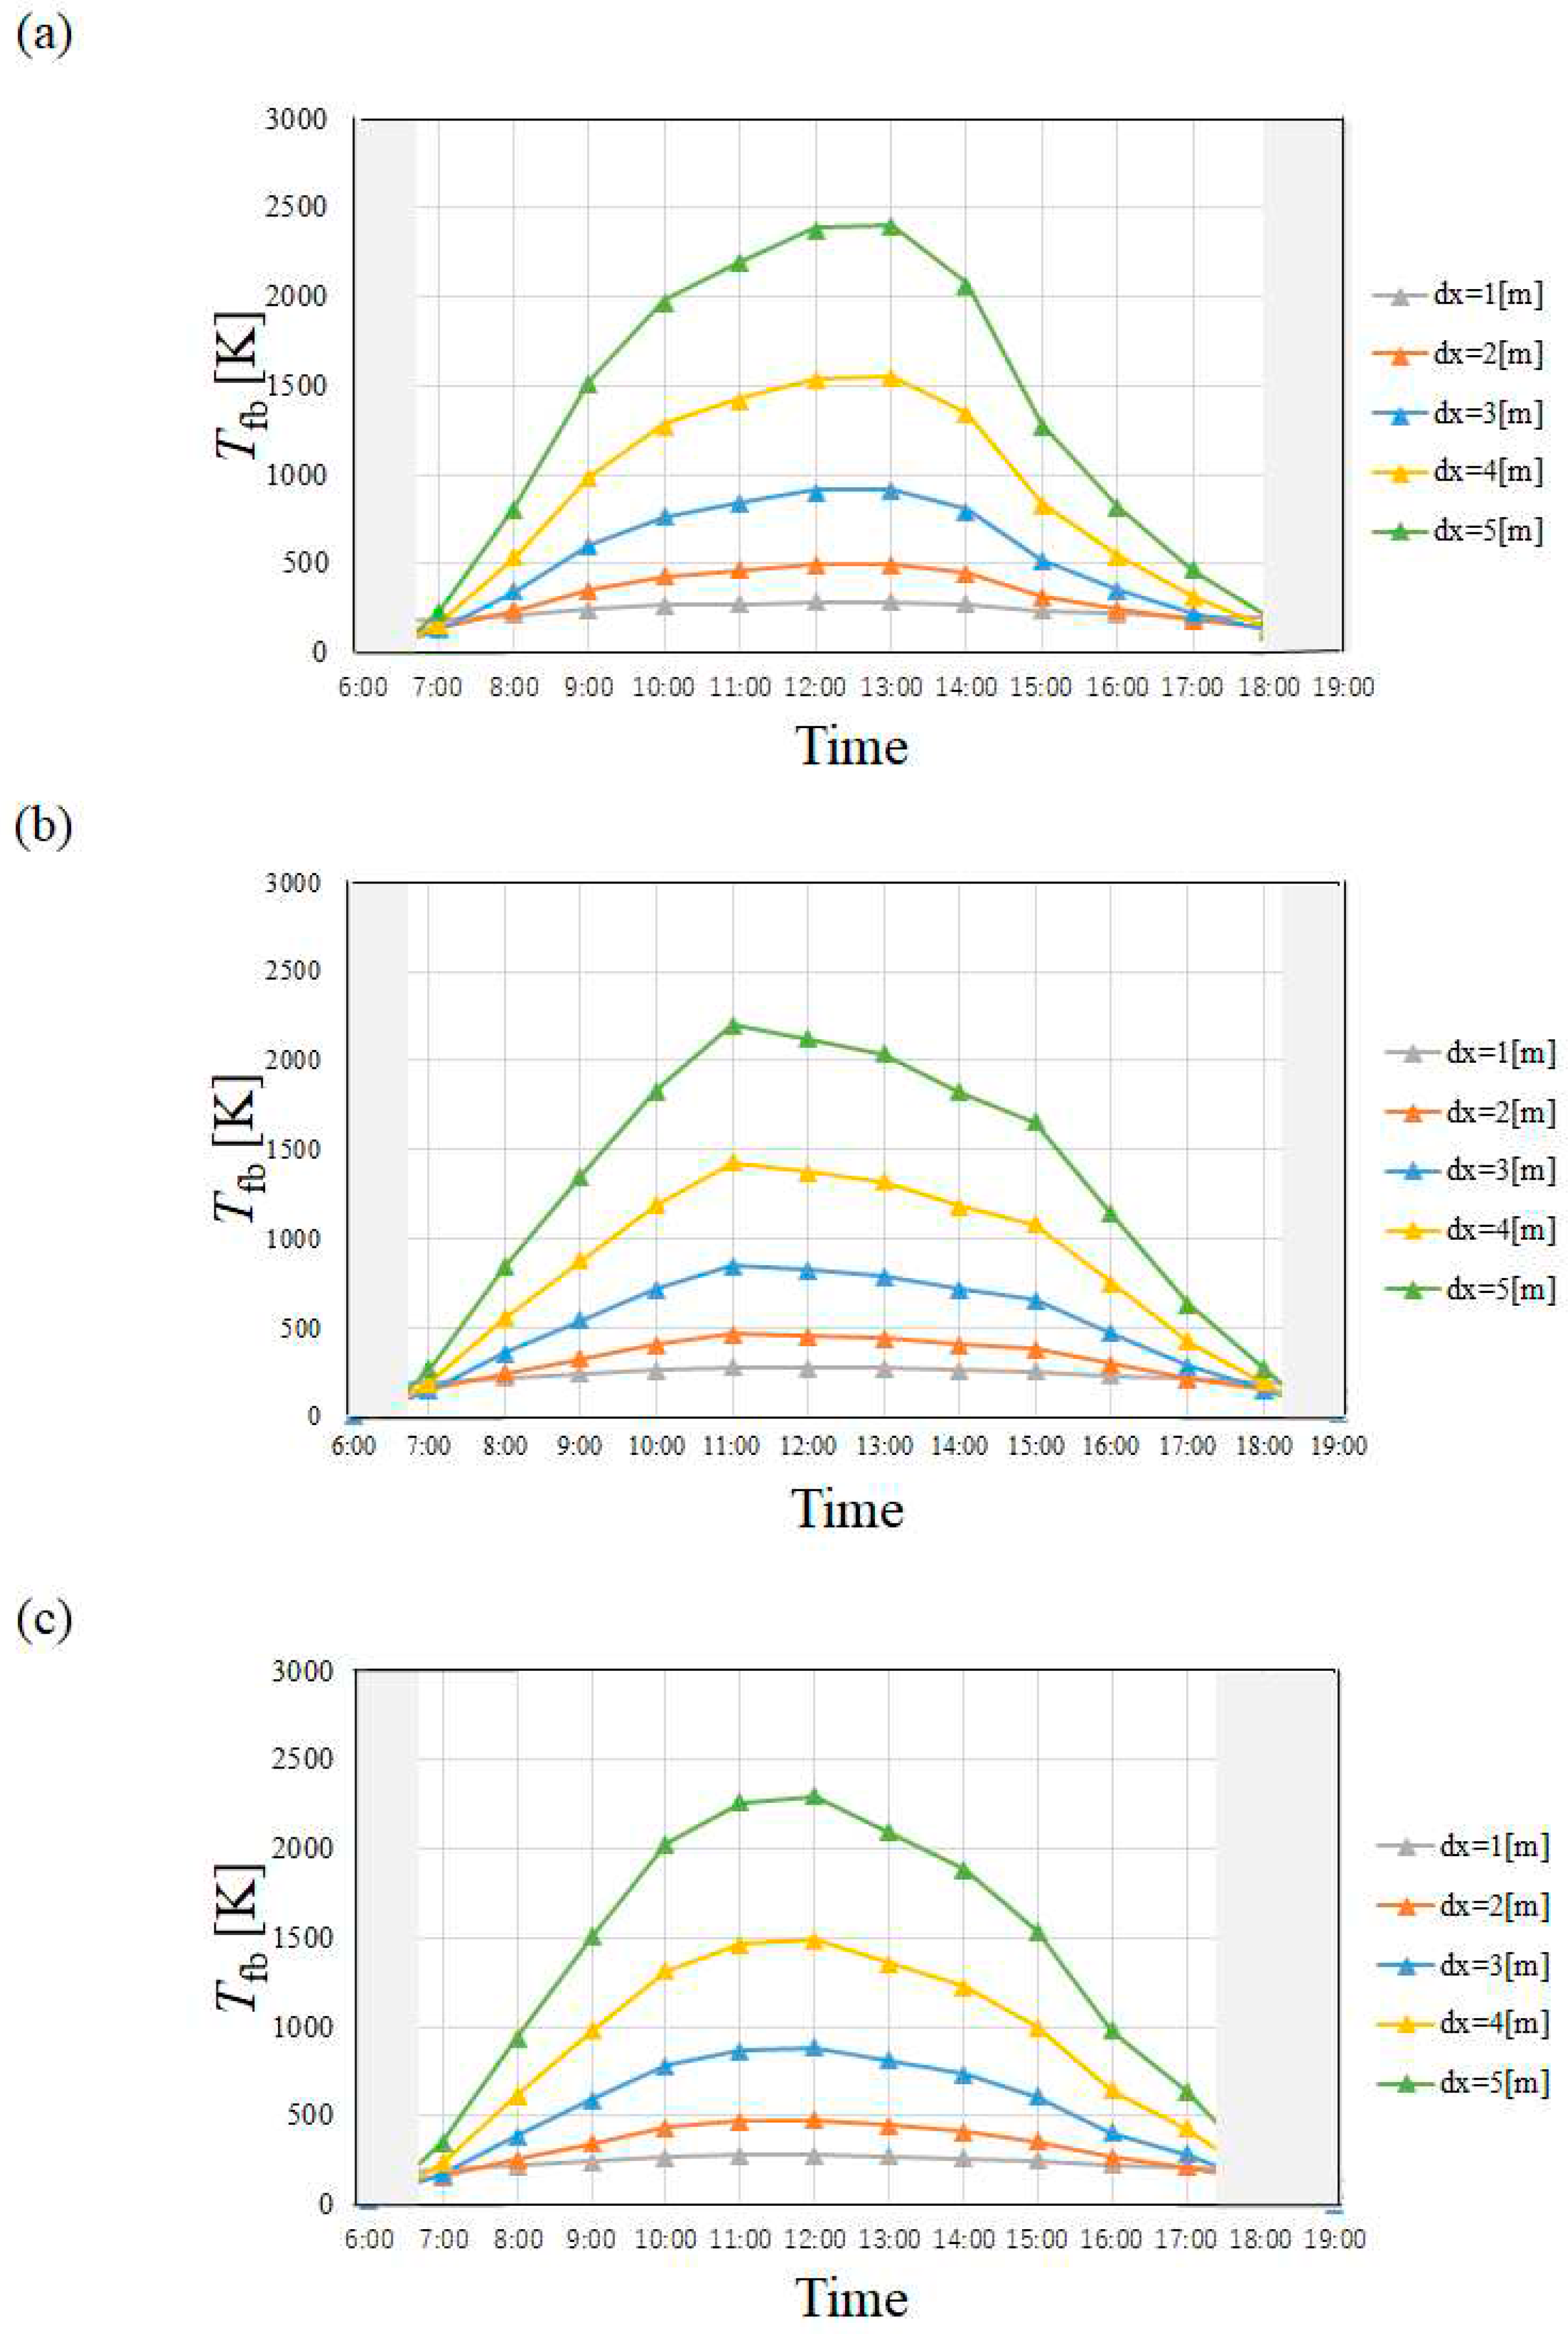
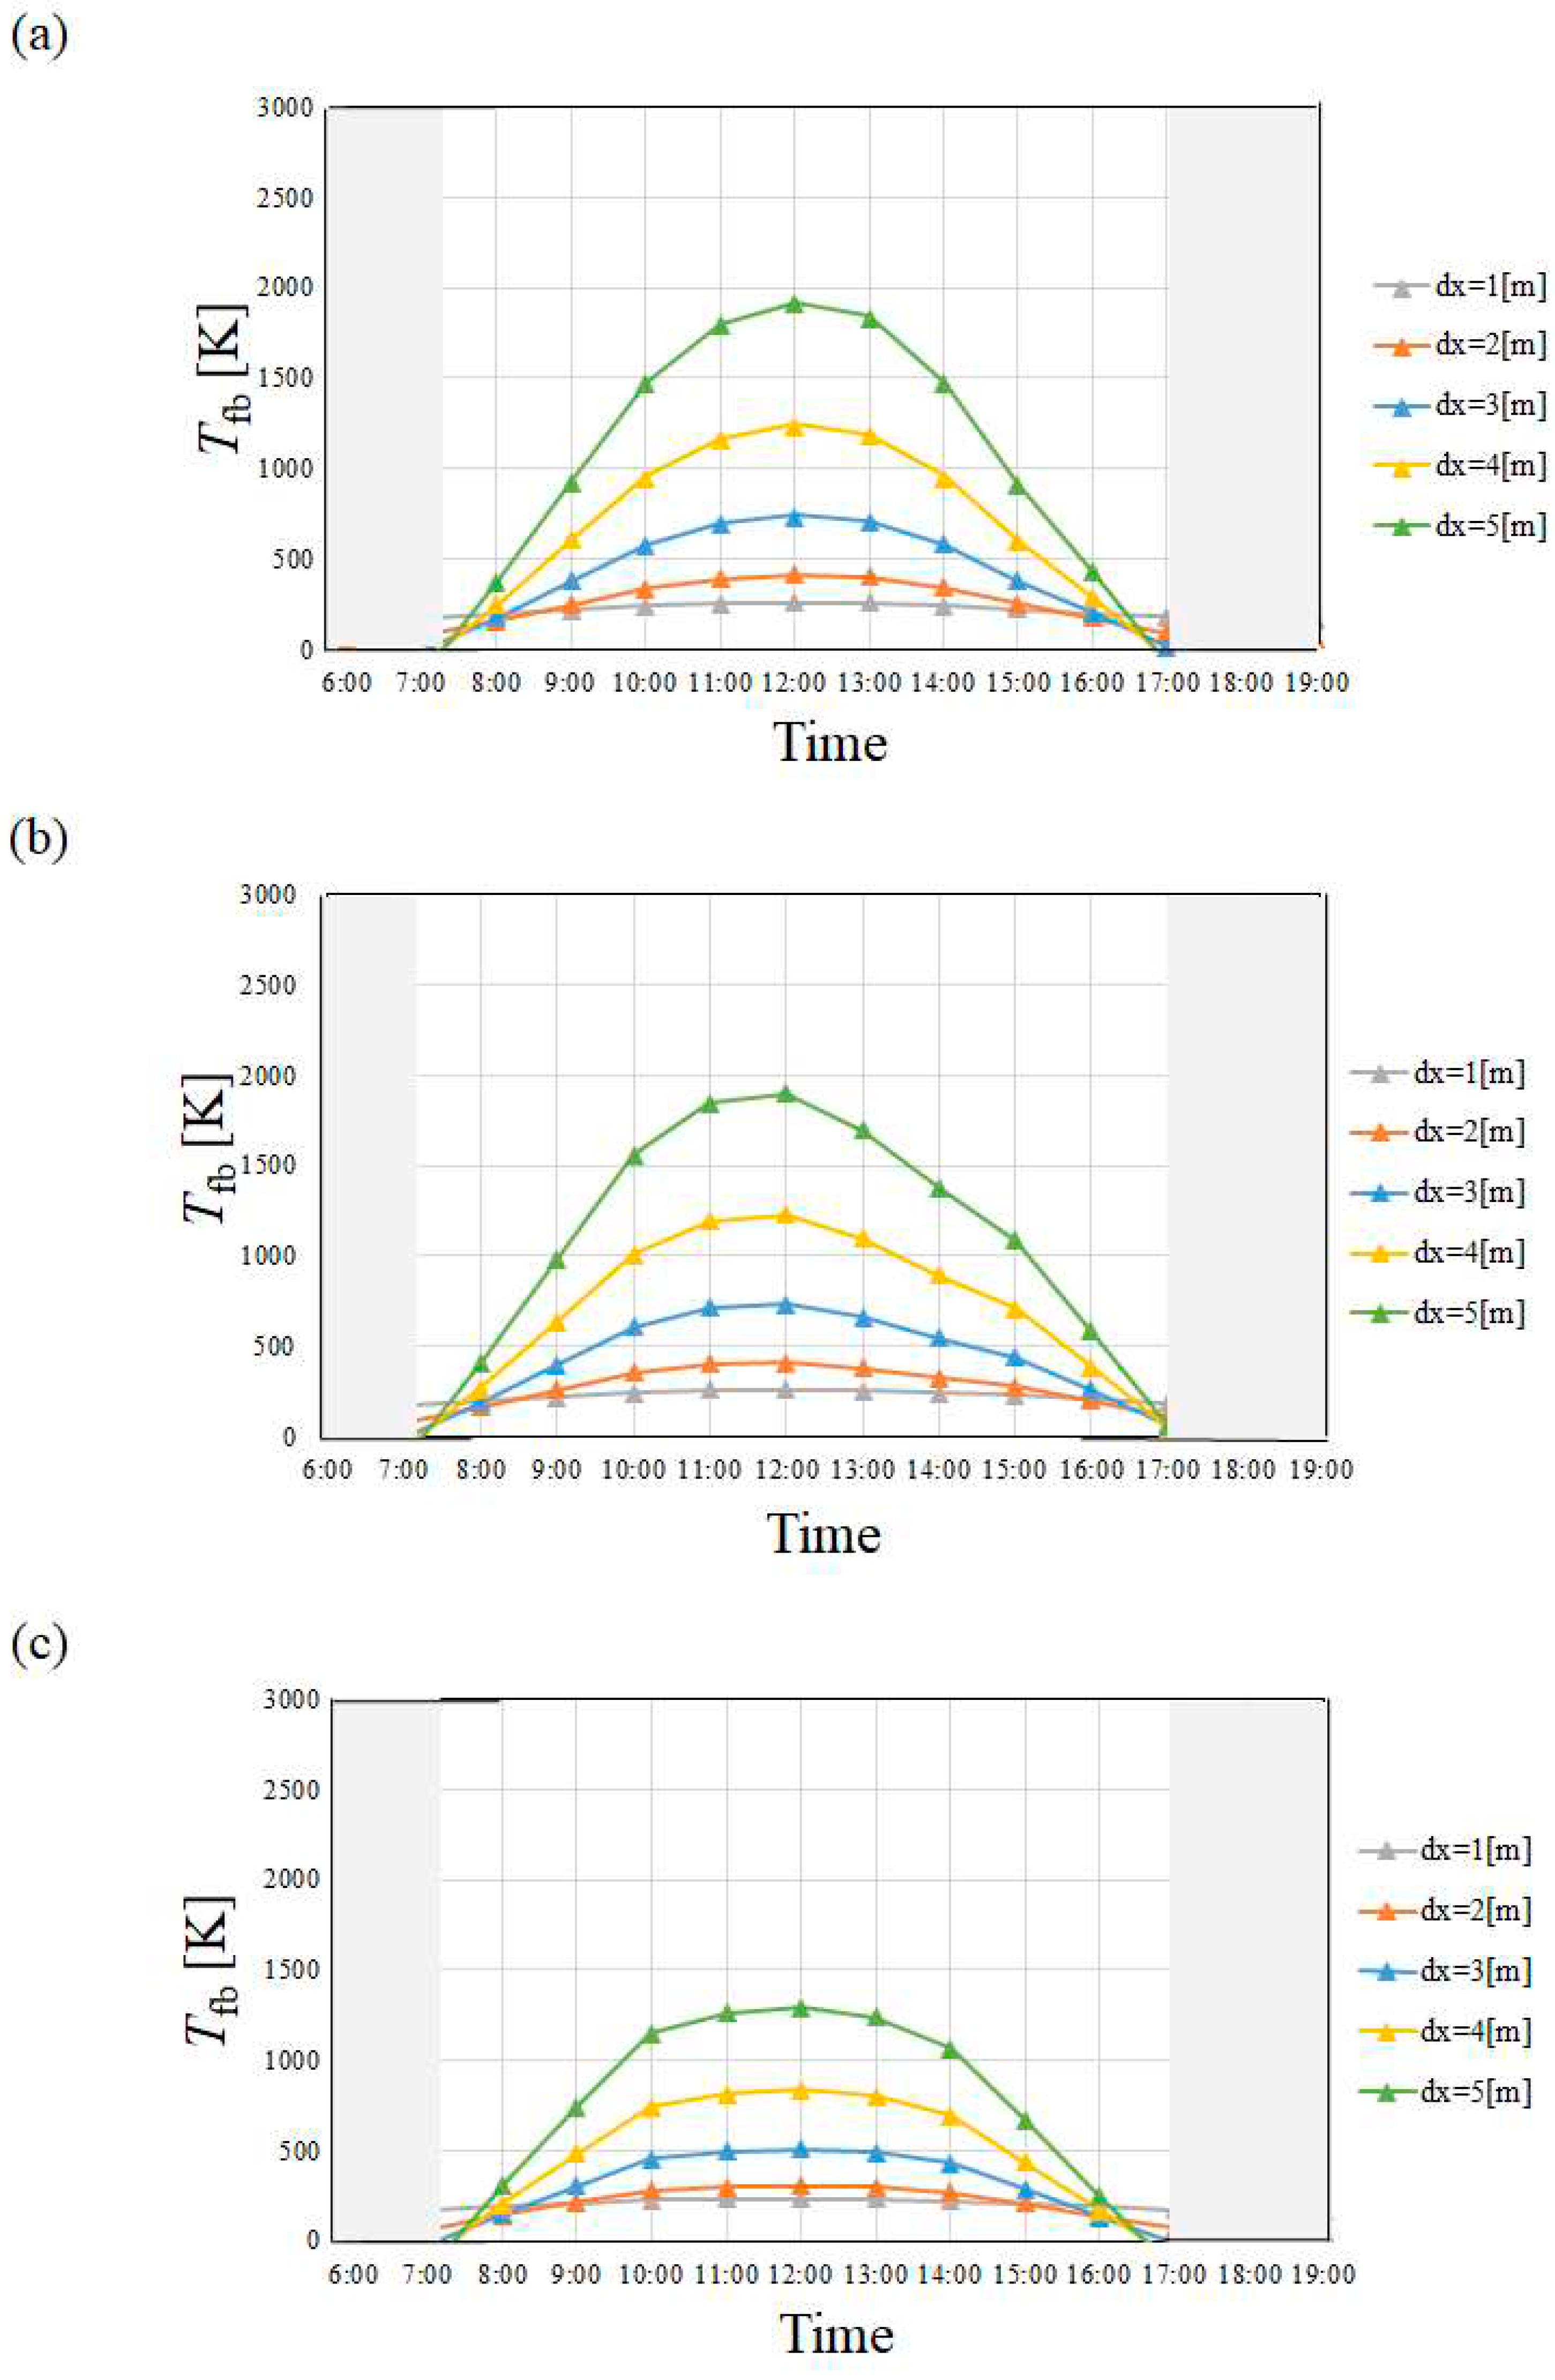
Figure 4, Figure 5, Figure 6 and Figure 7 show the changes of Tfb with time in different months and cities. The data in January, April, July and October are shown as a representative data for Winter, Spring, Summer and Autumn, respectively. The monthly mean values are shown in these figures.
It can be seen from Table 2, Table 3 and Table 4 and Figure 4, Figure 5, Figure 6 and Figure 7 that the change of Tfb with time follows the change of I mainly. In addition, Tfb in April and July is higher than that in January and October irrespective of city since I in April and July is higher than that in January and October. It is found from Figure 4, Figure 5, Figure 6 and Figure 7 that Tfb increases with the increase in dx since the surface area of absorber tube, i.e. heat transfer area is larger. Additionally, it can be seen that Tfb for dx = 5 m is higher than 2,000 K in April and July irrespective of city, which is not suitable for actual application due to the safety issues of the material of absorber tube. Therefore, this study decides that the optimum dx should be around 4 m irrespective of city to ensure the safety of stainless steel that is the material used to make the absorber tube. For example, the melt point of SUS 405 is 1,700 K [26]. In the following discussion on the analysis results, this study adopts the results using dx = 4 m. As to the comparison of the tendency of Tfb, it is seen that Tfb in Yamagata city in January and October, i.e. winter and autumn is lower than that in Kofu city and Nagoya city especially, which is influenced by the tendency of I strongly, not ua. On the other hand, Tfb is almost the same in April and July, i.e. spring and summer, irrespective of city. The difference of Tfb between Kofu city and Nagoya city is relatively small, resulting from that the difference of duration of sunshine for the ranking prefectural capital city which was under 24 in Japan in 2021 [16].

3.2. Amount of H2 Produced from Biogas Dry Reforming and Power Generated by SOFC

To calculate the amount of H2 produced from the biogas dry reforming reactor, Table 5 lists the time when Tfb is over 873 K for Kofu city, Nagoya city and Yamagata city. In this table, the data in the case of dx = 4 m are shown. As we described before, this study assumes that H2 can be produced at the conversion ratio of H2 of 100 % when Tfb is over 873 K. The time when Tfb is over 873 K is marked in this table.
According to Table 5, the time when Tfb is over 873 K in spring and summer is longer than that in winter and autumn irrespective of city. This is mainly due to the tendency of I, not ua. In addition, it is known the time when Tfb is over 873 K is 0 in January and December in Yamagata city. Therefore, other cities should be selected if the proposed system would be used all year around.
Table 6 lists the amount of H2 produced from the biogas dry reforming reactor for Kofu city, Nagoya city and Yamagata city, respectively. It can be seen form Table 6 that the annual amount of H2 produced from the biogas dry reforming reactor for Nagoya city is over than that for Kofu city. As described above, the difference of duration of sunshine for the ranking prefectural capital city which was under 24 in Japan in 2021 [16] was small.
It is seen from Table 6 that the amount of produced H2 from the biogas dry reforming reactor in spring and summer is higher as expected, compared to the other seasons irrespective of city. This could be explained by the time when Tfb is over 873 K listed in Table 5.
Table 7 lists the power generated by SOFC with the H2 generated from the biogas dry reforming reactor for Kofu city, Nagoya city and Yamagata city. The annual power generated by SOFC for Kofu city, Nagoya city and Yamagata city is 10,809 kWh, 10,959 kWh and 8,389 kWh, respectively. The annual power generated by SOFC for Nagoya city was also higher than that for Kofu city. As described above, the difference of duration of sunshine for the ranking prefectural capital city which was under 24 in Japan in 2021 [16] was small.
It is seen from Table 7 that the power generated by SOFC in spring and summer is higher compared to the other seasons irrespective of city, which can be explained by the time when Tfb is over 873 K in Table 5. In addition, it is found from Table 7 that the power generated by SOFC in January and December in Yamagata city is 0, because the reactor did not work as Tfb was lower than 873 K. Therefore, as claimed before, other cities should be selected if the proposed system would be used all year around.
Table 8 lists the number of households whose power demand could be met by the combined system in each month for Kofu city, Nagoya city and Yamagata city. The number that was termed as “available households number per month” in this study, was calculated by dividing the power generated by SOFC by the electricity demand of couple households in each season [27].
It can be seen from Table 8 that the highest available households number per month clarified in this study is 4.7 in June in Kofu. According to Table 8, this highest number can be also observed for Yamagata city. In spring and summer in Yamagata city, the foehn phenomenon, which causes the sunny days with high temperature, seldom occurs [21]. Therefore, the highest available household number per month of 4.7 can be obtained even for Yamagata city. However, the highest available households number per month of 4.7 is still small. In this study, the analysis was conducted for the case of m = 0.05 kg/s. If m was larger, the amount of H2 produced from the biogas dry reforming reactor would increase. The optimum dx and D would be changed when m was over 0.05 kg/s. In addition, the available households number per month was small in autumn and winter. To supply the energy for these seasons, the storage of H2 after a biogas dry reforming is proposed and is being studied currently. The results on these subjects will be reported in the near future.

4. Conclusions

This study has simulated the performances of PTC and a proposed energy system with the weather data of different cities in Japan. The cities studied were Kofu city, Nagoya city and Yamagata city which almost cover the whole climate zones of Japan. The temperature of heat transfer fluid was calculated by the simple but effective heat transfer model developed. The following conclusions could be drawn from the study:
  • Tfb in April and July is higher than that in January and October irrespective of city since I in April and July is higher than that in January and October.
  • Tfb increases with the increase in dx. However, this study has decided that the optimum and maximum dx should be 4 m irrespective of city since this study assumed to use stainless steel as the material to make the absorber tube.
  • Tfb in Yamagata city in January and October, i.e. winter and autumn was lower than that in Kofu city and Nagoya city especially, which is influenced by the tendency of I strongly, not ua. On the other hand, Tfb was almost the same in April and July, i.e. spring and summer, irrespective of city.
  • The amount of produced H2 as well as the power generated by SOFC in spring and summer were higher compared to the other seasons irrespective of city.
  • The highest available households number per month found in this study was 4.7 in June in Kofu city as well as June and July in Yamagata city. To increase the households number, some measures, e.g. increasing m should be further studied.

Author Contributions

Conceptualization and writing—original draft preparation, A.N.; methodology, R.S.; writing—review and editing, E. H.; All authors have read and agreed to the published version of the manuscript.

Funding

This research was funded by Mie University.

Conflicts of Interest

The authors declare no conflicts of interest.

References

  1. Agency for Natural Resources and Energy, Energy White Paper 2023. Available online: https://www.ebecgi.meti.go.jp/about/whitepaper/2023/pdf/ (accessed on 23 January 2024).
  2. International Energy Agency, World Energy Outlook 2022. Available online: https://www.jea.org/reports/world-energy-outlook-2022/outlook-for-electricity (accessed on 23 January 2024).
  3. Jelle, B. P. Building integrated photovoltaics: a concise research pathways. Energies 2016, 9. [Google Scholar] [CrossRef]
  4. World Bioenergy Association, Global Bioenergy Statistics. Available online: https://worldbioenergy.org/uploads/221223%20WBA%20GBS202022.pdf (accessed on 23 January 2024).
  5. Mao, C.; Chen, S.; Shang, K.; Liang, L.; Ouyang, J. Highly active Ni-Ru bimetallic catalyst integrated with MFI zeolite-loaded cerium zirconium oxide for dry reforming of methane. ACS Applied Material & Interfaces 2022, 14, 47616–47632. [Google Scholar] [CrossRef]
  6. Nishimura, A.; Sato, R.; Hu, E. An energy production system powered by solar heat with biogas dry reforming reactor and solid oxide fuel cell. Smart Grid and Renewable Energy 2023, 14, 85–106. [Google Scholar] [CrossRef]
  7. Zhang, T.; Tang, X. Y.; Yang, W. W.; Ma, X. Comprehensive performance study on reflux solar methanol stream reforming reactor for hydrogen production. International Journal of Hydrogen Energy 2023, 48, 879–893. [Google Scholar] [CrossRef]
  8. Lu, B.; Liu, T.; Yan, X.; Zheng, Z.; Liu, Q. A new solar mid-and-low temperature receiver/reactor with linear Fresnel reflector. Applied Thermal Engineering 2023, 226. [Google Scholar] [CrossRef]
  9. Sarabchi, N.; Yari, M.; Mahmoudi, S. M. S. Exergy and exergoeconomic analysis of novel high-temperature proton exchange membrane fuel cell based combined cogeneration cycles, including methanol steam reformer integrated with catalytic combustor or parabolic trough solar collector. Journal of Power Sources 2021, 485. [Google Scholar] [CrossRef]
  10. Cheng, Z. D.; Leng, Y. K.; Men, J. J.; He, Y. L. Numerical study on a novel parabolic trough solar receiver-reactor and a new control strategy for continuous and efficient hydrogen production. Applied Energy 2023, 261. [Google Scholar] [CrossRef]
  11. Cheng, Z. D.; Men, J. J.; He, Y. L.; Tao, Y. B.; Ma, Z. Comprehensive study on novel parabolic trough solar receiver-reactors for hydrogen production. Renewable Energy 2019, 143, 1766–1781. [Google Scholar] [CrossRef]
  12. Wang, H.; Liu, M.; Kong, H.; Hao, Y. Thermodynamic analysis on mid-low temperature solar methane steam reforming with hydrogen permeation membrane reactors. Applied Thermal Engineering 2019, 152, 925–936. [Google Scholar] [CrossRef]
  13. Zhao, Q.; Su, B.; Wang, H.; He, A.; He, R.; Kong, H. Mid/low-temperature solar hydrogen generation via dry reforming of methane enhanced in a membrane reactor. Energy Conversion and Management 2021, 240. [Google Scholar] [CrossRef]
  14. Fuqiang, W.; Lin, J.; Ziming, C.; Huaxu, L.; Jianyu, T. Combination of thermodynamic analysis and regression analysis for steam and dry methane reforming. International Journal of Hydrogen Energy 2019, 44, 15795–15810. [Google Scholar] [CrossRef]
  15. Rathod, V. P.; Shete, J.; Bhale, P. V. Experimental investigation on biogas reforming to hydrogen rich syngas production using solar energy. International Journal of Hydrogen Energy 2016, 41, 132–138. [Google Scholar] [CrossRef]
  16. Graph to Chart, The Annual Duration of Sunshine for Prefectural Capital Cities in Japan. Available online: https://graphtochart.com/japan/world-yearly-sunshine_hour2.php (accessed on 23 January 2024).
  17. Kumar, K. H.; Daabo, A. M.; Karmakar, M. K.; Hirani, H. Solar parabolic dish collector for concentrated solar thermal systems: a review and recommendation. Environmental Science and Pollution Research 2022, 29, 32335–32367. [Google Scholar] [CrossRef] [PubMed]
  18. Kalogirou, S. A. Solar thermal collectors and application. Prog. Energy Combust. Sci. 2004, 30, 231–295. [Google Scholar] [CrossRef]
  19. Badar, R.; Pedretti, A.; Barbato, M.; Steingeld, A. An air-based corrugated cavity-receiver for solar parabolic trough concentrators. Applied Energy 2015, 138, 337–345. [Google Scholar] [CrossRef]
  20. Valladares, O. G.; Velazquez, N. Numerical simulation of parabolic trough solar collector: improvement using counter flow concentric circular heat exchangers. International Journal of Heat and Mass Transfer 2009, 52, 597–609. [Google Scholar] [CrossRef]
  21. Japan Meteorological Agency, Past Meteorological Data Search. Available online: http://www/data/jma.go.jp/obd/stats/etrn/index/php (accessed on 23 January 2024).
  22. Nishimura, A.; Tanaka, T.; Ohata, S.; Kolhe, M. L. Biogas dry reforming for hydrogen through membrane reactor utilizing negative pressure. Fuels 2021, 2, 191–209. [Google Scholar] [CrossRef]
  23. Nishimura, A.; Ohata, S.; Okukura, K.; Hu, E. The impact of operating conditions on the performance of a CH4 dry reforming membrane reactor for H2 production. Journal of Energy and Power Technology 2020, 2. [Google Scholar] [CrossRef]
  24. Kreith, F.; Freider, J. K. Preprints of thermodynamics and heat transfer applied to solar energy. Solar Energy Handbook, 1st ed.; McGraw-Hill, New York, 1981; p. 1.
  25. NEDO (New Energy and Industry Technology Development Organization), Road Map of 2017 of NEDO Fuel Cell and Hydrogen. Available online. https://www.nedo.go.jp/content/100871873.pdf (23 January 2024).
  26. The Japan Society of Mechanical Engineers. JSME Heat Transfer Handbook, 1st ed.; Maruzen, Tokyo, 1993; p. 371.
  27. Power Plan. Available online. https://standard-project.net/energy/stasistis/emegy-consumption-day.html (23 January 2024).
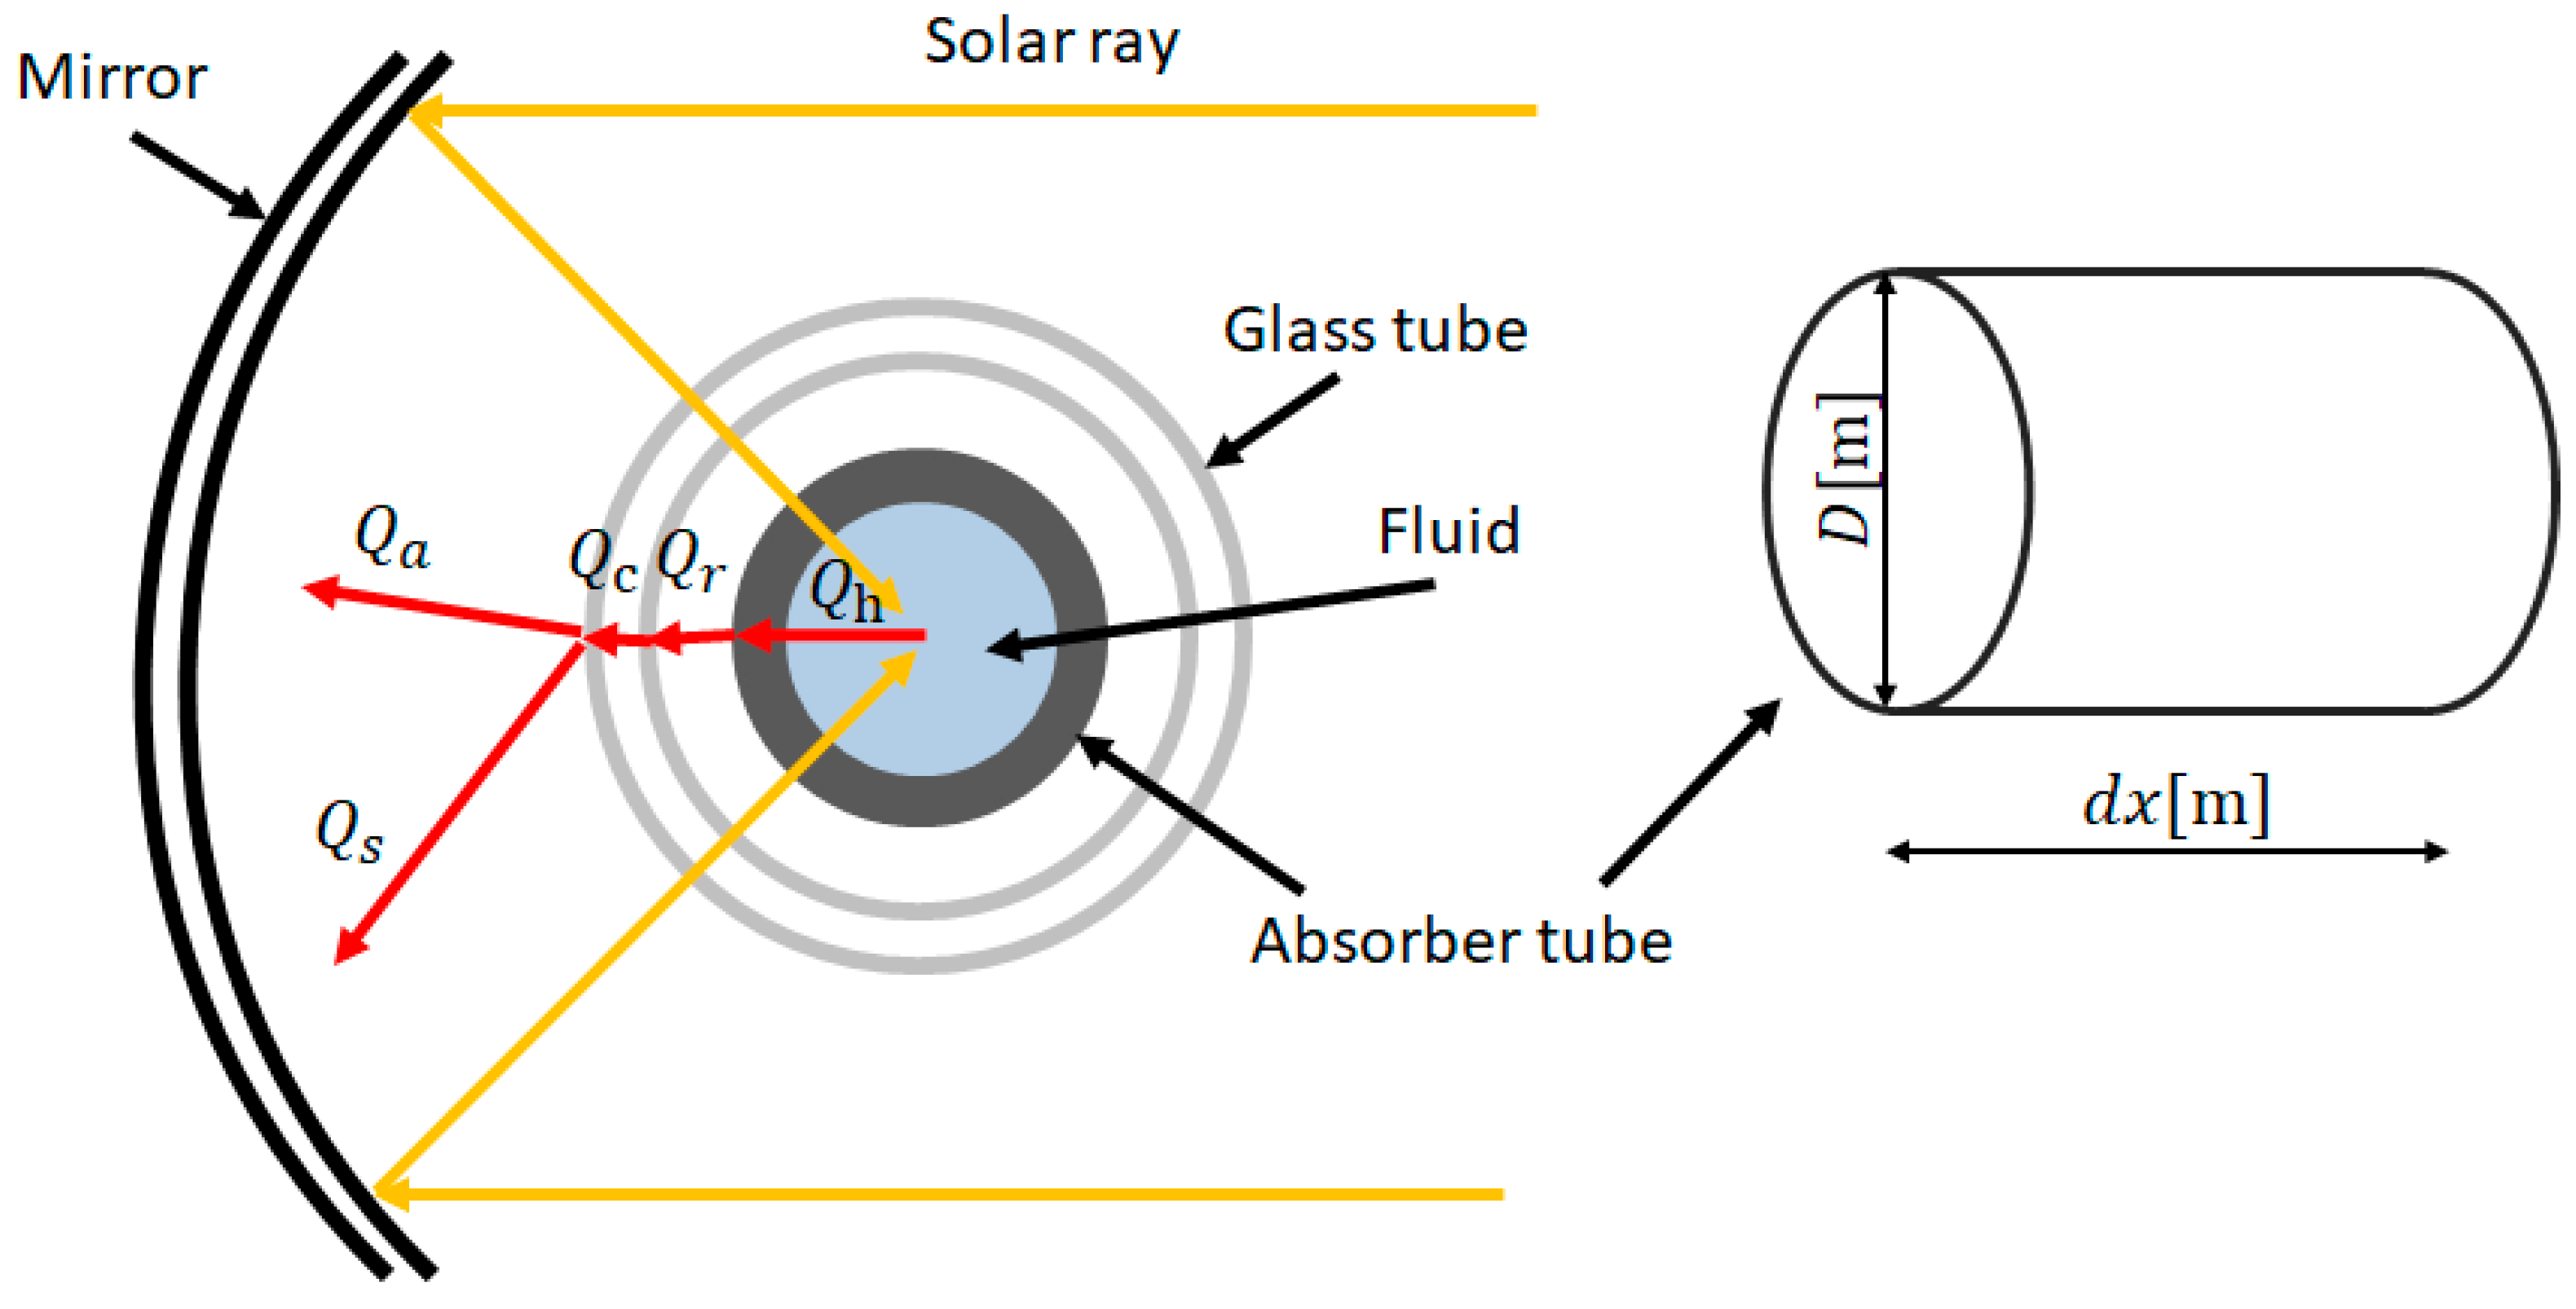
Figure 1. Schematic drawing for heat transfer model of parabolic trough solar collector investigated in this study.
Preprints 97353 g001
Figure 2. Thermal resistance diagram of heat transfer model investigated in this study.
Preprints 97353 g002
Figure 3. System consisting of solar collector, biogas dry reforming reactor and SOFC proposed by this study.
Preprints 97353 g003
Figure 4. Change of Tfb with time among different cities in January ((a): Kofu city, (b): Nagoya city, (c): Yamagata city).
Preprints 97353 g004
Figure 5. Change of Tfb with time among different cities in April ((a): Kofu city, (b): Nagoya city, (c): Yamagata city).
Preprints 97353 g005
Figure 6. Change of Tfb with time among different cities in July ((a): Kofu city, (b): Nagoya city, (c): Yamagata city).
Preprints 97353 g006
Figure 7. Change of Tfb with time among different cities in October ((a): Kofu city, (b): Nagoya city, (c): Yamagata city).
Preprints 97353 g007
Table 1. The values of physical properties adopted in this study. [17,25].
Property Value Information
α [-] 0.94 -
τ [-] 0.94 -
εt [-] 0.9 -
c [J/(kg・K)] 1.335 for CH4:CO2 = 1.5:1
σ [W/(m2・K4)] 5.67×10⁻⁸ Stefan-Boltzmann
coefficient
εg [-] 0.94 Glass smooth surface
ka [W/(m・K)] 0.0257 Surrounding air
ρa [kg/m3] 1.166 Surrounding air
μa [Pa・s] 1.82×10⁻⁵ Surrounding air
Cp,a [J/(kg・K)] 1006 Surrounding air
kt [W/(m・K)] 16 Stainless steel
Kg [W/(m・K)] 1.3 Quartz glass
Table 2. Weather data of I, ua and Ta in Kofu city in January.
Time I [MJ/m2] ua [m/s] Ta [K]
6:00 0 1.5 272.6
7:00 0.6 1.6 272.4
8:00 53.4 1.4 273.3
9:00 186.2 1.6 275.0
10:00 316.6 1.7 276.7
11:00 427.1 2.0 278.4
12:00 478.4 2.5 279.8
13:00 472.3 2.6 280.9
14:00 401.3 2.9 281.5
15:00 287.0 3.1 281.6
16:00 157.7 2.9 281.1
17:00 35.2 3.1 279.9
18:00 0.1 3.1 279.9
19:00 0 2.5 277.9
Table 3. Weather data of I, ua and Ta in Nagoya city in January.
Time I [MJ/m2] ua [m/s] Ta [K]
6:00 0 2.1 275.4
7:00 0 2.2 275.3
8:00 43.8 2.2 275.8
9:00 166.6 2.4 277.0
10:00 295.3 2.7 278.4
11:00 379.0 3.4 279.5
12:00 398.4 3.6 280.3
13:00 422.5 3.8 280.6
14:00 369.0 3.9 281.0
15:00 288.3 3.9 280.9
16:00 168.7 4.0 280.4
17:00 46.8 3.5 279.7
18:00 0.6 3.2 279.0
19:00 0 2.8 278.5
Table 4. Weather data of I, ua and Ta in Yamagata city in January.
Time I [MJ/m2] ua [m/s] Ta [K]
6:00 0 1.4 270.5
7:00 0.2 1.4 270.4
8:00 37.5 1.5 270.8
9:00 134.3 1.5 271.6
10:00 236.3 1.6 272.5
11:00 289.1 1.8 272.9
12:00 320.7 1.6 273.3
13:00 331.9 1.6 273.9
14:00 288.6 1.6 274.2
15:00 186.7 1.6 274.1
16:00 97.8 1.6 273.8
17:00 17.0 1.9 273.1
18:00 0 1.7 272.6
19:00 0 1.6 272.4
Table 5. The time when Tfb is over 873 K for Kofu city, Nagoya city and Yamagata city.
Kofu city
7:00 8:00 9:00 10:00 11:00 12:00 13:00 14:00 15:00 16:00 17:00 18:00
Jan
Feb
Mar
Apr
May
Jun
Jul
Aug
Sep
Oct
Nov
Dec
Nagoya city
7:00 8:00 9:00 10:00 11:00 12:00 13:00 14:00 15:00 16:00 17:00 18:00
Jan
Feb
Mar
Apr
May
Jun
Jul
Aug
Sep
Oct
Nov
Dec
Yamagata city
7:00 8:00 9:00 10:00 11:00 12:00 13:00 14:00 15:00 16:00 17:00 18:00
Jan
Feb
Mar
Apr
May
Jun
Jul
Aug
Sep
Oct
Nov
Dec
Table 6. The amount of H2 produced from the biogas dry reforming reactor for Kofu city, Nagoya city and Yamagata city.
Kofu city [kg] Nagoya city [kg] Yamagata city [kg]
Jan 29.82 29.82 0
Feb 40.40 40.40 20.20
Mar52.18 52.18 52.18 37.27
Apr 57.72 57.72 57.72
May 59.64 52.18 52.18
Jun 64.93 57.72 61.93
Jul 52.18 59.64 67.09
Aug 59.64 74.55 52.18
Sep 50.50 50.50 50.50
Oct 44.73 52.18 37.27
Nov 36.07 36.07 36.07
Dec 37.27 29.82 0
Table 7. The power generated by SOFC for Kofu city, Nagoya city and Yamagata city.
Kofu city [kWh] Nagoya city [kWh] Yamagata city [kWh]
Jan 551 551 0
Feb 746 746 373
Mar52.18 964 964 689
Apr 1070 1070 1070
May 1100 964 964
Jun 1200 1070 1200
Jul 964 1100 1240
Aug 1100 1380 964
Sep 933 933 933
Oct 826 964 689
Nov 666 666 267
Dec 689 551 0
Table 8. The available households number per month for Kofu city, Nagoya city and Yamagata city.
Kofu city [-] Nagoya city [-] Yamagata city [-]
Jan 1.7 1.7 0
Feb 2.6 2.6 1.3
Mar52.18 4.0 4.0 2.9
Apr 4.6 4.6 4.6
May 4.6 4.0 4.0
Jun 4.7 4.2 4.7
Jul 3.7 4.2 4.7
Aug 4.2 4.2 3.7
Sep 4.0 4.0 4.0
Oct 3.5 4.0 2.9
Nov 2.8 2.8 1.1
Dec 2.1 1.7 0
Disclaimer/Publisher’s Note: The statements, opinions and data contained in all publications are solely those of the individual author(s) and contributor(s) and not of MDPI and/or the editor(s). MDPI and/or the editor(s) disclaim responsibility for any injury to people or property resulting from any ideas, methods, instructions or products referred to in the content.
Copyright: This open access article is published under a Creative Commons CC BY 4.0 license, which permit the free download, distribution, and reuse, provided that the author and preprint are cited in any reuse.
Prerpints.org logo

Preprints.org is a free preprint server supported by MDPI in Basel, Switzerland.

Subscribe

© 2024 MDPI (Basel, Switzerland) unless otherwise stated