Introduction
Parkinson’s disease (PD) is a common neurodegenerative condition that predominantly affects individuals over the age of 65 and becomes increasingly prevalent with advancing age. According to the World Health Organization, the global burden of PD-related disability and mortality is escalating at a faster rate than any other neurological condition. Currently, levodopa serves as the primary clinical treatment for PD, alleviating its signs and symptoms. However, long-term use of levodopa can lead to motor disorders and a decline in its efficacy (Tambasco, Romoli et al. 2018). Therefore, the development of innovative PD treatment strategies is imperative.
In the process of repairing nerve damage and treating neurodegenerative diseases, microglia play a unique and crucial role. Microglia, which are immune cells in the central nervous system, are considered to be macrophages in the brain and one of the first responders to central nervous system injury. Following a brain injury, microglia become activated and undergo a rapid transformation from a resting to an active state (
Subhramanyam, Wang et al. 2019). Activated microglia secrete numerous cytokines, chemokines, growth factors, reactive oxygen species, proteases, excitatory amino acids, and more, which can impact the survival of neurons (Witcher, Bray et al. 2021). Due to the complexity of their products, activated microglia are a “double-edged sword” in neurodegenerative illnesses. Similar to peripheral macrophages, activated microglia can be categorized as either “bad” M1 pro-inflammatory (classical activation) or “good” M2 anti-inflammatory and repair (selective activation) types based on their released cytokines and functional status (Li, Yu et al. 2021). So, modulating microglial polarization from M1 to M2 has been widely recognized as an effective strategy for the treatment of Parkinson’s disease (PD) (Wang, Yuan et al. 2019).
“Metabolic reprogramming” describes the alterations in cellular metabolic processes that occur in response to changes in the external microenvironment, exhibiting distinct metabolic traits to furnish energy and essential biological compounds. In tumor cells, a preference for generating energy through glycolysis is observed even under oxygen-rich conditions, accompanied by suppressed oxidative phosphorylation. This phenomenon is commonly referred to as the Warburg effect (Bu, Chen et al. 2018). The reprogramming of glucose metabolism serves to fuel the rapid proliferation of tumor cells and the synthesis of other biomolecules, thereby conferring a growth advantage. Disrupting this metabolic reprogramming in tumors has been shown to exert anti-tumor effects (Gong, Li et al. 2022, Rushing, Tilley et al. 2022). Recent studies have revealed the presence of the Warburg effect in M1 pro-inflammatory microglia, macrophages, and other immune cells. Although glycolysis is less efficient than oxidative phosphorylation in ATP production, this shift enables M1-activated microglia to generate ATP more rapidly. This rapid ATP production meets the acute energy demands of cells during inflammatory responses and facilitates the production of cytokines and reactive oxygen species. In contrast, resting microglia and those exhibiting an M2 anti-inflammatory repair phenotype rely on oxidative phosphorylation to provide a substantial and sustained supply of energy for their normal physiological functions (Gimeno-Bayón, López-López et al. 2014). In the lipopolysaccharide (LPS)-induced acute lung injury mouse model, mouse lung tissue and abdominal macrophages demonstrated heightened glycolysis and decreased levels of oxidative phosphorylation. Administration of the glycolysis inhibitor 2-Deoxy-D-glucose (2-DG) or blockade of the mTOR/HIF-1α glycolytic pathway hindered macrophage NLRP3 activation, ultimately curbing inflammatory factor production and alleviating symptoms in mice with acute lung injury (Zhong, Liu et al. 2023).
Angelica sinensis, a traditional Chinese medicine, is widely utilized in clinical settings for its neuroprotective properties (Yang, Lin et al. 2023). Levistilide A (LA, CAS No. 88182-33-6) is a characteristic phthalide extracted from Angelica sinensis (Zhang, Yan et al. 2019). It has been observed that LA can hinder endothelial cell activation and the expression of inflammatory cytokines, as well as reduce NLRP3 expression in human umbilical vein endothelial cells and vasculitis rat vascular tissue (Guo, Sun et al. 2018). To our knowledge, the impact of LA on activated microglia remains unexplored. This study aims to investigate the potential effects of LA in mouse models of Parkinson’s disease (PD) induced by MPTP and LPS-stimulated microglia. Our findings indicate that LA can regulate glucose metabolism, modulate inflammatory responses, and exert neuroprotective effects.
Experimental Procedures
Animals
Twenty-two SPF C57BL/6N mice, all 8 weeks old, were acquired from Beijing Charles River Biotechnology Co. Ltd. The animals were housed in an environment with a controlled temperature of 24 ± 2℃ and a relative humidity of 35 ± 5%. They were provided with free access to food and water and were allowed a week of acclimation before the administration of MPTP. All experiments were approved by the Animal Care and Use Committee at Tianjin University of Traditional Chinese Medicine (Animal Research Ethics approval number: TCM-LAEC2022022).
Drug
LA (CAS No. 88182-33-6) was purchased from the Chinese National Institute for the Control of Pharmaceutical and Biological Products (Beijing, China). The purity was more than 98%, which was determined by HPLC.
Cell Culture
The BV2 murine microglial cell line was cultured in Dulbecco’s modified Eagle’s medium (DMEM, Gibco) supplemented with 10% heat-inactivated fetal bovine serum (Gibco), 100 μg/ml penicillin, and 100 μg/ml streptomycin (VivaCell). Primary microglia were derived from postnatal day 1-3 Wistar rat brains as described previously (Brás, Bravo et al. 2020). The entire forebrain was harvested from the rats after decapitation, digested with trypsin, and filtered through a 40 μm sieve to obtain a cell suspension. The cells were then cultured in T75 culture flasks for 14 days. After 14 days, the cells were purified on a shaker, and they could be used for subsequent experiments.
Cell Viability Assay, Detection of Nitric Oxide and Cytokines
The BV-2 microglia were seeded in 48-well plates at a density of 1.6×10⁵ cells per well, while the primary microglia were inoculated in 96-well plates at a density of 1×10⁵ cells per well. The microglia were pretreated with LA for 30 minutes before being treated with LPS and/or LA for 24 hours. Cell viability was determined using the CCK-8 assay. The supernatant from the cell cultures was used to measure the levels of NO and inflammatory factors. NO was detected using the Griess method according to the manufacturer’s instructions (Beyotime, S0021S). TNF-α and IL-6 were measured using commercial Elisa kits (RD, MTA00B and M6000B).
RNA Isolation and Quantitative PCR
BV-2 cells were seeded in 6-well plates (8×10
5 cells/Well). After treatment for 8 hours (for inflammatory factors) or 24 hours (for glycolysis-related enzymes), the mRNA expression was detected using quantitative PCR. RNA were extracted following the instructions (Progema, LS1040), and reverse transcribed to cDNA. qPCRs were performed in triplicate in a 10 µl reaction with SYBR Premix (ABI, A25742) with specific the primer sequences (
Table 1).
Flow Cytometry
BV-2 cells were seeded in 12-well plates (3×10⁵ cells/well). After 24 hours of LPS and/or LA treatment, the cells were washed and collected. To detect ROS, cells were incubated with DCFH probe (10 μM) for 1 hour in the dark. For the assessment of glucose uptake capacity, cells were treated with 2-NBDG (50 μM) for 1 hour. After another PBS wash, the levels of ROS and glucose uptake capacity were analyzed by flow cytometry.
EACR and OCR
To conduct an analysis of extracellular acidification rate (ECAR) and oxygen consumption rate (OCR), BV-2 cells (1×10⁴ cells per well) were examined using an XF-96 Extracellular Flux Analyzer (Agilent). The ECAR was evaluated in response to various stimuli, including 10mM glucose, 1µM oligomycin, and 50mM 2DG (all from Agilent, 103020-100). Additionally, ECAR was analyzed in response to 1.5µM oligomycin, 1µM FCCP, and 0.5 µM rotenone/antimycin A, following the manufacturer’s instructions.
The Effect of Conditioned Medium on Neurons
BV-2 cells were seeded in 48-well plates (1.6×10⁵ cells/well). After a 30-minute drug pretreatment, LPS and/or LA were added to the BV-2 cells and incubated for 24 hours. The supernatant of the culture medium was then collected. The culture medium of SH-SY5Y cells was replaced with the corresponding conditioned medium and incubated for another 24 hours. Cell viability was then assessed using the CCK-8 method.
Western Bloting
Cells were seeded in 6-well plates (8×10⁵ cells/well). The total protein, cytoplasmic and nuclear proteins were extracted after the cells were treated with LPS and/or LA for 1 h or 2 h. Western blot analysis was then performed using appropriate primary antibodies and horseradish peroxidase (HRP)-conjugated secondary antibodies, along with the ECL chemiluminescence kit (Millipore, WBKLS0100). ALL the primary antibodies were purchased from CST company: β-actin (3700S), NF-κB p65 (8242S), IκB-α (4812S), p-IκB-α (2859S), Lamin b1 (17416S), mTOR (29182S), AMPK (5831S), p-AMPK (2535S), TH (58844S), and Iba-1 (17198S).
MPTP-induced Mouse Parkinson Model
Mice were randomly assigned to three groups: Control (N=6), MPTP (N=8), and LA (N=8). After injecting 250 mg/kg of probenecid sodium intraperitoneally, MPTP (22 mg/kg) was administered for the first time 30 minutes later. To establish an acute MPTP mouse model, injections were given four times daily. LA, dissolved in sterile corn oil, was administered daily, starting the day before MPTP injection and continuing for 7 days, at a dose of 10 mg/kg once a day. In the Control and MPTP groups, mice received sterile corn oil injections according to their body weight and administered intraperitoneally.
Immunohistochemistry
Seven days post-administration, mice were anesthetized with pentobarbital sodium and perfused. Brain tissues were harvested. The entire brain tissue was fixed in 4% paraformaldehyde and dehydrated in sucrose solution. Frozen sections of mouse brain tissue were prepared, and coronal sections with a thickness of 40 μm from the striatum to the substantia nigra were selected for immunofluorescence staining. Brain tissue sections were perforated with PBS containing 0.3% Triton X-100, then blocked. Rabbit primary antibodies (TH, Iba-1, CST, 1:100) were added and incubated at 4°C overnight. After washing with PBS, goat anti-rabbit IgG labeled fluorescent secondary antibody (1:1000) was added and incubated for 1 hour at room temperature in the dark. Photographs were taken using a confocal fluorescence microscope with an excitation wavelength of 488 nm.
Statistical analysis
All experimental data underwent tests for homogeneity of variance and normality. The data were presented as mean ± standard deviation and analyzed using SPSS version 26.0. For comparisons between two groups, the t-test was employed, while ANOVA was utilized for comparisons involving multiple groups. A p-value less than 0.05 was considered statistically significant.
Results
LA Inhibits the Production of Inflammatory Cytokines NO, IL-6 and TNF-α in LPS-induced Microglia
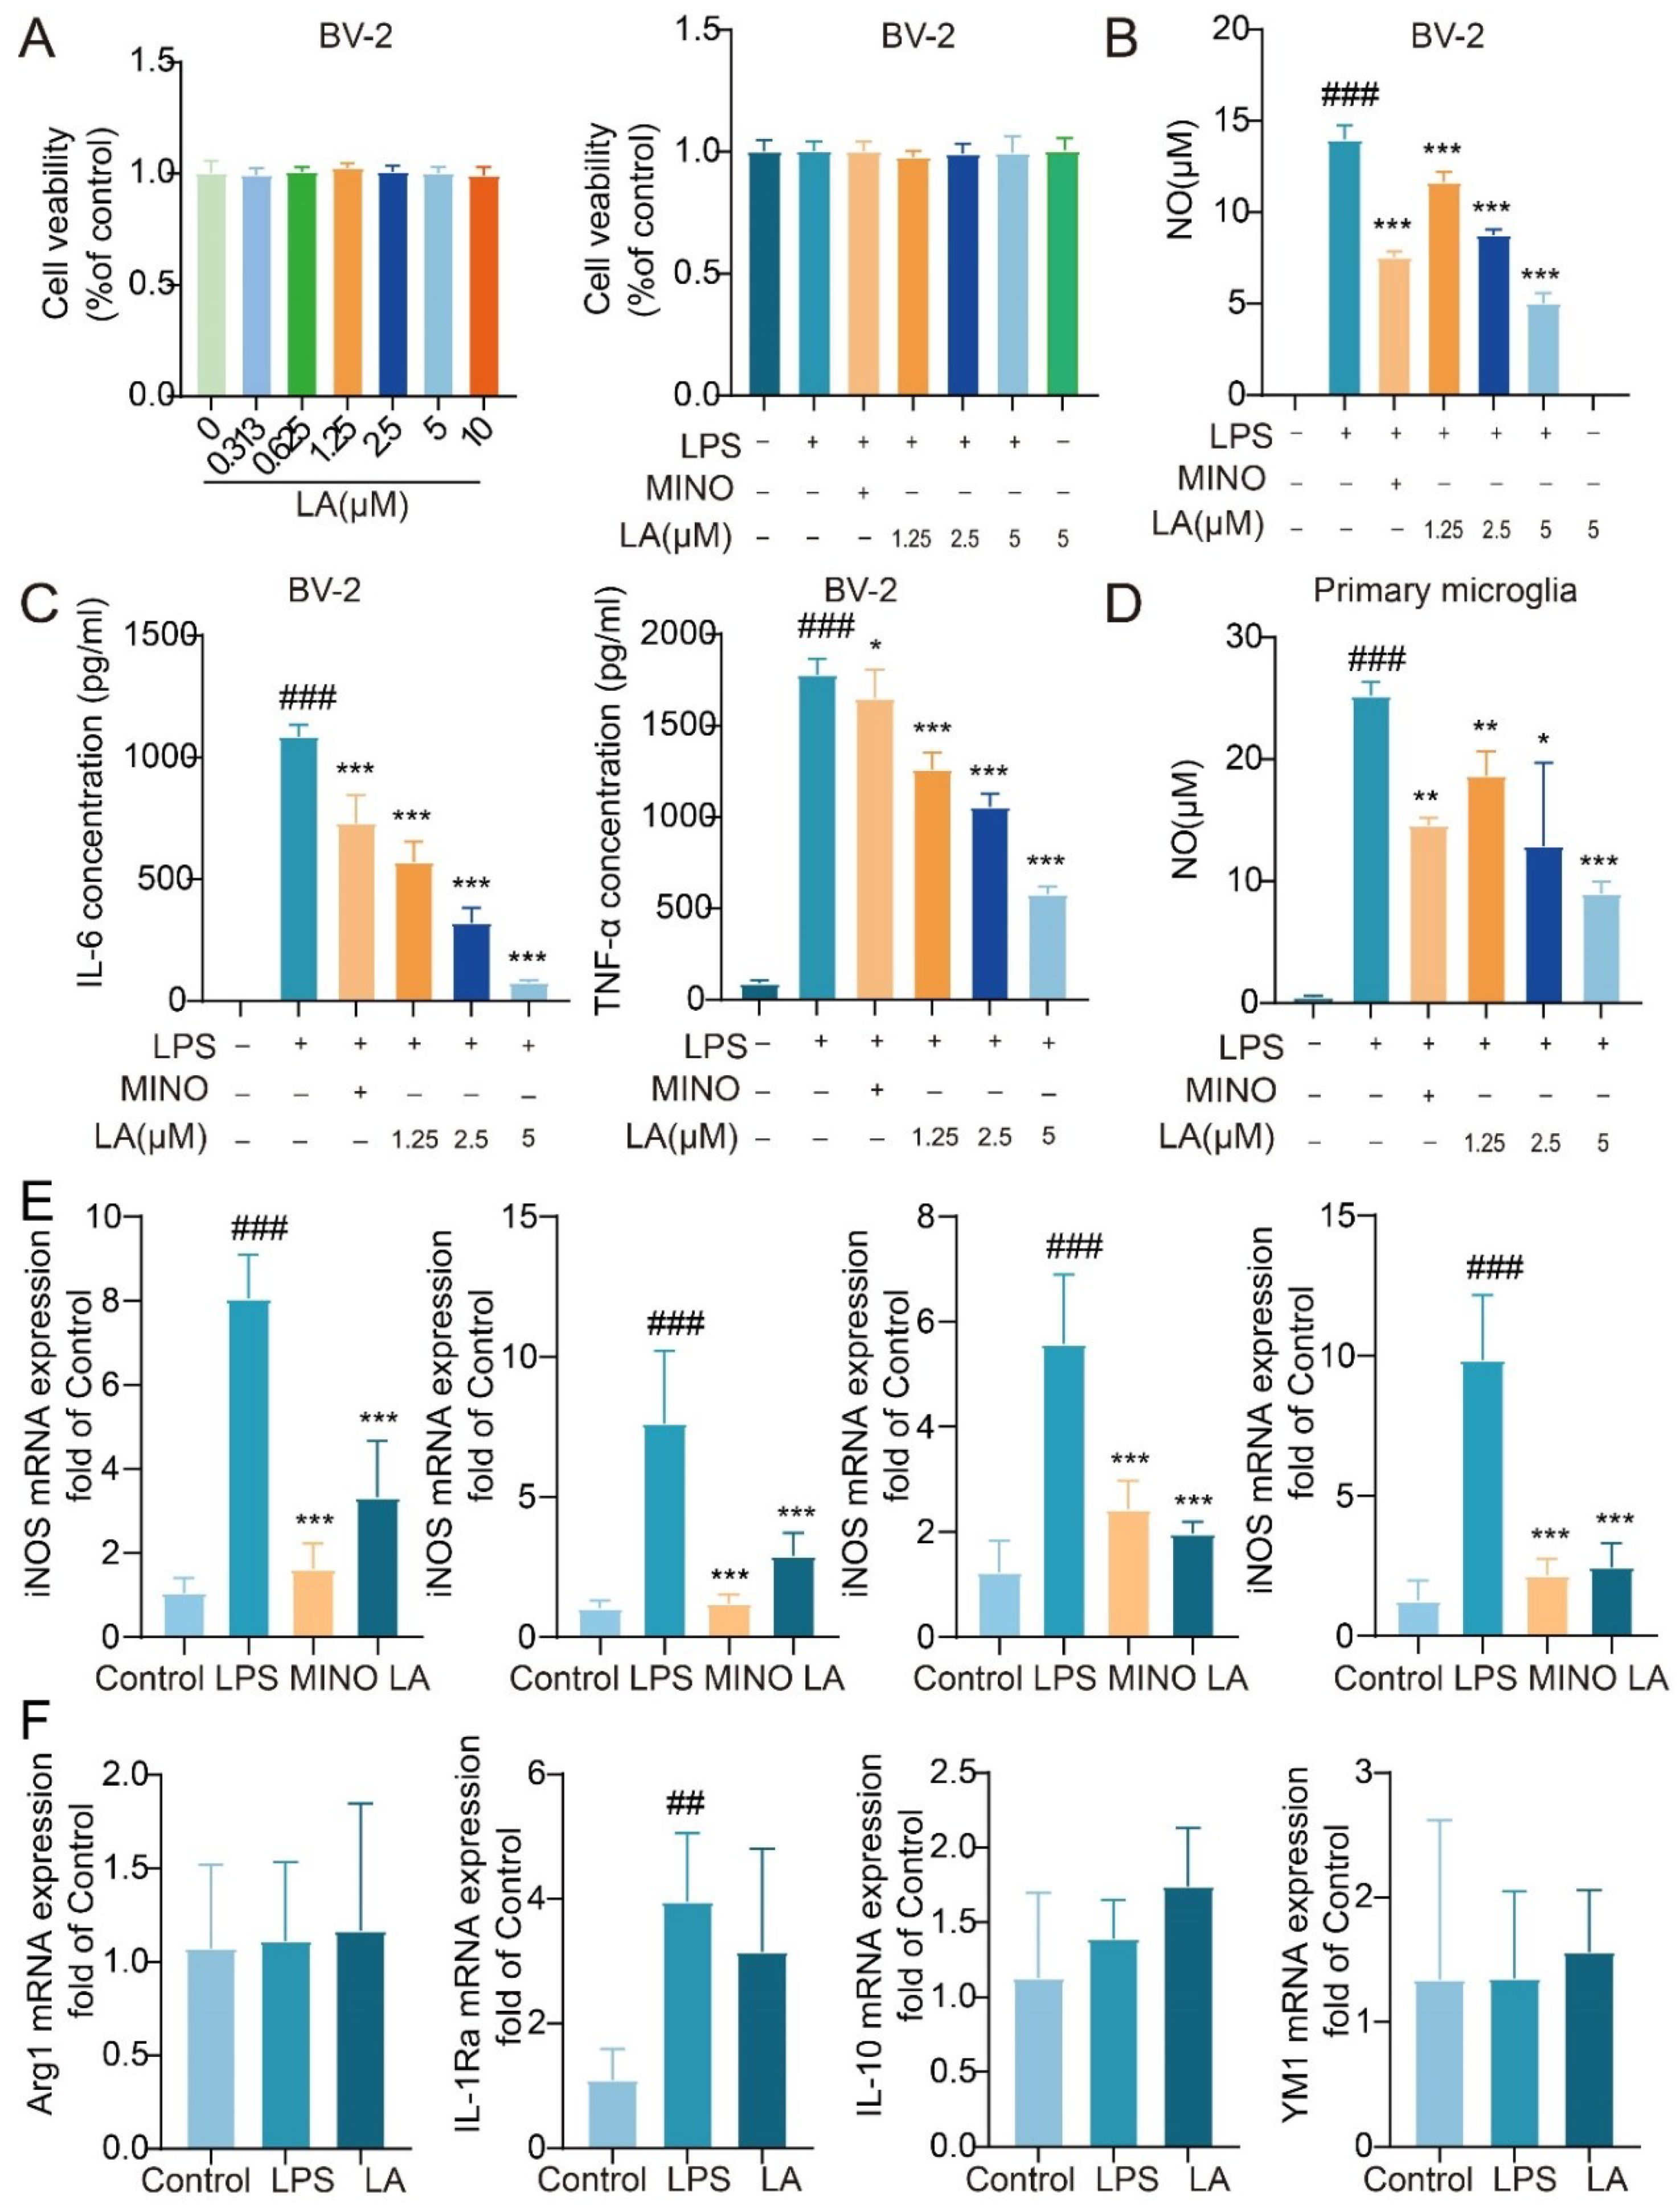
We initially aimed to investigate whether LA has the potential to inhibit the production of inflammatory cytokines in LPS-stimulated BV-2 cells. LA had no significant impact on BV-2 cell viability at concentrations ranging from 0 to 10 μM, whether in the presence or absence of LPS (P > 0.05,
Figure 1A). After stimulating BV-2 cells with LPS for 24 hours, the levels of pro-inflammatory cytokines, including NO, IL-6, and TNF-α, were significantly higher in the LPS group compared to the Control group (P < 0.001). The positive control drug, minocycline, significantly inhibited the production of these cytokines. LA also inhibited the production of these cytokines in a dose-dependent manner (
Figure 1B, C, P < 0.05). Similar results were observed in primary microglial cells (
Figure 1D), consistent with those observed in the BV-2 cell line.
To further confirm the impact of LA on LPS-induced inflammatory factors in microglia, we utilized real-time quantitative PCR to assess the expression of pro-inflammatory factors, including iNOS, IL-6, TNF-α, and IL-1β mRNA. The results (
Figure 1E) revealed that the expression of these pro-inflammatory factors induced by LPS was significantly reduced following treatment with the positive control drug minocycline or LA (P < 0.001). However, when compared to the LPS group, LA did not effectively inhibit the expression of the M2 anti-inflammatory factors Arg1, IL-1Ra, IL-10, and YM1 mRNA (
P > 0.05,
Figure 1F).
LA Inhibits LPS-induced ROS Production in Microglia
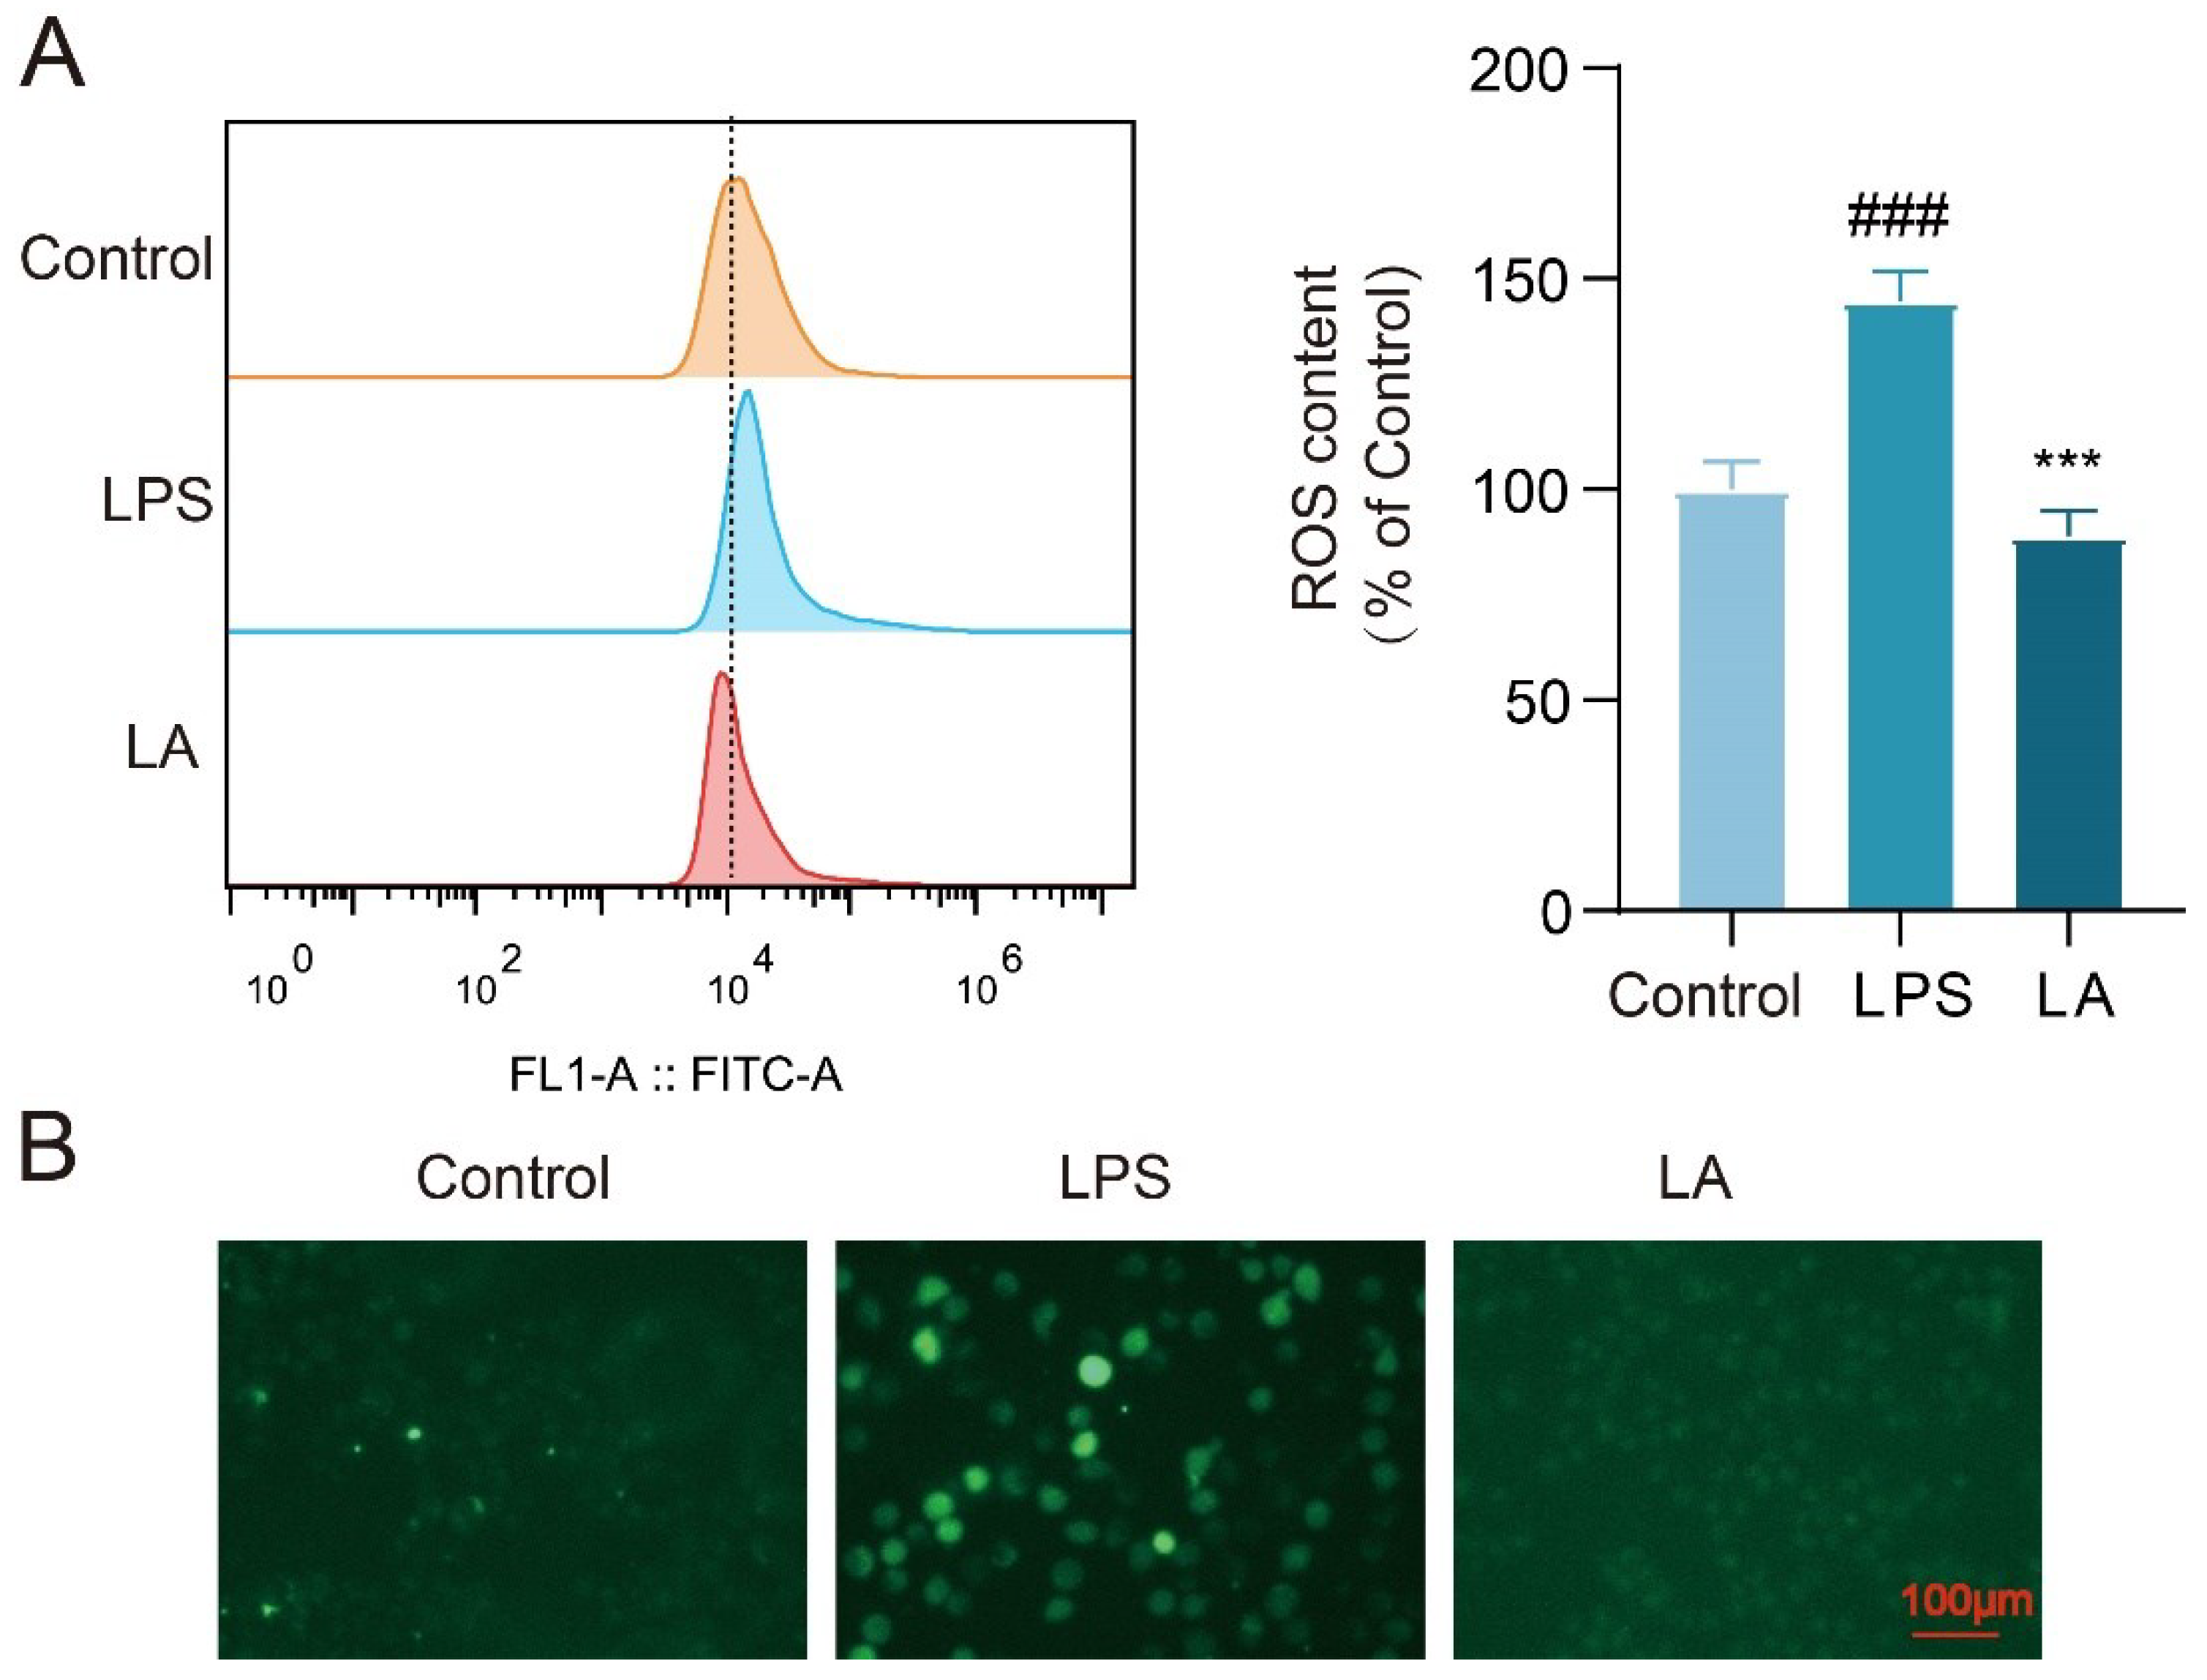
Upon microglia activation, a significant increase in reactive oxygen species (ROS) production occurs within the cells. Elevated levels of ROS have been associated with inflammation and neuronal cell death (Zhao, Zhang et al. 2021). To evaluate the intracellular ROS levels, we utilized the fluorescent probe DCFH-DA. Flow cytometry results (
Figure 2A) revealed that the intracellular ROS level was significantly higher in LPS-stimulated BV-2 cells after 24 hours compared to the Control group (P < 0.001). However, following LA treatment, the ROS level in the LA group was significantly reduced (P < 0.001). Fluorescence microscopy results supported these findings (
Figure 2B).
LA Inhibits Phosphorylation of IκB-α and Nuclear Translocation of NF-κB p65
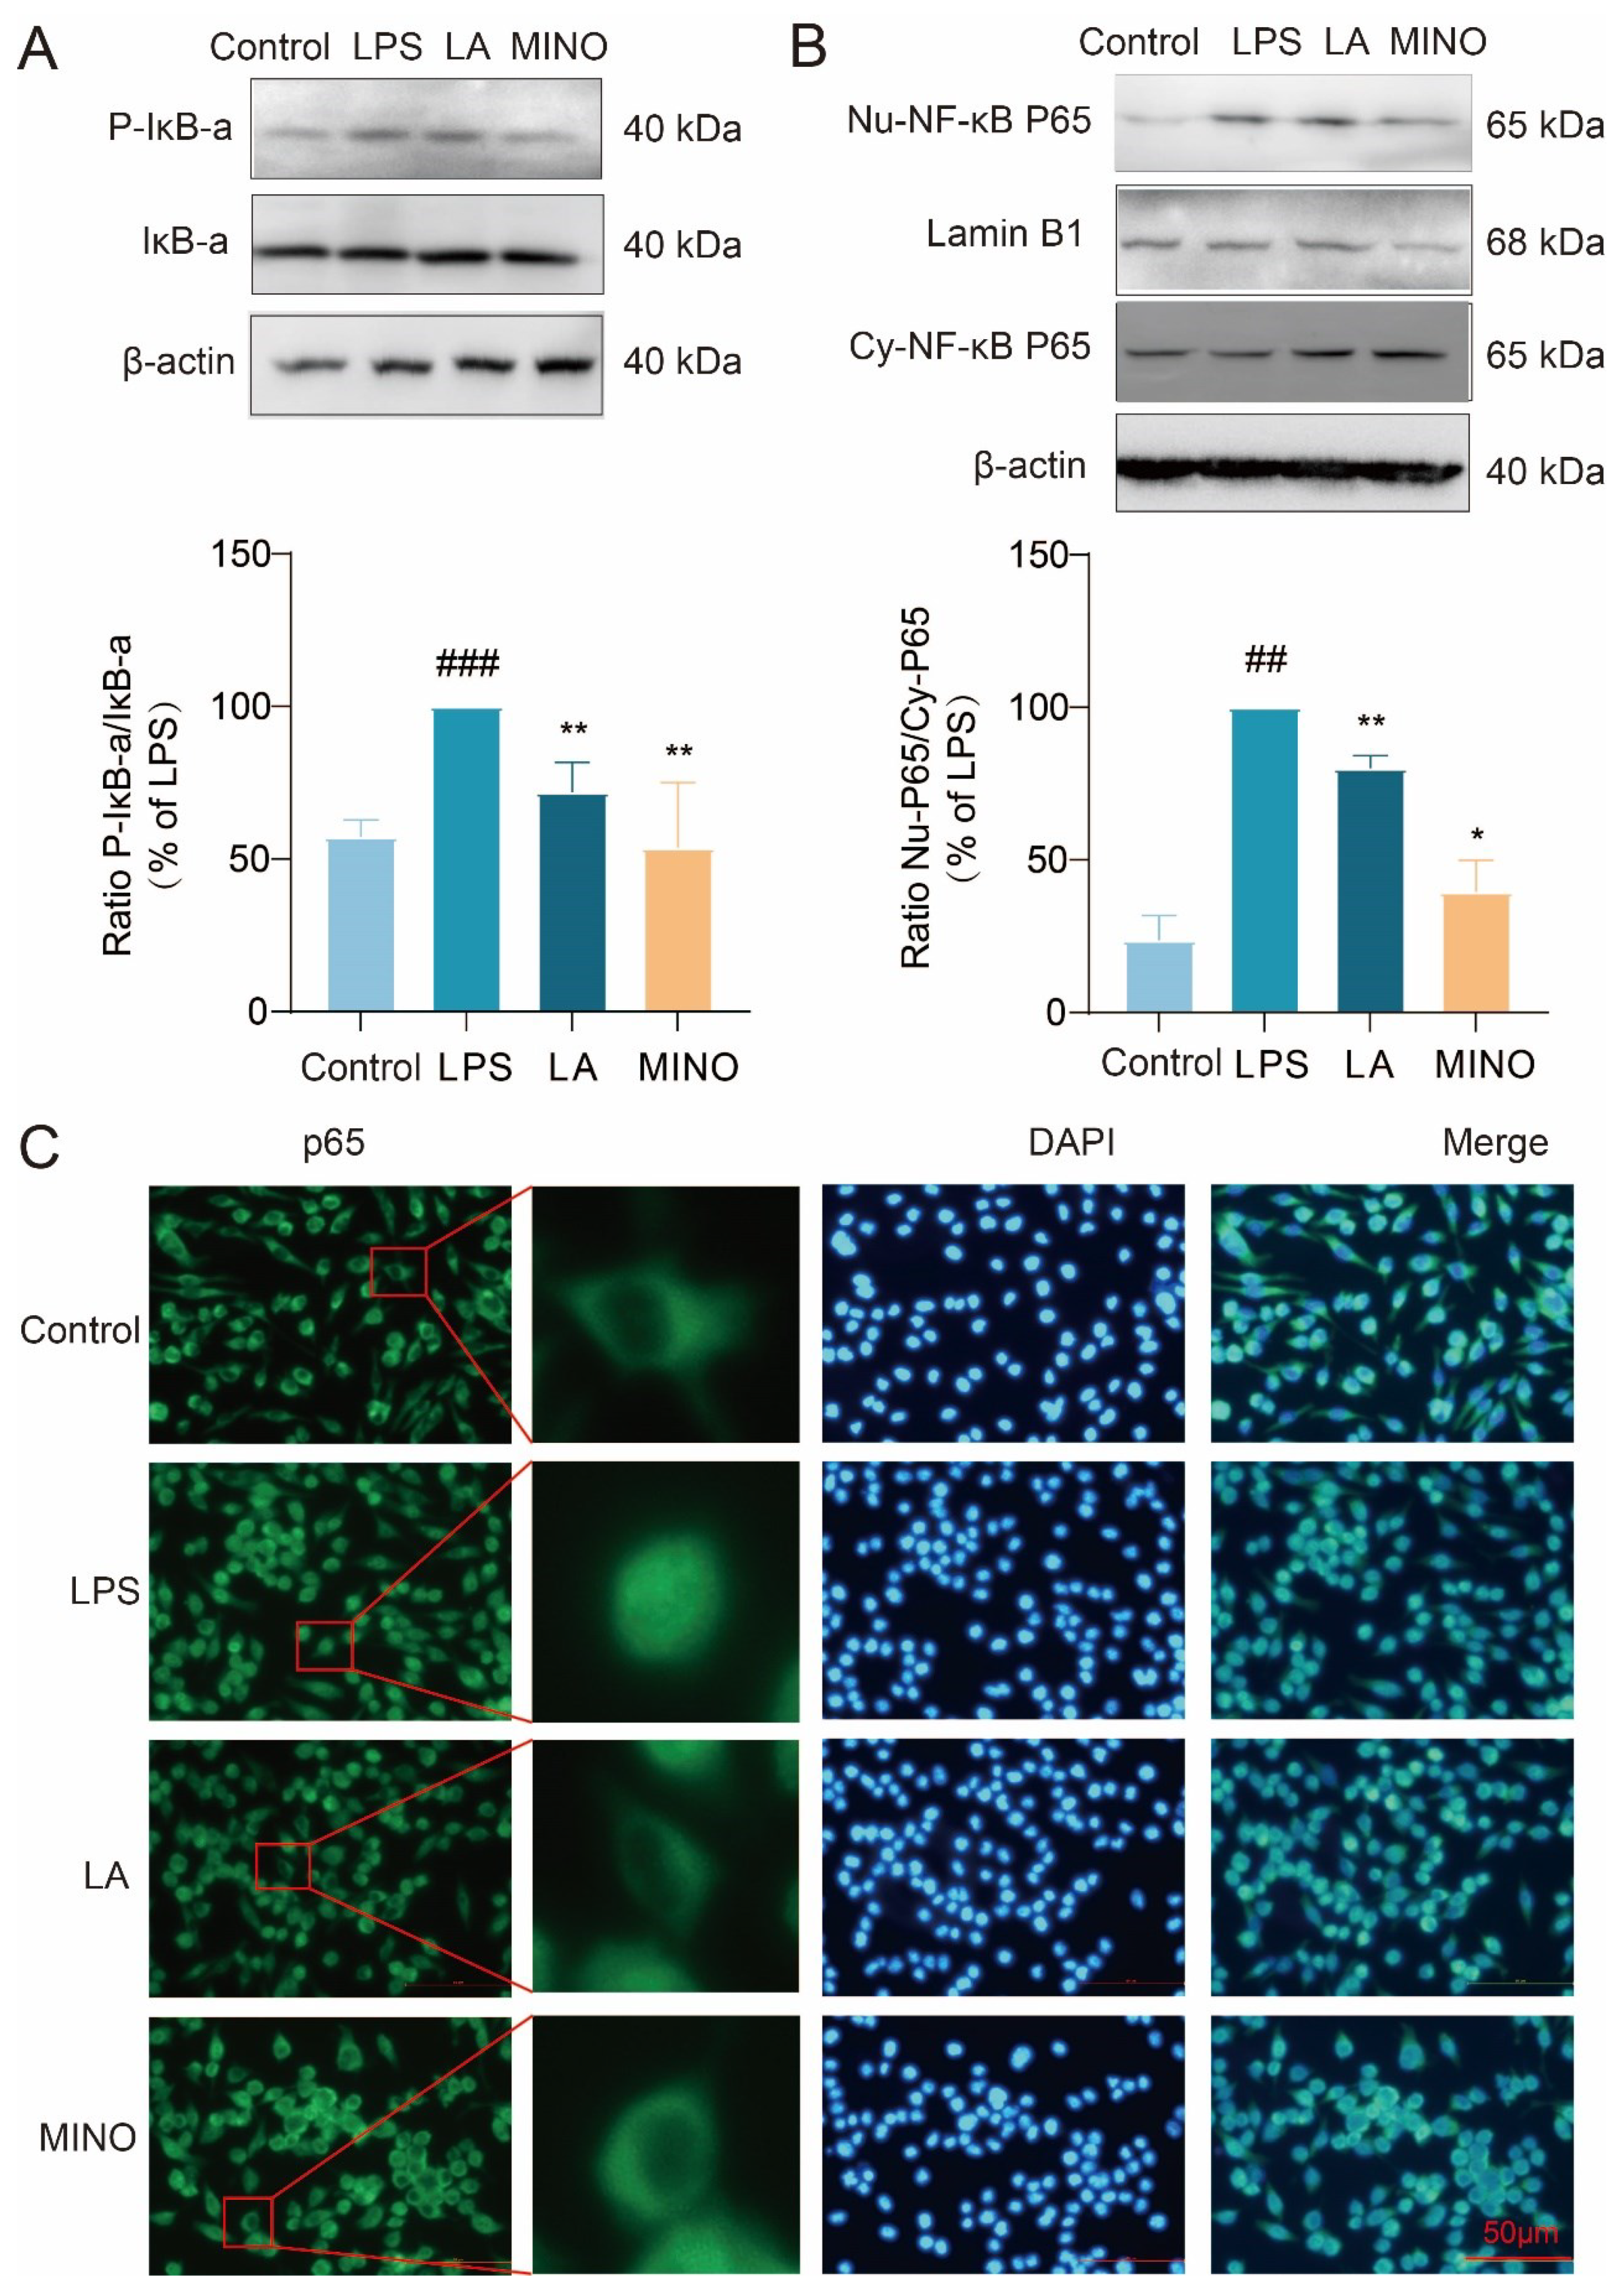
To investigate whether LA can hinder the nuclear translocation of NF-κB p65 and the phosphorylation of IκB-α, we utilized cellular immunofluorescence techniques and Western blot analysis. The Western blot results (
Figure 3A, B) revealed that, following LPS stimulation of BV-2 cells for 1 hour, LPS increased the phosphorylation level of IκB-α and caused the p65 subunit of NF-κB to translocate from the cytoplasm to the nucleus. Notably, LA hindered this translocation process. These findings were further validated by fluorescence microscopy images (
Figure 3C). Collectively, these results suggest that LA can inhibit the activation of NF-κB transcription factors.
LA’s Impact on the AMPK/mTOR Signaling Pathway
AMP-activated protein kinase (AMPK) serves as a crucial energy sensor in eukaryotic organisms, regulating cellular energy metabolism. mTOR, a downstream target of AMPK, is widely distributed in the cytoplasm of living organisms. AMPK activation leads to the inhibition of mTOR phosphorylation, both of which play a role in the regulation of cellular metabolic processes.
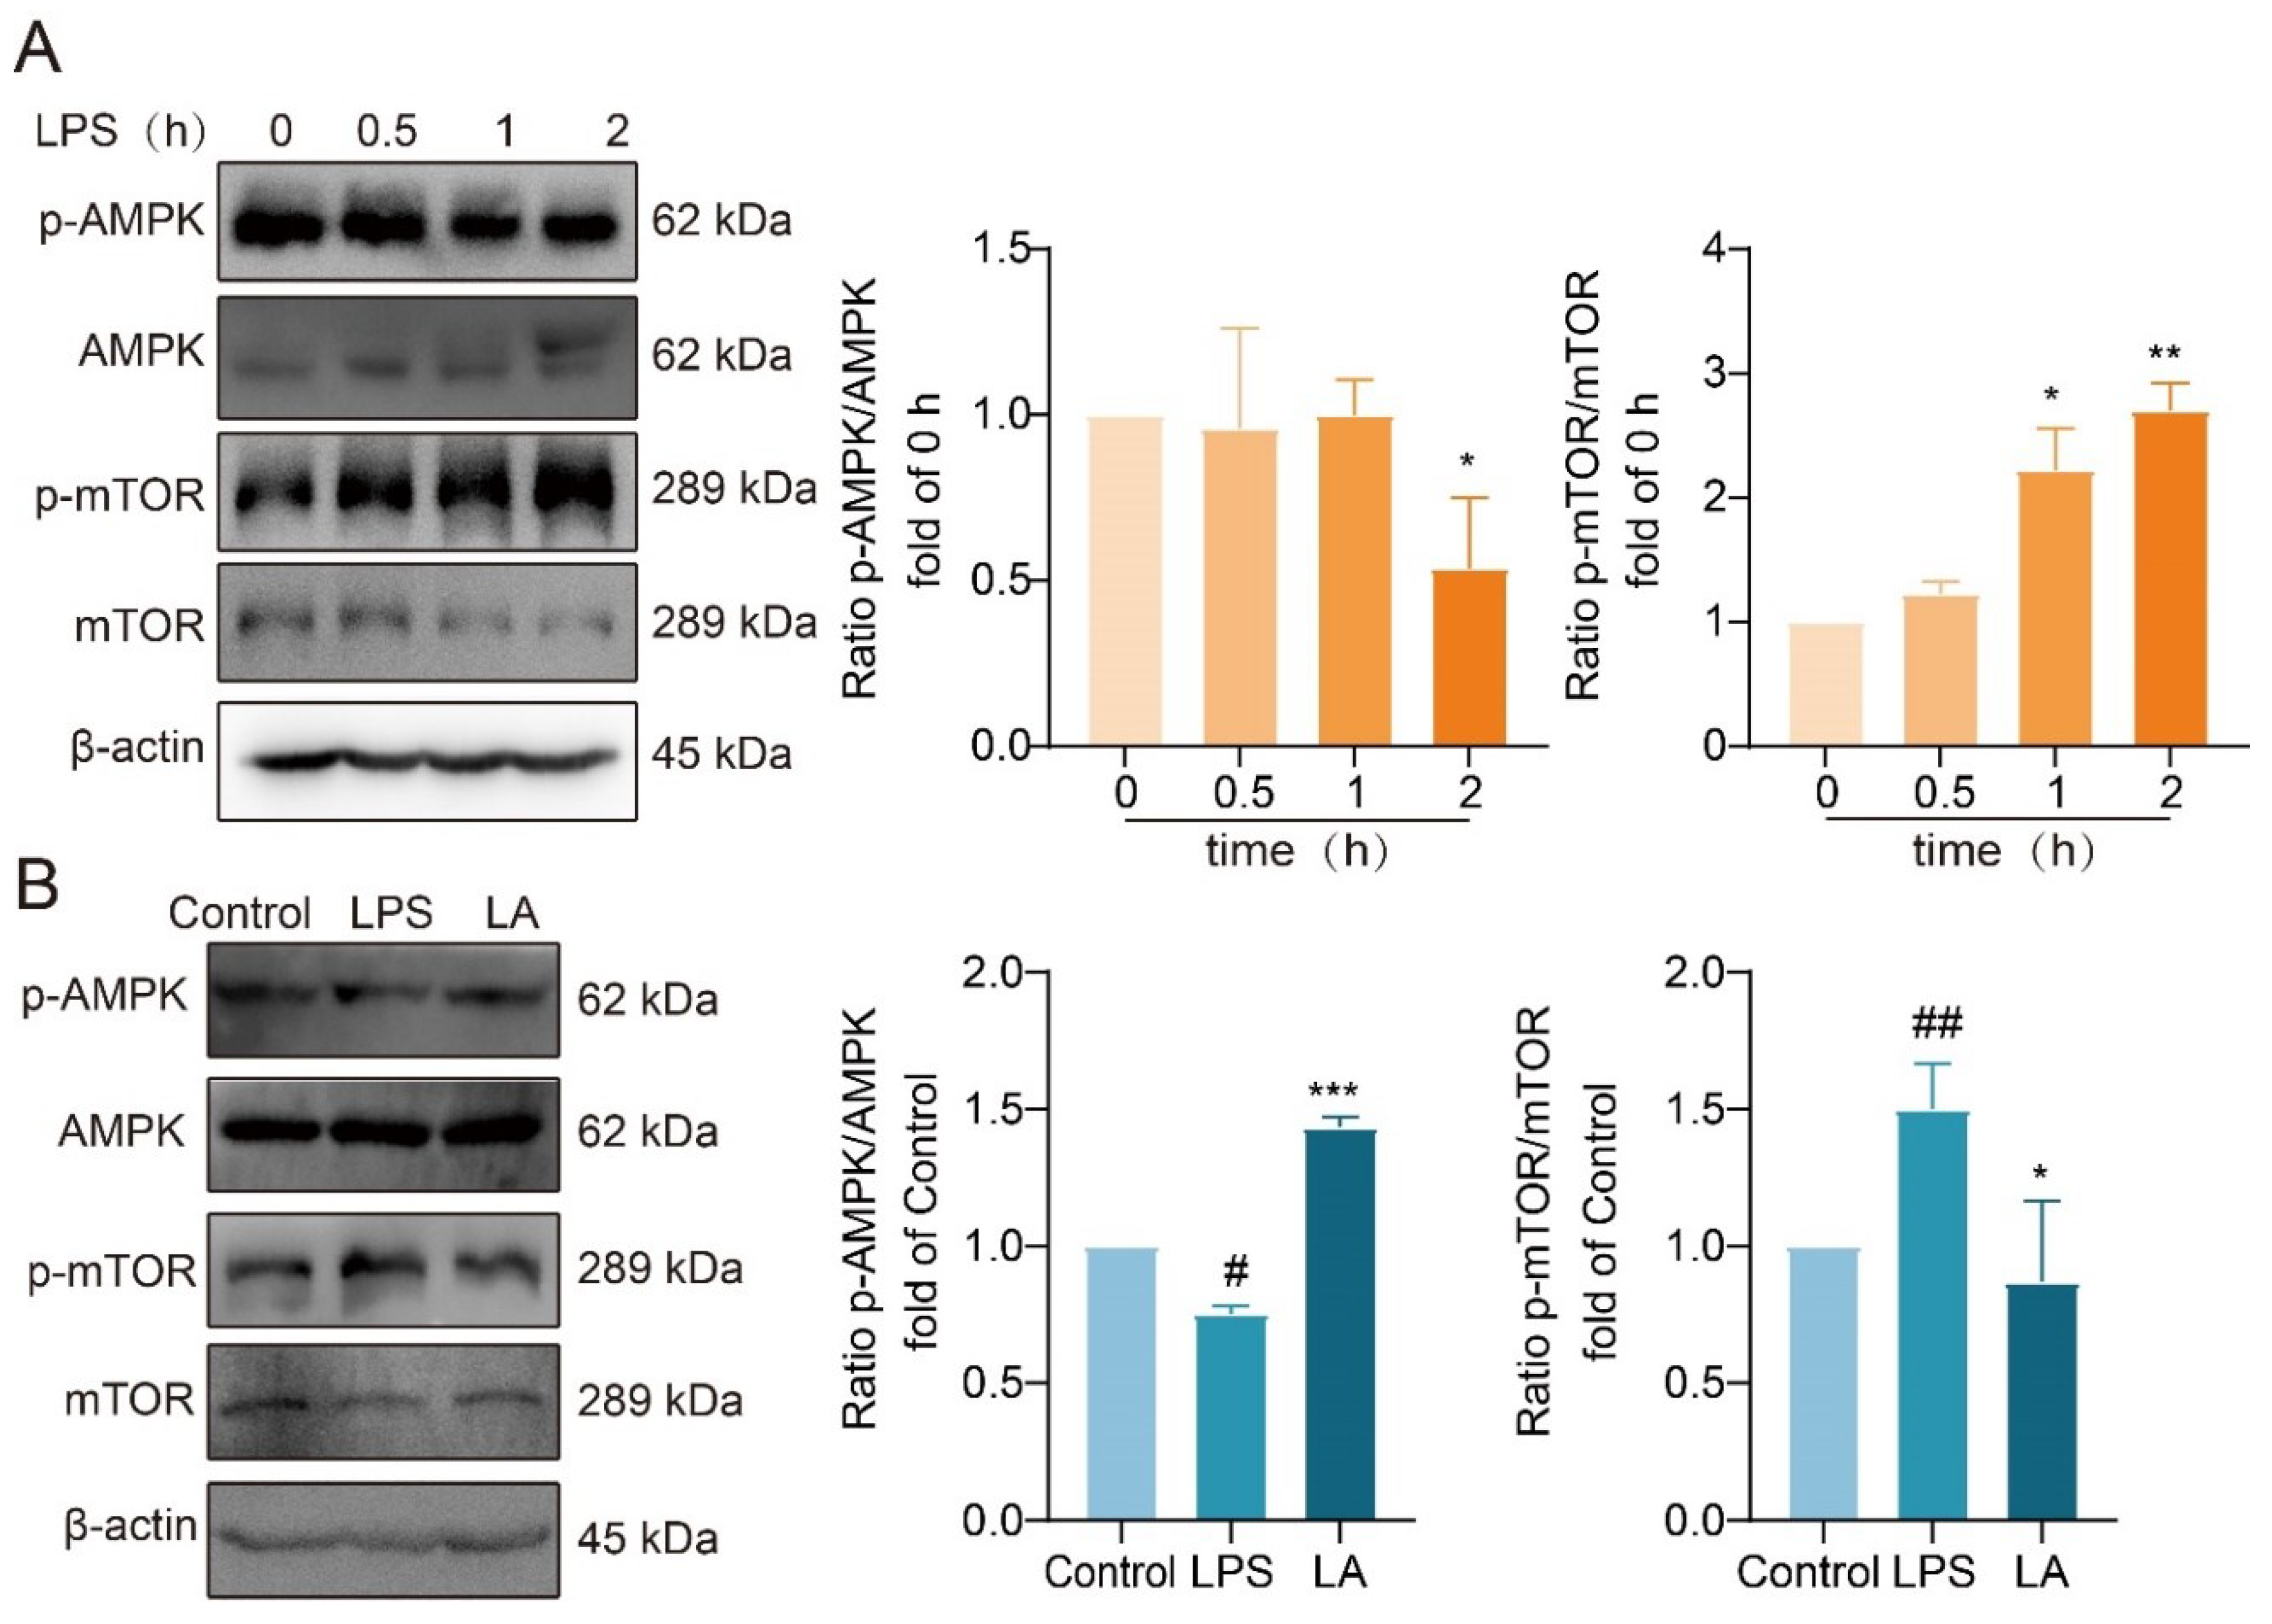
Western blot analysis revealed that following 2 hours of LPS stimulation, AMPK phosphorylation was significantly reduced, while mTOR phosphorylation was significantly increased (
Figure 6A). However, LA treatment reversed these effects, significantly increasing AMPK phosphorylation (
Figure 6B, P<0.001) and decreasing mTOR phosphorylation (
Figure 6B, P<0.05) compared to the LPS group. These findings suggested that LA has a regulatory effect on the AMPK/mTOR signaling pathway, potentially influencing cellular metabolism and energy balance.
The Conditioned Medium from LA-treated Microglia Protects Neurons
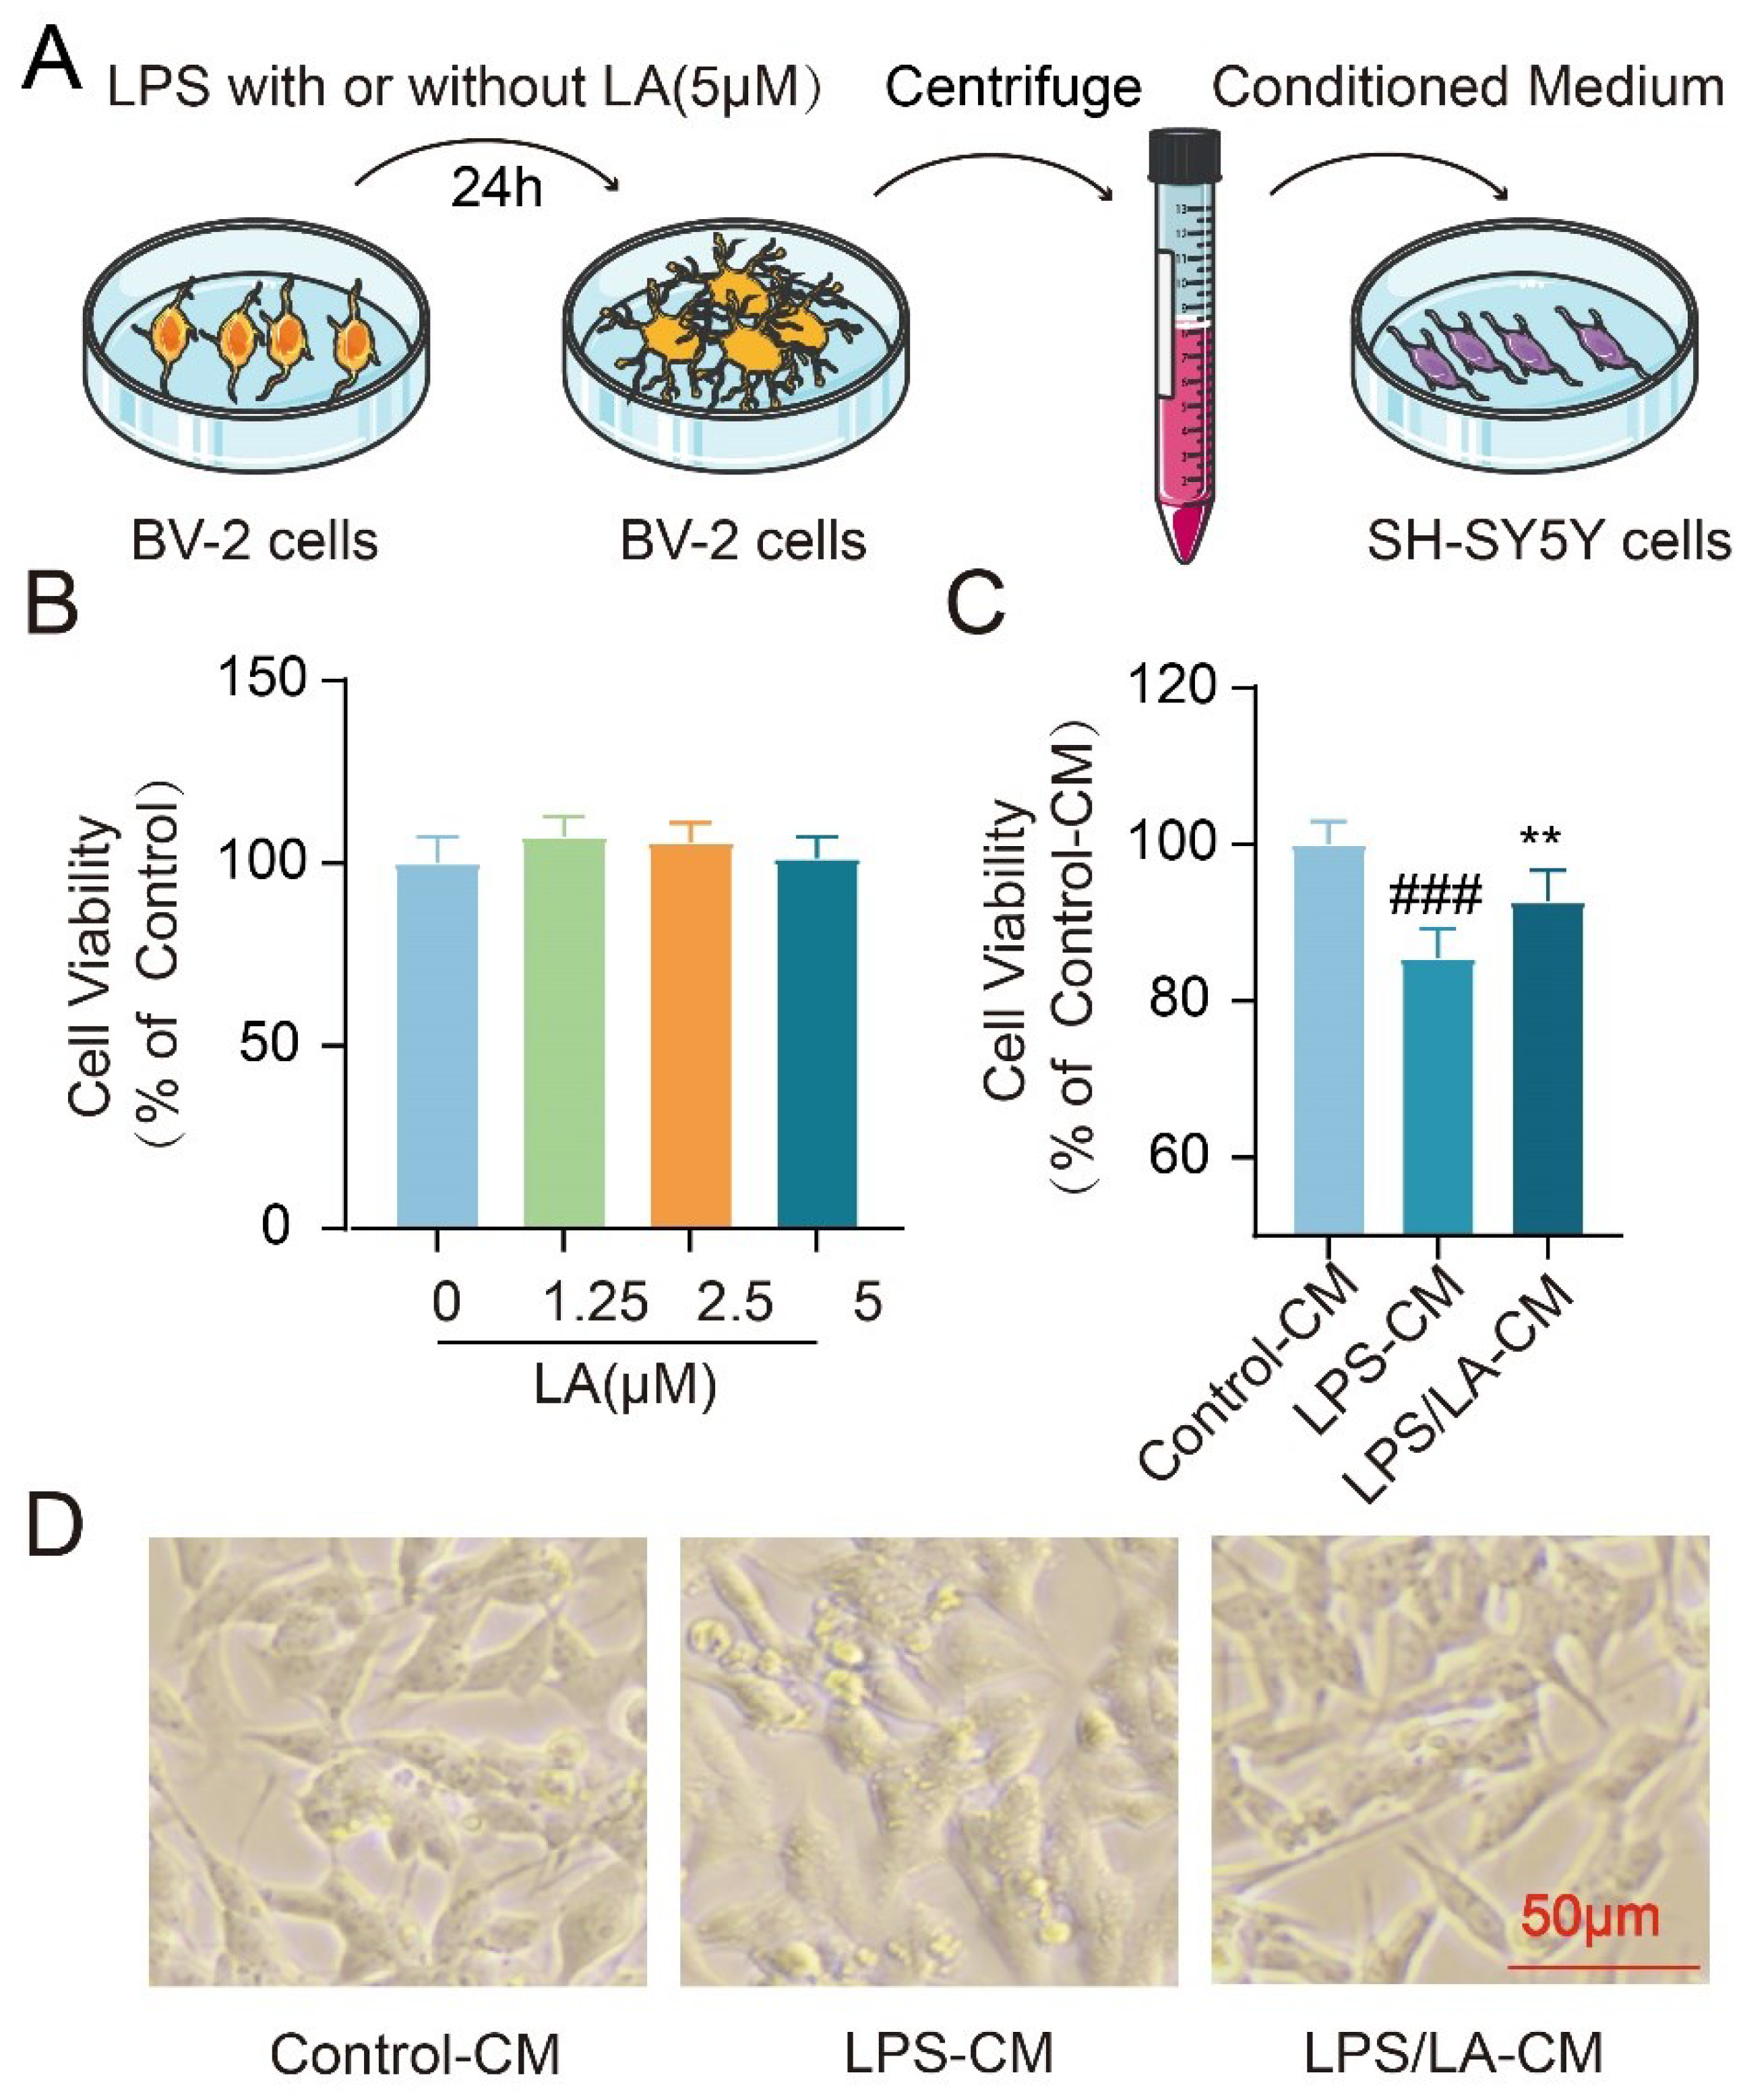
Inflammatory cytokines secreted by activated microglia have the potential to induce neuronal cell death. In our previous study, we observed that LA suppressed the LPS-induced production of these pro-inflammatory factors. This raises the question: Can this inhibitory effect of LA exert neuroprotective benefits? To address this, we examined the impact of the conditioned medium from BV-2 cells on the survival of neuroblastoma SH-SY5Y cells (
Figure 7A). Notably, LA alone, at concentrations ranging from 0-5 μM, did not affect the viability of SH-SY5Y cells (
Figure 7B). However, when compared to the conditioned medium from the LPS-stimulated group, the medium derived from microglia treated with both LPS and LA demonstrated a remarkable neuroprotective effect on SH-SY5Y cells (P < 0.01,
Figure 7C, D). These findings suggest that LA may confer neuroprotection by modulating microglia polarization.
LA Protects Dopaminergic Neurons and Inhibits Activation of Microglia in MPTP-induced Parkinson Mice
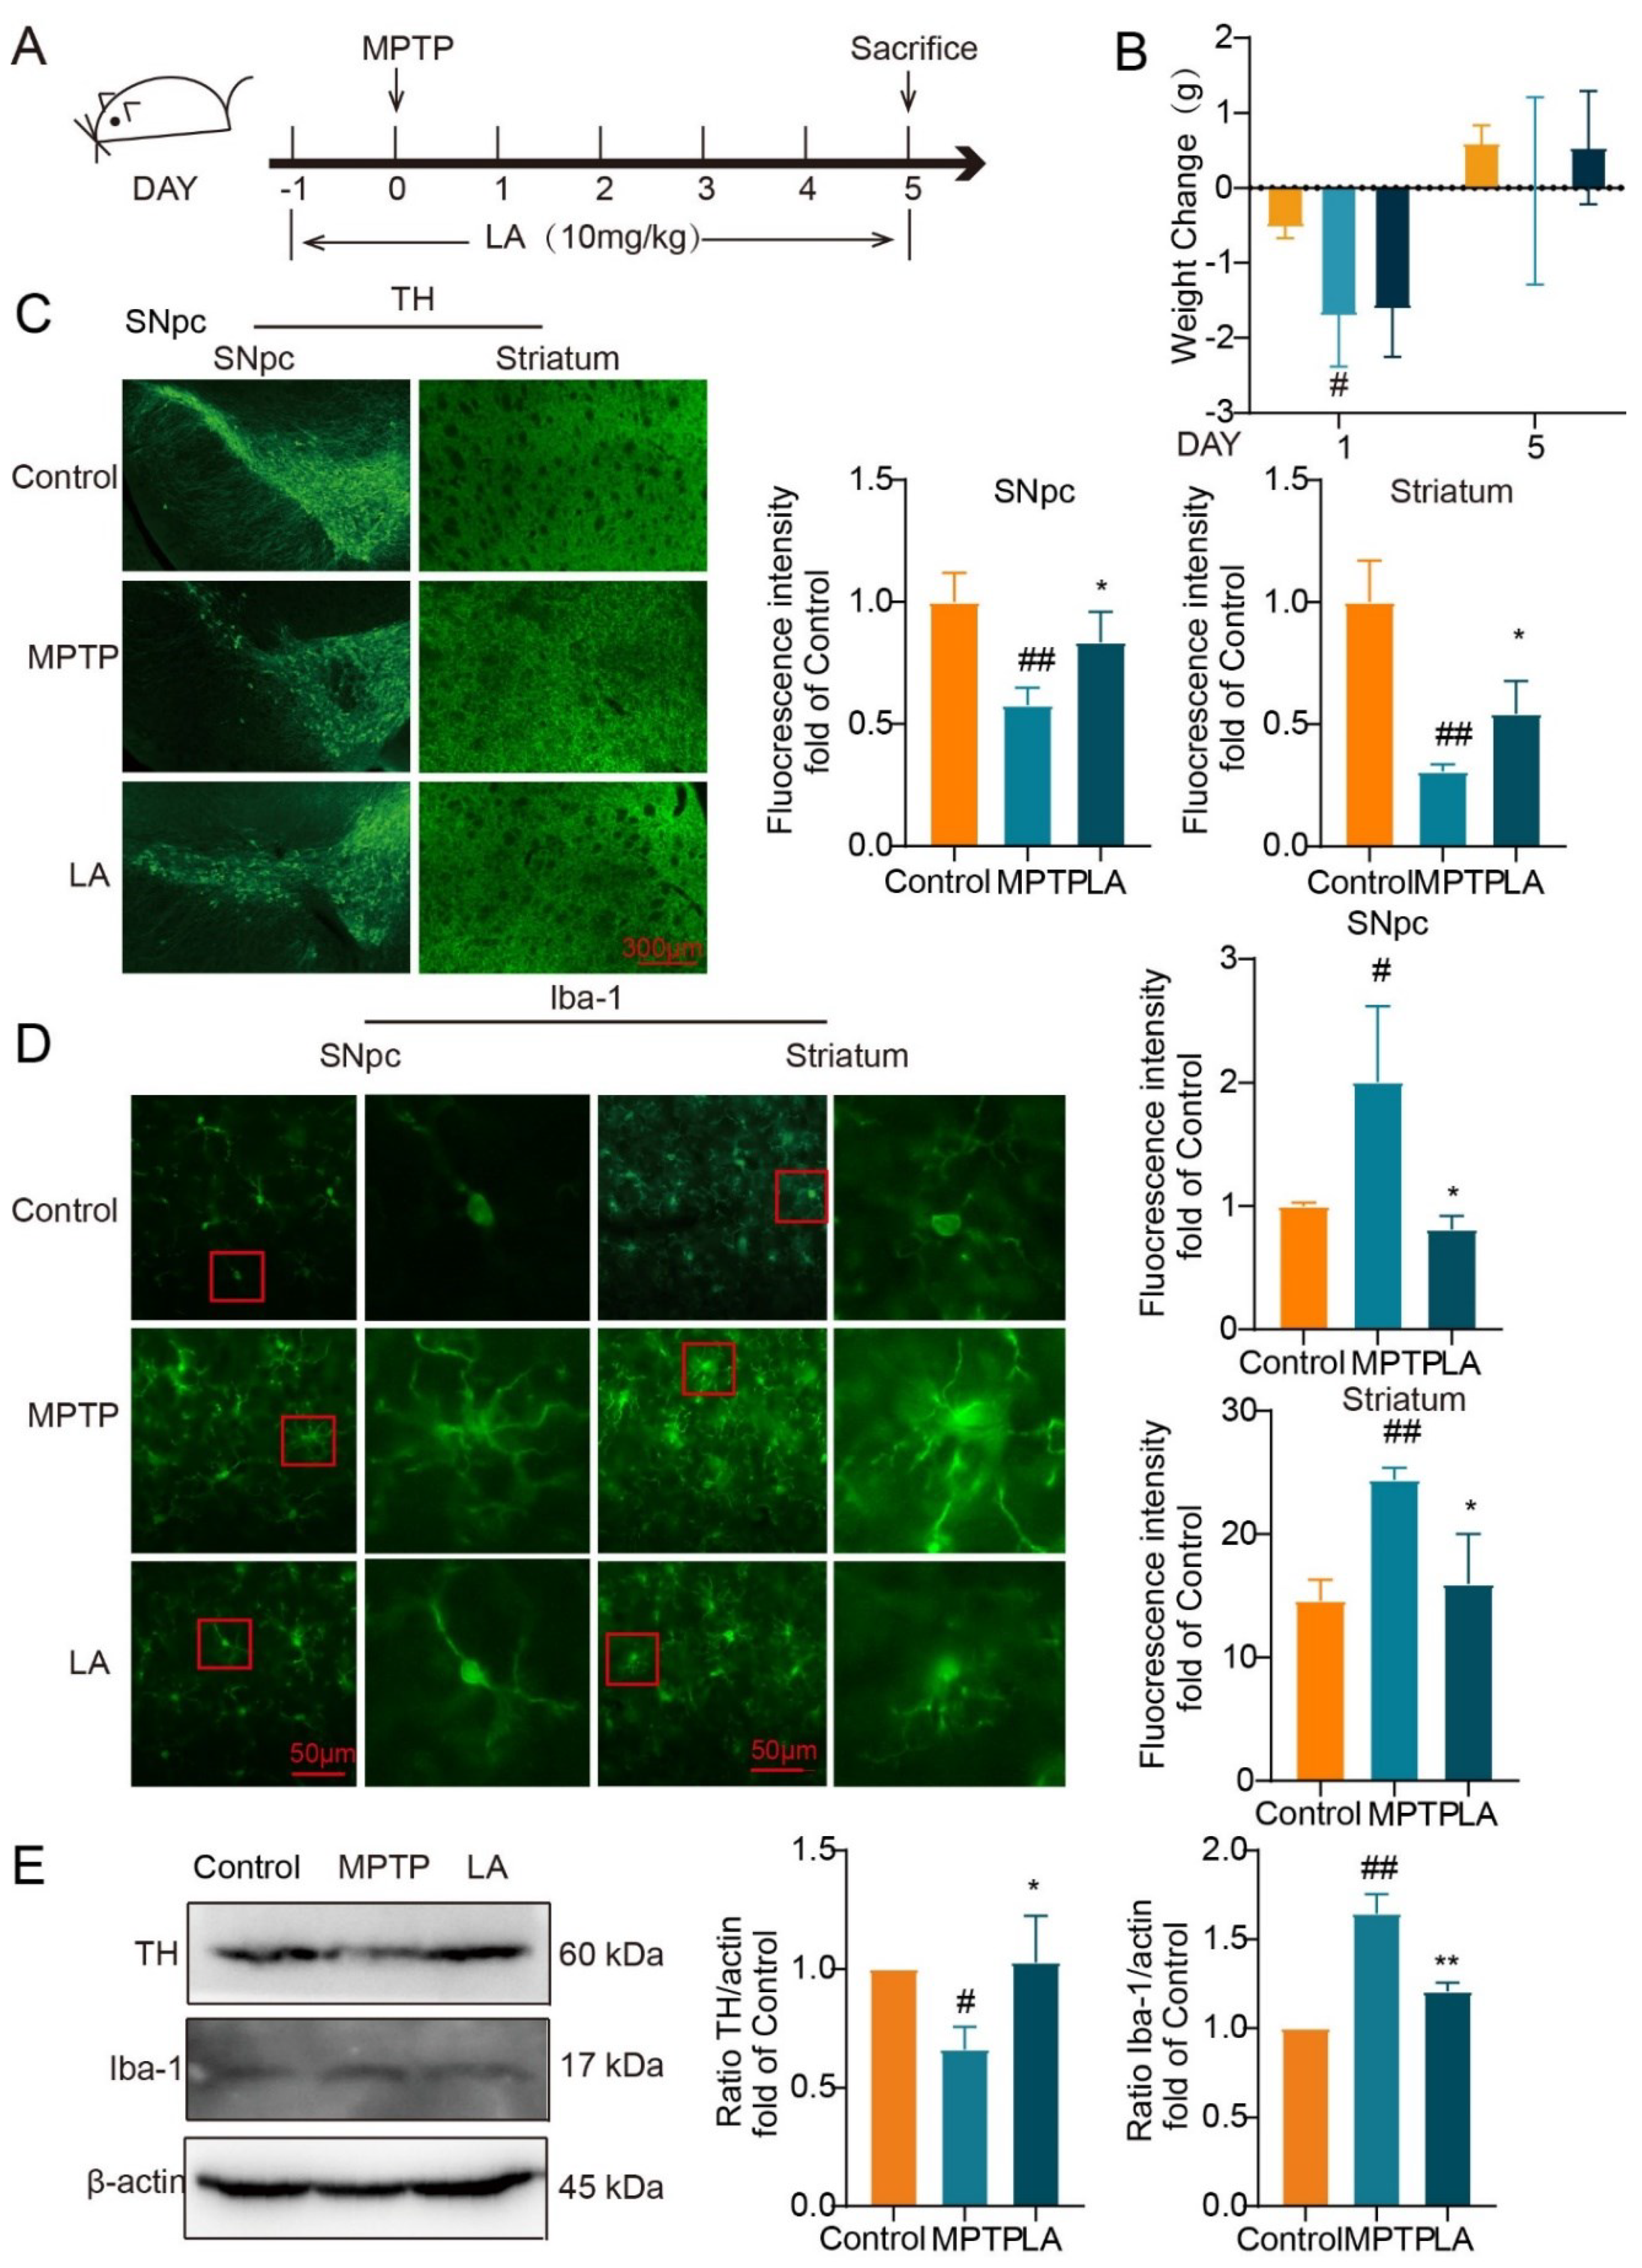
Subsequently, we utilized the MPTP-induced mouse model of Parkinson’s disease to assess the neuroprotective properties of LA in vivo (
Figure 8A). As shown in
Figure 8B, on the first day following MPTP administration, mice in the MPTP group exhibited a significant reduction in body weight (P < 0.05). While after 5 days, the body weight of the MPTP group and LA group had recovered.
To evaluate the impact of LA on dopaminergic neuronal damage and microglia activation in the MPTP-induced mouse model of PD, we examined the expression of tyrosine hydroxylase (TH), a specific marker for dopaminergic neurons, and Ionized calcium-binding adaptor molecule 1 (Iba-1), a sensitive marker for microglial activation. As demonstrated in
Figure 8C, TH expression was significantly reduced in the substantia nigra and striatum of Parkinson’s mice (P<0.05), while Iba-1 expression was elevated (
Figure 8D, P<0.05). Administration of LA reversed these effects, leading to increased TH expression (P<0.05) and decreased Iba-1 expression (P<0.01) in these brain regions. Western blot analysis further confirmed these findings (
Figure 8E).
Discussion
The research has shown that LA can control ROS levels and inhibit tumor cell growth, ultimately leading to tumor cell death (Yang, Zhang et al. 2017, Ding, Niu et al. 2019). Additionally, LA has been found to improve memory deficits and cognitive decline in APP/PS1 transgenic mice with Alzheimer’s disease by inhibiting the production of inflammatory factors and reducing the deposition of beta-amyloid protein (Qu, Guan et al. 2021). Furthermore, Angelica-derived LA has been reported to protect nerves and enhance the synthesis of the growth factor NGF (Noda, Shiga et al. 2019). These studies collectively demonstrate the pharmacological properties of LA, including its anti-tumor, anti-inflammatory, neuroprotective, and other beneficial effects. However, the impact of LA on activated microglia remains unexplored.
Parkinson’s disease (PD) is a complex neurodegenerative disorder associated with a depletion of dopamine (Simon, Tanner et al. 2020). Currently, levodopa, dopamine agonists, and inhibitors of dopamine-degrading enzymes are commonly used as symptomatic treatments for PD. Nevertheless, these therapeutic strategies possess several limitations, including a limited long-term efficacy and an inability to halt or reverse the progression of the disease (Mor, Sohrabi et al. 2020).
Microglia, in their physiological state, play a crucial role in maintaining the brain’s internal environment, development, and cognitive functions (Nayak, Roth et al. 2014). A remarkable feature of microglia is their sensitivity to external stimuli, as changes in various microenvironmental factors can prompt rapid activation (Wolf, Boddeke et al. 2017). Activated microglia can be categorized as either M1 pro-inflammatory or M2 anti-inflammatory types. While this classification may simplify the diversity of microglia, it remains a valid concept, and numerous studies have employed this classification to investigate new therapeutic strategies. M1 microglia are capable of releasing a large number of damaging pro-inflammatory mediators, such as IL-1β, TNF-α, IL-6, and NO, accompanied by mitochondrial dysfunction, which promotes cellular oxidative stress, elevates the level of ROS, and directly contributes to neuronal apoptosis and exacerbates local inflammation(Zusso, Lunardi et al. 2019, Liao, Wu et al. 2020). On the other hand, M2 microglia display an anti-inflammatory and reparative phenotype, producing anti-inflammatory, trophic, and tissue-repair-promoting factors (Block and Hong 2005). They also remove cellular debris and phagocytose neutrophils entering the brain, protecting neurons and promoting the migration of neural stem cells to ischemic zones to mitigate brain damage (Neumann, Sauerzweig et al. 2008). In the pathology of Parkinson’s disease (PD), microglia-mediated neuroinflammation plays a pivotal role and is a primary mechanism leading to the death of dopaminergic neurons. Therefore, the inhibition of microglia activation represents a potential therapeutic approach for PD, aiming to reduce dopaminergic neuron death (Chen, Mao et al. 2021). In our study, notably, LA has been shown to inhibit the release of inflammatory cytokines, ROS production, and NF-κB p65 nuclear transfer, exhibiting neuroprotective effects both in vivo and in vitro. Interestingly, LA does not hinder the expression of anti-inflammatory cytokines.
Recent research has demonstrated the crucial role of metabolic reprogramming in the phenotypic transformation of microglia. In M1 microglia, the metabolic mode shifts from oxidative phosphorylation to glycolysis. Although glycolysis does not generate as much ATP as oxidative phosphorylation, it produces ATP rapidly, meeting the heightened metabolic demands of microglial cell growth during inflammatory states, as well as supporting the production of cytokines and ROS. This rapid ATP production allows M1 microglia to effectively respond to inflammatory challenges and propagate the immune response (Korshoj and Kielian 2021). In a mouse model of perioperative neurocognitive impairment, it was observed that the hippocampus of animals in the surgical group exhibited altered microglial activation and an upregulation of M1 markers. Furthermore, surgical trauma was associated with a metabolic shift from oxidative phosphorylation to glycolysis in the hippocampus. In contrast, the pharmacological inhibition of glycolysis using 2-DG effectively mitigated the microglia M1 phenotype and the expression of pro-inflammatory mediators. This intervention also improved hippocampus-dependent cognitive functions, indicating a potential therapeutic approach for perioperative neurocognitive impairment (Luo, Wang et al. 2021).
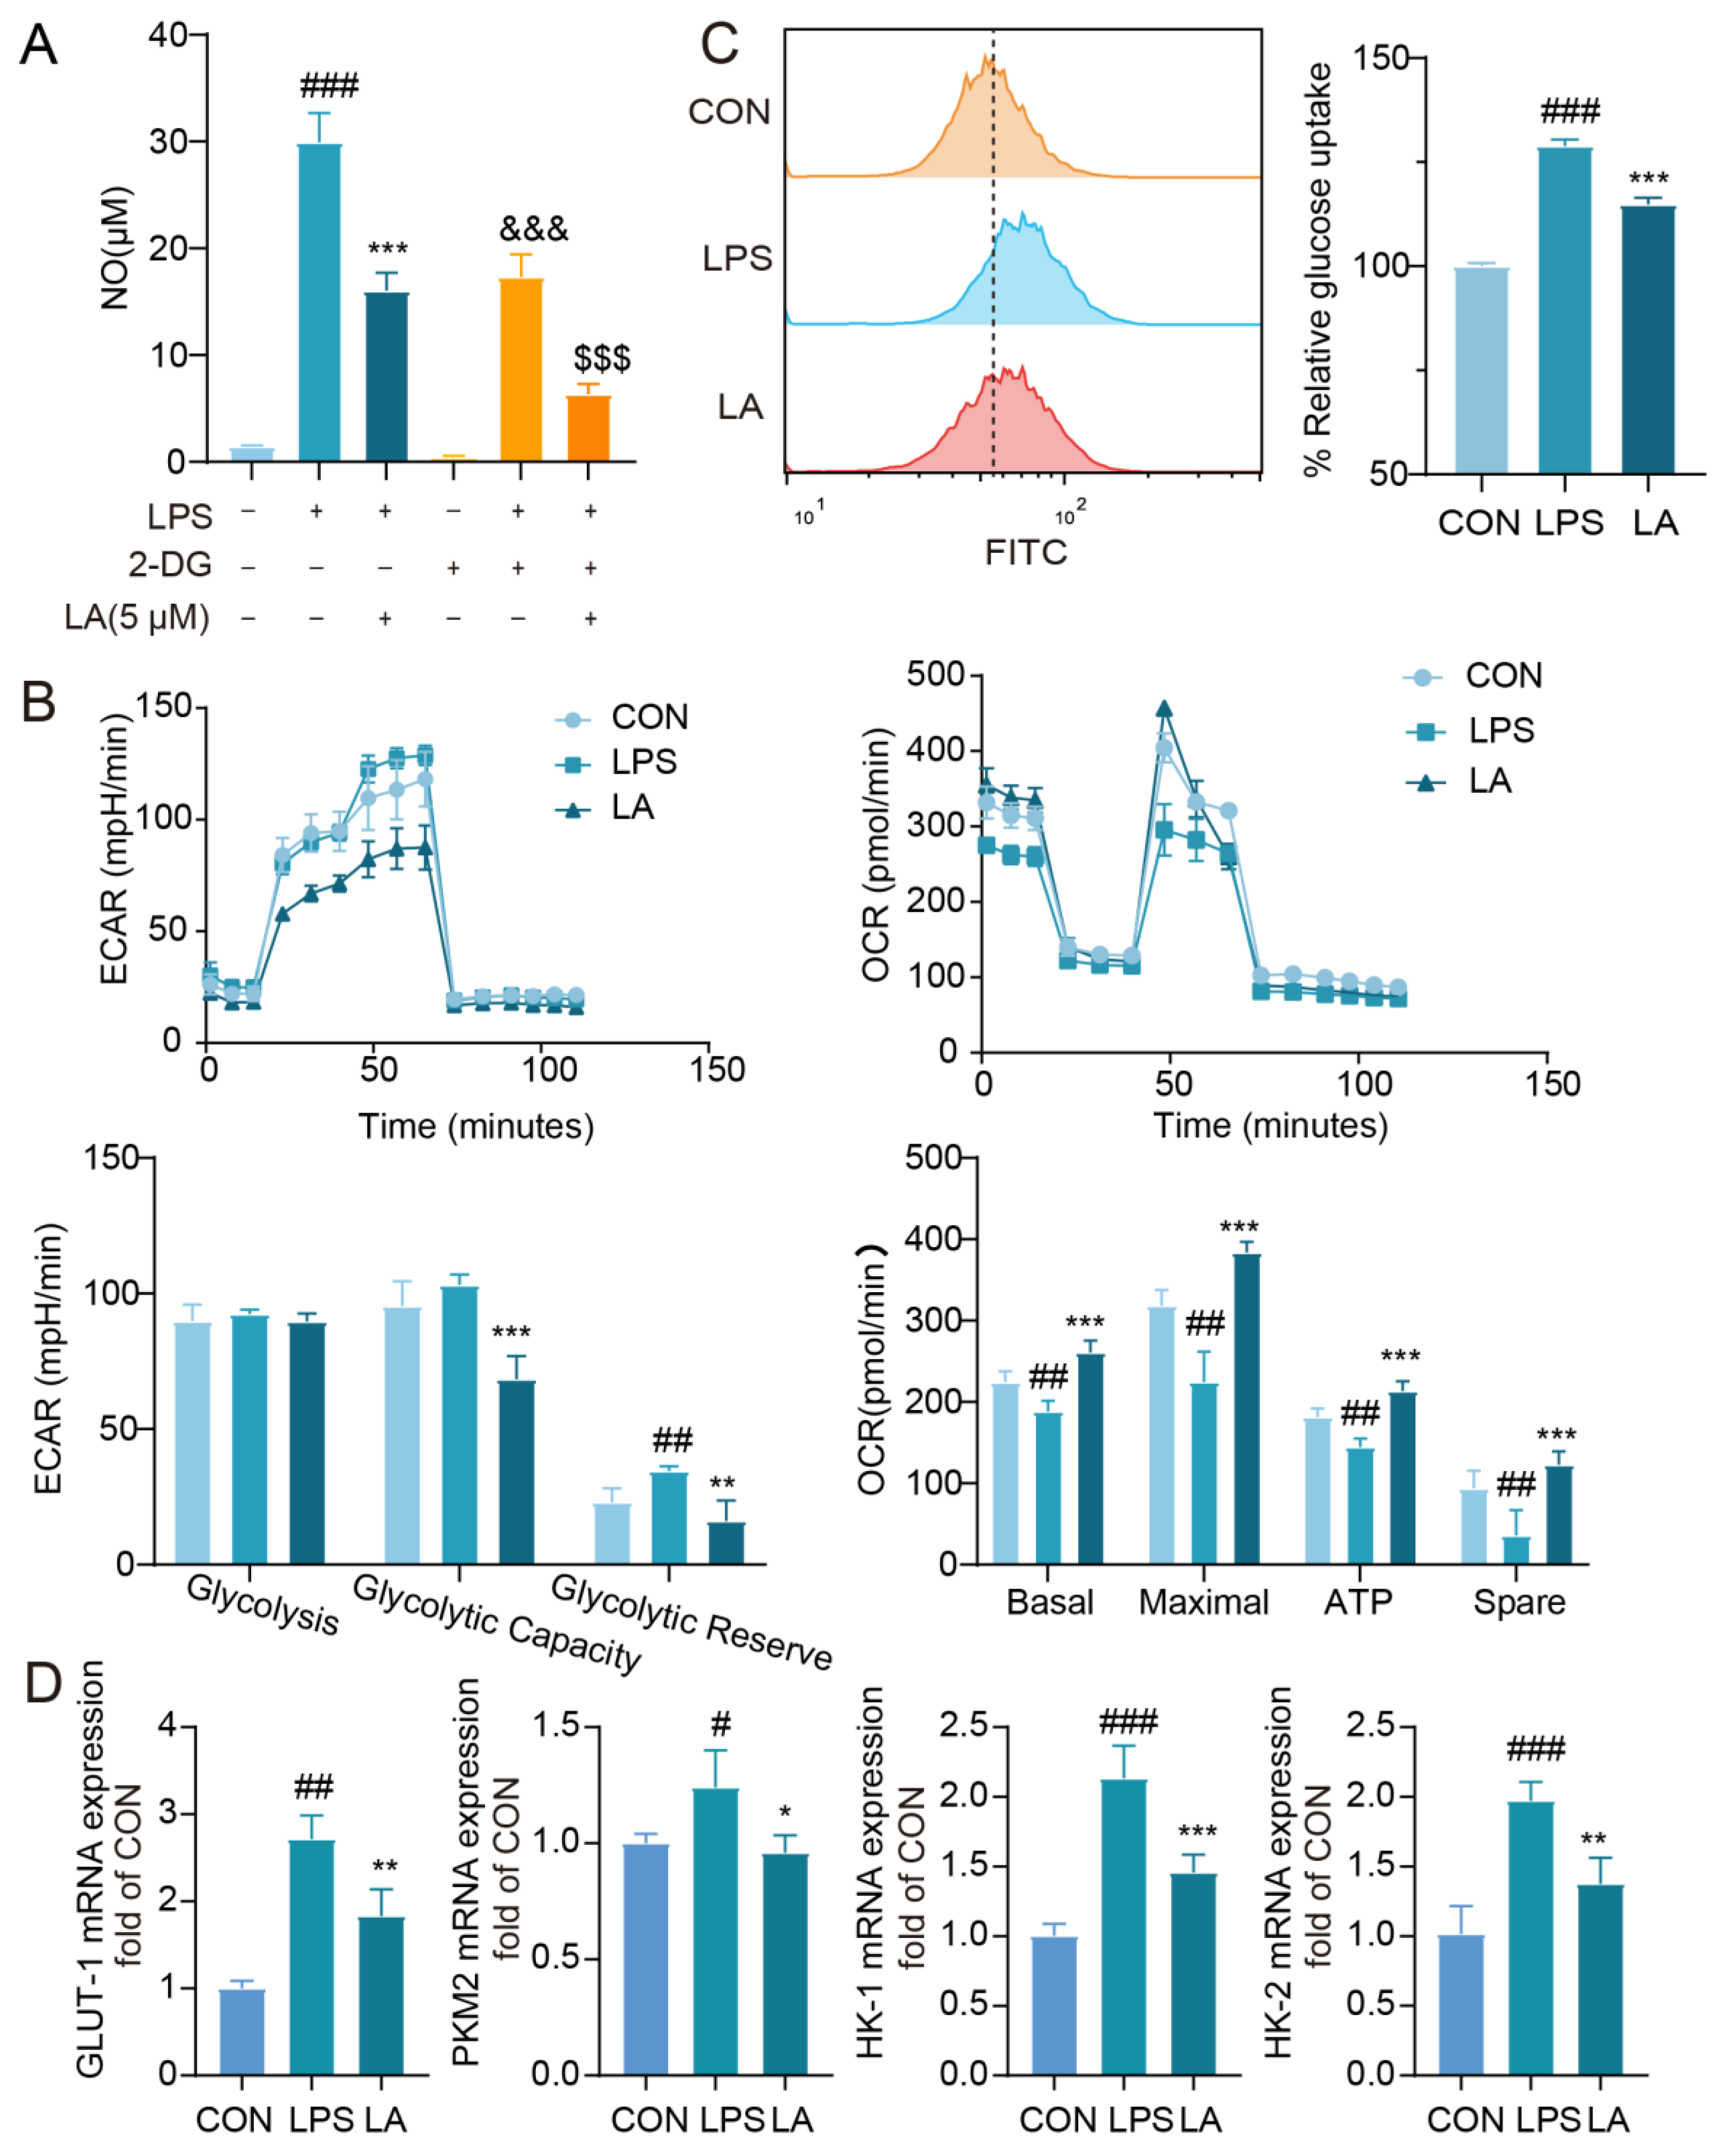
Our findings demonstrate that the glycolysis inhibitor 2-DG effectively inhibits LPS-induced production of the inflammatory factor NO, aligning with previous reports (Cheng, Zhang et al. 2021). And the NO inhibition was even more pronounced after the administration of LA. OCR and ECAR, which are commonly used to represent the cellular capacity for oxidative phosphorylation and glycolysis, were significantly elevated in the LPS-activated microglia, consistent with the literature(Gu, Zhang et al. 2017). While, LA has the potential to reverse the metabolic mode shift observed in LPS-activated microglia. GLUT-1, PKM2 and hexokinase are key enzymes in glycolysis, which play important roles in glucose transport, pyruvate production and mitochondrial stabilization, respectively(Sur, Nakanishi et al. 2019). Our findings indicate that LA significantly reduces the glucose uptake rate in LPS-induced microglia, accompanied by a reduction in glycolytic metabolite levels and a downregulation of key glycolysis enzyme genes. In summary, LA may promote a shift in the metabolic state of M1 microglial cells from glycolysis to oxidative phosphorylation.
The mTOR protein, serving as the central component of the cellular energy-sensing system, is responsible for facilitating the glucose metabolism pathway. AMPK, the primary sensor of energy status and regulator of metabolism in eukaryotic cells, phosphorylates tuberous sclerosis complex-2 (TSC2) and enhances its GAP activity on the small G protein Rheb (Ras homolog enriched in brain), ultimately inhibiting mTOR phosphorylation (Barisciano, Colangelo et al. 2020). We discovered that LA enhances the phosphorylation of AMPK and suppresses the phosphorylation of mTOR, indicating that LA reverses microglia metabolic reprogramming and inhibits their M1 phenotypic transformation through the AMPK/mTOR pathway.
To the best of our knowledge, no traditional Chinese medicine components have been reported to alter the polarization state of microglia by modulating metabolic reprogramming and providing a neuroprotective effect. This study fills this gap by demonstrating that LA, a phthalide-like constituent isolated from Angelica sinensis, can effectively suppress the phenotypic transformation of M1 microglia triggered by LPS. It also regulates the reprogramming of microglial glucose metabolism in an inflammatory state, potentially via the modulation of the AMPK/mTOR pathway. Furthermore, LA exhibits neuroprotective effects in an MPTP-induced Parkinson’s disease model. These findings provide valuable insights and data for future research into novel drugs for Parkinson’s disease and other neurodegenerative disorders.
Author Contributions
H. Wang, S. Wang, H. Guo and M. Zhang designed the research; M. Zhang, C. Duan, W. Lin, Q. Liu and M. Yu performed the research; H. Wu, Y. Nie and L. Chen analyzed data; M. Zhang and S. Wang wrote and edited the paper.
Institutional Review Board Statement
Animal Research Ethics approval number: TCM-LAEC2022022.
Acknowledgments
This study was supported by the National Natural Science Foundation of China [Grant number: 82274135] and Tianjin University of Traditional Chinese Medicine College Student Science and Technology Innovation Fund Project [Grant number: 202310063036].
Conflicts of Interest
No declarations of interest are reported by the authors.
References
- Barisciano, G., T. Colangelo, V. Rosato, L. Muccillo, M. L. Taddei, L. Ippolito, P. Chiarugi, M. Galgani, S. Bruzzaniti, G. Matarese, M. Fassan, M. Agostini, F. Bergamo, S. Pucciarelli, A. Carbone, G. Mazzoccoli, V. Colantuoni, F. Bianchi and L. Sabatino (2020). “miR-27a is a master regulator of metabolic reprogramming and chemoresistance in colorectal cancer.” Br J Cancer 122(9): 1354-1366.
- Benito, A., N. Hajji, K. O’Neill, H. C. Keun and N. Syed (2020). “β-Hydroxybutyrate Oxidation Promotes the Accumulation of Immunometabolites in Activated Microglia Cells.” Metabolites 10(9).
- Block, M. L. and J. S. Hong (2005). “Microglia and inflammation-mediated neurodegeneration: multiple triggers with a common mechanism.” Prog Neurobiol 76(2): 77-98.
- Brás, J. P., J. Bravo, J. Freitas, M. A. Barbosa, S. G. Santos, T. Summavielle and M. I. Almeida (2020). “TNF-alpha-induced microglia activation requires miR-342: impact on NF-kB signaling and neurotoxicity.” Cell Death Dis 11(6): 415.
- Bu, P., K. Y. Chen, K. Xiang, C. Johnson, S. B. Crown, N. Rakhilin, Y. Ai, L. Wang, R. Xi, I. Astapova, Y. Han, J. Li, B. B. Barth, M. Lu, Z. Gao, R. Mines, L. Zhang, M. Herman, D. Hsu, G. F. Zhang and X. Shen (2018). “Aldolase B-Mediated Fructose Metabolism Drives Metabolic Reprogramming of Colon Cancer Liver Metastasis.” Cell Metab 27(6): 1249-1262.e1244.
- Chen, J., K. Mao, H. Yu, Y. Wen, H. She, H. Zhang, L. Liu, M. Li, W. Li and F. Zou (2021). “p38-TFEB pathways promote microglia activation through inhibiting CMA-mediated NLRP3 degradation in Parkinson’s disease.” J Neuroinflammation 18(1): 295.
- Cheng, J., R. Zhang, Z. Xu, Y. Ke, R. Sun, H. Yang, X. Zhang, X. Zhen and L. T. Zheng (2021). “Early glycolytic reprogramming controls microglial inflammatory activation.” J Neuroinflammation 18(1): 129.
- Ding, Y., W. Niu, T. Zhang, J. Wang, J. Cao, H. Chen, R. Wang and H. An (2019). “Levistolide A synergistically enhances doxorubicin-induced apoptosis of k562/dox cells by decreasing MDR1 expression through the ubiquitin pathway.” Oncol Rep 41(2): 1198-1208.
- Gimeno-Bayón, J., A. López-López, M. J. Rodríguez and N. Mahy (2014). “Glucose pathways adaptation supports acquisition of activated microglia phenotype.” J Neurosci Res 92(6): 723-731.
- Gong, Z., Q. Li, J. Shi, E. T. Liu, L. D. Shultz and G. Ren (2022). “Lipid-laden lung mesenchymal cells foster breast cancer metastasis via metabolic reprogramming of tumor cells and natural killer cells.” Cell Metab 34(12): 1960-1976.e1969.
- Gu, R., F. Zhang, G. Chen, C. Han, J. Liu, Z. Ren, Y. Zhu, J. L. Waddington, L. T. Zheng and X. Zhen (2017). “Clk1 deficiency promotes neuroinflammation and subsequent dopaminergic cell death through regulation of microglial metabolic reprogramming.” Brain Behav Immun 60: 206-219.
- Guo, H., L. Sun, S. Ling and J. W. Xu (2018). “Levistilide A Ameliorates NLRP3 Expression Involving the Syk-p38/JNK Pathway and Peripheral Obliterans in Rats.” Mediators Inflamm 2018: 7304096.
- Korshoj, L. E. and T. Kielian (2021). “Neuroimmune metabolism: Uncovering the role of metabolic reprogramming in central nervous system disease.” J Neurochem 158(1): 8-13.
- Li, J., S. Yu, X. Lu, K. Cui, X. Tang, Y. Xu and X. Liang (2021). “The phase changes of M1/M2 phenotype of microglia/macrophage following oxygen-induced retinopathy in mice.” Inflamm Res 70(2): 183-192.
- Liao, S., J. Wu, R. Liu, S. Wang, J. Luo, Y. Yang, Y. Qin, T. Li, X. Zheng, J. Song, X. Zhao, C. Xiao, Y. Zhang, L. Bian, P. Jia, Y. Bai and X. Zheng (2020). “A novel compound DBZ ameliorates neuroinflammation in LPS-stimulated microglia and ischemic stroke rats: Role of Akt(Ser473)/GSK3β(Ser9)-mediated Nrf2 activation.” Redox Biol 36: 101644.
- Luo, G., X. Wang, Y. Cui, Y. Cao, Z. Zhao and J. Zhang (2021). “Metabolic reprogramming mediates hippocampal microglial M1 polarization in response to surgical trauma causing perioperative neurocognitive disorders.” J Neuroinflammation 18(1): 267.
- Matsuura, Y., M. Shimizu-Albergine, S. Barnhart, F. Kramer, C. C. Hsu, V. Kothari, J. Tang, S. A. Gharib, J. E. Kanter, E. D. Abel, R. Tian, B. Shao and K. E. Bornfeldt (2022). “Diabetes Suppresses Glucose Uptake and Glycolysis in Macrophages.” Circ Res 130(5): 779-781.
- Mor, D. E., S. Sohrabi, R. Kaletsky, W. Keyes, A. Tartici, V. Kalia, G. W. Miller and C. T. Murphy (2020). “Metformin rescues Parkinson’s disease phenotypes caused by hyperactive mitochondria.” Proc Natl Acad Sci U S A 117(42): 26438-26447.
- Nayak, D., T. L. Roth and D. B. McGavern (2014). “Microglia development and function.” Annu Rev Immunol 32: 367-402.
- Neumann, J., S. Sauerzweig, R. Rönicke, F. Gunzer, K. Dinkel, O. Ullrich, M. Gunzer and K. G. Reymann (2008). “Microglia cells protect neurons by direct engulfment of invading neutrophil granulocytes: a new mechanism of CNS immune privilege.” J Neurosci 28(23): 5965-5975.
- Noda, T., H. Shiga, K. Yamada, M. Harita, Y. Nakamura, T. Ishikura, M. Kumai, Z. Kawakami, A. Kaneko, T. Hatta, H. Sakata-Haga, H. Shimada and T. Miwa (2019). “Effects of Tokishakuyakusan on Regeneration of Murine Olfactory Neurons In Vivo and In Vitro.” Chem Senses 44(5): 327-338.
- Qu, X., P. Guan, L. Han, Z. Wang and X. Huang (2021). “Levistolide A Attenuates Alzheimer’s Pathology Through Activation of the PPARγ Pathway.” Neurotherapeutics 18(1): 326-339.
- Rabaneda-Lombarte, N., L. Blasco-Agell, J. Serratosa, L. Ferigle, J. Saura and C. Solà (2020). “Parkinsonian neurotoxicants impair the anti-inflammatory response induced by IL4 in glial cells: involvement of the CD200-CD200R1 ligand-receptor pair.” Sci Rep 10(1): 10650.
- Rushing, B. R., S. Tilley, S. Molina, M. Schroder and S. Sumner (2022). “Commonalities in Metabolic Reprogramming between Tobacco Use and Oral Cancer.” Int J Environ Res Public Health 19(16).
- Simon, D. K., C. M. Tanner and P. Brundin (2020). “Parkinson Disease Epidemiology, Pathology, Genetics, and Pathophysiology.” Clin Geriatr Med 36(1): 1-12.
- Stepanov, Y. V., I. Golovynska, R. Zhang, S. Golovynskyi, L. I. Stepanova, O. Gorbach, T. Dovbynchuk, L. V. Garmanchuk, T. Y. Ohulchanskyy and J. Qu (2022). “Near-infrared light reduces β-amyloid-stimulated microglial toxicity and enhances survival of neurons: mechanisms of light therapy for Alzheimer’s disease.” Alzheimers Res Ther 14(1): 84.
- Subhramanyam, C. S., C. Wang, Q. Hu and S. T. Dheen (2019). “Microglia-mediated neuroinflammation in neurodegenerative diseases.” Semin Cell Dev Biol 94: 112-120.
- Sur, S., H. Nakanishi, C. Flaveny, J. E. Ippolito, J. McHowat, D. A. Ford and R. B. Ray (2019). “Inhibition of the key metabolic pathways, glycolysis and lipogenesis, of oral cancer by bitter melon extract.” Cell Commun Signal 17(1): 131.
- Tambasco, N., M. Romoli and P. Calabresi (2018). “Levodopa in Parkinson’s Disease: Current Status and Future Developments.” Curr Neuropharmacol 16(8): 1239-1252.
- Tannahill, G. M., A. M. Curtis, J. Adamik, E. M. Palsson-McDermott, A. F. McGettrick, G. Goel, C. Frezza, N. J. Bernard, B. Kelly, N. H. Foley, L. Zheng, A. Gardet, Z. Tong, S. S. Jany, S. C. Corr, M. Haneklaus, B. E. Caffrey, K. Pierce, S. Walmsley, F. C. Beasley, E. Cummins, V. Nizet, M. Whyte, C. T. Taylor, H. Lin, S. L. Masters, E. Gottlieb, V. P. Kelly, C. Clish, P. E. Auron, R. J. Xavier and L. A. O’Neill (2013). “Succinate is an inflammatory signal that induces IL-1β through HIF-1α.” Nature 496(7444): 238-242.
- Wang, L., S. Pavlou, X. Du, M. Bhuckory, H. Xu and M. Chen (2019). “Glucose transporter 1 critically controls microglial activation through facilitating glycolysis.” Mol Neurodegener 14(1): 2.
- Wang, S., Y. H. Yuan, N. H. Chen and H. B. Wang (2019). “The mechanisms of NLRP3 inflammasome/pyroptosis activation and their role in Parkinson’s disease.” Int Immunopharmacol 67: 458-464.
- Witcher, K. G., C. E. Bray, T. Chunchai, F. Zhao, S. M. O’Neil, A. J. Gordillo, W. A. Campbell, D. B. McKim, X. Liu, J. E. Dziabis, N. Quan, D. S. Eiferman, A. J. Fischer, O. N. Kokiko-Cochran, C. Askwith and J. P. Godbout (2021). “Traumatic Brain Injury Causes Chronic Cortical Inflammation and Neuronal Dysfunction Mediated by Microglia.” J Neurosci 41(7): 1597-1616.
- Wolf, S. A., H. W. Boddeke and H. Kettenmann (2017). “Microglia in Physiology and Disease.” Annu Rev Physiol 79: 619-643.
- Yang, S. Y., Z. X. Lin, Y. F. Xian, H. M. Zhang and H. X. Xu (2023). “Traditional uses, chemical compounds, pharmacological activities and clinical studies on the traditional Chinese prescription Yi-Gan San.” J Ethnopharmacol 302(Pt A): 115859.
- Yang, Y., Y. Zhang, L. Wang and S. Lee (2017). “Levistolide A Induces Apoptosis via ROS-Mediated ER Stress Pathway in Colon Cancer Cells.” Cell Physiol Biochem 42(3): 929-938.
- Yu, H., Q. Chang, T. Sun, X. He, L. Wen, J. An, J. Feng and Y. Zhao (2023). “Metabolic reprogramming and polarization of microglia in Parkinson’s disease: Role of inflammasome and iron.” Ageing Res Rev 90: 102032.
- Zhang, K., M. Yan, S. Han, L. Cong, L. Wang, L. Zhang, L. Sun, H. Bai, G. Wei, H. Du, M. Jiang, G. Bai and Z. Yang (2019). “Identification of Chemical Markers for the Discrimination of Radix Angelica sinensis Grown in Geoherb and Non-Geoherb Regions Using UHPLC-QTOF-MS/MS Based Metabolomics.” Molecules 24(19).
- Zhao, Y., J. Zhang, Y. Zheng, Y. Zhang, X. J. Zhang, H. Wang, Y. Du, J. Guan, X. Wang and J. Fu (2021). “NAD(+) improves cognitive function and reduces neuroinflammation by ameliorating mitochondrial damage and decreasing ROS production in chronic cerebral hypoperfusion models through Sirt1/PGC-1α pathway.” J Neuroinflammation 18(1): 207.
- Zhong, W. J., T. Liu, H. H. Yang, J. X. Duan, J. T. Yang, X. X. Guan, J. B. Xiong, Y. F. Zhang, C. Y. Zhang, Y. Zhou and C. X. Guan (2023). “TREM-1 governs NLRP3 inflammasome activation of macrophages by firing up glycolysis in acute lung injury.” Int J Biol Sci 19(1): 242-257.
- Zhou, Y., F. Lin, T. Wan, A. Chen, H. Wang, B. Jiang, W. Zhao, S. Liao, S. Wang, G. Li, Z. Xu, J. Wang, J. Zhang, H. Ma, D. Lin and Q. Li (2021). “ZEB1 enhances Warburg effect to facilitate tumorigenesis and metastasis of HCC by transcriptionally activating PFKM.” Theranostics 11(12): 5926-5938.
- Zusso, M., V. Lunardi, D. Franceschini, A. Pagetta, R. Lo, S. Stifani, A. C. Frigo, P. Giusti and S. Moro (2019). “Ciprofloxacin and levofloxacin attenuate microglia inflammatory response via TLR4/NF-kB pathway.” J Neuroinflammation 16(1): 148.
Figure 1.
LA can inhibit the production of inflammatory cytokines NO, IL-6 and TNF-α in LPS-induced microglia(Mean±SD). ( A. LPS and/or LA had no effect on cells viability after LPS stimulation of BV-2 cells for 24 h, n=6; B, C. LA was able to inhibit LPS-induced NO, IL-6, and TNF-α production in BV-2 cells, n=5; D. LA was able to inhibit LPS-induced NO production in primary microglial cells. E. LA inhibited the expression of proinflammatory cytokines mRNA in LPS-induced microglia; F. LA does not inhibit anti-inflammatory factor mRNA expression. vs CON, ###P<0.001, ##P<0.01;;vs LPS, *P<0.05, **P<0.01, ***P <0.001).
Figure 2.
LA can inhibit LPS-induced ROS production in BV-2 cell. (A. Intracellular ROS content was detected by flow cytometry after 24 h of LPS-induced BV-2 cells; B. Fluorescence microscopy images of BV-2 cells treated with LPS and/or LA for 24 hours after incubation with the DCFH probe; vs CON, ### P <0.001; vs LPS, ***P< 0.001).
Figure 3.
LA inhibits IκB-α phosphorylation and nuclear translocation of NF-κB p65 (Mean±SD, n=3). (BV-2 cells were treated with LPS and or LA for 1 h; A. Western blot results showed that LA was able to inhibit IκB-α phosphorylation; B, C. The results of Western blot and fluorescence microscopy showed that LA was able to inhibit nuclear translocation of NF-κB p65. vs CON, ###P<0.001, ##P<0.01;vs LPS, *P<0.05, **P<0.01).
Figure 4.
LA inhibits LPS-induced reprogramming of microglia glucose metabolism. Effect of 2-DG on LPS-induced NO in BV-2 cell; B. LA decreased ECAR and increased OCR in BV-2 cells (n = 4); C. LA reduced glucose uptake in inflammatory microglia, n = 4; D. LA reduced the mRNA expression of key glycolytic enzymes, n=6. vs Control, ###P<0.001, ##P<0.01;vs LPS, *P<0.05, **P<0.01, ***P <0.001, &&&P<0.001, vs LPS+2DG组, $$$P<0.001, Mean±SD, n=6).
Figure 5.
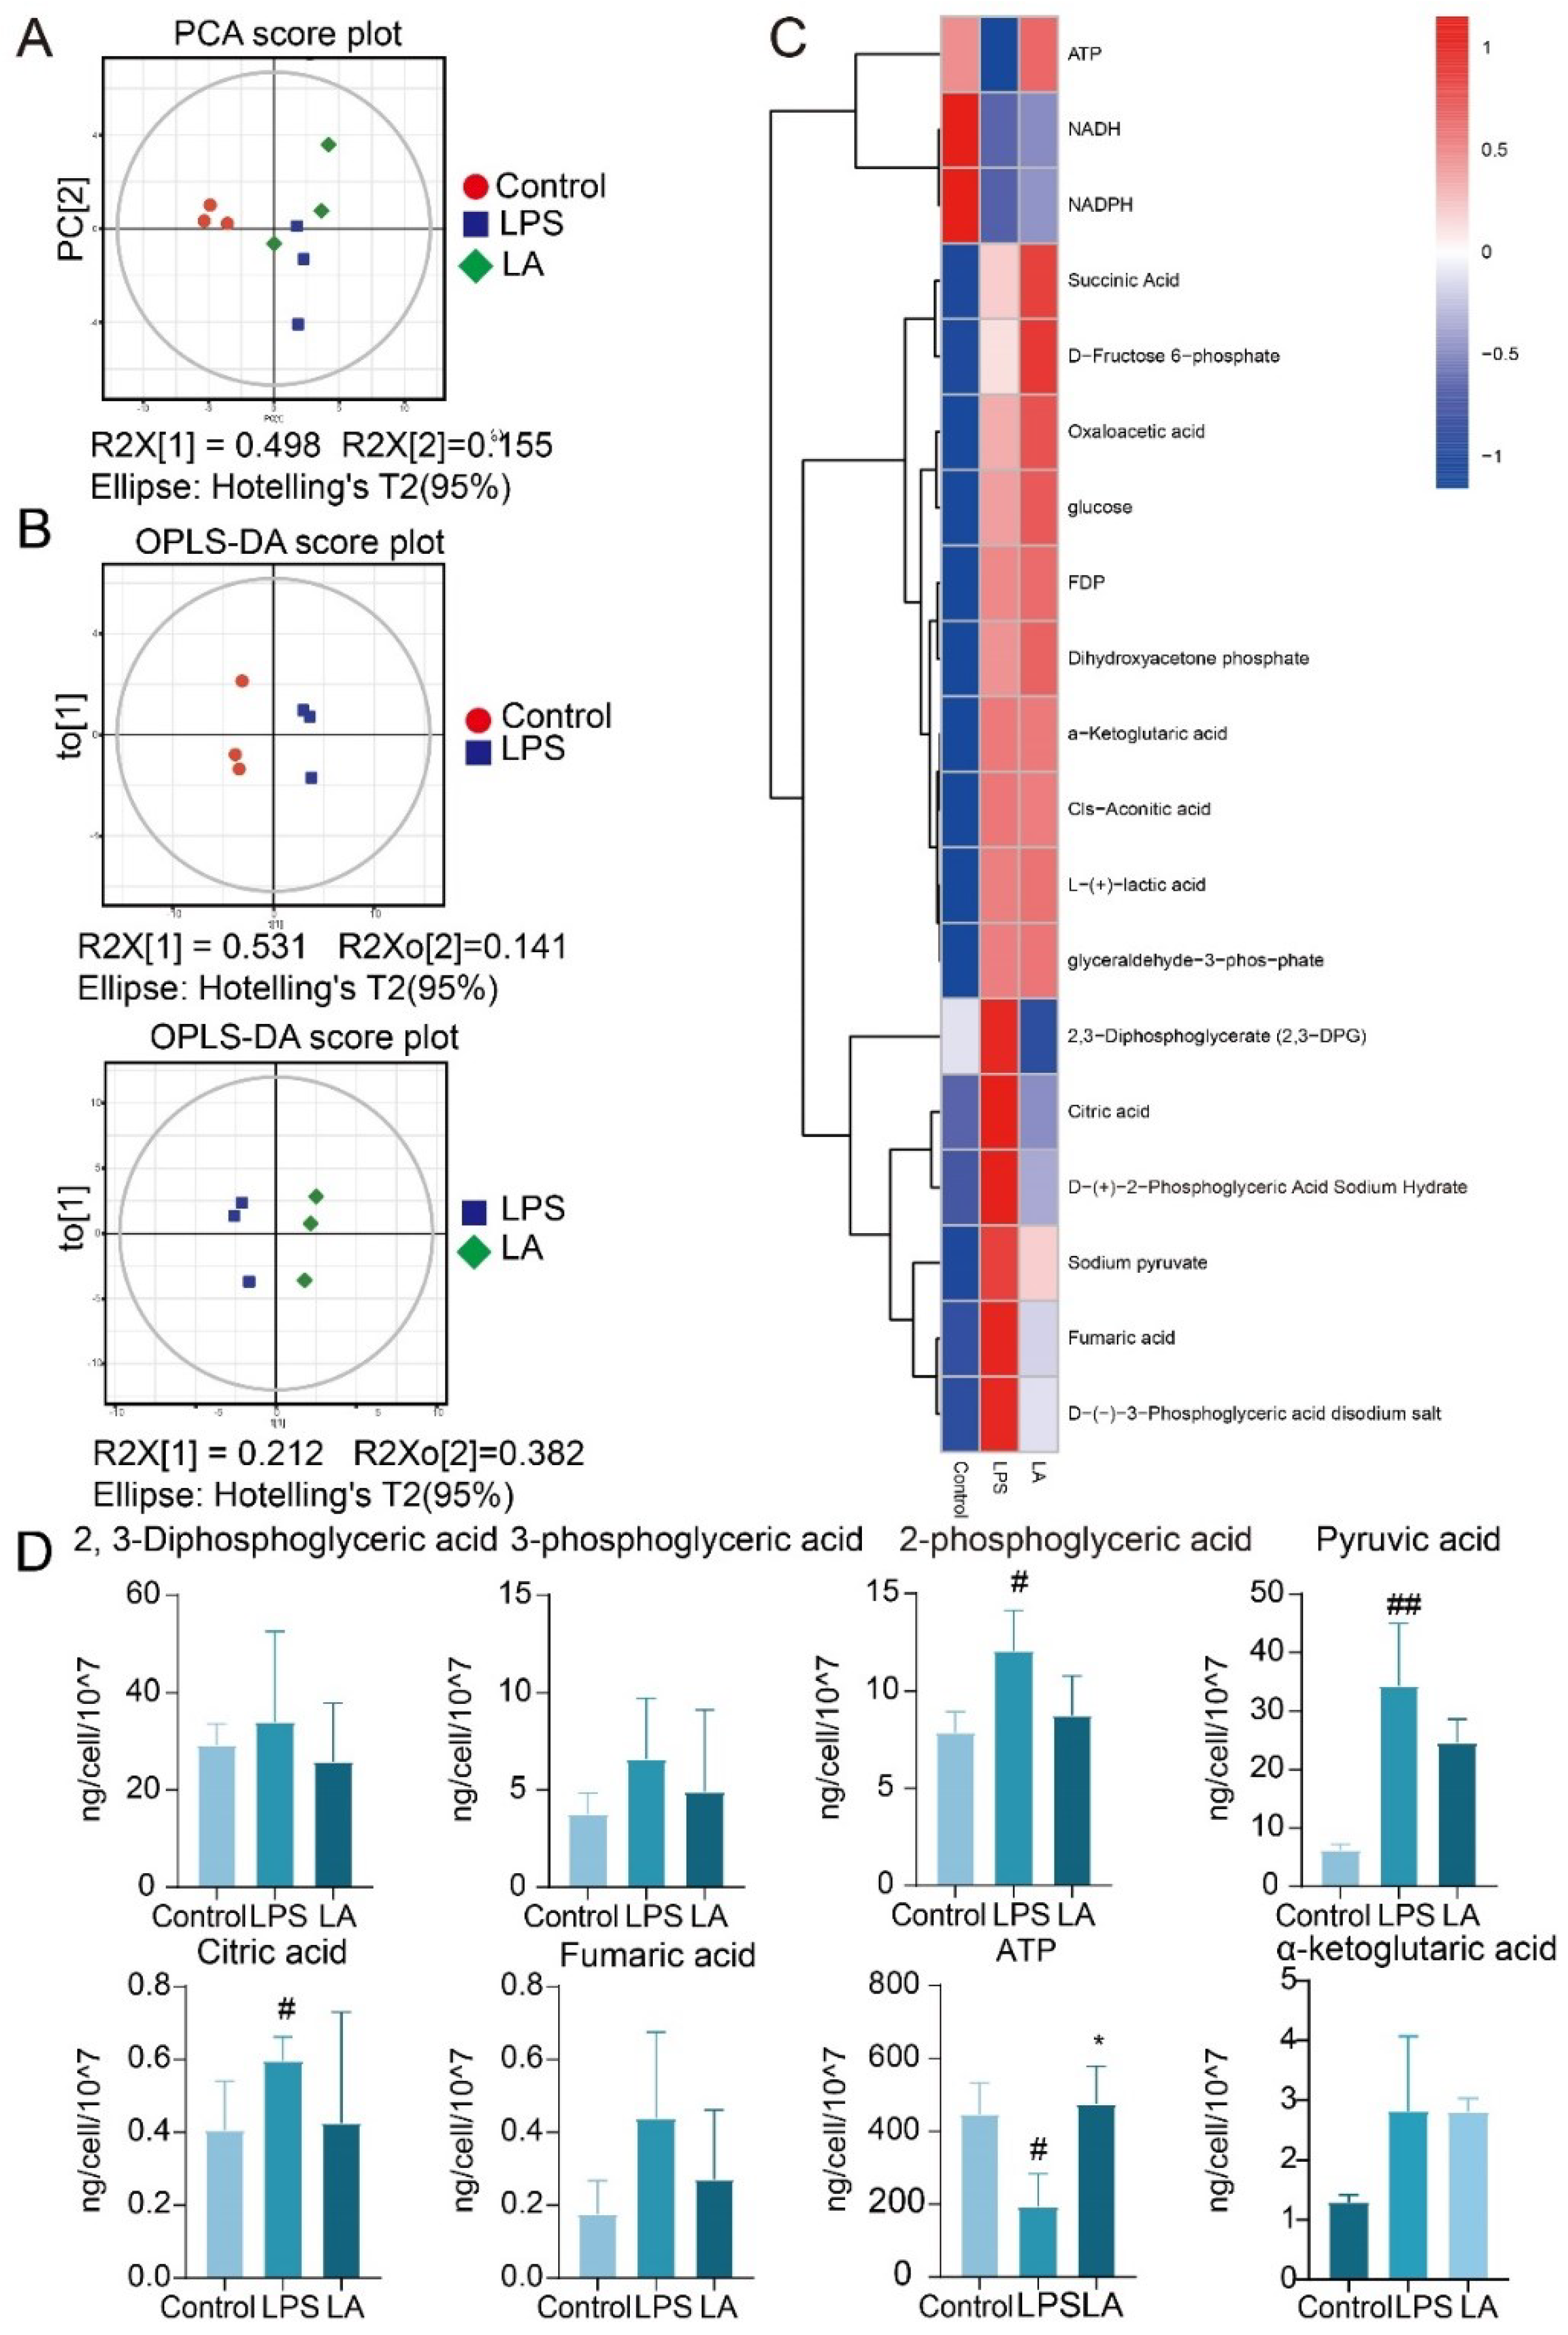
Central carbon target metabolome analysis. (A. PCA scatter plot of total sample of con group, LPS group and LA group; B. OPLS-DA model scatter plot of CON group vs LPS group and LPS group vs LA group; C. Hierarchical cluster analysis thermodynamic diagram; D. Histogram of differential metabolites. vs CON, ##P<0.01;vs LPS, *P<0.05).
Figure 6.
LA increases the phosphorylation level of AMPK and decreased the phosphorylation level of mTOR. Effects of LPS on AMPK/mTOR pathway in BV-2 cells at 0, 0.5, 1, 2 h after LPS treatment. B. Effect of LA on AMPK/mTOR in BV-2 cells induced by LPS for 2 h. vs CON, ##P<0.01, #P<0.05;vs LPS, *P<0.05, **P<0.01, ***P<0.001).
Figure 7.
The Conditioned Medium from LA-treated Microglia Protects Neurons. (A. Experimental process; B. No effect of LA treatment alone on SH-SY5Y cell viability; C. Microglia conditioned medium co-treated with LPS and LA had a significant neuroprotective effect on SH-SY5Y; D. Morphology of different conditioned culture treatments of SH-SY5Y cells. vs CON , ###P<0.01;vs LPS, **P<0.01).
Figure 8.
LA ameliorates dopaminergic neuronal damage and inhibits microglia activation in the brain of Parkinson’s disease mice. (A. In vivo experimental procedure; B. Changes in body weights of mice; C. Effect of LA on TH in the substantia nigra and striatum of Parkinson’s model mice; D. Effect of LA on Iba-1 in the substantia nigra and striatum of Parkinson’s model mice; E. Western blot of TH and Iba-1 expression in the substantia nigra of Parkinson’s model mice. vs CON, #P<0.05, ##P<0.01, vs MPTP, *P<0.05, **P<0.01).
Table 1.
The Primer sequences of quantitative PCR.
Table 1.
The Primer sequences of quantitative PCR.
| gene |
primer pair (5, -3, ) |
Accession ID |
| GAPDH |
F: CTTCACCACCATGGAGAAGGC
R: GGCATGGACTGTGGTCATGAG |
XM_001476707.5 |
iNOS
|
F: GGCAGCCTGTGAGACCTTTG
R: GCATTGGAAGTGAAGCGTTTC |
XM_006532446.3 |
| TNF-α |
F: CGGGGTGATCGGTCCCCAAAG
R: GGAGGGCGTTGGCGCGCTGG |
NM_001278601.1 |
IL-6
|
F: CCAGAGATACAAAGAAATGATGG
R: ACTCCAGAAGACCAGAGGAAA |
NM_001314054.1
|
| IL-1β |
F: CGCAGCAGCACATCAACAAGAGC
R: TGTCCTCATCCTGGAAGGTCCACG |
XM_006498795.3
|
IL-1Ra
|
F: AAGCCTTCAGAATCTGGGATAC
R: TCATCTCCAGACTTGGCACA |
NM_001159562.1
|
| Ym1 |
F:TCACTTACACACATGAGCAAGAC
R: CGGTTCTGAGGAGTAGAGACCA |
NM_009892.3
|
Arg1
|
F: GGAAGACAGCAGAGGAGGTG
R: TATGGTTACCCTCCCGTTGA |
NM_007482.3
|
IL-10
|
F: GCTCTTACTGACTGGCATGAG
R: CGCAGCTCTAGGAGCATGTG |
NM_010548.2
|
| β-actin |
F:AGAGGGAAATCGTGCGTGACATCAA
R:ATACCCAAGAAGGAAGGCTGGAAAA |
NM_007393.5 |
| HK1 |
F:TGCCATGCGGCTCTCTGATG
R:CTTGACGGAGGCCGTTGGGTT |
NM_010438.3 |
PKM2
|
F:AGGATGCCGTGCTGAATG
R:TAGAAGAGGGGCTCCAGAGG |
NM_011099.4 |
HK2
|
F:TCATTGTTGGCACTGGAAGC
R:TTGCCAGGGTTGAGAGAGAG |
NM_013820.3
|
| GLUT-1 |
F:CAGTTCGGCTATAACACTGGTG
R:GCCCCCGACAGAGAAGATG |
NM_011400.3 |
|
Disclaimer/Publisher’s Note: The statements, opinions and data contained in all publications are solely those of the individual author(s) and contributor(s) and not of MDPI and/or the editor(s). MDPI and/or the editor(s) disclaim responsibility for any injury to people or property resulting from any ideas, methods, instructions or products referred to in the content. |
© 2024 by the authors. Licensee MDPI, Basel, Switzerland. This article is an open access article distributed under the terms and conditions of the Creative Commons Attribution (CC BY) license (http://creativecommons.org/licenses/by/4.0/).
