1. Introduction
Atrial fibrillation (AF) is a cardiac arrhythmia with irregular heartbeats. It can lead to the development of tachyarrhythmias, heart failure, dementia and arterial emboli, with ischaemic cerebral stroke being the most common complication [1]. AF also increases the risk of dying prematurely.
AF is often asymptomatic, especially in men and older people [2] and its complications, e.g. ischaemic stroke, may be the first presentation of this arrhythmia. The incidence of AF increases with age and is usually associated with many diseases or risk factors like hypertension, obesity, smoking, coronary artery disease, valvular heart disease, lung disease and hyperthyroidism [3]. However, AF is not rare in otherwise healthy people, e.g. those involved in long-term endurance sports [4]. AF can also be caused by alcohol consumption and the abuse of illicit substances such as methamphetamine, cocaine, opiates and cannabis [5].
An increasing incidence of AF and its clinical importance require effective and timely diagnosis. Recently, parameters derived from heart rate variability (HRV) analysis have become more commonly applied for AF detection in ECGs [6]. Several HRV descriptors have been proposed, such as standard deviation of the interbeat intervals (SDRR), root mean square of successive differences between normal heartbeats (rMSSD), percentage of differences higher than 50 ms (pRR50) [7].
pRR50 is the most studied but specific example of a parameter from the pRRx family (percentage of successive RR interval differences greater than or equal to x ms). Buś et al. [8] explored different parameters from the pRRx family and found that the optimal diagnostic properties for AF detection were found for the threshold x = 31 ms (AUC = 0.958, sensitivity = 95.35%, specificity = 90.47). The study was performed on a dataset of over 60 thousands of 1-minute segments of RR intervals. Using the same data, they reported that the pRRx% parameters (defined like pRRx but with a threshold x% relative to the previous RR interval) have even better diagnostic properties with pRR3.25% (AUC = 0.972, sensitivity = 97.16%, specificity = 93.75%) outperforming other pRRx% and pRRx parameters. Both the pRRx and pRRx% families count occurrences of unusually large successive differences in RR intervals and are generally much greater in AF than in normal sinus rhythm (SR).
Asymmetric entropy based on monotonic runs, introduced by Piskorski and Guzik [9,10], is another set of features used in HRV analysis. Unlike other entropy measures, asymmetric entropy separately examines information derived from monotonic runs consisting of heart rate accelerations, decelerations, or consecutive RR intervals that do not change (neutral monotonic runs).
We hypothesized that heart rate entropy derived from deceleration, acceleration, and neutral runs might differ between ECGs derived from sinus rhythm and atrial fibrillation. If so, the measurement of asymmetric entropy may be useful in distinguishing SR and AF segments of the ECG. This study compared the asymmetric entropy-based descriptors with pRR30 and pRR3.25% and their possible combinations for AF detection in 1-minute segments of RR intervals.
2. Materials and Methods
2.1. Data
This study used de-identified data from the Long-Term Atrial Fibrillation Database (LTAFDB) [10,11]. The LTAFDB consists of 84 extended 24-hour Holter electrocardiographic (ECG) recordings sampled at 128 Hz. The database contains information on R-wave locations and corresponding heart rhythms (normal, supraventricular, ventricular, atrial and technical artefacts) in patients with paroxysmal AF and other arrhythmias. For our analysis, we selected only continuous ECG fragments with either AF or sinus rhythm (SR) lasting at least 60 seconds, discarding segments labelled as other rhythms.
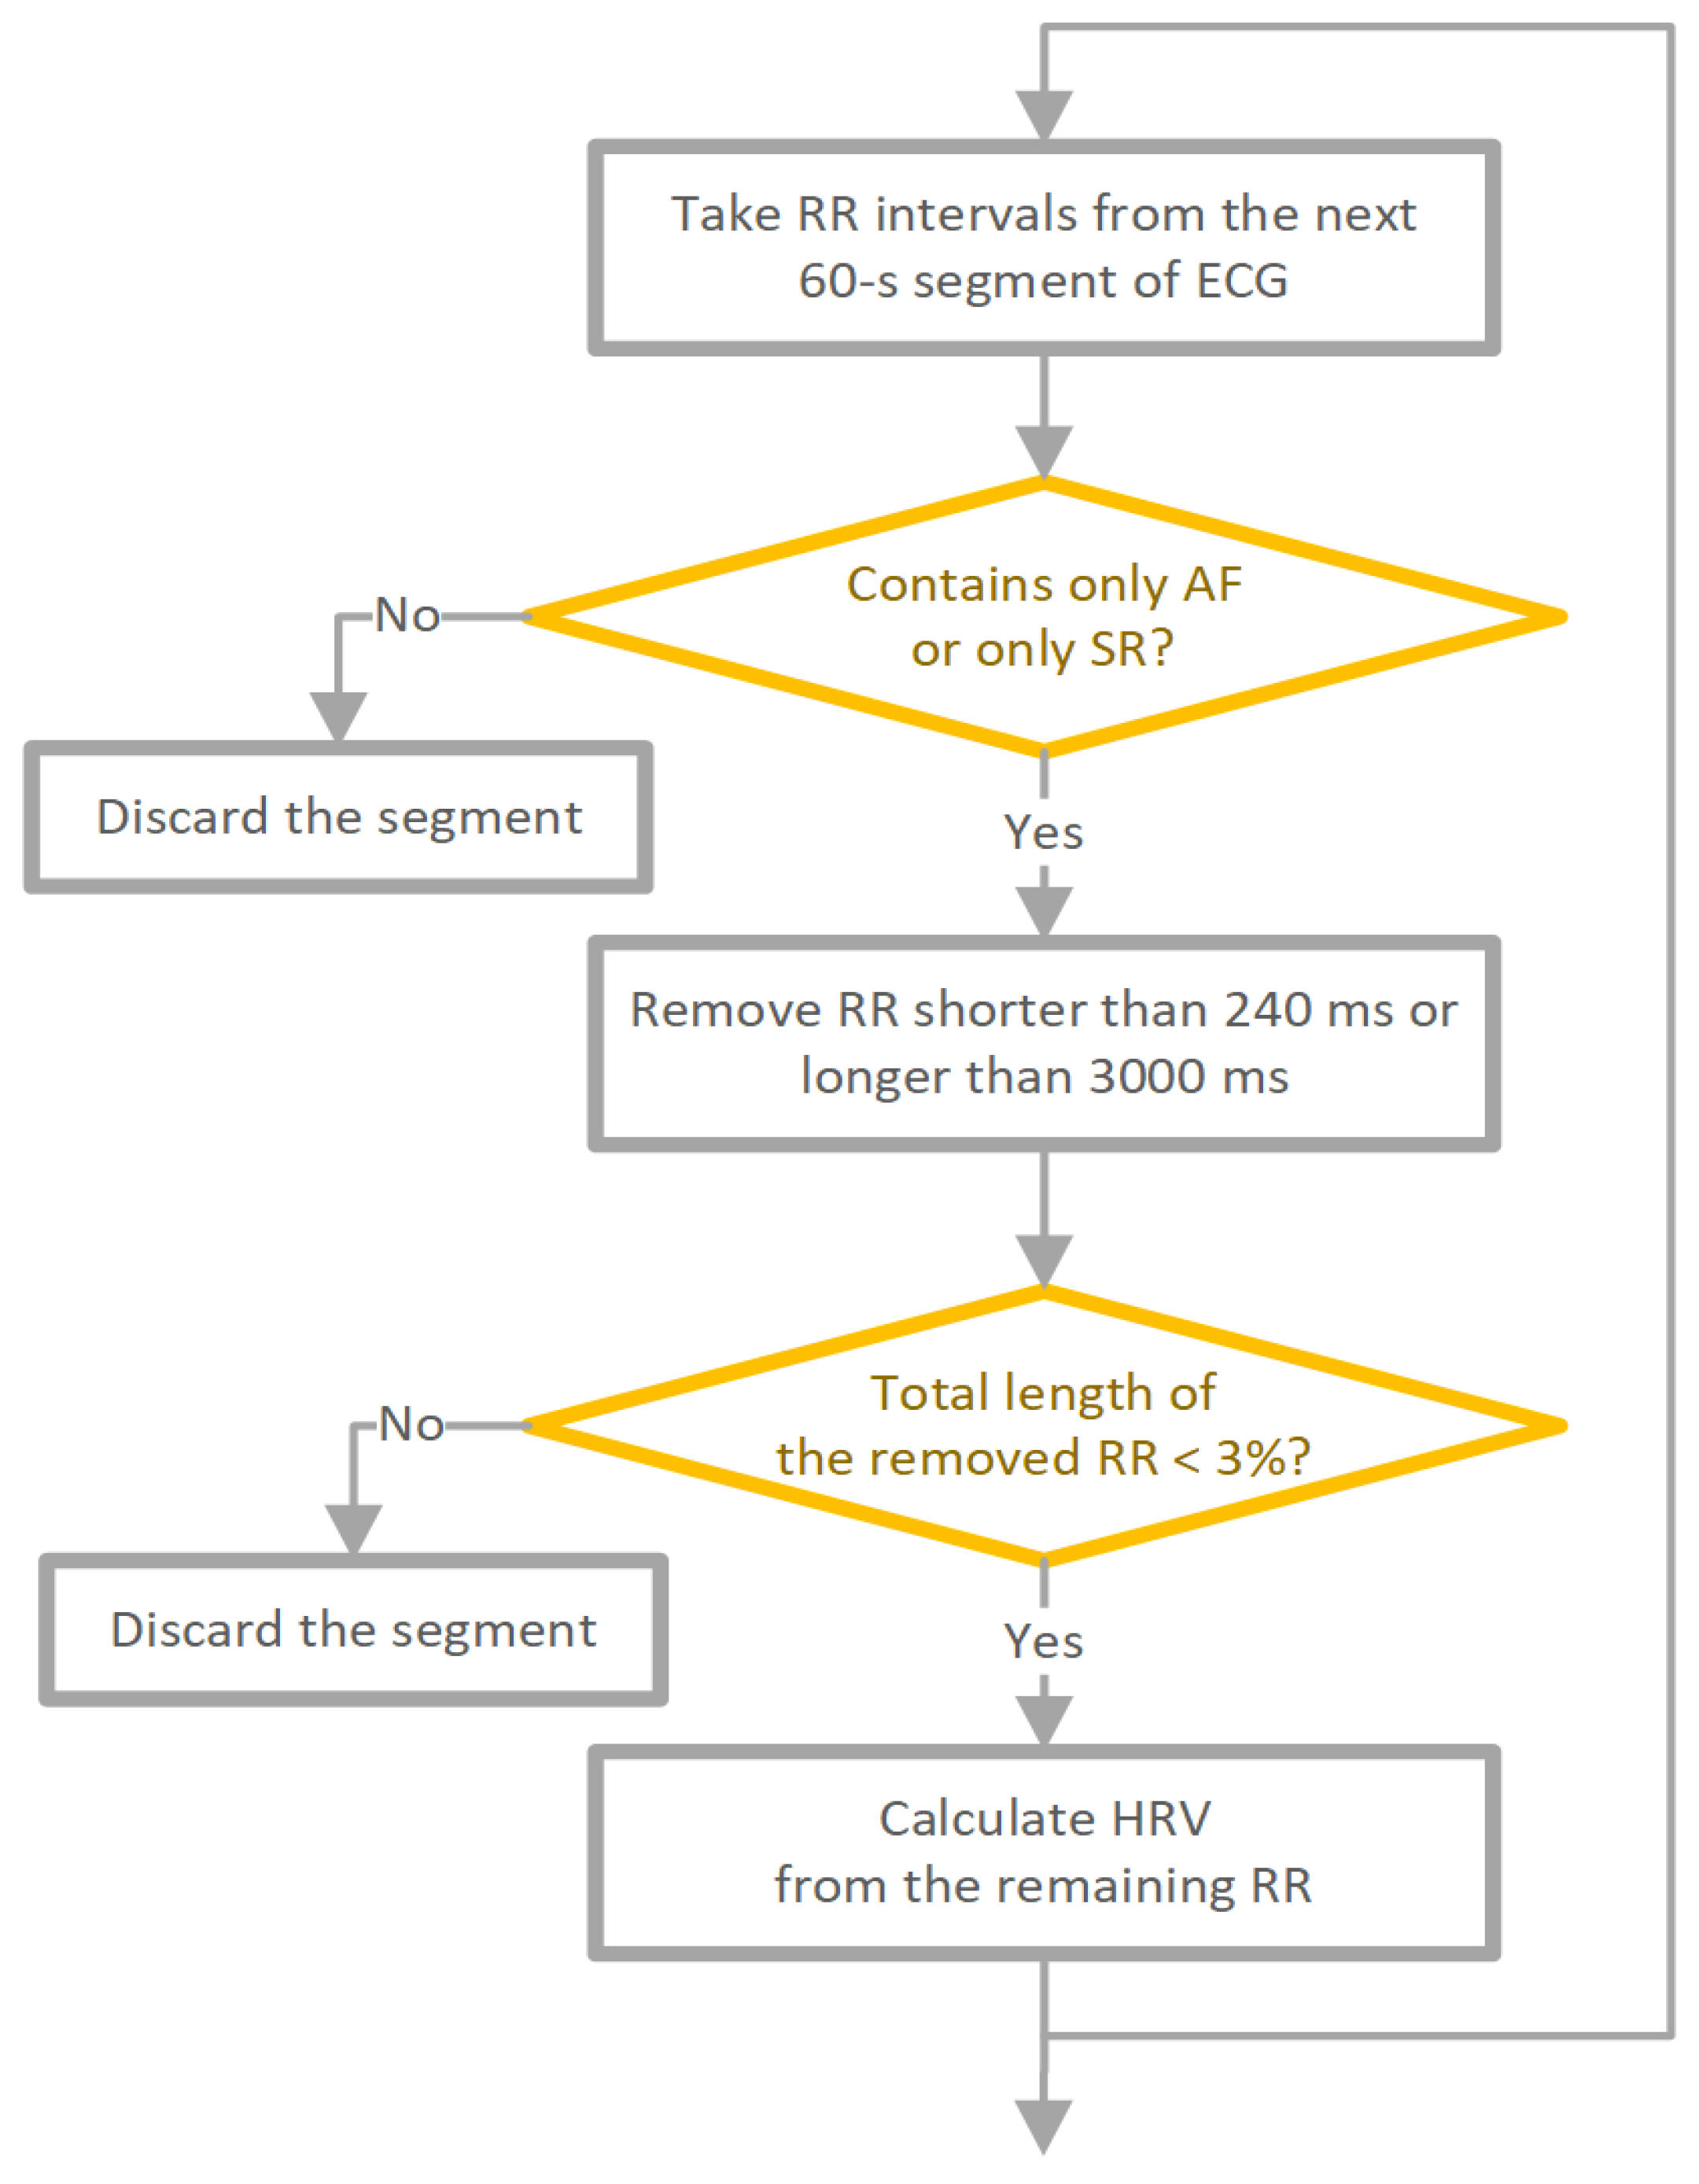
The used data pre-processing method is shown in
Figure 1. The RR interval time series were divided into 60-second contiguous segments. Each RR interval within the segment had to originate from SR to label the whole segment as SR. If not, the segment was excluded from further analysis. Similarly, for AF segments, each beat within the segment had to be AF, and segments containing ventricular beats were also excluded. To minimize the number of potentially unidentified technical artefacts, we removed RR intervals shorter than 240 ms or longer than 3000 ms for both SR and AF. In addition, we removed RR intervals corresponding to ventricular premature beats from both SR and AF ECGs. For SR only, supraventricular premature beats were also removed. Segments where the total length of excluded RR intervals exceeded 3% (1.8 s) of the segment length were excluded from the analysis. After preprocessing, the total 60-second RR series was 63,636 (31,919 SR, 31,717 AF). ECG segments where the total length of RR intervals after filtering was less than 58 seconds were also discarded.
2.2. Software
We used Python programming language (version 3.9, Python Software Foundation,
Wilmington, DE, USA) for statistical analysis. Part of runs-based asymmetrical calculation was done thanks to free GPL3 software written in Python, HRAexplorer, which can be reviewed and downloaded at
https://github.com/jaropis/HRAExplorer. An interactive online version of this software in the R programming language may be found at
https://hraexplorer.com/. Data preprocessing and calculating pRRx and pRRx% parameters were done using the code from
https://github.com/simonbus/prrx_af.
2.3. Asymmetrical entropy
Asymmetrical entropy is an approach presented in [9]. In summary, the RR series is partitioned into monotonic runs, as shown in
Figure 1. If we define a series of RR intervals as:
we can use this to build a series of differences. Starting from the second element, we subtract (
i-1)-th element from
i-th element like this:
Where single difference looks like this:
We can use this series to construct a symbolic series of signs of those differences:
Using this, we can write definitions for acceleration, deceleration and neutral series:
Definition 1. A deceleration series of length i (DRi) is an uninterrupted series of i decelerations (sign +) that starts and ends with acceleration (sign -) or neutral difference (sign 0).
Definition 2. An acceleration series of length i (ARi) is an uninterrupted series of i accelerations (sign -) that starts and ends with deceleration (sign +) or neutral difference (sign 0).
Definition 3. A neutral series of length i (NRi) is an uninterrupted series of i neutral differences (sign 0) that starts and ends with acceleration (sign -) or deceleration (sign +).
Figure 2.
Example of runs-based partitioning of a short tachogram. The runs can be classified as deceleration and acceleration runs of length i (DRi and ARi, respectively), with neutral runs represented by the symbol Ni, which can interrupt the deceleration/acceleration runs. A full grey circle indicates the start of a deceleration run. A full black circle marks the start of an acceleration run. These circles can be used as reference points for the respective runs [9].
It is common practice [9] [12] [13] to remove neutral runs from the record by adding white noise with a sufficiently small standard deviation. However, we will include neutral runs in our calculation and model building.
We calculate the Shannon entropy for each type of the monotonic run. If we define the value
p as a probability estimate of how likely it is to find an interval in the RR recording that belongs to a given run type of a given length:
where
i is run length and
k is run type and can be AR, DR, NR, the Shannon entropy for this estimator is as follows:
Mathematical details can be found [9]
2.4. pRR30 and pRR3.25%
One of the key parameter in HRV analysis is pRR50, a special case of a pRRx parameter, which measures the percentage of successive RR intervals differing by at least x = 50 ms. Recent study [
8] has explored a whole family of pRRx parameters and searched for a candidate for AF detection. They also explored pRRx% parameters (percentage of relative RR interval differences of at least x% of the previous RR interval).
In these study we found pRR30 and pRR3.25% to be promising candidates for AF detection, outperforming pRR50 in 60 seconds long RR time series.
2.5. Statistical analysis
Data distribution was not normal [Guzik P, Więckowska B. Data distribution analysis – a preliminary approach to quantitative data in biomedical research. JMS. 2023 Jun. 27;92(2):e869. DOI: 10.20883/medical.e869]. Non-parametric Spearman correlation analyzed associations between parameters. Receiver operating characteristic (ROC) [13] was used to investigate which parameters discriminated between 60-second segments of sinus rhythm (SR) and atrial fibrillation (AF). For each HRV parameter studied, Youden’s criterion was used to calculate the optimal cutoff from the ROC curve [14].
We used a 2:1 ratio to divide the final set of 63,826 recordings into the training dataset (42,763 samples) and the test dataset (21,063 samples. Univariate and multivariate logistic regression examined individual parameters or their combinations with either pRR30 or pRR3.25% or both pRR30 and pRR3.25%. A non-parametric bootstrap with 1,000 samples was used to estimate classification metrics with a 95% confidence interval. Accuracy, sensitivity and specificity were compared between features using a paired t-test, and the diagnostic odds ratio (DOR) [15] was studied by the Wilcoxon test [16]. Only p < 0.05 was considered statistically significant.
3. Results
Our data consisted of 64738 segments, from which 912 were discarded after filtration, leaving 63826 segments. 31753 of them were classified as AF and 32073 as SR. Mean RR is 698 ms for AF and 858 ms for SR.
3.1. Entropy distribution
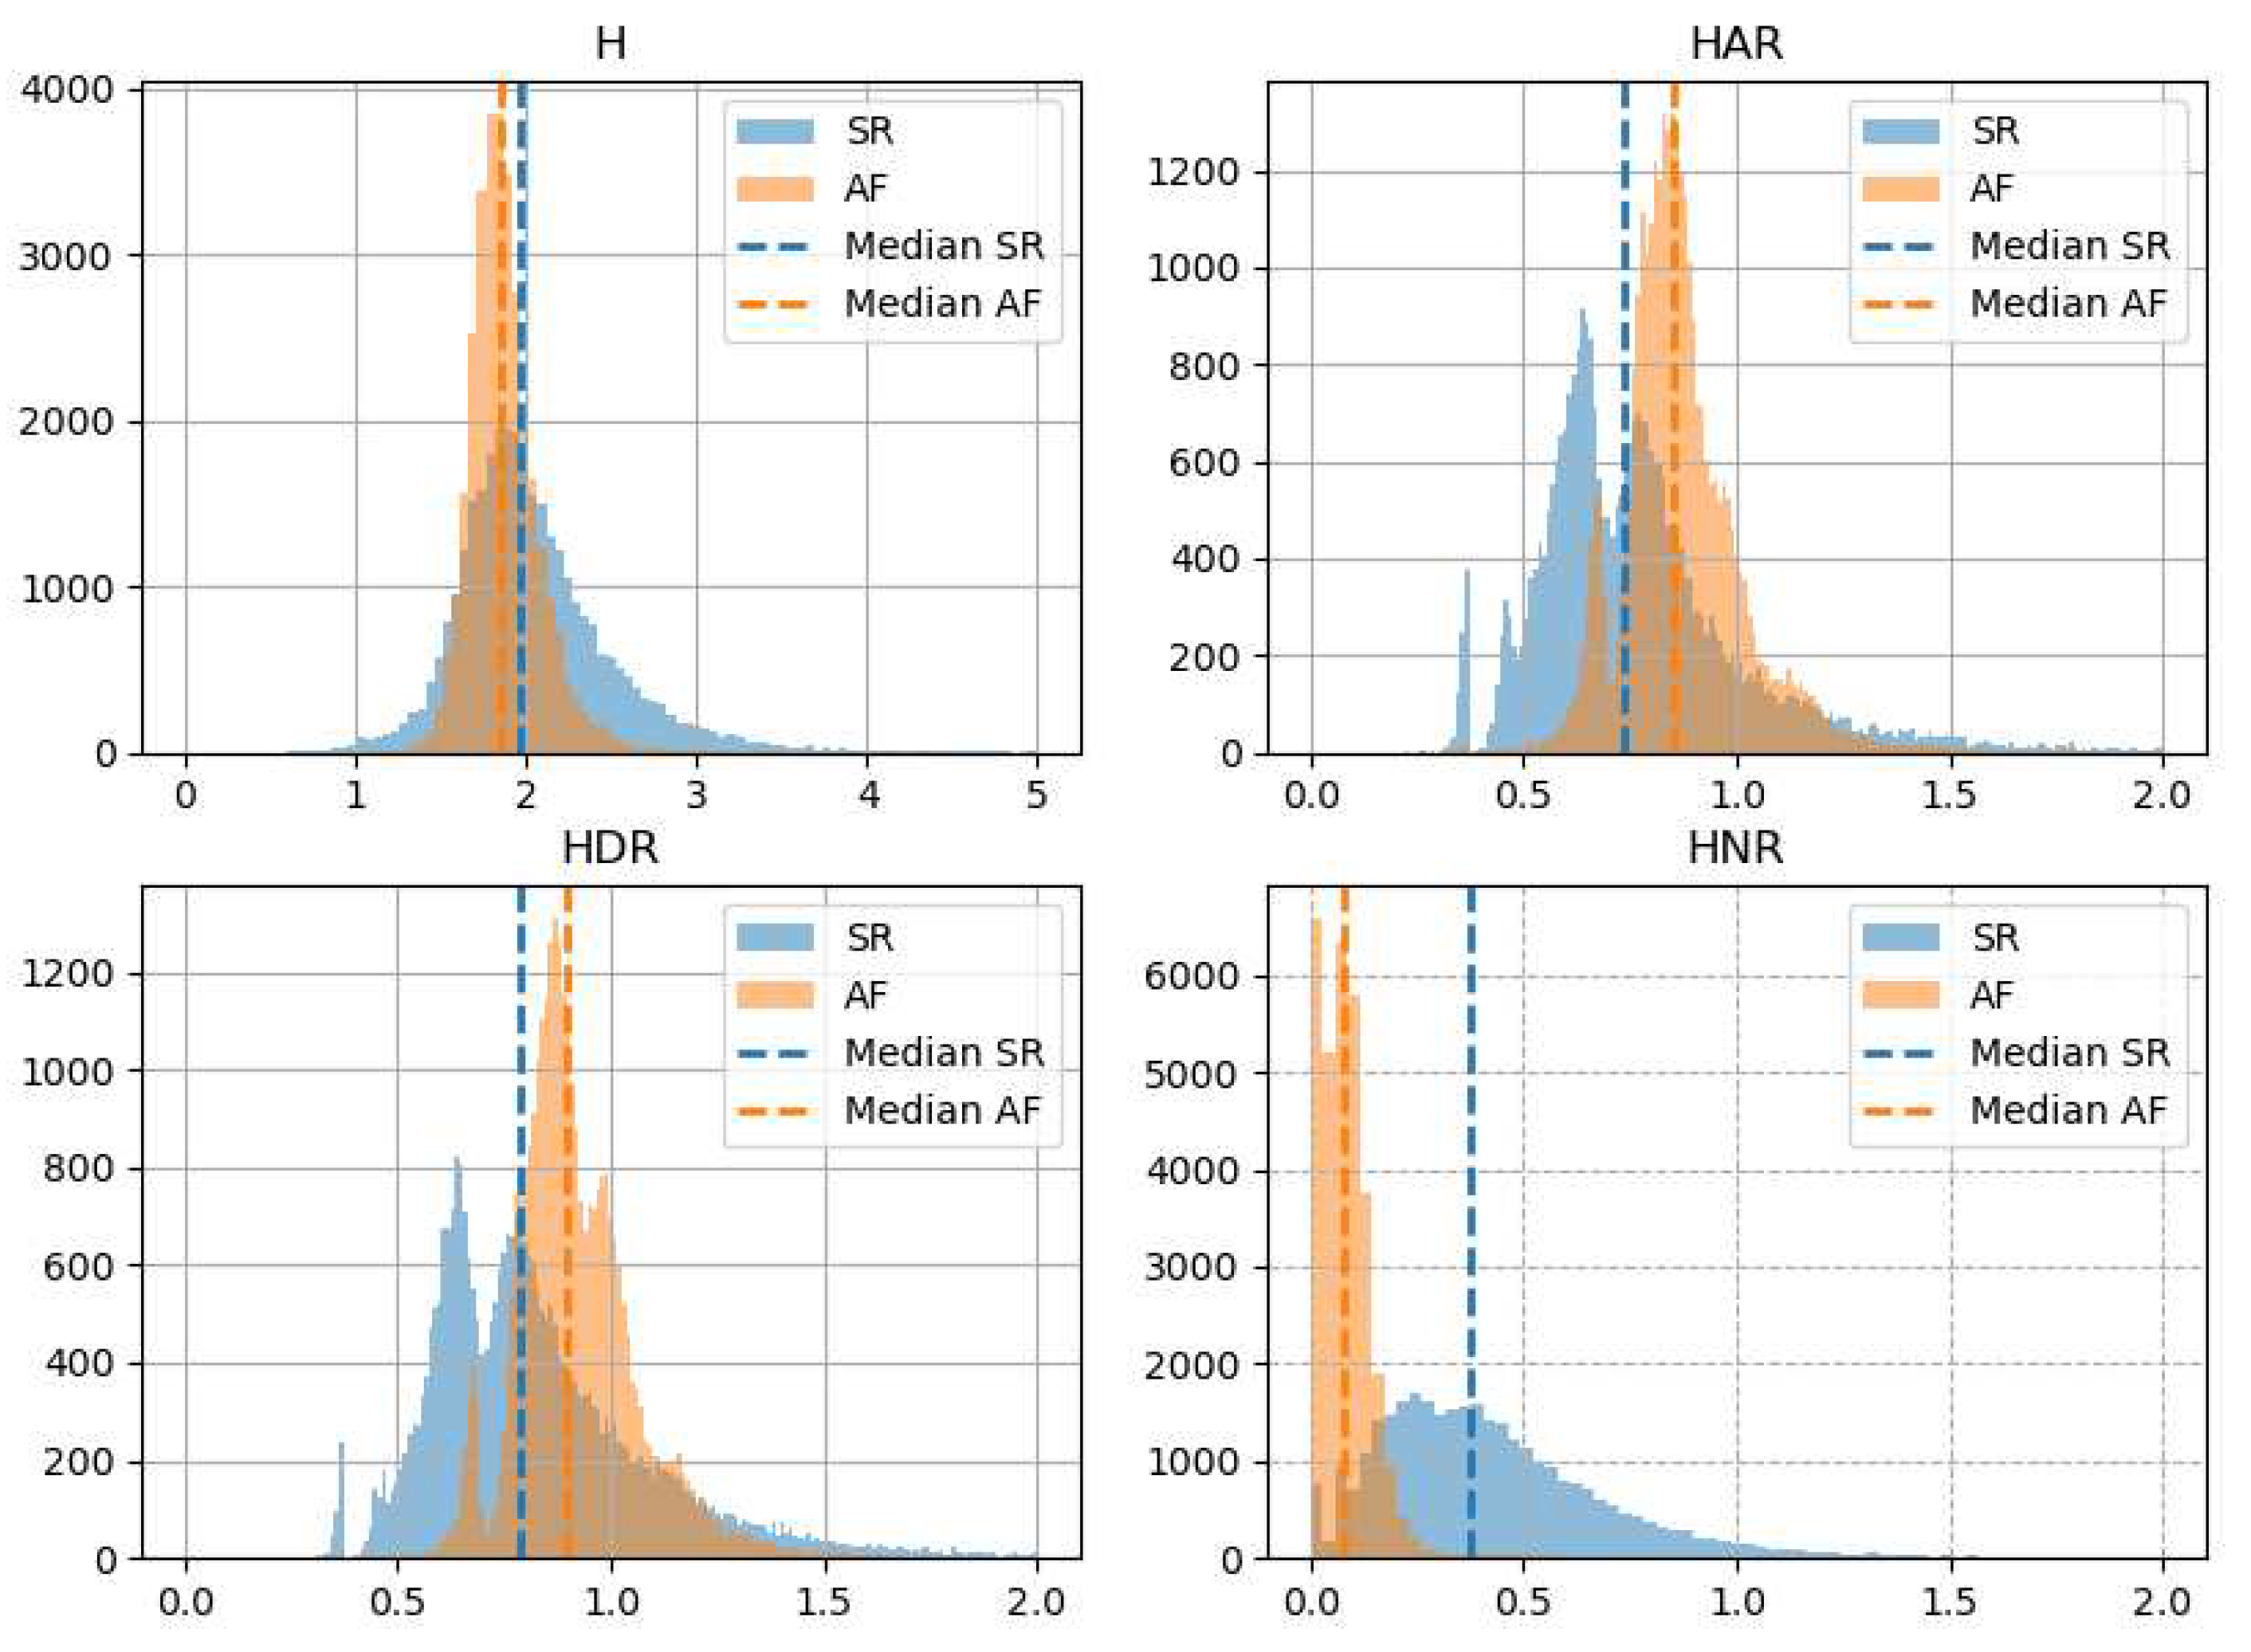
Figure 4 presents histograms for all studied types of asymmetrical entropy: total entropy (H), entropy of acceleration runs (HAR), entropy of deceleration runs (HDR) and entropy of neutral runs (HNR). All forms of entropy have narrower and higher histograms for AF than for SR. The peaks of histograms for H overlap for AF and SR, but are separated for HAR, HDR and HNR. Median HAR and HDR are higher for AF than for SR. In contrast, the median H and HNR is lower in AF.
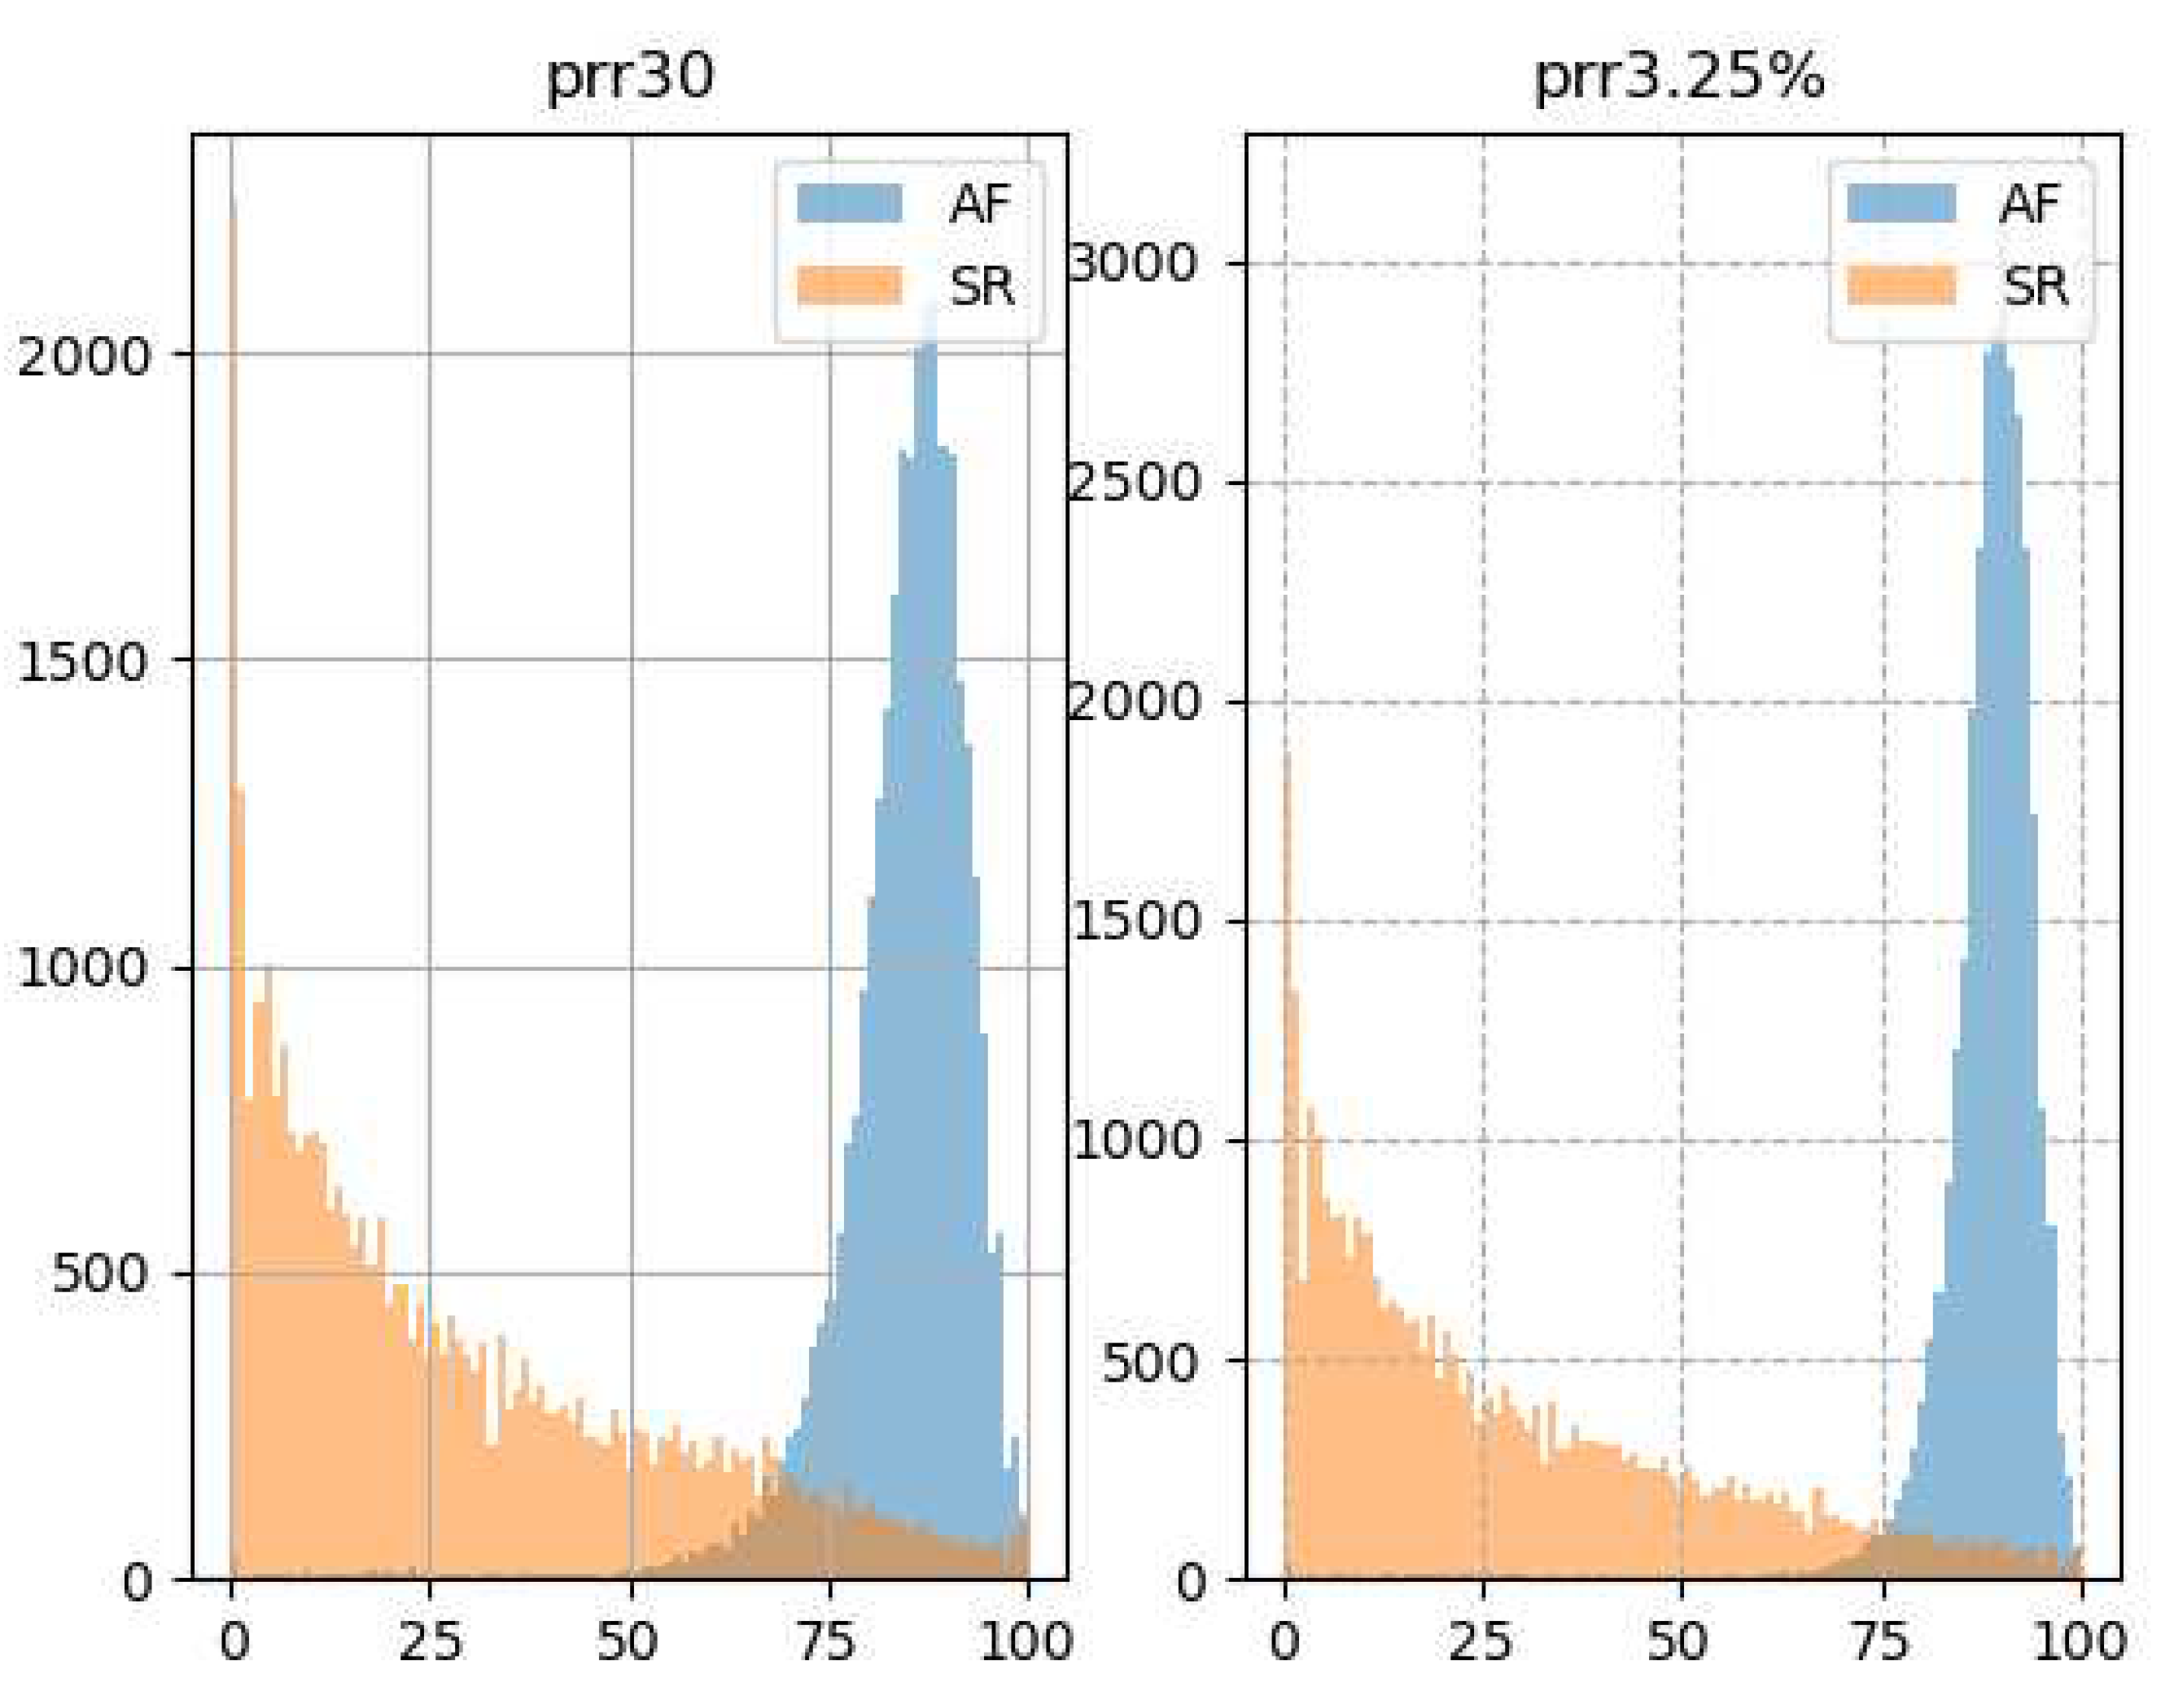
Figure 5 shows how the histograms of the pRR30 and pRR3.25% differ in AF and SR. For SR, the most common values of pRR30 and pRR3.25% are close to 0%. The rates gradually decrease for higher values of pRR30 and pRR.25%. In contrast, the distributions are shifted to the right for AF and the most common values of pRR30 and pRR3.25% are around 85% and 90%, respectively.
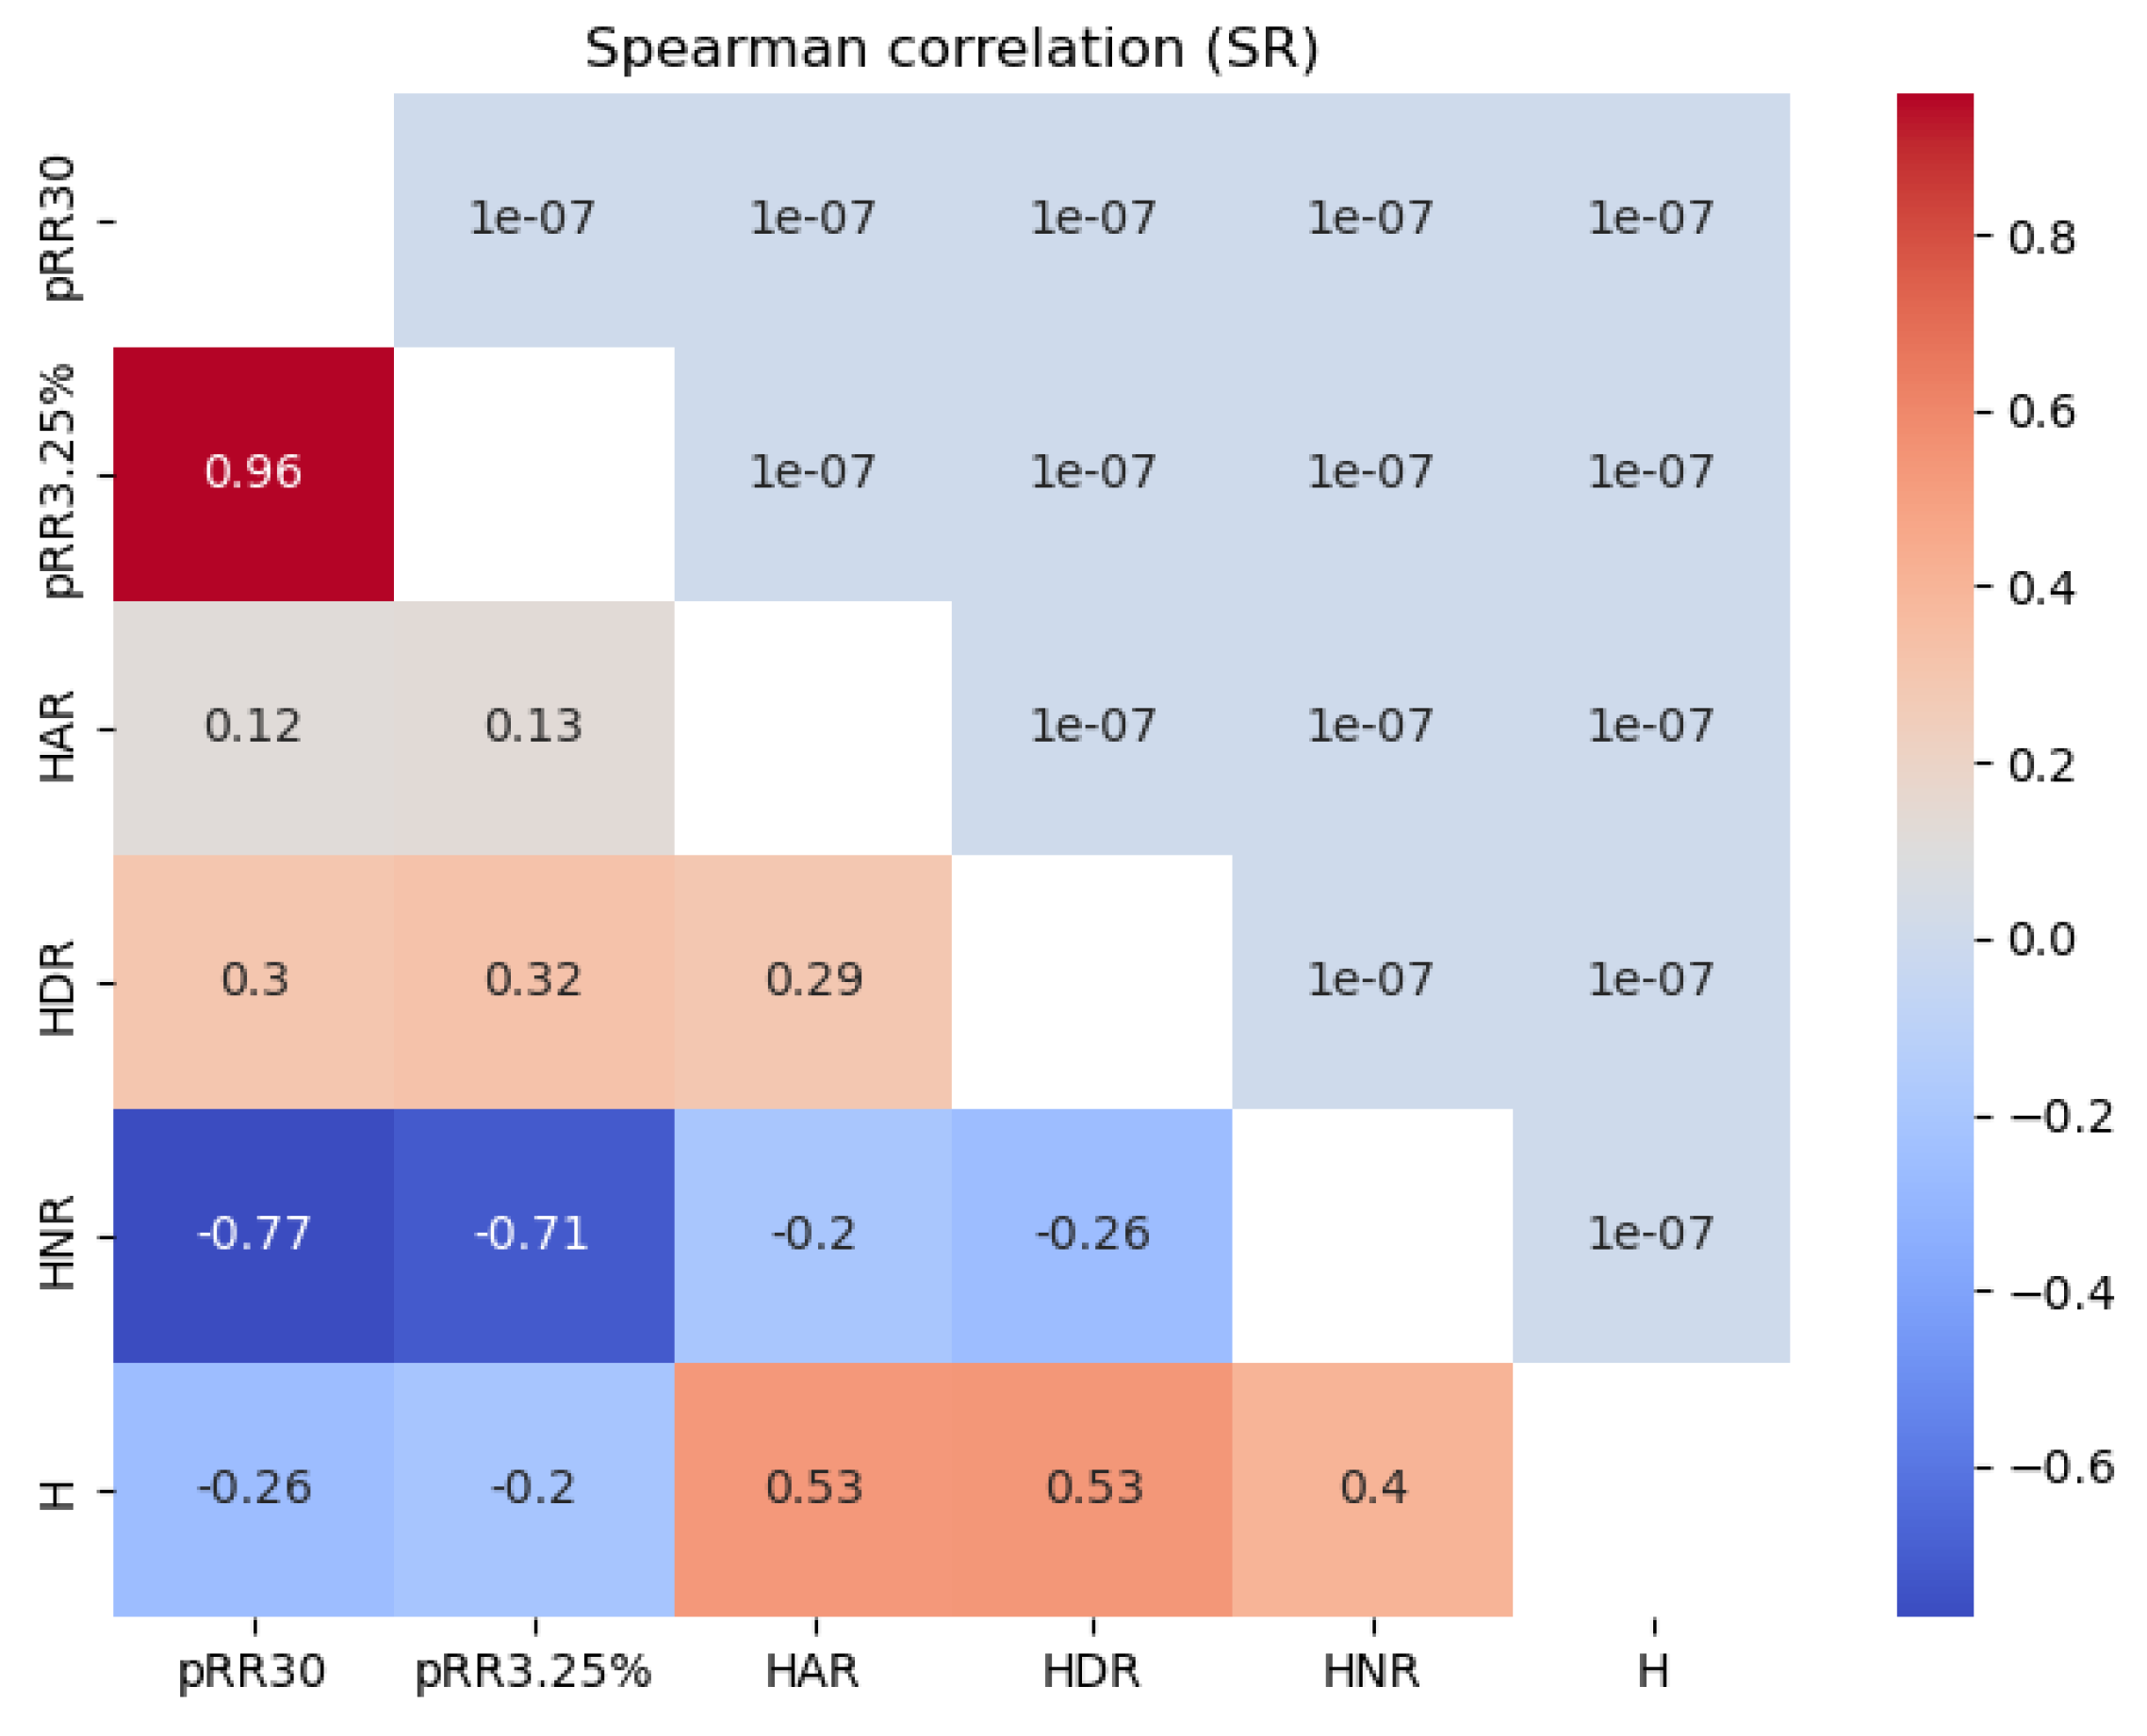
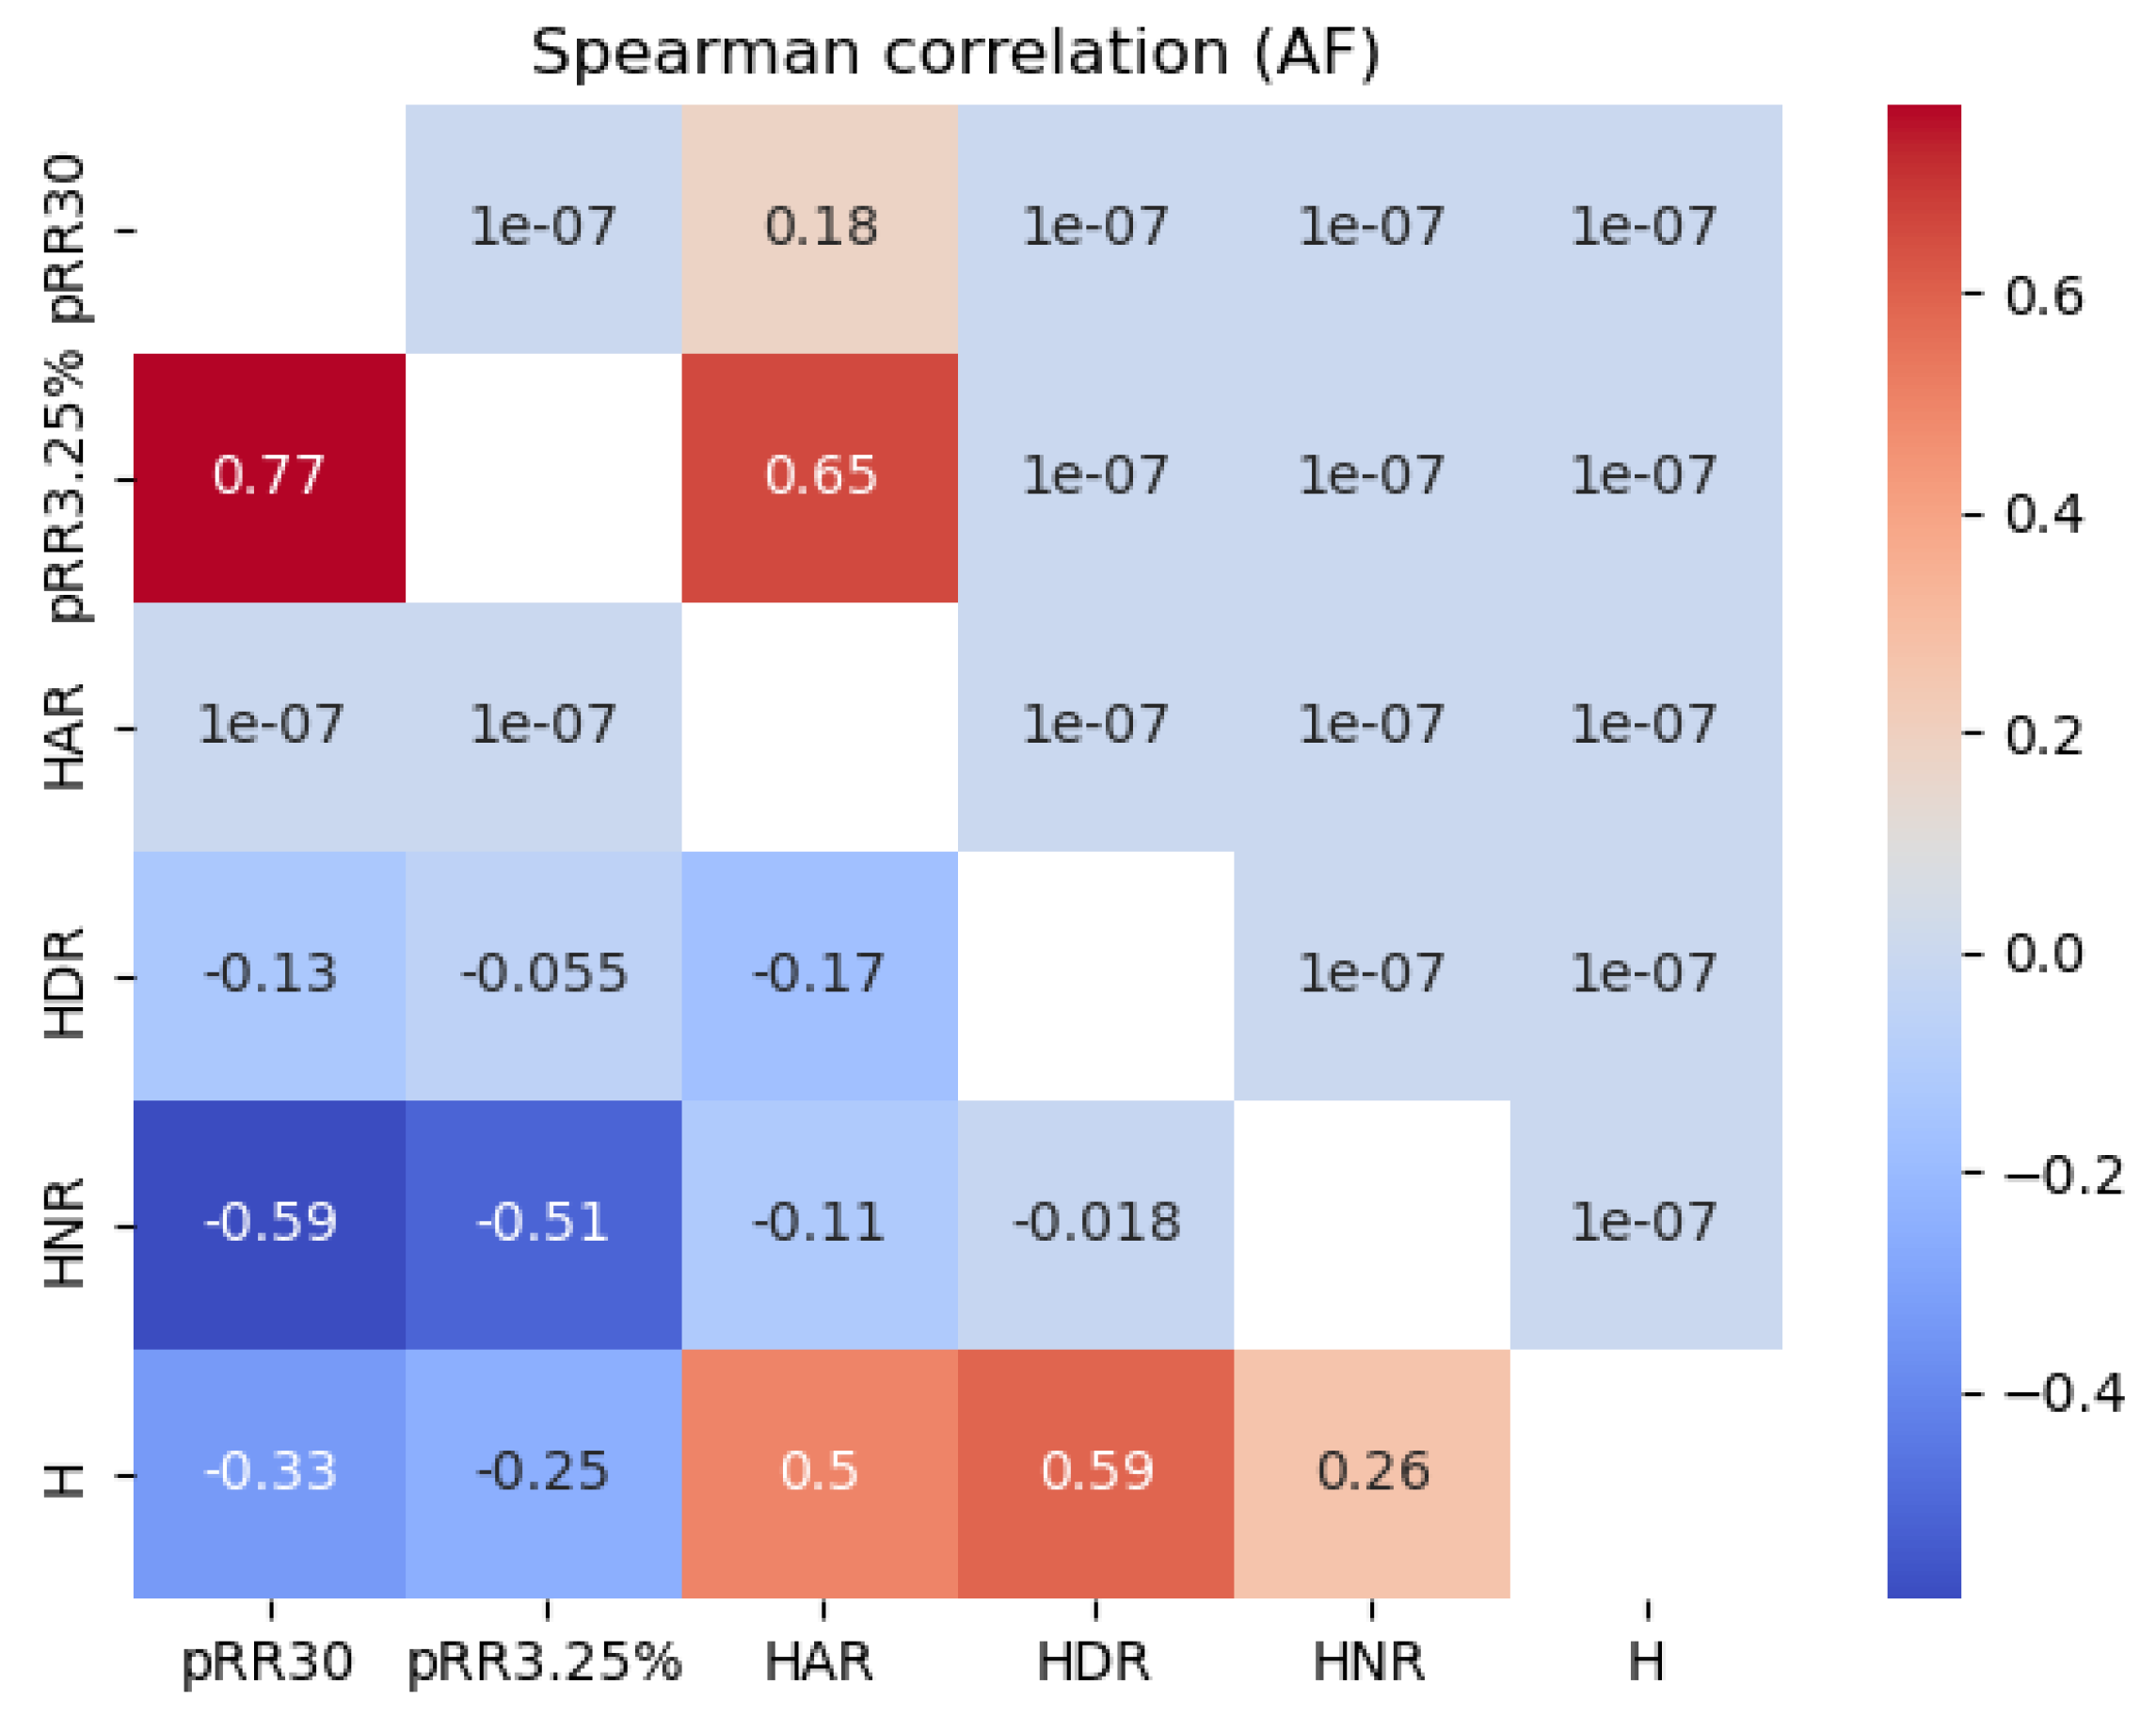
Figure 6 shows the Spearman correlation values between all the features examined for the SR and AF data separately. For SR, HNR correlated strongly and negatively (dark blue) with pRR30 (-0.77) and pRR3.25% (-0.71). The correlations between HNR and pRR30 and pRR3.25% were weaker for AF, with the most pronounced correlations for HNR and pRR30 (-0.59).
3.3. Diagnostic properties of single HRV parameters
Table 1 characterizes the diagnostic properties of all investigated parameters to differentiate AF from SR for the 1-minute ECG segments. As pRR3.25% has the highest AUC, it is considered the reference value for comparisons with other parameters and is included in all multivariate diagnostic models. AUC for the discrimination of AF from SR for the 1-minute RR interval ECG segments were all significantly different from 0.5. (p at least < 1 x 10
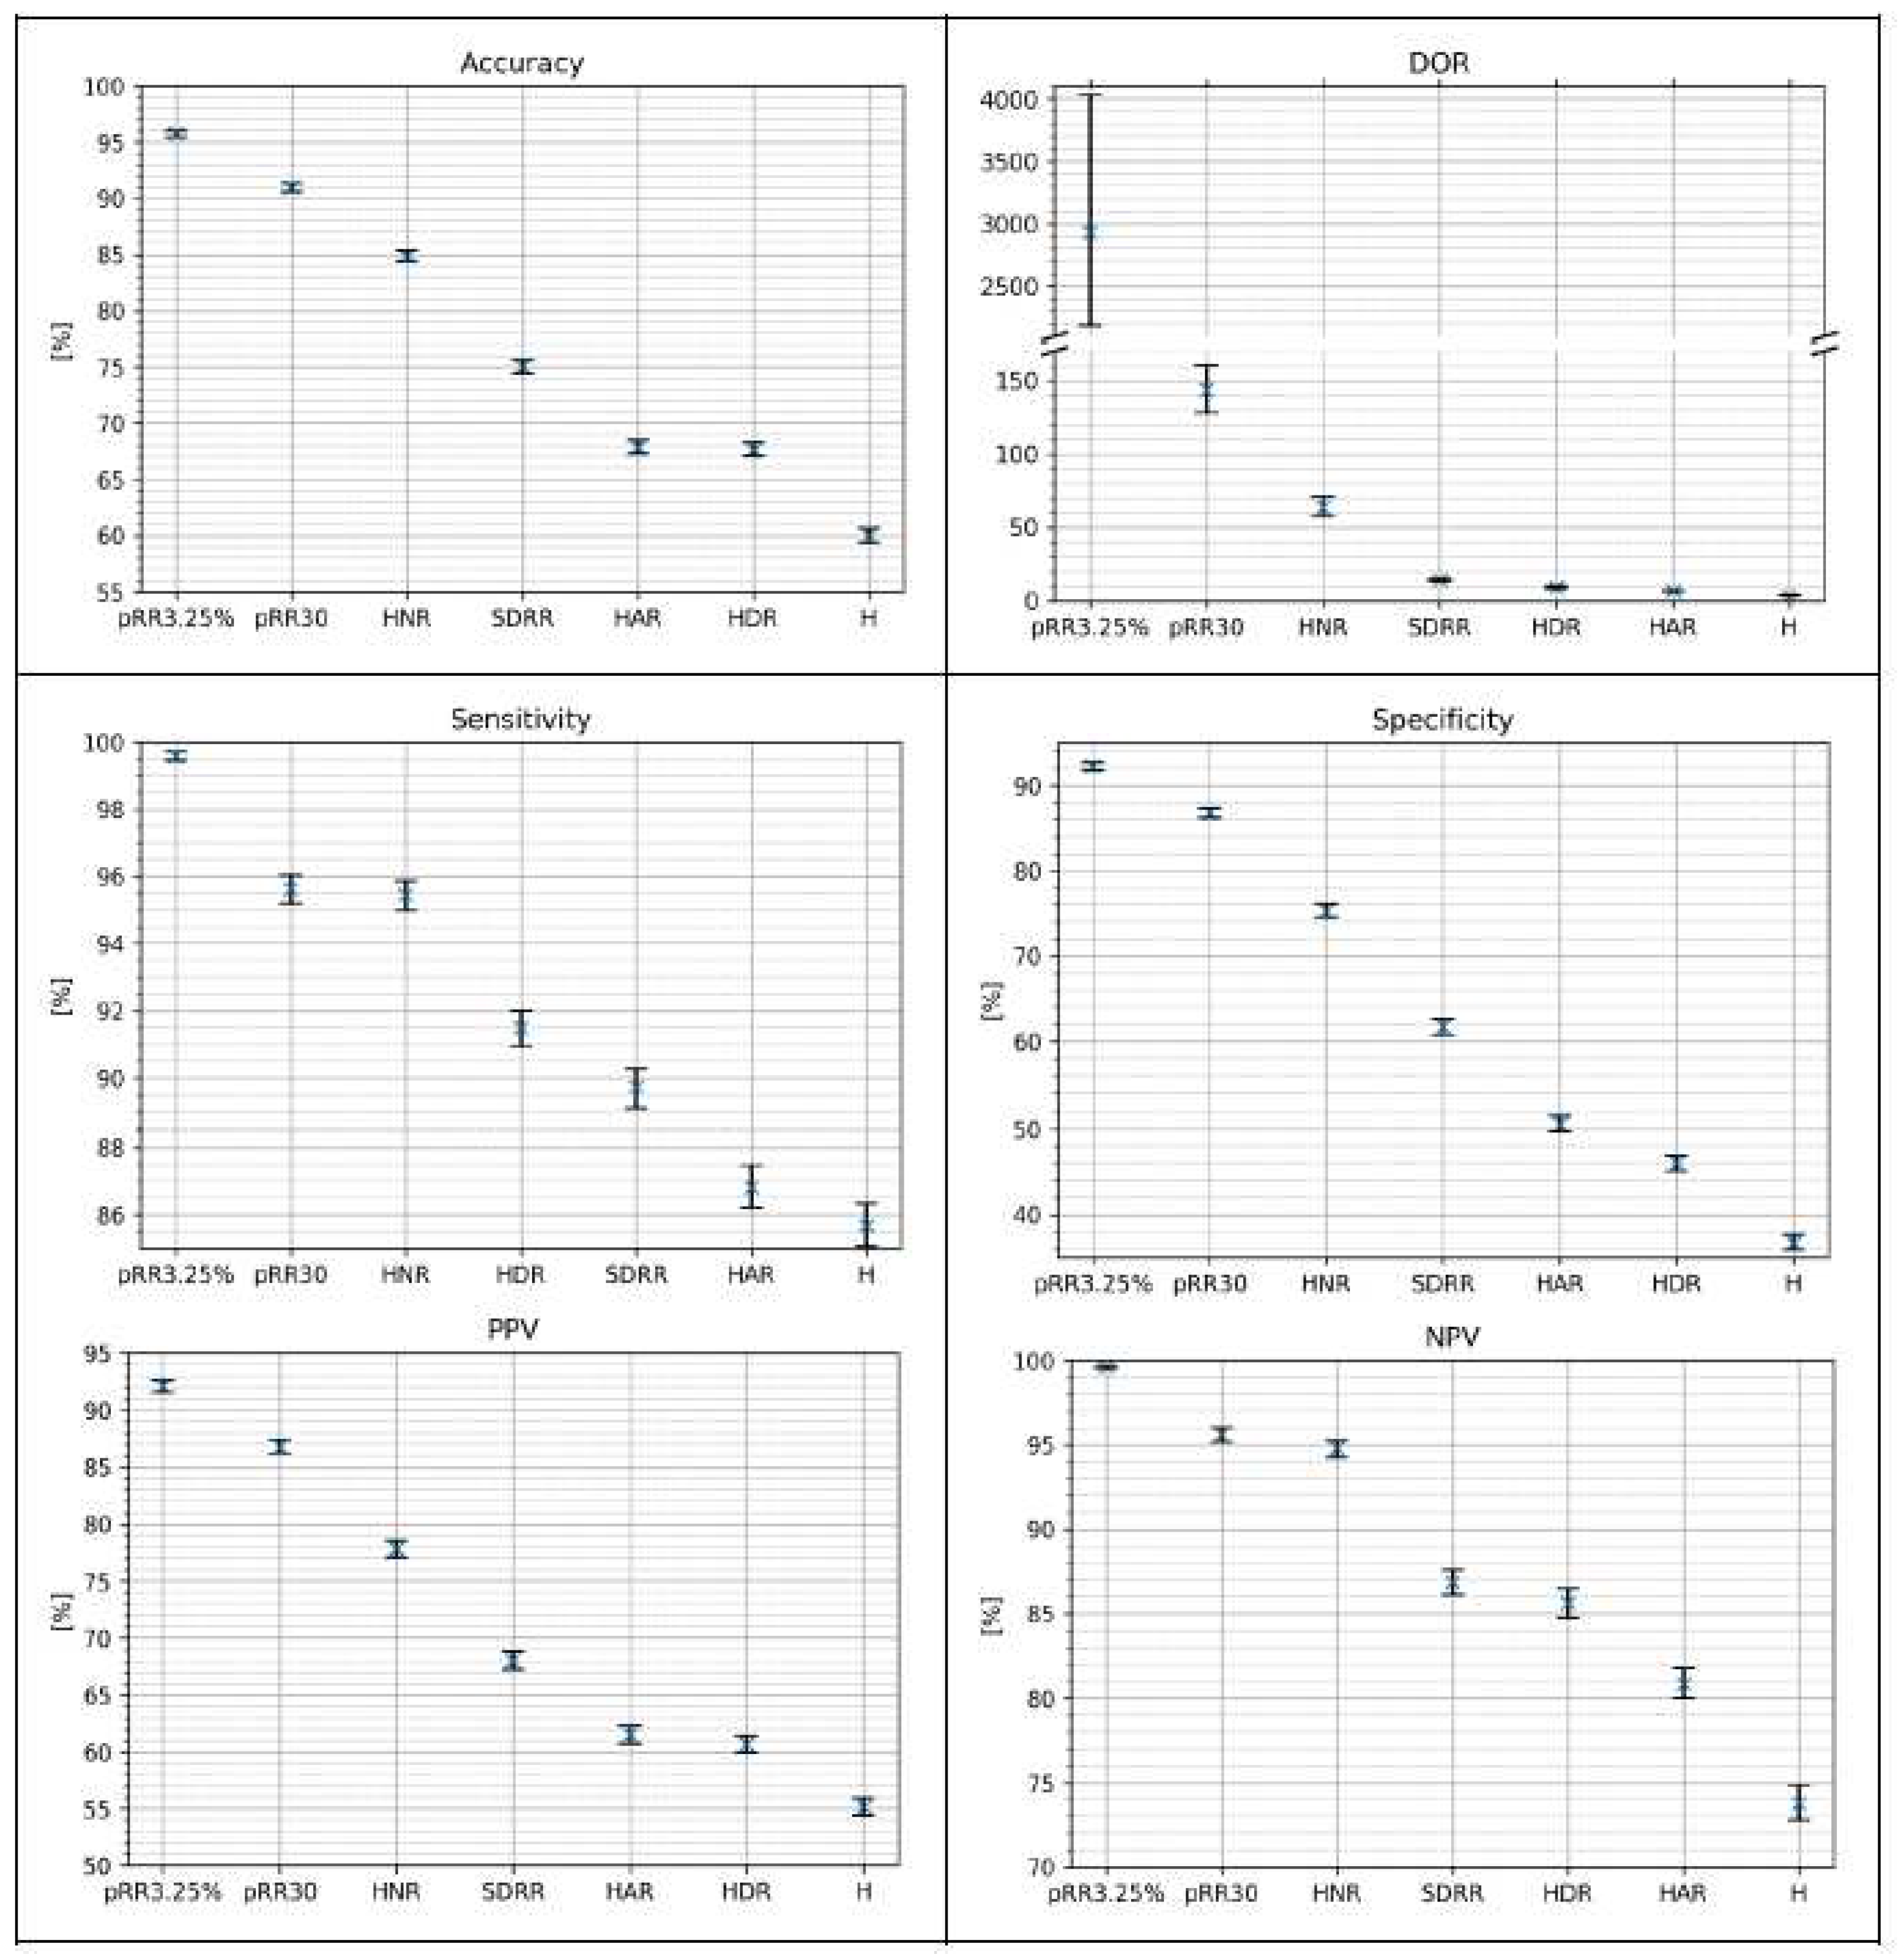
-114). The top three strongest candidates for AF detection are pRR3.25% (AUC = 0.9727) pRR30 (0.9596), and HNR (0.9315).
Figure 7 shows the classification metrics for AF detection on the testing dataset using the optimal cutoff method for single HRV parameters. For every metric, the best score achieved three parameters: pRR3.25%, pRR30 and HNR. The NPV difference between pRR30 and HNR is the smallest. The whiskers on the plots represent 95% confidence intervals from the bootstrap.
3.4. Diagnostic values of models built using pRR30, pRR3.25% and asymmetric entropy indices
Table 2 presents results of AF detection using univariate or multivariate logistic regression models on testing dataset. The highest AUC was achieved by model with three parameters: pRR30, pRR3.25% and H while pRR30, pRR3.25%, HAR has the highest DOR. From univariate models pRR3.25% has highest AUC and all other metrics.
From
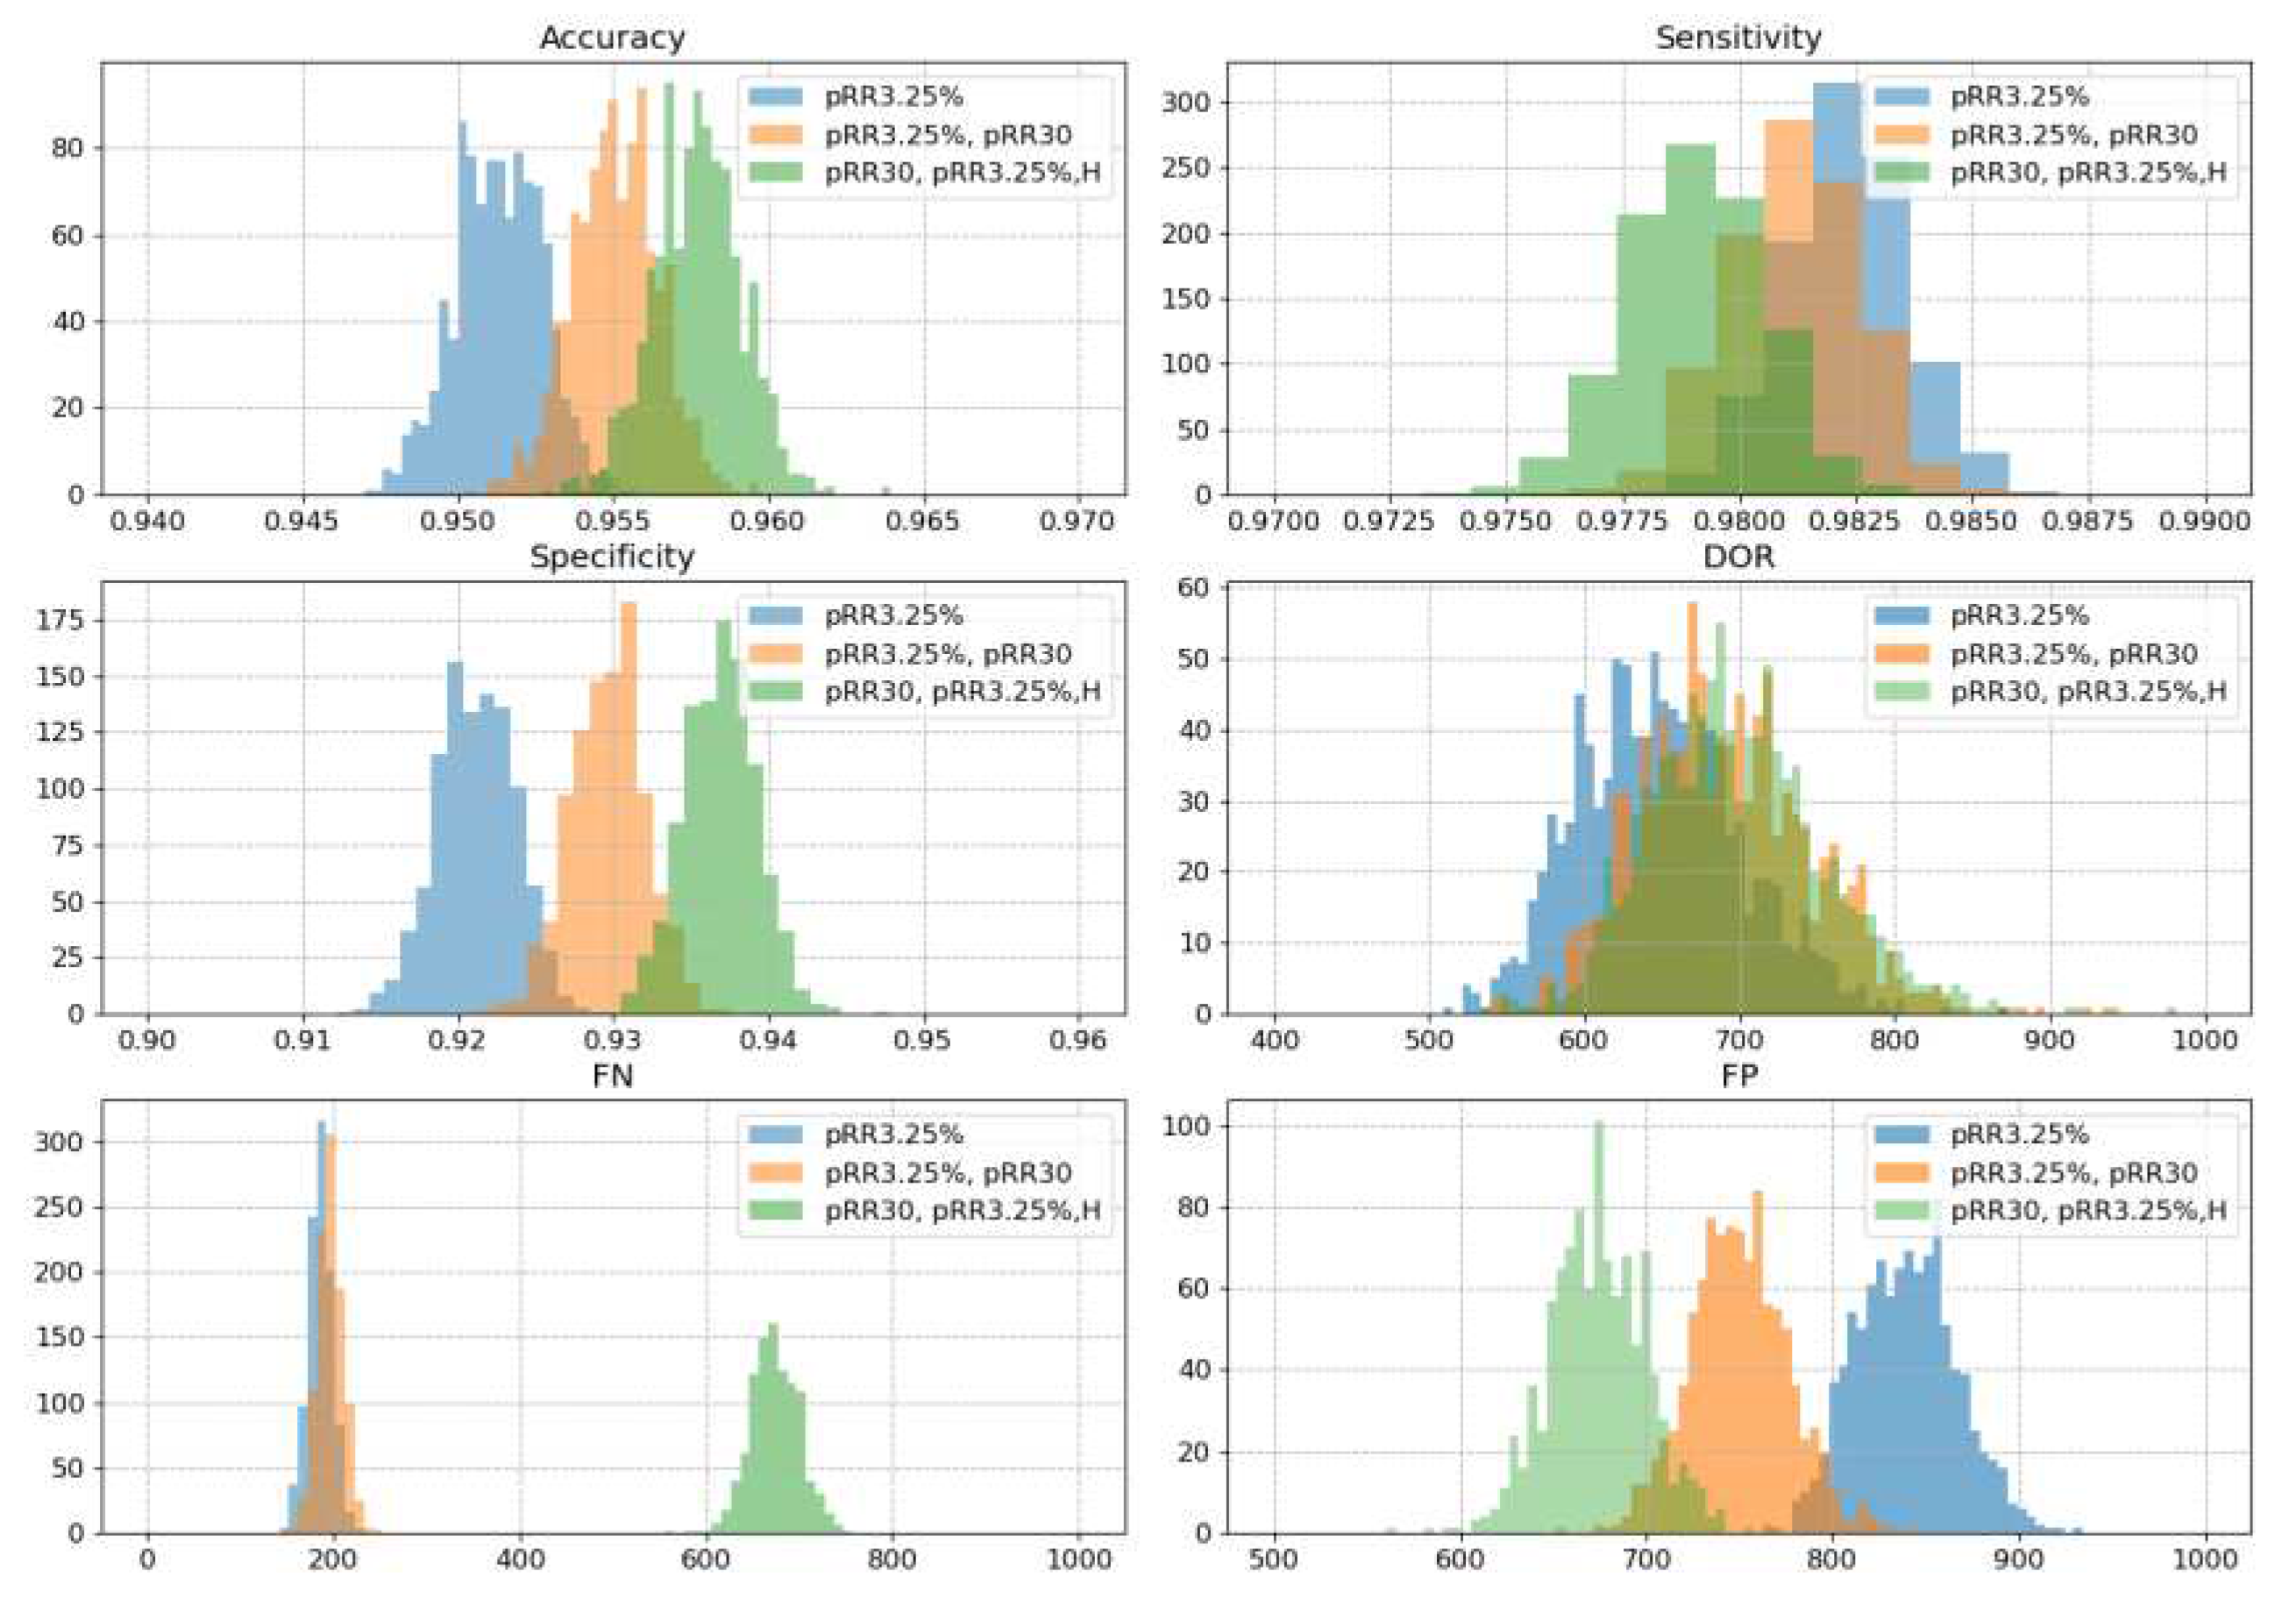
Table 2 we selected three models for further validation. The best (in AUC) single feature model which is pRR3.25%, best two-features model which is pRR3.25%& pRR30 and best three features model which is pRR3.25%,&pRR30& H. A 1000-resampled bootstrap test revealed a statistically significant difference in AUC (p-value = 0.02) between the one-feature and two-feature models. Furthermore, the comparisons between the one-feature versus three-feature and two-feature versus three-feature models yielded p-values less than 10^-6, indicating highly significant differences. The same bootstrap methodology was employed to assess the performance of the models in terms of accuracy, sensitivity, specificity, DOR, FN, and FP. In all cases, the differences between the models were statistically significant, with p-values consistently below 10^-5. Figure provides histograms with a visual representation of these findings.
It is worth noting that the scales in
Figure 8 for accuracy, sensitivity and specificity on the respective x-axes have been adapted. In this way it is easier to see the small differences. In practice, however, the range of these differences is negligible. Optimizing the models for AUC is at the expense of undetection of AF. The median FN for pRR3.25% and pRR3.25% & pRR30 increases from less than 200 to almost 700 undetected AF for the model with pRR3.25%, pRR30 and H.
4. Discussion
We found that both pRR3.25% and pRR30 outperformed all asymmetric entropy parameters in their diagnostic value for detecting AF in 1-minute ECGs. For AF detection, the best single parameter was pRR3.25% with an AUC of 0.972 and a DOR of 643, the second best was pRR30 with an AUC of 0.959 and a DOR of 233.5, and the third best was HNR with an AUC of 0.93 and a DOR of 84.5. All combinations that had either a higher AUC or DOR than a single pRR3.25% contained pRR3.25%. The best combination when measured by AUC was pRR3.25%, pRR30and H, while when measured by DOR it was pRR3.25% and H. However, the combined models with higher AUC or DOR had increased false negative values. Using pRR3.25% as a reference, the observed increases in AUC were of negligible clinical value as they were up to 0.006, which is less than 1% improvement. In addition, using the best combination, i.e. pRR3.25%, pRR30 and H, was associated with a risk of increasing false-negative AF diagnoses - the number of undiagnosed AF episodes increased almost fourfold
This study is not the first one to demonstrate entropy based features for AF detection. In [23] Richman JS and Moorman JR have introduced sample entropy, a novel method for comparing two physiological time series. Liu C et al. and Zhao L et al [21,22] have compared different entropic measures and proposed a novel one, called normalized fuzzy entropy for AF detection. They have achieved 0.86 accuracy for 60 beats long RR segments. Their approach and other tested features was based on sample entropy [23].
Runs-based asymmetrical entropy is very different from sample entropy. It does not depend on parameters which represent matching radius for determining similarity between subsequences of data points within a time series and can break relative consistency which means it does not always provide consistent results when sample size is increasing [24]. Run-based asymmetric entropy has a more straightforward interpretation. It quantitatively separates the contributions of accelerating, decelerating and neutral runs to the overall asymmetry of the time series (
Figure 2).
We found a negative correlation between the asymmetric entropy of NR and pRR30. In addition, the HNR distribution differs between AF and SR. The AF classifier built from HNR alone has an accuracy of over 0.88, the best among other run-based asymmetric entropy parameters. Neutral runs are either ignored, removed from the analysis or replaced by the addition of white noise [9,12,13]. However, neutral runs may contain valuable information, especially in the context of AF detection. Typically, their contribution to HRV is either zero (to short-term HRV) or random and depends on the ECG sampling frequency. However, their lower rate in AF provides interesting information.
The nature of AF makes RR intervals highly random with low stability. This results in a low probability of finding two or more consecutive RR intervals of the same duration. It also explains why there are fewer neutral runs in AF than in SR. Changes in RR interval duration in SR are gradual. They are controlled by many physiological mechanisms that modulate sinus node depolarisation. In AF, fast fibrillation waves above 350 depolarisations/minute reset and quieten the sinus node. Changes between successive RR intervals in AF are less well controlled and therefore more dramatic. We have previously reported higher values of pRRx and pRRx% in AF than in SR [8]. Therefore, the probability of small changes between consecutive RR intervals is low in AF but higher in SR. Here we show that information derived from neutral runs has some diagnostic properties. However, it is uncertain whether this information should be incorporated into AF detection algorithms. All run-based asymmetric entropy measures, either as single parameters or in combination with pRR3.25% or pRR30 , are not particularly effective in discriminating AF from SR. They are also more complex to calculate than pRR3.25% or pRR30 .
As previously shown, the pRRx and pRRx% families have interesting diagnostic properties for distinguishing ECG segments with AF from SR. First, we demonstrated that pRR30 outperformed other commonly used HRV indices including SDNN, SD1, SD2, SD2/SD1, coefficient of variation, for the same purpose [25]. Second, we showed that pRR30 is outperformed by the pRRx% family, especially pRR3.25%. In this study, we report that both pRR30 and pRR3.25 have better diagnostic properties for AF detection than any of the run-based asymmetric entropy descriptors. Adding asymmetric entropy-derived descriptors to models with pRR30 or pRR3.25 slightly improved their AUC or DOR, but at the cost of increasing FN.
The impact of false positive and false negative results can vary depending on the specific condition being tested for and the context in which the test is performed. For example, a false positive result for a serious condition may lead to unnecessary treatment or further testing. Conversely, a false negative result may delay necessary treatment. In AF, a false-negative diagnosis appears to be more harmful than a positive diagnosis. A patient with undiagnosed AF will not receive antithrombotic treatment and will remain at increased risk of ischaemic stroke. In contrast, a false-positive result leads to further testing and has no immediate negative consequences [19] [20].
Our study had several limitations. The analysis was based on RR intervals from 1-minute ECGs only, potentially missing longer-term cardiac dynamics that contribute to entropy. We cannot extrapolate our findings to ECGs of shorter or longer duration. The sampling frequency of our data was only 128 Hz, which increases the rate of neutral RR intervals for technical rather than physiological reasons. In this study we tested the ability to detect AF using classic simple logistic regression models. Although we achieved a high accuracy rate of 0.96, there is potential for even higher accuracy rates using more complex machine learning models. ML algorithms [21] may perform better with random forest than with logistic regression. Whether this applies to our results is uncertain. It is noteworthy that the AUC for AF detection by pRR3.25% is already close to 1 and there is not much room for improvement. However, it may be worth exploring a wider range of machine learning models, such as XGBoost or Random Forest, to determine their ability to detect AF from the asymmetric entropy of neutral runs. These models may be able to capture more complex relationships between the features and the target variable.
The novelty of our study lies in the comprehensive investigation of AF detection using a novel combination of runs-based asymmetric entropy and pRR30 with pRR3.25% and pRR30 . Runs based asymmetric entropy has not previously been tested as a candidate for AF detection. Another novelty was not to remove neutral runs but to include them and analyze their characteristics, which seems to be useful.
5. Conclusions
pRR3.25% stands out as a robust and reliable choice for effectively identifying AF episodes, even in comparison with runs-based asymmetrical entropy. While it is observed that more complex models such as pRR3.25%, pRR30 and H exhibit slightly enhanced performance on a general scale, this marginal improvement is often overshadowed by the substantial drawback of a nearly fourfold increase in false negatives. Notably, it is worth emphasizing that every superior model inherently encompasses the pRR3.25% parameter. This underscores the foundational importance of pRR3.25% in contributing to the diagnostic accuracy of any enhanced model. In practical clinical applications, the single-parameter model with pRR3.25% emerges as the optimal choice, delivering a commendable balance between detection precision and false-negative rates.
Our results suggest that HNR may be a helpful parameter for AF detection, and future studies should investigate its potential further.
Author Contributions
Conceptualization, Jarosław Piskorski and Przemysław Guzik; Data curation, Szymon Buś; Formal analysis, Bartosz Biczuk and Szymon Buś; Investigation, Bartosz Biczuk; Methodology, Bartosz Biczuk, Szymon Buś and Sebastian Żurek; Project administration, Przemysław Guzik; Resources, Przemysław Guzik; Software, Bartosz Biczuk, Szymon Buś and Jarosław Piskorski; Supervision, Jarosław Piskorski and Przemysław Guzik; Visualization, Bartosz Biczuk and Szymon Buś; Writing – original draft, Bartosz Biczuk and Szymon Buś; Writing – review & editing, Bartosz Biczuk, Szymon Buś, Sebastian Żurek, Jarosław Piskorski and Przemysław Guzik.
Funding
This research received no external funding
Conflicts of Interest
The authors declare no conflict of interest.
References
- G. Hindricks, T. Potpara, N. Dagres, E. Arbelo, J. Bax, C. Blomström-Lundqvist, G. Boriani, M. Castella, G. Dan and P. Dilaveris, "2020 ESC Guidelines for the diagnosis and management of atrial fibrillation developed in collaboration with the European Association for Cardio-Thoracic Surgery (EACTS): The Task Force for the diagnosis and management of atrial fibrillation of the Europea," European heart journal, Vols. 42,5, pp. 373-498, 2021. [CrossRef]
- Ble M, Benito B, Cuadrado-Godia E, Pérez-Fernández S, Gómez M, Mas-Stachurska A, Tizón-Marcos H, Molina L, Martí-Almor J, Cladellas M. Left Atrium Assessment by Speckle Tracking Echocardiography in Cryptogenic Stroke: Seeking Silent Atrial Fibrillation. J Clin Med. 2021 Aug 9;10(16):3501. [CrossRef]
- Roten L, Goulouti E, Lam A, Elchinova E, Nozica N, Spirito A, Wittmer S, Branca M, Servatius H, Noti F, Seiler J, Baldinger SH, Haeberlin A, de Marchi S, Asatryan B, Rodondi N, Donzé J, Aujesky D, Tanner H, Reichlin T, Jüni P. Age and Sex Specific Prevalence of Clinical and Screen-Detected Atrial Fibrillation in Hospitalized Patients. J Clin Med. 2021 Oct 22;10(21):4871. [CrossRef]
- .
- Turagam MK, Flaker GC, Velagapudi P, Vadali S, Alpert MA. Atrial Fibrillation In Athletes: Pathophysiology, Clinical Presentation, Evaluation and Management. J Atr Fibrillation. 2015;8(4):1309. [CrossRef]
- Lin AL, Nah G, Tang JJ, Vittinghoff E, Dewland TA, Marcus GM. Cannabis, cocaine, methamphetamine, and opiates increase the risk of incident atrial fibrillation. Eur Heart J. 2022;43(47):4933-4942. [CrossRef]
- Rizwan, A. Zoha, I. Mabrouk, H. Sabbour, A. Al-Sumaiti, A. Alomainy, M. Imran and Q. Abbasi, "A Review on the State of the Art in Atrial Fibrillation Detection Enabled by Machine Learning," IEEE Reviews in Biomedical Engineering, vol. 14, pp. 219-239, 2021. [CrossRef]
- Khan AA, Lip GYH, Shantsila A. Heart rate variability in atrial fibrillation: The balance between sympathetic and parasympathetic nervous system. Eur J Clin Invest. 2019 Nov;49(11):e13174. [CrossRef]
- Buś S, Jędrzejewski K, Guzik P. Statistical and Diagnostic Properties of pRRx Parameters in Atrial Fibrillation Detection. J Clin Med. 2022 Sep 27;11(19):5702. [CrossRef]
- Piskorski J, Guzik P. The structure of heart rate asymmetry: deceleration and acceleration runs. Physiol Meas. 2011 Aug;32(8):1011-23. [CrossRef]
- Goldberger AL, Amaral LA, Glass L, Hausdorff JM, Ivanov PC, Mark RG, Mietus JE, Moody GB, Peng CK, Stanley HE. PhysioBank, PhysioToolkit, and PhysioNet: components of a new research resource for complex physiologic signals. Circulation. 2000 Jun 13;101(23):E215-20. [CrossRef]
- Petrutiu S, Sahakian AV, Swiryn S. Abrupt changes in fibrillatory wave characteristics at the termination of paroxysmal atrial fibrillation in humans. Europace. 2007 Jul;9(7):466-70. [CrossRef]
- Y. Mina-Paz, V. Santana-García, L. Tafur-Tascon, M. Cabrera-Hernández, A. Pliego-Carrillo and J. Reyes-Lagos, "Analysis of Short-Term Heart Rate Asymmetry in High-Performance Athletes and Non-Athletes.," Symmetry, vol. 14, no. 1229, 2022. [CrossRef]
- Sibrecht G, Piskorski J, Krauze T, Guzik P. Heart Rate Asymmetry, Its Compensation, and Heart Rate Variability in Healthy Adults during 48-h Holter ECG Recordings. J Clin Med. 2023 Feb 3;12(3):1219. [CrossRef]
- W. B. Guzik P, "Data distribution analysis – a preliminary approach to quantitative data in biomedical research.," JMS [Internet], 2023. [CrossRef]
- T. Fawcett, "An introduction to ROC analysis," Pattern Recognit. Lett., vol. 27, p. 861–874, 2006. [CrossRef]
- W. Youden, "Index for rating diagnostic tests.," Cancer, vol. 3, pp. 32–35.;2-3, 1950. [CrossRef]
- Glas, J. Lijmer, M. Prins, G. Bonsel and P. Bossuyt, " The diagnostic odds ratio: A single indicator of test performance.," J. Clin. Epidemiol., vol. 56, pp. 1129–1135, 2003. [CrossRef]
- F. Wilcoxon, "Individual Comparisons by Ranking Methods.," Biom. Bull, vol. 1, pp. 80-83., 1945. [CrossRef]
- Renshaw AA, Gould EW. Reducing false-negative and false-positive diagnoses in anatomic pathology consultation material. Arch Pathol Lab Med. 2013 Dec;137(12):1770-3. [CrossRef]
- Klinkman MS, Coyne JC, Gallo S, Schwenk TL. False positives, false negatives, and the validity of the diagnosis of major depression in primary care. Arch Fam Med. 1998 Sep-Oct;7(5):451-61. [CrossRef]
- Liu C, Oster J, Reinertsen E, Li Q, Zhao L, Nemati S, Clifford GD. A comparison of entropy approaches for AF discrimination. Physiol Meas. 2018 Jul 6;39(7):074002. [CrossRef]
- Zhao L, Liu C, Wei S, Shen Q, Zhou F, Li J. A New Entropy-Based Atrial Fibrillation Detection Method for Scanning Wearable ECG Recordings. Entropy (Basel). 2018 Nov 26;20(12):904. [CrossRef]
- Richman JS, Moorman JR. Physiological time-series analysis using approximate entropy and sample entropy. Am J Physiol Heart Circ Physiol. 2000 Jun;278(6):H2039-49. [CrossRef]
- Żurek S, Grabowski W, Wojtiuk K, Szewczak D, Guzik P, Piskorski J. Relative Consistency of Sample Entropy Is Not Preserved in MIX Processes. Entropy (Basel). 2020 Jun 21;22(6):694. [CrossRef]
- Buś S, Jędrzejewski K, Guzik P. Using Minimum Redundancy Maximum Relevance Algorithm to Select Minimal Sets of Heart Rate Variability Parameters for Atrial Fibrillation Detection. J Clin Med. 2022 Jul 11;11(14):4004. [CrossRef]
|
Disclaimer/Publisher’s Note: The statements, opinions and data contained in all publications are solely those of the individual author(s) and contributor(s) and not of MDPI and/or the editor(s). MDPI and/or the editor(s) disclaim responsibility for any injury to people or property resulting from any ideas, methods, instructions or products referred to in the content. |
© 2024 by the authors. Licensee MDPI, Basel, Switzerland. This article is an open access article distributed under the terms and conditions of the Creative Commons Attribution (CC BY) license (http://creativecommons.org/licenses/by/4.0/).

