
Submitted:
26 January 2024
Posted:
26 January 2024
You are already at the latest version
Abstract
Diamond-like carbon (DLC) layers are known for their high corrosion and wear resistance, low friction, and high biocompatibility. However, it is often necessary to dope DLC layers with additional chemical elements to strengthen their adhesion to the substrate. Ti-DLC layers (doped with 0.4, 2.1, 3.7, 6.6, 12.8 at.% of Ti) were prepared by dual pulsed laser deposition, and pure DLC, glass, and polystyrene (PS) were used as controls. In vitro cell-material interactions were investigated with an emphasis on cell adhesion, proliferation, and osteogenic differentiation. We observed slightly increasing roughness and contact angle and decreasing surface free energy on Ti-DLC layers with increasing Ti content. Three-week biological experiments were performed using adipose tissue-derived stem cells (ADSCs) and bone marrow mesenchymal stem cells (bmM-SCs) in vitro. The cell proliferation activity was similar or slightly higher on the Ti-doped materials than on glass and PS. Osteogenic cell differentiation on all materials was proved by collagen and osteocalcin production, ALP activity, and Ca deposition. The bmMSCs exhibited greater initial proliferation potential and an earlier onset of osteogenic differentiation than the ADSCs. The ADSCs showed a slightly higher formation of focal adhesions, higher metabolic activity, and Ca deposition with increasing Ti content.
Keywords:
titanium
; diamond-like carbon layer (DLC)
; biocompatibility
; osteogenic differentiation
; adipose tissue-derived stem cells (ADSCs)
; bone marrow mesenchymal stem cells (bmMSCs)
1. Introduction
Discovering new bioinert or bioactive coatings for conventionally-used joint implants, made from cobalt (Co) – chromium (Cr) alloys, magnesium (Mg) alloys, stainless steel or titanium (Ti) alloys, is still of high importance. For example, new coatings can provide improved chemical stability, strengthened corrosion resistance, appropriate physiological mechanical properties, better support for osseointegration or increased microbial resistance for current orthopaedic implants (for a review, see [1,2,3]). One of the most important properties of joint replacements is high wear resistance, which can be obtained by creating a stable surface layer on the material. The stable surface layer plays a key role in preventing the release of metal ions and wear debris from an implant, which can otherwise later result in inflammation of the surrounding tissue followed by osteolysis and implant failure/loosening (for a review, see [4,5].
Diamond-like carbon (DLC) layers have been used for coating orthopaedic implants (e.g. joint replacements, medical wires, screws) due to their hardness, high corrosion resistance, low friction, high wear resistance, and high biocompatibility (for a review, see [6,7,8]. Moreover, due to their chemical inertness, surface smoothness and hydrophobicity, resulting in low thrombogenicity, DLC coatings have been widely explored for cardiovascular stents, heart valve prosthesis, and other cardiovascular devices (for a review, see [6,7,8]. Nevertheless, the DLC layer itself is burdened with instability in the aqueous environment and poor substrate adhesion [9]. These disadvantages can be overcome by using suitable interlayers or by doping DLC with specific chemical elements during fabrication (for a review, see [6,8]. Ti is known to possess superior biocompatibility properties, and it is therefore a commonly used material for dental implants and medical devices (for a review, see [10]. The addition of Ti or Cr to DLC has been reported to increase the adhesion of DLC layers to an underlying substrate, such as Si(100) wafers, 316 L stainless steel, or Ti6Al4V [11,12,13,14]. The addition of Ti to DLC also improves other mechanical properties, such as the elastic modulus, hardness, and surface roughness of the coating [12,13,15]. Similarly, our previous studies on the fabrication of Ti-DLC layers have shown an increasing critical load and increasing roughness as the Ti content increases, along with the Young’s modulus of the Ti-DLC being closer to that of the cortical bone, in comparison to the results when pure DLC layers are used [13]. The reported properties have depended on the specific Ti content and fabrication techniques, such as dual pulsed laser deposition (dual PLD) or pulsed laser deposition combined with magnetron sputtering (PLD + MS) [13,15]. In addition to the improved physicochemical properties, high initial biocompatibility of Ti-DLC layers doped with various contents of Ti has been reported by our previous studies [13,15] and also by other researchers [12].
Mesenchymal stem cells (MSCs), which are able to undergo osteogenic and/or chondrogenic differentiation, play a key role in bone regeneration and bone healing/repair processes (for a review, see [16]. Under physiological conditions in vivo, MSCs are recruited to the damaged area from the surrounding tissue (mainly from the periosteum, the endosteum, and the bone marrow cavity) as well as from peripheral circulation [16]. The MSCs involved in bone repair are modulated by many signalling pathways, which can be further advantageously used in regenerative medicine to stimulate the mobilization and homing of the MSCs (for a review, see [17]. For decades, bone marrow mesenchymal stem cells (bmMSCs) have been widely investigated, and these cells have been considered as a gold standard for bone cell-based therapies. However, MSCs can also be harvested from other specific tissues such as adipose tissue (ADSCs), dental pulp, peripheral blood, amniotic fluid, or placenta (for a review, see [18]). Among these cells/tissues, ADSCs are one of the most promising cell types for MSC-based bone regeneration therapies, due to their easy accessibility in relatively large quantities, high proliferative capacity, high osteogenic differentiation potential, osteoinductive and immunomodulation properties (for a review, see [19]. These superior characteristics rank ADSCs equal to or even higher than bmMSCs for further routine autologous or allogenic clinical applications in bone tissue engineering. However, previous and current clinical trials focused on the usage of ADSCs in bone repair have so far resulted in ambiguous outcomes, and specific cell characterization therefore needs to be performed to allow comparisons of the results/outcomes that are obtained (for a review, see [20]). To the best of our knowledge, no comprehensive study covering the interaction of variably Ti-doped DLC coatings with adult MSCs has been performed. Similar Ti-DLC coatings have been fabricated and characterized in the past, and their basic cytocompatibility has been tested with the Saos-2 cell line, i.e. human osteoblast-like cells derived from osteosarcoma, by our group [13,15]. Based on previous promising results, the current study aims to provide a broader set of in vitro experiments concerning the adhesion, growth and differentiation of primary or low-passaged human osteogenic cells, and thus to ensure the suitability of Ti-DLC layers for orthopaedic implants. In addition, our study aims to elucidate the potential influence of an increasing Ti content on cell behaviour. For this purpose, multipotent MSCs that are physiologically involved in bone healing or that are present in a surrounding tissue were chosen. Specifically, cell-material interactions of two types of adult MSCs (i.e. ADSCs and bmMSCs) are studied. Detailed physicochemical characterization of the prepared Ti-DLC layers was performed prior to the cell experiments.
2. Results
2.1. Material characterization
2.1.1. Surface morphology
The surface morphology of the samples was determined by scanning electron microscope (SEM) and atomic force microscopy (AFM) techniques. As is shown in the SEM images (Figure 1), with increasing amounts of Ti in the DLC layers, larger clusters were formed on the surface. These clusters were probably formed during the PLD process on the pure DLC substrate. The structures were relatively randomly distributed over the surface, with globular shapes and with diameters of several micrometers. As expected, the size, the number and the concentration of these structures increased with increasing thickness of the deposited layer.
However, as is clear from the SEM images (Figure 1) and also from the AFM images (Figure 2), most of the surface area is not significantly affected by these clusters. A detailed analysis of the surface morphology with AFM confirmed that no significant changes were found on the DLC surface with increasing amounts of titanium. It can be seen that there was a slight increase in roughness with increasing thickness of Ti, followed by a decrease in roughness for the highest concentration of Ti, i.e. 12.8 at.% of Ti. However, the changes indicated by the AFM technique were within the range of 0.1-0.4 nm, confirming good homogeneity of the prepared nanolayers. The nanostructure of the layer was not significantly affected by an increasing amount of Ti.
2.1.2. Wettability
It is known that the surface wettability value depends mainly on the chemical composition of the surface layer. Other surface parameters, such as surface morphology and roughness, can also have an influence on this value. In this case, however, the "very smooth" surface roughness values of the samples are very small (tenths of nm), and their influence on the change in surface wettability can therefore be neglected. Table 1 shows the water and glycerol contact angles and the total surface free energy (SFE) values for the original glass substrate and for the substrate with a deposited DLC layer containing 0-12.8 at.% of Ti. It can be seen that the deposition of the DLC layer on the glass substrate led to a significant increase in the value of the contact angle, i.e. an increase in the hydrophobicity of the surface. The addition of Ti to the deposited layer caused a further change in the contact angle. It can be stated that as the amount of Ti in the DLC layer increases, the value of the contact angle also increases slightly.
It is known from experiments that cells adhere preferentially and better to surfaces with moderate hydrophilicity, i.e. that are neither too wettable nor too hydrophobic. From the point of view of surface wettability, surfaces with contact angle values in the range of 70°-80° can be expected to be the most suitable for cell cultivation. These values correspond to samples with a deposited DLC layer containing a medium amount of Ti (2.1-6.6 at.%).
2.1.3. Surface free energy (SFE)
Surface free energy determines the disruption of intermolecular bonds on the surface when the surface is created. The SFE of a solid surface is the parameter that can provide information about how liquids will interact with the solid surface. The SFE of the surface also affects its wettability. In general, it can be said that a surface with high SFE is more easily wetted than a surface with low SFE. The highest surface energy value was measured on DLC_0.4Ti and DLC_pure, and lower SFE was observed on DLC with higher Ti concentrations, with the lowest value on DLC_12.8Ti.
2.1.4. Chemical composition
The chemical composition of the glass, the pure DLC layer, and the Ti-doped DLC layers were studied using two different techniques: X-ray photoelectron spectroscopy (XPS) and energy dispersive X-ray spectroscopy (EDS). In the case of the XPS method, two different take-off angles to the perpendicular of the sample surface were used. Table S1 (take-off angle 0°) summarizes the atomic concentrations of chemical elements of the surface of the sample measured by XPS. The Ti concentrations increased from 0.89 at.% (sample DLC_0.4Ti) to 9.45 at.% (sample DLC_12.8Ti), and the C concentrations decreased from 93.45 at.% (sample DLC_0.4Ti) to 68.41 at.% (sample DLC_12.8Ti). The O concentrations increased with the increasing Ti concentrations, and the N concentrations were almost unchanged.
Figure 3 shows detailed mass concentrations of Ti and C measured by EDS. The EDS analysis of Ti-doped DLC layers proved the presence of Ti in an increasing manner, ranging from 1 wt.% (sample DLC_0.4Ti) to 15.95 wt.% (sample DLC_12.8Ti), and the presence of C in a decreasing manner ranging from 30.71 wt.% (sample DLC_0.4Ti) to 14.15 wt.% (sample DLC_12.8Ti). All these values were significantly different from the DLC_pure sample. The chemical analyses show that Ti is distributed throughout the entire analyzed Ti-doped DLC layers.
Table S2 (take-off angle 81°) provides information on the elemental composition of the superficial surface layers. It can be seen that a large quantity of C was detected on the pure glass sample. The high values are caused by so-called surface carbonaceous contamination from the ambient atmosphere. Table S3 summarizes the concentrations of all elements determined by EDS. The EDS method can analyse the chemical composition of samples to a "greater depth" than the XPS method. Unlike the XPS method, elements that occur in silica glasses were also detected here (in the case of the XPS method, however, the amounts of these elements were below the detection limit). It is evident that, in this analysis, the phenomenon of so-called carbon contamination from the air atmosphere is significantly less pronounced.
2.2. Biological in vitro experiments
2.2.1. Cell proliferation
Cell proliferation on the studied materials was estimated by direct cell counting and by a resazurin metabolic assay, which is considered to be an indirect indicator of cell growth. In general, the ADSCs and bmMSCs showed a very high biocompatibility rate of the Ti-doped DLC layers, which was proved by very similar or even higher proliferation than in the case of the control PS material.
The cell number of ADSCs increased in time and reached a maximum on day 21 (the end of the cell culture experiment) (Figure 4). A similar tendency was also observed in the case of the metabolic activity of ADSCs (Figure 5). Only mild differences in cell number or in metabolic activity were observed among the studied samples on specific days of the culture. Interestingly, in the case of the DLC pure samples, the lowest value of the metabolic activity on day 21 (Figure 5) was probably caused by the visually observable partial detachment of the surface DLC layer from the underlying glass material.
In comparison with the ADSCs, the bmMSCs manifested earlier rapid growth with maximum values on day 14 (Figure 4). In the cell culture, the bmMSCs tended to form multilayers on all studied materials, which could probably have influenced the manual cell counting on days 14 and 21. Nevertheless, the metabolic activity of bmMSCs showed a similar tendency and scarcely increased between days 14 and 21 (Figure 5).
2.2.2. Cell spreading area and cell morphology
The initial cell adhesion to the tested materials was quantified by measuring the cell spreading area on day 1 after seeding. The ADSCs showed a spindle-shaped morphology on all tested materials, and the cell spreading area on the DLC-based samples appeared to be similar as in the case of glass and the PS control material (Figure 6). The bmMSCs showed a polygonal-shaped morphology on both the DLC-based materials and the control materials, and no statistical differences were observed in the cell spreading area on day 1 (Figure 6).
On day 3, the morphology and the cytoskeleton of the ADSCs was visualised. The cells were positively stained for F-actin, and these actin stress fibres showed a well-developed cytoskeleton in cells on all samples. Vinculin and F-actin staining revealed the presence of focal adhesions (i.e. plasma-membrane associated assemblies of stress fibres with cell adhesion receptors binding the extracellular matrix), which were more pronounced in cells cultured on DLC with a higher Ti content, namely on DLC_6.6Ti and DLC_12.8Ti (Figure 7).
2.2.3. Immunofluorescence staining of osteogenic markers
Immunofluorescence staining was used to visualise type I collagen (i.e. an early marker of osteogenic differentiation) and osteocalcin (i.e. a late marker of osteogenic differentiation) on days 14 and 21 of the culture. The presence of type I collagen was detectable in ADSCs both on day 14 (the first interval of staining) and on day 21 (the last interval of staining) (Figure 8). On day 7, the deposition of type I collagen in ADSCs was initially observable mainly intracellularly (Figure S1); however, on day 14 and especially on day 21, its extracellular deposition and fibril formation was noticeable (Figure. 8). The ADSCs cultured on all studied samples were positively stained for osteocalcin. The staining of osteocalcin on day 7 showed its preferential localization in the nuclear region of the cells (Figure S1). In comparison with this, on days 14 and 21, the cytoplasmic localization was observed (Figure 8). Similarly, staining of type I collagen revealed a strong signal in bmMSCs on day 14 and also on day 21 (Figure 9). The fibrillar arrangement of type I collagen was not as pronounced as in the case of ADSCs; however, a strong diffuse signal was detected in cells on all tested samples. The bmMSCs were also positively stained for osteocalcin in both time intervals on all tested samples (Figure 9).
The results for the fluorescence intensity of osteogenic markers are summarised in Figure 10. The lowest intensity of type I collagen in ADSCs was detected on DLC_0.4Ti and DLC_2.1Ti on day 14. Similar results were obtained on day 14 for bmMSCs, where the intensity of type I collagen was highest on DLC_12.8Ti. Nevertheless, on day 21, no clear trend in the fluorescence intensity of type I collagen depending on the amount of Ti was observed. The fluorescence intensity of osteocalcin was slightly higher on DLC-based materials with a higher Ti content on day 14 (in bmMSCs) and on day 21 (in ADSCs). Although the absolute values of fluorescence intensity per cell decreased slightly between days 14 and 21 in most of the osteogenic markers, a strong signal of the markers was still detected in cells on all studied samples on day 21 (Figure 10).
2.2.4. Measurements of ALP activity
In addition to immunofluorescence staining of type I collagen and osteocalcin, the osteogenic differentiation of cells, supported by the addition of specific osteogenic supplements from day 4 of the culture, was observed. Potential differences among the tested samples were evaluated using the ALP activity assay on days 7, 14, and 21. The results were normalized to the area of the samples and/or to the cell number. The ALP activity/area increased in time both in ADSCs and in bmMSCs (Figure 11). Only mild differences were observed among the samples. Specifically, control PS showed lower initial ALP activity/area values on days 7 and 14 in comparison with the DLC samples. However, this trend disappeared on day 21. Concerning the recalculation of ALP activity to the cell number, both ADSCs and bmMSCs showed a relatively stable trend in ALP activity within the whole cell culture period. Almost no significant differences were measured among the studied samples (Figure 11).
2.2.5. Measurements of calcium deposition
To observe late osteogenic differentiation, a calcium deposition assay was performed on day 14 and on day 21 after seeding. On all studied samples, the calcium deposition increased between days 14 to 21 in both cell models (i.e. ADSCs and bmMSCs) (Figure 12). Interestingly, a different trend in calcium deposition in ADSCs and in bmMSCs was observed among the studied samples. Specifically, on day 14 in ADSCs, there was greater calcium deposition (p<0.05) on DLC containing a greater amount of Ti (i.e. DLC_6.6Ti and DLC_12.8Ti) than on glass, DLC_pure, and DLC_0.4Ti. This trend in ADSCs was even more pronounced on day 21, when increasing calcium deposition values were measured in accordance with the increasing Ti content in all DLC samples. Similarly to day 14, these trends reached statistical significance (p<0.05) for DLC_6.6Ti and DLC_12.8Ti vs. glass and DLC_pure. At the same time, however, the highest calcium deposition values were measured in the cells on PS. By contrast, the calcium deposition in bmMSCs scarcely differed among the DLC samples either on day 14 or on day 21, and the lowest values were observed on PS (Figure 12).
3. Discusion
3.1. Material preparation and characterization
Ti-DLC layers are known to possess very good corrosion resistance, high electrochemical stability, and also adhesion to the substrate in a simulated body fluid [21]. Additionally, a reduction in friction and wear was reported in comparison with the substrate itself. The layers with a higher carbon content also exhibited superior tribocorrosion properties in a simulated body fluid [21]. In various publications, Ti-DLC layers containing increasing Ti concentrations have been prepared by various techniques, such as dual PLD, PLD combined with magnetron sputtering (MS), dual MS, and plasma-enhanced chemical vapour deposition [12,13,15,22]. The specific preparation technique can influence the results, and can make a potential comparison of results among the publications difficult. Specifically, some discrepancies can be observed in the trends of the contact angle, SFE or hardness values.
In our current study, we prepared and characterized pure DLC layers and Ti-doped DLC layers containing from 0.4 to 12.8 at.% of Ti by dual PLD. The preparation and characterization of similar Ti-DLC layers for future application as implant coatings has been previously described and discussed in our earlier studies [13,15]. Concerning analyses of material characterization prior to cell seeding, our current results show similar trends as in our previous publications [13,15]. Specifically, increasing contact angle, slightly increasing roughness and more numerous droplets (mainly around 10 μm in size) were present on the surface with increasing Ti content. Similar results were observed by Zhang et al. [12] and by Zhao et al. [22], where the increasing Ti content in DLC layers, prepared by dual MS and plasma-enhanced chemical vapour deposition technique, caused increasing Ra and Rq values. In contrast, Zhao et al. [22] described a slightly decreasing contact angle with increasing Ti content (1.3-3.2 at.% of Ti) in Ti-DLC layers. Such discrepancies could have been caused by different fabrication techniques for layers with different properties. Interestingly, from our previous results [15] and also from our current results, it seems that the samples with concentrations from 2.1 at.% to 12.8 at.% of Ti showed quite similar properties regarding the contact angle and SFE measurements. The measured values between 2.1 and 12.8 at.% of Ti differed only slightly in comparison to DLC_pure and DLC_0.4Ti. In contrast, sample DLC_0.4Ti showed significantly different values from DLC_pure and from DLC doped with a higher Ti content, in both SFE and contact angle values. The differences in the absolute values of surface topography, contact angle, SFE and chemical composition that occur between samples previously characterized and currently characterized may have been caused by a different batch of materials and by different testing devices (e.g. for XPS, SEM and AFM) [13,15]. However, although the absolute values measured in various analyses differ, the trends are the same in all our publications.
Concerning the mechanical properties of Ti-DLC layers prepared by dual PLD, increasing Ti concentration significantly decreased the hardness from 31.2 GPa (for pure DLC) to 10.4 GPa (for DLC containing 12.8 at.% of Ti) and decreased the Young’s modulus in a similar manner, i.e. from 263 GPa (for pure DLC) to 134 GPa (for DLC containing 12.8 at.% of Ti) [13]. At the same time, it increased the critical adhesion force Lc3 from 9.9 N (for pure DLC) to 18.4 N (for DLC containing 12.8 at.% of Ti) [13]. Similar trends in hardness and critical adhesion force values can be observed for Ti-DLC layers prepared by PLD combined with MS [13]. From this point of view, Ti doping of DLC layers approximated hardness and Young’s modulus values closer to healthy cortical bone, which is very desirable for potential applications in implant orthopaedic surgery.
3.2. Biocompatibility – cell adhesion, proliferation, and differentiation
The set of experiments was performed with two cell types that are important for bone regeneration in vivo and for bone tissue engineering in general. The osteogenic differentiation of ADSCs and bmMSCs, which was supported by appropriate composition of the medium, was successfully obtained during the experiments on all observed samples (i.e. pure DLC and Ti-doped DLC layers, control glass and PS samples). The osteogenic differentiation of bmMSCs and ADSCs by a similar medium composition has been proved in our previous publications [23,24,25]. In our current results, slight differences between bmMSCs and ADSCs were observed in terms of proliferation potential, the onset of osteogenic differentiation and dependence on Ti content. Specifically, the bmMSCs rapidly proliferated in the initial phase of the experiments (i.e. up to day 14) and reached full confluence followed by the formation of another cell layer shortly afterwards. Moreover, they reached the highest ALP activity values on day 14, and these values were similar or slightly decreased on day 21. In contrast, the ADSCs showed continuous proliferation, which was accompanied by full confluence up to day 21. In addition, the ADSCs showed increasing ALP activity up to day 21. In both cell types, an increasing amount of Ca was detected up to day 21, and the maximum fluorescence intensity per cell in most of the osteogenic markers was detected on day 14. These findings can indicate an earlier onset of the proliferation and differentiation phase in bmMSCs than in ADSCs. The results are also in accordance with our previous research [25], where bmMSCs were better spread, strongly attached, and showed higher proliferation and differentiation capacity than ADSCs, when chemically differentiated towards osteoblasts on composite chitosan/β-1,3-glucan/hydroxyapatite scaffolds. Interestingly, the bmMSCs and ADSCs in some current analyses acted slightly differently depending on the amount of Ti in the DLC layers. The metabolic activity of ADSCs showed increasing values with increasing amounts of Ti on days 7, 14 and 21, and the same trend was obtained for the amount of Ca, especially on day 21. In contrast, the proliferation and the osteogenic differentiation of bmMSCs did not show crucial dependency on the amount of Ti, except for the fluorescence intensity of type I collagen on day 14. These results are in accordance with the behaviour of bmMSCs on variably Cr-doped DLC layers prepared by simultaneous PLD and MS, where neither the metabolic activity of the cells nor the ALP activity or Ca deposition in the cells were changed depending on the amount of chromium [26]. In addition, Zhang et al. tested the biocompatibility of human periodontal ligament cells on similar Ti-doped DLC layers (Ti content ranging from 0 to 26.98 at.%) and they described favourable initial biocompatibility on all samples regardless of the Ti content [12]. Similarly, our previous study on the interaction of Saos-2 cells with Ti-doped DLC layers (containing 0.4-12.8 at.% Ti) showed a very similar proliferation rate on all Ti-doped DLC layers. Only the formation of focal adhesion and the cell spreading area was influenced by the amount of Ti, i.e. a greater amount of Ti caused more pronounced focal adhesions and a greater cell spreading area [13,15]. In a similar way, our current study proved that there were more pronounced focal adhesions and a better-developed F-actin cytoskeleton in ADSCs cultured on DLC-based layers containing a higher Ti content. The development of the F-actin cytoskeleton and the formation of focal adhesions during the initial cell adhesion to the material surface is also related to the surface topography, the wettability, and the electrical charge and conductivity [27]. From this point of view, the better formation of focal adhesions in Saos-2 and ADSCs on Ti-DLC layers with a higher Ti content could be influenced mainly by slightly higher surface roughness and a higher concentration of both Ti and O than in pure DLC layers and in Ti-DLC layers containing a lower at.% of Ti. In addition, it is known that other types of stem cells or various mature cells can act differently in terms of cell adhesion, proliferation and differentiation on similar material surfaces [28,29]. Our results could indicate different sensitivity of different cell types to the material surface chemistry/surface topography, which is influenced by the Ti content. Nevertheless, the biocompatibility and the differentiation parameters in the cells were still at high levels on all tested samples in our experiments.
It is also worth mentioning that during biological experiments lasting three weeks it was possible to observe sporadic detachment of DLC_pure layers from glass substrates on some samples. This detachment proved lower adhesion of pure DLC layers to the substrate, as was previously mentioned in the introduction. This could affect e.g. the measurements of the metabolic activity of the ADSCs on day 21 on these samples.
An increasing Ti content in DLC layers not only influenced the mechanical properties, the surface topography and the chemical composition of the layers, which is subsequently important for cell-material interactions, but can also reduce bacterial adhesion to Ti-DLC coatings [22]. Specifically, an increase in concentration from 1.3 to 3.2 at.% of Ti significantly reduced the adhesion of Escherichia coli and Pseudomonas aeruginosa in comparison with uncoated stainless steel and in comparison with a pure DLC layer [22]. Such properties are very favourable for orthopaedic metal implants, as they contribute to better osseointegration and lower potential implant loss, which is often caused by infectious pathogens.
4. Materials and methods
4.1. Material preparation
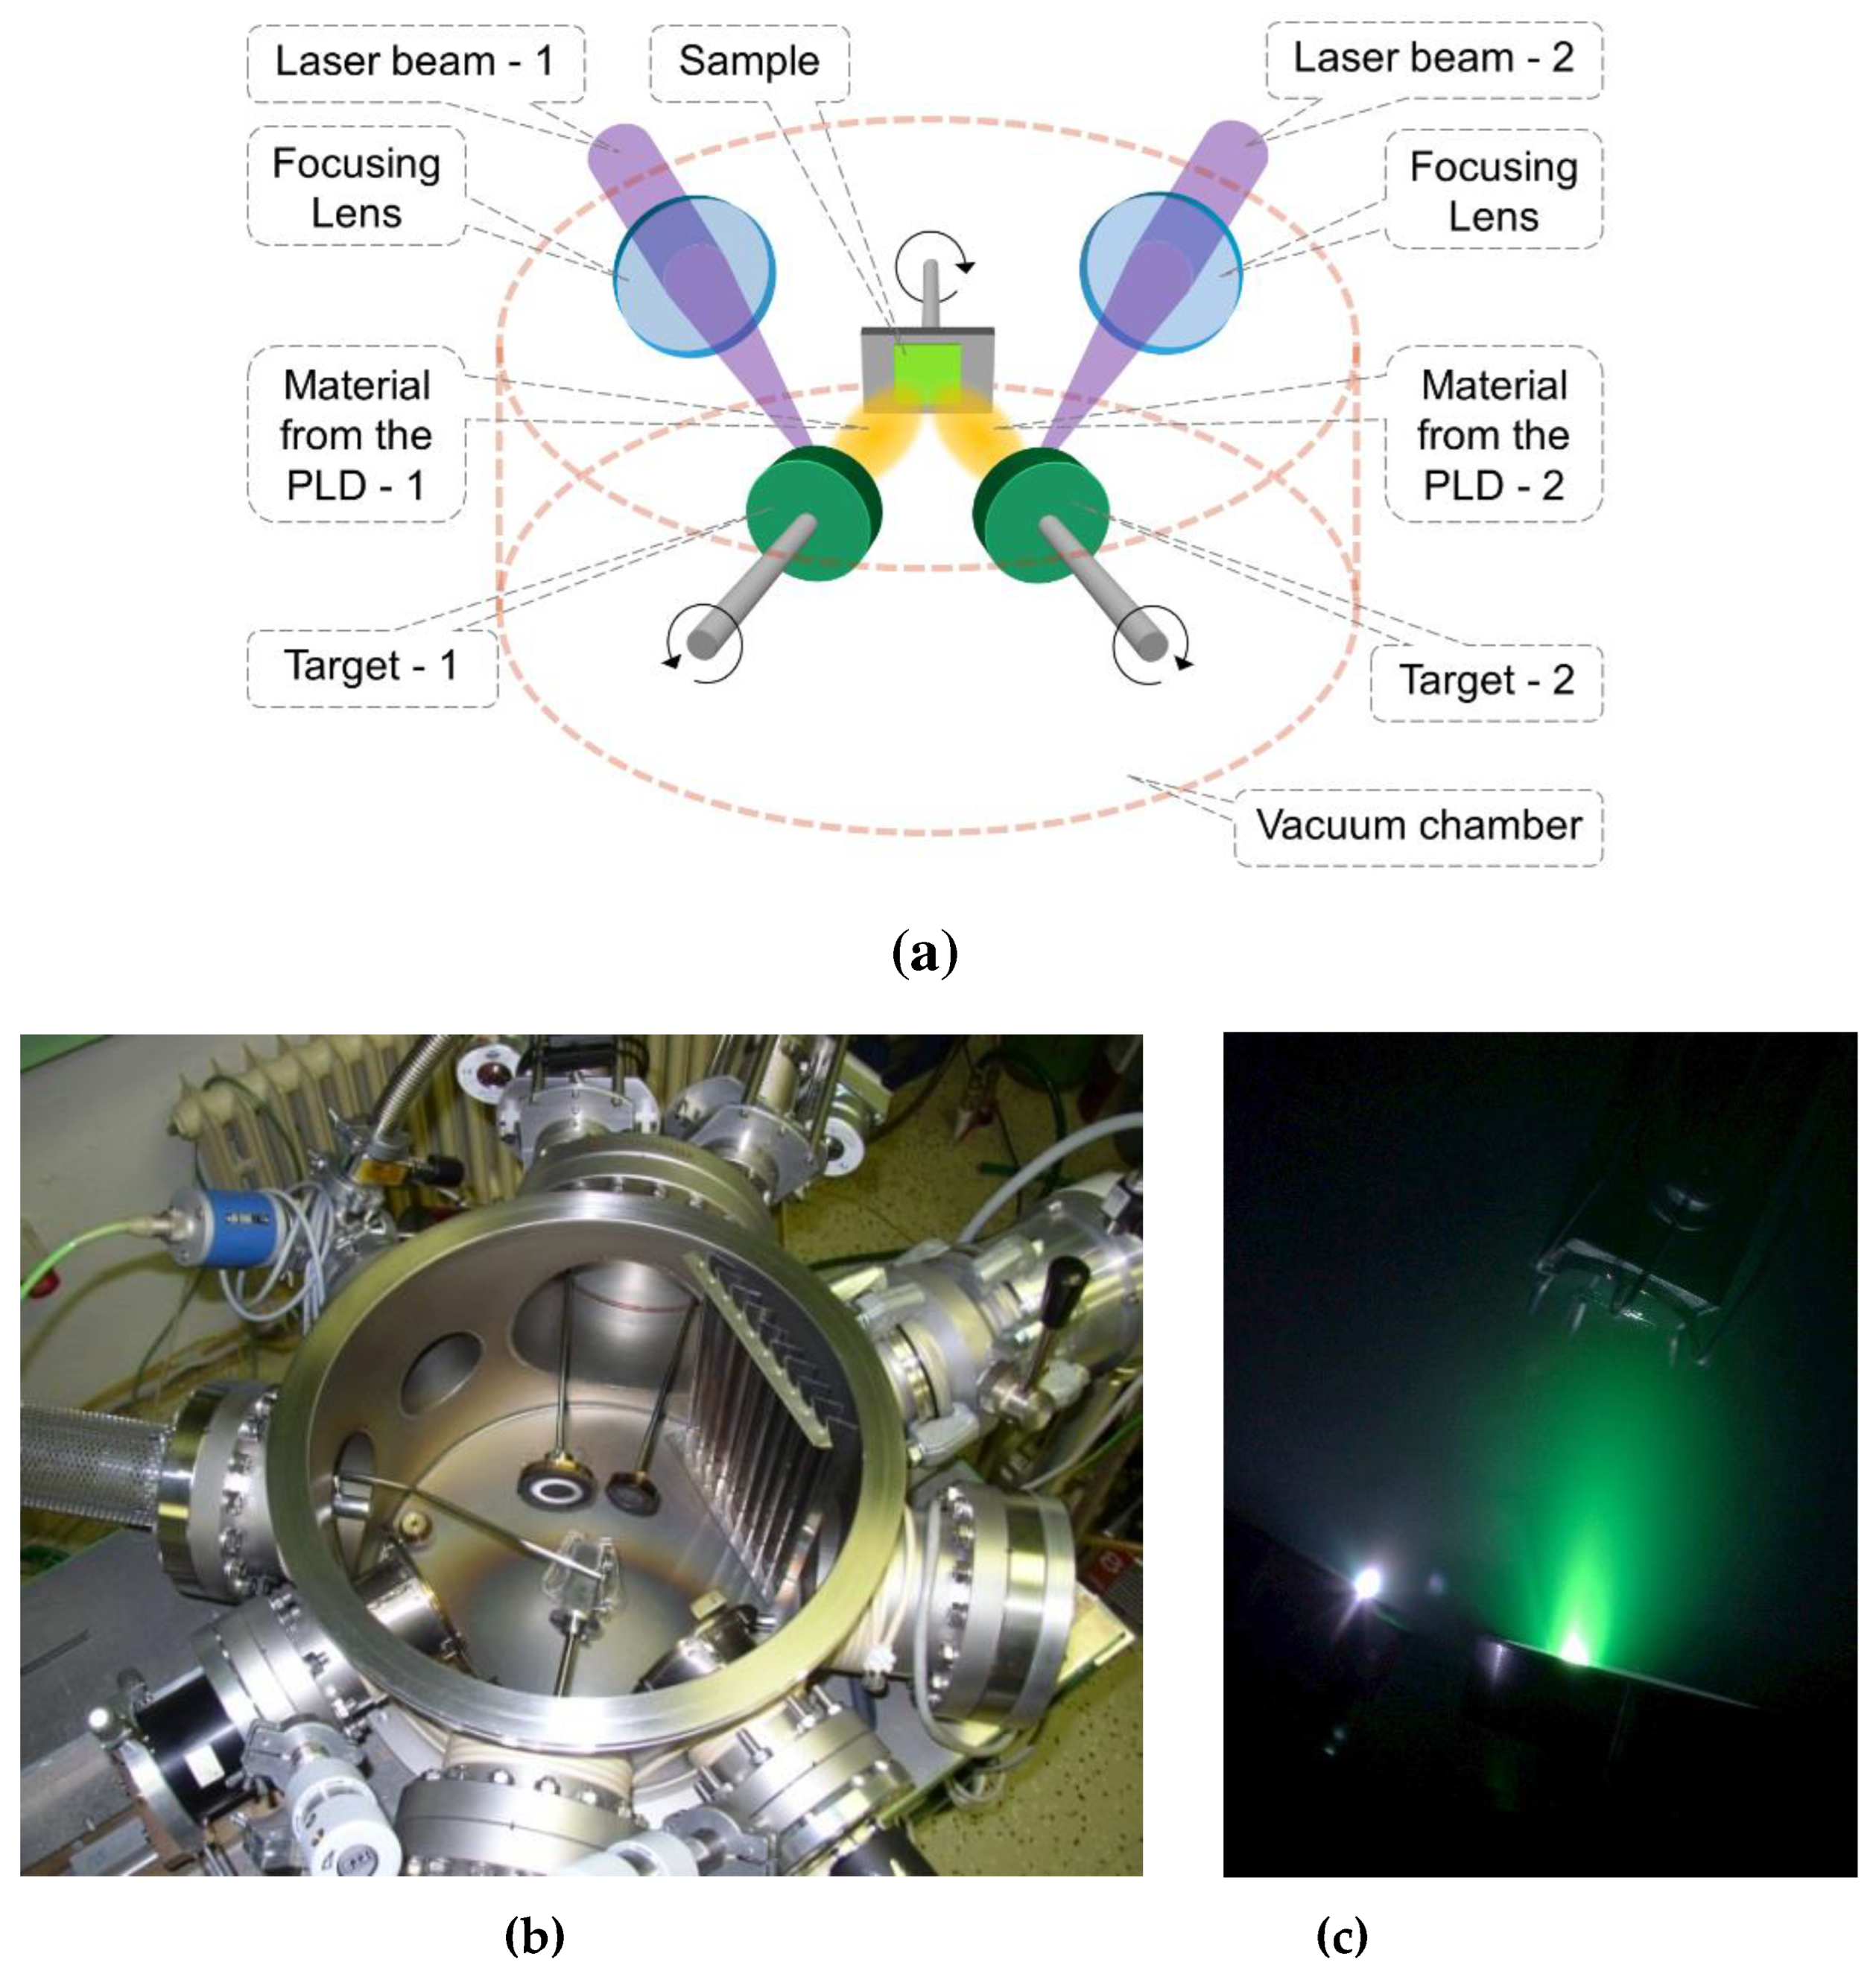
Pure DLC layers and Ti-doped DLC layers were prepared by dual pulsed laser deposition (PLD) (see Figure 13a, 13b, 13c), which has been previously described [13,15]. In brief, DLC layers were deposited on glass substrates (dimensions: 1 cm x 1 cm x 0.1 cm) by a dual PLD method using two excimer KrF lasers (details of the laser rate are listed in Table 2). The DLC layers were doped with variable amounts of Ti. The increasing Ti content was as follows: 0.4, 2.1, 3.7, 6.6, 12.8 at.% of Ti (These values were measured by XPS immediately after dual PLD and are used as a default to name the samples in this study). The Ti-DLC layers were 120 nm in thickness.
Laser frequencies (L1 and L2) used for preparing the layers by a dual PLD method; L1 – Laser 1 Complex Freq. (repetition rate of Laser 1 – Complex); L2 – Laser 2 Lumonics Freq. (repetition rate of Laser 2 – Lumonics); Rc – as grown (the concentration of as-received surfaces); Sp – sputtered (the concentration of surfaces sputtered-cleaned by an argon cluster ion beam, thickness ∼ 100 nm, deposition time ∼ 8 min); The Rc values measured by XPS after fabrication were used as a default to name the samples in this study; a - measured by XPS.
4.2. Material characterization
4.2.1. Scanning electron microscopy (SEM)
The material surface morphology (micro-scale) was determined by a scanning electron microscope (SEM) using LYRA3 (Tescan, Czech Republic). The applied acceleration voltage for SEM was 10 kV. The substrates were covered with a Pt conductive layer with a thickness of 10 nm using a diode sputtering method (Quorum Q300T).
4.2.2. Atomic force microscopy (AFM)
The material surface morphology (nanoscale) was examined with a Dimension Icon atomic force microscope (Bruker Corp.). ScanAsyst mode in Air was used. A SCANASYST-AIR Silicon Tip on Nitride Lever with spring constant 0.4 N/m was used. NanoScope Analysis software was applied for data processing. The mean roughness values (Ra) represent the average of the deviations from the centre plane of the sample.
4.2.3. Wettability
The material surface wettability was determined by goniometry, using the static water drop method. The measurements of water contact angles were performed using the DSA100 Drop Shape Analyzer (A.KRÜSS Optronic, Germany). Drops of distilled water or glycerol (volume 5.0 l) were deposited at 5 different positions on the sample, and the consequent photo was evaluated. DSA4 software was used to evaluate the drops. The Owens-Wendt-Rabel-Kaelble calculation method was used to determine the surface free energy values (SFE).
4.2.4. X-ray photoelectron spectroscopy (XPS)
The elemental concentration was determined by X-ray photoelectron spectroscopy (XPS). An Omicron Nanotechnology ESCAProbeP spectrometer was used. The exposed and analysed area had dimensions of 2 x 3 mm2. The X-ray source was monochromatic at 1486.7 eV. The take-off angles were 0° and 81° to the perpendicular of the surface of the sample. The atomic concentrations of the elements were determined by the CASA XPS program using an integrated area of spectrum lines and relative sensitivity factors that are quoted in the database of CASA XPS. The error of determination was ± 1.5 %.
4.2.5. Energy-dispersive X-ray spectroscopy (EDS)
For elemental concentration, EDS was used on the Quanta 450 scanning electron microscope (FEI, USA) equipped with an Si(Li) Apollo XL Silicon Drift Detector with an FET preamplifier (EDAX Inc., USA) at a magnification of 1,000x and an accelerating voltage of 12.5 kV. Prior to the EDS analyses, samples were attached by carbon tape to an alumina stub and were gold-coated on a K550X (EMITech, USA) sputter coater in an argon atmosphere. The weight and the atomic fractions of the chemical elements were characterized. Five measured fields were taken for each sample at a magnification of 1,000x (measured area of 85.456 µm2, i.e. a total of 427.331 µm2 for each sample). On each sample, the EDS map was taken at 1,000x magnification. Data acquisition was performed on EDAX TSL OIM software with ZAF corrections.
4.3. Biological in vitro experiments
4.3.1. Cell models
Human adipose tissue-derived stem cells (ADSCs) were isolated from a lipoaspirate using collagenase digestion; the detailed isolation procedure has been described in our earlier studies [24,25]. The isolation was conducted according to the tenets of the Declaration of Helsinki and was approved by the Ethics Committee at Na Bulovce Hospital in Prague (approval issued on August 21, 2014; No. 11.6.2019/9150/EK-Z, 2019, and No. 16.3.2023/10795/EK-Z, 2023). Written informed consent was obtained from the donor (a healthy 46-year-old woman) before the liposuction procedure was applied (thigh region of liposuction, negative pressure of -200 mmHg during liposuction). After the isolation procedure, the cells were expanded in Dulbecco's modified Eagle's Medium (DMEM) (Gibco, Thermo Fisher Scientific) supplemented with 10% (vol/vol) of fetal bovine serum (FBS) (Gibco, Thermo Fisher Scientific), 10 ng/mL of basic fibroblast growth factor (FGF2) (GenScript) and 40 μg/mL of gentamicin (LEK, Slovenia). The cells were further characterized by flow cytometry (Accuri C6 Flow Cytometer, BD Biosciences, San José, CA, USA) for the presence of specific CD markers. The analysis revealed a high presence of CD105 (99.9%), CD90 (99.5%), CD73 (100%) and CD29 (100%), and a very low presence of CD146 (4.7%), CD45 (3.8%), CD34 (0.2%) and CD31 (0.5%).
Bone marrow mesenchymal stem cells (bmMSCs) originating from a single donor were purchased from ScienCell Research Laboratories (Cat. No. 7500, ScienCell Research Laboratories, Carlsbad, CA, USA). Before the experiments, the cells were expanded in Mesenchymal Stem Cell Medium (MSCM) (Cat. No. 7501, ScienCell Research Laboratories) in 75 cm2 tissue culture flasks (TPP, Trasadingen, Switzerland) coated with poly-L-lysine (15% vol/vol in H20; Cat. No. P4707, Sigma-Aldrich).
4.3.2. Culture conditions
An overview of the biological experiments is illustrated in Scheme 1. Prior to cell seeding, the tested samples (i.e. glass, DLC_pure, DLC_0.4Ti, DLC_2.1Ti, DLC_3.7Ti, DLC_6.6Ti, DLC_12.8Ti) were sterilized with 70% ethanol for 1 hour at room temperature (RT). The samples were further washed with PBS and were placed in 24-well tissue culture test plates (TPP, Trasadingen, Switzerland). ADSCs (passage 3) were seeded on the samples at a density of 14 000 viable cells/cm2 in 1.5 mL of DMEM supplemented with 10% (vol/vol) of FBS, 10 ng/mL of FGF2 and 40 μg/mL of gentamicin. From day 4, this growth medium was replaced by an osteogenic medium, i.e. DMEM supplemented with 10% (vol/vol) FBS, 10 nM of dexamethasone (DXM) (Cat. No. D2915, Sigma-Aldrich), 10 mM of β-glycerophosphate (BGCP) (Cat. No. G9422, Sigma-Aldrich), 50 μg/mL of ascorbic acid (AA) (Cat. No. 49752-10G, Sigma-Aldrich), 2mM of L-Glutamine (L-Glu) (G-8540, Sigma-Aldrich), 1 μM of dihydroxyvitamin D3 (vit.D3) (D1530, Sigma-Aldrich), 5 ng/mL of FGF2, and 40 μg/mL of gentamicin. The ADSCs were cultured at 37 °C in a humidified air atmosphere with 5% CO2 for 21 days in total, and the osteogenic medium was replaced twice per week.
The bmMSCs (passage 3) were seeded on the samples at a density of 5 000 viable cells/cm2 in 1.5 mL of α-MEM (Cat. No. 11900-016, Gibco, Thermo Fisher Scientific) supplemented with 15% (vol/vol) of FBS, and 40 μg/mL of gentamicin. From day 4, this growth medium was exchanged for an osteogenic medium, i.e. α-MEM supplemented with 15% (vol/vol) of FBS, 10 nM of DXM, 10 mM of BGCP, 50 μg/mL of AA, 2mM of L-GLU, 1 μM of vit. D3, and 40 μg/mL of gentamicin). The bmMSCs were cultured at 37 °C in a humidified air atmosphere with 5% CO2 for 21 days in total, and the osteogenic medium was replaced twice per week.
4.3.3. Image analysis - cell numbers and cell morphology
On day 1, the cell spreading area of 67 to 106 (ADSCs) and of 59 to 103 (bmMSCs) separate cells, i.e. cells without cell-cell contacts, which had been fixed and stained with Texas Red C2-maleimide (concentration in PBS of 10 ng/mL, incubation for 1 h), was counted on microphotographs using TESCAN Atlas software (TESCAN s.r.o., Czech Republic).
On days 1, 7, 14, and 21, the cell numbers were manually counted on microphotographs according to the Hoechst 33258 staining of cell nuclei. Between 10 and 20 microphotographs for each sample in each time interval were analysed.
4.3.4. Metabolic activity of the cells
On days 1, 7, 14 and 21 of the culture, in addition to the direct cell counting, the cell proliferation was estimated based on the metabolic activity of the cells. The metabolic activity was evaluated by resazurin (Cat. No. R7017, Sigma-Aldrich) conversion, which is brought about by mitochondrial enzymes of the cells. A detailed description of the method has been presented in our previous article [26]. In brief, the resazurin solution (40 μmol/L) in DMEM without phenol red was prepared and was added to the cells that had previously been washed with PBS. The cells with the solution were incubated at 37 °C for 3 hours and 30 min (ADSCs) or for 2 hours (bmMSCs) on all days of the evaluation. The fluorescence of the solution was subsequently measured (Ex/Em = 530/590 nm) and was corrected to the background control (resazurin solution without cells).
4.3.5.(. Immuno)fluorescence staining
(Immuno)fluorescence staining was used to visualize the markers of cell adhesion, growth and differentiation on the tested materials. Prior to all types of staining, the cells were washed with PBS and were fixed with 4% paraformaldehyde (10 min). Subsequently, the cells were pre-treated with PBS containing 1% (wt/vol) bovine serum albumin (BSA) (Sigma-Aldrich) and 0.1% (vol/vol) TritonX-100 for 20 min and were further pre-treated for 20 min with PBS containing 1% (vol/vol) of Tween 20. After each step, the samples with cells were washed with pure PBS. The list of fluorescent dyes, and the primary and secondary antibodies used in the experiments, is shown in Table 3. On days 14 and 21, the fluorescence intensity of osteogenic markers (i.e. type I collagen and osteocalcin) was quantified from fluorescent micrographs (8-12 per sample) using ImageJ. The fluorescence intensity was then normalized to the cell number.
4.3.6. ALP activity assay
For a study of the early and/or the mid-term phase of the osteogenic differentiation of cells, the activity of ALP was measured on days 7, 14 and 21. The method was described in detail in our previous article [26]. In brief, 0.1 mg/mL p-nitrophenyl phosphate in the substrate buffer (50 mmol/L glycine, 1 mmol/L MgCl2, pH 10.5; Sigma-Aldrich), was added to the samples with cells. The cells were incubated with the solution for 10 min at RT; then the solution was added into an equal amount of NaOH (1 mol/L) and the absorbance of the samples was measured (λ = 405 nm). The results were normalised to the area of the samples and to the cell number on the same day of the culture.
4.3.7. Calcium colorimetric assay
To detect a late phase of osteogenic differentiation of cells and mainly the deposition of inorganic compounds by the cells, a calcium colorimetric assay was performed on days 14 and 21. The method was described in detail in our previous article [26]. In brief, the samples with cells were dried and were treated with HCl (0.5 mol/L) overnight. Then the cell suspensions were centrifuged and the supernatants that were obtained were further analysed using a Calcium Colorimetric Assay (Cat. No. MAK022-1KT, Sigma-Aldrich) according to the manufacturer’s protocol. Similar to the ALP activity assay, the results were normalised to the area of the samples and to the cell number on the same day of the culture.
4.3.8. Statistical analysis
The data are presented as the arithmetical mean, unless otherwise specified, and the number of samples for each analysis used in this work is specified in the relevant chapter of the Materials and Methods section or in the relevant figure caption.
For an evaluation of the contact angle and the total surface free energy, One Way Analysis of Variance, Multiple Comparisons versus Control Group (Bonferroni t-test) was used (SigmaPlot 14.0). The statistical analysis of the EDS evaluation was performed in GraphPad Prism (ver. 9.5.0 (730), GraphPad Software, San Diego, CA, USA). For the evaluation of the EDS data, non-parametric analysis was employed, since the assumption of normality (Shapiro-Wilk's test and the construction of Q-Q plots) or homoscedasticity (Levene's test) was violated. The two-tailed Mann-Whitney test was applied to compare each material separately with the control sample (DLC_pure). Statistical significance was accepted at p ≤ 0.05. Scatter plots with the median and the interquartile range (IQR) plotted were used for the graphical presentation of the data.
For all the biological experiments, the data are expressed as mean+SD, and for the statistical analyses the One Way ANOVA, Student-Newman-Keuls method was applied, unless otherwise specified in the figure caption. The statistical comparison was made on cells on the same day of the culture, and p ≤ 0.05 was considered significant. Due to the large number of compared samples, some plots contain significance p ≤ 0.001 only. Statistical analyses were performed using SigmaStat 3.5 software (Systat Software Inc. USA) and the data were plotted using GraphPad Software (MA, U.S.A.).
5. Conclusions
In the present study, Ti-doped DLC layers with variable Ti content were prepared by dual pulsed laser deposition, and the cytocompatibility of the layers was proved in vitro using two mesenchymal stem cell types: ADSCs and bmMSCs. A complex comparative study of the two mesenchymal stem cell types was focused on material properties, cell adhesion, proliferation and osteogenic differentiation.
The physicochemical characterization of Ti-doped DLC layers showed an increased content of both Ti and O, contact angle and roughness, and decreased SFE with increased Ti concentration from DLC_2.1Ti to DLC_12.8Ti.
Ti-doped DLC layers with their nanostructured surface provided a suitable substrate for initial cell adhesion and spreading, and both ADSCs and bmMSCs maintained their typical spindle-shaped or polygonal-shaped morphology after adhesion and spreading.
The cell proliferation, measured as the density of the cell population and the metabolic activity of the cells, of both ADSCs and bmMSCs on Ti-DLC layers, was similar or was even higher than on control glass and PS during the three-week cell culture.
The ADSCs and bmMSCs were successfully differentiated towards osteoblasts on all tested materials. The Ti levels did not significantly influence the rate of osteogenic differentiation in most of the tested parameters, and the differentiation was mainly driven chemically by the composition of the medium.
The comparison between the two cell types revealed that the bmMSCs exhibited greater initial proliferation potential and an earlier onset of osteogenic differentiation, which was proved by greater ALP activity on days 7 and 14, greater osteocalcin production on day 14, and earlier and greater calcium deposition in comparison with ADSCs.
The ADSCs proliferated steadily over a period of 21 days and produced more collagen than the bmMSCs on day 14. In addition, ADSCs seemed to be more sensitive to the Ti content, as ADSCs showed a slightly greater formation of focal adhesions, and evinced greater metabolic activity, collagen production and Ca deposition with increasing Ti content in the layer. The bmMSCs were less sensitive to Ti content and more uniform results were obtained.
Based on our results combining the material characterization and in vitro biological analyses, we would suggest using Ti-DLC layers containing 2.1-12.8 at.% of Ti for further in vivo animal studies.
Supplementary Materials
The following supporting information can be downloaded at the website of this paper posted on Preprints.org., Figure S1: collagen a osteocalcin staining_day 7, Table S1: XPS analysis_0°, Table S2: XPS analysis_81°; Table S3: Detailed EDS analysis.
Author Contributions
Conceptualization, M.T., E.F., L.B.; methodology, M.T., M.Z., E.F., L.B.; validation, T.S.; formal analysis, M.T., E.F.; investigation, M.T., E.F., P.S., N.K.S., T.S., M.Z.; resources, L.B., T.K., E.F..; data curation, P.S., E.F., M.T., T.K.; writing—original draft preparation, M.T., E.F., M.Z.; writing—review and editing, M.T., E.F., L.B., N.K.S., T.K..; visualization, M.T., E.F., T.S.; supervision, L.B..; project administration, E.F, L.B..; funding acquisition, E.F., L.B. All authors have read and agreed to the published version of the manuscript. The study was conducted in accordance with the Declaration of Helsinki, and approved by the Institutional Ethics Committee at Na Bulovce Hospital in Prague (August 21, 2014; No. 11.6.2019/9150/EK-Z, 2019, and No. 16.3.2023/10795/EK-Z, 2023) for studies involving humans. Informed consent was obtained from all subjects involved in the study.
Data Availability Statement
The data presented in this study are available on request from the corresponding author.
Funding/Acknowledgements
This study was supported by of the Ministry of Education, Youth and Sports, Czech Republic, co-funded by the European Union (projects CZ.02.01.01/00/22_008/0004631 and CZ.02.01.01/00/22_008/0004562) and by the Grant Agency of the Czech Republic (project No. 20-01570S). Further support was provided by Czech Academy of Sciences (Praemium Academiae grant No. 2202). The authors would like to thank Dr. Martin Molitor (Clinic of Plastic Surgery, Faculty Hospital Na Bulovce) for his cooperation on adipose stem cell isolation. Mr. Robin Healey (Czech Technical University, Prague) is gratefully acknowledged for his language revision of the manuscript. We would also like to acknowledge the contributions of the late Prof. Miroslav Jelinek (Institute of Physics, Czech Academy of Sciences).
Conflicts of Interest
The authors declare no conflicts of interest. The funders had no role in the design of the study; in the collection, analyses, or interpretation of data; in the writing of the manuscript; or in the decision to publish the results.
References
- Bohara, S. and Suthakorn, J. Surface coating of orthopedic implant to enhance the osseointegration and reduction of bacterial colonization: a review. Biomater Res 2022, 26, pp, 26. [CrossRef]
- Chen, Q. and Thouas, G. A. Metallic implant biomaterials. Materials Science and Engineering: R: Reports 2015, 87, pp, 1-57. [CrossRef]
- Goodman, S. B.; Yao, Z.; Keeney, M.; Yang, F. The future of biologic coatings for orthopaedic implants. Biomaterials 2013, 34, pp, 3174-83. [CrossRef]
- Goodman, S. B. and Gallo, J. Periprosthetic Osteolysis: Mechanisms, Prevention and Treatment. J Clin Med 2019, 8. [CrossRef]
- Abu-Amer, Y.; Darwech, I.; Clohisy, J. C. Aseptic loosening of total joint replacements: mechanisms underlying osteolysis and potential therapies. Arthritis Res Ther 2007, 9 Suppl 1, pp, S6. [CrossRef]
- Amirtharaj Mosas, K. K.; Chandrasekar, A. R.; Dasan, A.; Pakseresht, A.; Galusek, D. Recent Advancements in Materials and Coatings for Biomedical Implants. Gels 2022, 8. [CrossRef]
- Roy, R. K. and Lee, K. R. Biomedical applications of diamond-like carbon coatings: a review. J Biomed Mater Res B Appl Biomater 2007, 83, pp, 72-84. [CrossRef]
- Grill, A. Diamond-like carbon coatings as biocompatible materials - an overview. Diamond and Related Materials 2003, 12, pp, 166-170. doi: Pii S0925-9635(03)00018-9. [CrossRef]
- Park, S. J.; Lee, K. R.; Ahn, S. H.; Kim, J. G. Instability of diamond-like carbon (DLC) films during sliding in aqueous environment. Diamond and Related Materials 2008, 17, pp, 247-251. [CrossRef]
- Hanawa, T. Titanium-Tissue Interface Reaction and Its Control With Surface Treatment. Front Bioeng Biotechnol 2019, 7, pp, 170. [CrossRef]
- Wang, Q.; Zhou, F.; Zhou, Z.; Yang, Y.; Yan, C.; Wang, C.; Zhang, W.; Li, L. K.-Y.; Bello, I.; Lee, S.-T. Influence of Ti content on the structure and tribological properties of Ti-DLC coatings in water lubrication. Diamond and Related Materials 2012, 25, pp, 163-175. [CrossRef]
- Zhang, M.; Xie, T.; Qian, X.; Zhu, Y.; Liu, X. Mechanical Properties and Biocompatibility of Ti-doped Diamond-like Carbon Films. ACS Omega 2020, 5, pp, 22772-22777. [CrossRef]
- Jelínek, M.; Zemek, J.; Remsa, J.; Mikšovský, J.; Kocourek, T.; Písařík, P.; Trávníčková, M.; Filová, E.; Bačáková, L. Hybrid laser technology and doped biomaterials. Applied Surface Science 2017, 417, pp, 73-83. [CrossRef]
- Jelinek, M.; Kocourek, T.; Zemek, J.; Mikšovský, J.; Kubinová, Š.; Remsa, J.; Kopeček, J.; Jurek, K. Chromium-doped DLC for implants prepared by laser-magnetron deposition. Mater Sci Eng C Mater Biol Appl 2015, 46, pp, 381-6. [CrossRef]
- Jelínek, M.; Zemek, J.; Kocourek, T.; Remsa, J.; Miksovsky, J.; Písarík, P.; Jurek, K.; Tolde, Z.; Trávnícková, M.; Vandrovcová, M.; Filová, E. Dual laser deposition of Ti: DLC composite for implants. Laser Physics 2016, 26. doi: Artn 105605 10.1088/1054-660x/26/10/105605.
- Knight, M. N. and Hankenson, K. D. Mesenchymal Stem Cells in Bone Regeneration. Adv Wound Care (New Rochelle) 2013, 2, pp, 306-316. [CrossRef]
- Lin, W.; Xu, L.; Zwingenberger, S.; Gibon, E.; Goodman, S. B.; Li, G. Mesenchymal stem cells homing to improve bone healing. J Orthop Translat 2017, 9, pp, 19-27. [CrossRef]
- Iaquinta, M. R.; Mazzoni, E.; Bononi, I.; Rotondo, J. C.; Mazziotta, C.; Montesi, M.; Sprio, S.; Tampieri, A.; Tognon, M.; Martini, F. Adult Stem Cells for Bone Regeneration and Repair. Front Cell Dev Biol 2019, 7, pp, 268. [CrossRef]
- Mende, W.; Götzl, R.; Kubo, Y.; Pufe, T.; Ruhl, T.; Beier, J. P. The Role of Adipose Stem Cells in Bone Regeneration and Bone Tissue Engineering. Cells 2021, 10. [CrossRef]
- Le, Q.; Madhu, V.; Hart, J. M.; Farber, C. R.; Zunder, E. R.; Dighe, A. S.; Cui, Q. Current evidence on potential of adipose derived stem cells to enhance bone regeneration and future projection. World J Stem Cells 2021, 13, pp, 1248-1277. [CrossRef]
- Bayón, R.; Igartua, A.; González, J. J.; Ruiz de Gopegui, U. Influence of the carbon content on the corrosion and tribocorrosion performance of Ti-DLC coatings for biomedical alloys. Tribology International 2015, 88, pp, 115-125. [CrossRef]
- Zhao, Y. Y.; Zhao, B.; Su, X.; Zhang, S.; Wang, S.; Keatch, R.; Zhao, Q. Reduction of bacterial adhesion on titanium-doped diamond-like carbon coatings. Biofouling 2018, 34, pp, 26-33. [CrossRef]
- Trávníčková, M. and Bačáková, L. Application of adult mesenchymal stem cells in bone and vascular tissue engineering. Physiol Res 2018, 67, pp, 831-850. [CrossRef]
- Travnickova, M.; Pajorova, J.; Zarubova, J.; Krocilova, N.; Molitor, M.; Bacakova, L. The Influence of Negative Pressure and of the Harvesting Site on the Characteristics of Human Adipose Tissue-Derived Stromal Cells from Lipoaspirates. Stem Cells Int 2020, 2020, pp, 1016231. [CrossRef]
- Przekora, A.; Vandrovcova, M.; Travnickova, M.; Pajorova, J.; Molitor, M.; Ginalska, G.; Bacakova, L. Evaluation of the potential of chitosan/β-1,3-glucan/hydroxyapatite material as a scaffold for living bone graft production in vitro by comparison of ADSC and BMDSC behaviour on its surface. Biomed Mater 2017, 12, pp, 015030. [CrossRef]
- Travnickova, M.; Vandrovcova, M.; Filova, E.; Steinerova, M.; Rackova, J.; Kocourek, T.; Bartova, J.; Suchy, T.; Zaloudkova, M.; Jelinek, M.; Bacakova, L. Effect of diamond-like carbon doped with chromium on cell differentiation, immune activation and apoptosis. Eur Cell Mater 2020, 40, pp, 276-302. [CrossRef]
- Bacakova, L.; Filova, E.; Parizek, M.; Ruml, T.; Svorcik, V. Modulation of cell adhesion, proliferation and differentiation on materials designed for body implants. Biotechnol Adv 2011, 29, pp, 739-67. [CrossRef]
- Lisková, J.; Kasálková, N. S.; Slepicka, P.; Svorcík, V.; Bacáková, L. Heat-treated carbon coatings on poly (L-lactide) foils for tissue engineering. Materials Science and Engineering C-Materials for Biological Applications 2019, 100, pp, 117-128. [CrossRef]
- Argentati, C.; Morena, F.; Montanucci, P.; Rallini, M.; Basta, G.; Calabrese, N.; Calafiore, R.; Cordellini, M.; Emiliani, C.; Armentano, I.; Martino, S. Surface Hydrophilicity of Poly(l-Lactide) Acid Polymer Film Changes the Human Adult Adipose Stem Cell Architecture. Polymers (Basel) 2018, 10. [CrossRef]
Figure 1.
SEM images of pure DLC and of DLC doped with Ti (0.4, 2.1, 3.7, 6.6, 12.8 at. % of Ti). Scale bar = 50 µm (a) and 10 µm (b).
Figure 1.
SEM images of pure DLC and of DLC doped with Ti (0.4, 2.1, 3.7, 6.6, 12.8 at. % of Ti). Scale bar = 50 µm (a) and 10 µm (b).
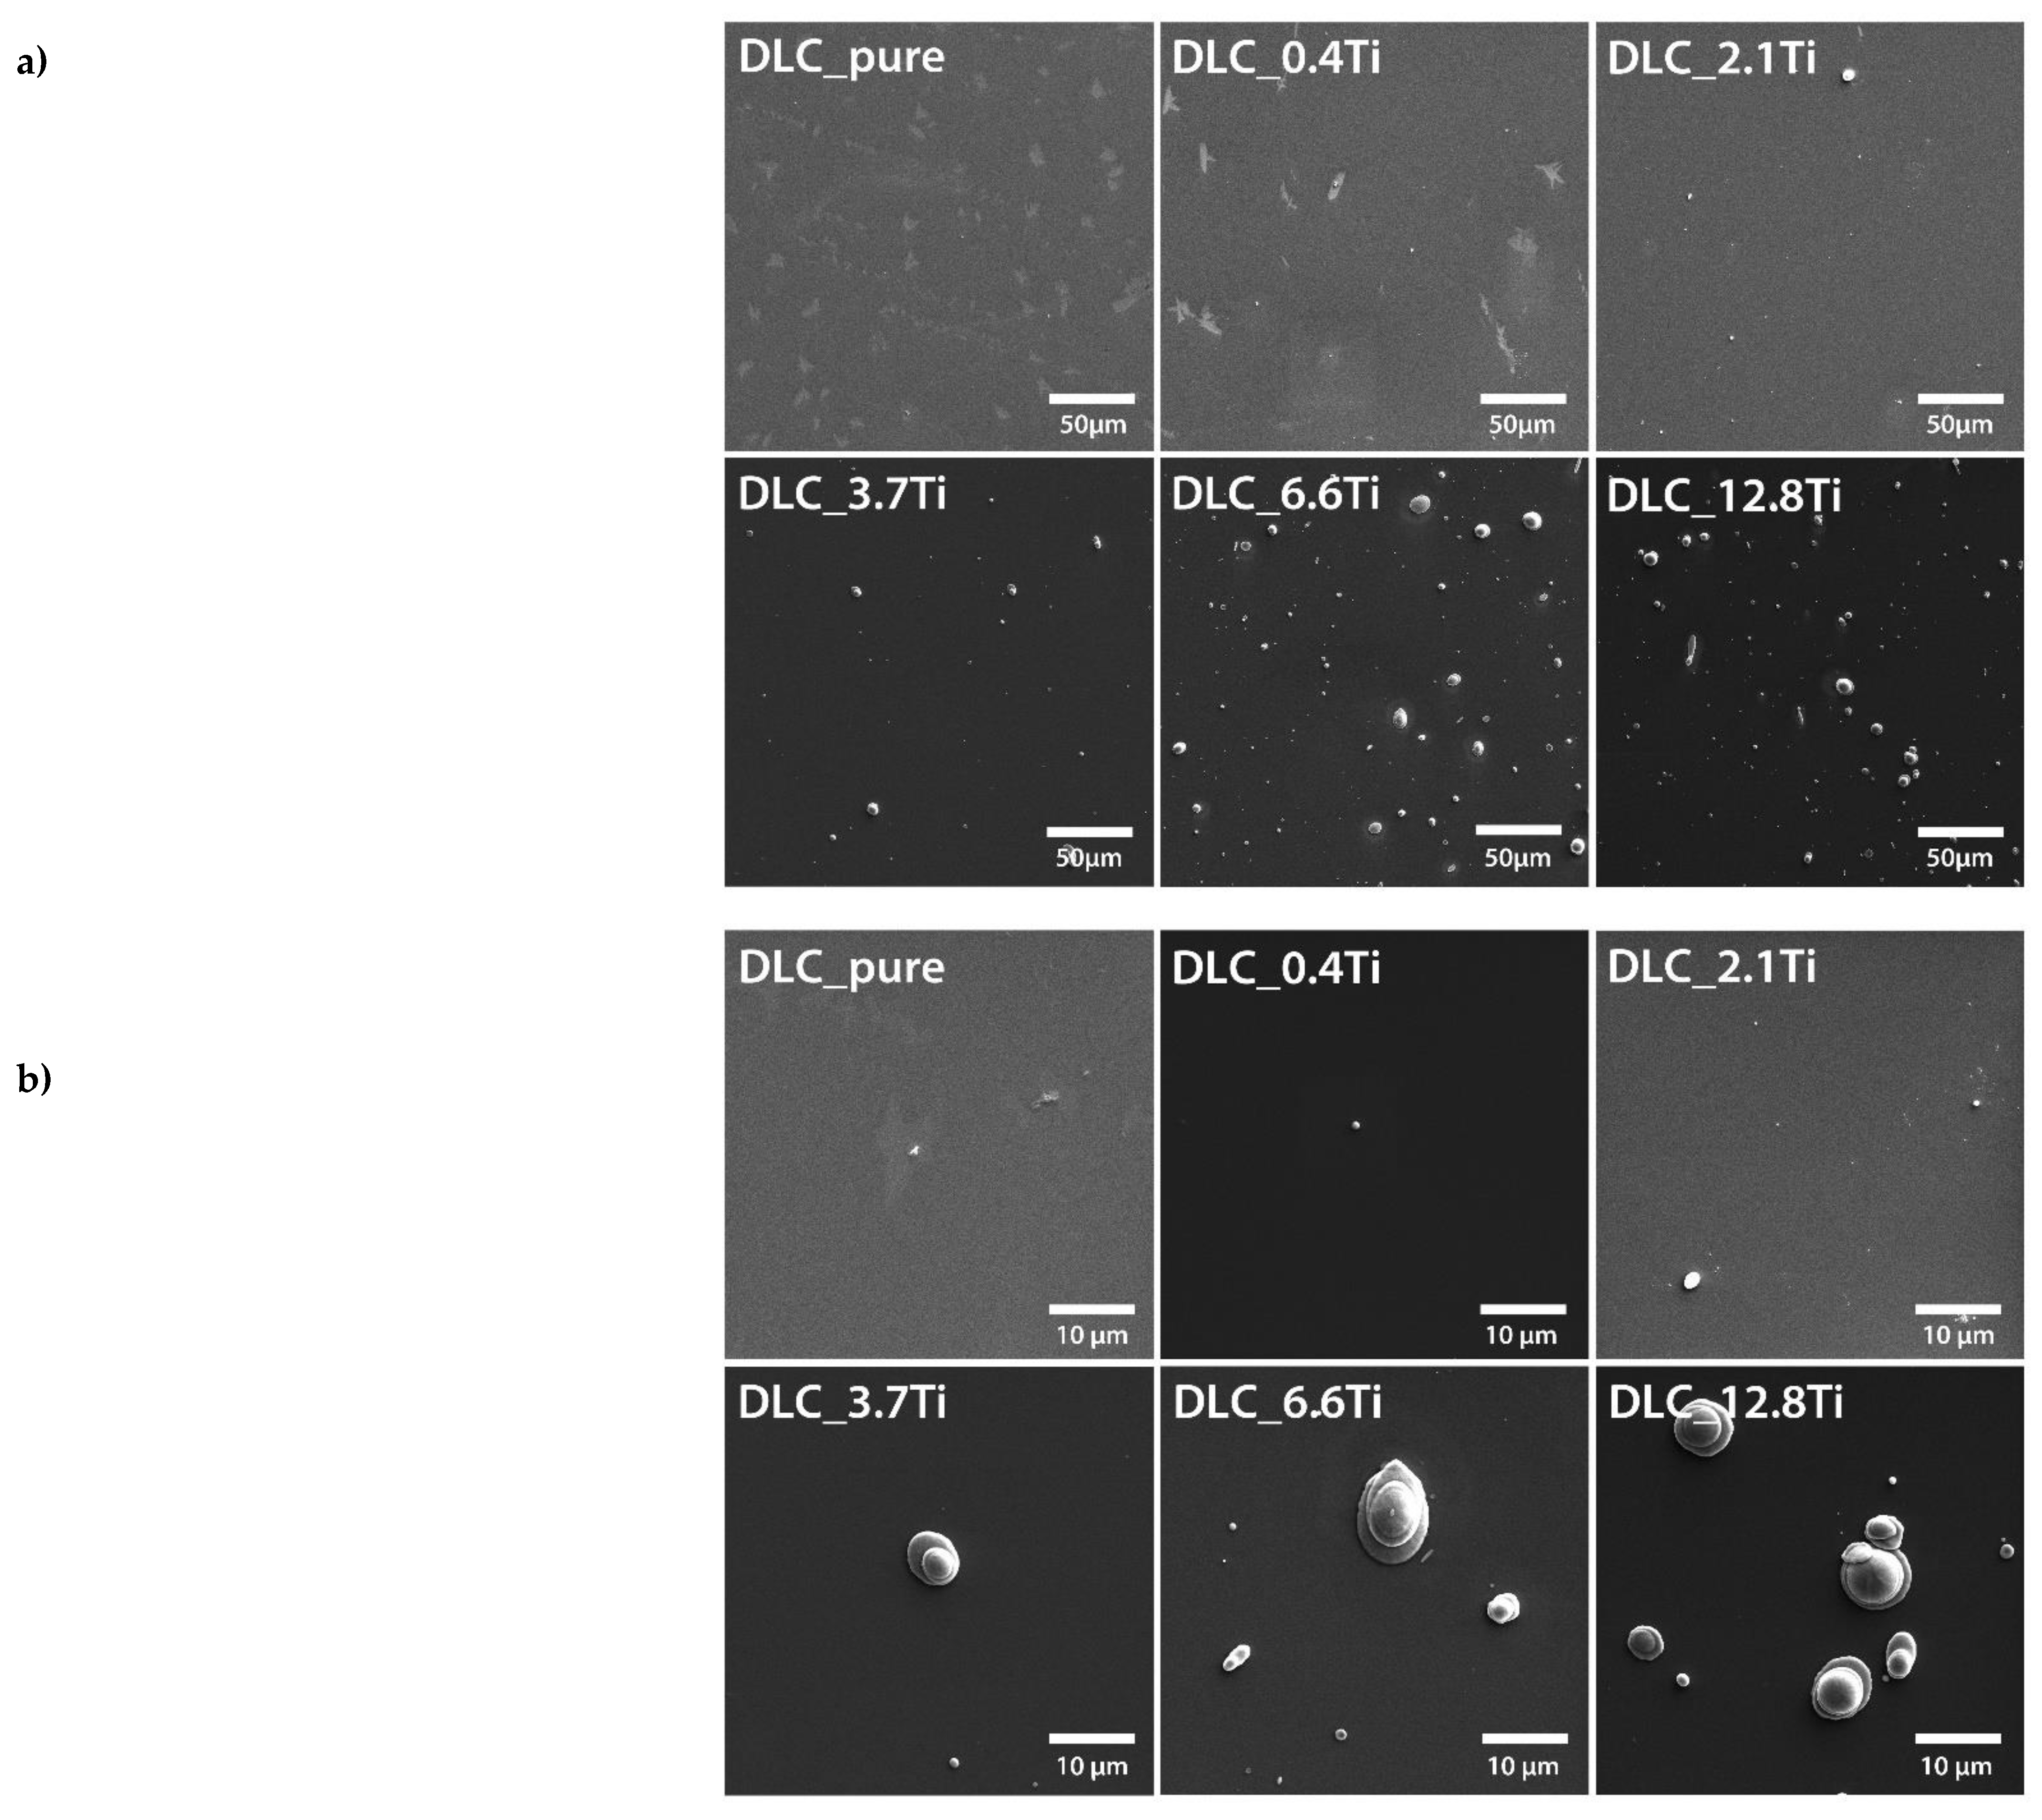
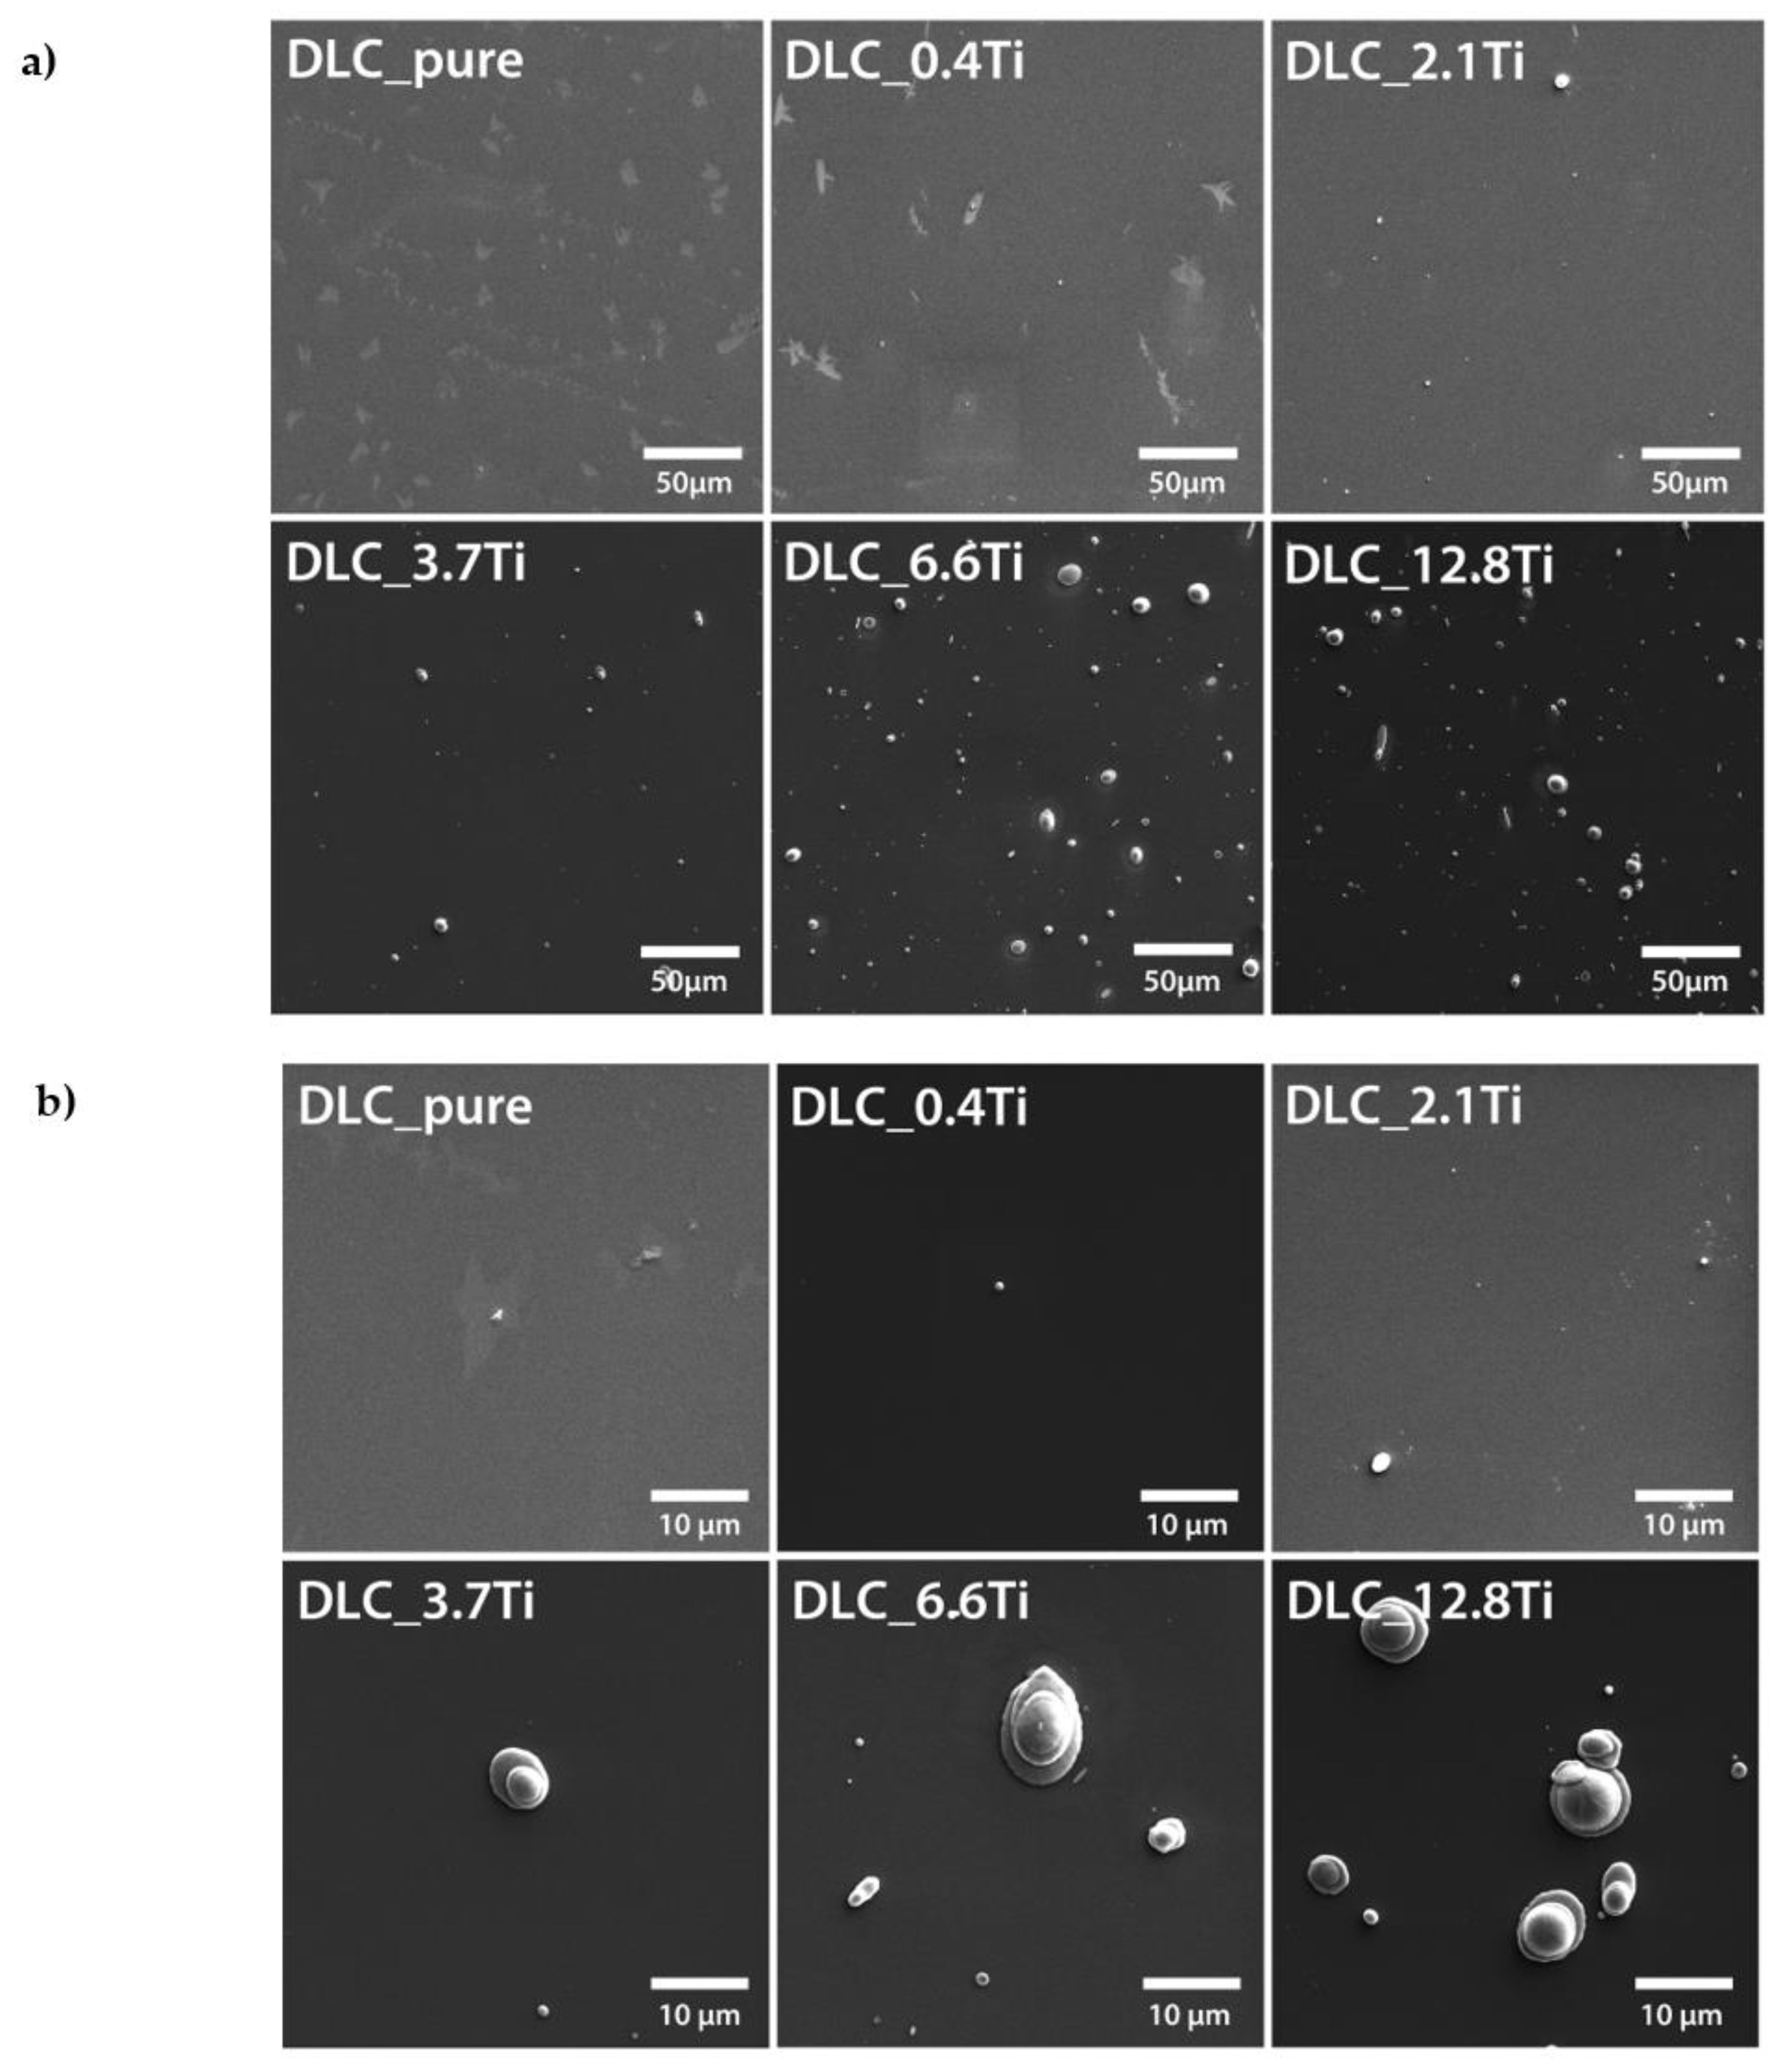
Figure 2.
AFM scans of glass, of pure DLC, and of DLC doped with Ti (0.4, 2.1, 3.7, 6.6, 12.8 at. % of Ti). A region of 1 µm x 1 µm is depicted. The mean roughness value (Ra) represents the average surface roughness in nm.
Figure 2.
AFM scans of glass, of pure DLC, and of DLC doped with Ti (0.4, 2.1, 3.7, 6.6, 12.8 at. % of Ti). A region of 1 µm x 1 µm is depicted. The mean roughness value (Ra) represents the average surface roughness in nm.
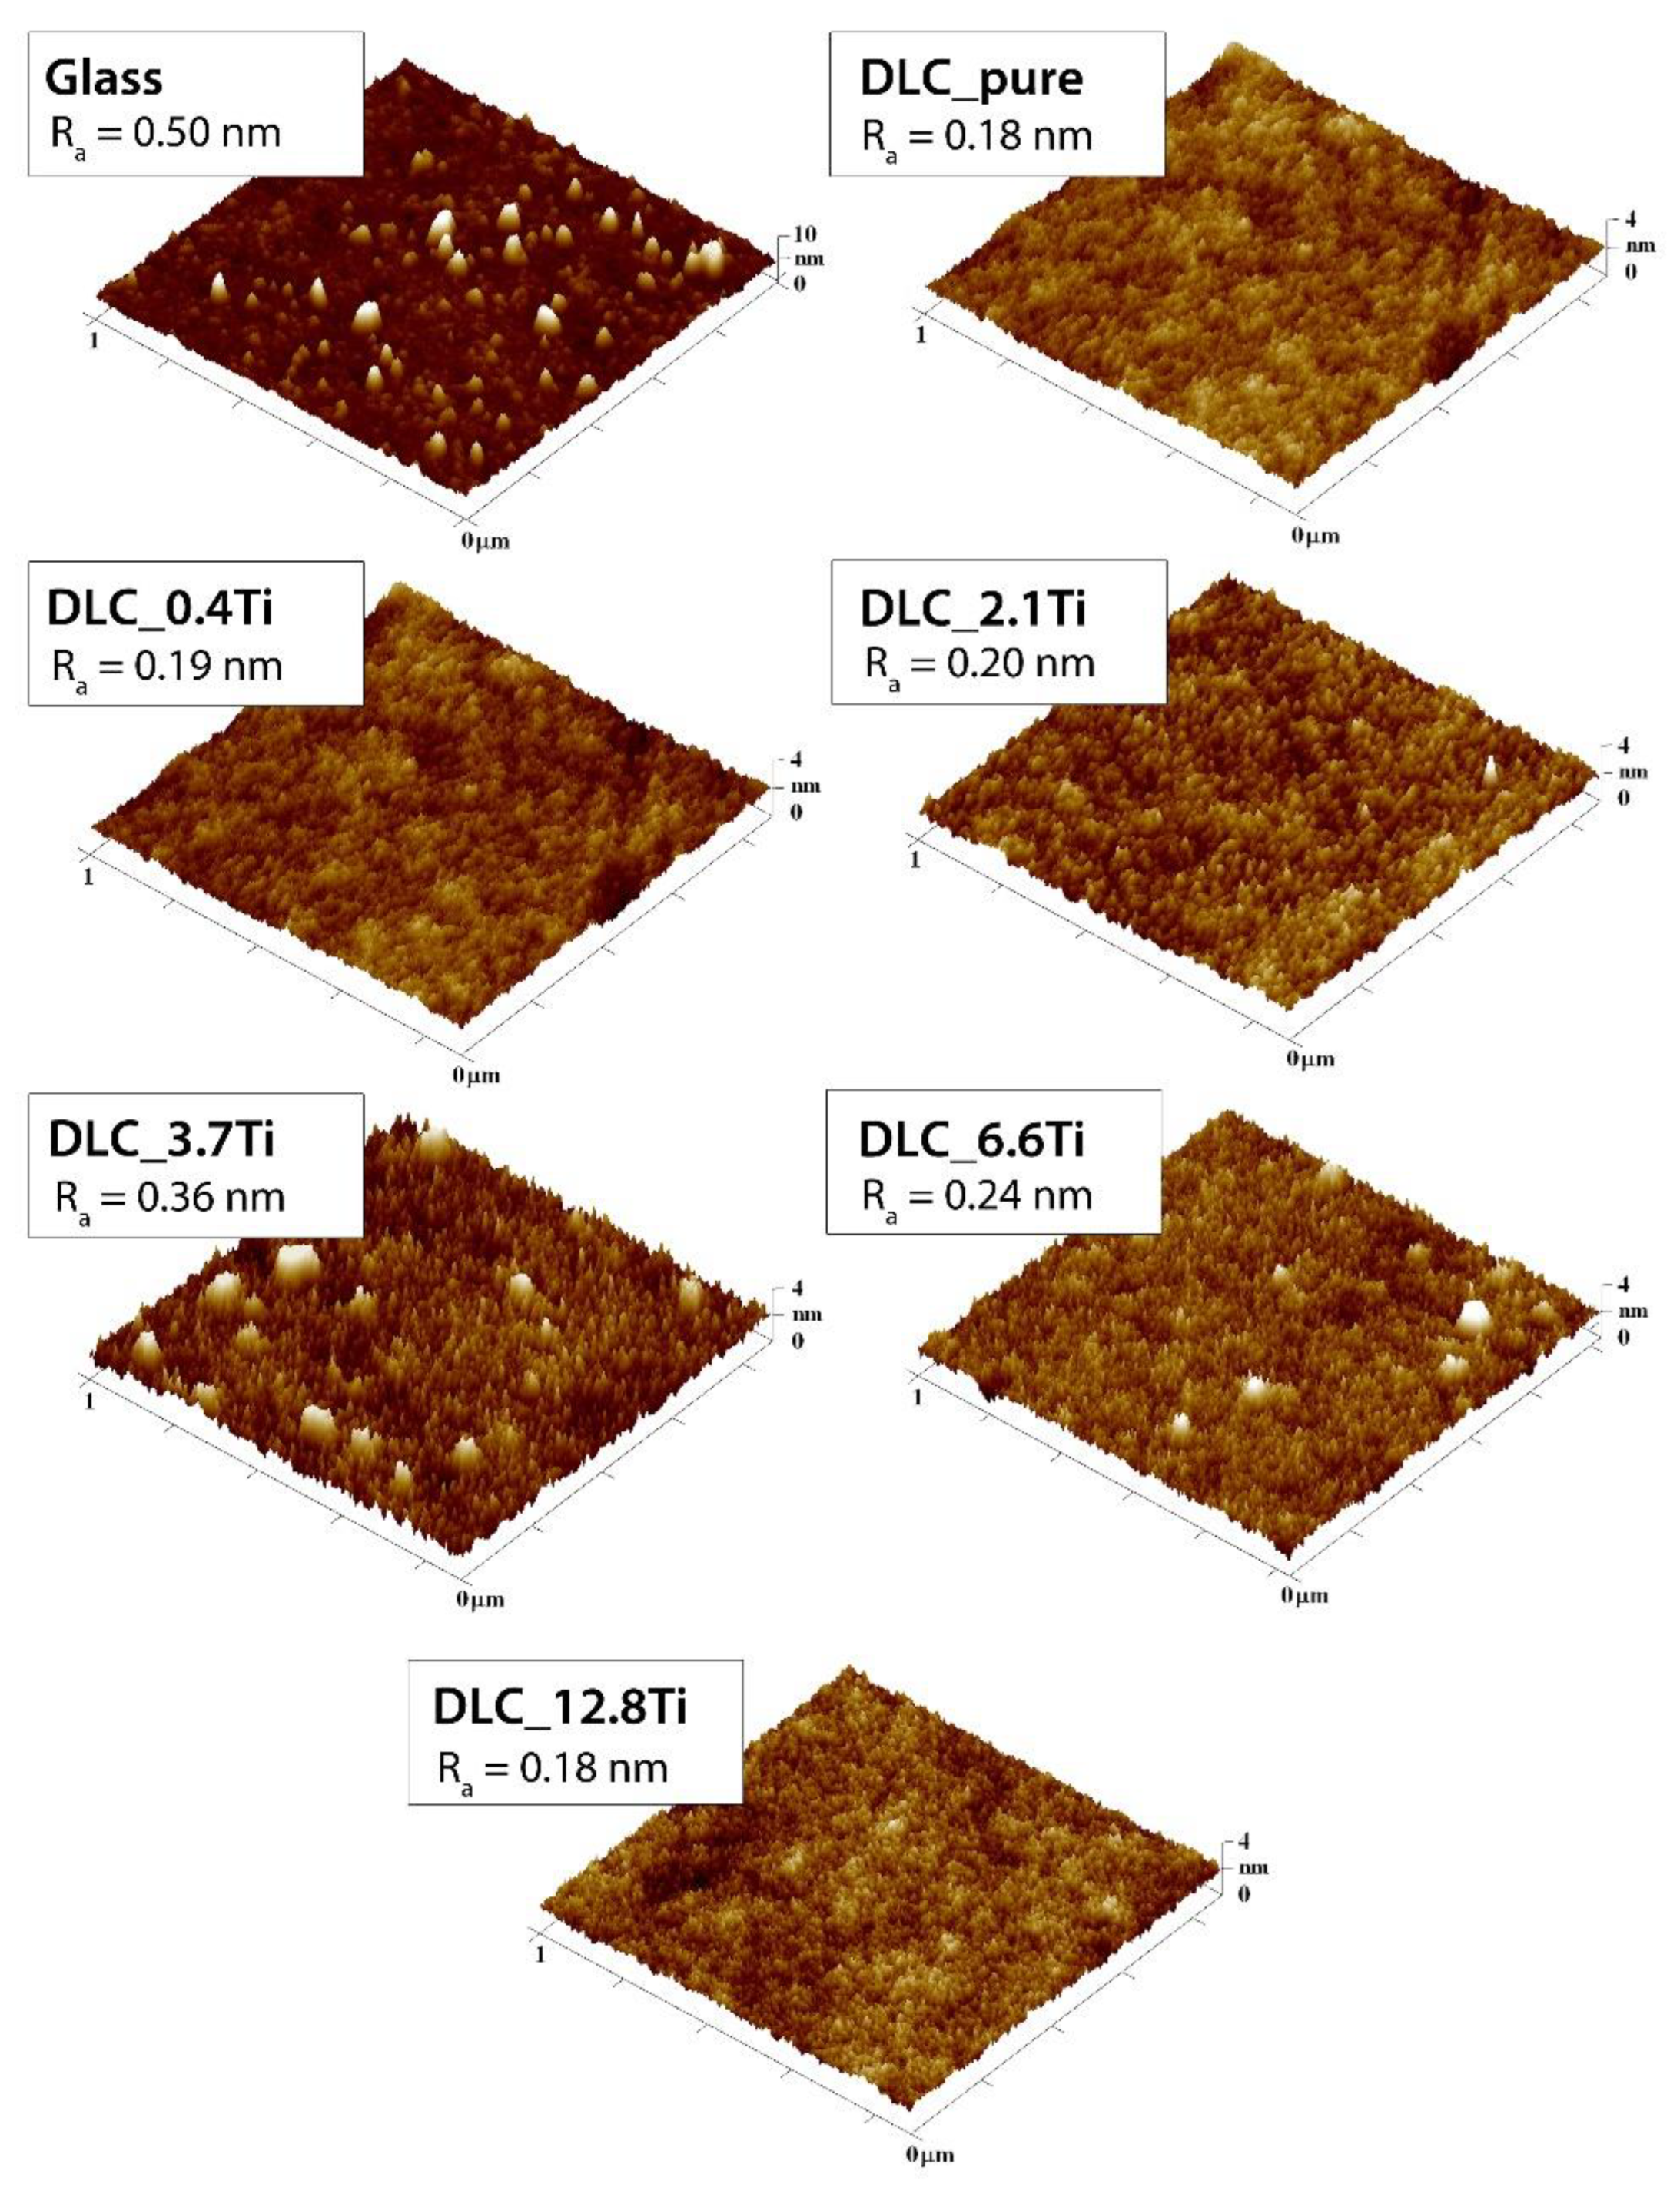
Figure 3.
The mass concentration of Ti and C elements determined by EDS on the surface of the tested materials. The Mann-Whitney test was applied to compare each material separately with the control sample (DLC_pure). The pairs with p-values ≤ 0.05 (n=5) are marked with “*”.
Figure 3.
The mass concentration of Ti and C elements determined by EDS on the surface of the tested materials. The Mann-Whitney test was applied to compare each material separately with the control sample (DLC_pure). The pairs with p-values ≤ 0.05 (n=5) are marked with “*”.
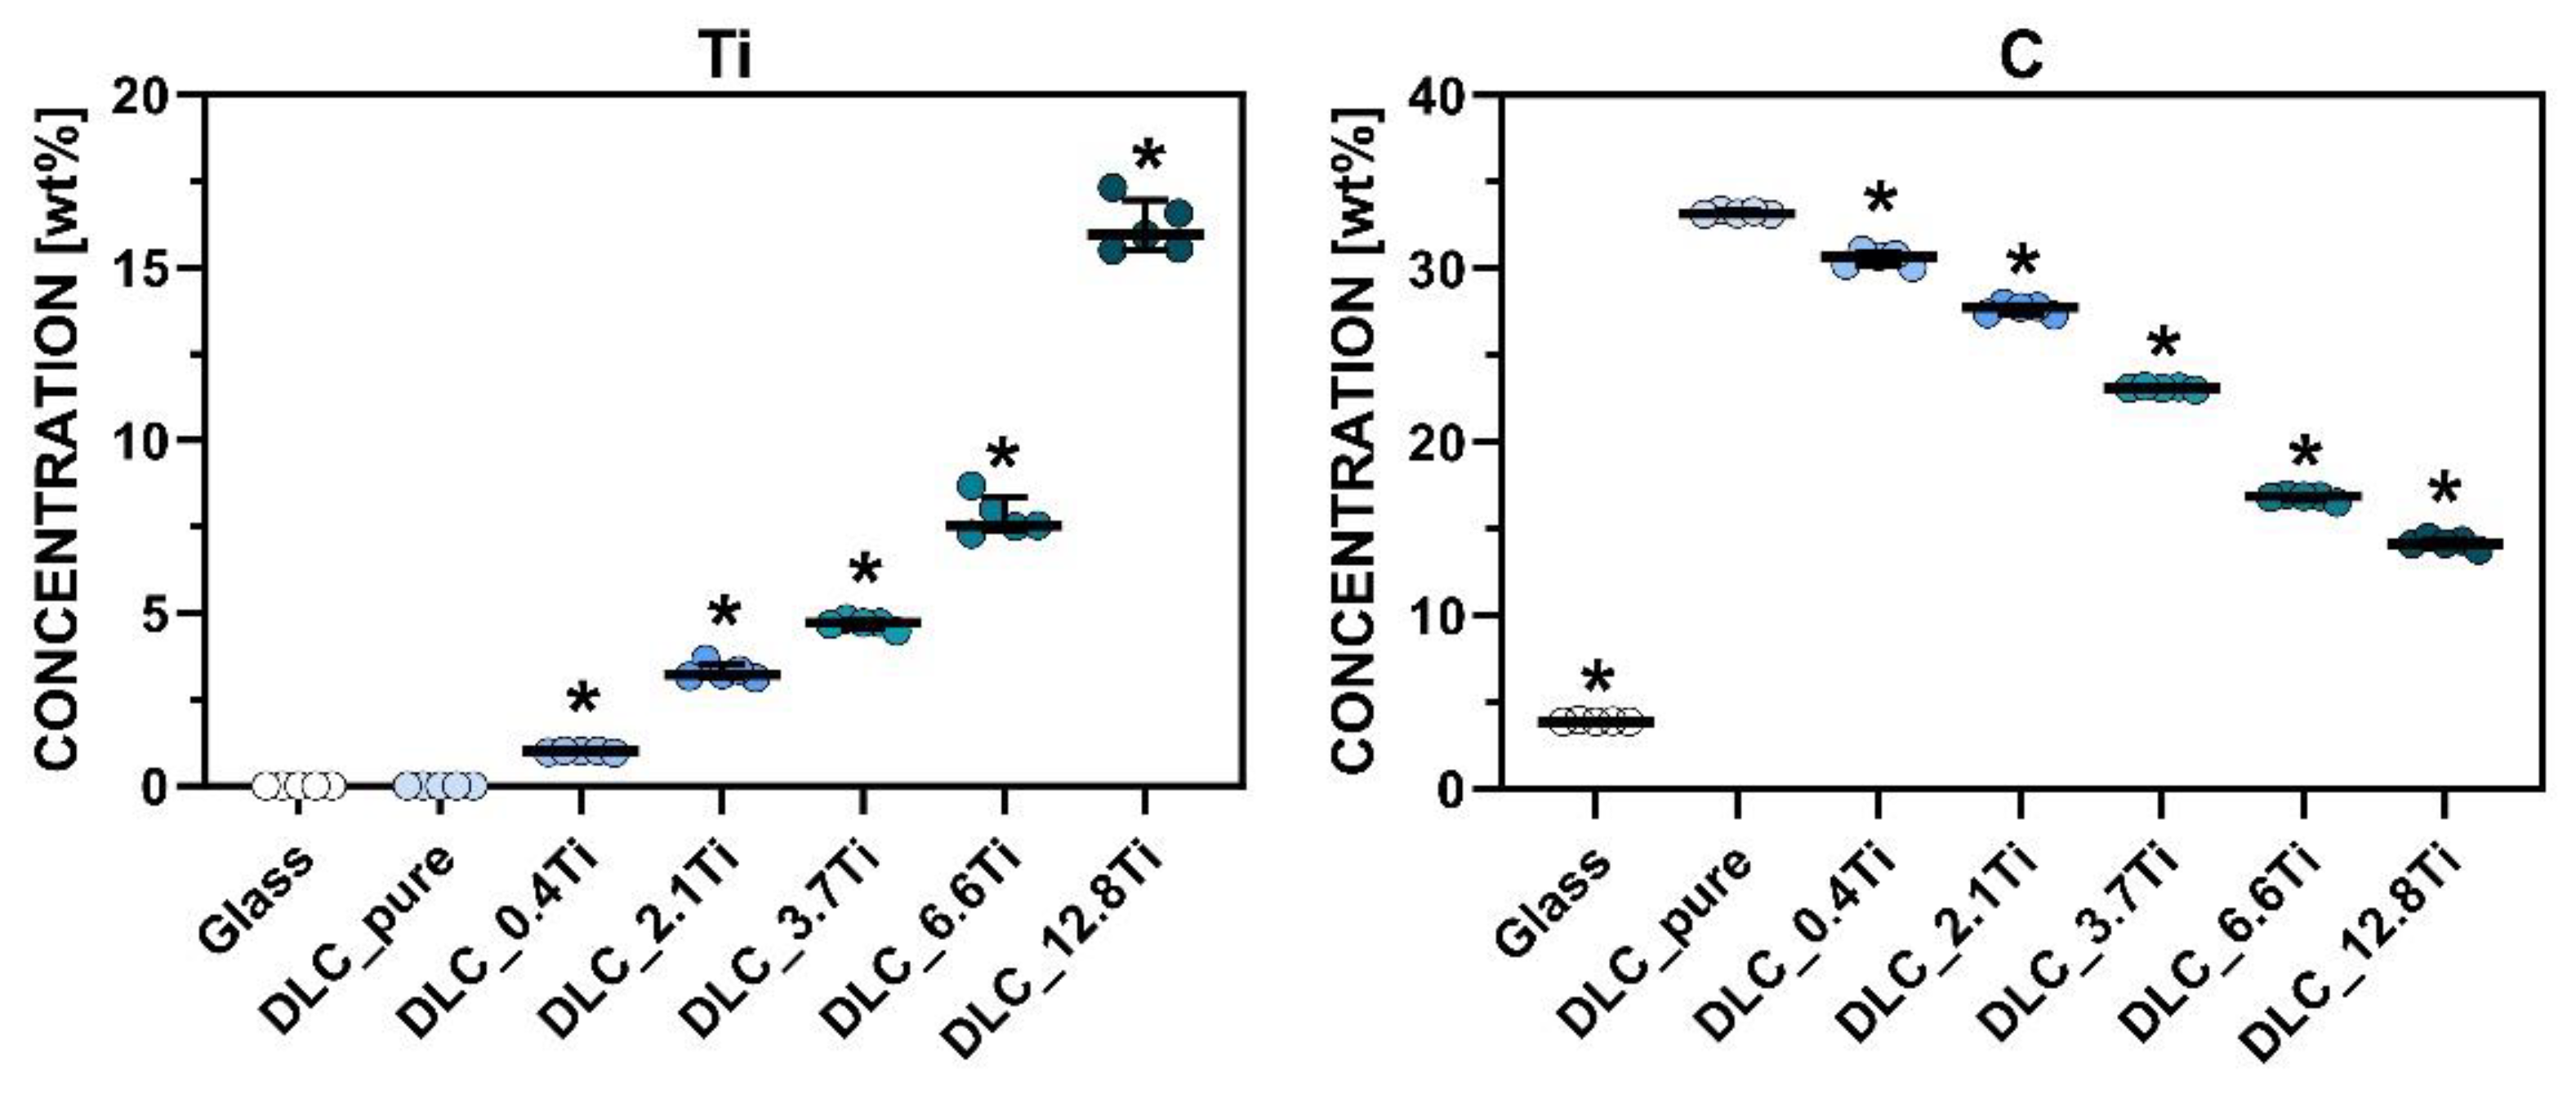
Figure 4.
The densities of ADSCs (A) and of bmMSCs (B) on glass, on pure DLC, on DLC doped with Ti (0.4, 2.1, 3.7, 6.6, 12.8 at.% of Ti), and on polystyrene (PS) on days 1, 7, 14 and 21. The data are expressed as mean + SD. ANOVA, Student-Newman-Keuls method. The statistical comparison among the samples was made on cells on the same day of the culture. The statistical significance (p≤0.001) is specified above the columns (ADSCs (A): * means a lower value than on glass, 2.1 and 12.8 at.%, bmMSCs (B): * means a higher value than on glass, 0.4 and 12.8 at.%, and on PS; # means a lower value than on 0.4, 2.1, 3.7 and 6.6 at.%; § means a lower value than on 3.7 and 6.6 at.%; ¶ means a lower value than on 3.7 at.%).
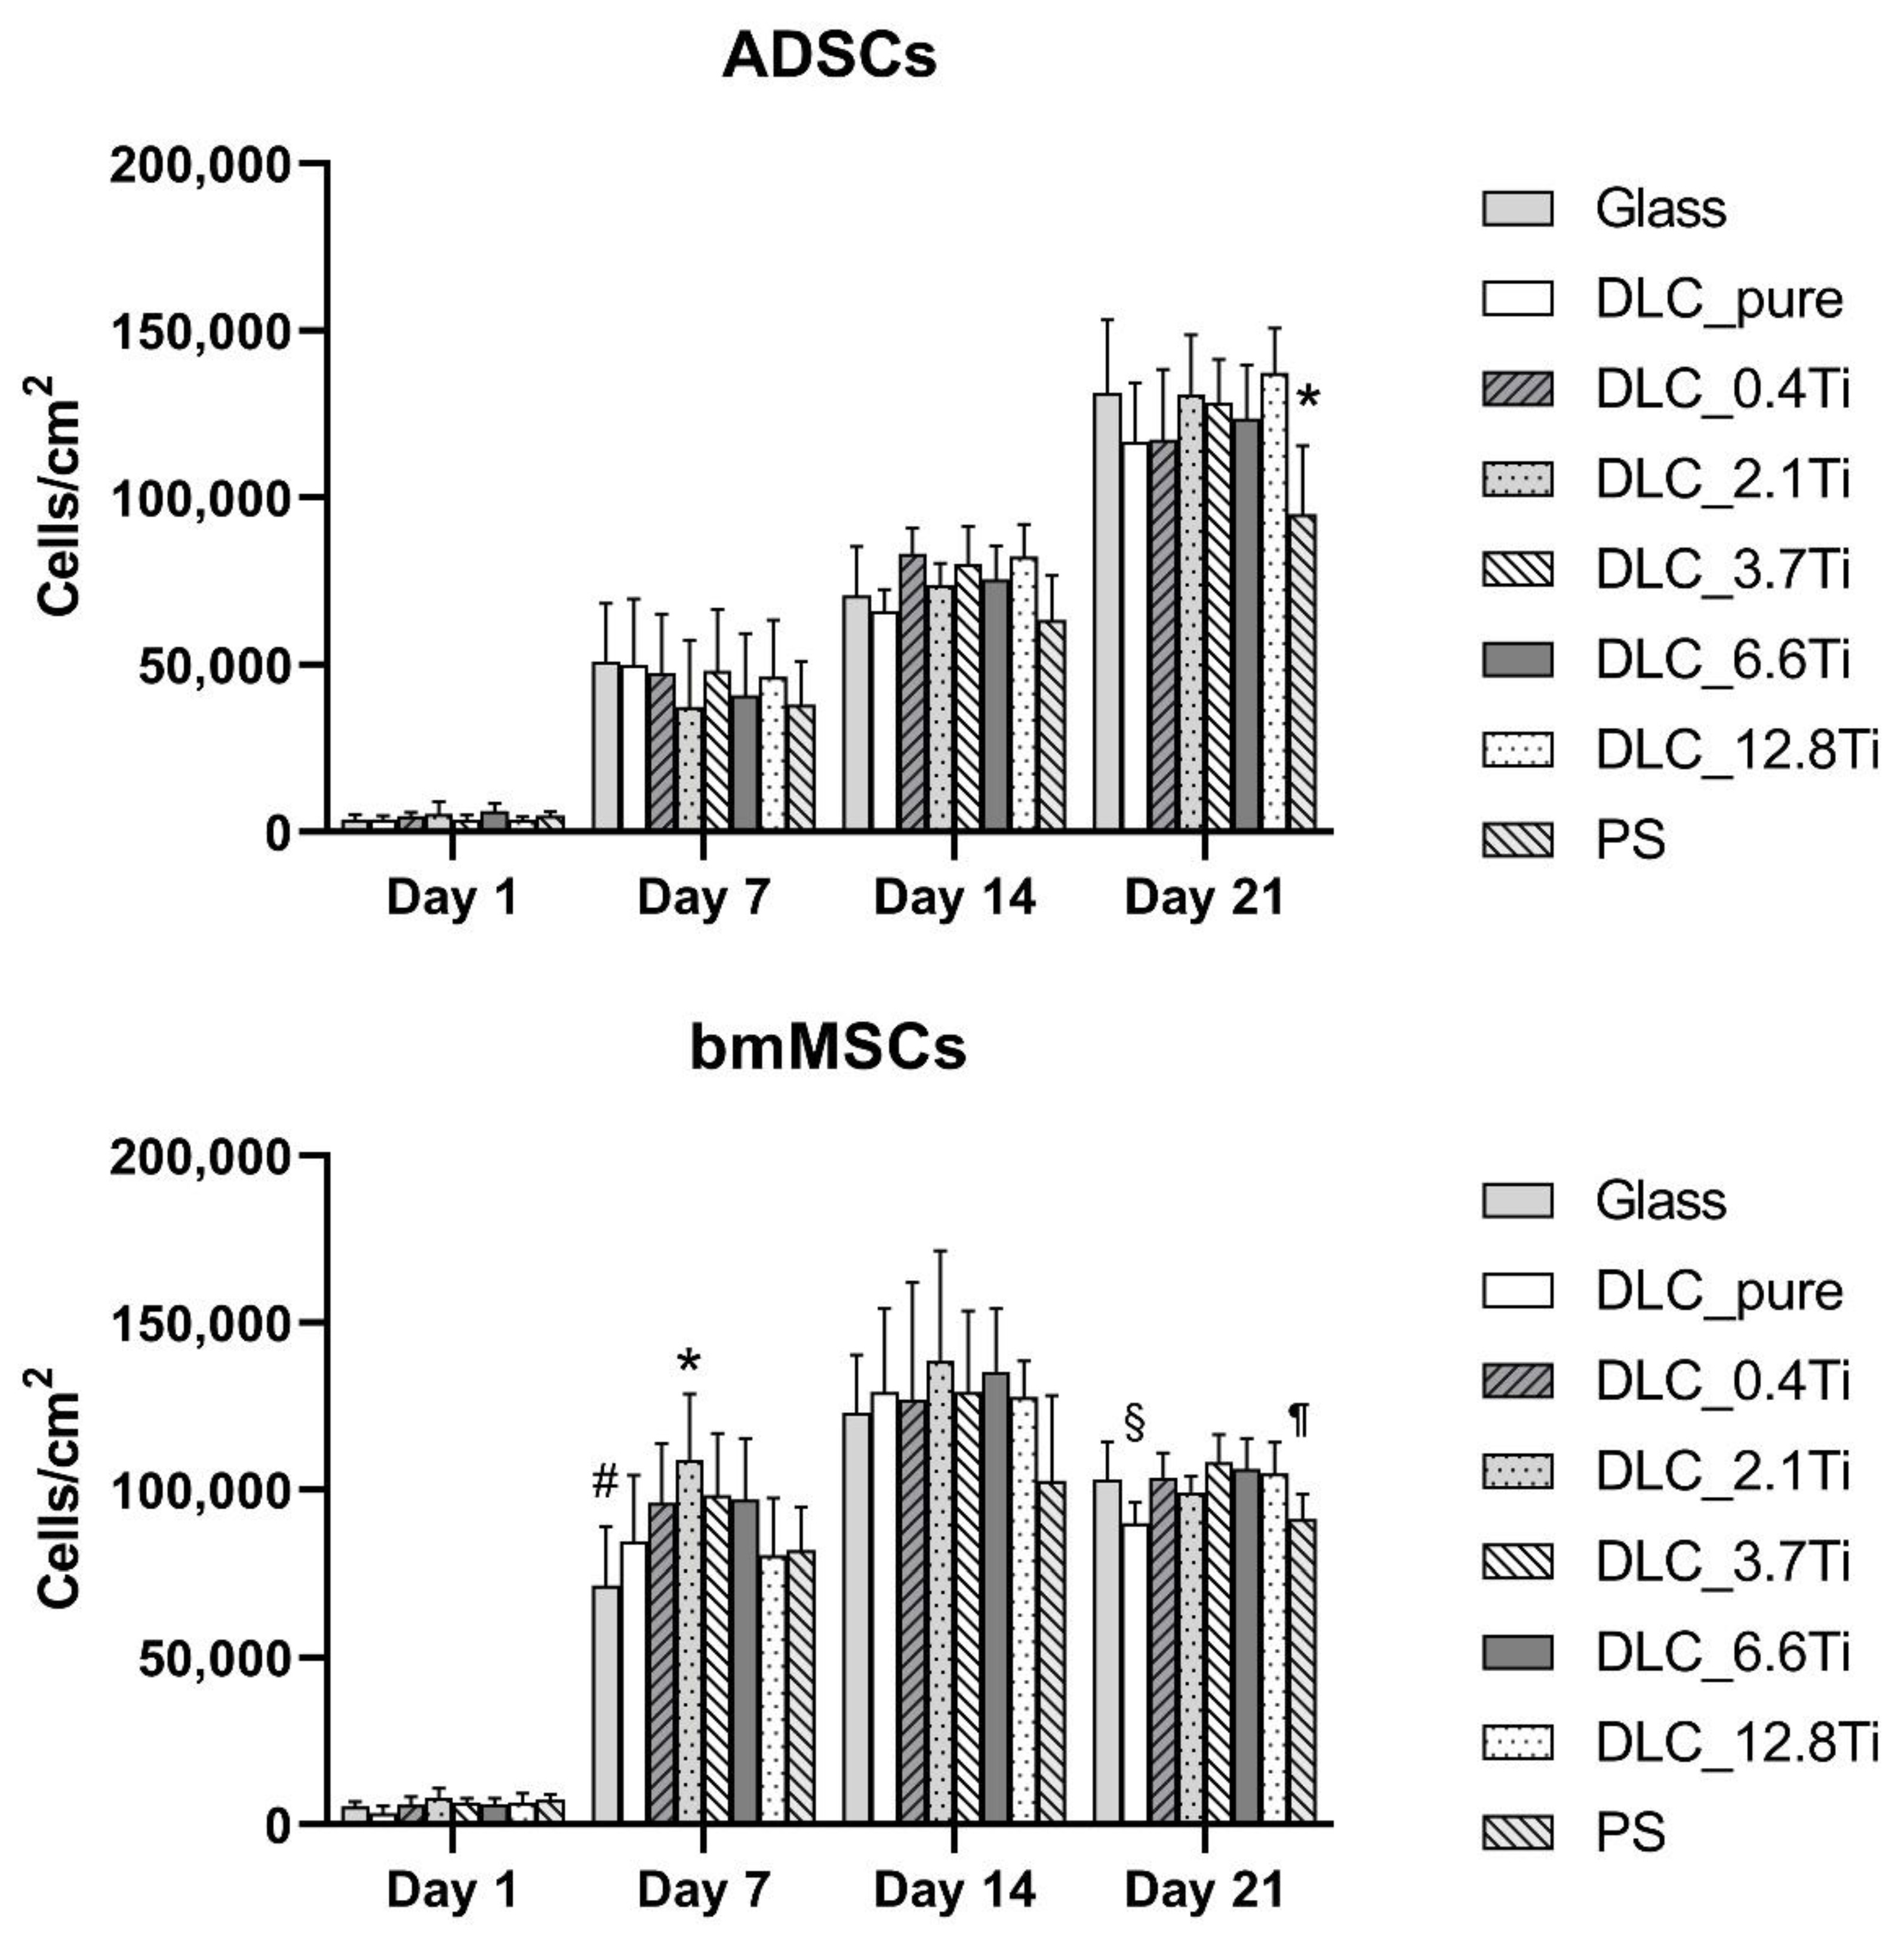
Figure 5.
The metabolic activity of ADSCs (A) and of bmMSCs (B) on glass, on pure DLC, on DLC doped with Ti (0.4, 2.1, 3.7, 6.6, 12.8 at.% of Ti), and on polystyrene (PS) on days 1, 7, 14 and 21. The data (n=3) are expressed as mean + SD. ANOVA, Student-Newman-Keuls method. The statistical comparison among the samples was made on cells on the same day of the culture. The statistical significance (p<0.05) is specified above the columns (ADSCs (A): * means a higher value than on 6.6 and 12.8 at.%; “all” means a statistically different value from all other samples on the specific day of the culture, bmMSCs (B): # means a significantly different value compared to PS, “all” means a statistically different value from all other samples on the specific day of the culture).
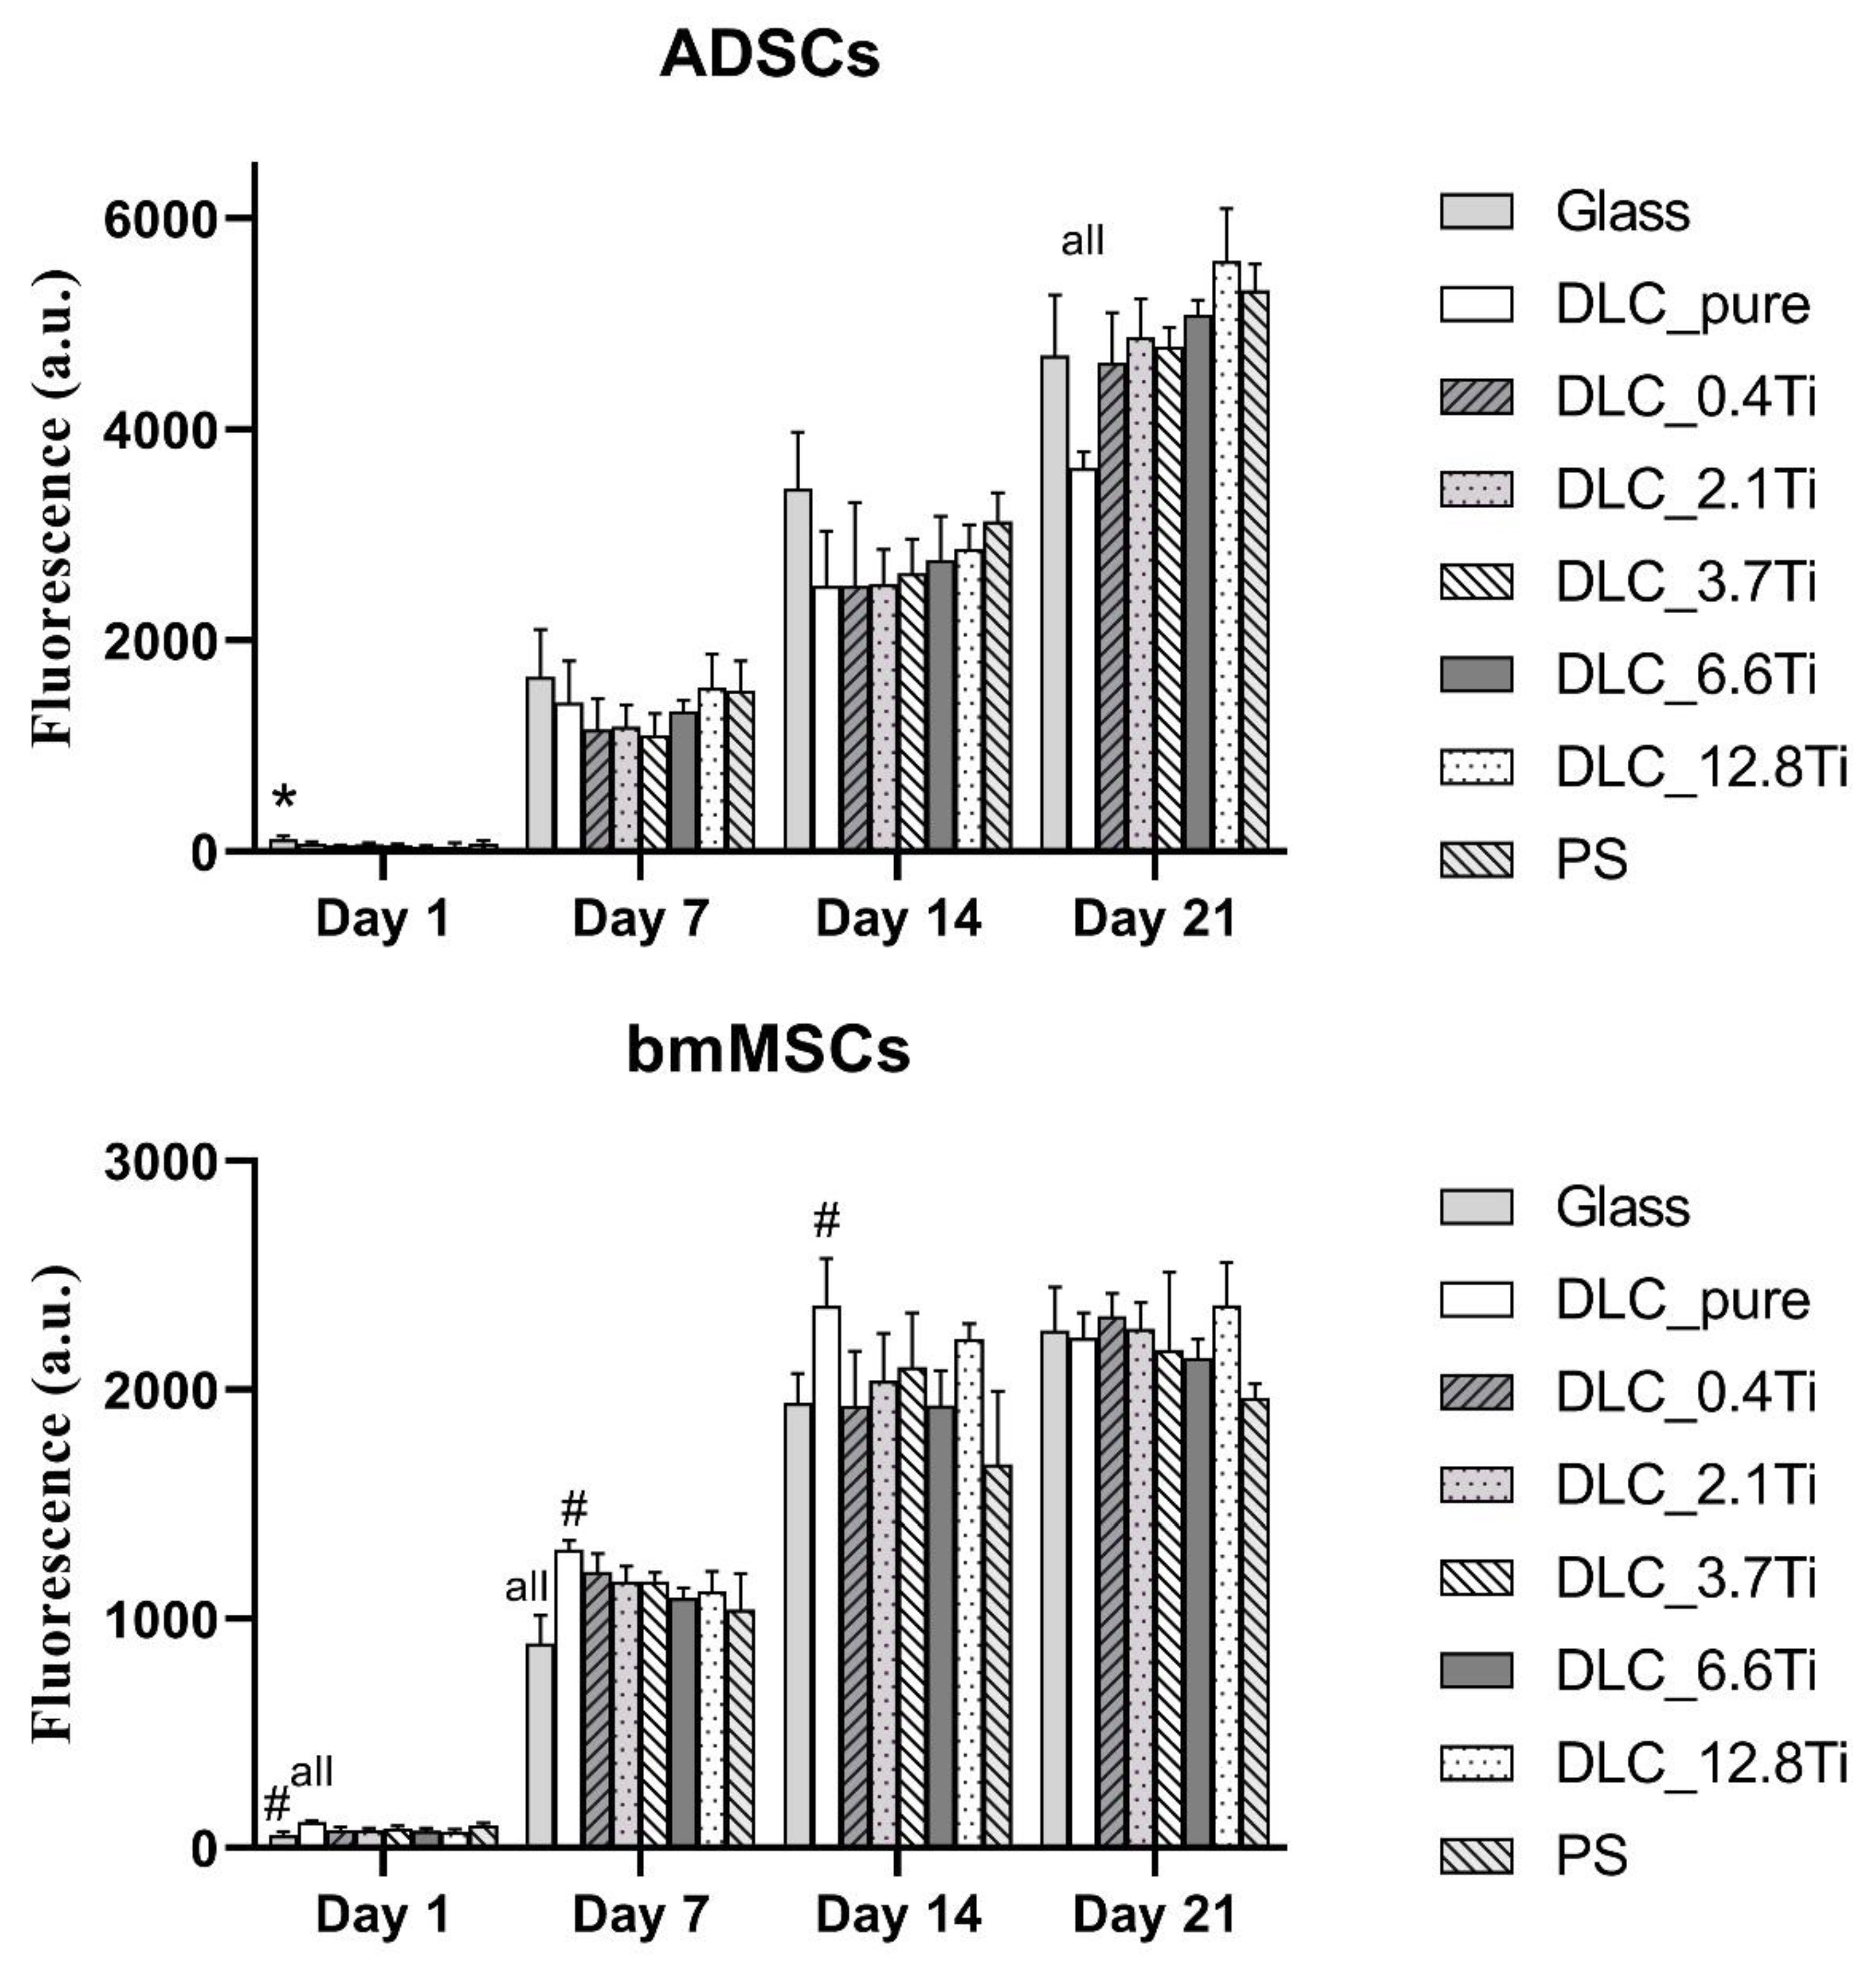
Figure 6.
The morphology and cell spreading of ADSCs and bmMSCs on day 1 after seeding on glass, on pure DLC, on DLC doped with Ti (0.4, 2.1, 3.7, 6.6, 12.8 at.% of Ti), and on polystyrene (PS). The cell cytoplasm was visualized by Texas Red C2-maleimide (red colour) and the cell nuclei were counterstained with Hoechst 33258 (blue colour). Representative images were selected. IX71 Olympus microscope, DP71 digital camera, objective magnification × 20, scale bar 100 μm. The cell spreading area was analysed by Atlas software. Data are presented as box plots with a median line, the outer edges representing the 1st and 3rd quartile, the whiskers depicting the 5th and the 95th percentile.
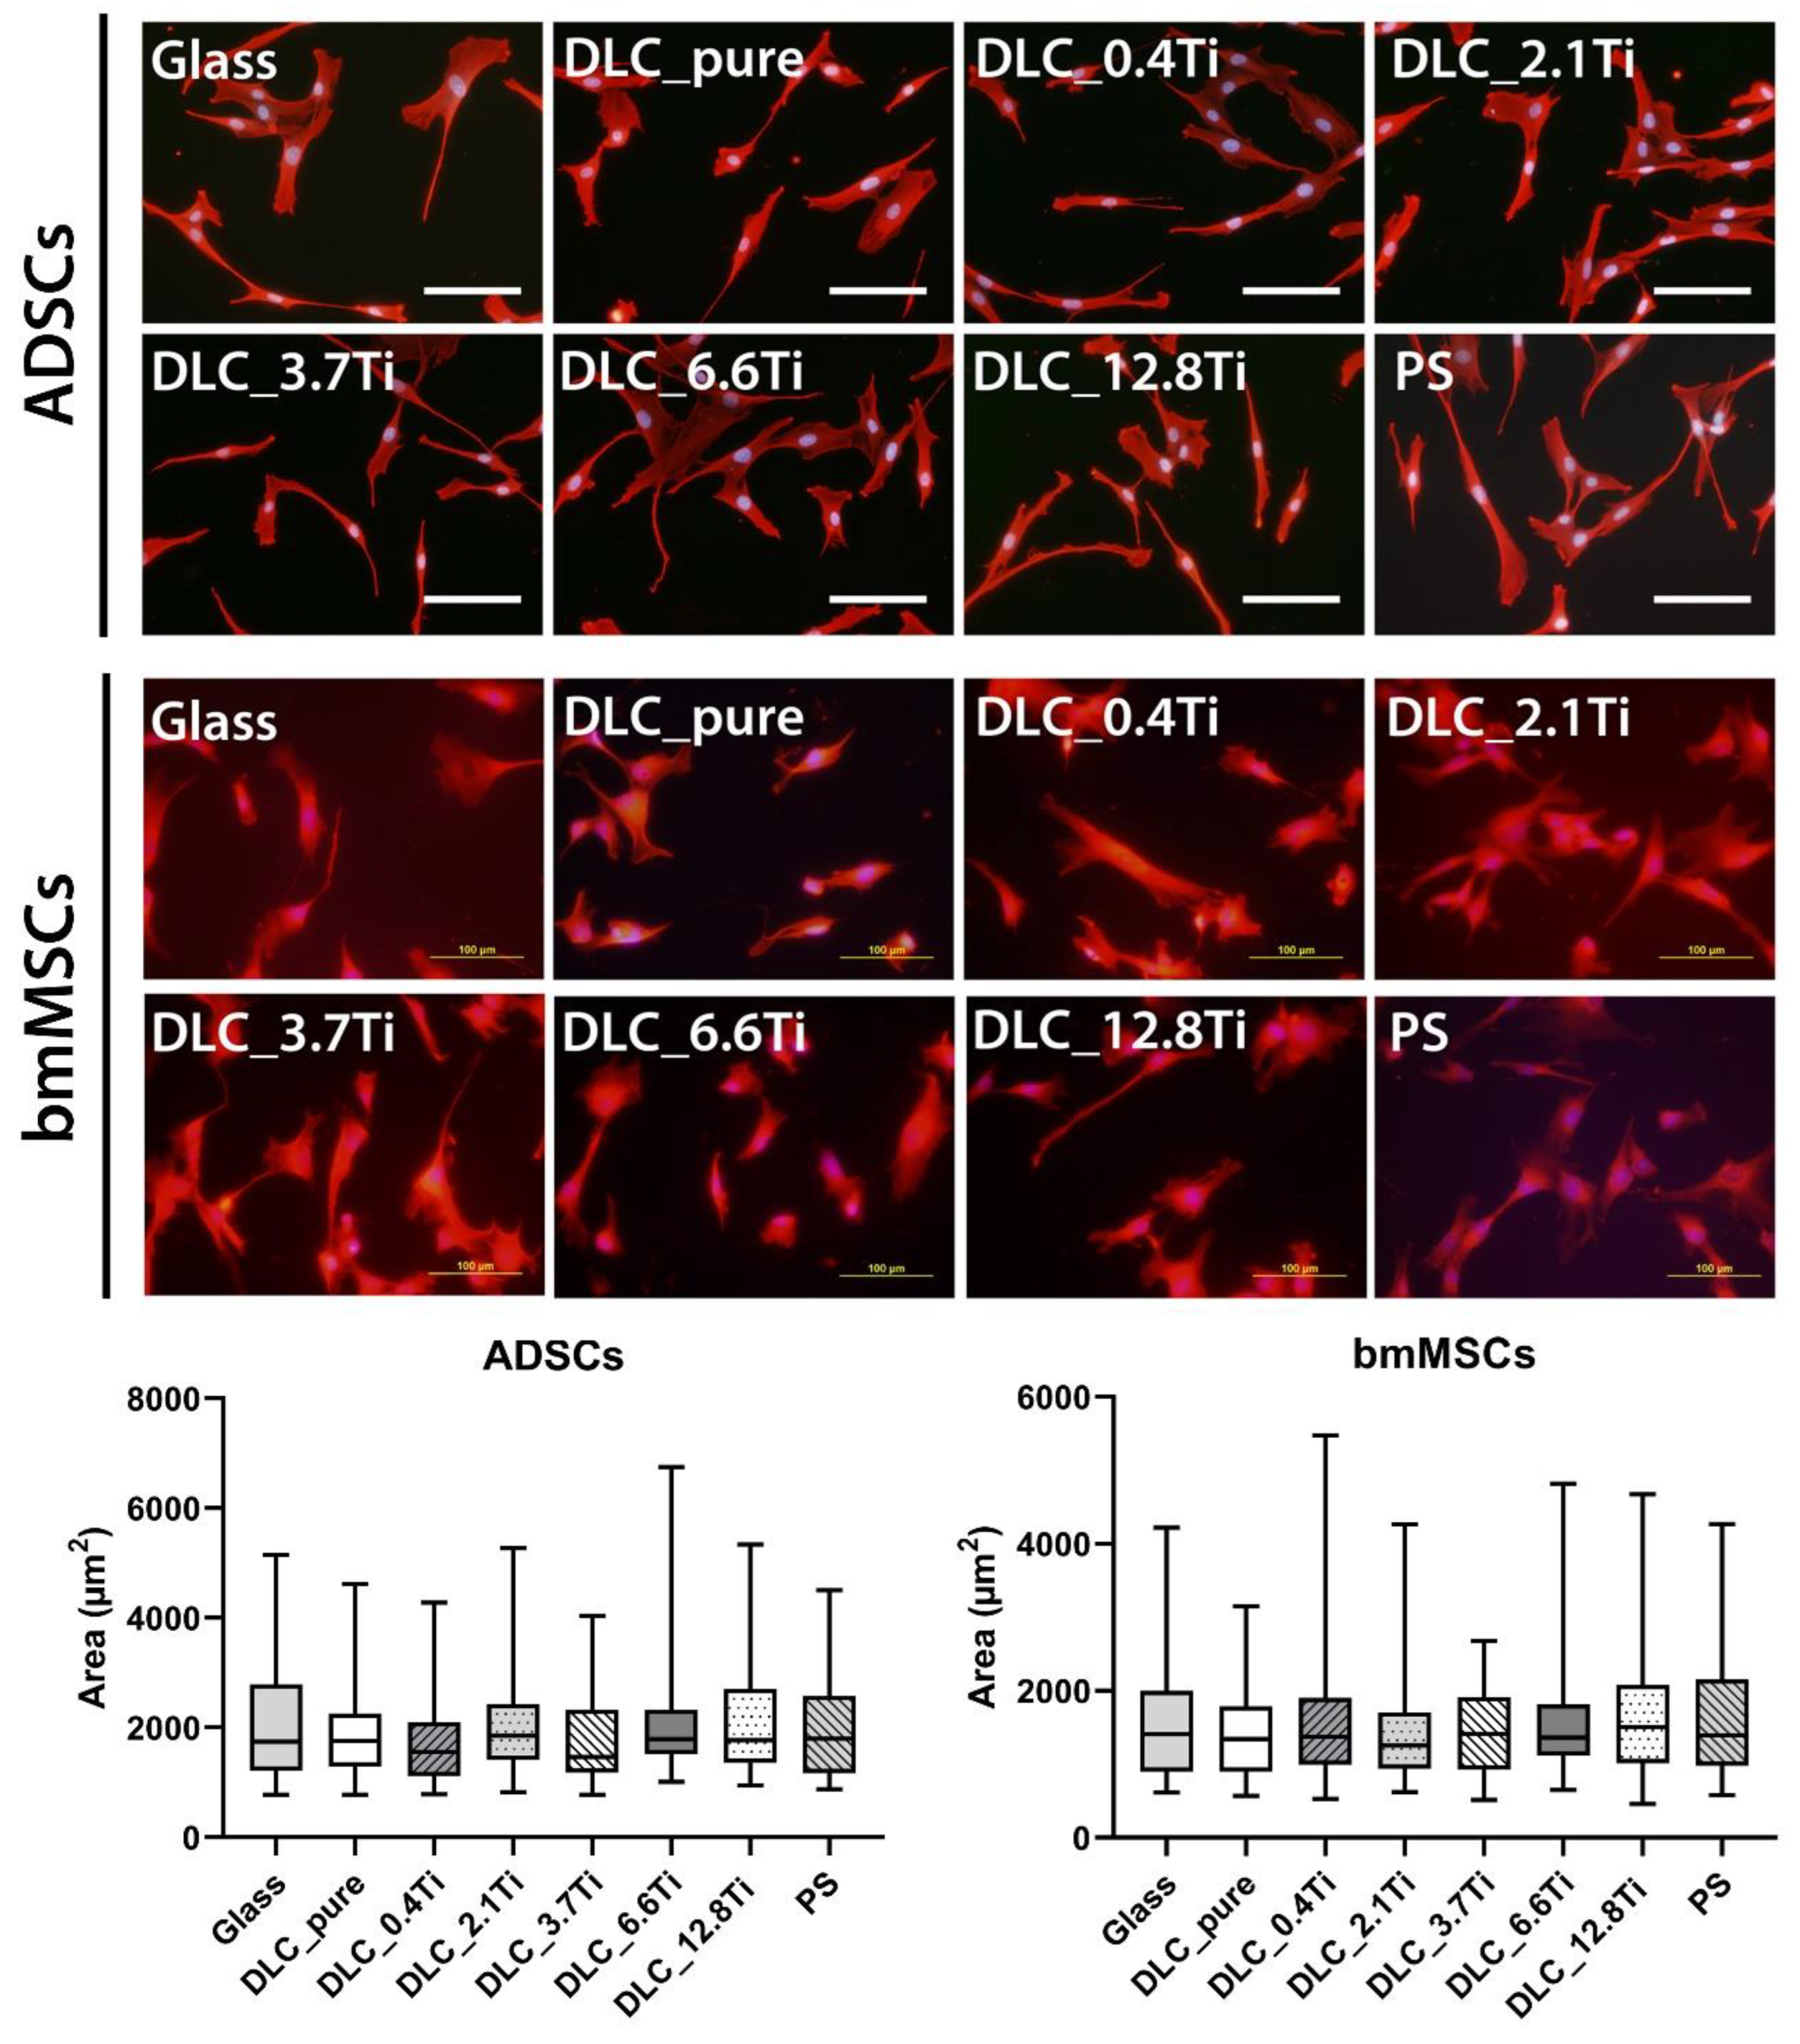
Figure 7.
The fluorescence staining of F-actin (red) and vinculin (green) in ADSCs on glass, on pure DLC, on DLC doped with Ti (0.4, 2.1, 3.7, 6.6, 12.8 at.% of Ti) on day 3. Cell nuclei are counterstained with Hoechst 33258 (blue). Representative images were selected. Olympus IX71 microscope, IX71 digital camera, objective magnification ×20, scale bar 100 µm.
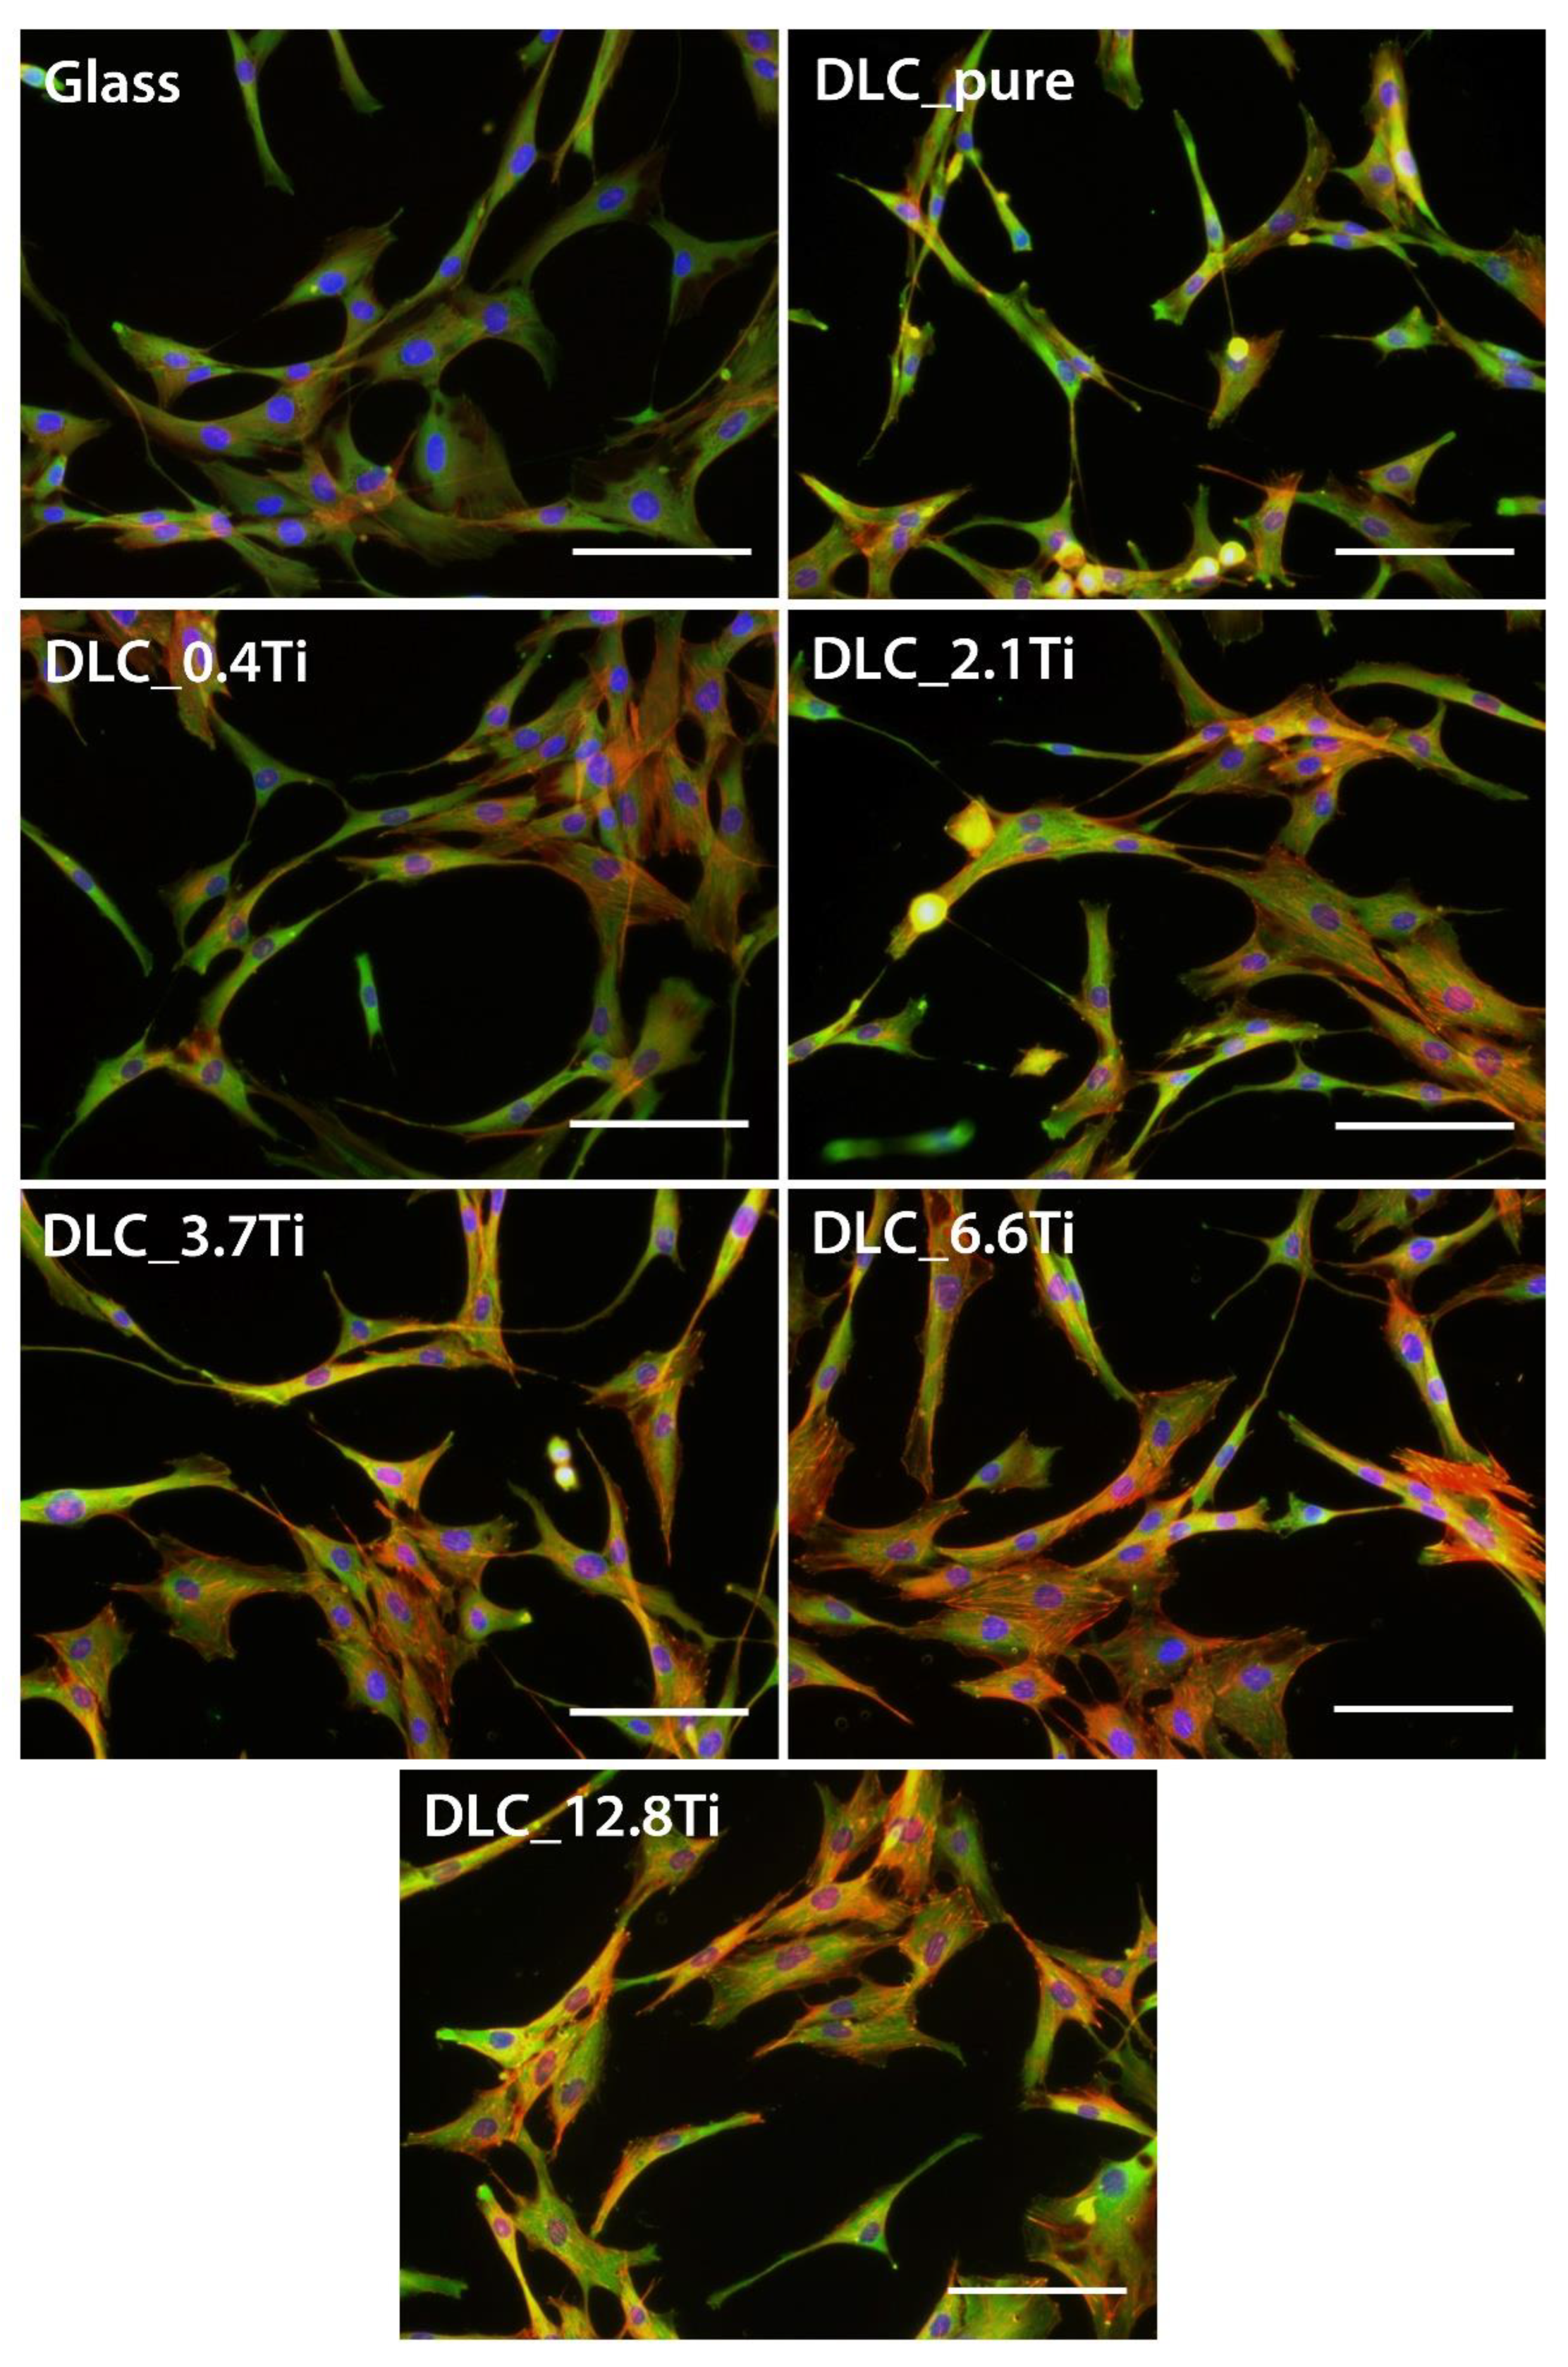
Figure 8.
The immunofluorescence staining of type I collagen and osteocalcin (both markers in green colour) in ADSCs on glass, on pure DLC, and on DLC doped with Ti (0.4, 2.1, 3.7, 6.6, 12.8 at.% of Ti) on days 14 and 21. In the collagen-stained cells, the cell nuclei are counterstained with Hoechst 33258 (blue). Representative images were selected. Olympus IX71 microscope, IX71 digital camera, objective magnification ×20, scale bar 100 µm.
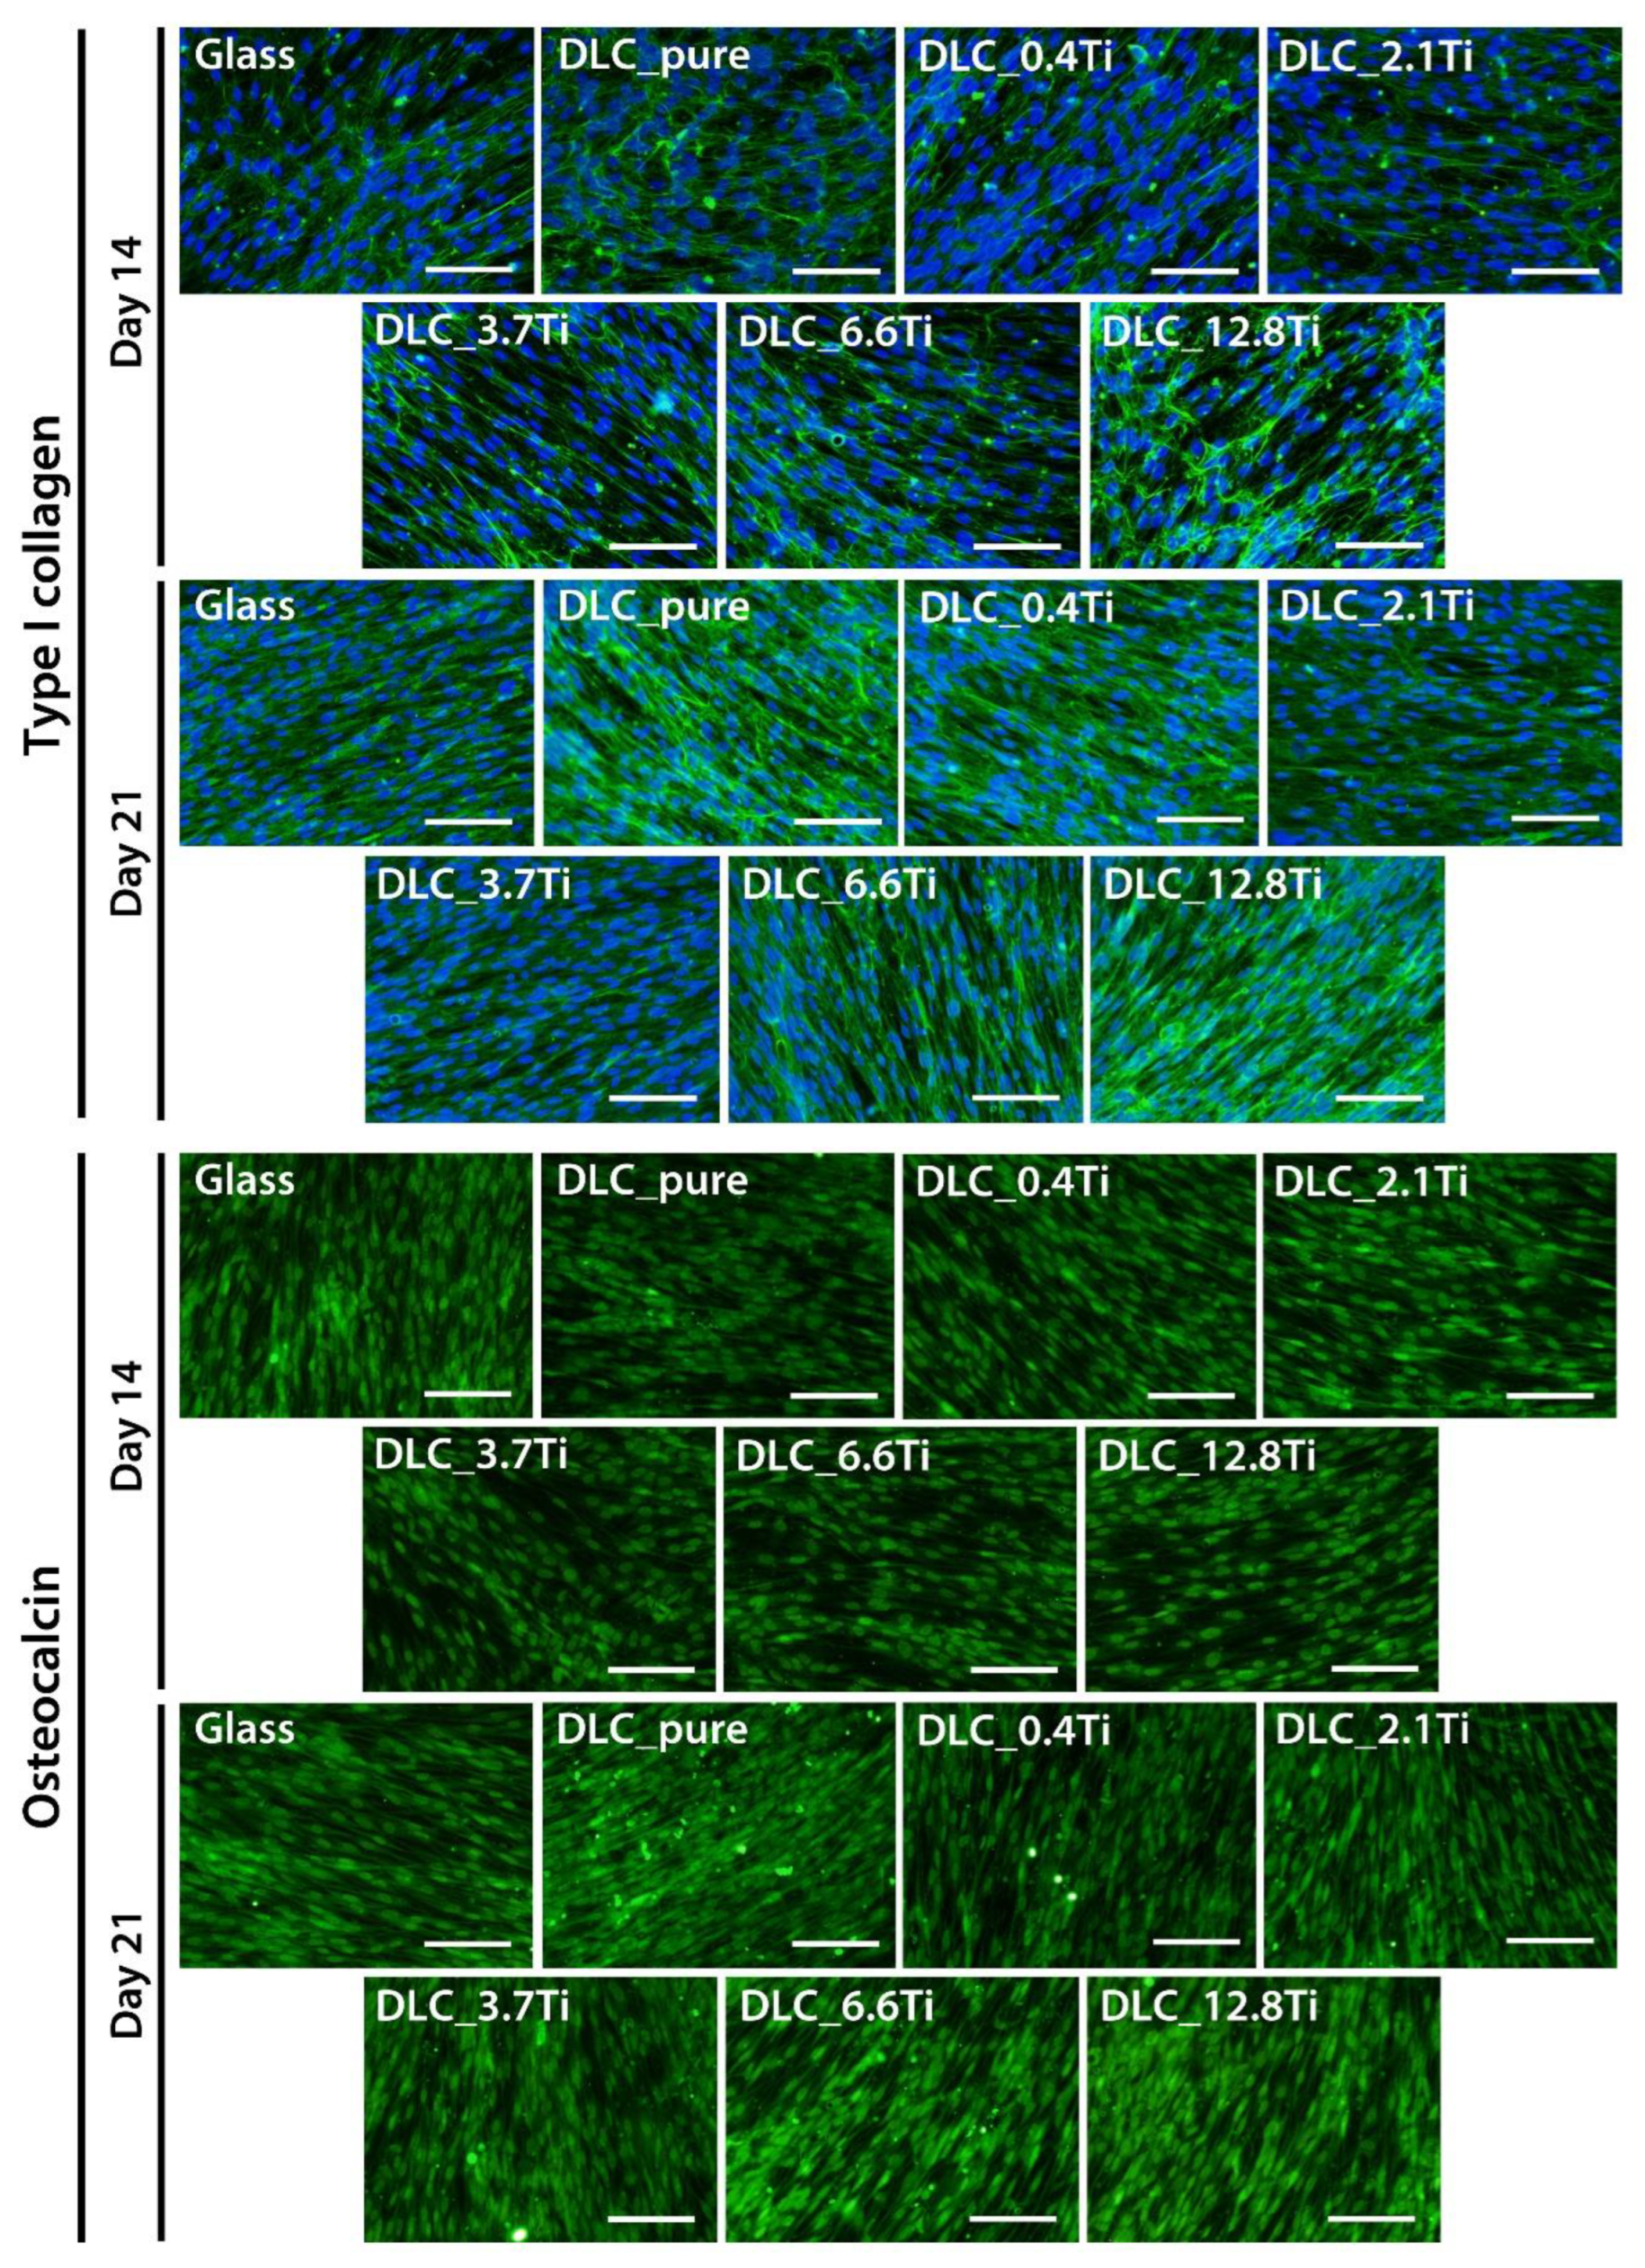
Figure 9.
The immunofluorescence staining of type I collagen (green colour on day 14 and red colour on day 21) and of osteocalcin (green colour) in bmMSCs on glass, on pure DLC, and on DLC doped with Ti (0.4, 2.1, 3.7, 6.6, 12.8 at.% of Ti) on days 14 and 21. Cell nuclei are counterstained with Hoechst 33258 (blue). Representative images were selected. Olympus IX71 microscope, IX71 digital camera, objective magnification ×20, scale bar 100 µm.
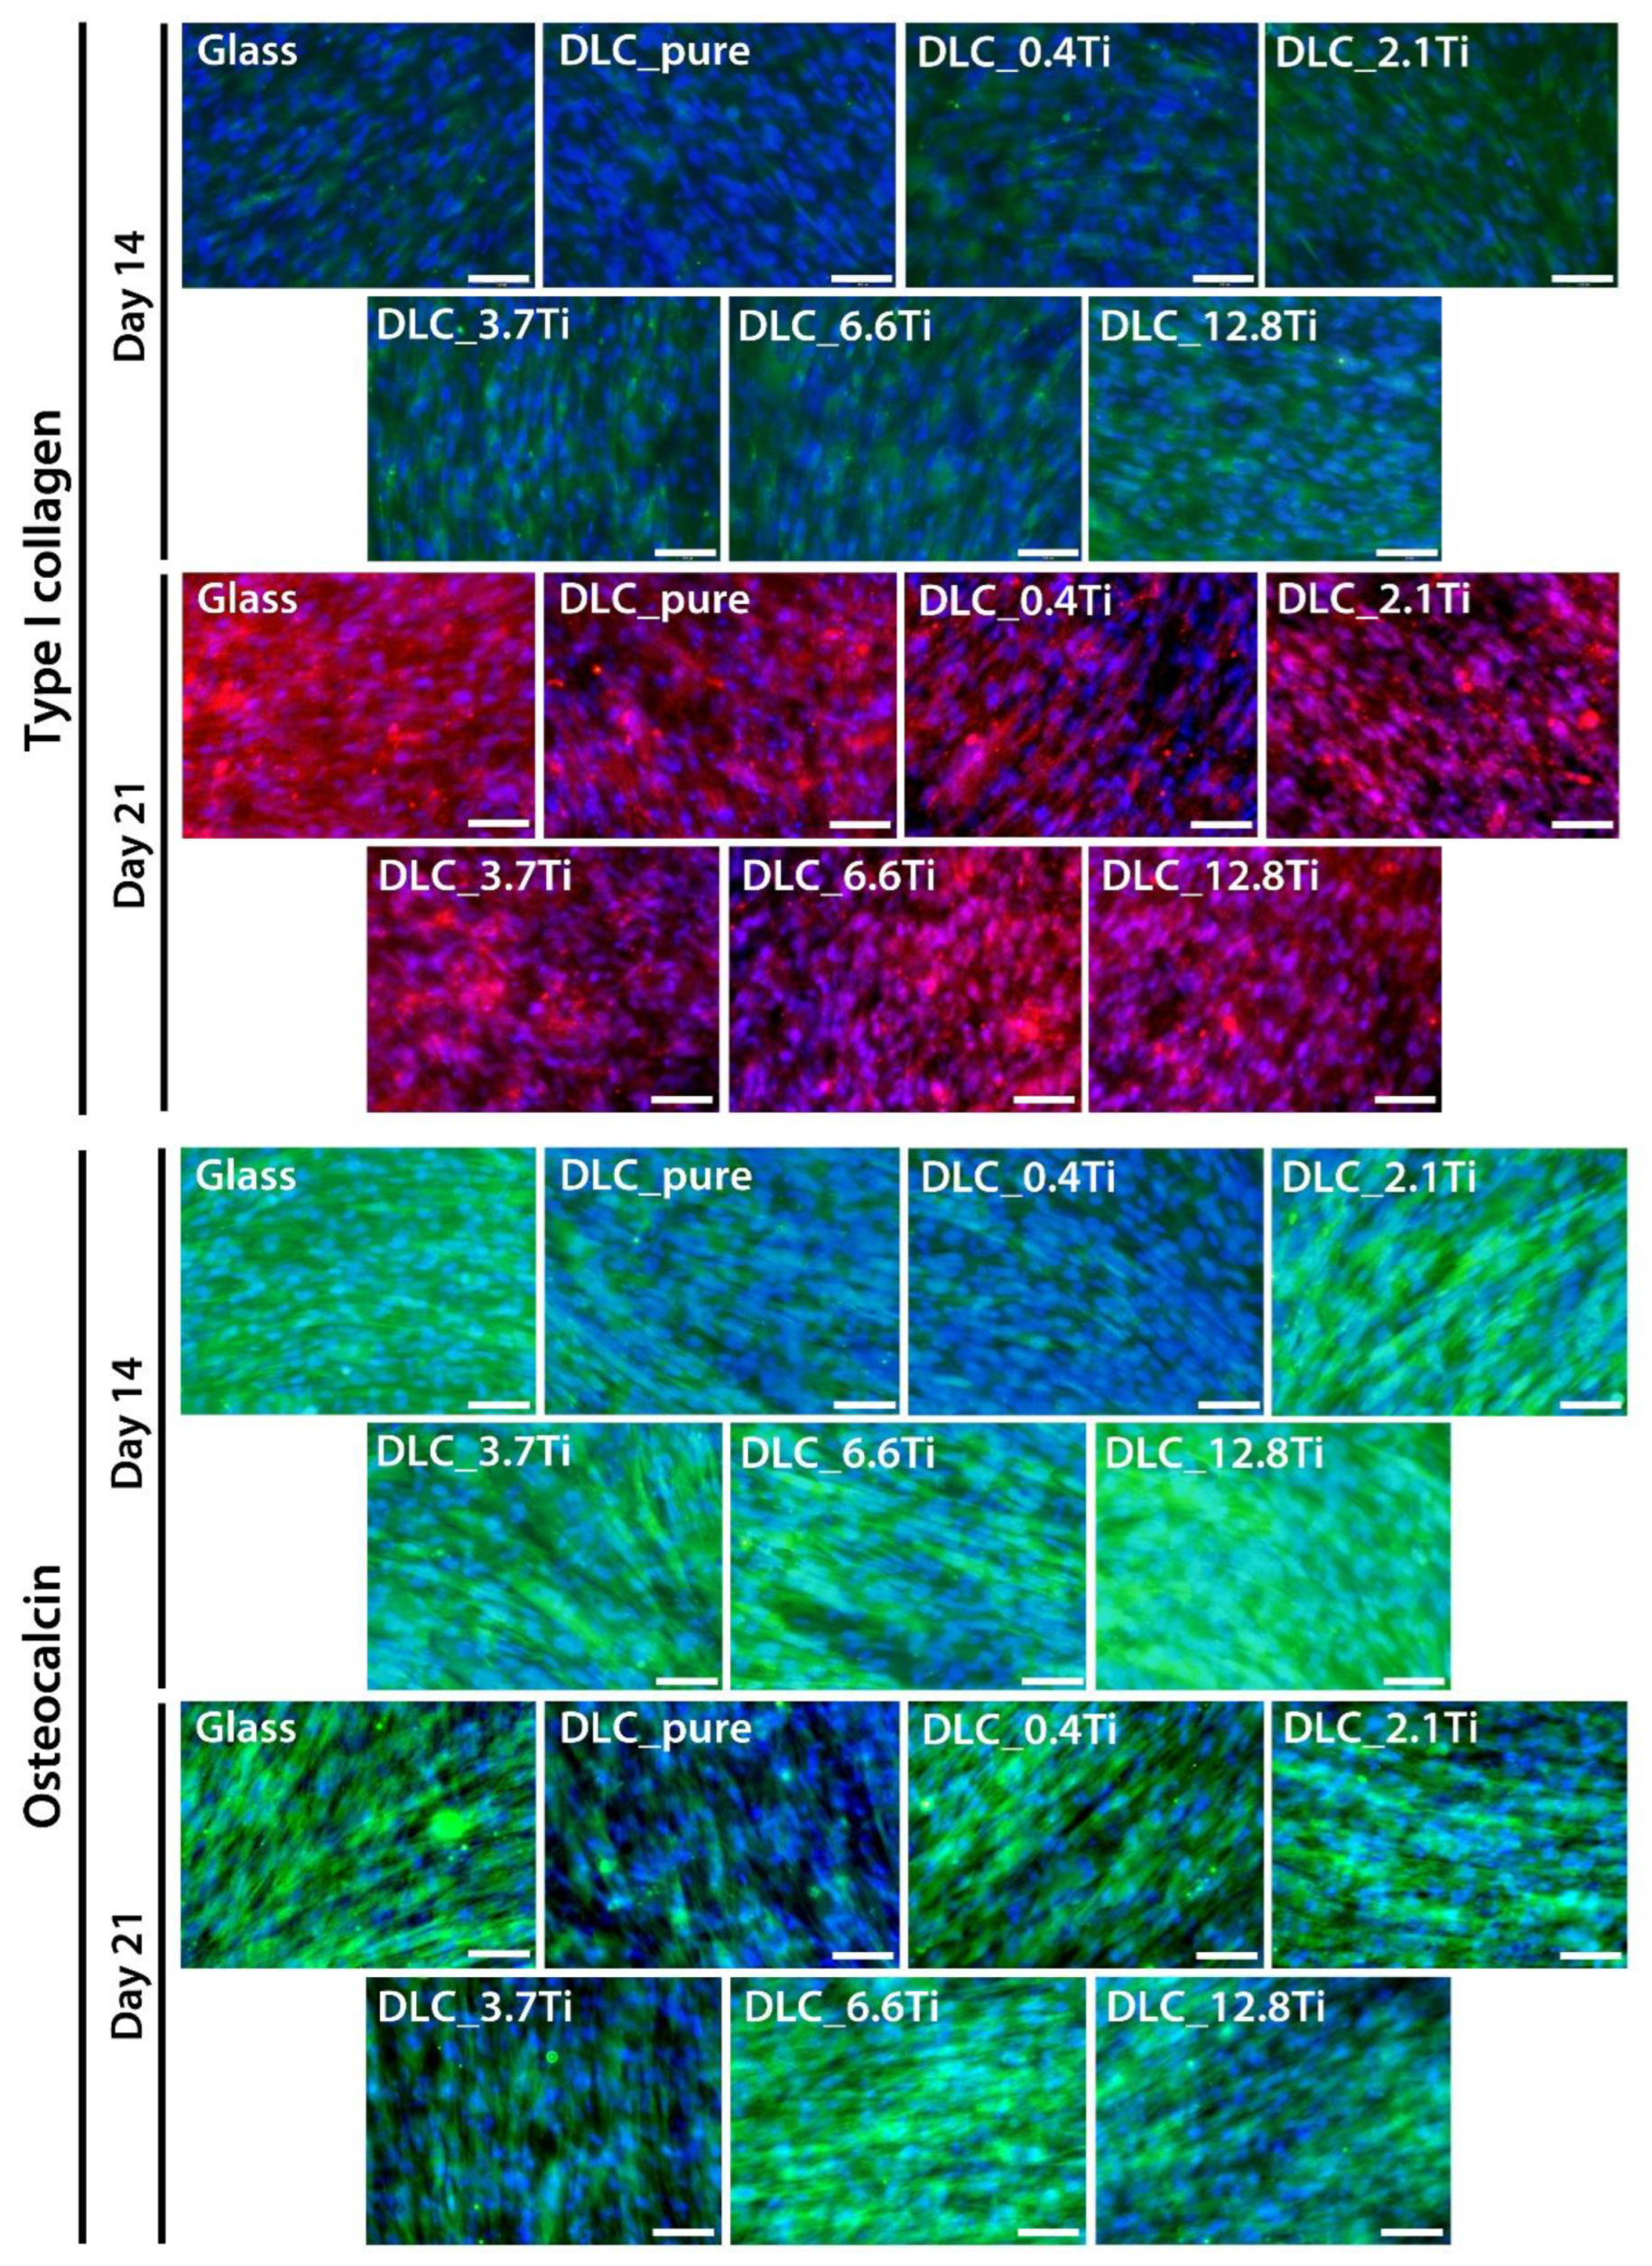
Figure 10.
The fluorescence intensity of type I collagen and osteocalcin in ADSCs and bmMSCs on glass, on pure DLC, and on DLC doped with Ti (0.4, 2.1, 3.7, 6.6, 12.8 at.% of Ti) on days 14 and 21. The fluorescence intensity is related to the cell number. The data are expressed as mean + SD. ANOVA, Holm-Sidak method. The statistical comparison among the samples was made on cells on the same day of the culture. The statistical significance (p≤0.001) is specified above the columns by the numbers of the compared experimental groups.
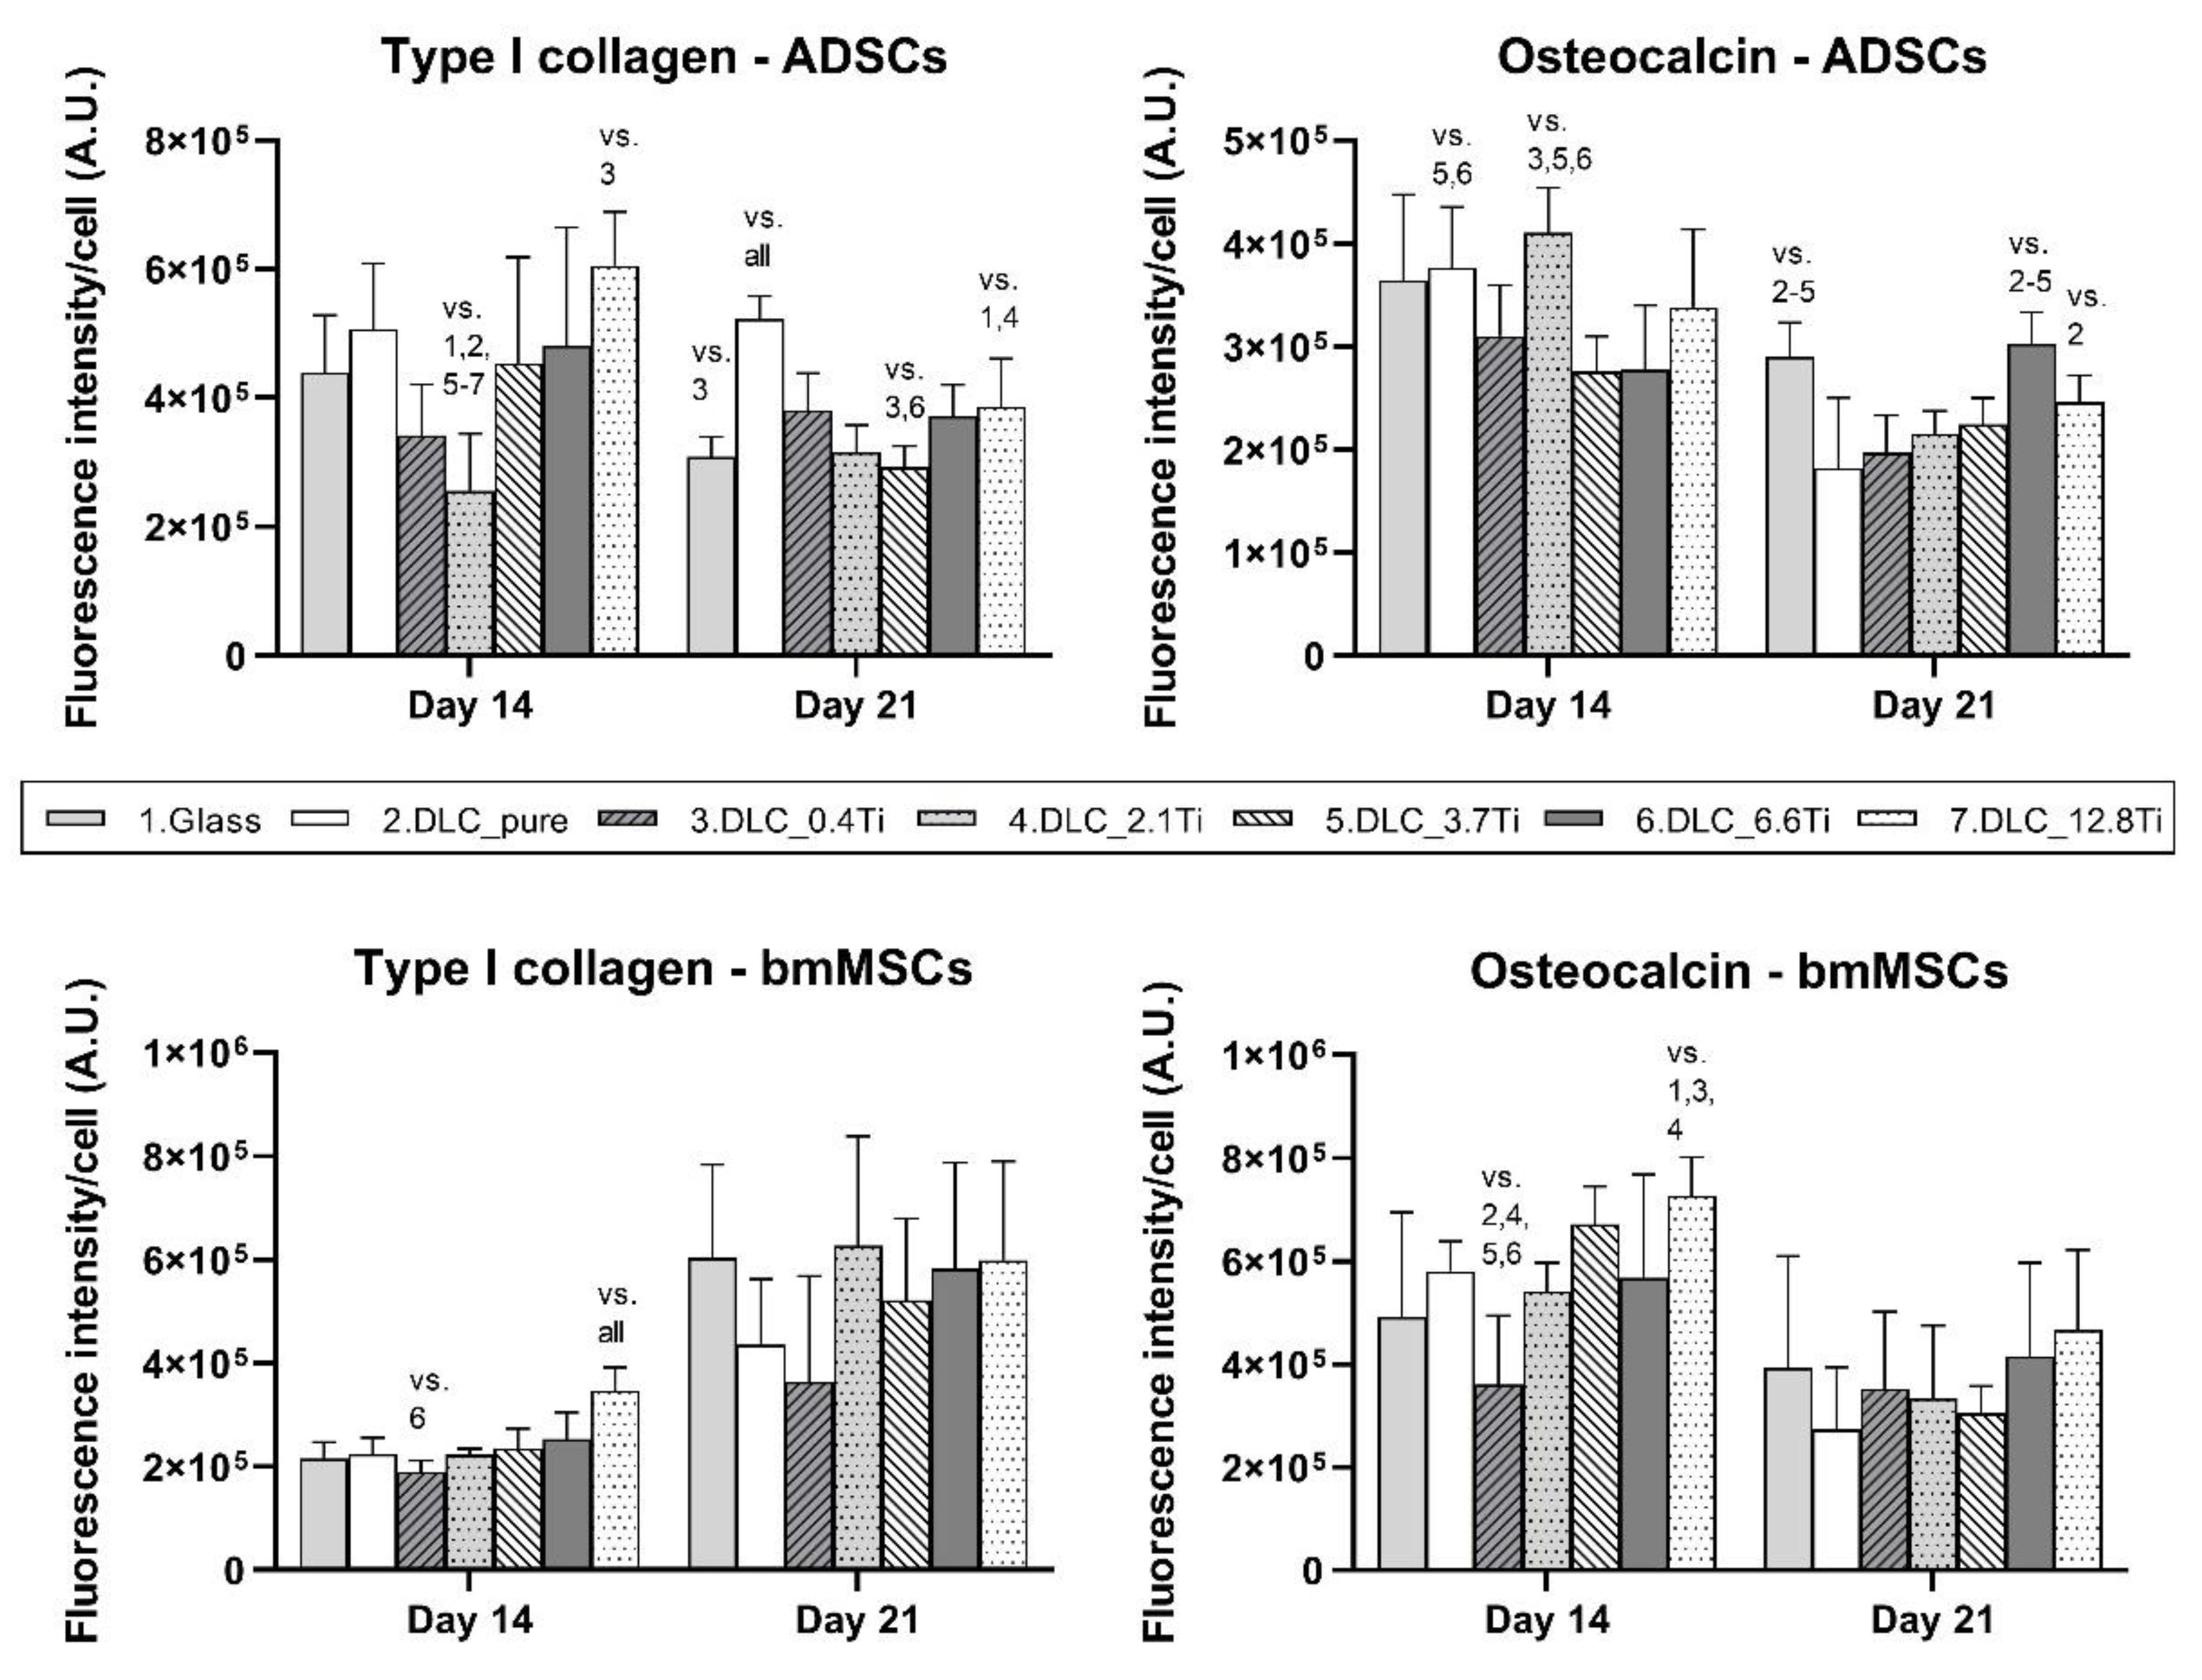
Figure 11.
The ALP activity of ADSCs and bmMSCs on glass, on pure DLC, on DLC doped with Ti (0.4, 2.1, 3.7, 6.6, 12.8 at.% of Ti), and on polystyrene (PS) on days 7, 14 and 21. The data are expressed as mean + SD. ANOVA, Student-Newman-Keuls method. The statistical comparison among the samples was made on cells on the same day of the culture. The statistical significance (p≤0.001) is specified above the columns (* means a lower value than on 0.4, 2.1 and 3.7 at.%; # means a lower value than on pure DLC, 2.1 and 12.8 at.%; ¶ means a higher value than on glass and PS; £ means a higher value than on PS; § means a higher value than on 0.4, 3.7 and 12.8 at.%; “all” means a statistically different value from all other samples on the specific day of the culture).
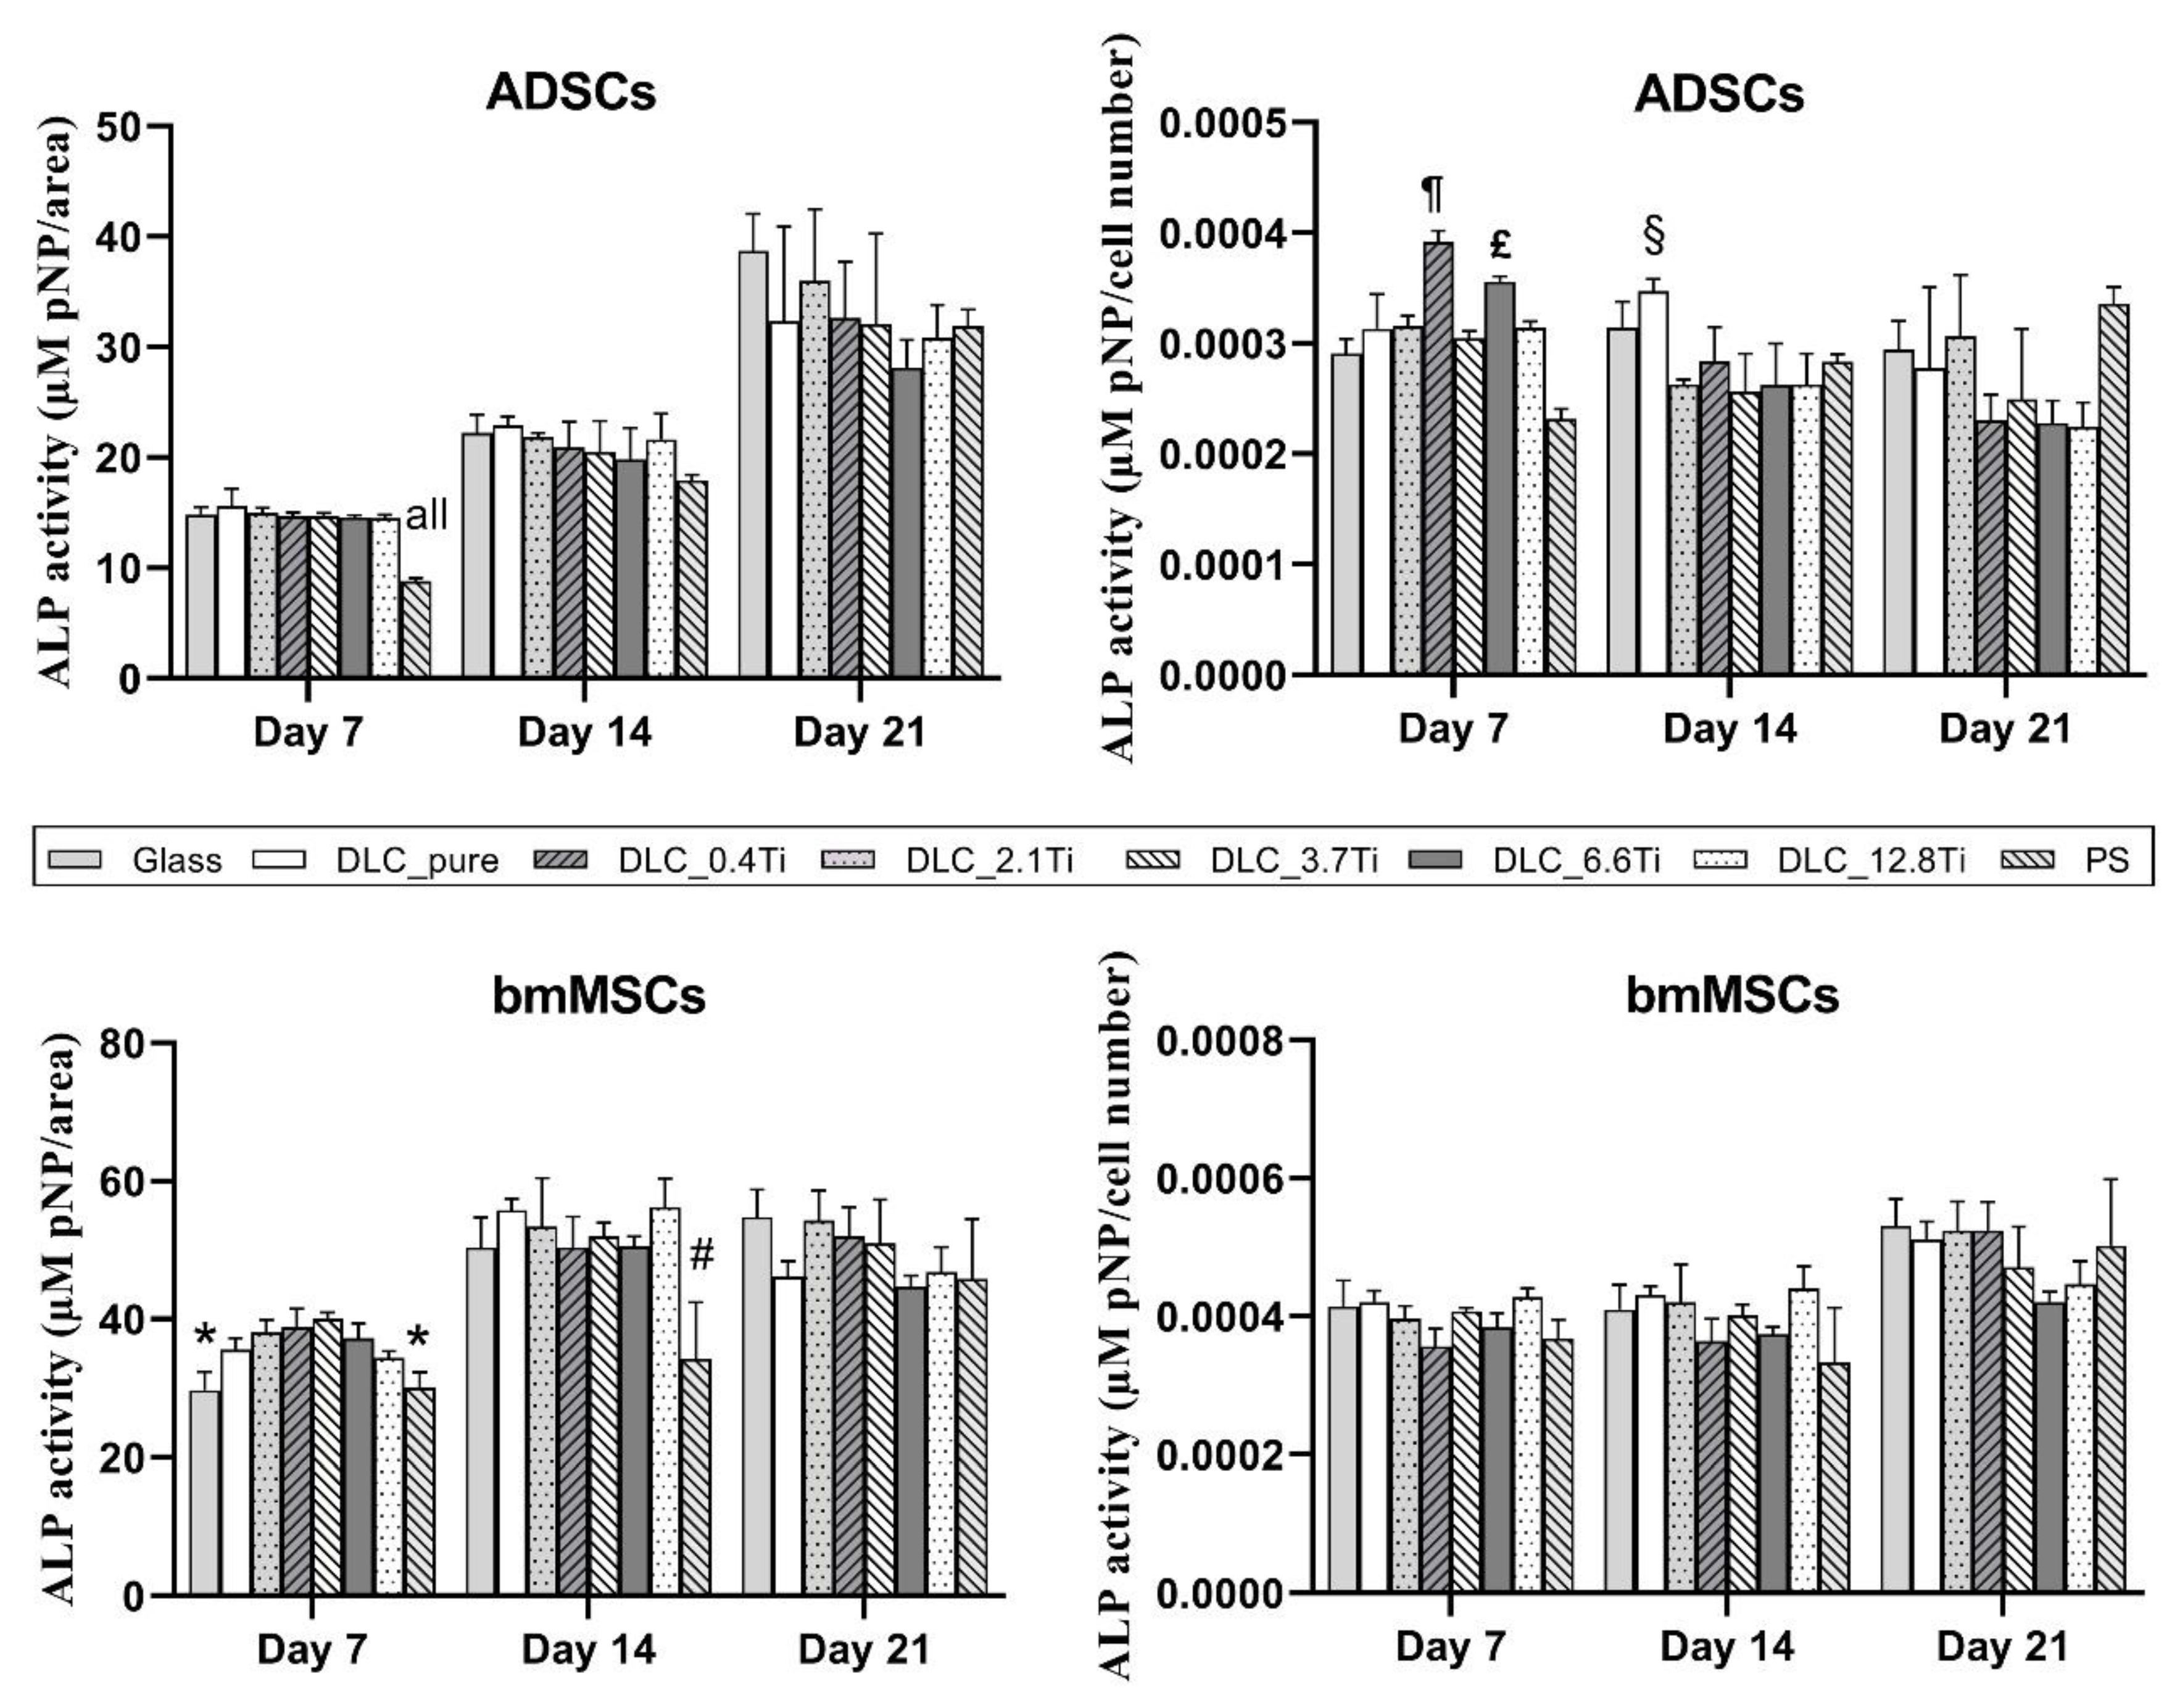
Figure 12.
The calcium deposition of ADSCs and bmMSCs on glass, on pure DLC, on DLC doped with Ti (0.4, 2.1, 3.7, 6.6, 12.8 at. % of Ti), and on polystyrene (PS) on days 14 and 21. The data are expressed as mean + SD. ANOVA, Student-Newman-Keuls method. The statistical comparison among the samples was made on cells on the same day of the culture. The statistical significance (p≤0.05) is specified above the columns (¶ means a higher value than on glass and 0.4 at. %; § means a higher value than on glass; * means a higher value than on glass, pure DLC, and 0.4 at. %; # means a higher value than on glass, pure DLC, and 0.4-3.7 at. %; £ means a higher value than on glass and pure DLC; “all” means a statistically different value from all other samples on the specific day of the culture).
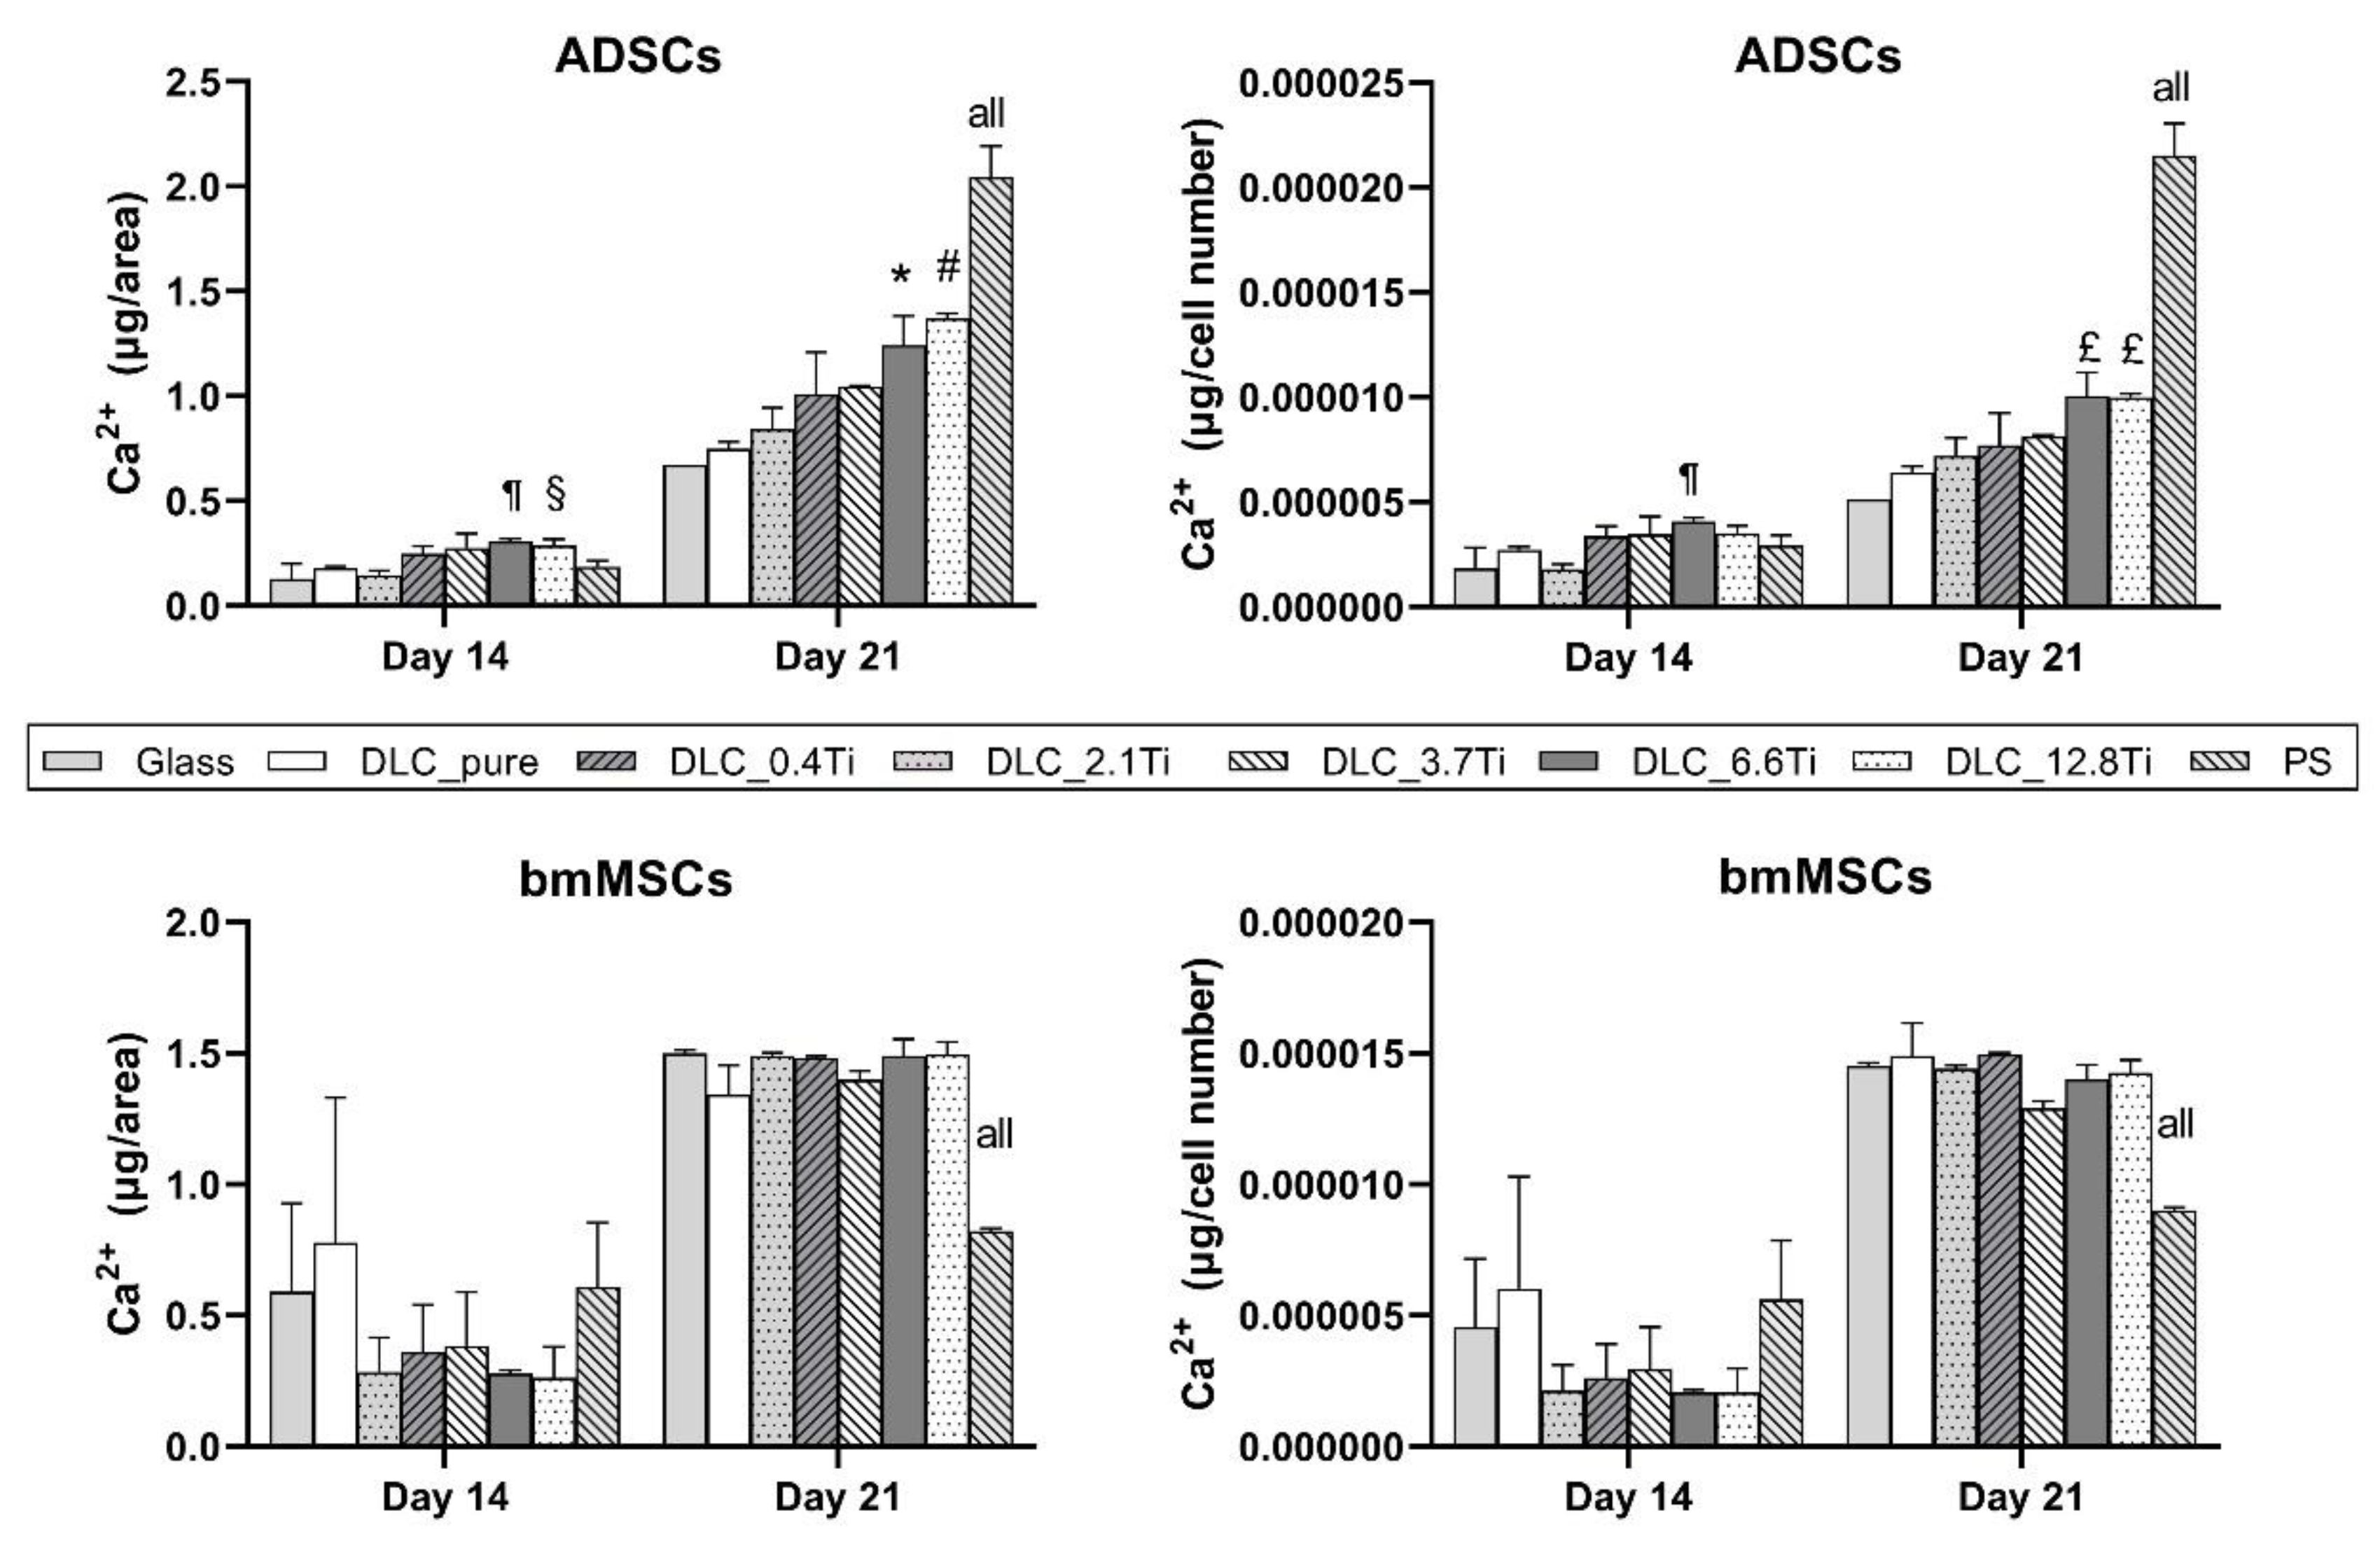
Figure 13.
a) Scheme of dual PLD using two lasers and two targets, b) photo of the deposition chamber, c) photo of the deposition process.
Figure 13.
a) Scheme of dual PLD using two lasers and two targets, b) photo of the deposition chamber, c) photo of the deposition process.
Scheme 1.
Scheme of the experimental work.
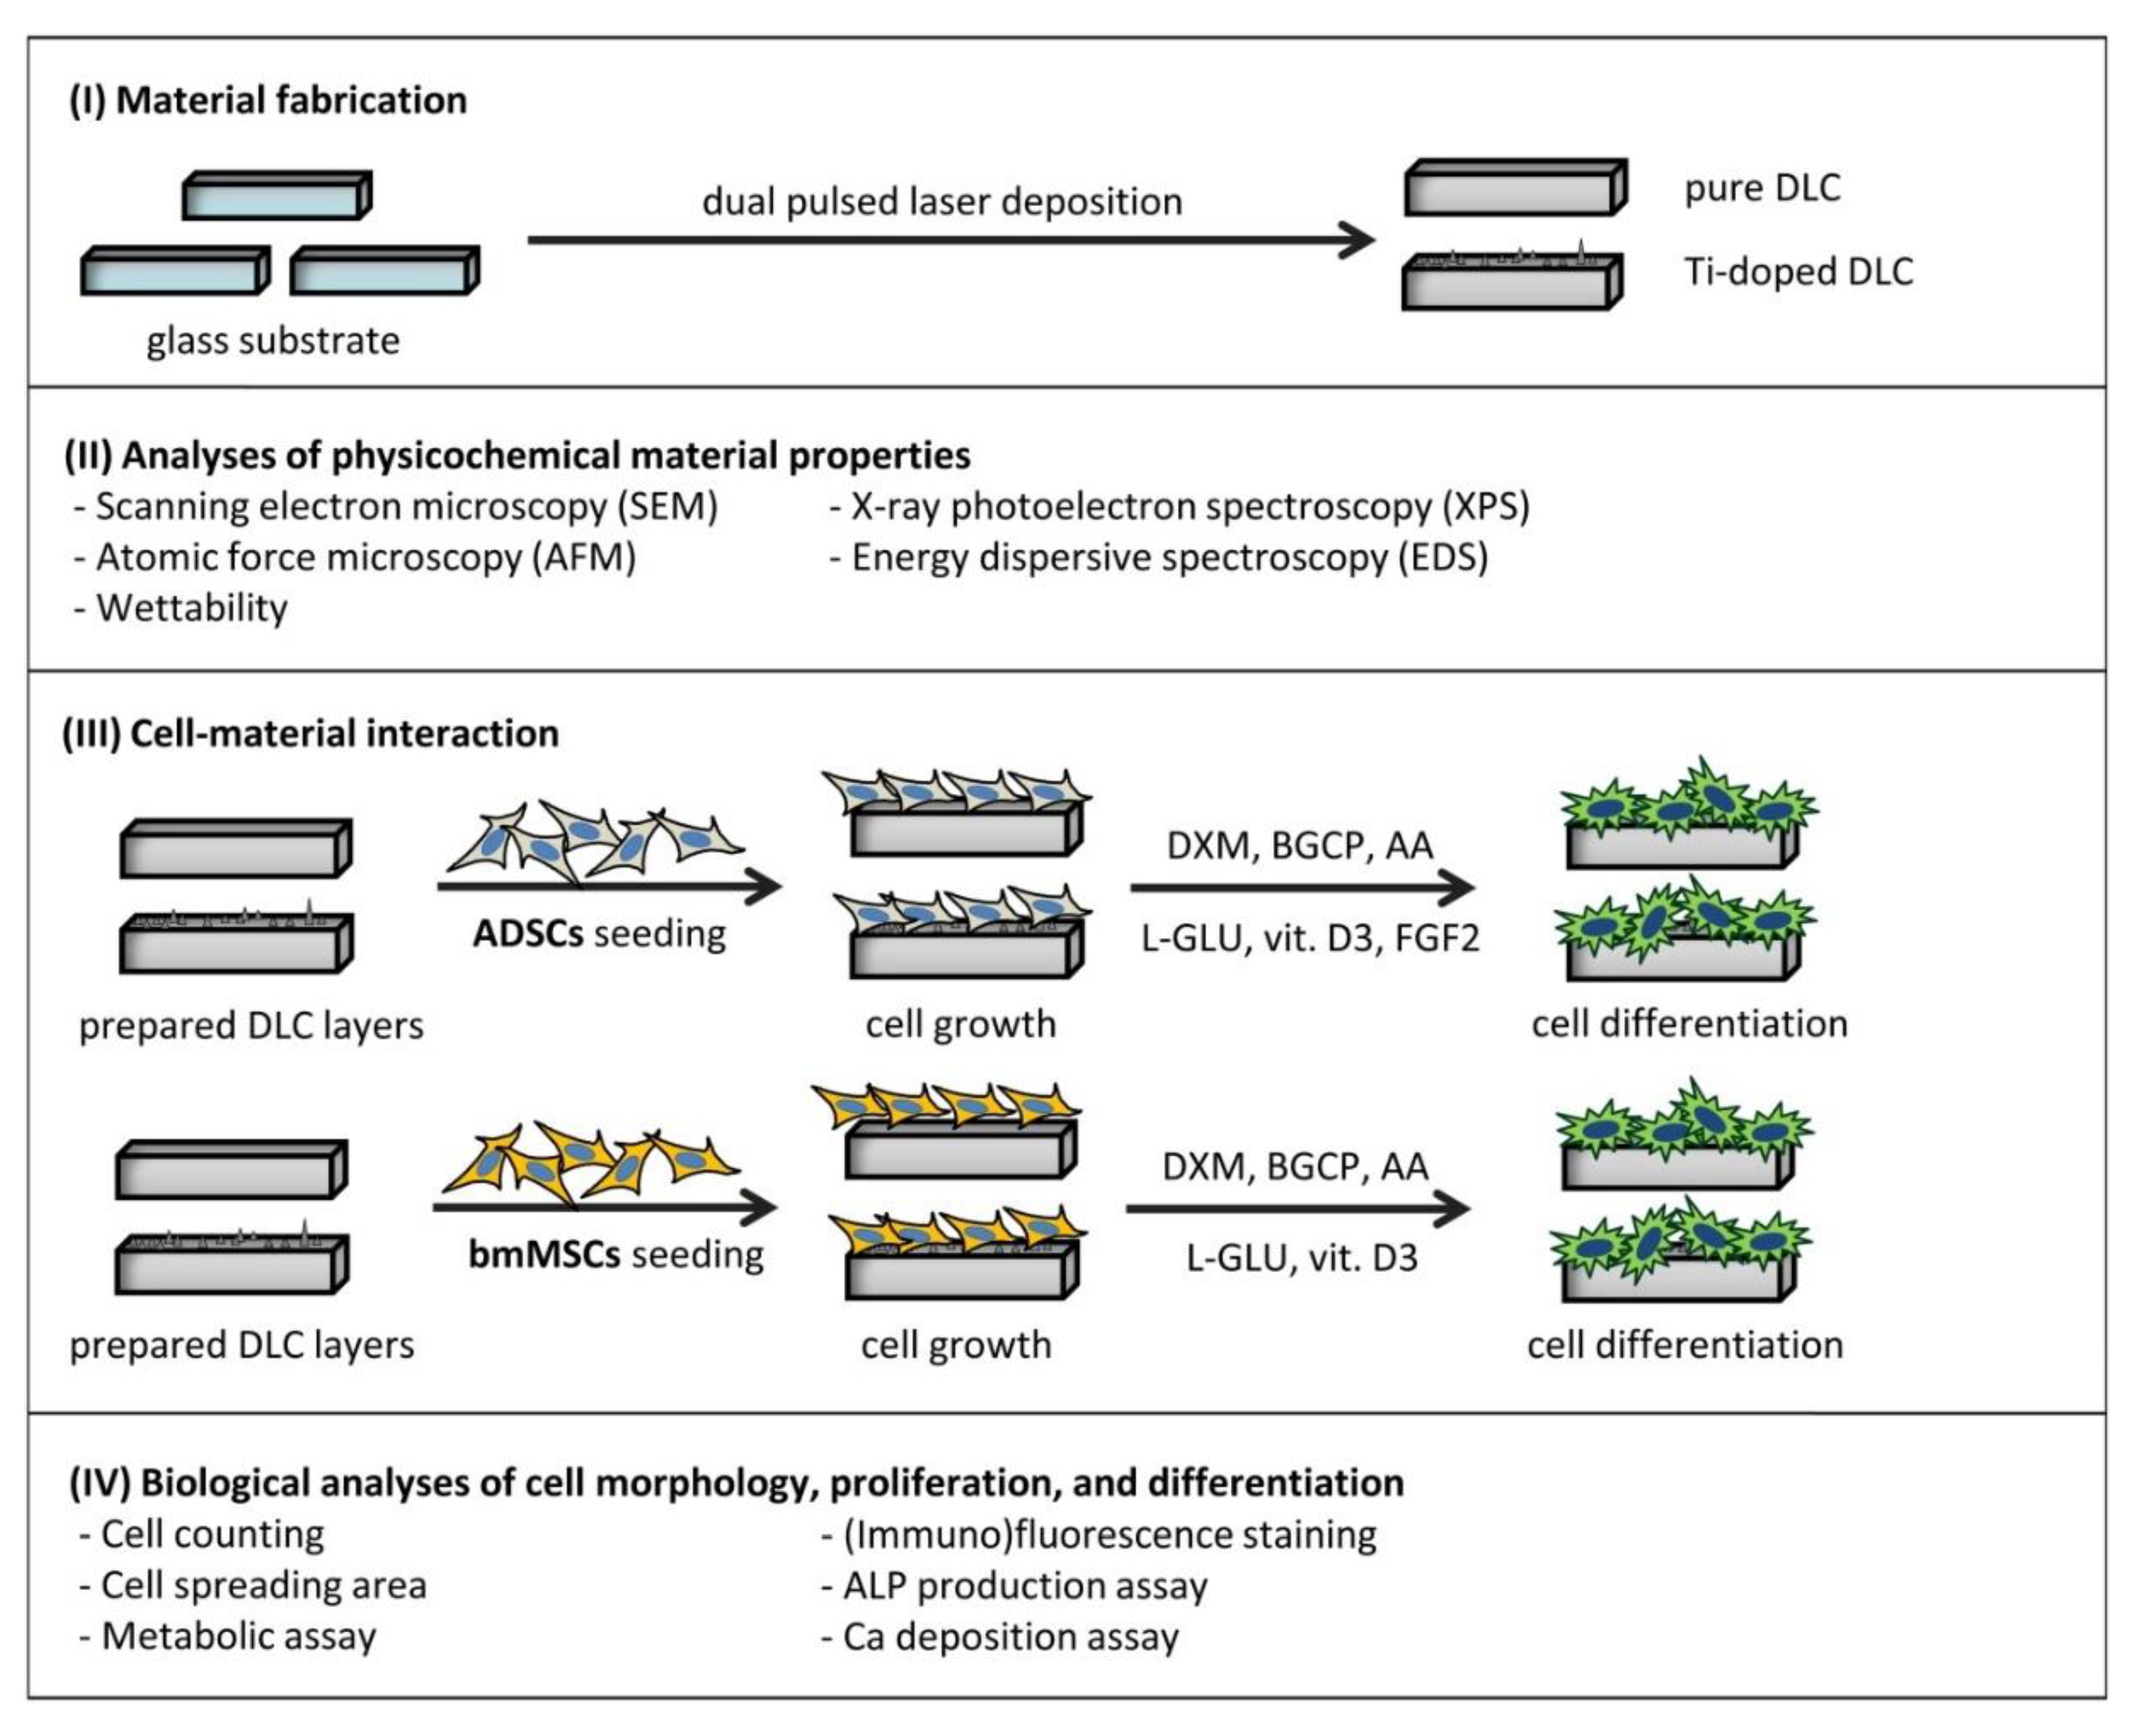

Table 1.
Contact angle and surface energy values.
| Sample | Contact angle (°) | Surface energy (mN/m) | |
|---|---|---|---|
| Water | glycerol | Total | |
| Glass | 45.6 ± 2.5 * | 37.7 ± 1.2 * | 53.0 ± 7.22 * |
| DLC_pure | 76.8 ± 1.4 | 48.3 ± 5.0 | 59.0 ± 13.53 |
| DLC_0.4Ti | 27.7 ± 3.1 * | 55.1 ± 1.0 * | 90.3 ± 5.98 * |
| DLC_2.1Ti | 78.0 ± 0.9 | 77.3 ± 1.9 * | 26.6 ± 4.68 * |
| DLC_3.7Ti | 78.4 ± 1.7 | 77.9 ± 3.0 * | 26.4 ± 7.73 * |
| DLC_6.6Ti | 80.5 ± 3.4 | 68.7 ± 1.2 * | 30.1 ± 9.54 * |
| DLC_12.8Ti | 86.3 ± 1.5 * | 89.0 ± 3.8 * | 21.7 ± 7.68 * |
*vs. DLC_pure, p value < 0.05.
Table 2.
Deposition parameters and the original measured titanium content of the DLC layers [13,15].
| Sample | Laser rate [Hz] | Titanium content [at.%]a | ||
|---|---|---|---|---|
| L1 | L2 | Rc | Sp | |
| DLC_pure | 26 | - | 0.0 | 0.0 |
| DLC_0.4Ti | 26 | 1 | 0.4 | 0.7 |
| DLC_2.1Ti | 25 | 3 | 2.1 | 3.3 |
| DLC_3.7Ti | 25 | 5 | 3.7 | 5.2 |
| DLC_6.6Ti | 26 | 11 | 6.6 | 10.1 |
| DLC_12.8Ti | 18 | 23 | 12.8 | 24.5 |
Table 3.
Fluorescent dyes and antibodies used in the study.
| Type, Name | Supplier | Cat. No. | Concentration |
|---|---|---|---|
| Texas Red C2-maleimide | Invitrogen | T6008 | 10 ng/mL |
| Phalloidin-TRITC | Sigma-Aldrich | P1951 | 5 μg/mL |
| Hoechst 33258 | Sigma-Aldrich | B1155 | 10 μg/mL |
| Anti-vinculin (mouse) Anti-type I collagen (rabbit) Anti-type I collagen (mouse) |
Sigma-Aldrich CosmoBio Sigma-Aldrich |
V9131 LSL-LB-1197 C2456 |
1:200 1:200 1:200 |
| Anti-osteocalcin (rabbit) | Peninsula Laboratories | T-4743 | 1:200 |
| Anti-rabbit IgG-Alexa Fluor 488 | Thermo Fisher Scientific | A11070 | 1:400 |
| Anti-rabbit IgG-Alexa Fluor 546 Anti-mouse IgG-Alexa Fluor 488 Anti-mouse IgG-Alexa Fluor 546 |
Thermo Fisher Scientific Thermo Fisher Scientific Thermo Fisher Scientific |
A11010 A11017 A11003 |
1:400 1:400 1:400 |
Disclaimer/Publisher’s Note: The statements, opinions and data contained in all publications are solely those of the individual author(s) and contributor(s) and not of MDPI and/or the editor(s). MDPI and/or the editor(s) disclaim responsibility for any injury to people or property resulting from any ideas, methods, instructions or products referred to in the content. |
© 2024 by the authors. Licensee MDPI, Basel, Switzerland. This article is an open access article distributed under the terms and conditions of the Creative Commons Attribution (CC BY) license (http://creativecommons.org/licenses/by/4.0/).
Copyright: This open access article is published under a Creative Commons CC BY 4.0 license, which permit the free download, distribution, and reuse, provided that the author and preprint are cited in any reuse.


