Preprint
Article

Anaerobic Co-digestion of Pre-hydrodynamically Cavitated Aerobic Granular Sludge with Waste Fats – the Importance of Substrate Ratio and Fermentation Temperature

Submitted:

27 January 2024

Posted:

29 January 2024

You are already at the latest version

A peer-reviewed article of this preprint also exists.

Abstract
The characteristics of excess aerobic granular sludge, related to its structure and chemical composition, limit the efficiency of anaerobic digestion. For this reason, pre-treatment methods and compositions with other organic substrates are used. The aim of the research was to determine the effects of co-digestion of pre-hydrodynamically cavitated aerobic granular sludge with waste fats on the efficiency of methane fermentation under mesophilic and thermophilic conditions. The addition of waste fats improved the C/N ratio and increased its value to 19. The greatest effects were observed in thermophilic anaerobic digestion at 55°C, where a 15% waste fat content in volatile soilds was ensured. This resulted in the production of 1278.2±40.2 mL/gVS biogas and 889.4±29.7 mL/gVS CH4. The CH4 content of the biogas was 69.6±1.3%. The increase in biogas and CH4 yield compared to pure AGS anaerobic digestion was 34.4% and 40.1%, respectively. An increase in the proportion of waste fats in the substrate had no significant effect on the efficiency of methane fermentation.
Keywords: 
Subject: 
Engineering  -   Energy and Fuel Technology

1. Introduction

Anaerobic digestion (AD) is a recognised, technologically efficient, economically viable and therefore widely used method for the management of sewage sludge (SS). Its use leads to stabilisation of the SS by reducing the content of organic compounds and susceptibility to putrefaction [1]. AD improves the sanitary properties, limits the spread of odours and microbiological aerosols, which determines the possibility of using SS in nature or agriculture [2,3]. So far, AD has been used for the anaerobic degradation of mixed sewage sludge (MSS), which consists of about 60 – 80% organic material from primary sewage sludge (PSS) and 20 – 40% biomass from excess sewage sludge (ESS) [4,5]. PSS consists mainly of easily settleable suspensions that enter the sedimentation tanks with the wastewater and are released there. PSS is a substrate that is very susceptible to biodegradation under anaerobic conditions and is characterised by a high potential for biogas and methane production [6].
ESS, on the other hand, is the growing bacterial biomass that is regularly removed from reactors to maintain the appropriate concentration of microorganisms in wastewater treatment plants (WWTP) [7]. In contrast to PSS, it poses major technological and operational problems in AD chambers [8]. Compared to PSS, the biogas yield of ESS is much lower, ranging from 500 to 700 m3/MgVS [9]. Therefore, it is common practise to mix ESS and PSS to achieve a biogas production of more than 1000 m3/MgVS [10]. ESS consists mainly of carbohydrates, proteins, humic substances and nucleic acids, which are enclosed in bacterial cells. The complex flocculent structure in combination with extracellular polymeric substances (EPS), degradation-resistant cell walls and other high molecular weight organic compounds in ESS makes it difficult to hydrolyse [11]. This requires a longer hydraulic retention time (HRT) and a larger digester volume. In addition, the C/N ratio of ESS is usually far below the optimal range for AD, which is between C/N 15–30 [12].
A specific type of ESS is aerobic granular sludge (AGS), whose popularity in wastewater treatment technology has increased dynamically in recent years [13]. In many cases, the use of AGS leads to lower investment and operating costs for wastewater treatment [14]. A major obstacle to the competitiveness of AGS is the limited knowledge about the processing of the resulting excess sludge in AD [15]. Due to the characteristics and features of AGS that differ from typical ESS, the processes currently in use need to be assessed for their suitability and effectiveness. This may mean that the fundamentals and technological parameters of the AD process need to be verified and adapted to a substrate with a different chemical composition, structure and properties. Another problem related to the possibility of using AD for the biodegradation of AGS arises when this technology is used to treat industrial wastewater. In this case, the characteristics of the pollutants very often preclude the possibility of separating PSS from the wastewater stream to support AD [16]. The only option available to the operator of the technological system is then the excessive use of AGS, which, due to its properties, chemical composition and compact granular cell structure, poses significant technological problems in AD [17].
In such a case, it is necessary to take technological measures and introduce procedures that support the optimisation of AD. These primarily include AGS pretreatment techniques and anaerobic co-digestion (AC-D) through the use of organic substrates that complement the substrate composition [18]. Pretreatment processes lead to the destruction of complex cellular structures and the release of organic matter into the dissolved phase, making it available to the fermentation bacteria [19]. These include various processes based on mechanical disruption, hydrothermal depolymerisation under elevated temperature and pressure conditions, chemical, physical and enzymatic hydrolysis processes [20]. However, the AC-D of AGS with other externally supplied organic substrates is an increasingly common and widespread trend observed in municipal facilities and industrial wastewater treatment plants [21]. This is related to the concept of a utilisation biorefinery, the concept of which fits directly into the currently promoted assumptions of the bioeconomy and circular economy [22]. This type of treatment is fully justified from a technological and economic point of view and in many cases contributes to achieving energy self-sufficiency of WWTP and even a positive energy balance [23].
The experiments presented are directly in line with current trends in the development of biorefinery systems and make a significant new contribution to the current state of knowledge on AGS fermentation processes. The work describes the next step in multi-stage AD optimisation research, following the previous selection of the hydrodynamic cavitation process parameters [24]. This is the first report in which the performance of AC-D subjected to AGS pretreatment was analysed with a high lipid concentration of waste fats (WF) from the poultry sector. The main objective of the study was to determine the effects of co-digestion of pre-hydrodynamically cavitated AGS with WF on the performance of methane fermentation. The influence of different mass ratios of the tested organic substrates and the temperature of the AD process on the production efficiency and the composition of the biogas as well as the kinetics of the anaerobic conversions was investigated. The experimental data obtained made it possible to determine the relationship between the characteristics of the substrate and the observed effects of the methane fermentation process.

2. Materials and Methods

2.1. Organisation of the experiment

The experimental work was carried out under laboratory conditions in batch fermentation reactors. The study was divided into two stages (S). The criterion for the separation of the stages was the temperature of AD. In stage 1 (S1) the process was carried out under mesophilic conditions (38±1°C), in stage 2 (S2) under thermophilic conditions (55±1°C). Four variants (V) were distinguished in each stage. Depending on V, a different proportion of volatile solids from the WF was used in the substrate mixture. In variant 1 (V1), no WF was added to the AGS pre-treated in the HC process (control sample). In variant 2 (V2), the proportion of volatile solids from WF was 8%, in variant 3 (V3) 15% and in variant 4 (V4) 25%. The organigram of the experiment is shown in Figure 1.

2.2. Materials

2.2.1. Aerobic granular sludge (AGS)

The AGS used in the experiment originates from a sequential biological reactor (SBR) that treats synthetic wastewater. Prior to the AD process, the AGS separated in the secondary settling tank and concentrated to 4.9±0.2% TS was subjected to hydrodynamic cavitation (HC) for 15 minutes. Detailed information on the origin of the AGS and the design data of the HC used were presented in a previous research paper by the authors [24]. In these experiments, optimisation work was carried out to determine the most effective pre-treatment time in terms of methane production and energy balance. The highest technological and economic effects were achieved in the variant in which the HC time was 15 minutes [24]. Therefore, such a disintegrated AGS was used in the AD with WF. The characteristics of the AGS used are shown in Table 1.

2.2.2. Waste fat (WF)

The used WF came from an industrial plant specialising in the slaughtering and processing of poultry meat (chickens, turkeys). The substrate came from a plant for the removal of WF from waste water, which is based on pressure flotation. In the pressure flotation system, the average size of the compressed air microbubbles used was 50 µm. The floating grease was removed at regular intervals with a scraper into a storage tank. The WF was removed from the storage tank at regular intervals using a flotation pump. The purity of the WF was ensured by a pre-cleaning process based on the use of a sand trap to remove mineral impurities and a drum-type microsieve with a sieve diameter of 1.0 mm. The microsieve is equipped with a cleaning system based on spray nozzles. The impurities separated during drum filtration (sand, stones, suspensions, protein emulsions) are channelled into the sedimentation tank. The characteristics of the WF used are listed in Table 1.

2.2.3. Anaerobic sludge inoculum (AS)

The lab-scale AD batch bioreactors were inoculated with anaerobic sludge (AS) from a closed anaerobic chamber (CAC) with an active volume of 5000 m3, which is used for large-scale stabilisation of SS. The applied organic load rate (OLR) of the CAC was 2.4 kg VS/m3·day, the hydraulic retention time (HRT) was 20 days and the process temperature 38°C. Since the thermophilic fermentation process was also used in the research work, it was first necessary to adapt the AS to these conditions. For this purpose, a CAC with an active volume of 5.0 L was operated at a temperature of 55±1°C for a period of 80 days (4 complete hydraulic replacements of the reactor). The substrate used and the basic technological parameters corresponded to those of mesophilic fermentation (38°C), OLR - 2.4 kg VS/m3·day, HRT - 20 days. The characteristics of the AS used in the study are presented in Table 1.

2.3. Research station

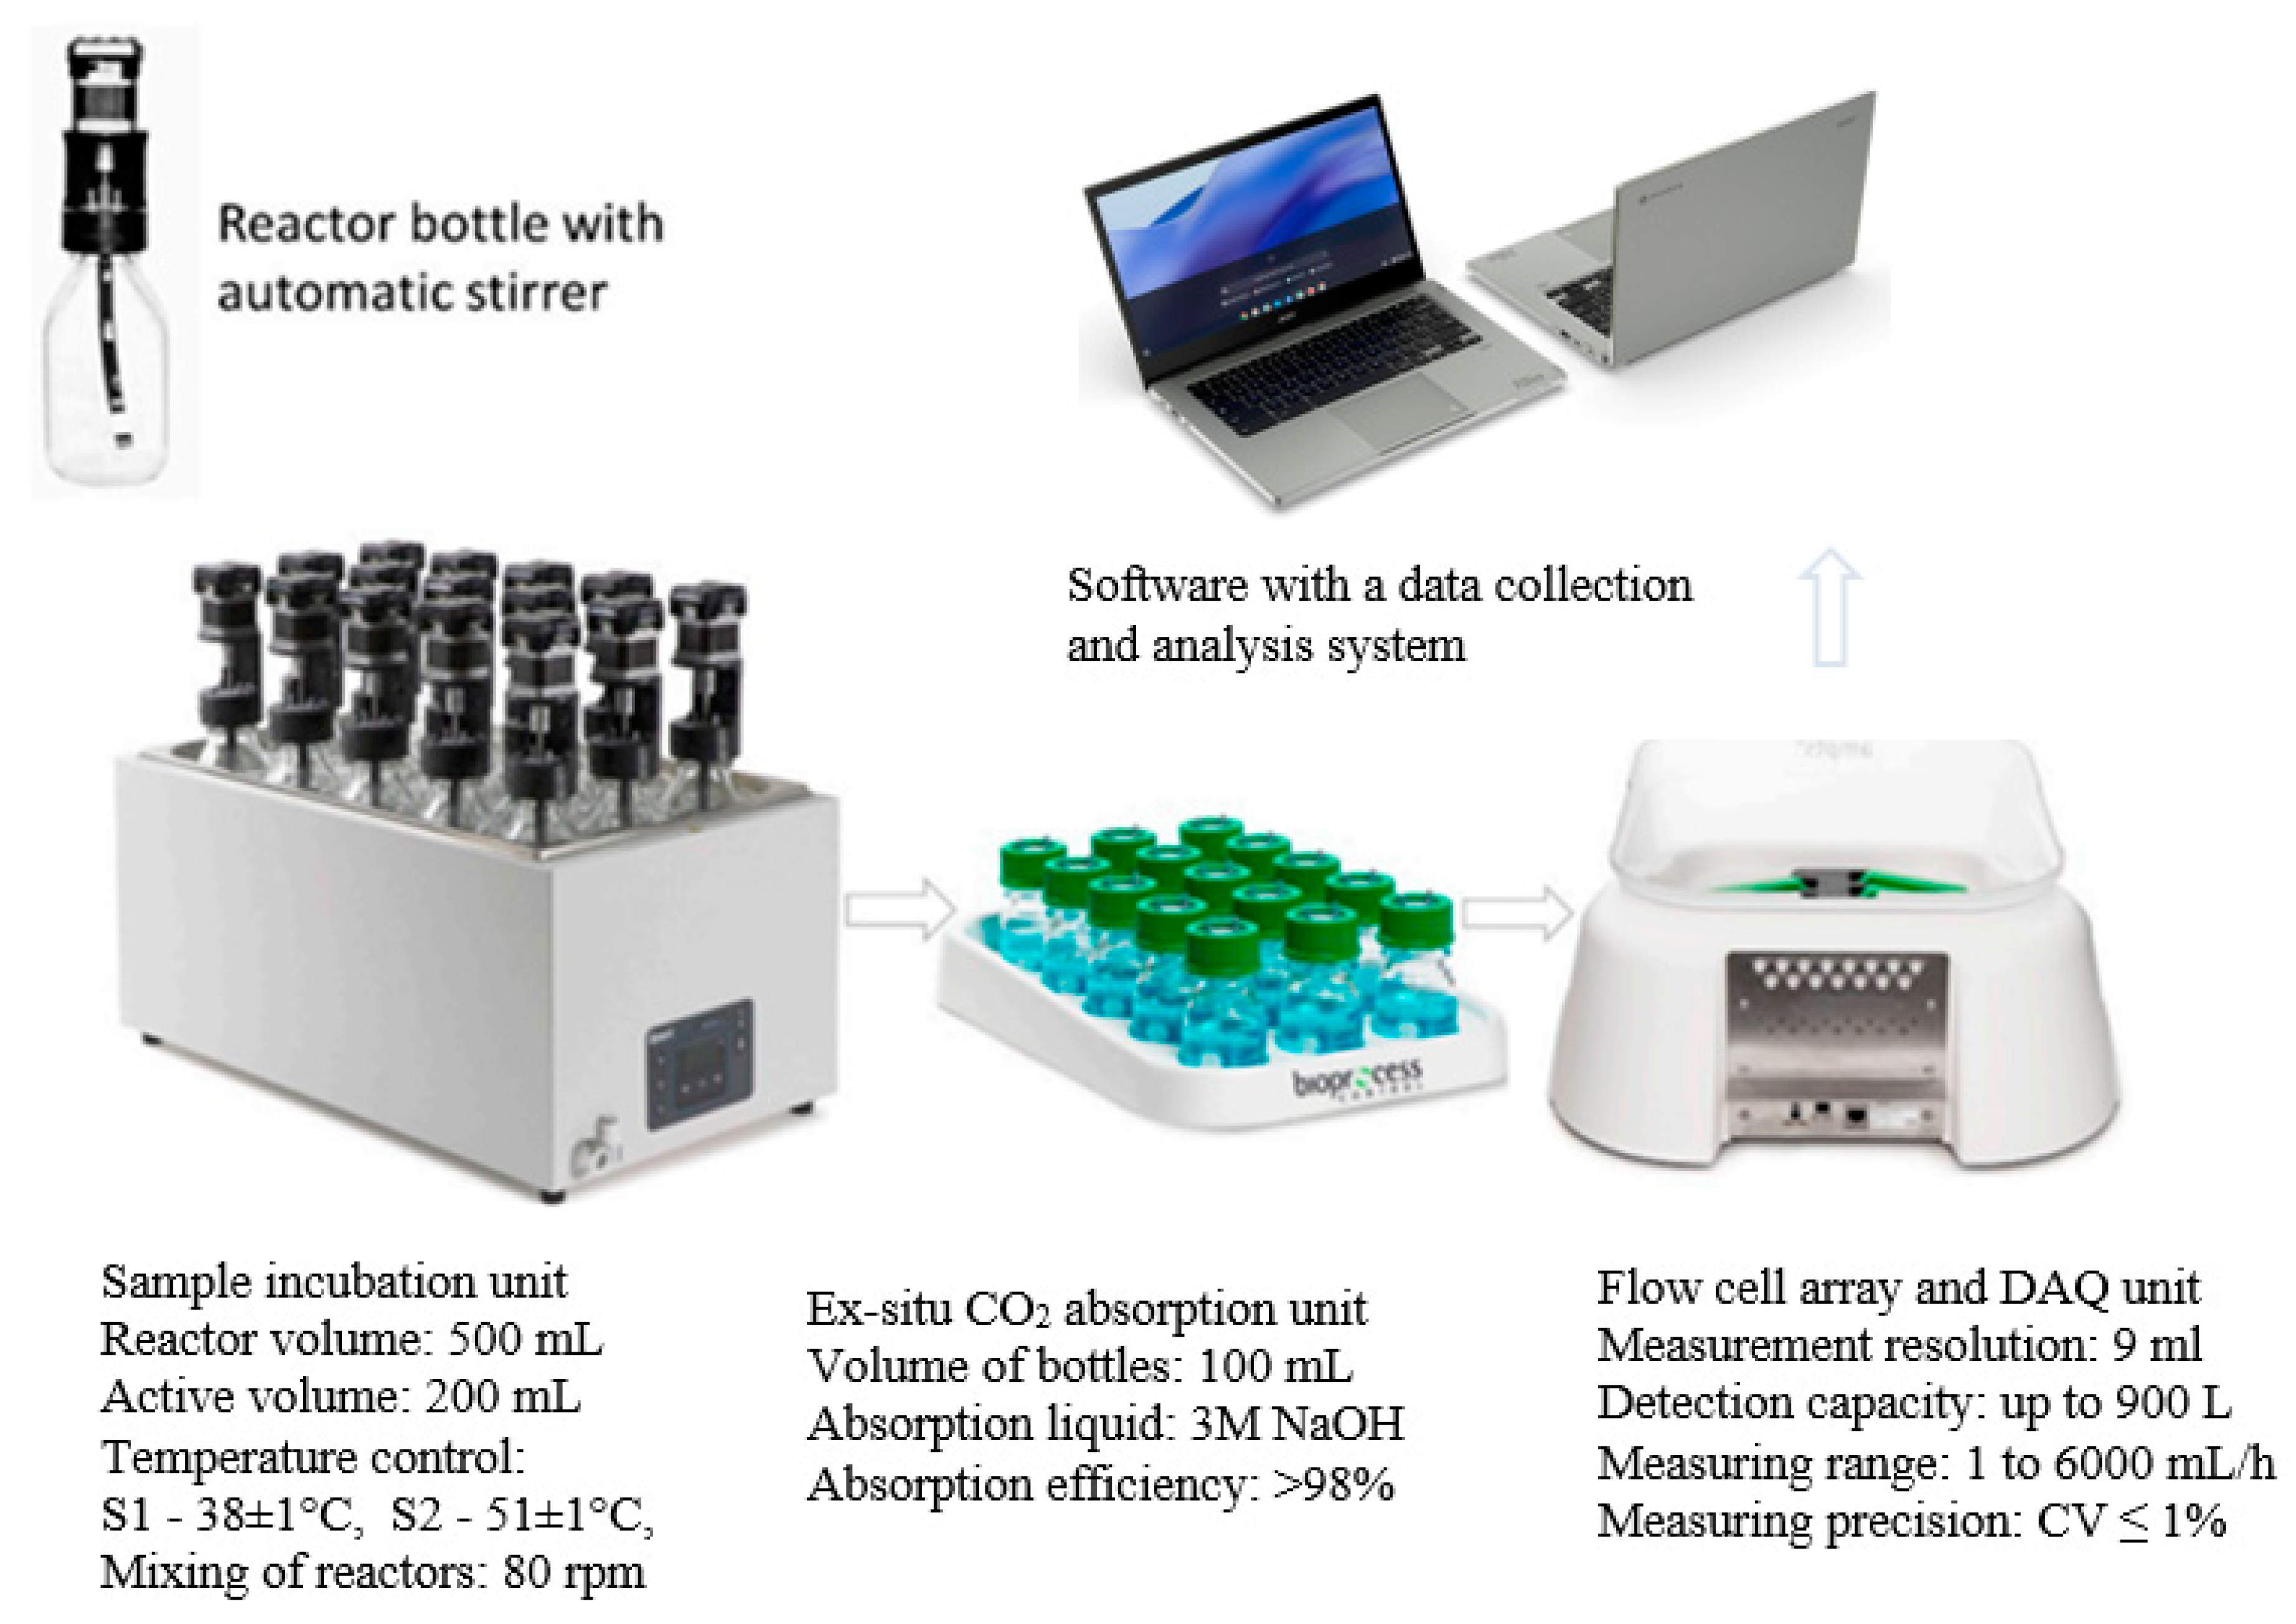
AD was performed in respirometric bioreactors with a total volume of 500 mL (Automatic Methane Potential Test System II - AMPTS II, BPC Instruments AB, Lund, Sweden). Process monitoring was based on continuous measurements of volumetric biogas production. The bioreactors were equipped with agitators with a rotation speed of 80 rpm. The stirring system was started every 9 minutes and operated continuously for 1 minute. At the beginning of the test cycle, the respirometric bioreactors were filled with 200 mL of AS inoculum and then the tested substrate compositions were added. An initial OLR of 5 g VS/L was used. Anaerobic conditions in the bioreactors were ensured by flushing the inoculum and AS mixture with pure nitrogen at a capacity of 150 L/h for 1 minute. Biogas/methane production was monitored once a day using the AMPTS application, which converted the volume to normal conditions (pressure 101.3 kPa, temperature 273K). To determine the CH4 yield, the biogas produced was fed into the ex-situ CO2 absorption unit. The measurement was performed until the available organic compounds were completely biodegraded. Three consecutive measurements of the total volume of biogas produced, between which a difference of less than 1% was observed, determined the end of the experiment. The results obtained were corrected for the endogenous biogas produced by AS to which no substrates were fed. A diagram of the test rig and the methods used in the respirometric measurements is shown in Figure 2.

2.4. Analytical methods

The content of total solids (TS), volatile solids (VS) and mineral solids (MS) was determined using the gravimetric method in accordance with standard EN 15934:2012. The pH of the homogenised solutions was measured using a pH metre (1000 L, VWR International, Radnor, PA, USA). The samples dried at 105°C were also determined for total carbon (TC), total organic carbon (TOC) and total nitrogen (TN) using a Flash 2000 analyser (Thermo Scientific, Delft, Netherlands). The protein content was estimated by multiplying the TN value by the protein conversion factor of 6.25. The fat content of the samples was determined gravimetrically after evaporation of the solvent and drying of the residue at 105°C. The analysed samples were acidified with HCl to pH 1. The prepared samples were then evaporated to dryness and quantitatively transferred to thimbles, which were placed in a Soxhlet apparatus and extracted in the presence of petroleum ether. The quality of the resulting biogas was analysed using an Agilent 7890A GC gas chromatograph (Agilent, Santa Clara, CA, USA) with a TCD detector.

2.5. Calculation and statistical methods

The biogas and methane production rate (r) and rate constants (k) were calculated using an iterative method using linear regression [25].
Y(t) = −Ymax (e−kt − 1)
where Y – biogas/methane yield (mLN/gVSadded·day), Ymax – maximum biogas/methane yield (mLN/gVSadded), k – kinetic constant (1/day), t – time (day). The biogas/methane production rate was calculated as the product of k and the maximum methane volume per gramme of VS added to the bioreactors, which results from first-order kinetics.
The experiments were conducted in four replicates. The assessment of the statistical significance of differences between the analysed variables was performed at the applied significance level of α = 0.05 using the Statistica 13.3 programme (Statsoft, Inc., Tulsa, OK, USA). Normality of the distribution (Shapiro-Wilk test). Significance of the differences between the means (one-way analysis of variance - ANOVA). Homogeneity of variance between the groups (Levene test). Significance of the differences between the analysed variables (Tukey HSD test). The independent variable is the experimental variant - the substrate/AD temperature used - and the dependent variables are the monitored and calculated characteristic AD parameters.

3. Results and discussion

The work includes measures aimed at intensifying the AGS methane fermentation process by supplementing the substrate composition with WF from a poultry processing plant. Since the aim of the research was to put the results into practise, the maximum and limit value of the proportion of WF in the total amount of VS introduced into the AD was set at 25%. This value results from the available scientific and practical knowledge on the biodegradation of fats by anaerobic bacteria. It has been proven and confirmed that the addition of fatty substances to ESS usually improves the final efficiency of AD in terms of the amount of biogas and methane produced, but a high percentage of WF may result in the need to modify the technological parameters of the process [26]. It has been shown that the biodegradation of WF is slow, which means that if a significant amount of this substrate is added, the HRT must be extended or the process must be carried out at lower OLR values [27]. Lower parameters of process kinetics may also be related to the accumulation of products of the acidic phase of fermentation, mainly volatile fatty acids (VFA), which lower the pH and limit the activity of methanogenic microorganisms [28].
Feeding anaerobic chambers intended for ESS fermentation with excessive amounts of WF also causes operational difficulties related to reduced mixing efficiency, clogging of pipes, reduced efficiency of pumping systems, foaming and scum formation, which limits the effective removal of biogas [29]. Due to the risk of such limitations, the substrate composition based on ESS and WF should be chosen carefully and wisely, which is especially important for existing and currently operating plants. Negative operational phenomena and emerging operational difficulties related to the use of fatty substances have been described by Davidsson et al. (2008) [30]. They showed that monodigestion of SS with grease traps does not ensure stable AD. After 10 days of slow start-up at an OLR of 1.7 kg VS/m3·day, the pH decreased, resulting in reduced CH4 production. Despite repeated additions of NaHCO3, it was not possible to stabilise the process [30]. Silvestre et al. (2014) [28] in turn showed that increasing the WF content to 37% in AC-D with SS under thermophilic conditions led to unstable operation of the reactor, an accumulation of long-chain fatty acids (LCFA) and poor dewaterability of the digestate.
It has been shown that the simplest way to reduce the potential hazards to anaerobic systems arising from the AC-D of ESS with WF is to increase the AD temperature [31]. Changing the conditions from mesophilic to thermophilic helps to increase the biodegradability of fats by increasing the kinetics of hydrolysis and acidogenesis processes [32]. This contributes to an increase in the production rate of simpler compounds and VFAs, which are the initial substrate for methanogenic bacteria [33]. Such conclusions were formulated by Al-Sulaimi et al. (2022) [34] and Shin et al. (2019) [35] in studies on thermophilic fermentation of SS. Under thermophilic AD conditions, a significantly higher activity of methanogenic microorganisms was also observed [36]. This is supported by the studies of Banach et al. (2018) [37], which showed that the genotypic structure of methanogenic communities analysed by PCR–DGGE changed under thermophilic conditions. Temperature had the greatest effect on the archaea methanogens in the digester immediately after the temperature was increased. Under thermophilic conditions, a significantly higher biogas yield and a higher average methane content in the produced biogas were observed [37].
The facts presented above formed the basis for selecting the WF dosage and conducting comparative studies on the AC-D of the tested AGS with WF under the commonly used mesophilic conditions and in the thermophilic fermentation process. Increasing the temperature of the AD process in systems where the biogas is combusted in cogeneration unit is a relatively simple procedure. It is possible to recover and utilise low-temperature heat from combined heat and power (CHP) plants [38]. An additional simplification is the fact that WF from the meat sector must undergo heat treatment in accordance with regulations [39]. The requirements for hygienisation prior to the AD process stipulate that the material is pre-crushed to a maximum particle diameter of 60 mm and processed at a temperature of 70°C for 60 minutes, in accordance with the provisions of European Commission Regulation (EU) No 142/2011 of 25 February 2011 implementing Regulation (EC) No 1069/2009 of the European Parliament and of the Council [40].

3.1. Characterisation of the substrates

In variant 1 (V1), which served as a reference for the subsequent research phases, AD was exposed to the AGS monosubstrate, which was pretreated with HC for 15 minutes [24]. The basis for the selection of the pretreatment time was a multivariate investigation aimed at obtaining the highest technological effect in terms of CH4 production, as well as the operational and economic effect resulting from the energy balance performed [24]. The hydration of the AGS used was 4.91±0.18% with a VS content of 72.9±1.1%TS. The TN content was 40.2±5.8 mg/gTS, the TOC concentration was 216.7±4.1 mg/gTS and the ratio of organic carbon to total nitrogen C/N was 5.39±1.1. The characteristics of the substrate compositions tested in the following variants of the study are shown in Table 2.
These values are characteristic of AGS, as previous studies in the literature have shown [41,42,43]. According to common knowledge, the value of the C/N ratio is well below the optimum value for the efficient operation of the methane fermentation process [44]. According to literature data and operating reports, the value of this parameter should be in the range of 15 to 30 [45]. Many previous works have reported too low values for the C/N ratio in SS. Zheng et al. (2021) [46] reported 6.60±0.22, Azarmanesh et al. (2021) [12] showed a value of 7.6. The purpose of introducing WF into the substrate composition was to improve the C/N ratio and ensure a higher supply of organic compounds, the available amount of which determines the amount of biogas and methane produced. This is a typical technological procedure described by Arelli et al. (2021) [47] in their work on the AC-D of ESS with food waste and by Ahmadi-Pirlou and Mesri Gundoshmian (2021) [48] in their research on the AC-D of ESS with municipal solid waste.
The addition of WF to AGS at a level ensuring 8% VS from fats in V2 made it possible to increase the C/N values to 9.88±1.9 (Table 2). At this stage, the TOC and TN contents in the biomass were 415±15.2 mg/gTS and 42.0±3.8 mg/gTS, respectively. The VS content in the biomass was 74.02±1.9%TS (Table 2). Increasing the proportion of WF in the substrate led to a further increase in the organic compound content, which had a direct effect on positive changes in the C/N ratio, which was 13.96±2.2 at V3 and reached a level in the optimum range of 18.94±2.6 at V4 (Table 2). The composition of the raw WF contained a VS concentration of 90.6±1.3%TS, a TOC content of 6164±44.4 mg/gTS, a NT of 95.11±9.6 and a C/N ratio of 64.8±4.4 (Table 1). The use of the AGS and WF proportions tested in the study had no significant effect on the changes in TN concentration in the biomass, which was within a narrow range of 40.2±5.8 mg/gTS to 46.3±6.5 mg/gTS (Table 2). The increase in VS and TOC content in the biomass and the improvement in the C/N ratio due to the introduction of lipids in SS are also confirmed by the work of Silvestre et al. (2011) [49] and Davidsson et al. (2008) [30].

3.2. Anaerobic digestion

During AD of the AGS monosubstrate at 38°C (S1V1), biogas production was 760.5±29.3 mL/gVS with a CH4 content of 63.4±1.1%. The biogas production rate (k) was 174.8 mL/day and the production rate constant (r) was 0.23 1/day. In the study by Cydzik-Kwiatkowska et al. (2022) [50], AGS fermentation enabled a biogas yield of 400 mL/gVS, 420 mL/gVS and 455 mL/gVS after 0.5, 4.0 and 8.0 minutes of ultrasonic pretreatment, respectively. The biogas yield in raw AGS was 375 mL/gVS [50]. Kazimierowicz et al. (2023) [42] achieved biogas and CH4 production of 476±20 mL/gVS and 341±13 mL/gVS, respectively, under mesophilic conditions by digesting AGS after digestion with solidified CO2 at an optimal ratio of solidified CO2 to AGS of 0.3 [42]. Similar results were obtained under thermophilic conditions [51]. At the same ratio of solidified CO2 to AGS, 482±21 mL/gVS biogas and 337±14 mL/gVS CH4 were obtained [51]. In studies investigating the effects of the thermal hydrolysis process (THP) on the solubilisation of the main organic substances of SS and the effectiveness of the subsequent biochemical methane potential (BMP) tests under mesophilic conditions (35°C), the results were between 940–1070 mL/gVS CH4, depending on the variant [52].
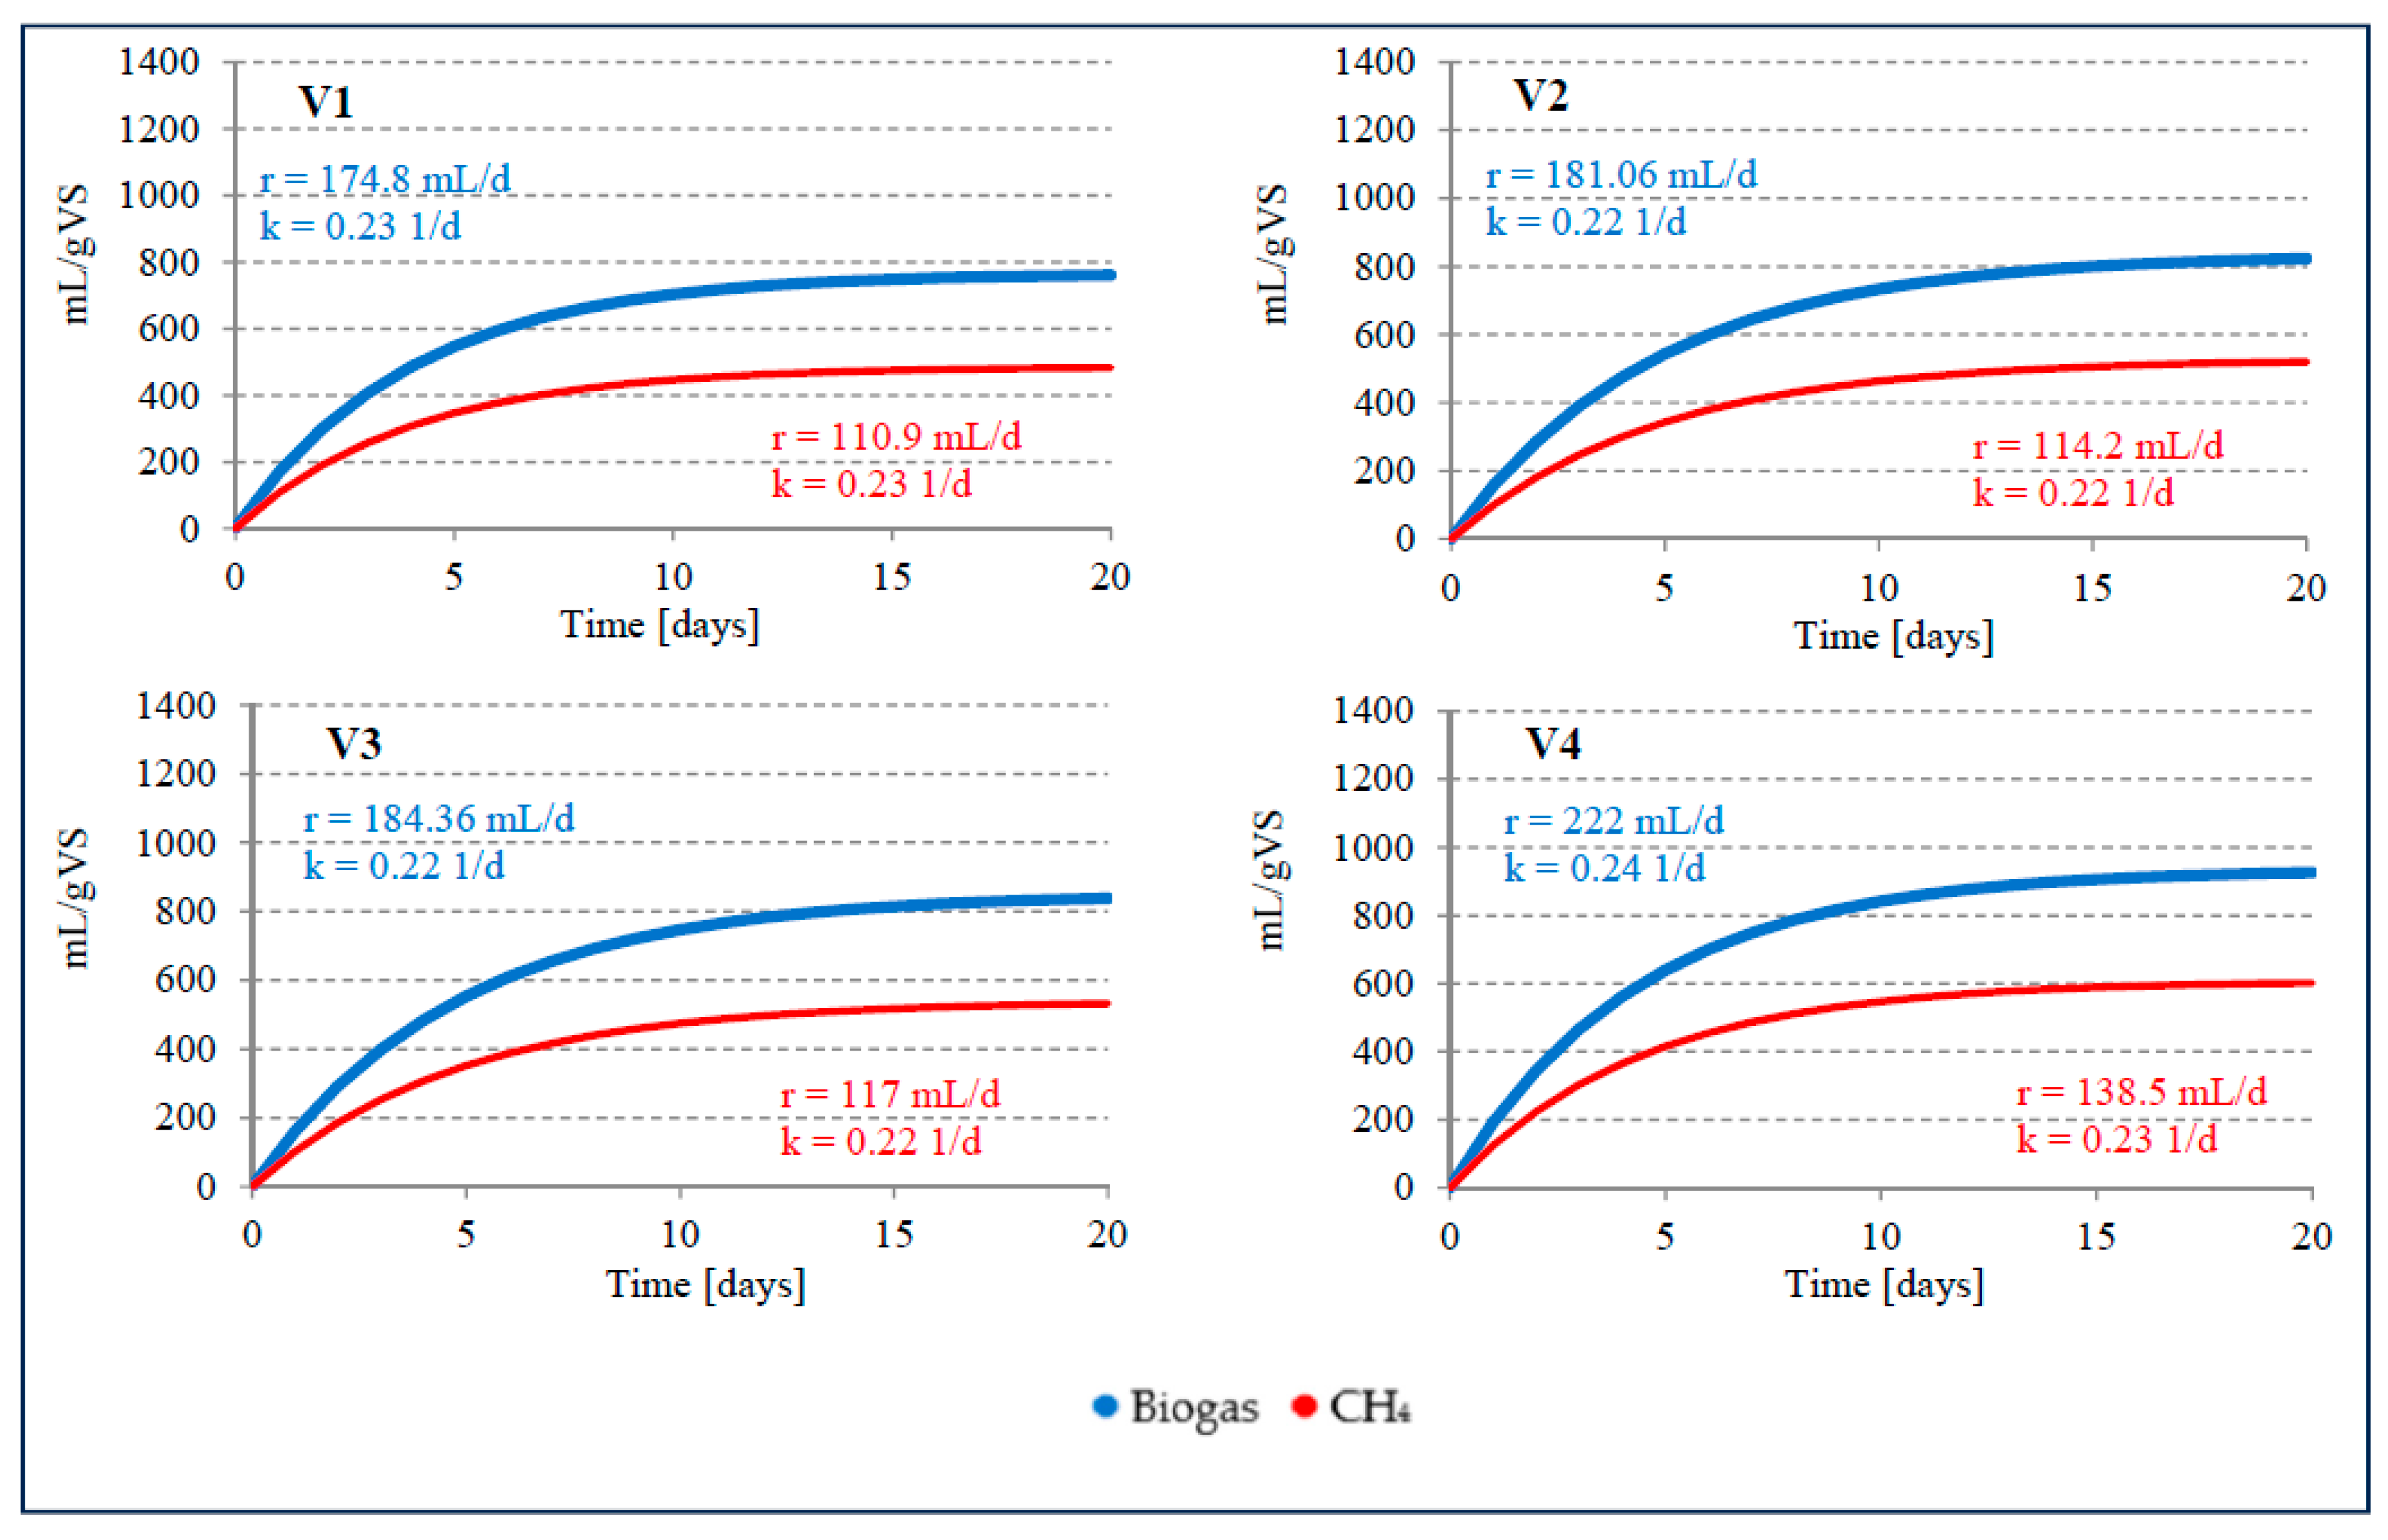
Figure 3. Kinetics of biogas and CH4 production in stage 1 of the experiment.
Preprints 97482 g003
Significantly higher AD effects than in S1V1 were observed in S1V2 and S1V3, where the proportion of WF in VS was 8% and 15%, respectively. However, it should be noted that no significant differences were observed between the results in these two variants. Biogas production was 823.1±33.4 mL/gVS in S1V2 and 838.3±32.3 mL/gVS in S1V3. There were also no differences in CH4 content, which was between 63.2±1.3% to 63.5±1.1%. The kinetics of the process were also very similar, with an r-value of 0.22 1/day for both variants. A significant improvement in AD efficiency was observed in S1V4, where the proportion of VS from WF was increased to 25%. The biogas production in this variant was 925.8±36.8 mL/gVS, with k = 222.0 mL/day and r = 0.24 1/day. The CH4 content fluctuated near the level of 65.0±1.2%, resulting in a unit production of 602.0±23.2 mLCH4/gVS at a rate (k) of 138.5 mLCH4/day. The average amount of biogas produced in S1V4 was 17.85% higher than in S1V1, but CH4 production increased on average by 19.85% thanks to the use of AGS and WF in AC-D under mesophilic conditions.
AC-D of SS with WF under mesophilic conditions was analysed by Grosser and Neczaj (2018) [53], who observed an increase in the efficiency of biogas production at a proportion of more than 10% WF. The highest biogas production value of 27.5 L/L·d was achieved with 52% WF addition, which was three times higher than with SS mono-digestion. Increasing the WF addition above 54% led to a drastic decrease in biogas production to 1.2 L/L·d. At the same time, a decrease in CH4 yield was also observed. The highest CH4 production values between 404 and 448 L/kgVS were recorded at 34% WF. The biogas yield for this variant ranged from 536 and 589 L/kgVS [53]. Davidsson et al. (2008) [30] found that the addition of 10 to 30% WF increased CH4 production by 9 to 12% and reached values in the range of 295 - 344 L/kgVS. The CH4 concentration in the biogas ranged from 66 to 69% [30]. Martínez et al. (2016) achieved a cumulative CH4 production of 700 mL/gVS under mesophilic conditions in the AC-D of SS and butchery fat waste as co-substrate [54].
Table 3. Production efficiency and composition of the biogas depending on the variant in stage 1.
Variant Production efficiency Main components of biogas
Biogas Methane
mL/gFM mL/gTS mL/gVS mL/gFM mL/gTS mL/gVS CH4 [%] CO2
[%]
S1V1 27.23±1.1 554.5±22.3 760.5±29.3 17.28±0.6 351.8±15.5 482.5±22.6 63.4±1.1 36.1±1.3
S1V2 62.1±1.6 697.5±31.3 823.1±33.4 39.21±1.3 440.6±21.6 519.9±18.8 63.2±1.3 30.1±1.1
S1V3 96.8±2.8 748.5±33.5 838.3±32.3 61.49±1.6 475.5±20.5 532.5±21.1 63.5±1.1 29.5±1.3
S1V4 128.5±2.5 826.6±35.4 925.8±36.8 98.37±1.5 537.5±22.4 602.0±23.2 65.0±1.2 28.9±1.2
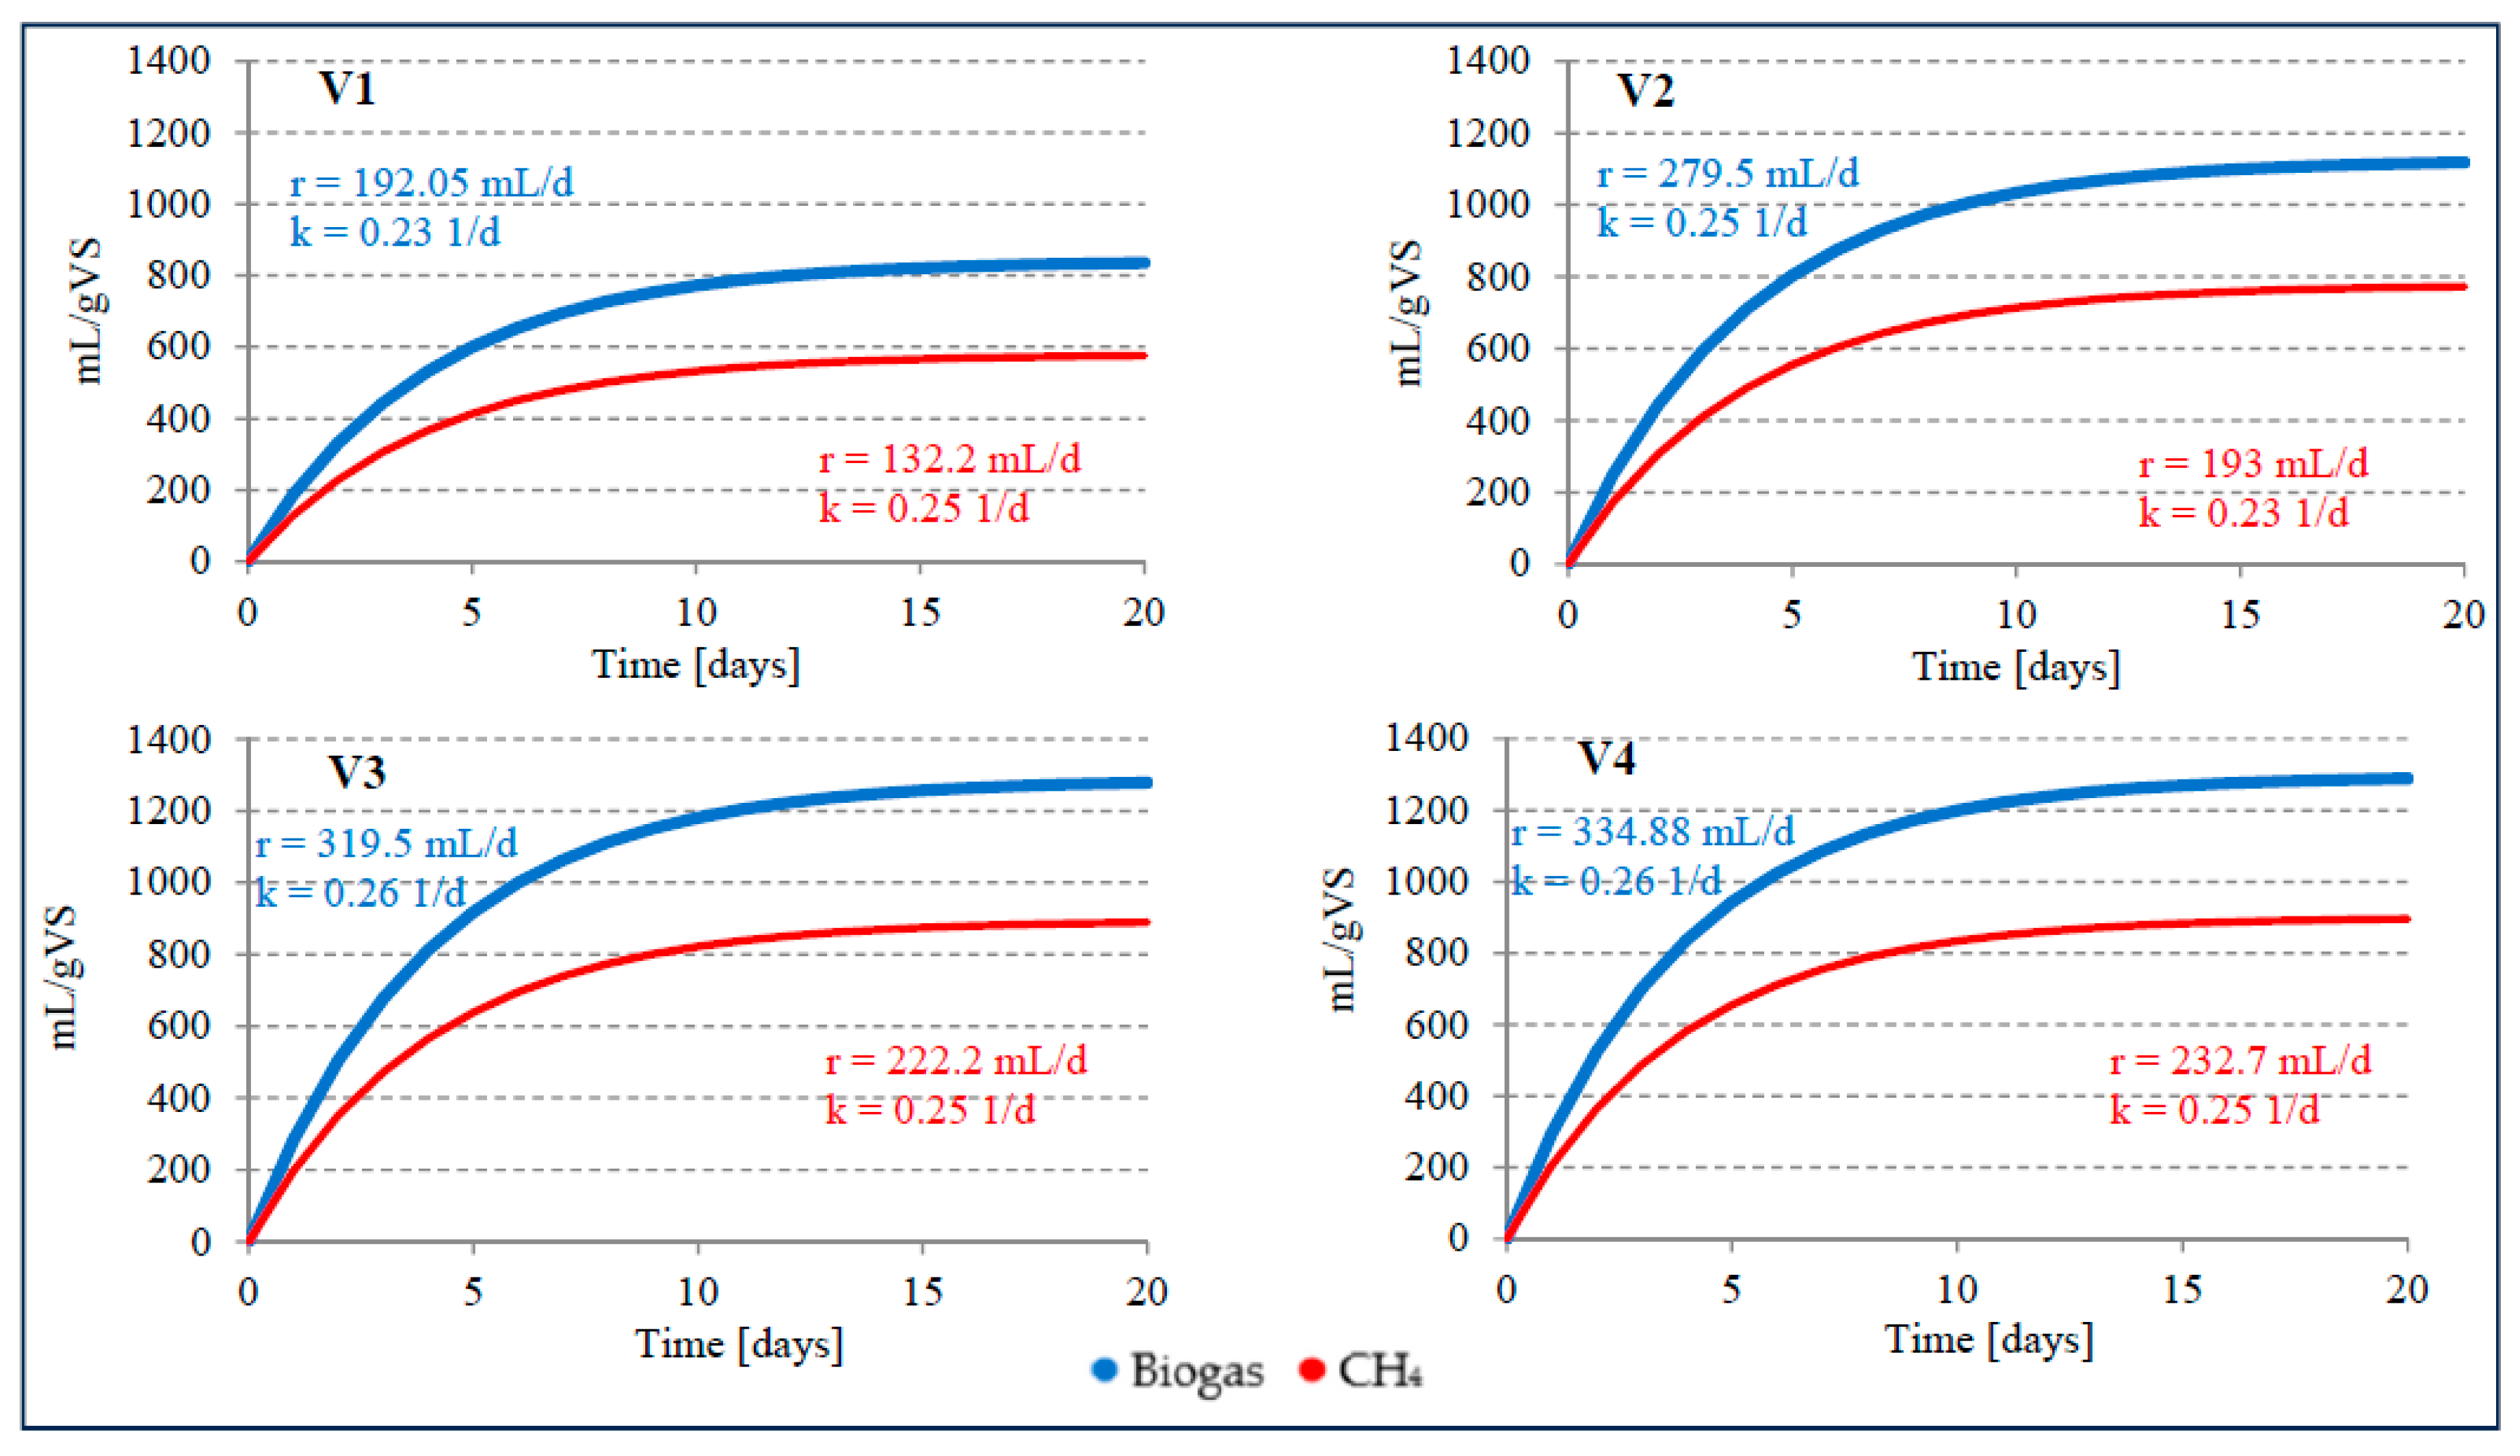
The increase in AD efficiency achieved was less than the previously published research results suggested. For this reason, and in view of the relative ease with which such a technological solution could be used in practise, tests were carried out under thermophilic conditions. By using thermophilic AGS fermentation at a temperature of 55°C (S2V1), 835.2±30.3 mL/gVS of biogas and 575.9±24.6 mL/gVS of methane were obtained. These values were 8.94% and 16.16% higher than the values achieved in S1V1. A significantly higher efficiency of CH4 production was caused by an increase in the proportion of this component in the gas mixture to 68.9±1.2%. An even greater improvement in the technological effects achieved was observed in the variants in which AGS was supplemented with WF. In S2V2, where the proportion of VS from WF was 8%, 1118.5±39.3 mL/g biogas VS was obtained at the end of the process, with a CH4 content of 69.0±1.3%. Compared to S1V2, the amount of biogas increased by 26.4% and that of methane by 32.7%. The kinetics of the biogas production process was characterised by a rate (r) of 279.5 mL/day and a rate constant (k) of 0.25 1/day. Similar proportions of SS and WF in the AD process were used by Silvestre et al. (2014) [28], who obtained 0.26 L/L·d CH4 without the addition of WF, 0.345 L/L·d CH4 with 8% WF and 0.575 L/L·d CH4 with 27% WF. At a WF content of 29%, a decrease in CH4 production to a value of 0.545 L/L·d was observed [28]. Davidsson et al. (2008) [30] also used similar ratios of the substrates mentioned. SS AD od SS without WF yielded 271 L/kgVS CH4. The addition of 10% WF led to an increase in CH4 production to 295 – 308 L/kgVS. With 30% WF, however, CH4 production increased to 344 L/kgVS [30].
Figure 4. Kinetics of biogas and CH4 production in stage 2 of the experiment.
Preprints 97482 g004
Increasing the VS proportion of WF to 15% led to a significant improvement in AD efficiency. The amount of biogas produced was 1278.2±40.2 mL/gVS (r = 319.5 mL/day, k = 0.26 1/day) and the CH4 content was 889.4±29.7 mL/gVS (r = 222.2 mL/day, k = 0.25 1/day). The CH4 content of the biogas was 69.6±1.3%. Compared to S1V3, the biogas yield increased by 34.4% and the CH4 content by 40.1%. Increasing the addition of WF to the substrate mixture in S2V4 had no significant effect on the biogas and CH4 yield. The observed values did not differ significantly from those in S2V3. The amount of biogas produced was 1288.4±36.4 mL/gVS. The CH4 content was lower than in S2V3 and was 69.5±1.2%. The values characterising the kinetics of AD were also similar to those recorded in S2V3. Silvestre et al (2014) [28] compared the mesophilic and themophilic AC-D effects of SS with the addition of WF. The highest CH4 yield was obtained with a WF content of 27%. In this case, mesophilic AD proved to be more effective and yielded 0.575 L/L·d CH4. However, 0.4 L/L·d CH4 was obtained by thermophilic fermentation. Increasing the WF content to 37 – 39% led to a decrease in AD efficiency [28]. In the mesophilic and thermophilic AD of SS and fats, oils and grease, the CH4 yield during single-stage fermentation was 473 mL/gVS and 551 mL/gVS, respectively. After the initial hydrolysis, significantly higher values were recorded, reaching 1040 mL/gVS and 1083 mL/gVS at 35°C and 52°C, respectively [55].
Table 4. Production efficiency and composition of the biogas depending on the variant in stage 2.
Variant Production efficiency Main components of biogas
Biogas Methane
mL/gFM mL/gTS mL/gVS mL/gFM mL/gTS mL/gVS CH4 [%] CO2
[%]
S2V1 29.90±1.2 609.0±24.4 835.2±30.3 20.62±0.8 419.9±19.6 575.9±24.6 68.9±1.2 30.6±1.1
S2V2 81.3±1.9 1016.8±36.2 1118.5±39.3 126.2±2.1 702.1±25.8 772.3±24.1 69.0±1.3 30.0±1.3
S2V3 130.0±2.6 1083.2±32.3 1278.2±40.2 67.07±1.4 753.7±29.6 889.4±29.7 69.6±1.3 29.1±1.2
S2V4 148.8±2.1 1150.4±31.1 1288.4±36.4 103.4±1.7 799.9±28.7 895.8±30.1 69.5±1.2 29.2±1.1
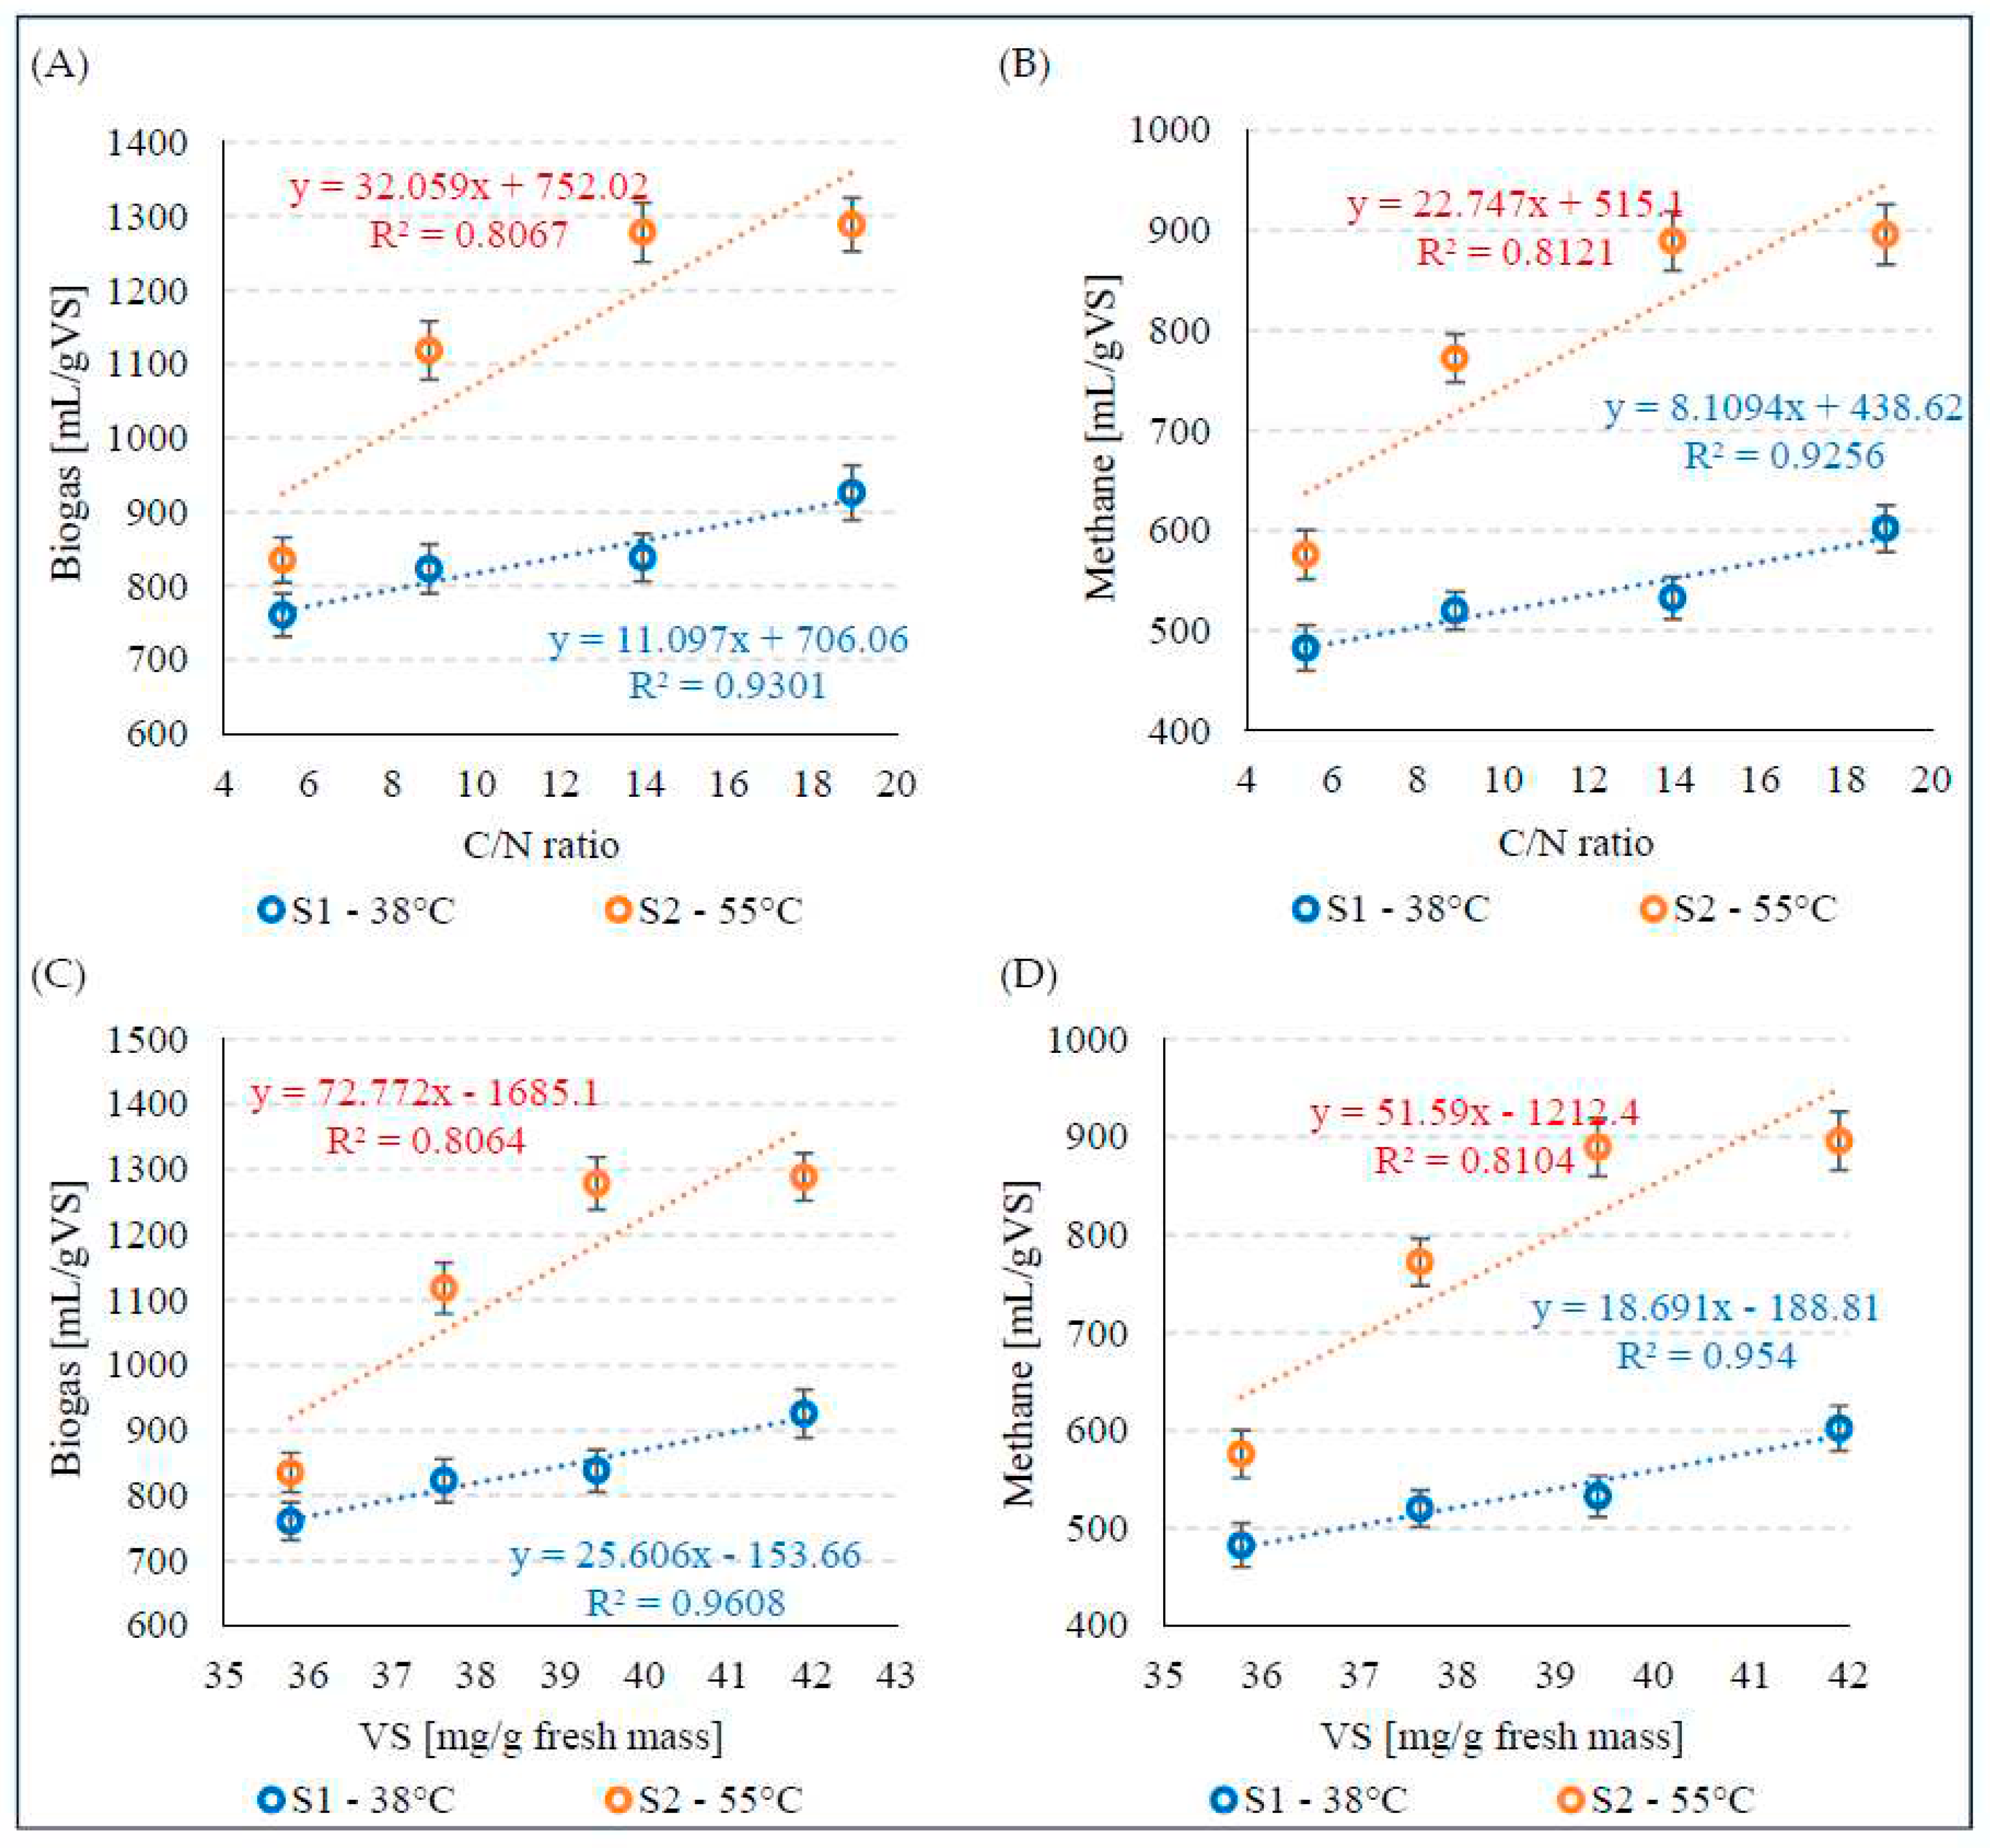
The increase in biogas and CH4 production for the variants V1 - V4 during mesophilic fermentation in S1 was strongly positively correlated with the C/N ratio, and the coefficients of determination were R2 = 0.9301 (Figure 5A) and R2 = 0.9256 (Figure 5B), respectively. A strong positive correlation between these parameters was also observed in S2, as evidenced by the coefficients of determination of R2 = 0.8067 for biogas (Figure 5A) and R2 = 0.8121 for CH4 (Figure 5B). Similar relationships were observed between VS concentration and biogas and CH4 production, with very strong positive correlations in S1 (Figure 5C) and strong positive correlations in S2 (Figure 5D).

4. Conclusions

The pre-hydrodynamically cavitated AGS used in the tests was mineralised, as confirmed by low concentrations of indicators of organic compound content, including VS and TOC. This had a direct impact on the very low C/N ratio, which is significantly different from the values considered optimal for proper AD.
A justified technological measure was to supplement the AGS biomass with another substrate rich in organic compounds and capable of AD. The addition of WF to the substrate composition had a positive effect on the properties of the substrate. The concentration of organic matter was significantly increased and the C/N ratio improved, which led to an increase in the efficiency of AD.
Under mesophilic fermentation conditions, the highest technological effects in terms of biogas and CH4 production were observed when the proportion of VS from WF was 25%. In this variant, the average amount of biogas produced increased by 17.85% and CH4 by 19.85% compared to the fermentation of the AGS monosubstrate.
The highest technological effects were observed when the mixture of AGS and WF was subjected to AD under thermophilic conditions. In the variant in which the proportion of WF in the VS was 15%, 1278.2±40.2 mL/gVS biogas and 889.4±29.7 mL/gVS CH4 were obtained. The CH4 content of the biogas was 69.6±1.3%. The increase in biogas yield compared to pure AD in AGS was 34.4% and that CH4 of 40.1%. Increasing the addition of WF to the substrate mixture to 25% VS no longer had a significant effect on increasing the efficiency of AD.
Very strong positive correlations (R2>0.9) were observed between biogas and CH4 production and the C/N ratio and VS concentration during mesophilic fermentation. Strong positive correlations (R2>0.8) were observed between these parameters during thermophilic fermentation.

Author Contributions

Conceptualization, M.D. and M.Z.; Methodology, M.D. and M.Z.; Validation, M.D.; Formal analysis, M.D.; Investigation, M.D., M.Z., J.K., A.N., and M.D.; Resources, M.D., M.Z., J.K., A.N., and M.D.; Data curation, M.D., M.Z., J.K., A.N., and M.D; Supervision, M.D.; Writing—original draft preparation, M.D. and J.K.; Writing—review and editing, M.D., M.Z., J.K., A.N., and M.D.; Visualization, M.D. and J.K.; Funding acquisition, M.D. All authors have read and agreed to the published version of the manuscript.

Funding

This research was financially supported by works no. 29.610.023-110 of the University of Warmia and Mazury in Olsztyn and WZ/WB-IIŚ/3/2022 of the Bialystok University of Technology, funded by the Minister of Education and Science.

Data Availability Statement

Not applicable.

Conflicts of Interest

The authors declare no conflict of interest.

References

  1. Woo, D. C. Y.; Goh, Q. H.; Poh, P. E.; Chew, I. M. L. A Technoeconomic Analysis of Sewage Sludge Valorization for Carbon Emission Reduction. Biomass Convers. Biorefinery 2023, 13, 13591–13604. [Google Scholar] [CrossRef]
  2. Almansa, X. F.; Starostka, R.; Raskin, L.; Zeeman, G.; De Los Reyes, F.; Waechter, J.; Yeh, D.; Radu, T. Anaerobic Digestion as a Core Technology in Addressing the Global Sanitation Crisis: Challenges and Opportunities. Environ. Sci. Technol. 2023, 57, 19078–19087. [Google Scholar] [CrossRef] [PubMed]
  3. Chen, W.; Wang, J.; Liu, W. A View of Anaerobic Digestion: Microbiology, Advantages and Optimization. Acad. J. Environ. Earth Sci. 5, 1–8. [CrossRef]
  4. Hallaji, S. M.; Torabian, A.; Aminzadeh, B.; Zahedi, S.; Eshtiaghi, N. Improvement of Anaerobic Digestion of Sewage Mixed Sludge Using Free Nitrous Acid and Fenton Pre-Treatment. Biotechnol. Biofuels 2018, 11, 1–12. [Google Scholar] [CrossRef] [PubMed]
  5. Sun, C.; Guo, L.; Zheng, Y.; Yu, D.; Jin, C.; Zhao, Y.; Yao, Z.; Gao, M.; She, Z. Effect of Mixed Primary and Secondary Sludge for Two-Stage Anaerobic Digestion (AD). Bioresour. Technol. 2022, 343, 126160. [Google Scholar] [CrossRef]
  6. Sakaveli, F.; Petala, M.; Tsiridis, V.; Darakas, E. Enhanced Mesophilic Anaerobic Digestion of Primary Sewage Sludge. Water 2021, Vol. 13, Page 348 2021, 13, 348. [Google Scholar] [CrossRef]
  7. Mannacharaju, M.; Natarajan, P.; Villalan, A. K.; Jothieswari, M.; Somasundaram, S.; Ganesan, S. An Innovative Approach to Minimize Excess Sludge Production in Sewage Treatment Using Integrated Bioreactors. J. Environ. Sci. 2018, 67, 67–77. [Google Scholar] [CrossRef]
  8. Di Capua, F.; Spasiano, D.; Giordano, A.; Adani, F.; Fratino, U.; Pirozzi, F.; Esposito, G. High-Solid Anaerobic Digestion of Sewage Sludge: Challenges and Opportunities. Appl. Energy 2020, 278, 115608. [Google Scholar] [CrossRef]
  9. Abdelmegeed, M. N. M. Optimisation of Sludge Management in EThekwini Municipality, College of Agriculture, Engineering and Science, University of KwaZulu-Natal, 2022.
  10. Reysset, M. Comprehensive Overview of Biogas for Sanitation Options – Training of Trainers. Gates Open Res. 2021 526 2021, 5, 26. [Google Scholar] [CrossRef]
  11. Wu, B.; Dai, X.; Chai, X. Critical Review on Dewatering of Sewage Sludge: Influential Mechanism, Conditioning Technologies and Implications to Sludge Re-Utilizations. Water Res. 2020, 180, 115912. [Google Scholar] [CrossRef]
  12. Azarmanesh, R.; Zonoozi, M. H.; Ghiasinejad, H. Characterization of Food Waste and Sewage Sludge Mesophilic Anaerobic Co-Digestion under Different Mixing Ratios of Primary Sludge, Secondary Sludge and Food Waste. Biomass and Bioenergy 2020, 139, 105610. [Google Scholar] [CrossRef]
  13. Kazimierowicz, J.; Dębowski, M. Aerobic Granular Sludge as a Substrate in Anaerobic Digestion—Current Status and Perspectives. Sustain. 2022, 14, 10904. [Google Scholar] [CrossRef]
  14. Hamza, R.; Rabii, A.; Ezzahraoui, F. zahra; Morgan, G.; Iorhemen, O. T. A Review of the State of Development of Aerobic Granular Sludge Technology over the Last 20 Years: Full-Scale Applications and Resource Recovery. Case Stud. Chem. Environ. Eng. 2022, 5, 100173. [Google Scholar] [CrossRef]
  15. Kazimierowicz, J.; Dębowski, M.; Zieliński, M. Microbial Granule Technology—Prospects for Wastewater Treatment and Energy Production. Energies 2023, Vol. 16, Page 75 2022, 16, 75. [Google Scholar] [CrossRef]
  16. Kaegi, R.; Gogos, A.; Voegelin, A.; Hug, S. J.; Winkel, L. H. E.; Buser, A. M.; Berg, M. Quantification of Individual Rare Earth Elements from Industrial Sources in Sewage Sludge. Water Res. X 2021, 11, 100092. [Google Scholar] [CrossRef] [PubMed]
  17. Rosa-Masegosa, A.; Muñoz-Palazon, B.; Gonzalez-Martinez, A.; Fenice, M.; Gorrasi, S.; Gonzalez-Lopez, J. New Advances in Aerobic Granular Sludge Technology Using Continuous Flow Reactors: Engineering and Microbiological Aspects. Water 2021, Vol. 13, Page 1792 2021, 13, 1792. [Google Scholar] [CrossRef]
  18. Val Del Río, Á.; Palmeiro-Sanchez, T.; Figueroa, M.; Mosquera-Corral, A.; Campos, J. L.; Méndez, R. Anaerobic Digestion of Aerobic Granular Biomass: Effects of Thermal Pre-Treatment and Addition of Primary Sludge. J. Chem. Technol. Biotechnol. 2014, 89, 690–697. [Google Scholar] [CrossRef]
  19. Chen, Y.; Ping, Q.; Li, D.; Dai, X.; Li, Y. Comprehensive Insights into the Impact of Pretreatment on Anaerobic Digestion of Waste Active Sludge from Perspectives of Organic Matter Composition, Thermodynamics, and Multi-Omics. Water Res. 2022, 226, 119240. [Google Scholar] [CrossRef] [PubMed]
  20. Myszograj, S.; Płuciennik-Koropczuk, E. Thermal Disintegration of Sewage Sludge as a Method of Improving the Biogas Potential. Energies 2023, 16, 559. [Google Scholar] [CrossRef]
  21. Dababat, S.; Enaime, G.; Wichern, M.; Lübken, M. Aerobic Granular Sludge: Perspectives for Excess Sludge Management and Resource Recovery. Chemie Ing. Tech. 2023, 95, 1881–1896. [Google Scholar] [CrossRef]
  22. Goswami, R.; Thakur, R. Valorizing Sludge: A Biorefinery Perspective Prospecting for Sustainable Development. Clean Energy Resour. Recover. Wastewater Treat. Plants as Biorefineries 2022, 2, 435–454. [Google Scholar] [CrossRef]
  23. Banerjee, A.; Banerjee, A.; Bhaskar, T.; Bhaskar, T.; Ghosh, D.; Ghosh, D. A Biorefinery Approach for Sewage Sludge. Waste Biorefinery Integr. Biorefineries Waste Valoris. 2020, 393–421. [Google Scholar] [CrossRef]
  24. Zieliński, M.; Dębowski, M.; Kazimierowicz, J.; Nowicka, A.; Dudek, M. Application of Hydrodynamic Cavitation in the Disintegration of Aerobic Granular Sludge—Evaluation of Pretreatment Time on Biomass Properties, Anaerobic Digestion Efficiency and Energy Balance. Energies 2024, 17, 335. [Google Scholar] [CrossRef]
  25. Llabrés-Luengo, P.; Mata-Alvarez, J. Kinetic Study of the Anaerobic Digestion of Straw-Pig Manure Mixtures. Biomass 1987, 14, 129–142. [Google Scholar] [CrossRef]
  26. Wiśniowska, E.; Janosz-Rajczyk, M. Effect of Chemically Conditioned FOG Fraction on Methane Co-Fermentation with Excess Sewage Sludge with Regard to Heavy Metals Concentration. Desalin. Water Treat. 2016, 57, 1525–1533. [Google Scholar] [CrossRef]
  27. Hagos, K.; Zong, J.; Li, D.; Liu, C.; Lu, X. Anaerobic Co-Digestion Process for Biogas Production: Progress, Challenges and Perspectives. Renew. Sustain. Energy Rev. 2017, 76, 1485–1496. [Google Scholar] [CrossRef]
  28. Silvestre, G.; Illa, J.; Fernández, B.; Bonmatí, A. Thermophilic Anaerobic Co-Digestion of Sewage Sludge with Grease Waste: Effect of Long Chain Fatty Acids in the Methane Yield and Its Dewatering Properties. Appl. Energy 2014, 117, 87–94. [Google Scholar] [CrossRef]
  29. Diamantis, V.; Eftaxias, A.; Stamatelatou, K.; Noutsopoulos, C.; Vlachokostas, C.; Aivasidis, A. Bioenergy in the Era of Circular Economy: Anaerobic Digestion Technological Solutions to Produce Biogas from Lipid-Rich Wastes. Renew. Energy 2021, 168, 438–447. [Google Scholar] [CrossRef]
  30. Davidsson, Å.; Lövstedt, C.; la Cour Jansen, J.; Gruvberger, C.; Aspegren, H. Co-Digestion of Grease Trap Sludge and Sewage Sludge. Waste Manag. 2008, 28, 986–992. [Google Scholar] [CrossRef]
  31. Alqaralleh, R. M.; Kennedy, K.; Delatolla, R.; Sartaj, M. Thermophilic and Hyper-Thermophilic Co-Digestion of Waste Activated Sludge and Fat, Oil and Grease: Evaluating and Modeling Methane Production. J. Environ. Manage. 2016, 183, 551–561. [Google Scholar] [CrossRef] [PubMed]
  32. Gu, J.; Liu, R.; Cheng, Y.; Stanisavljevic, N.; Li, L.; Djatkov, D.; Peng, X.; Wang, X. Anaerobic Co-Digestion of Food Waste and Sewage Sludge under Mesophilic and Thermophilic Conditions: Focusing on Synergistic Effects on Methane Production. Bioresour. Technol. 2020, 301, 122765. [Google Scholar] [CrossRef]
  33. Yang, Z.; Wang, W.; He, Y.; Zhang, R.; Liu, G. Effect of Ammonia on Methane Production, Methanogenesis Pathway, Microbial Community and Reactor Performance under Mesophilic and Thermophilic Conditions. Renew. Energy 2018, 125, 915–925. [Google Scholar] [CrossRef]
  34. Al-Sulaimi, I. N.; Nayak, J. K.; Alhimali, H.; Sana, A.; Al-Mamun, A. Effect of Volatile Fatty Acids Accumulation on Biogas Production by Sludge-Feeding Thermophilic Anaerobic Digester and Predicting Process Parameters. Ferment 2022, 8, 184. [Google Scholar] [CrossRef]
  35. Shin, J.; Jang, H. M.; Shin, S. G.; Kim, Y. M. Thermophilic Anaerobic Digestion: Effect of Start-up Strategies on Performance and Microbial Community. Sci. Total Environ. 2019, 687, 87–95. [Google Scholar] [CrossRef]
  36. Seneesrisakul, K.; Sutabutr, T.; Chavadej, S. The Effect of Temperature on the Methanogenic Activity in Relation to Micronutrient Availability. Energies 2018, 11, 1057. [Google Scholar] [CrossRef]
  37. Banach, A.; Ciesielski, S.; Bacza, T.; Pieczykolan, M.; Ziembińska-Buczyńska, A. Microbial Community Composition and Methanogens’ Biodiversity during a Temperature Shift in a Methane Fermentation Chamber. Environ. Technol. 2019, 40, 3252–3263. [Google Scholar] [CrossRef]
  38. Arslan, M.; Yılmaz, C. Thermodynamic Optimization and Thermoeconomic Evaluation of Afyon Biogas Plant Assisted by Organic Rankine Cycle for Waste Heat Recovery. Energy 2022, 248, 123487. [Google Scholar] [CrossRef]
  39. Kazimierowicz, J.; Dzienis, L.; Dębowski, M.; Zieliński, M. Optimisation of Methane Fermentation as a Valorisation Method for Food Waste Products. Biomass and Bioenergy 2021, 144, 105913. [Google Scholar] [CrossRef]
  40. European Parliament and of the Council. Regulation (EC) No 1069/2009 of the European Parliament and of the Council of 21 October 2009 Laying down Health Rules as Regards Animal by-Products and Derived Products Not Intended for Human Consumption and Repealing Regulation (EC) No 1774/2002 (Animal; 2009.
  41. Bernat, K.; Cydzik-Kwiatkowska, A.; Wojnowska-Baryła, I.; Karczewska, M. Physicochemical Properties and Biogas Productivity of Aerobic Granular Sludge and Activated Sludge. Biochem. Eng. J. 2017, 117, 43–51. [Google Scholar] [CrossRef]
  42. Kazimierowicz, J.; Dębowski, M.; Zieliński, M. Technological, Ecological, and Energy-Economic Aspects of Using Solidified Carbon Dioxide for Aerobic Granular Sludge Pre-Treatment Prior to Anaerobic Digestion. Int. J. Environ. Res. Public Heal. 2023, 20, 4234. [Google Scholar] [CrossRef]
  43. Luiz de Sousa Rollemberg, S.; Queiroz de Oliveira, L.; Nascimento de Barros, A.; Igor Milen Firmino, P.; Bezerra dos Santos, A. Pilot-Scale Aerobic Granular Sludge in the Treatment of Municipal Wastewater: Optimizations in the Start-up, Methodology of Sludge Discharge, and Evaluation of Resource Recovery. Bioresour. Technol. 2020, 311, 123467. [Google Scholar] [CrossRef]
  44. Mkruqulwa, U.; Okudoh, V.; Oyekola, O. Optimizing Methane Production from Co-Digestion of Cassava Biomass and Winery Solid Waste Using Response Surface Methodology. Waste and Biomass Valorization 2020, 11, 4799–4808. [Google Scholar] [CrossRef]
  45. Kainthola, J.; Kalamdhad, A. S.; Goud, V. V. Optimization of Process Parameters for Accelerated Methane Yield from Anaerobic Co-Digestion of Rice Straw and Food Waste. Renew. Energy 2020, 149, 1352–1359. [Google Scholar] [CrossRef]
  46. Zheng, Y.; Wang, P.; Yang, X.; Lin, P.; Wang, Y.; Cheng, M.; Ren, L. Process Performance and Microbial Communities in Anaerobic Co-Digestion of Sewage Sludge and Food Waste with a Lower Range of Carbon/Nitrogen Ratio. Bioenergy Res. 2022, 15, 1664–1674. [Google Scholar] [CrossRef]
  47. Arelli, V.; Mamindlapelli, N. K.; Begum, S.; Juntupally, S.; Anupoju, G. R. Solid State Anaerobic Digestion of Food Waste and Sewage Sludge: Impact of Mixing Ratios and Temperature on Microbial Diversity, Reactor Stability and Methane Yield. Sci. Total Environ. 2021, 793, 148586. [Google Scholar] [CrossRef] [PubMed]
  48. Ahmadi-Pirlou, M.; Mesri Gundoshmian, T. The Effect of Substrate Ratio and Total Solids on Biogas Production from Anaerobic Co-Digestion of Municipal Solid Waste and Sewage Sludge. J. Mater. Cycles Waste Manag. 2021, 23, 1938–1946. [Google Scholar] [CrossRef]
  49. Silvestre, G.; Rodríguez-Abalde, A.; Fernández, B.; Flotats, X.; Bonmatí, A. Biomass Adaptation over Anaerobic Co-Digestion of Sewage Sludge and Trapped Grease Waste. Bioresour. Technol. 2011, 102, 6830–6836. [Google Scholar] [CrossRef]
  50. Cydzik-Kwiatkowska, A.; Bernat, K.; Zielińska, M.; Gusiatin, M. Z.; Wojnowska-Baryła, I.; Kulikowska, D. Valorization of Full-Scale Waste Aerobic Granular Sludge for Biogas Production and the Characteristics of the Digestate. Chemosphere 2022, 303, 135167. [Google Scholar] [CrossRef] [PubMed]
  51. Kazimierowicz, J.; Dębowski, M.; Zieliński, M.; Bartkowska, I.; Wasilewski, A.; Łapiński, D.; Ofman, P. The Use of Solidified Carbon Dioxide in the Aerobic Granular Sludge Pre-Treatment before Thermophilic Anaerobic Digestion. Appl. Sci. 2023, 13, 7864. [Google Scholar] [CrossRef]
  52. Xue, Y.; Liu, H.; Chen, S.; Dichtl, N.; Dai, X.; Li, N. Effects of Thermal Hydrolysis on Organic Matter Solubilization and Anaerobic Digestion of High Solid Sludge. Chem. Eng. J. 2015, 264, 174–180. [Google Scholar] [CrossRef]
  53. Grosser, A.; Neczaj, E. Sewage Sludge and Fat Rich Materials Co-Digestion - Performance and Energy Potential. J. Clean. Prod. 2018, 198, 1076–1089. [Google Scholar] [CrossRef]
  54. Martínez, E. J.; Gil, M. V.; Fernandez, C.; Rosas, J. G.; Gómez, X. Anaerobic Codigestion of Sludge: Addition of Butcher’s Fat Waste as a Cosubstrate for Increasing Biogas Production. PLoS One 2016, 11, e0153139. [Google Scholar] [CrossRef]
  55. Kabouris, J. C.; Tezel, U.; Pavlostathis, S. G.; Engelmann, M.; Dulaney, J. A.; Todd, A. C.; Gillette, R. A. Mesophilic and Thermophilic Anaerobic Digestion of Municipal Sludge and Fat, Oil, and Grease. Water Environ. Res. 2009, 81, 476–485. [Google Scholar] [CrossRef] [PubMed]
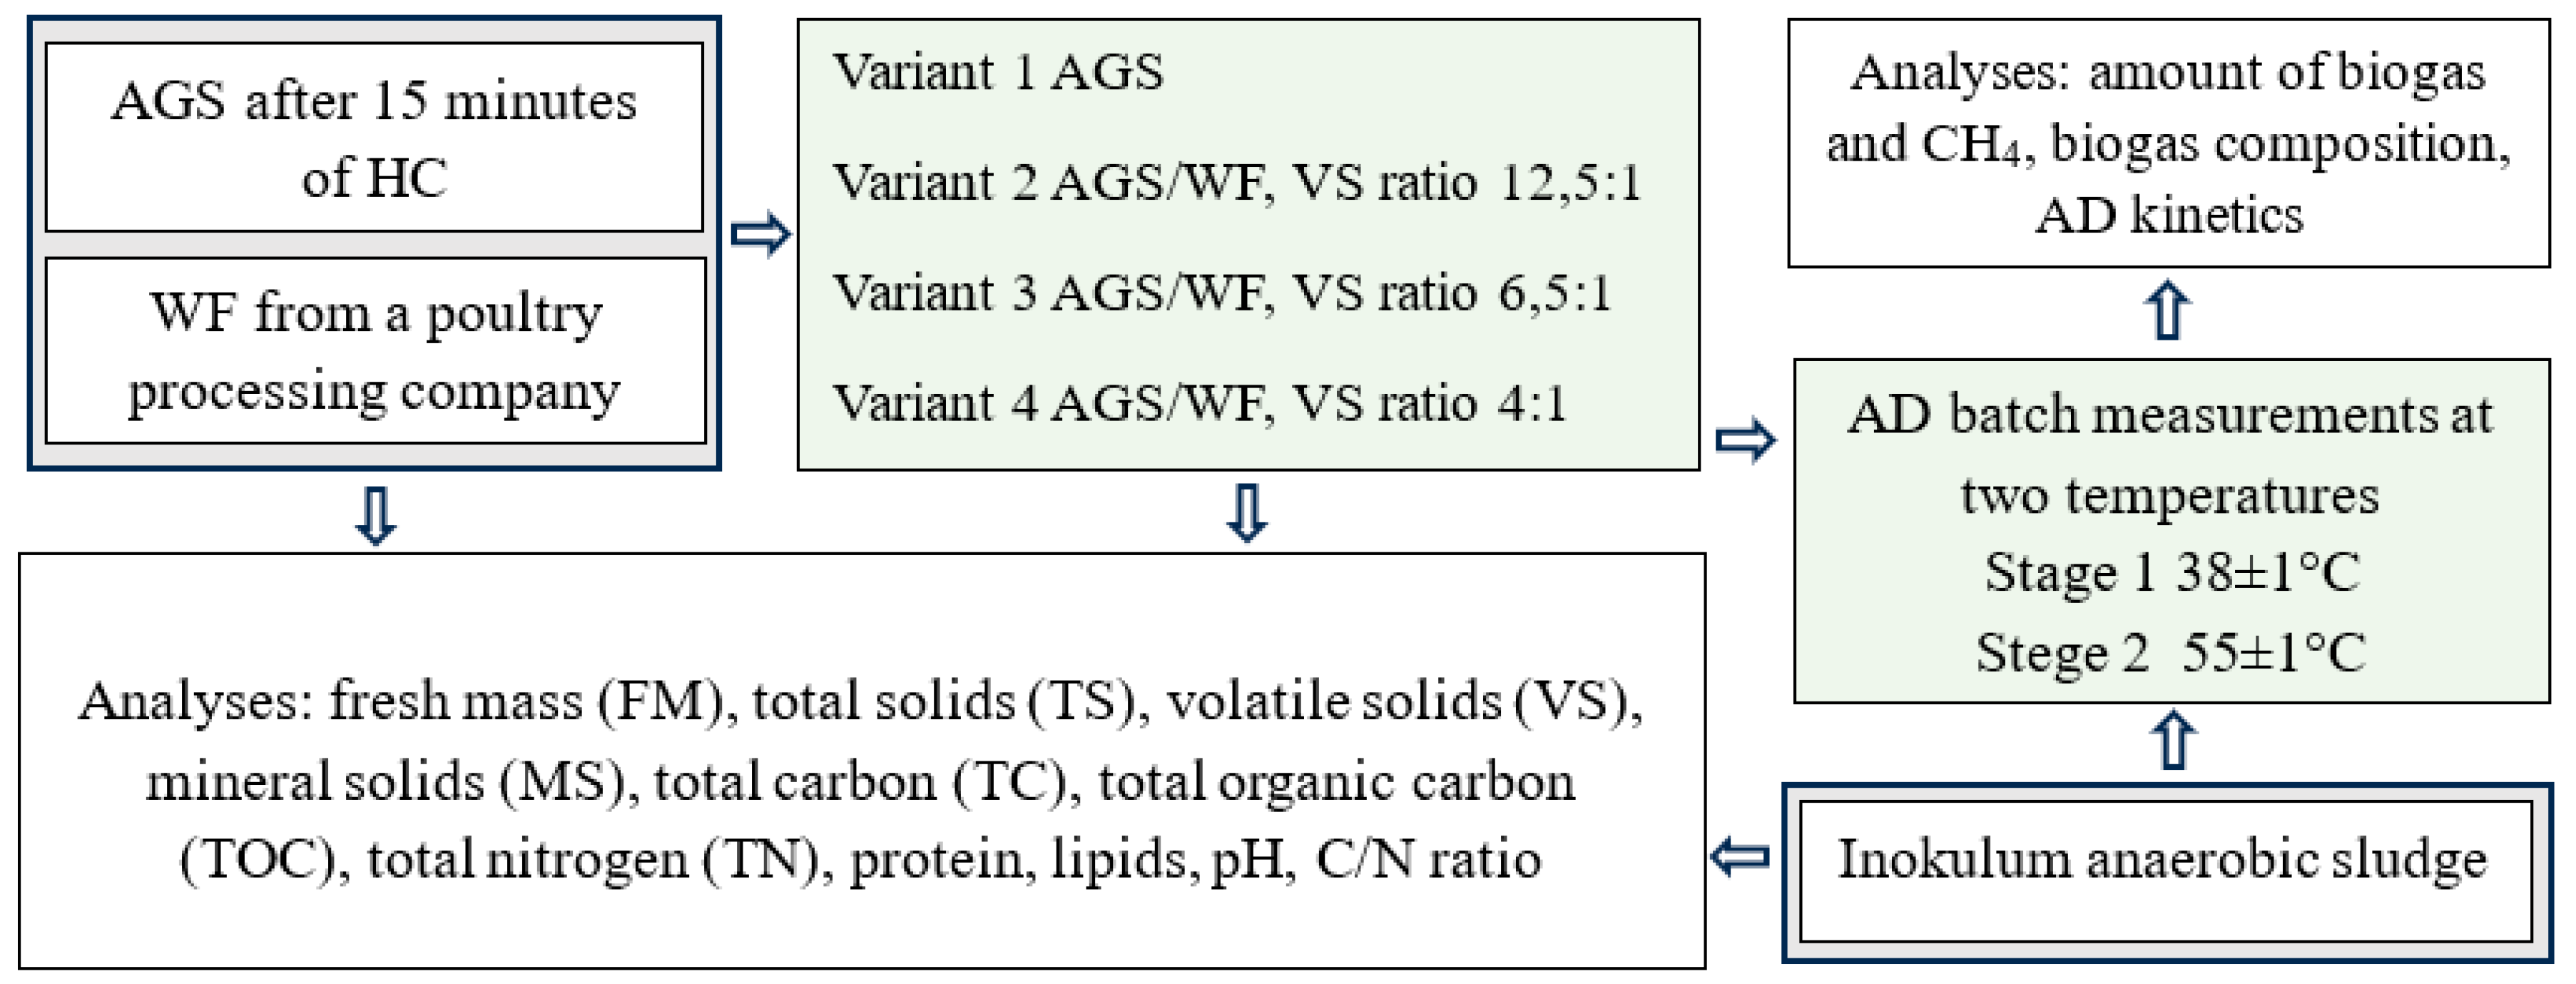
Figure 1. Organisation chart of the experimental work.
Preprints 97482 g001
Figure 2. Scheme of the test stand and the parameters used for the respirometric measurements of AD.
Preprints 97482 g002
Figure 5. Correlations between biogas production (A) and CH4 (B) and the C/N ratio and between biogas production (C) and CH4 (D) and the VS concentration.
Preprints 97482 g005
Table 1. Characteristics of the initial substrates used in AD (AGS, WF) and the anaerobic sludge (AS) inoculum.
Parameter Unit AGS WF AS
Total solids (TS) mg/gFM 49.1±1.8 101±5.4 47.8±1.3
%FM 4.91±0.18 10.10±0.54 4.78±0.13
Mineral solids (MS) mg/gFM 13.3±1.2 10.6±0.5 14,7±0.3
%TS 27.1±0.9 9.44±0.91 30.7±0.2
Volatile solids (VS) mg/gFM 35.8±1.2 90.3±1.6 33.5±1.4
%TS 72.9±1.1 90.6±1.3 69.3±0.8
Total nitrogen (TN) mg/gTS 40.2±5.8 95.11±9.6 45.3±3.1
Total carbon (TC) mg/gTS 297.2±4.5 9149±52.6 384.4±19.2
Total organic carbon (TOC) mg/gTS 216.7±4.1 6164±44.4 319.7±21.6
Total inorganic carbon (IC) mg/gTS 80.5±1.1 2985±16.4 64,7±20.5
pH - 7.31±0.07 7.01±0.12 7.43±0.06
Lipid mg/gTS 4.2±1.2 775.5±22.7 1.9±0.4
Protein mg/gTS 251.3±12.5 594.4±110.2 283.1±19.4
C/N (TOC/TN) - 5.39±1.1 64.8±4.4 7.06±0.7
Table 2. Characteristics of the substrate mixtures used in the following variants of the experimental work.
Parameter Unit Variant 1 Variant 2 Variant 3 Variant 4
Total solids (TS) mg/gFM 49.1±1.8 50.8±2.5 52.6±2.3 54.3±1.9
%FM 4.91±0.18 5.08±0.25 5.26±0.23 5.43±0.19
Mineral solids (MS) mg/gFM 13.3±1.2 13.2±1.6 13.1±1.4 12.4±1.5
%TS 27.1±0.8 25.98±0.9 24.90±0.8 22.83±0.7
Volatile solids (VS) mg/gFM 35.8±1.2 37.6±1.6 39.4±1.4 41.9±1.5
%TS 72.9±1.1 74.02±1.9 75.10±2.0 77.17±1.8
Total nitrogen (TN) mg/gTS 40.2±5.8 42.0±3.8 43.9±4.4 46.3±6.5
Total carbon (TC) mg/gTS 297.2±4.5 592.3±28.4 887.3±21.5 1280±42.2
Total organic carbon (TOC) mg/gTS 216.7±4.1 415±15.2 613.2±20.3 877±22.3
Total inorganic carbon (IC) mg/gTS 80.5±1.1 177.3±9.5 274.1±8.8 403±9.7
pH - 7.31±0.07 7.27±0.06 7.19±0.11 7.11±0.07
Lipids mg/gTS 4.2±1.2 29.9±2.1 55.6±4.8 89.9±4.2
Proteins mg/gTS 251.3±12.5 262.7±13.3 274.1±14.6 289.4±18.4
C/N (TOC/TN) - 5.39±1.1 9.88±1.9 13.96±2.2 18.94±2.6
Disclaimer/Publisher’s Note: The statements, opinions and data contained in all publications are solely those of the individual author(s) and contributor(s) and not of MDPI and/or the editor(s). MDPI and/or the editor(s) disclaim responsibility for any injury to people or property resulting from any ideas, methods, instructions or products referred to in the content.
Copyright: This open access article is published under a Creative Commons CC BY 4.0 license, which permit the free download, distribution, and reuse, provided that the author and preprint are cited in any reuse.
Alerts
Prerpints.org logo

Preprints.org is a free preprint server supported by MDPI in Basel, Switzerland.

Subscribe

© 2025 MDPI (Basel, Switzerland) unless otherwise stated