
Submitted:
26 January 2024
Posted:
30 January 2024
You are already at the latest version
Abstract
Recently, volatile organic compounds (VOCs) have been shown to act as precursors of secondary organic particles that react with ultraviolet rays in the atmosphere and contribute to photochemical smog, global warming, odor, and human health risks, highlighting the importance of VOC management. In this study, we measured VOC concentrations in various contexts including industrial and residential areas of Bucheon, Korea, through mobile laboratory and proton-transfer-reaction time-of-flight mass spectrometry methods to determine winter VOC concentrations, visualized the data based on spatial information, and used the results to develop an air quality management plan. For this purpose, global information system (GIS)-based air quality data and various environmental variables were comprehensively reviewed to assess spatial and temporal concentrations in three dimensions rather than in tables and graphs. Among VOCs, the levels of toluene, methanol, and n+i-butene were relatively high, with average concentrations of 48.3 ± 67.2, 34.4 ± 102.7, and 32.6 ± 57.7 ppb, respectively, at the end of the working day. The highest concentrations occurred near the Ojeong Industrial Complex. Mobile pollution sources are also a major driver of VOCs, highlighting the necessity of comprehensively reviewing traffic variables such as road level, estimated traffic volume, and average speed when identifying hotspots of air pollution. GIS-based visualization analysis techniques will improve the efficiency of air quality management.
Keywords:
Geographic information system
; hotspot analysis
; mobile laboratory
; spatiotemporal distribution characteristics
; volatile organic compounds
1. Introduction
In Korea, the Clean Air Policy Support System identifies nine air pollutants (total suspended particulates, ultrafine dust [PM2.5], fine dust [PM10], sulfur oxides [SOx], nitrogen oxides [NOx], volatile organic compounds [VOCs], ammonia [NH3], carbon monoxide, and black carbon) originating from point, surface, and mobile pollution sources annually in Korea. According to the National Fine Dust Information Center of the Ministry of Environment, based on calculated national air pollution emissions in 2021, the total emissions of VOCs were 1,002,810 tons, with Gyeonggi Province accounting for approximately 20% at 188,789 tons, the highest proportion [1]. In particular, based on emissions from 2016 to 2021, the implementation of the Comprehensive Fine Dust Management Plan and the 2nd Fine Dust Seasonal Management System resulted in decreased emissions of PM2.5, SOx, and NOx, whereas VOC and NH3 emissions increased. These increases were attributed to increased usage of paints for ships and construction.
Major anthropogenic sources of VOCs include automobiles, painting facilities, oil reservoirs, gas stations, the printing and ink industries, wastewater treatment plants, road paving, and agriculture. In particular, emissions related to the use of organic solvents, including the painting of automobiles and ships, account for 50% of total emissions, whereas emissions of automobile-related mobile pollutants account for 13.5% [2,3,4,5]. VOCs, air pollution-causing substances that deteriorate air quality, are hydrocarbon compounds that readily volatilize into the air in the forms of ozone and secondary aerosol precursors, contribute to climate change, worsen air quality, and pose risks to human health [6,7,8,9]. Among VOCs, benzene, formaldehyde, and 1,3-butadiene are classified as carcinogens, and acetaldehyde, acrylonitrile, chloroform, and 1,2-dichloroethane are managed as specific air pollutants. VOCs in the human body can cause drowsiness, difficulty breathing, vomiting, nausea, abdominal cramps, unconsciousness, suffocation, lung cancer, leukemia, central nervous system disorders, asthma, and emphysema [10,11,12,13,14]. Accordingly, the importance of VOC management has recently been highlighted due to its impact on air pollution [15].
Bucheon is a megacity connected to Seoul and Incheon in Gyeonggi Province, where the combination of exhaust from automobiles and pollutants emitted from production processes within industrial complexes is worsening urban air quality. In a 2007 survey, Bucheon was found to have a VOC concentration of 71.916 ppb, the highest in Gyeonggi Province, due to its high level of industrial activities. However, in areas with diverse emission characteristics, investigating the emission sources can be challenging [16]. Five air pollution measurement stations are located in Bucheon (4 urban air quality monitoring system [AQMS] and 1 roadside air quality monitoring system [RAQMS]), which obtain 10 types of air quality measurements in real time. However, although these fixed measurement networks can analyze the impact of air pollution on a single receptor at a given location, they have limitations in examining broader impacts on the surrounding area and accurately identifying mixed pollutants. Recently, mobile laboratories (MLs) have been used to supplement this network. Many local governments in Korea are expanding the use of ML vehicles and drones to monitor air quality in areas without existing monitoring stations. However, the collected data are often not effectively visualized [17].
Many previous studies have been conducted using ML methods to examine the concentrations and spatial distributions of VOCs in urban areas, and around petrochemical complexes and publishing complexes [6,10,13,16]. However, to date, no comprehensive air pollution management strategy has been implemented using geographic information system (GIS)-based data visualization or digital twin-based models and environmental data, which have been recently developed.
This study is the first to visualize the relationship between ML-based time-series data and environmental factors that can affect VOCs using GIS-based spatiotemporal analysis. Bucheon comprises residential, industrial, and industrial settings, and this study will support policy decision-making by identifying hotspots and areas requiring intensive management through visualization of the factors that can affect VOCs as well as their spatial and temporal patterns. This study also aims to demonstrate that GIS-based air quality management is essential in some contexts.2. Materials and Methods
The Materials and Methods should be described with sufficient details to allow others to replicate and build on the published results. Please note that the publication of your manuscript implicates that you must make all materials, data, computer code, and protocols associated with the publication available to readers. Please disclose at the submission stage any restrictions on the availability of materials or information. New methods and protocols should be described in detail while well-established methods can be briefly described and appropriately cited.
Research manuscripts reporting large datasets that are deposited in a publicly available database should specify where the data have been deposited and provide the relevant accession numbers. If the accession numbers have not yet been obtained at the time of submission, please state that they will be provided during review. They must be provided prior to publication.
Interventionary studies involving animals or humans, and other studies that require ethical approval, must list the authority that provided approval and the corresponding ethical approval code.
2. Materials and Methods
2.1. Research site
As of 2020, Bucheon, Korea, has an area of 53.4 km2, a population of 831,701, and a population density of 15,575 people/km2. Bucheon has the highest population density in Gyeonggi Province, and contains a high concentration of residential, industrial, and industrial facilities. Bucheon is located between Seoul and Incheon, adjacent to the Gyeongin Expressway and the Capital Region First Ring Expressway, with a traffic volume of 3.3 million people per day, which is very high relative to its population. Four AQMS stations (Nae-dong, Sosabon-dong, Ojeong-dong, and Jung 2-dong) and one RAQMS station (Songnae-daero) are located in Bucheon. These stations measure a total of 10 air quality characteristics.
The target site for this study was adjacent to the Gyeongin Expressway and First Ring Expressway in the metropolitan Bucheon area, as well as to the Naedong AQMS station and Songnae-daero RAQMS station. A survey route was selected near industrial areas and major roads that may impact VOCs. Figure 1
2.2. Experimental methods
2.2.1. Mobile laboratory
We used an ML to obtain location information and measure air pollutants (Figure 2). MLs enable real-time measurement of the spatiotemporal distributions and concentrations of air pollutants within a target area. However, the time delay between the flow of pollutants into the inlet and measurement, non-uniform absorption due to the physical characteristics of different pollutants, and separation from Global Positioning System (GPS) data due to equipment sensitivity may affect the results [16,18,19,20,21,22].
In this study, proton-transfer-reaction time-of-flight mass spectrometry (PTR-ToF-MS; Ionicon Analytik, Innsbruck, Austria), which can acquire and analyze data on individual VOCs in real time, was used as the main measurement technology. PTR-ToF-MS analyzes VOCs through the proton transfer reaction; compared to gas chromatography-mass spectrometry (GC-MS), this method has the advantage of analyzing the concentrations of individual VOCs in the air in seconds without sample collection or pretreatment. In general, when using GC-MS for VOC analysis, significant time is required for pre-processing prior to analysis. In contrast, PTR ToF-MS analysis is completed within 1 s, without pre-processing. This method presents measurement results in practical units, making it highly suitable for mobile measurement [23,24,25,26]. We used a GPS device to determine the spatial coordinates of each measurement collected during vehicle movement to prevent measurement errors due to time differences among measurement devices.

Table 1.
Measurements collected and instruments used in this study. GPS, Global Positioning System; PTR-ToF-MS, proton-transfer-reaction time-of-flight mass spectrometry; VOC, volatile organic compound.
Table 1.
Measurements collected and instruments used in this study. GPS, Global Positioning System; PTR-ToF-MS, proton-transfer-reaction time-of-flight mass spectrometry; VOC, volatile organic compound.
| Measurement | Instrument | Unit | Interval |
|---|---|---|---|
| Latitude, longitude | GPS | ° | 1 s |
| Elevation | GPS | m | |
| Speed | GPS | km/h | |
| VOCs | PTR-ToF-MS | ppb | 6 s |
The ML vehicle was remodeled after approval of the structural changes. The vehicle was equipped with a PTR-ToF-MS instrument and a generator for measuring individual VOCs. At vehicle speeds of 0–70 km/h, we confirmed that vehicle speed caused changes of less than 0.8–2.0%; therefore, measurements in traffic were conducted within this speed range whenever possible [27].
2.2.2. Target substances
In this study, 16 major pollutants were selected; information about each substance is summarized in Table 2. For each target material, calibration was performed using standard samples and high-purity clean air prior to measurement, and the equipment was confirmed to be operating normally through fixed measurements.
2.2.3. Measurement procedure
Mobile measurements were taken along a predetermined route, which started and ended at the Bucheon Technopark in Yakdae-dong; prior to operation, the equipment was inspected and the battery was charged. Beginning at the Technopark, the route passed through Gyenam Park and the Eugene ready-mixed concrete complex, and near Songnae-daero, Gilju-ro, Gyenam-ro, and the Gyeongin Expressway. The route was 19.3 km in length, and took about 1 h to complete.
An analysis of seasonal concentrations showed that VOC concentrations were highest in winter; therefore, this study was conducted on December 6 and 7. Seven sets of moving measurements (five on December 6, two on December 7) were conducted during regular commuting and working hours. The driving speed was maintained at approximately 20–30 km/h.
2.2.4. GIS analysis
We used the open-source software QGIS ver. 3.32 to analyze the spatiotemporal distribution of air pollution in Bucheon. GIS analysis was conducted using the GPS-derived coordinates of the ML along with time and concentration data for the measured pollutants.
Most VOCs occur in gaseous form, and organic solvent use such as painting accounts for the largest portion of VOC emissions. Another important emission source is automobile-related pollutants released during travel. Accordingly, data such as road information, vehicle speed (average speed in congested traffic and maximum speed), and traffic volume were collected and included as variables in our analysis. For traffic volume, we used publicly available data from the Korea Transport Institute national transport database, View-T (Figure 4).
3. Results
3.1. Concentration distribution of VOCs
The measurement period was during winter, when the average temperature was 6.4 ± 3.8°C, humidity was 60.6 ± 13.7%, and wind speed was 0.4 ± 0.3 m/s. The path of the ML included a mixture of residential and industrial areas, and Table 3 presents the fixed observation data, excluding moving observations. In this study, stationary measurements were performed from the ML at Bucheon Techno Park in Yakdae-dong.
Among VOCs, benzene is the subject of environmental standards, with an annual average of 1.5 ppb as the national standard. However, the average concentration observed in fixed measurements over the entire measurement period was approximately 2 ppb, which was above the standard. The concentrations of VOCs measured during the fixed measurement period decreased in the order of methanol > toluene > n+i-butene. Overall, methanol accounted for 17.0%, toluene for 16.5%, and n+i-butene for 12.3% of total VOCs (Table 3). Developed countries such as the United States, United Kingdom, and Japan have set environmental standards for VOCs since 1990 [28], and Korea has introduced annual average standards for benzene.
This study did not target specific complexes, and instead examined the spatial and temporal distributions of various VOC types in the city center using the ML. Among VOCs, benzene, which is subject to an environmental standard in Korea, was found to exceed the annual average criterion of 1.5 ppb during the measurement period. On December 6, the benzene concentration was high during working hours, and on December 7, it was high in the morning. Between 09:00 and 10:30, the benzene level was more than three times the annual average threshold. VOC concentrations measured during the movement of the ML decreased in the order of toluene > methanol > n+i-butene. When measured statically, methanol had a higher concentration than toluene, but when measured from the moving ML, the opposite pattern was observed. The concentrations of each VOC type at each measurement period are presented in Table 4. Most studies to date have shown that VOC concentrations are high in winter, and this study examined the temporal and spatial distributions of VOCs during the winter period.
3.2. Spatiotemporal patterns of VOC concentrations
Local air management for VOCs requires the identification of substances with the greatest environmental and health importance. In this study, among 16 substances measured, three substances with high concentrations and one substance that met the applicable atmospheric standard were included in spatial analysis (Figure 5, Figure 6, Figure 7 and Figure 8). Measurements were made in 1-s increments during the movement of the ML. Because the measurement points were too densely spaced to visualize the observations in 1-s increments, the results were displayed using GIS after averaging over 10-s increments.
Toluene, which accounted for a large proportion of VOCs in this study, is a representative VOC emitted into the atmosphere from anthropogenic activities. Toluene decomposes in the air through reaction with optically generated OH radicals. The concentration of toluene increases in the presence of vehicle emissions, and exhibits large increases in areas of direct use, such as industrial processes and solvent treatments. In particular, the proportion of toluene is high when the contribution from automobile exhaust is large [29]. We found that toluene concentrations were relatively high when the ML traveled the Gyeongin National Road and passed through the Ojeong Ready-Mixed Concrete Industrial Complex, and particularly elevated during off-peak hours (Figure 5e).
The highest average toluene concentration was 48.3 ± 67.2 ppb, observed during the period when people were leaving work. However, the spatial and temporal distribution of toluene during mobile measurements, in contrast to the average value, had a maximum of 640.64 ppb and minimum of 1.93 ppb (Figure 5). Visual assessment of areas with low toluene levels allowed us to identify the regional characteristics that cause variations in the toluene concentration.
Methanol had the second-highest average concentration among VOCs. Methanol is particularly toxic to humans and can cause destruction of the optic nerve and permanent visual impairment. Like toluene, the average concentration of methanol was highest while most people were leaving work, at 34.4 ± 102.7 ppb. However, assessing the spatial and temporal distribution using GIS with moving measurements, in contrast to simply using the average value, showed that the highest concentration reached 1242.43 ppb and the lowest was 7.01 ppb (Figure 6). Thus, we were able to visually determine which regions had the highest and lowest concentrations. Management measures for VOCs must be established based on analysis of the results according to regional characteristics rather than simply confirming that the average concentration is high. Therefore, we examined the spatial and temporal distributions of VOC concentrations based on GIS analysis.
The substance with the third-highest concentration was n+i-butene. A relatively high average concentration was observed during work hours, at 32.6 ± 57.7 ppb. However, assessing the spatial and temporal distribution using GIS with moving measurements, in contrast to simply using the average value, showed that the highest concentration reached 670.98 ppb and the lowest was 3.91 ppb (Figure 7). Thus, results are available for each point along the ML route, allowing us to determine which regions had the highest and lowest concentrations.
In addition to the three high-concentration substances noted above, benzene, which is subject to an environmental standard, was also measured. The air quality standard for benzene is an annual average concentration of 1.5 ppb, and the highest average concentration measured in this study was 5.0 ± 10.3 ppb. The average concentrations of the seven measurement periods consistently exceeded the air quality standard. Based on the spatial and temporal distribution obtained using GIS, we visually confirmed that the lowest concentration was 0.54 ppb and the highest concentration reached 77.92 ppb (Figure 8). Benzene is highly volatile and disperses very quickly in air, leading to exposure via the respiratory tract. Benzene is a carcinogen, and exposure to high concentrations can cause blood cancers such as leukemia. Additionally, short-term exposure to high benzene concentrations can affect the nervous system, causing dizziness, headaches, confusion, and unconsciousness, and eye and skin irritation. Long-term exposure reduces white blood cell and red blood cell levels, causing anemia and lowering immunity. Accordingly, rather than presenting benzene levels in a simple table, management measures should be developed based on visualization of regional concentrations, allowing for immediate confirmation.
3.3. GIS-based pollution hotspot analysis
In Bucheon, the Gyeongin Expressway passes through Songnae-dong, Simgokbon-dong, Sosabon-dong, and Goean-dong. During ML measurement, the concentration of VOCs generated on the road was measured while traveling along a route that included the entirety of the residential and industrial areas in the study region. In this study, hotspot analysis was performed on three VOCs found in high concentrations and one substance covered by air quality standards based on average speed and expected traffic volume.
As automobile-related mobile pollutant emissions are a major source of VOCs, we investigated the effects of traffic volume and average travel speed on toluene concentrations. As the average concentration (48.3 ± 67.2 ppb) was high in the evening, hotspots were identified through analysis of the spatial pattern of toluene concentrations using evening data. We identified hotspots of toluene levels during rush hour in congested road sections that had average traffic speeds ranging from 0 to 30 km/h. The maximum toluene concentration during the off-hours was very high, at 521.64 ppb. Comparison of the estimated traffic volume and toluene concentration confirmed that traffic volume increased to 1,253–1,895 vehicles/day where the toluene concentration was high (Naedong and Gyeongin-ro intersection) (Figure 9). The proportion of toluene was high when the contribution of automobile exhaust gases was high, emphasizing the importance of pollution mitigation measures that account for traffic volume and average traffic speed.
For methanol, which had the second-highest concentration, we investigated the effects of traffic volume and average travel speed on its concentration. As the average concentration (34.4 ± 102.7 ppb) was high in the evening, hotspots were identified based on the spatial pattern of toluene concentration during the evening. We identified hotspots of methanol during rush hour in congested road sections that had average traffic speeds ranging from 0 to 30 km/h. In particular, frequent movement of ready-mix concrete vehicles toward the Ojeong Industrial Complex was observed in these areas. Comparison of the estimated traffic volume and methanol concentration confirmed that traffic volume increased to 1,253–1,895 vehicles/day in areas with high methanol concentrations (Ojeong Industrial Complex) (Figure 10). To manage the concentration of VOCs among automobile-related pollutants, comprehensively considering factors such as traffic volume is essential.
For n+i-butene, which had the third-highest concentration, we investigated the effects of traffic volume and average travel speed on its concentration. As the average concentration (32.6 ± 57.7 ppb) was high in the evening, hotspots were identified through analysis of the spatial pattern of n+i-butene concentrations in evening data. We identified hotspots of n+i-butene during rush hour on congested road sections with average traffic speeds ranging from 0 to 30 km/h. Movement of ready-mix concrete vehicles in the direction of Ojeong Industrial Complex was extensive, and the concentration was high at the Naedong-Gyeongin-ro intersection. Comparing the estimated traffic volume and n+i-butene concentration confirmed that the maximum traffic volume reached 1,253–1,895 vehicles/day (Figure 11).
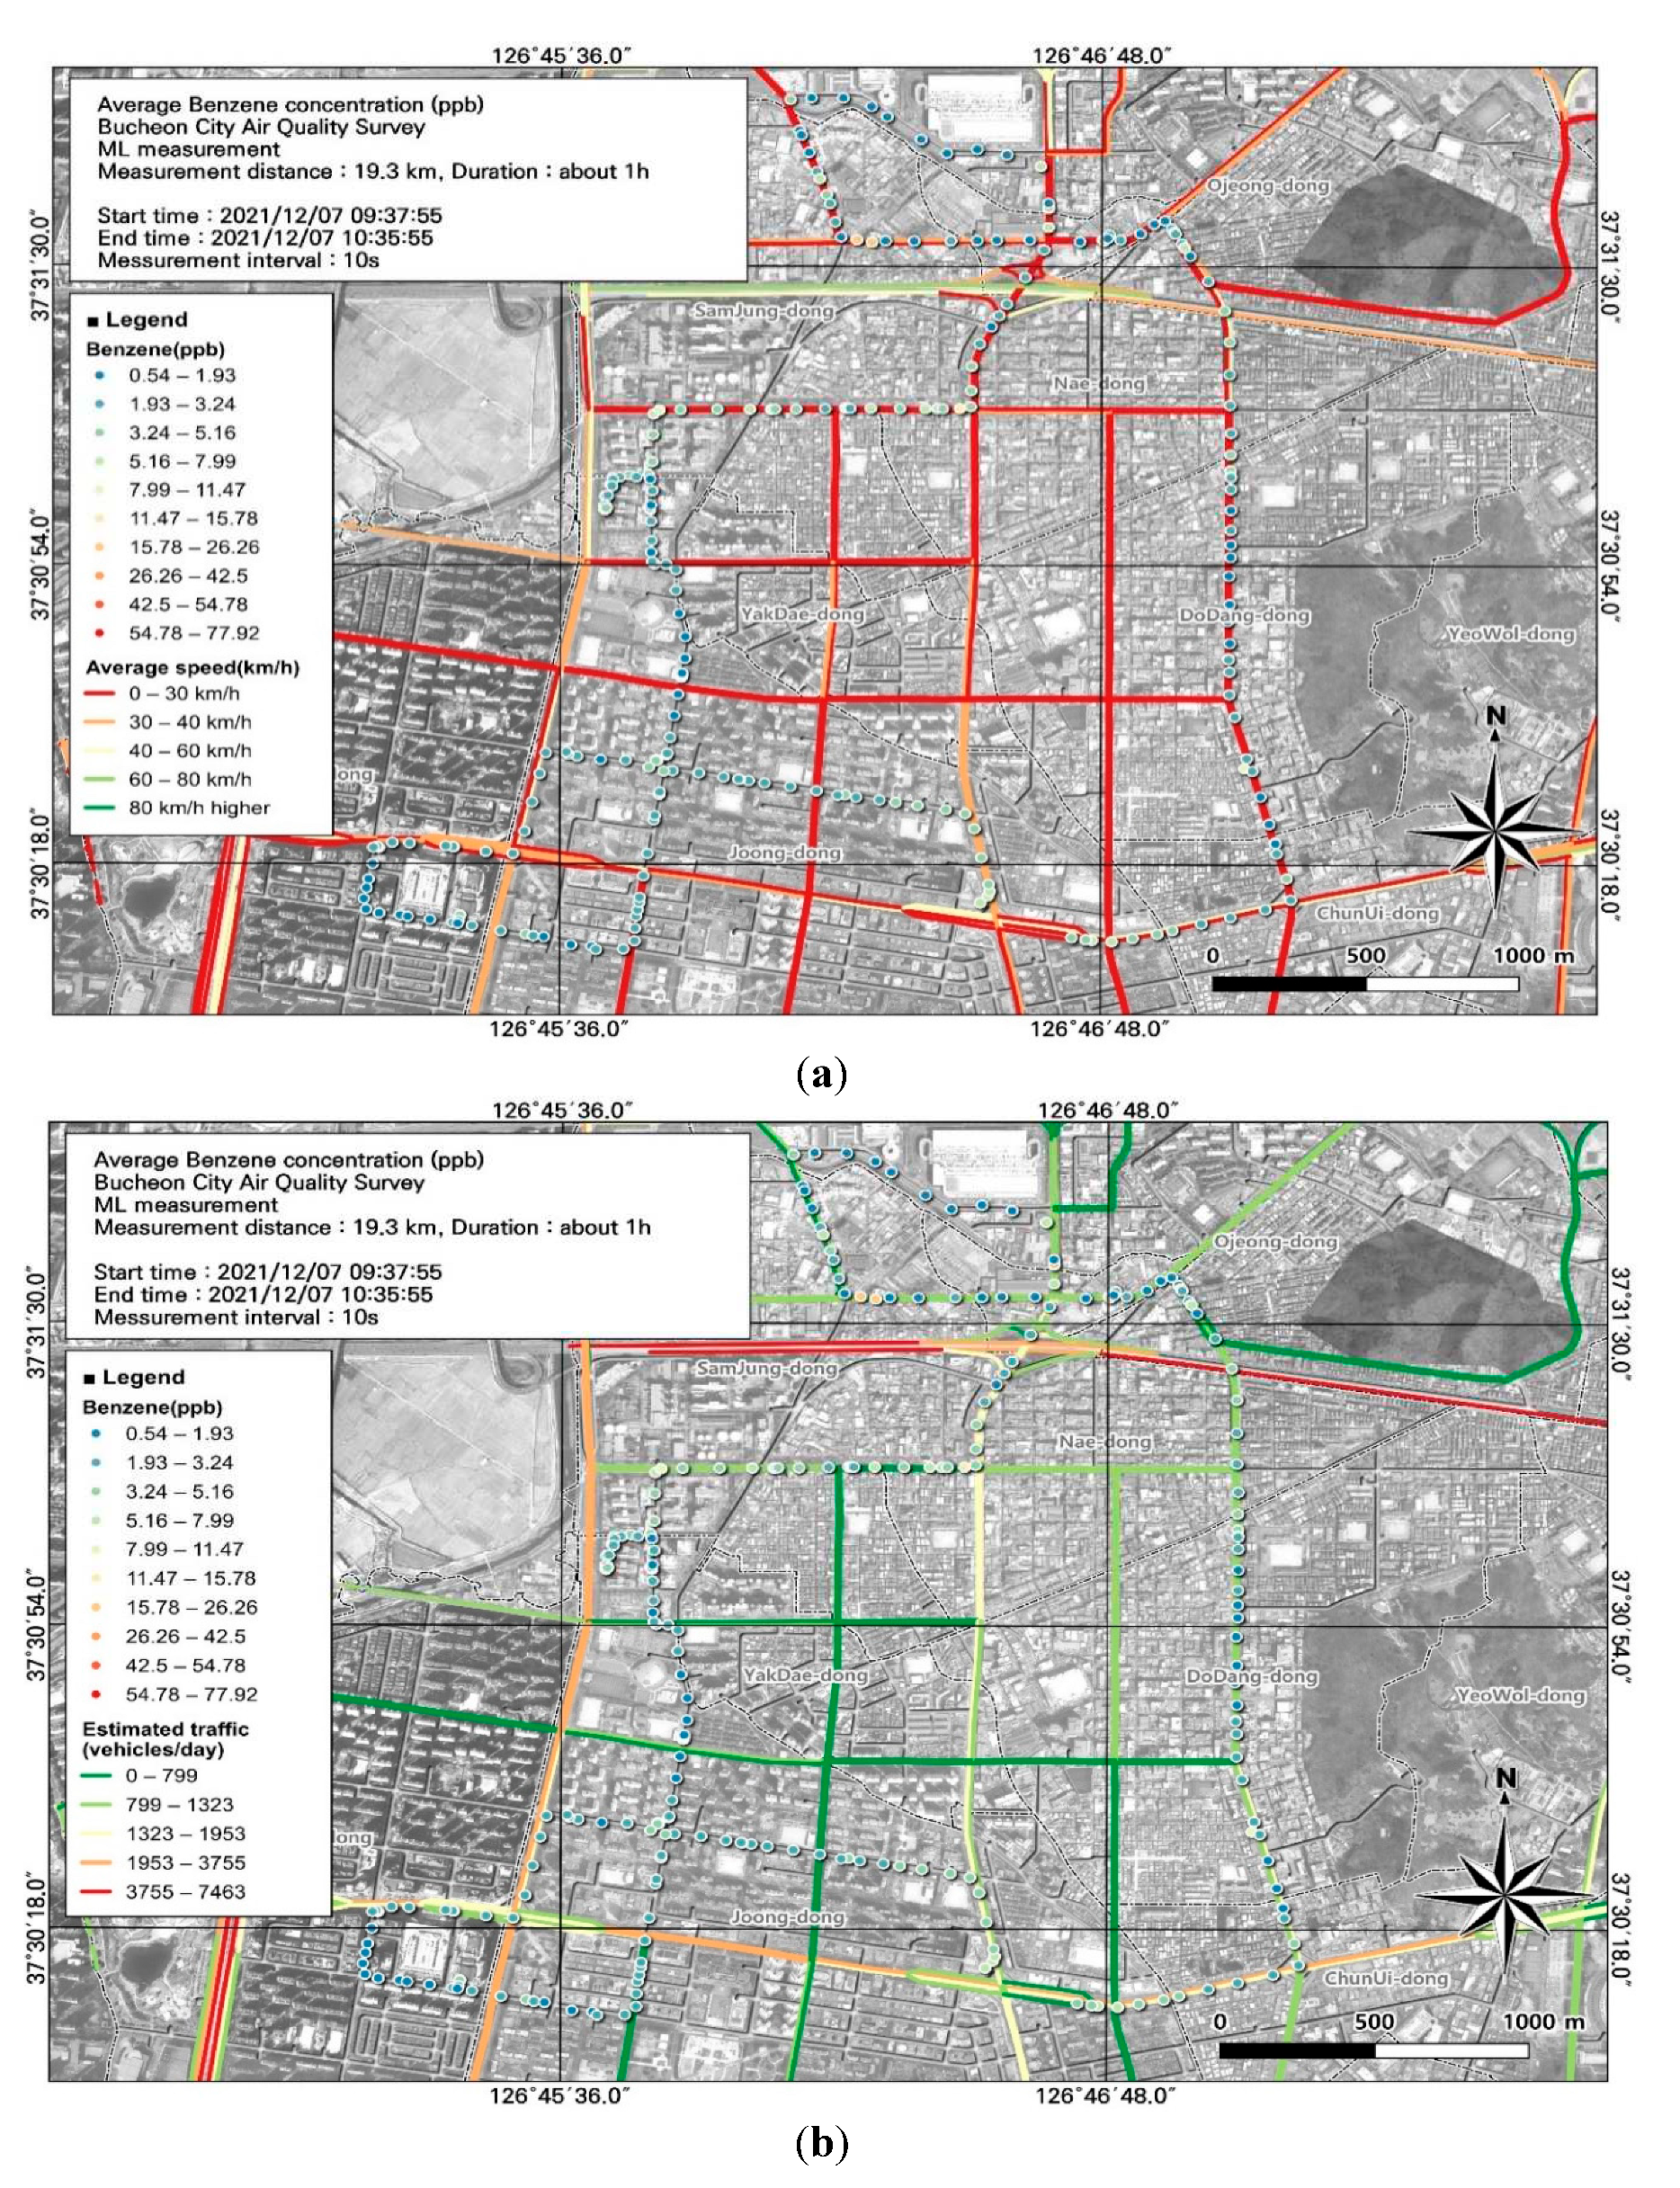
Benzene is a VOC included in air quality standards, and is generally considered a marker of automobile exhaust gas and evaporative emissions. Therefore, the effects of estimated traffic volume and average travel speed in a road section on benzene concentration was investigated. Hotspots were identified based on the spatial pattern of benzene concentrations using data with a relatively high average concentration (5.0 ± 10.3 ppb) collected during the study period. We identified hotspots of benzene during rush hour in busy road sections with average traffic speeds of 0 to 30 km/h. The Naedong-Gyeongin-ro intersection and the Ojeong Industrial Complex area had benzene concentrations above 1.5 ppb, which is the air quality standard. Comparing the estimated traffic volume and benzene concentration confirmed that traffic volume increased from 799 to 1,323 vehicles per day at the Naedong-Gyeongin-ro intersection and the Ojeong Industrial Complex, where benzene concentrations were high. In particular, as air quality standards are being proposed for benzene, management measures should be formulated using GIS-based spatial and temporal distribution data.
Figure 12.
Associations of VOC (benzene) concentrations with (a) average traffic speed and (b) estimated traffic volume during the morning rush hour, corresponding to Figure 7g.
Figure 12.
Associations of VOC (benzene) concentrations with (a) average traffic speed and (b) estimated traffic volume during the morning rush hour, corresponding to Figure 7g.
Our findings highlight the need to target and continuously manage road sections with high concentrations of VOCs that are harmful to humans. Studies to date have generally examined only the ratio and average concentration of each VOC type. Pollution emitted by automobiles is a source of VOCs, making it necessary to identify pollution hotspots based on spatiotemporal analysis of traffic-related variables and to reflect those hotspots in air management policies. In this study, the concentration of each VOC type was determined, and substances with high concentrations were visualized and reviewed. In future research, comprehensively reviewing various factors such as regional factors, traffic variables, and environmental variables to visualize GIS-based air quality management measures will be essential. Many local governments are currently using MLs to collect air quality data in real time; however, simply considering the average values limits identification of the source area and establishment of efficient management measures. To address this limitation, GIS-based air quality management plans must be established.
4. Discussion and conclusion
Bucheon has the highest population density among the regions of Gyeonggi Province, and contains industrial facilities and complexes in its downtown area. For these reasons, VOC types become mixed and are discharged at high concentrations. In general, determining the level of pollution according to the discharge characteristics of pollutants is important, but most surveys of regional concentration levels use static process testers, and only representative concentrations for AQMS and RAQMS can be obtained. In particular, VOCs are highly volatile, which allows them to be and easily diluted and diffused when released into the atmosphere. Accordingly, to establish management measures for this area, confirming the spatial and temporal distribution of VOCs in the target area and developing air quality management measures based on information about the spread of those substances are essential. Therefore, this study used an ML to collect data for analysis using PTR-ToF-MS, which supports real-time measurement in seconds along routes passing through residential and industrial areas.
This study was conducted in winter (December), when VOC concentrations are seasonally high. Bucheon, the target area, is a city in Gyeonggi Province with total daily average traffic volume of 20,000 vehicles as of 2019, and changes in the concentration of VOCs associated with mobile pollution sources were examined. Because Bucheon is densely packed with industrial complexes, its VOC concentrations are high. We determined the concentrations of individual VOCs using PTR-ToF-MS, which can acquire and analyze ML and VOC data in real time.
We confirmed that the average concentration of toluene, methanol, and n+i-butene were 48.3 ± 67.2, 34.4 ± 102.7 ppb, and 32.6 ± 57.7 ppb, respectively. The concentrations of these VOCs were particularly high during work hours. Spatially, pollutant concentrations were elevated on specially managed roads within the study area, and due to the highly volatile nature of VOCs, concentrations were high on roads around the Ojeong Industrial Complex. GIS-based visualizations of road level, traffic volume (average and during congested traffic), and pollution level data overlaid with estimated traffic volume allowed us to identify pollution hotspots. As GIS can be used to spatially analyze various environmental, traffic, and topographic variables, air quality management measures can be established that consider the spatial and temporal distribution of VOCs in the region. In particular, VOCs, which are precursors of ozone and secondary aerosols, appear to worsen air quality and pose hazards to the human body, and therefore management measures based on spatiotemporal analysis are necessary.
In this study, we used an ML to measure real-time VOC concentrations and individual VOC characteristics to identify high-concentration areas. Among VOCs, only benzene is currently reviewed in terms of air quality standards, but other VOCs require similar analysis. Previously, only the ratio and average concentration of each VOC type were assessed; therefore, this study is significant in that it derived results through the visualization of spatial and temporal pollutant distributions by overlaying maps of time-series data and traffic variables. Many local governments are currently using MLs to measure road pollution; to make accurate decisions based on the resulting scientific data, GIS-based analysis of air quality measurements collected in the field is needed. Through such analysis, it will be possible to identify areas with high levels of pollution and contribute to source determination based on the characteristics of highly volatile VOCs. In the future, we plan to expand this study and conduct further analysis and comparison of pollutants in various regions.
The English in this document has been checked by at least two professional editors, both native speakers of English. For a certificate, please see: http://www.textcheck.com/certificate/ZYaeuX
References
- AuthorMinistry of Environment, 2021. National Air Pollutants Emission 2011 (in Korean).
- Scheff, P. A. and Wadden, R. A., Receptor modeling of volatile organic compounds: Emission inventory and validation, Environmental Science & Technology 1993, 27, 617–625. [Google Scholar]
- Bloemen, H. J. T. and Burn, J. Chemistry and Analysis of Volatile Organic Compounds in the Environment. Chapman & Hall: London, 1993. [Google Scholar]
- Kim, J. C. Trends and control technologies of volatile organic compound. Korea J Atmos Environ 2006, 22, 743–757. [Google Scholar]
- Kim, D. G., Song. Concentration distribution of toxic volatile organic hydrocarbons in Gyeonggi-do’s atmosphere. J Korean Society for Environmental Analysis (in Korean). 2018, 21, 11–23. [Google Scholar]
- Lee, D. S., Kim. A study on distribution of volatile organic compounds concentration over Paju national publishing complex. J Korean Society for Atmospheric Environment 2022, 38, 599–609. [Google Scholar] [CrossRef]
- Godish, T., Davis. Air Quality, 5th ed; 2017; CRC Press/ Lewis Publishers: Boca Raton. [Google Scholar]
- Soni, V. , Singh, P., Shree, V., Goel, V., 2018. Effects of VOCs on human health, In: Air Pollution and Control. Ed. by N. Sharma, A. K. Agarwal, P. Eastwood, T. Gupta, & A. P. Singh, Gateway East: Springer Singapore, pp. 119-142. [CrossRef]
- Seinfeld, J. H., Pandis. Atmospheric Chemistry and Physics: From Air Pollution to Climate Change (3rd ed.).; John Wiley & Sons: Hoboken, 2016. [Google Scholar]
- Kim, C. H., Kim. A study on temporal–spatial characteristics of volatile organic compounds distributed near a petrochemical industrial complex using PTR-ToF-MS. J Korean Society for Atmospheric Environment 2021, 37, 812–828. [Google Scholar] [CrossRef]
- Molhave, L. , 1991. Volatile organic compounds: Indoor air quality and health, IndoorAir, 1(4), 357–376. [CrossRef]
- Son, B. , Breysse, P., Yang, W., 2003. Volatile organic compounds concentration in residential indoor and outdoor and its personal exposure in Korea, Environment International, 29(1), 79–85. [CrossRef]
- Park, S. C. Kim, J. B., Lee, G. H., Noh, S. J., Chae, J. S., Kim, M. Y., Jeon, J. M., Lee, S. S., and Kim. J. B.Characteristics of spatial distribution VOCs around a petrochemical complex using a passive sampler. J Korean Society for Atmospheric Environment 2022, 38, 764–775. (in Korean) [Google Scholar] [CrossRef]
- Cheng, S. , Zhang, J., Wang, Y., Zhang, D., Teng, G., Chien, G. C., Huang, Q., Zhang, Y. B., Yan, P., 2019. Global research trends in health effects of volatile organic compounds during the last 16 years: A bibliometric analysis, Aerosol and Air Quality Research, 19, 1834–1843. [CrossRef]
- Liu, Y. , Shao, M., Fu, L. L., Lu, S. H., Zeng, L. M., Tang, D.G., 2008. Source profile of volatile organic compounds (VOCs) measured in China: Part I, Atmospheric Environment, 42, 6247–6260.
- Kim, J. B. Kim, C. H., Noh, S. J., Hwang, E. Y., Park, D. S., Lee, J. J., and Kim. J. H. A study on spatial distribution characteristics of air pollutants in Bucheon-si using a mobile laboratory. J Particle and Aerosol Research 2020, 17, 9–20. [Google Scholar]
- Kim, M. K. , Kim, D. H., Jang, Y. L., Lee, J. Y., Ko, S. W., Kim, K. H., Park, C. S., and Park, D. S., 2023. Determination of the spatial distribution of air pollutants in Bucheon, Republic of Korea, in winter using a GIS-based mobile laboratory, Toxics,. [CrossRef]
- Hitchins, J., Morawska. Concentration of submicrometre particles from vehicle emissions near a major road. Atmospheric Environment 2000, 34, 51–59. [Google Scholar] [CrossRef]
- Westerdahl, D., Fruin S. Mobile platform measurements of ultrafine particles and associated pollutant concentrations of freeways and residential streets in Los Angeles. Atmospheric Environment 2005, 39, 3597–3610. [Google Scholar] [CrossRef]
- Woo, D. Lee, S. B., Lee, S. J., Kim, J. Y., Jin, H. C., Kim, T. S., and Bae, G. N. Spatial distribution of on-road ultrafine particle number concentration on Naebu Express Way in Seoul during winter season. J Korean Society for Atmospheric Environment 2013, 29, 10–26. [Google Scholar] [CrossRef]
- Bossche, J. V. D. Peters, J., Verwaeren, J., Botteldooren, D., Theunis, J., and Baets, B. D. Mobile monitoring for mapping spatial variation in urban air quality: Development and validation of a methodology based on ana extensive dataset. Atmospheric Environment 2015, 105, 148–161. [Google Scholar] [CrossRef]
- Kim, K. H. Kwak, K. H., Lee, J. Y., Woo, S. H., Kim, J. B., Lee, S. B., Ryu, S. H., Kim, C. H., Bae, G. N., and Oh, I. B., Spatial mapping of a highly non-uniform distribution of particle-bound PAH in a densely polluted urban area. Atmosphere 2020, 11, 496. [Google Scholar] [CrossRef]
- Lindinger, W. Hansel, A., Jordan, A., On-line monitoring of volatile organic compounds at pptv levels by means of proton-transfer-reaction mass spectrometry (PTR-MS): Medical applications, food control and environmental research. International J Mass Spectrometry 1998, 173, 191–241. [Google Scholar] [CrossRef]
- Hansel, A. Jordan, A., Warneke, C., Holzinger, R., Lindinger, W. Improved detection limit of the proton-transfer reaction mass spectrometer: On-line monitoring of volatile organic compounds at mixing ratios of a few pptv. Rapid Communications in Mass Spectrometry 1998, 12, 871–875. [Google Scholar] [CrossRef]
- Moser, B. Bodrogi, F., Eibl, G., Lechner, M., Rieder, J., Lirk, P. Mass spectrometric profile of exhaled breath field study by PTR-MS. Respiratory Physiology and Neurobiology, 2005; 145, 295–300. [Google Scholar]
- De Gouw, J., Warneke, C. Measurements of volatile organic compounds in the Earth’s atmosphere using proton-transfer-reaction mass spectrometry. Mass Spectrometry Reviews 2006, 26, 223–257. [Google Scholar] [CrossRef] [PubMed]
- APM Engineering Co., Ltd. , 2019. Test Report of Inlet System Installed for ML.
- United State Environmental Protection Agency (U.S. EPA). 1997. Compendium Method TO17: Determination of Volatile Organic Compounds in Ambient Air Using Active Sampling onto Sorbent Tubes. 1-49.
- Zhang, Z. , Zhang, Y., Wang, X., Lü, S., Huang, Z., Huang, X., Yang, W., Wang, Y., Zhang, Q. 2016. Spatiotemporal patterns and source implications of aromatic hydrocarbons at six rural sites across China’s developed coastal regions, J Geophysical Research: Atmospheres, 121(11), 6669–6687. [CrossRef]
Figure 1.
Location of the study site and mobile laboratory (ML) route.
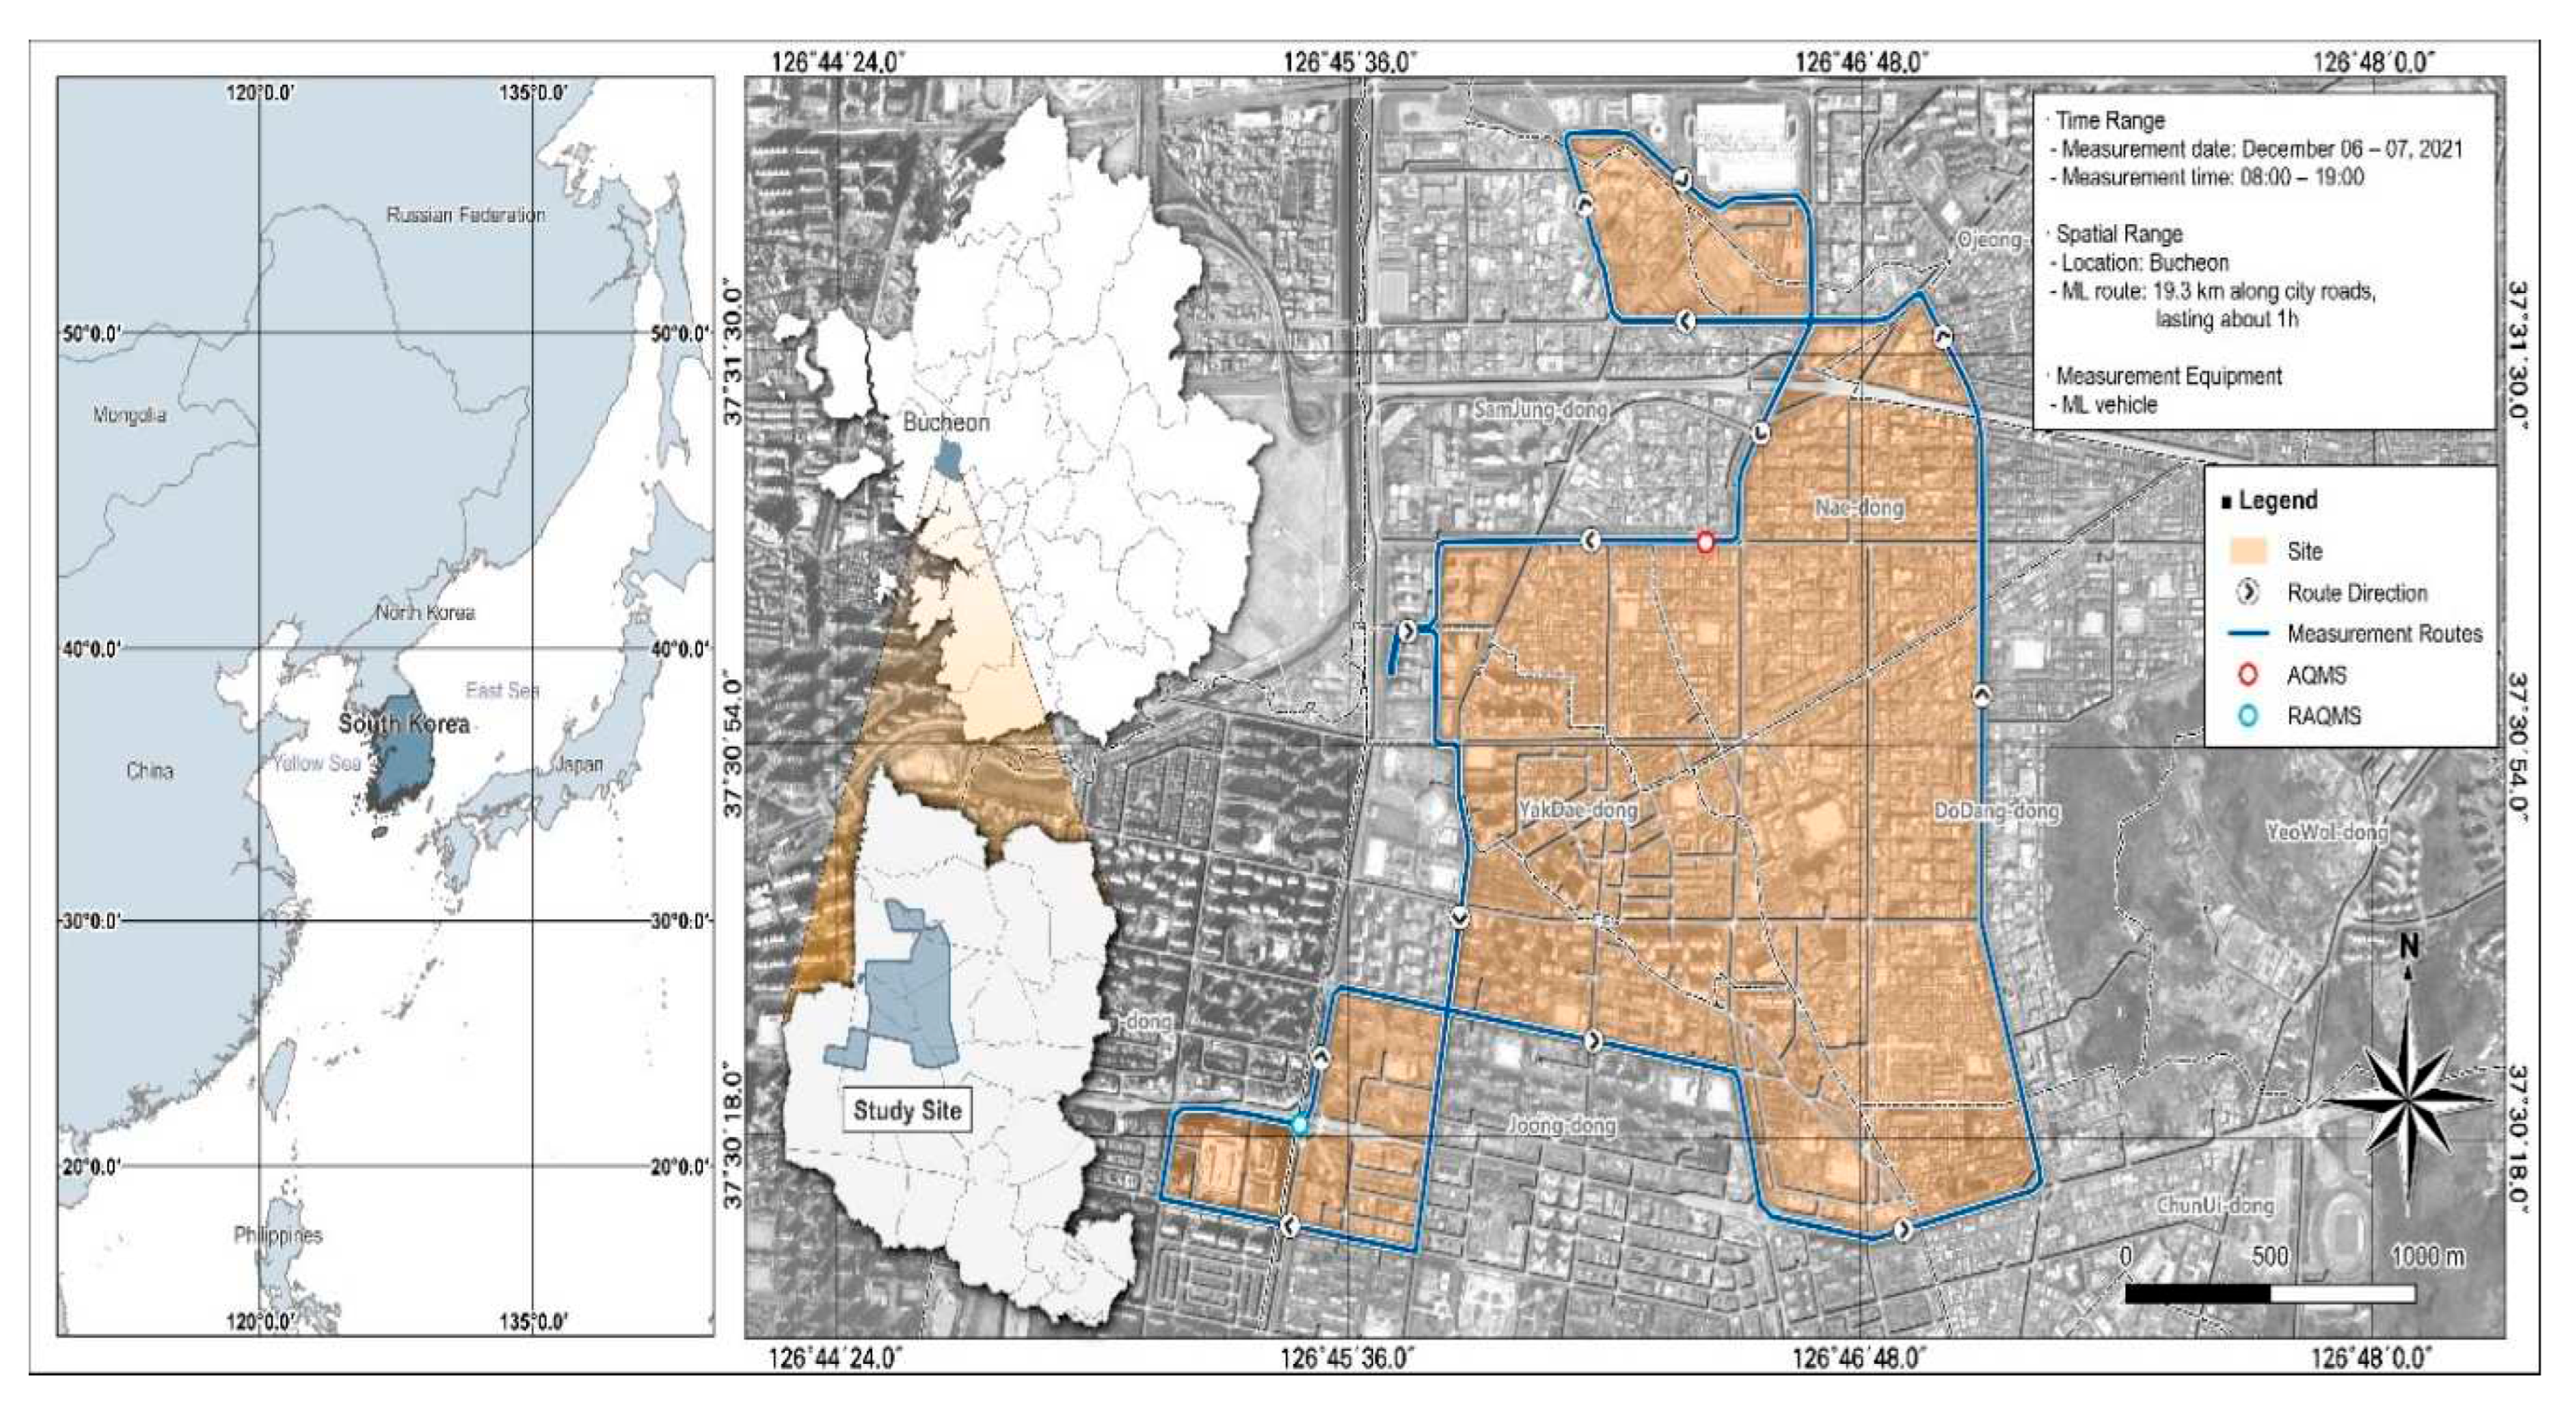
Figure 2.
Air pollution ML vehicle (left) and proton-transfer-reaction time-of-flight mass spectrometry measurement instrument (right).
Figure 2.
Air pollution ML vehicle (left) and proton-transfer-reaction time-of-flight mass spectrometry measurement instrument (right).
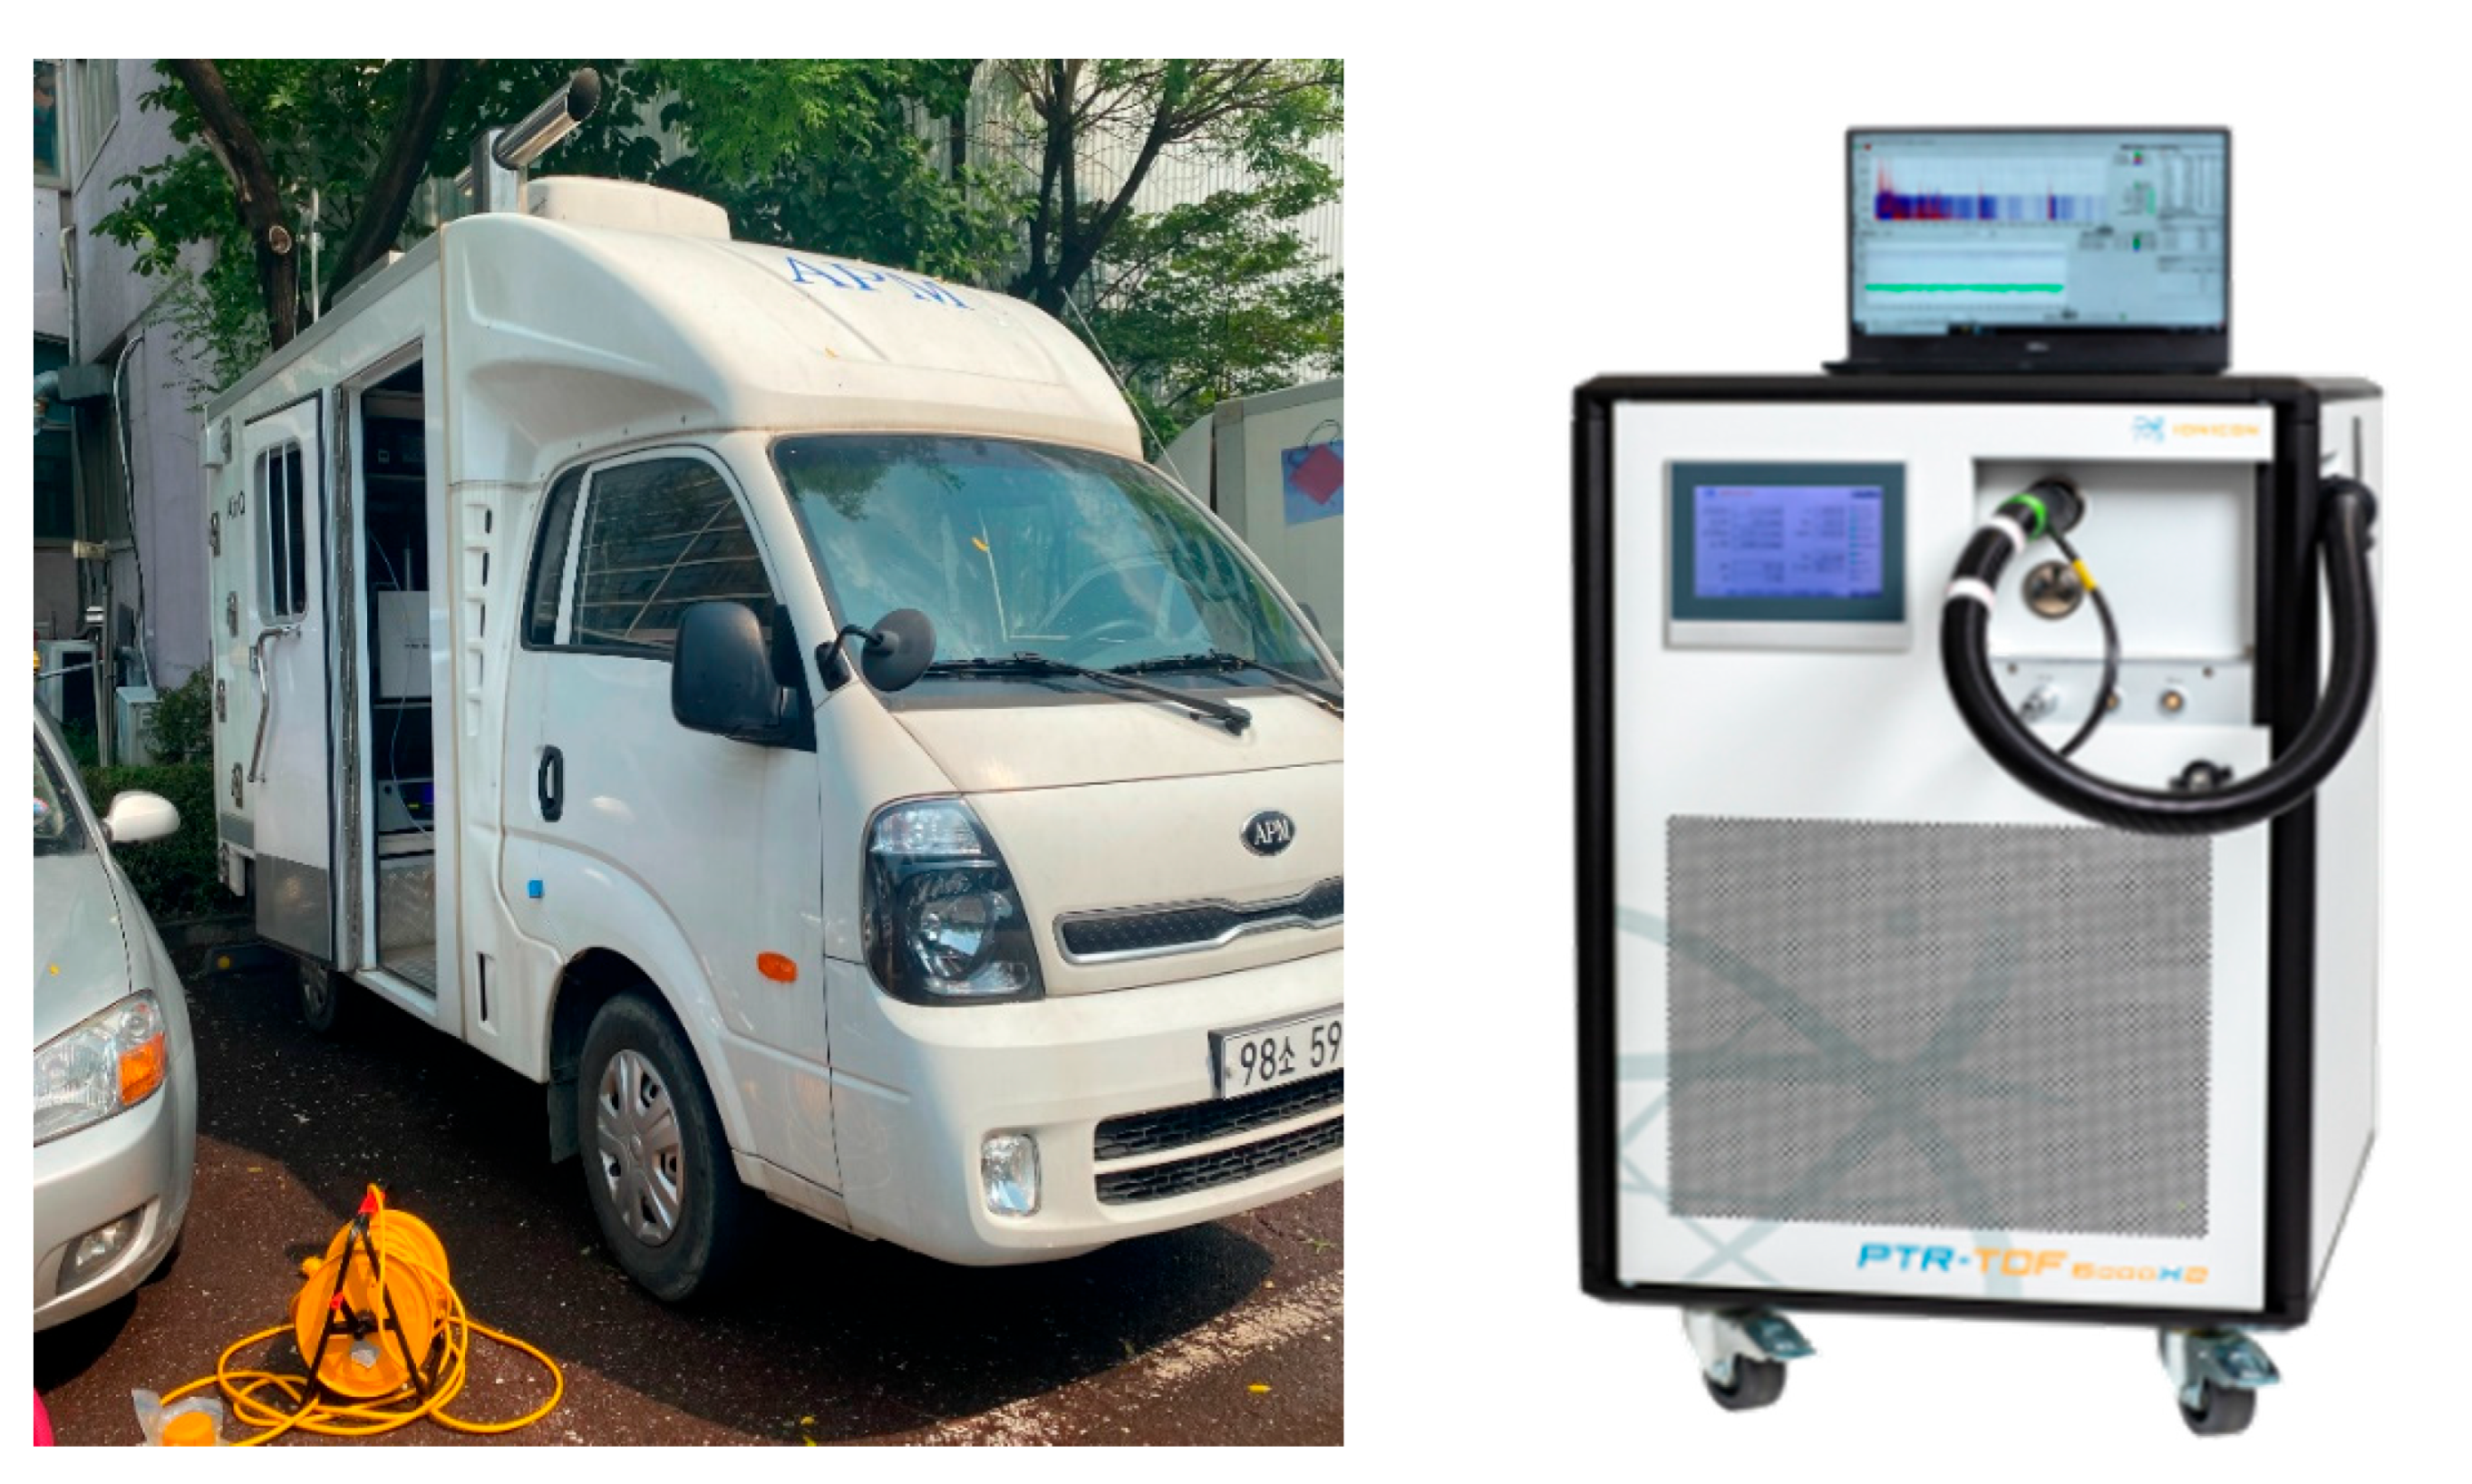
Figure 4.
Numbers of lanes in roads within the study area.
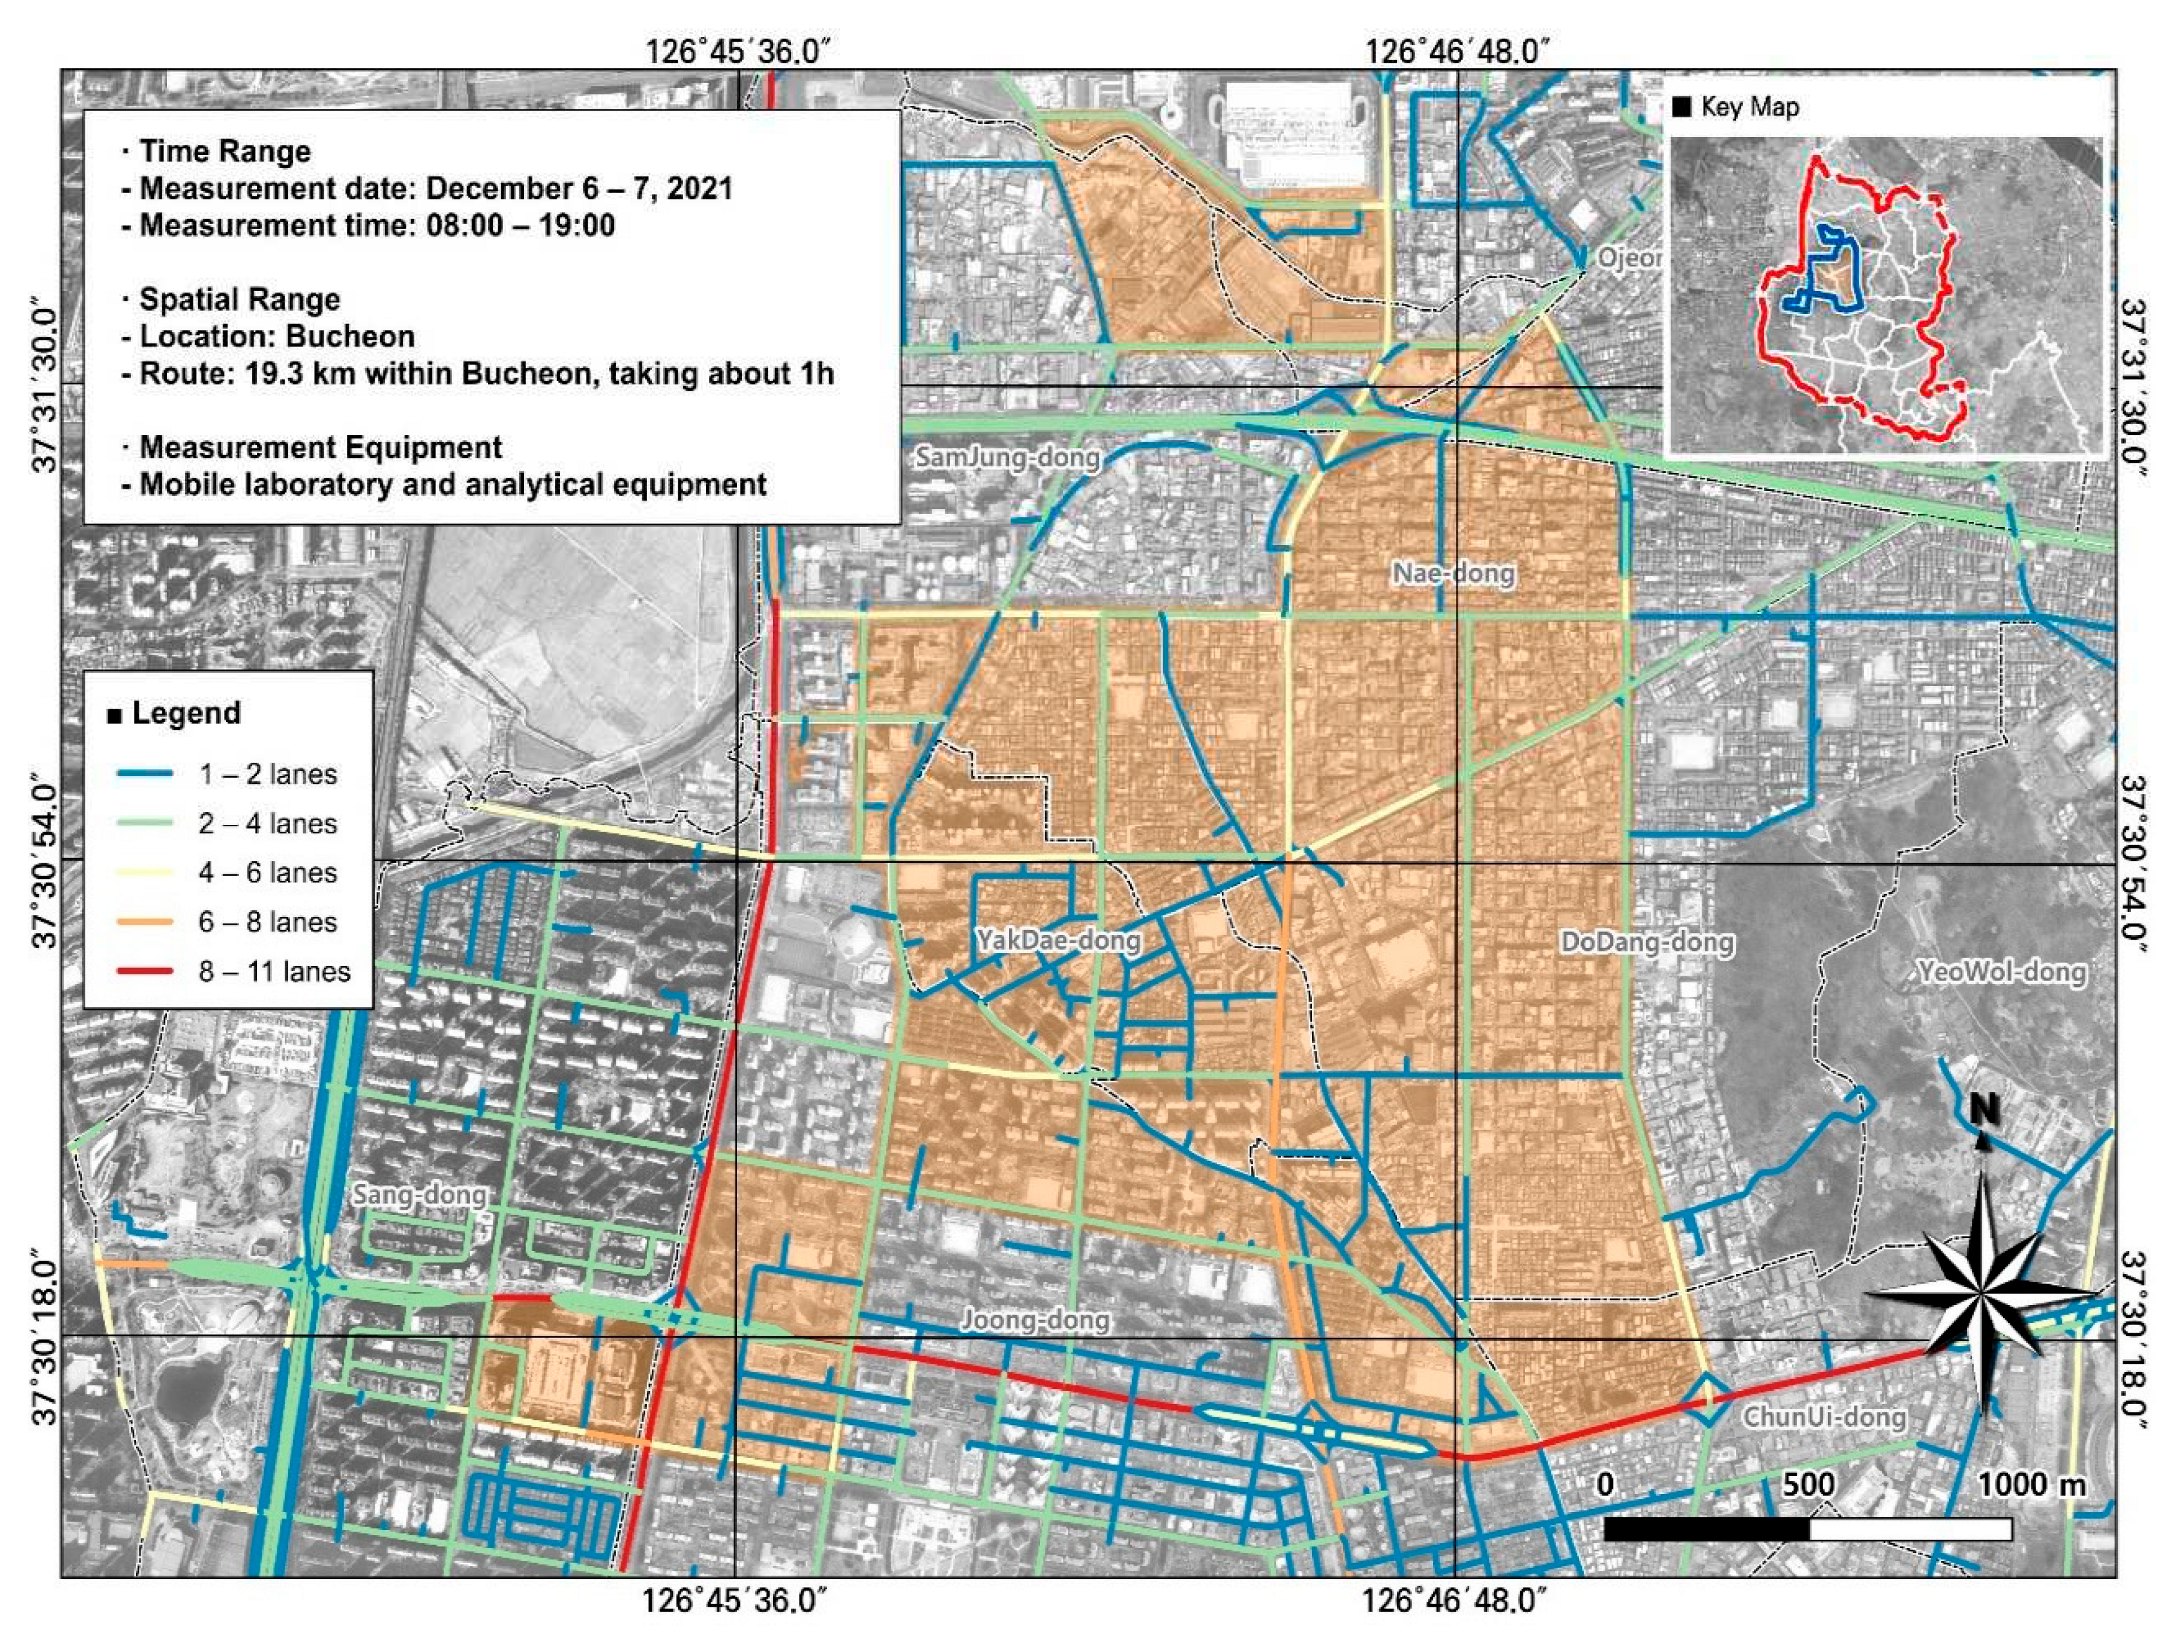
Figure 5.
Spatial and temporal plots of VOC (toluene) concentrations measured from the ML: (a) December 6, first run; (b) December 6, second run; (C) December 6, third run; (d) December 6, fourth run; (e) December 6, fifth run; (f) December 7, first run; (g) December 7, second run.
Figure 5.
Spatial and temporal plots of VOC (toluene) concentrations measured from the ML: (a) December 6, first run; (b) December 6, second run; (C) December 6, third run; (d) December 6, fourth run; (e) December 6, fifth run; (f) December 7, first run; (g) December 7, second run.
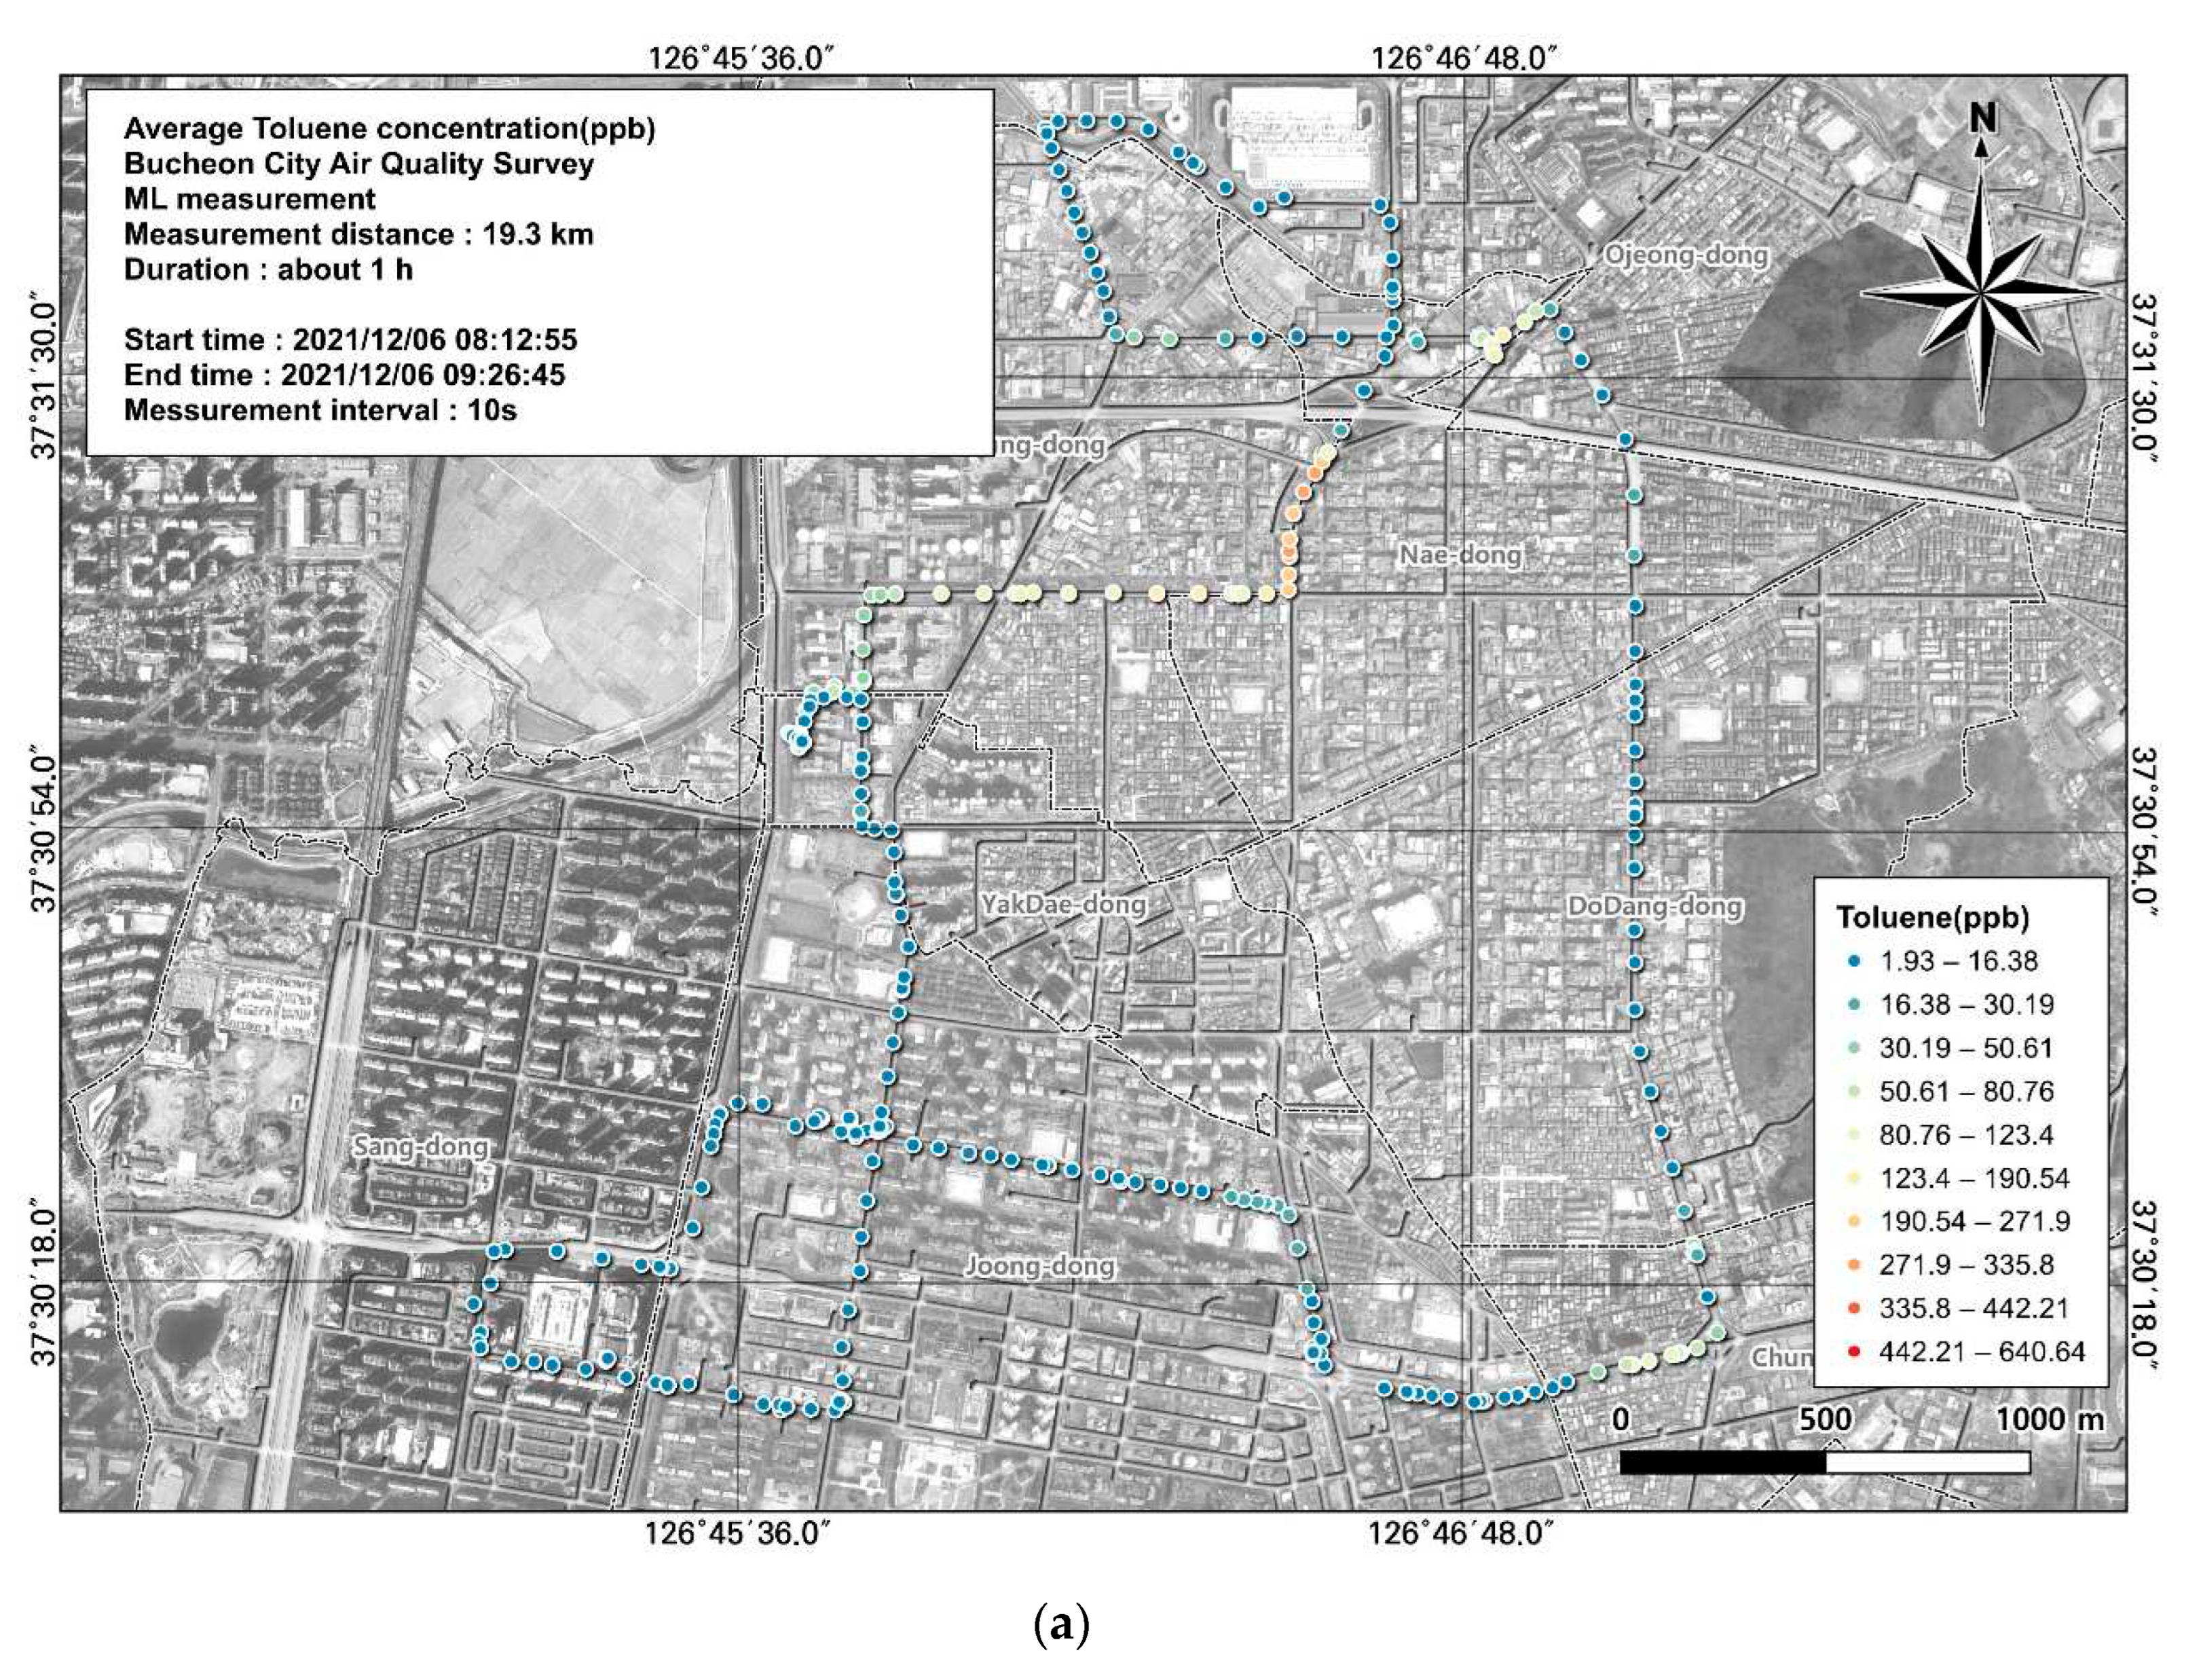
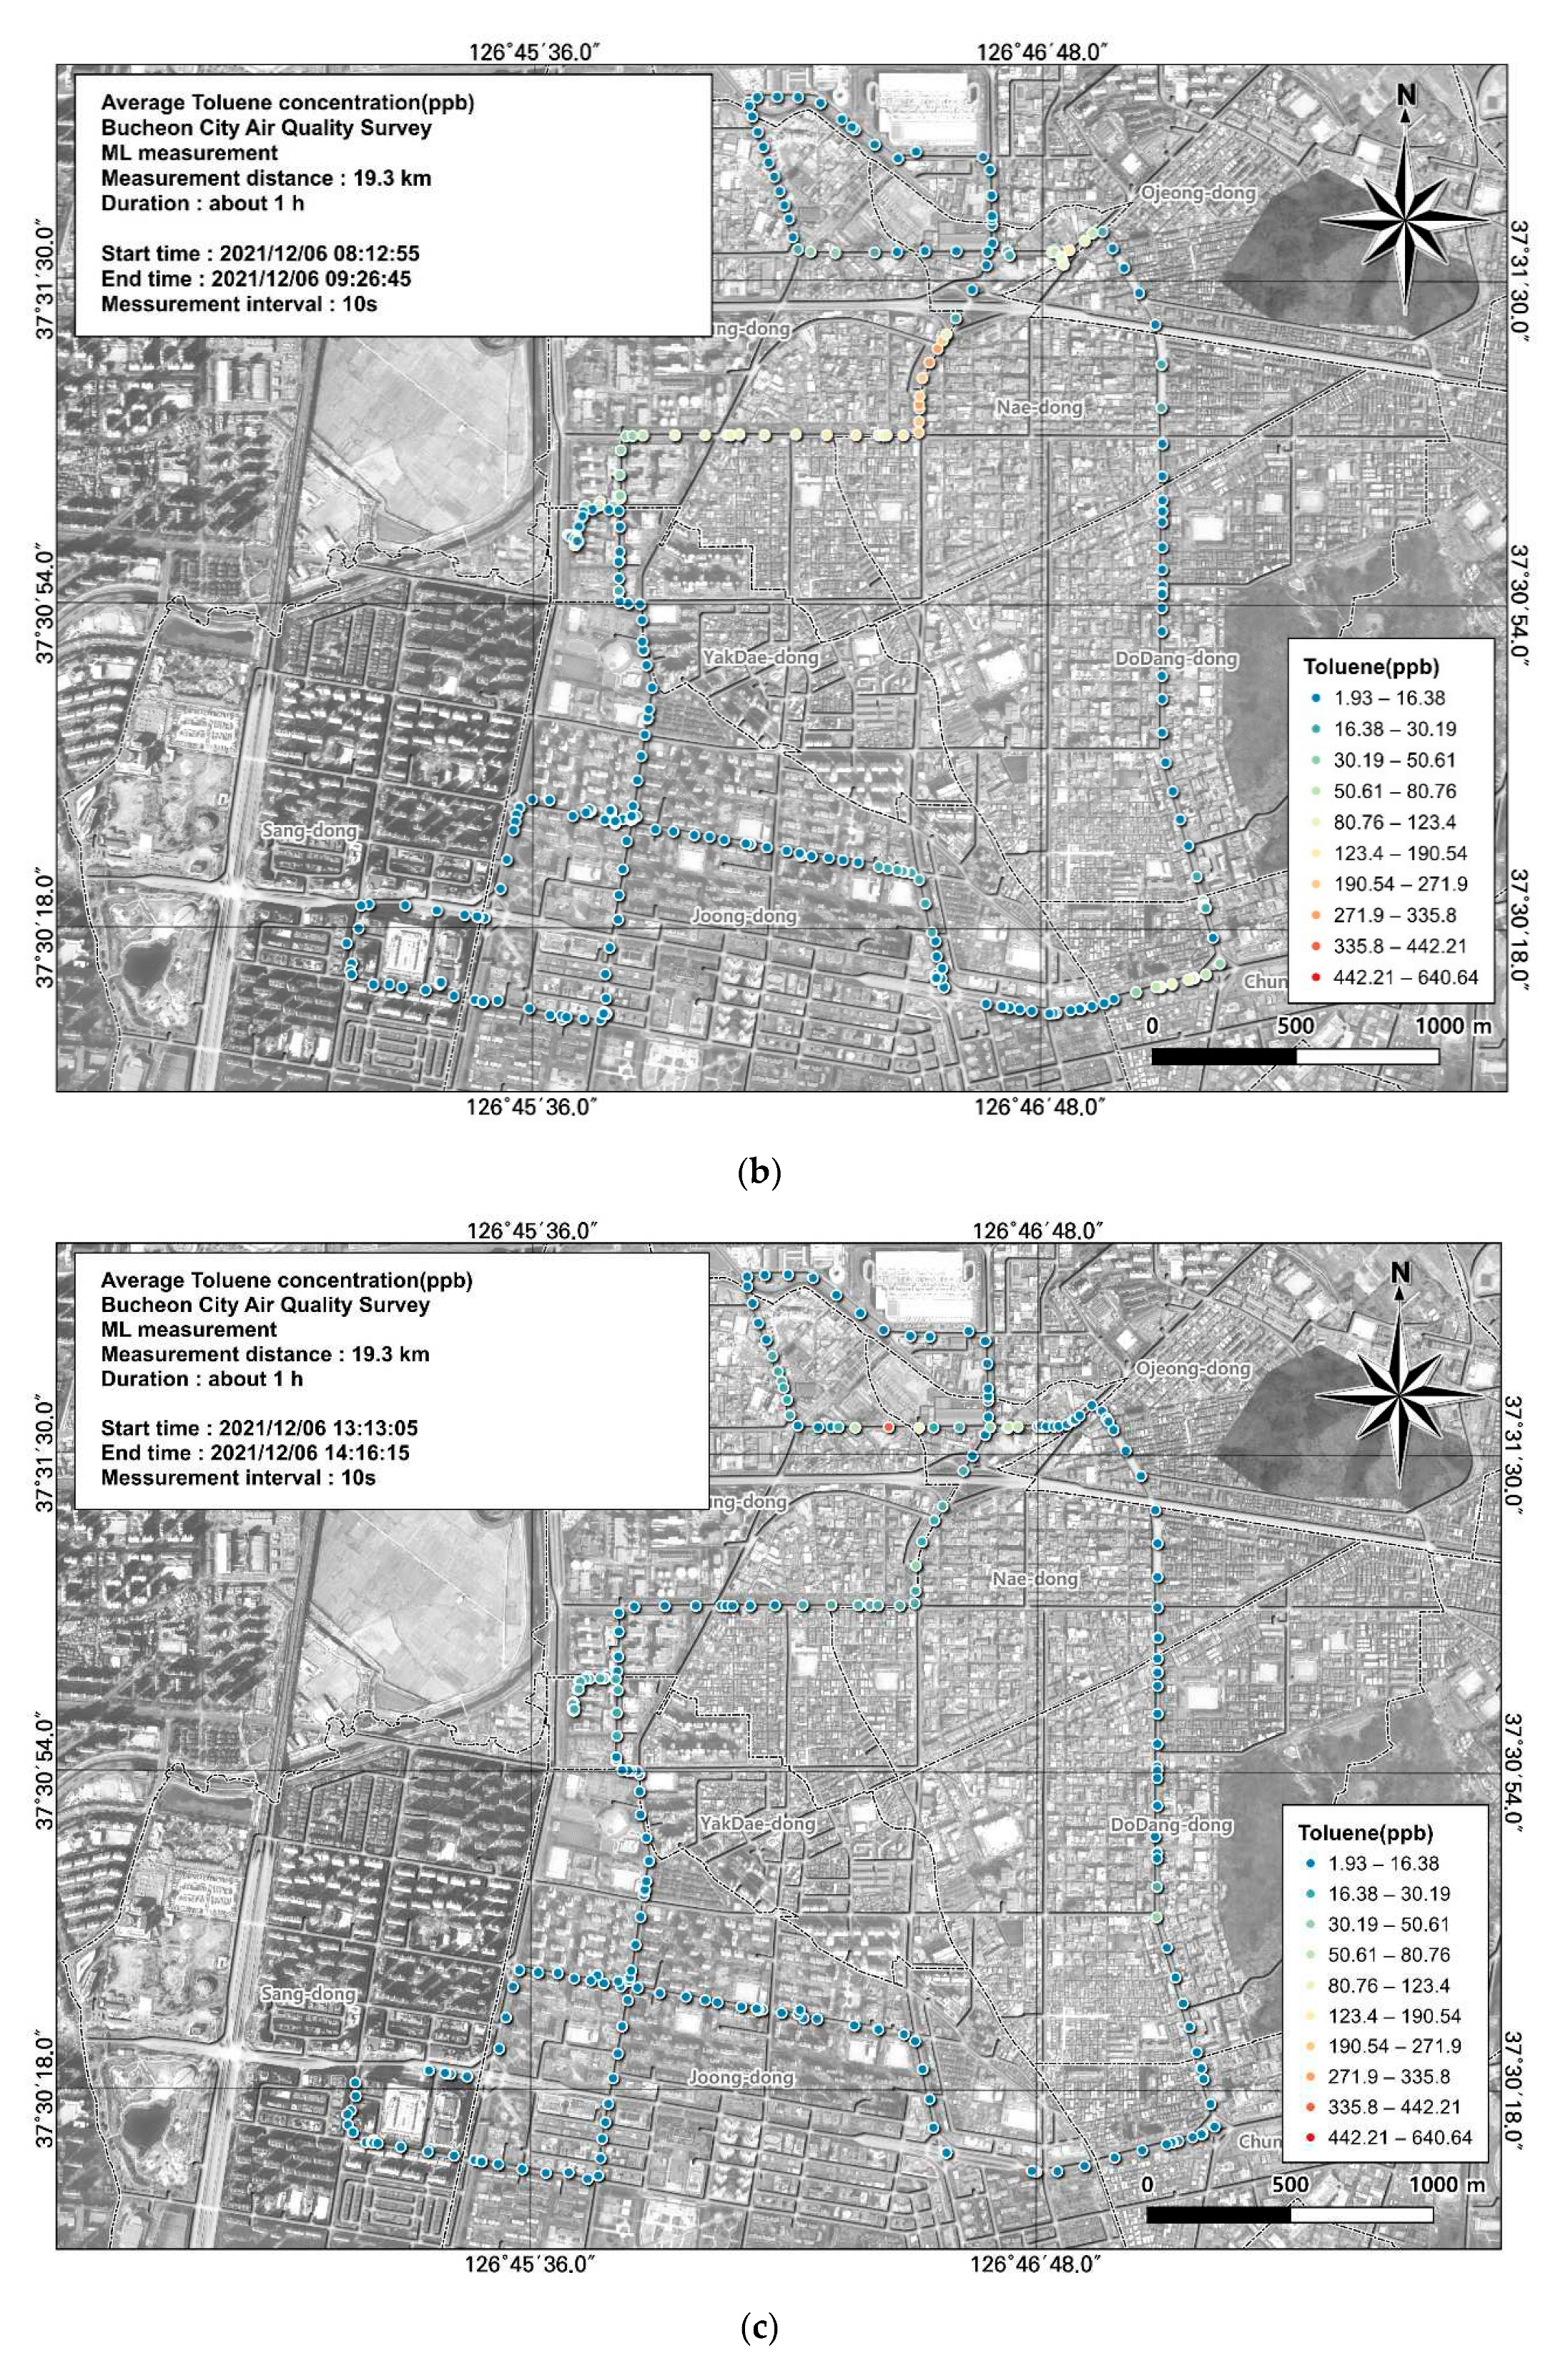
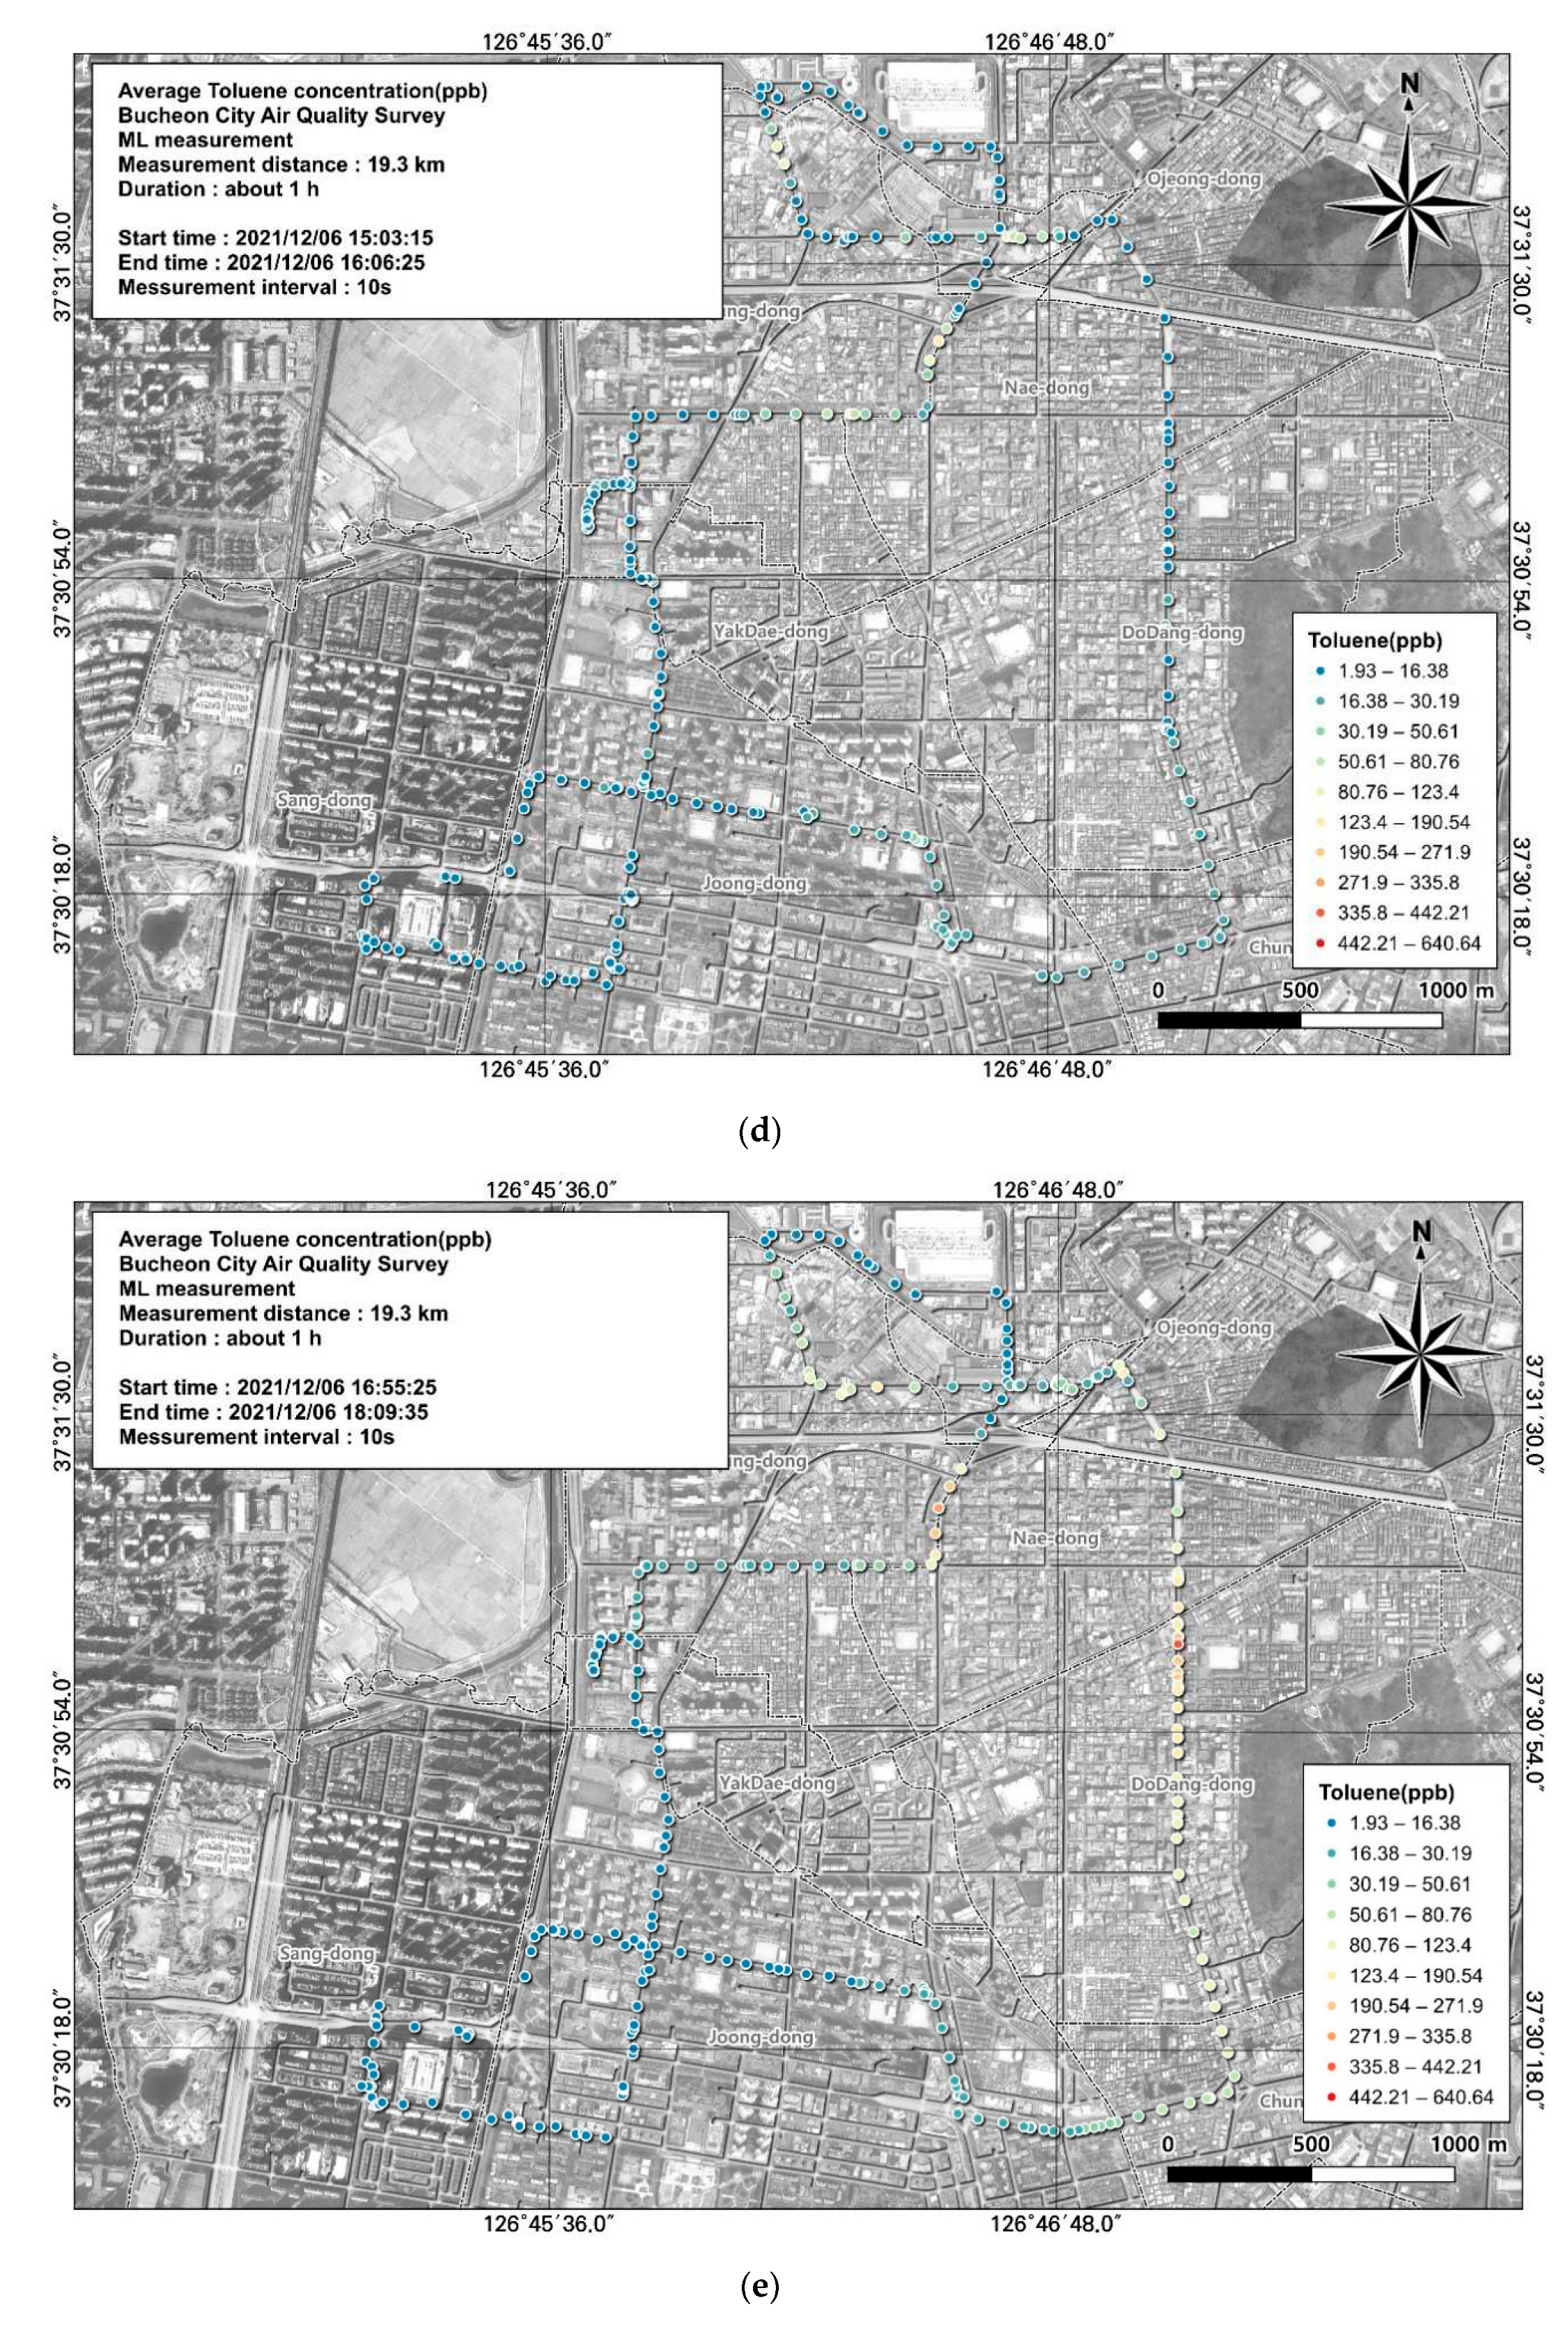
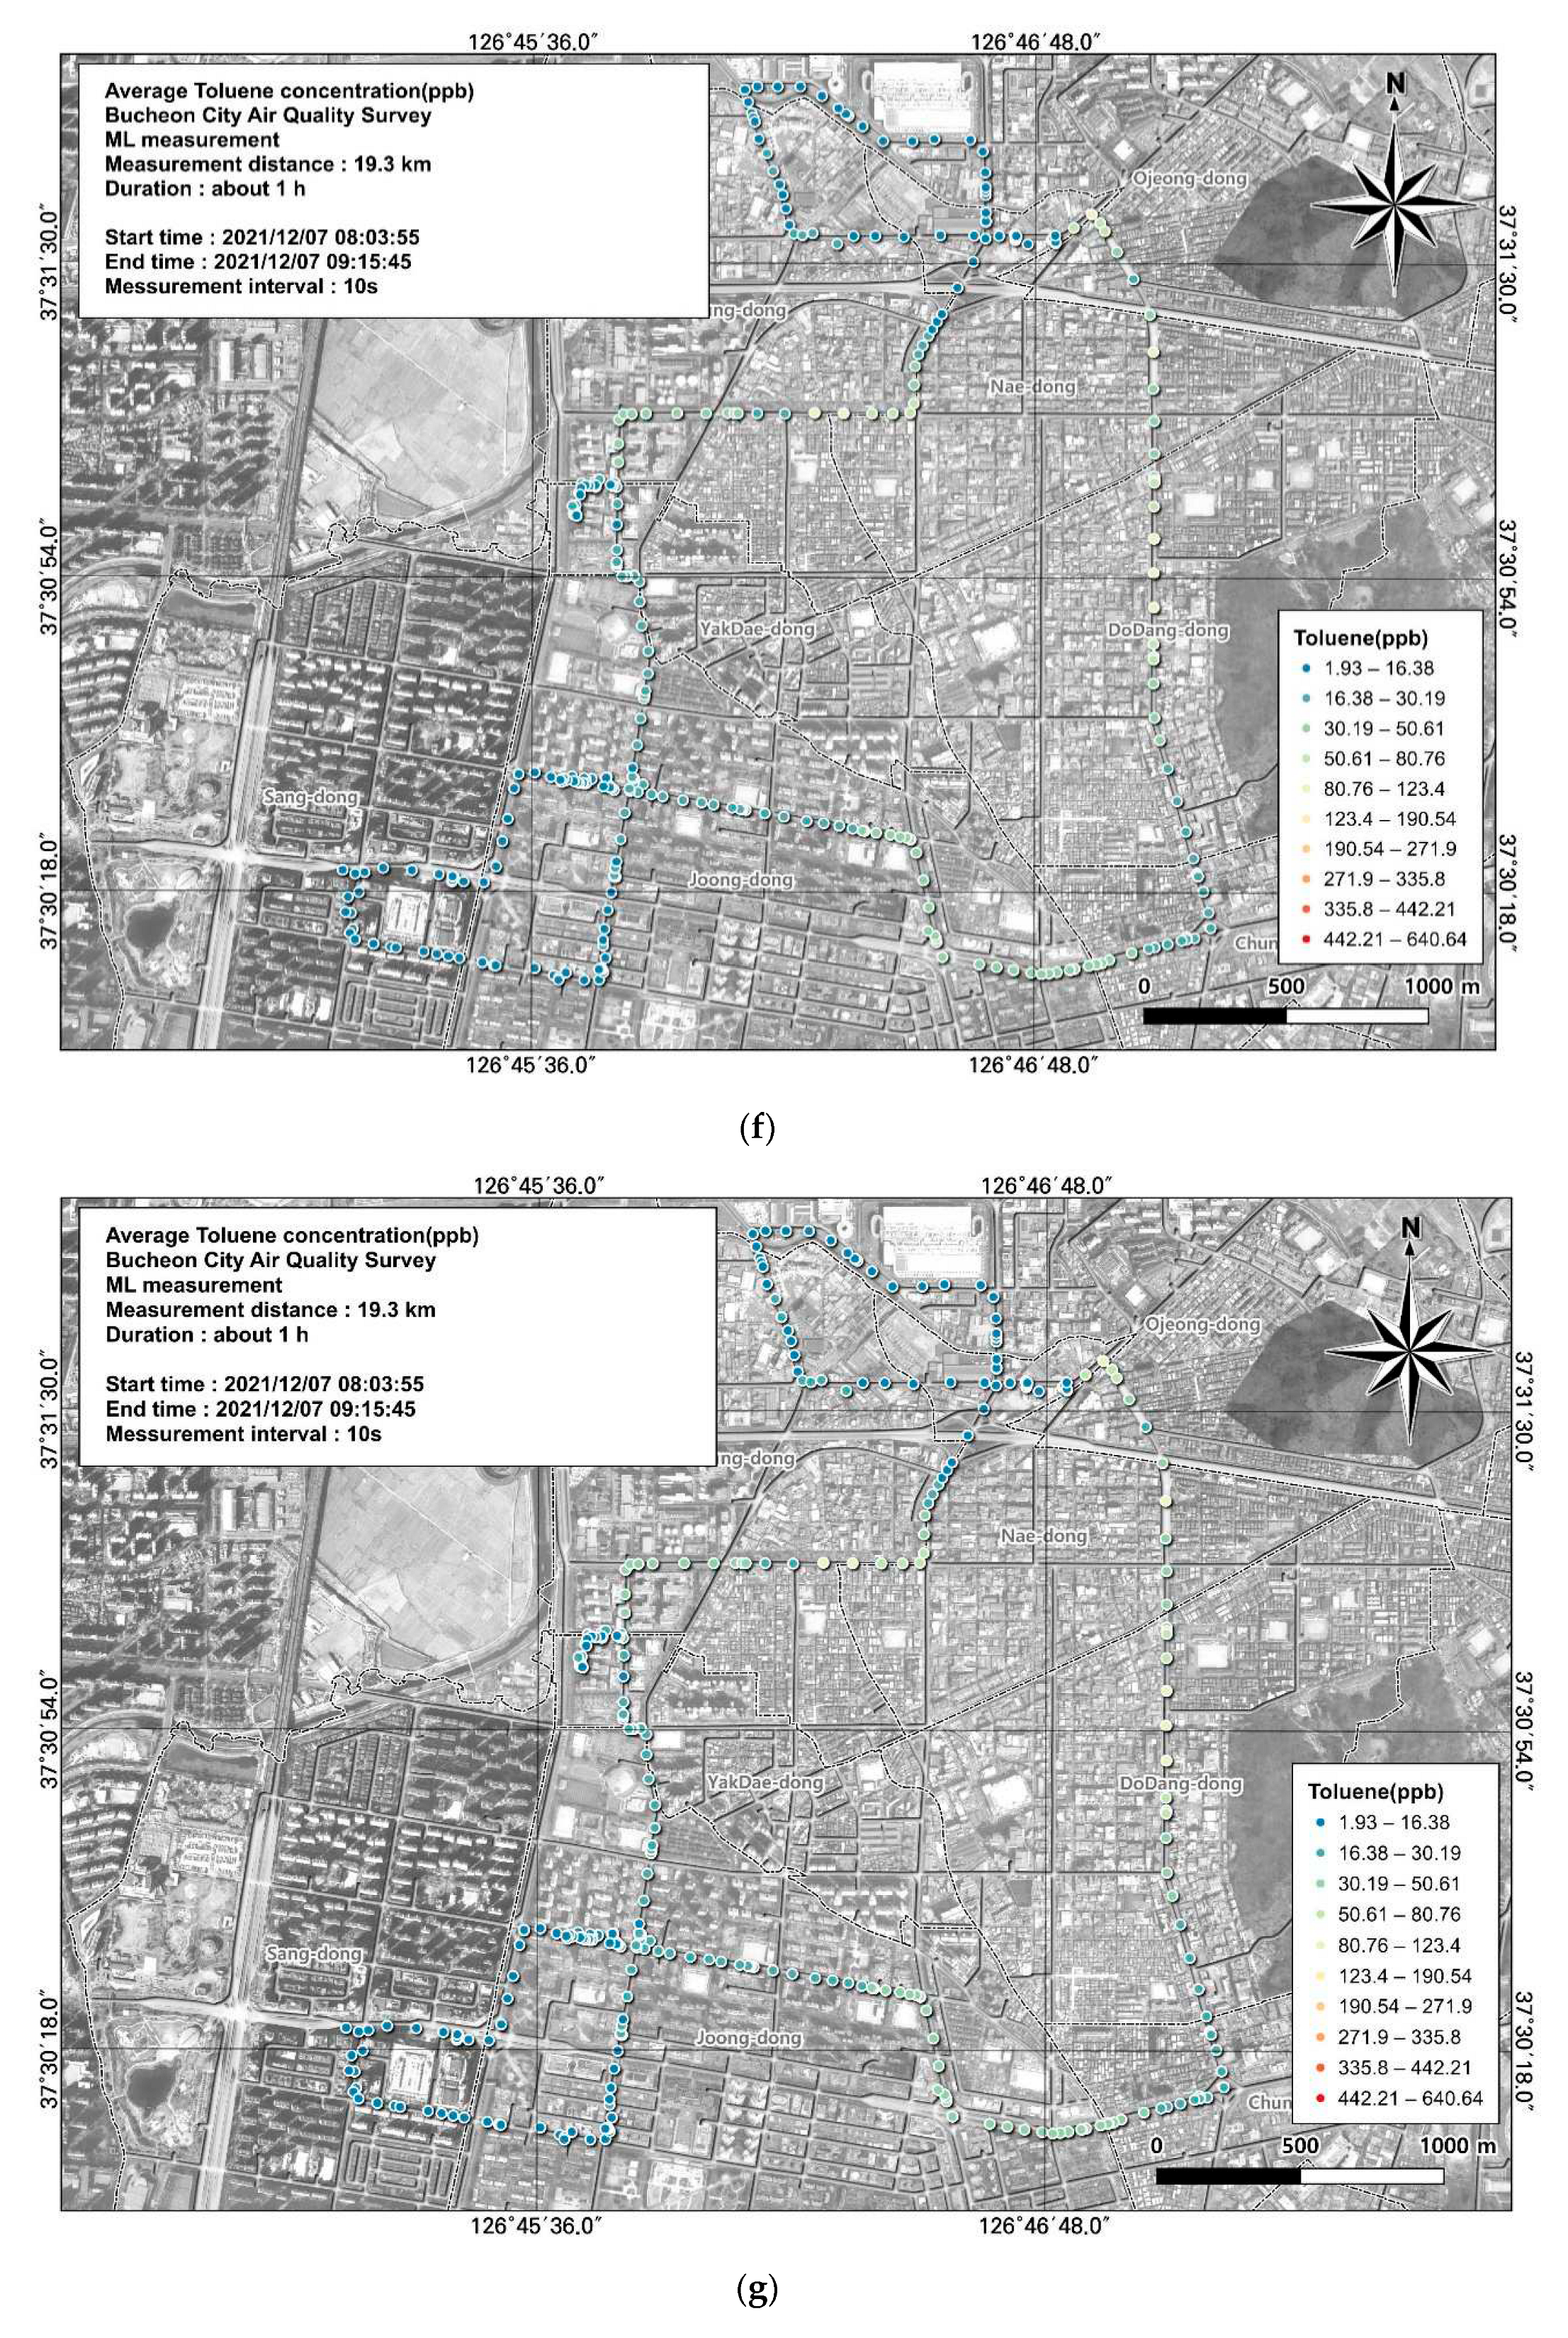
Figure 6.
Spatial and temporal distributions of VOC (methanol) concentrations measured using the ML: (a) December 6, first run; (b) December 6, second run; (C) December 6, third run; (d) December 6, fourth run; (e) December 6, fifth run; (f) December 7, first run; (g) December 7, second run.
Figure 6.
Spatial and temporal distributions of VOC (methanol) concentrations measured using the ML: (a) December 6, first run; (b) December 6, second run; (C) December 6, third run; (d) December 6, fourth run; (e) December 6, fifth run; (f) December 7, first run; (g) December 7, second run.
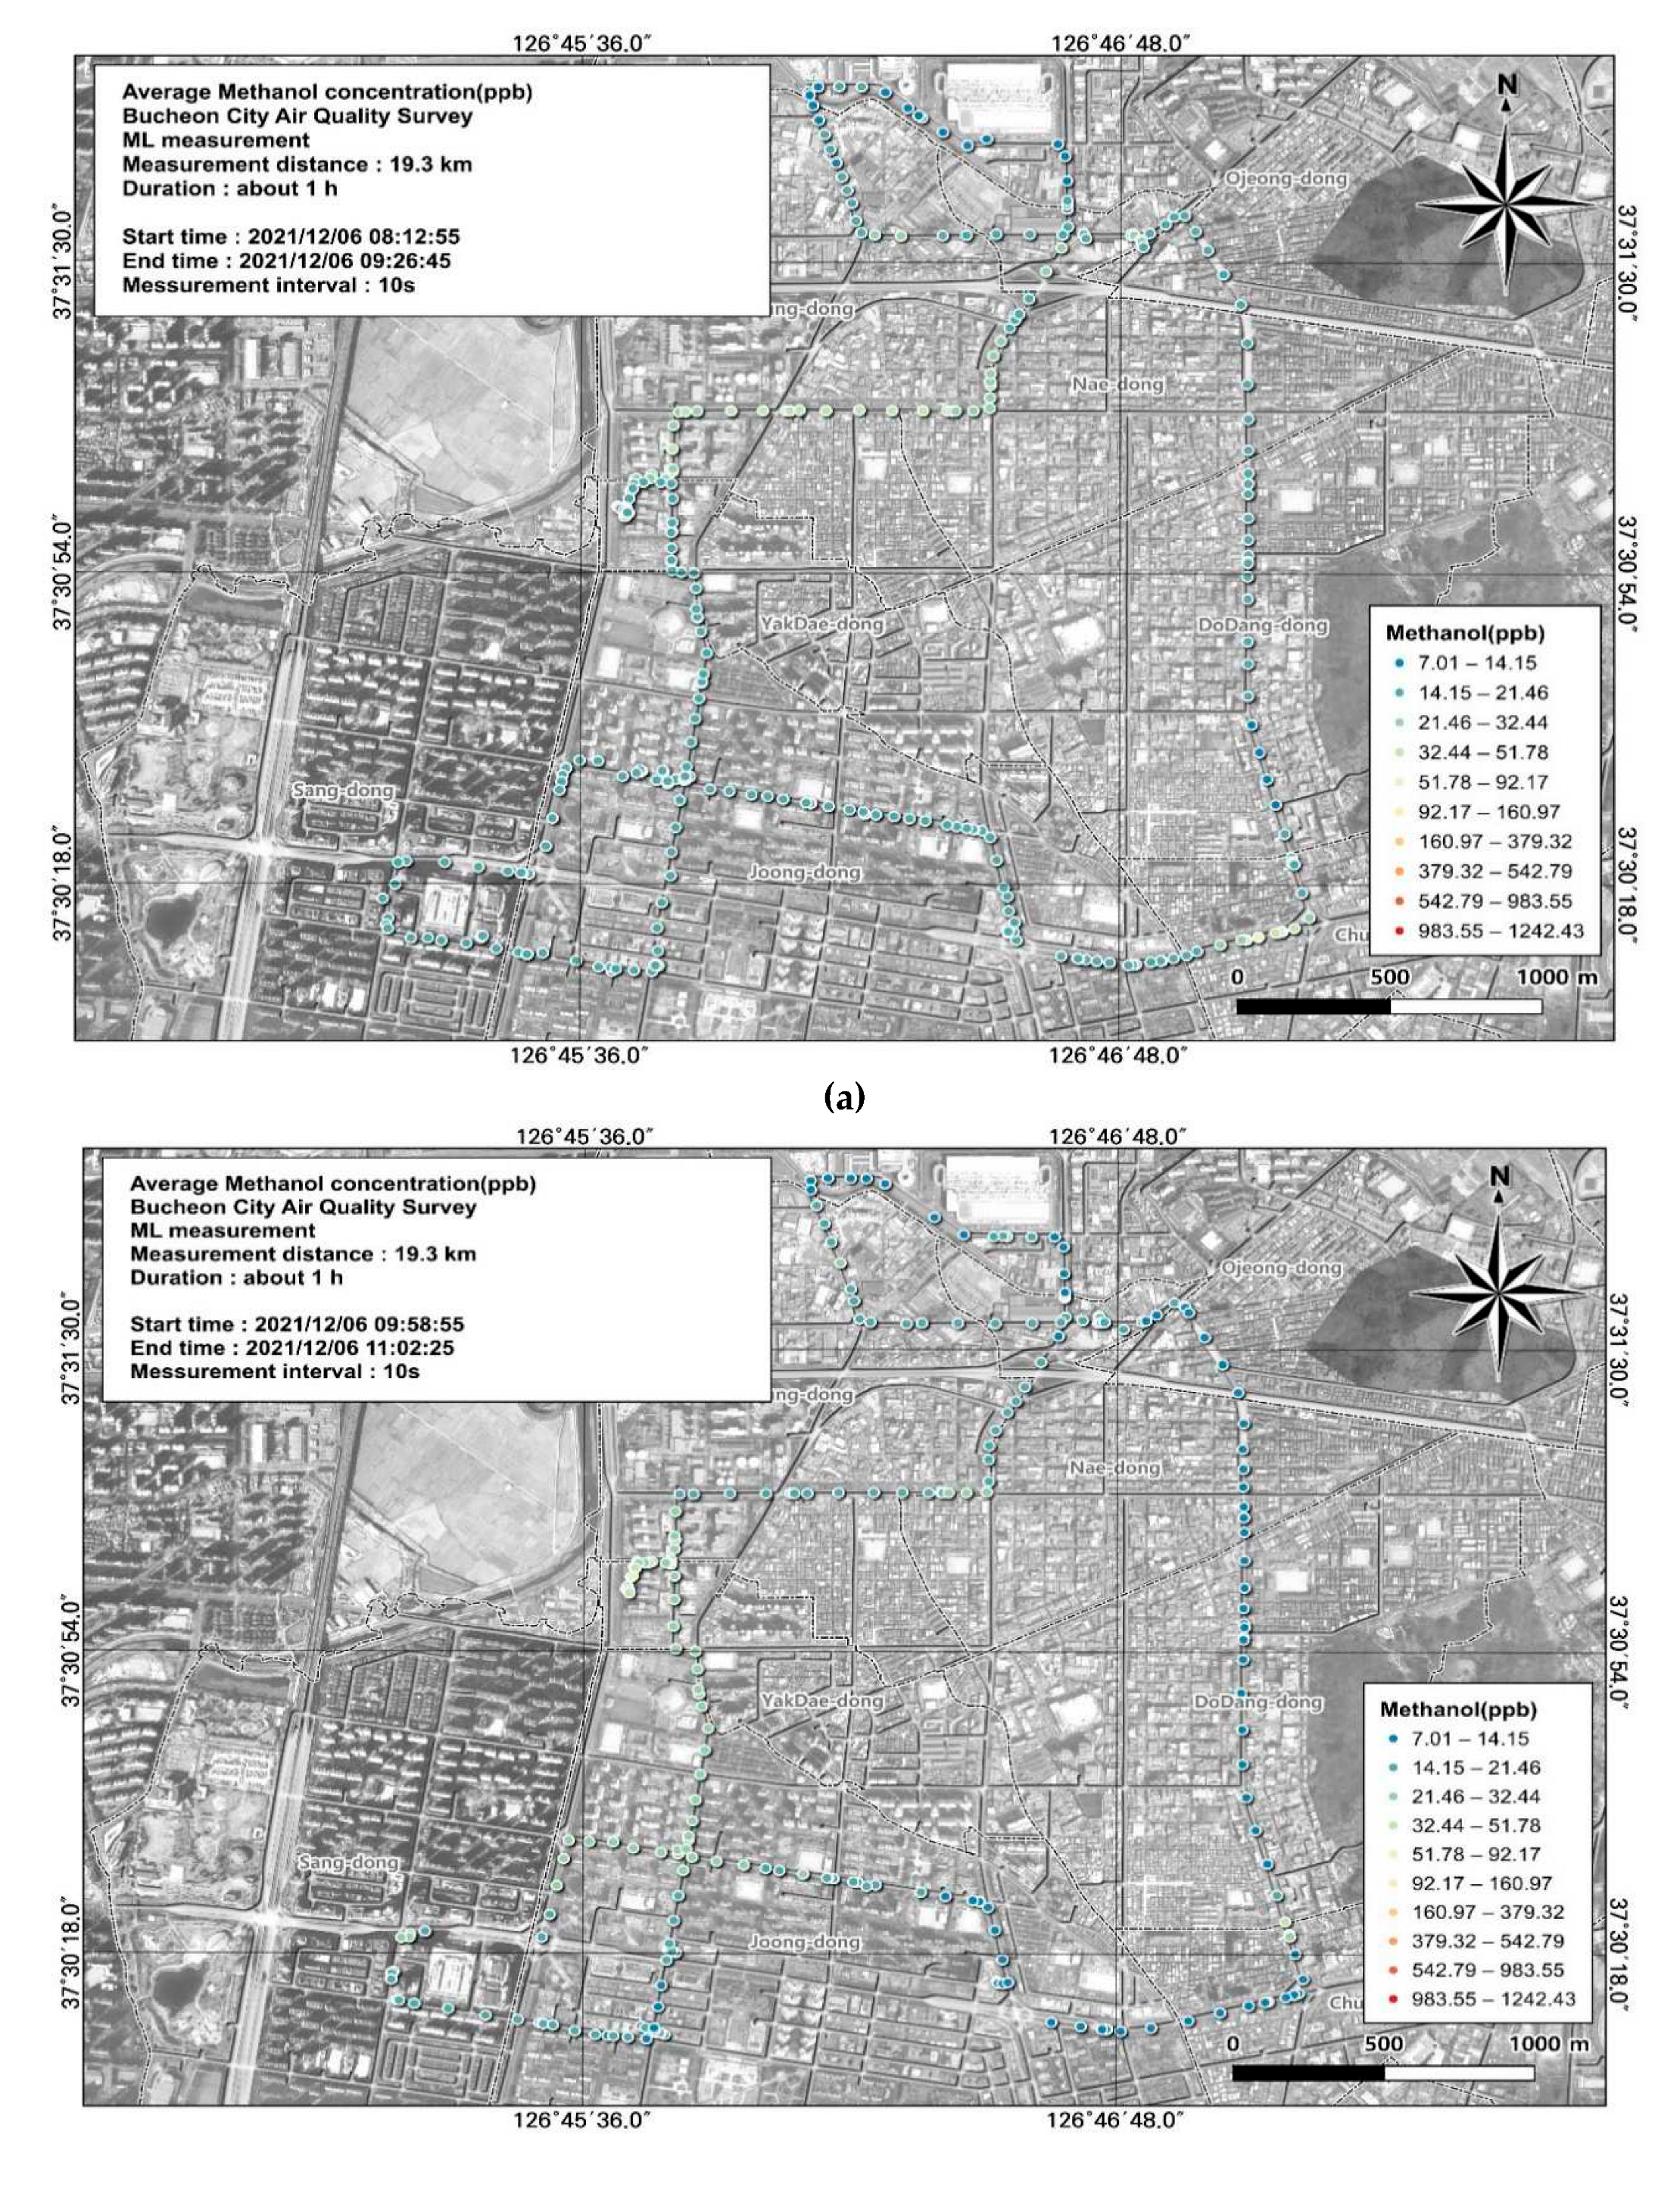
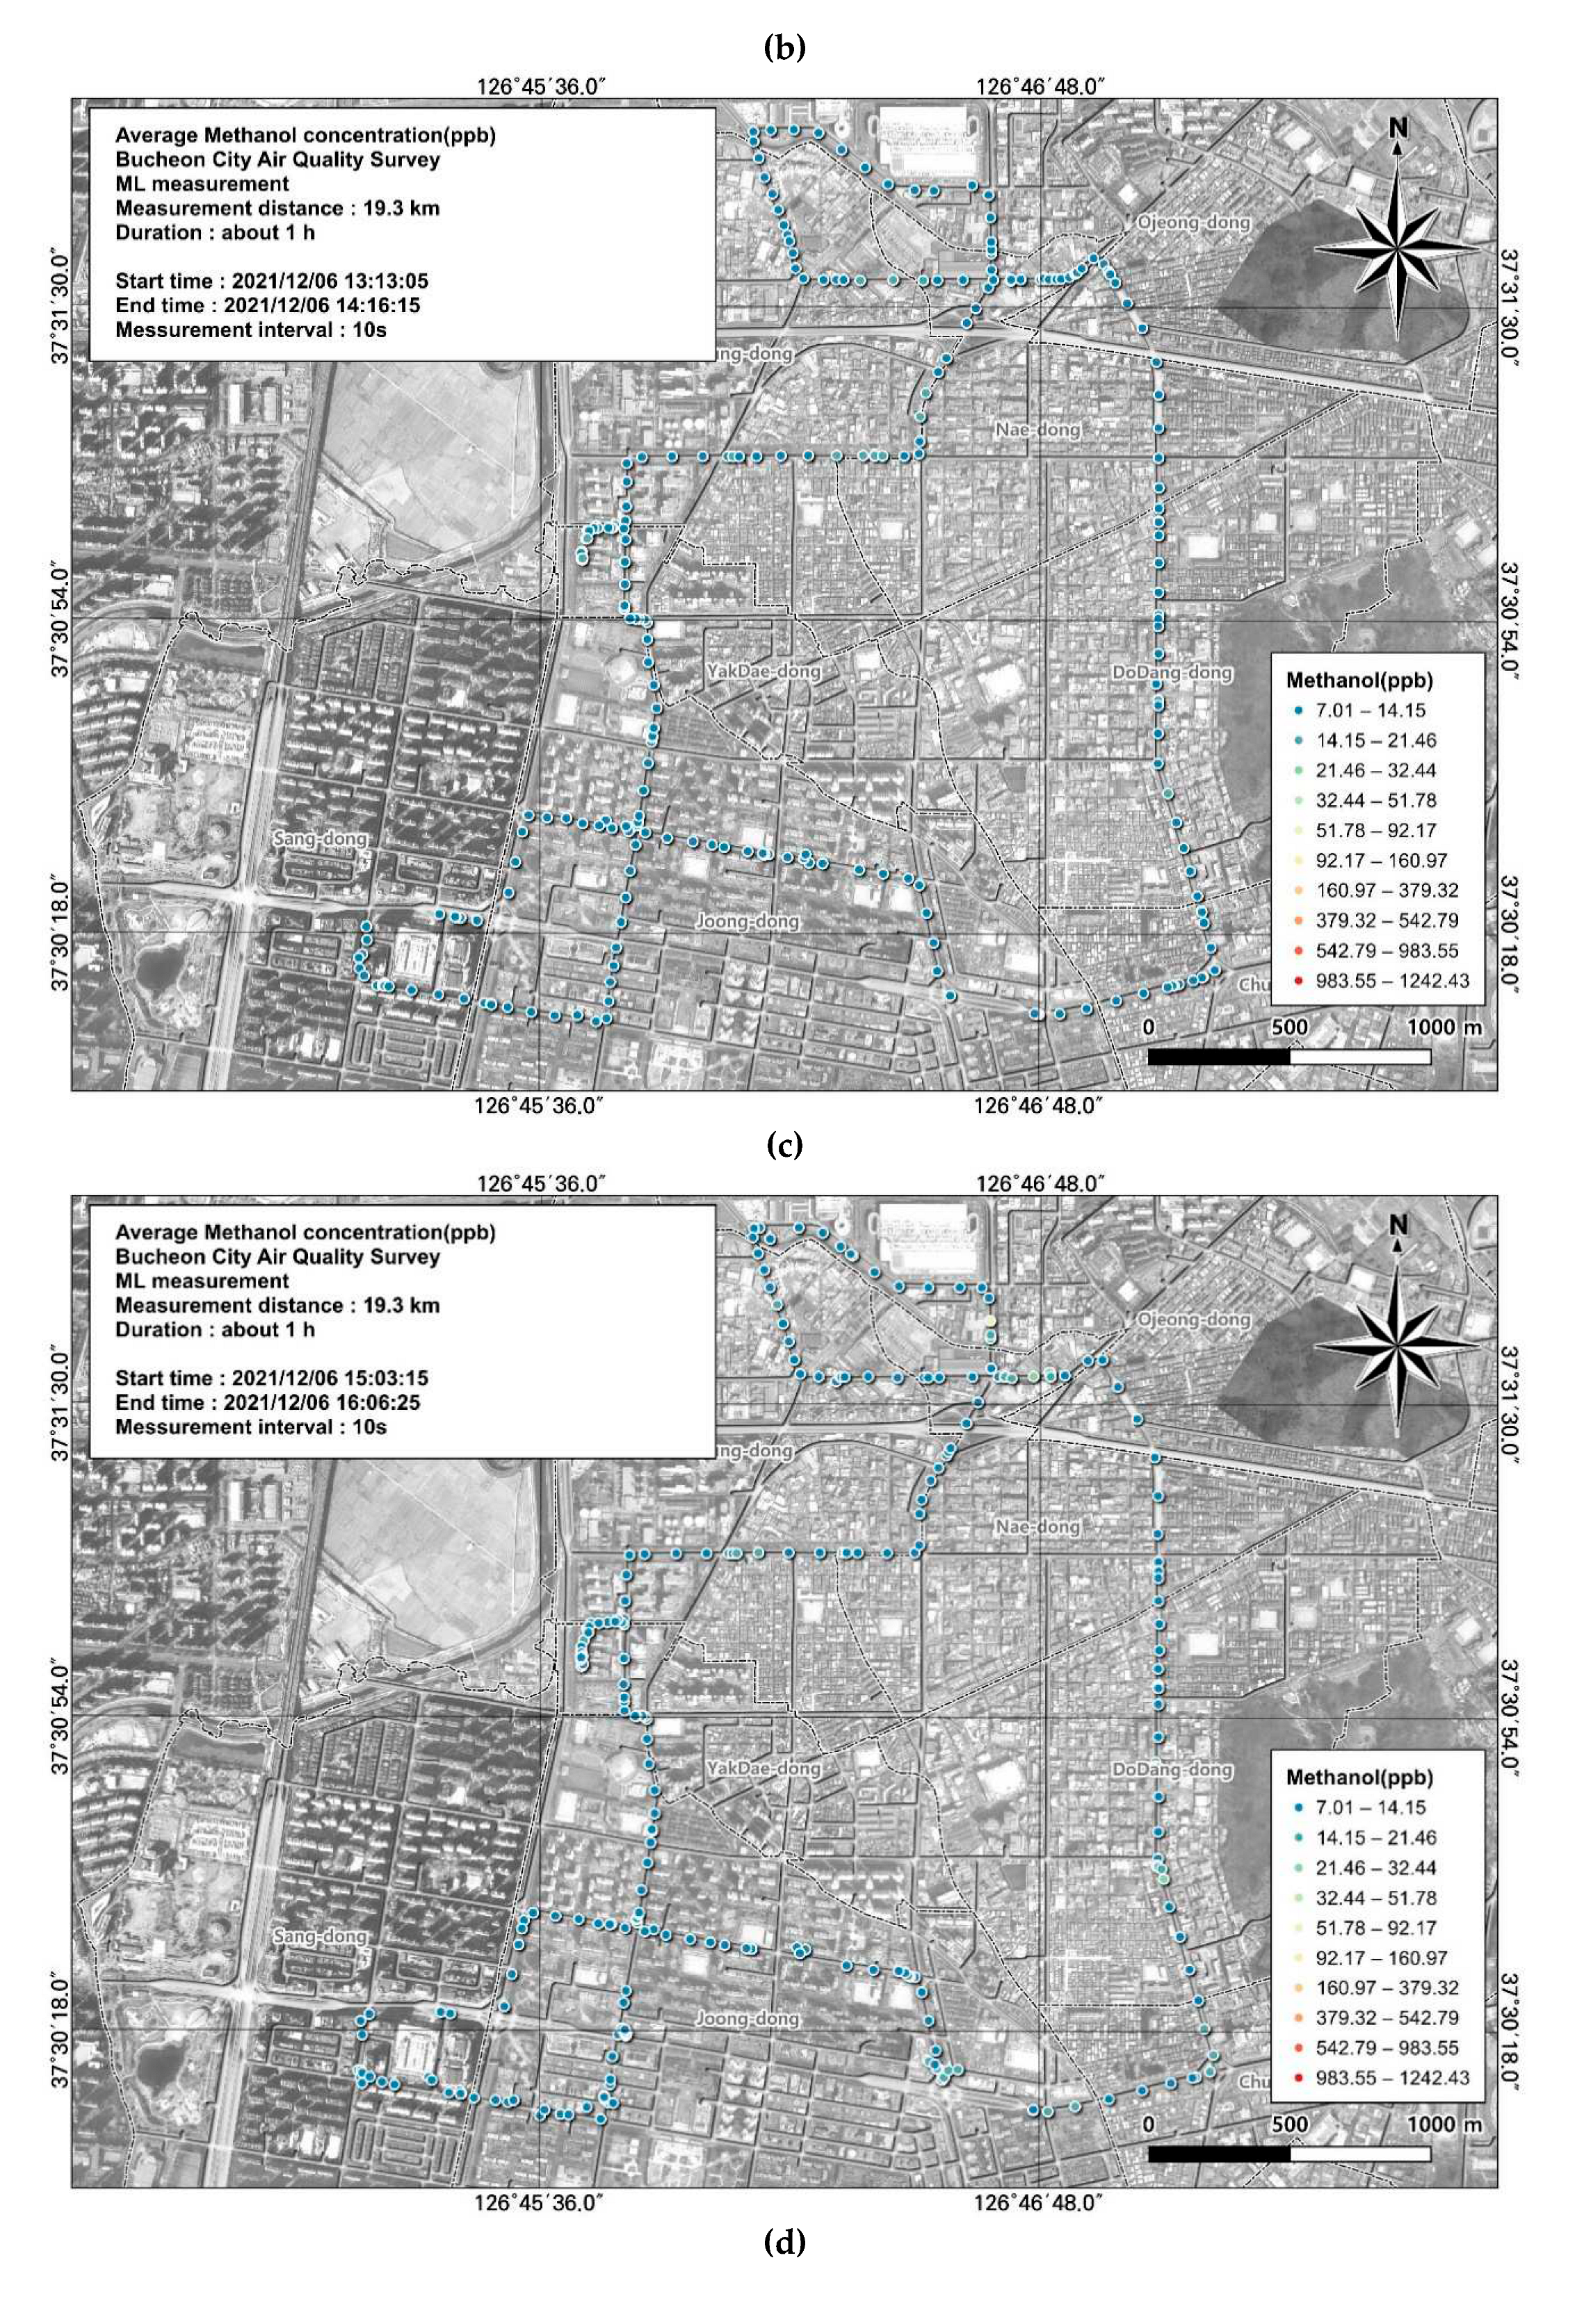

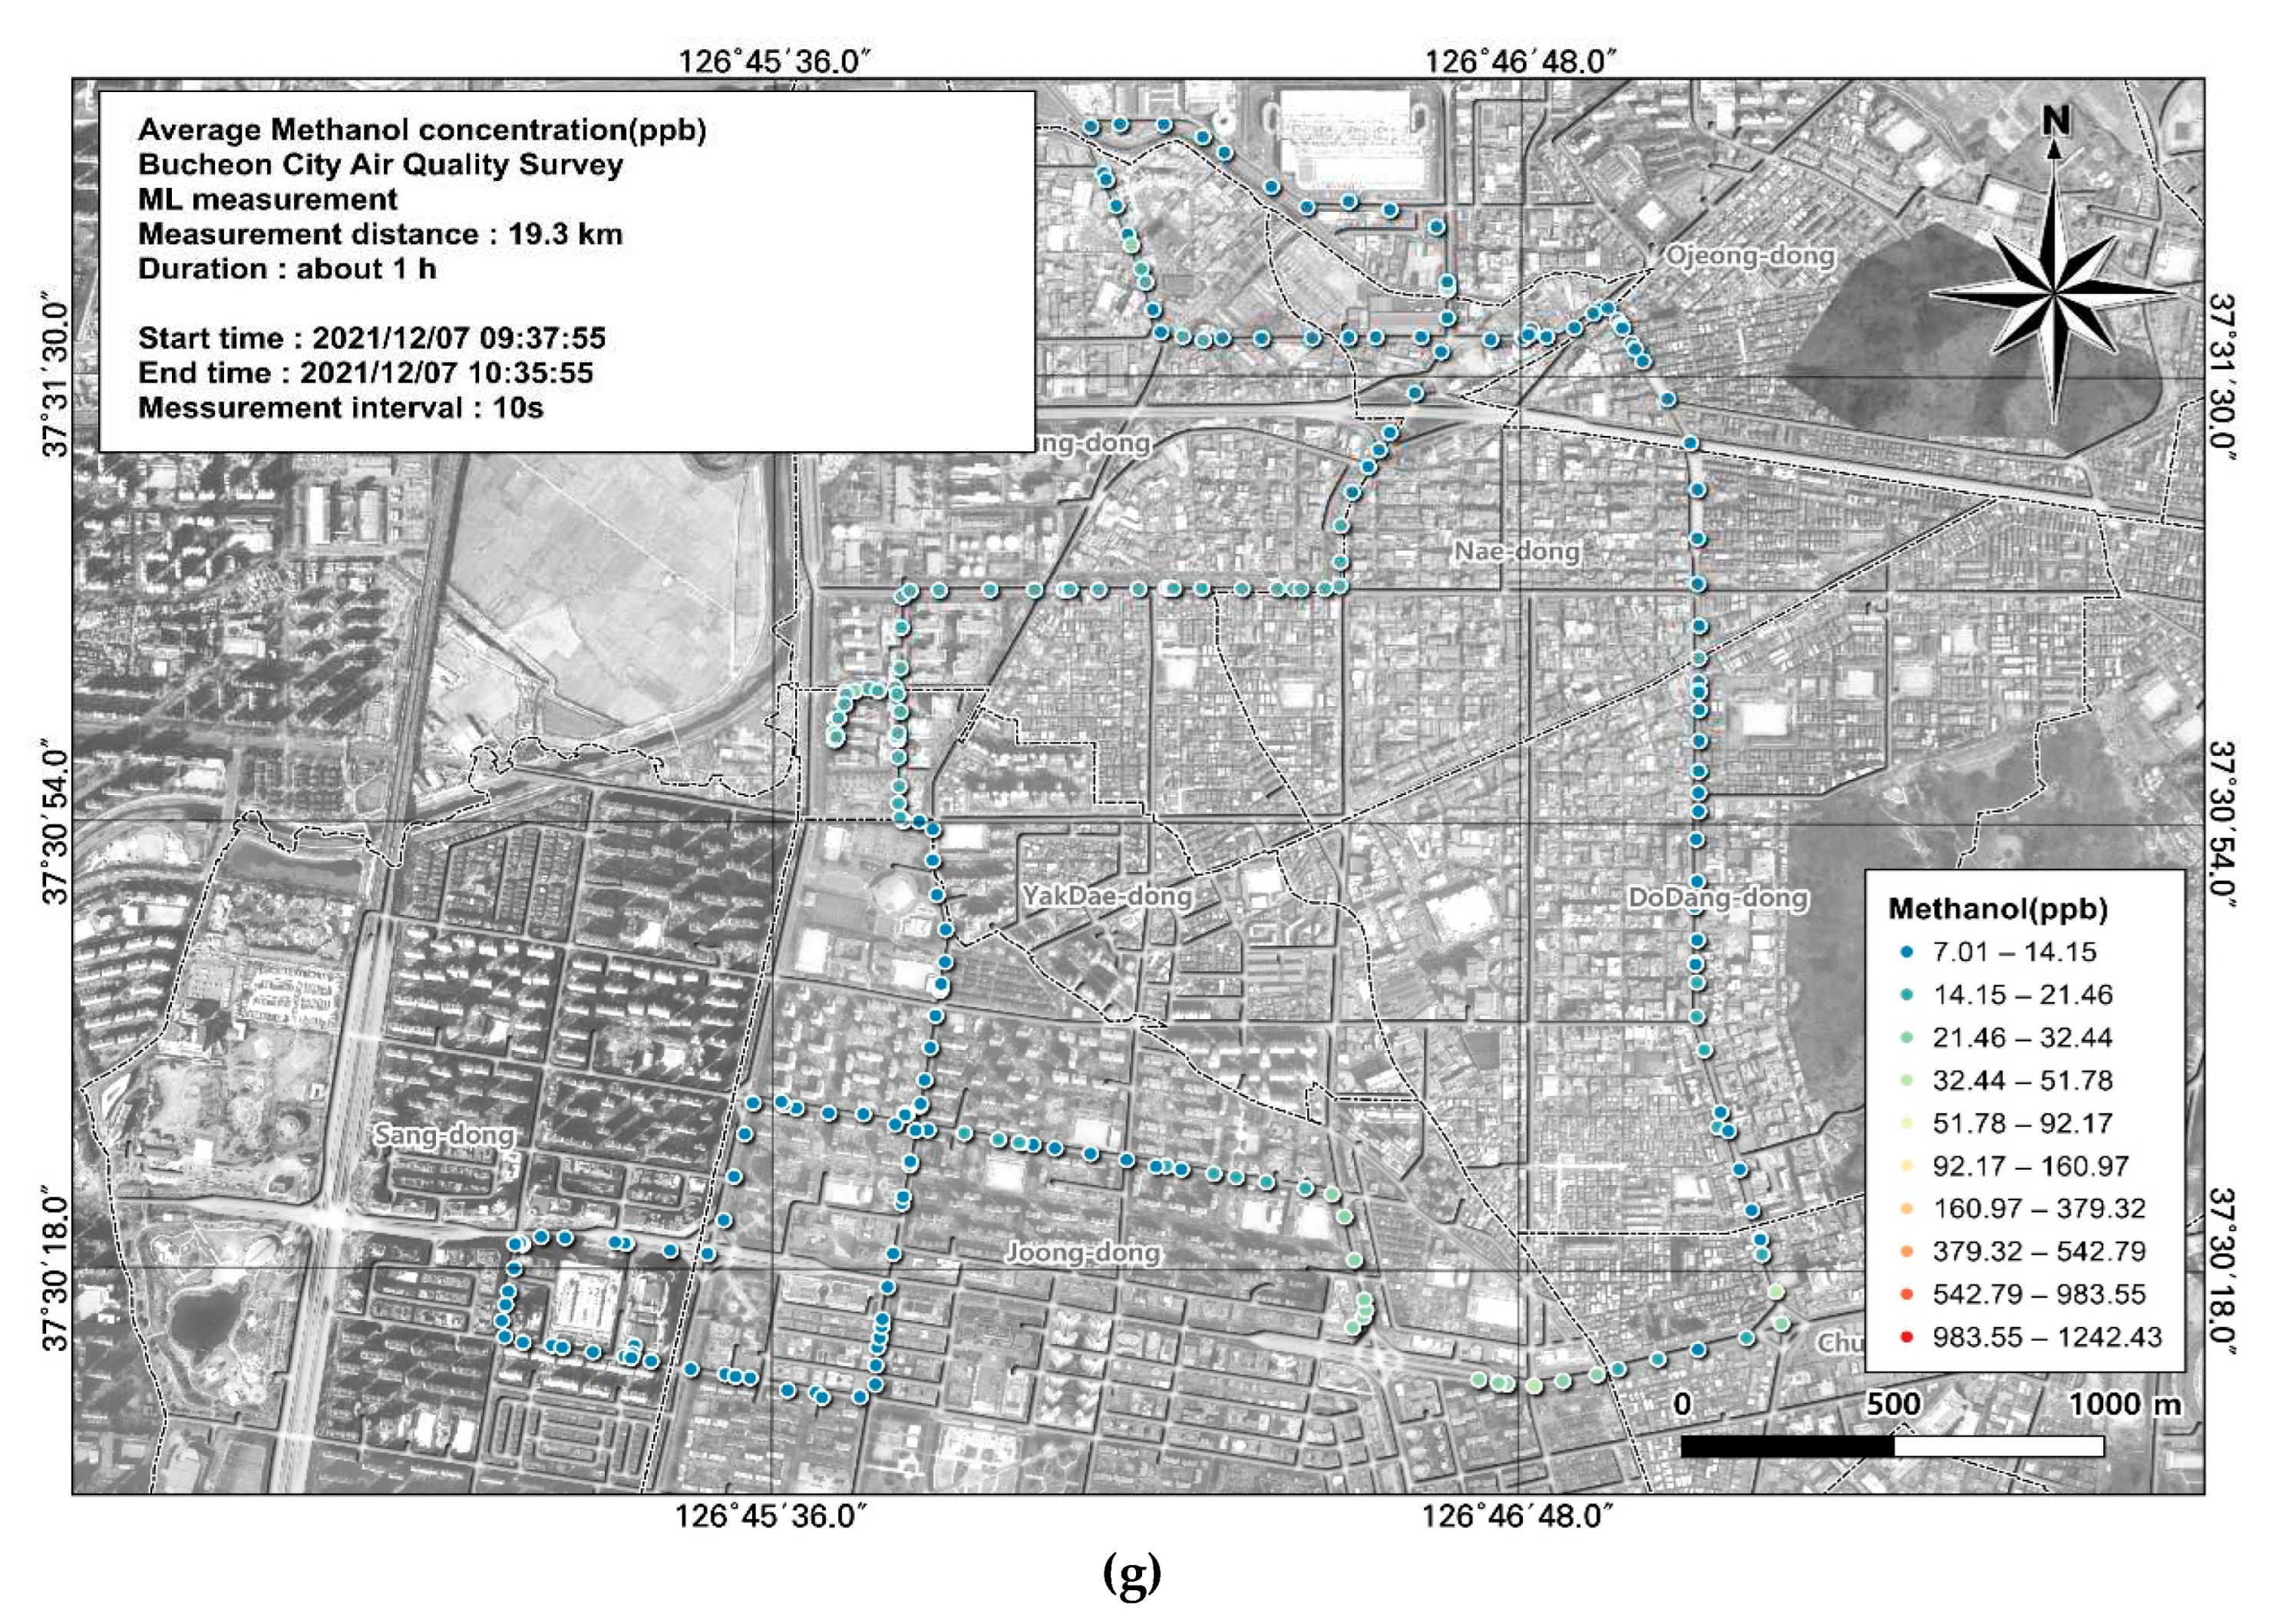
Figure 7.
Spatial and temporal distributions of VOC (n+i-butene) concentrations measured using the ML: (a) December 6, first run; (b) December 6, second run; (C) December 6, third run; (d) December 6, fourth run; (e) December 6, fifth run; (f) December 7, first run; (g) December 7, second run.
Figure 7.
Spatial and temporal distributions of VOC (n+i-butene) concentrations measured using the ML: (a) December 6, first run; (b) December 6, second run; (C) December 6, third run; (d) December 6, fourth run; (e) December 6, fifth run; (f) December 7, first run; (g) December 7, second run.
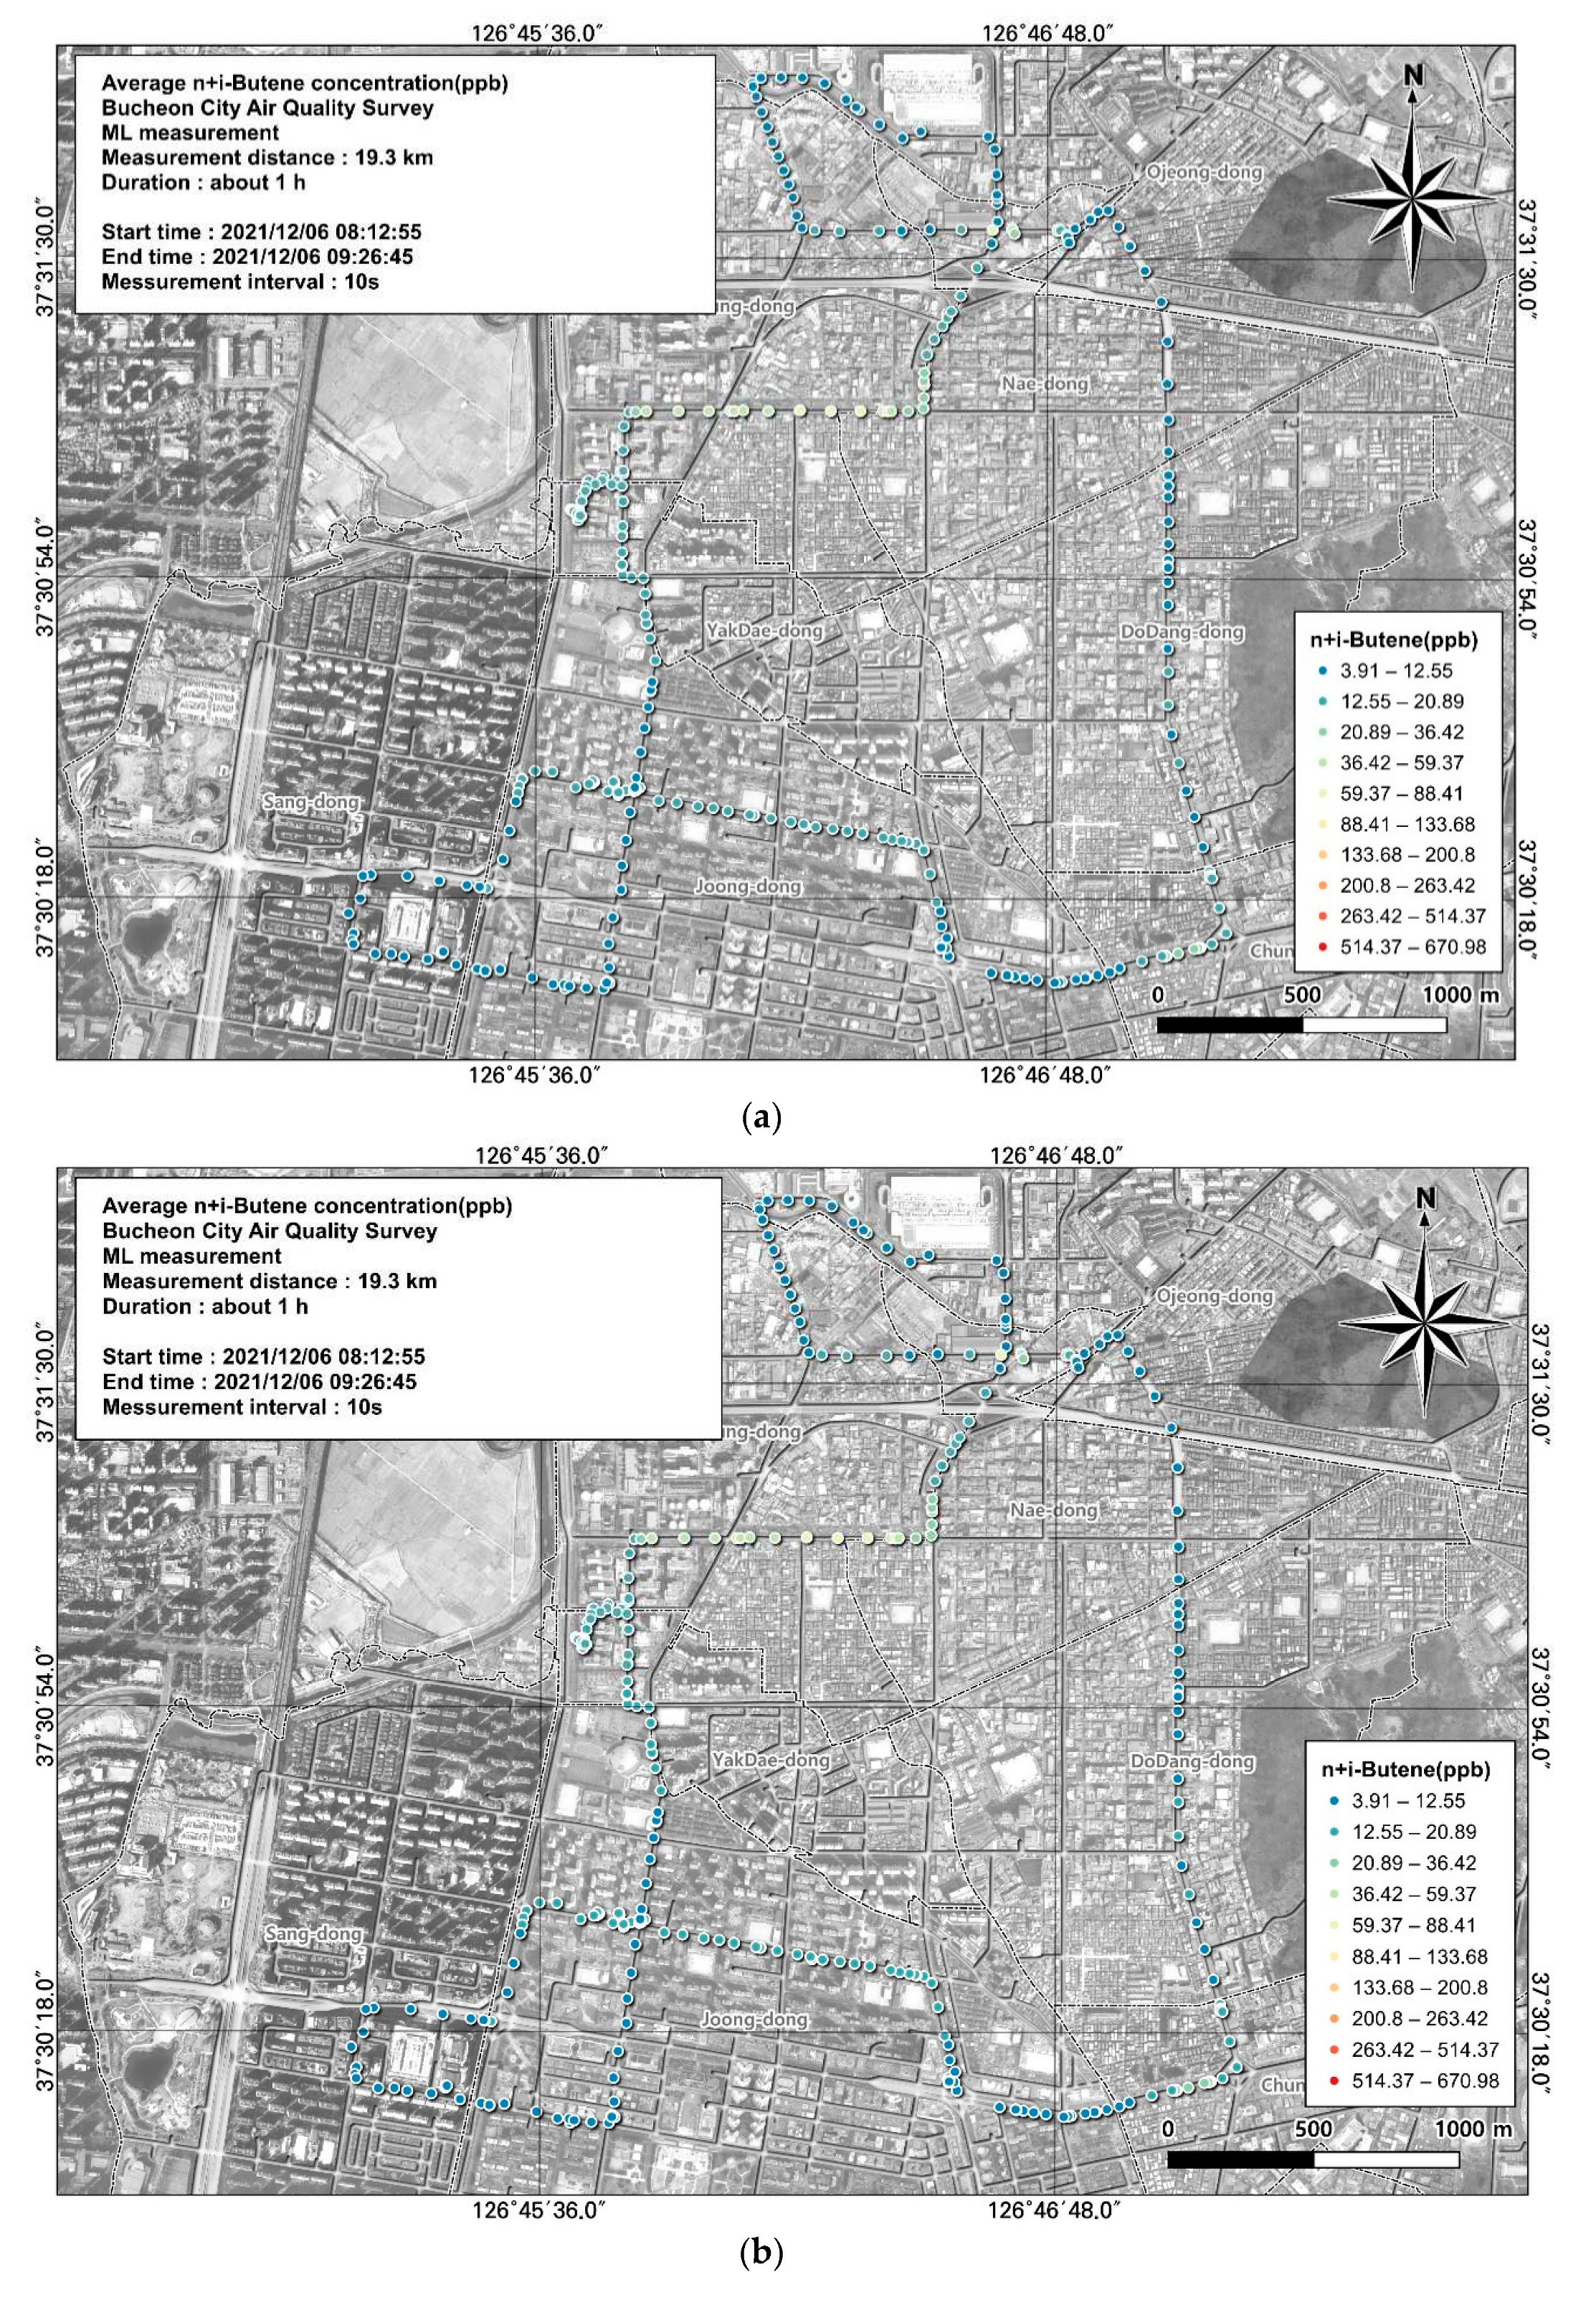

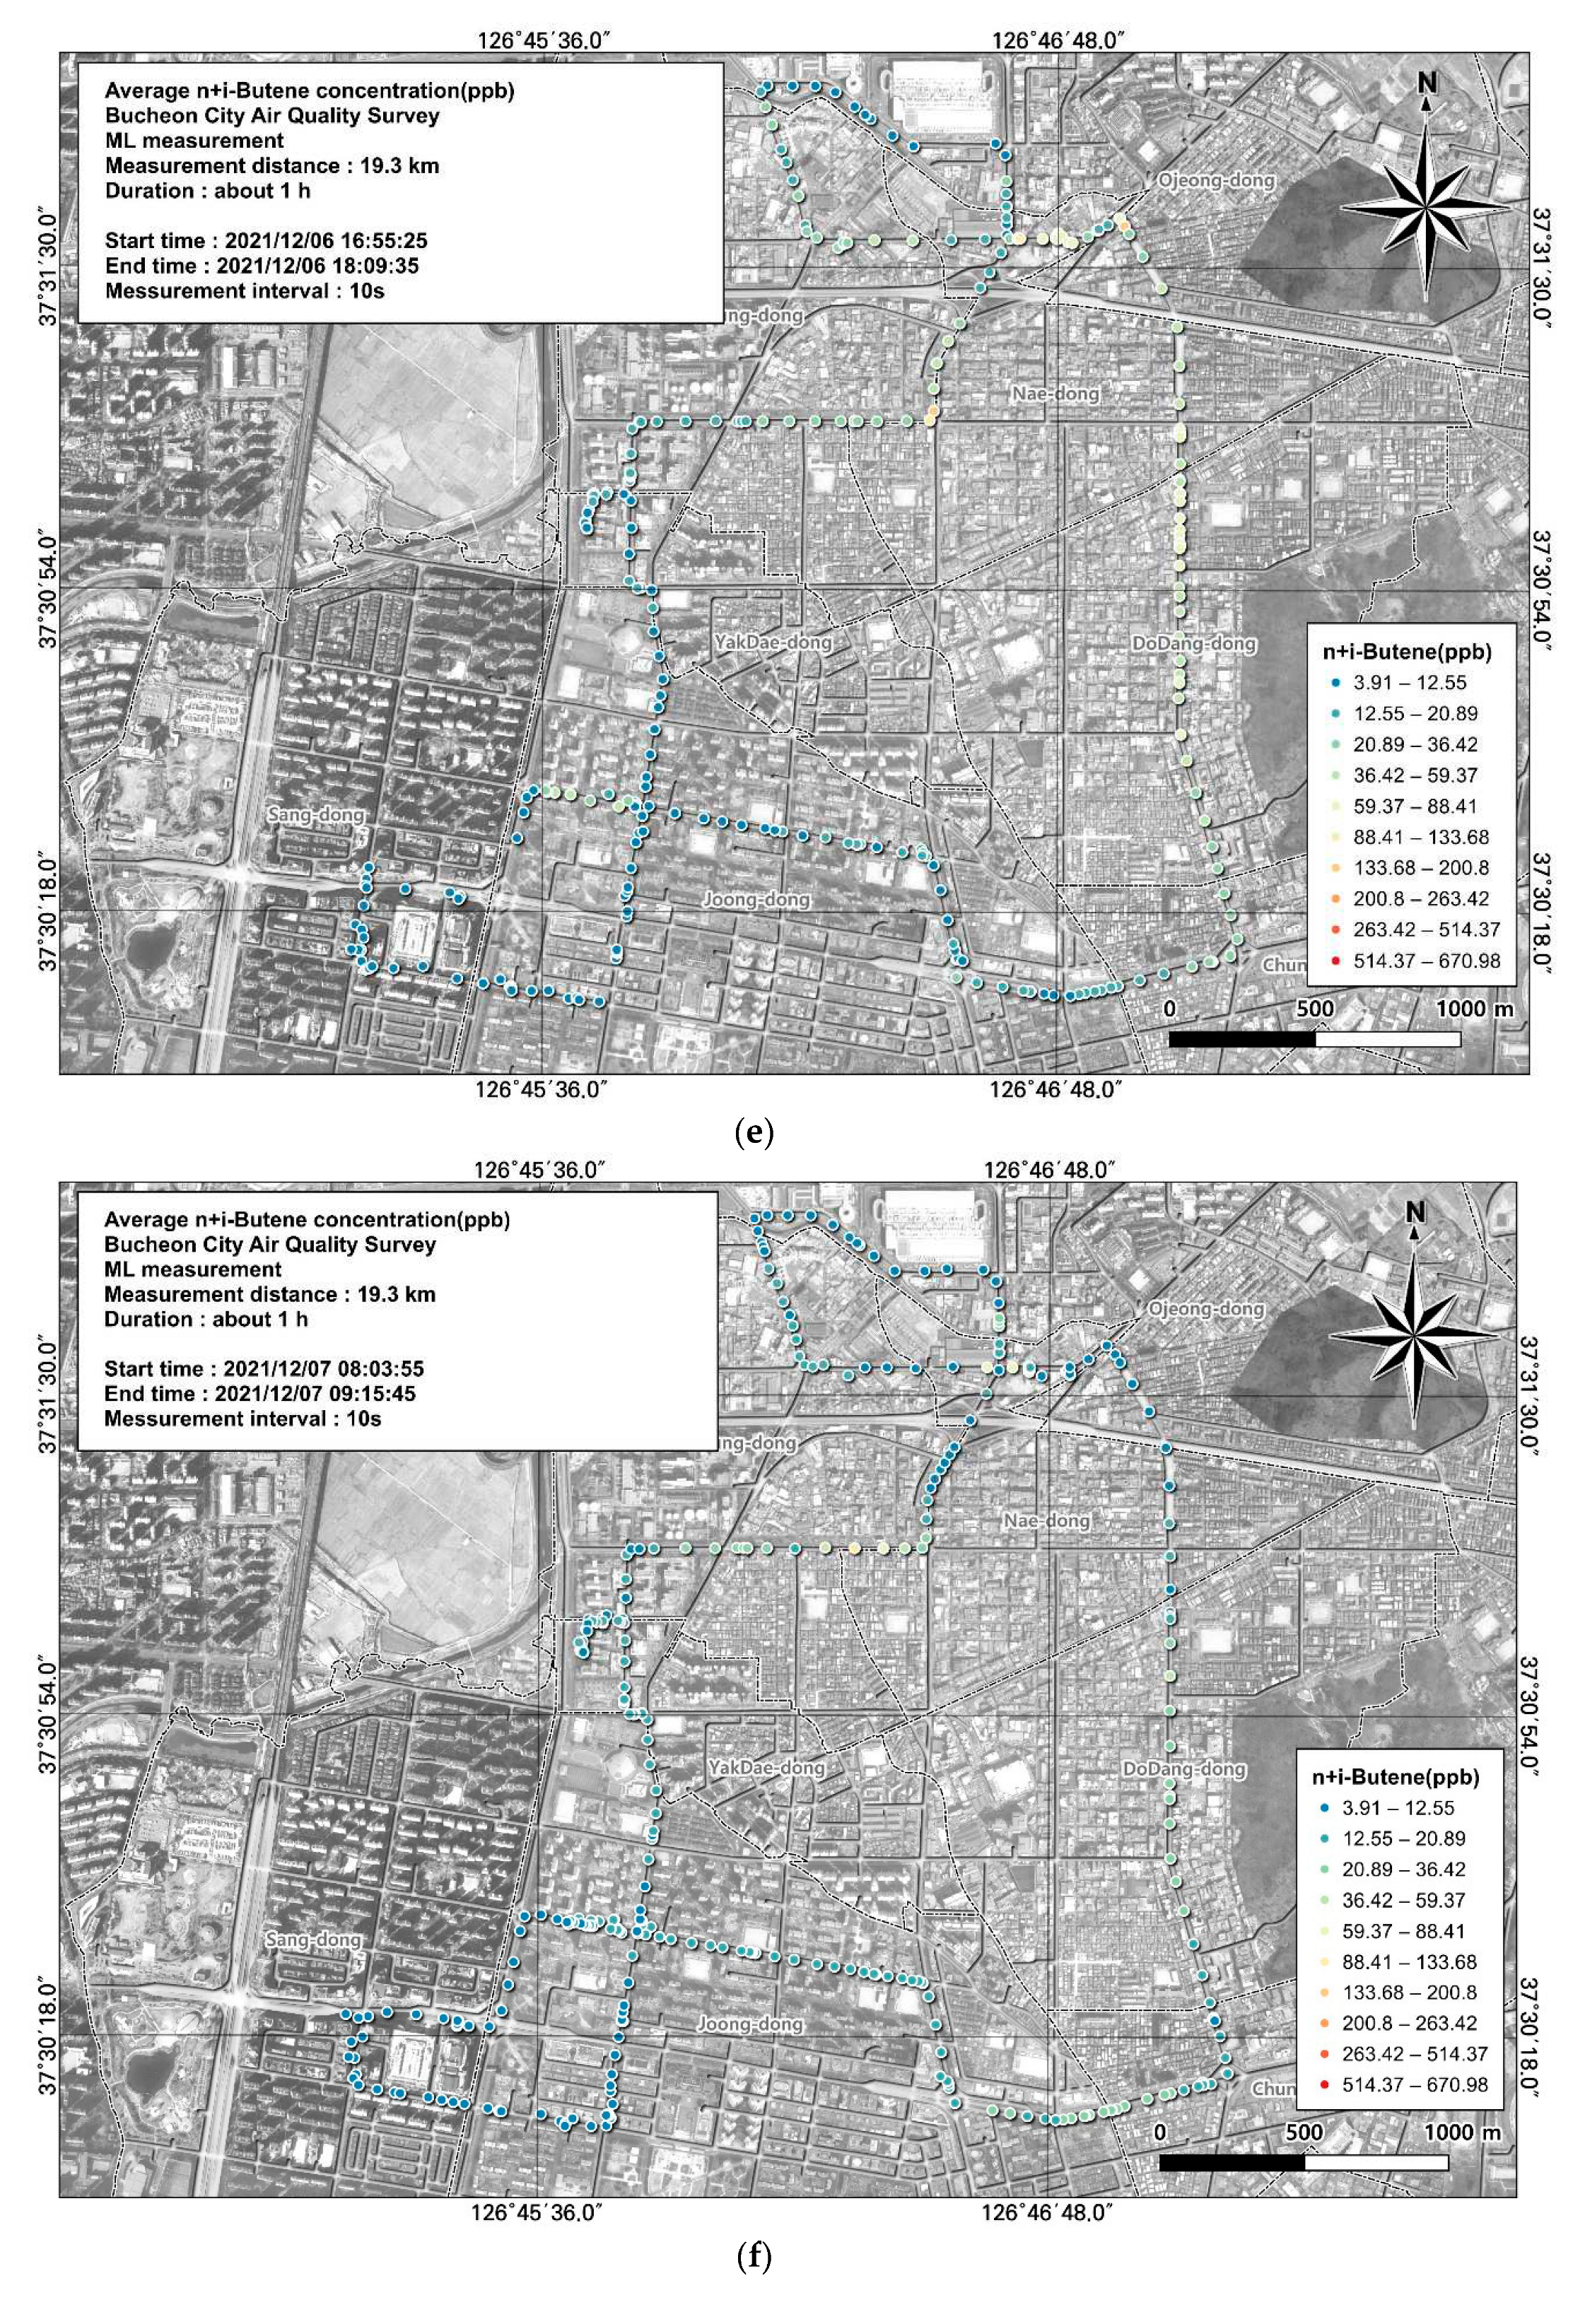
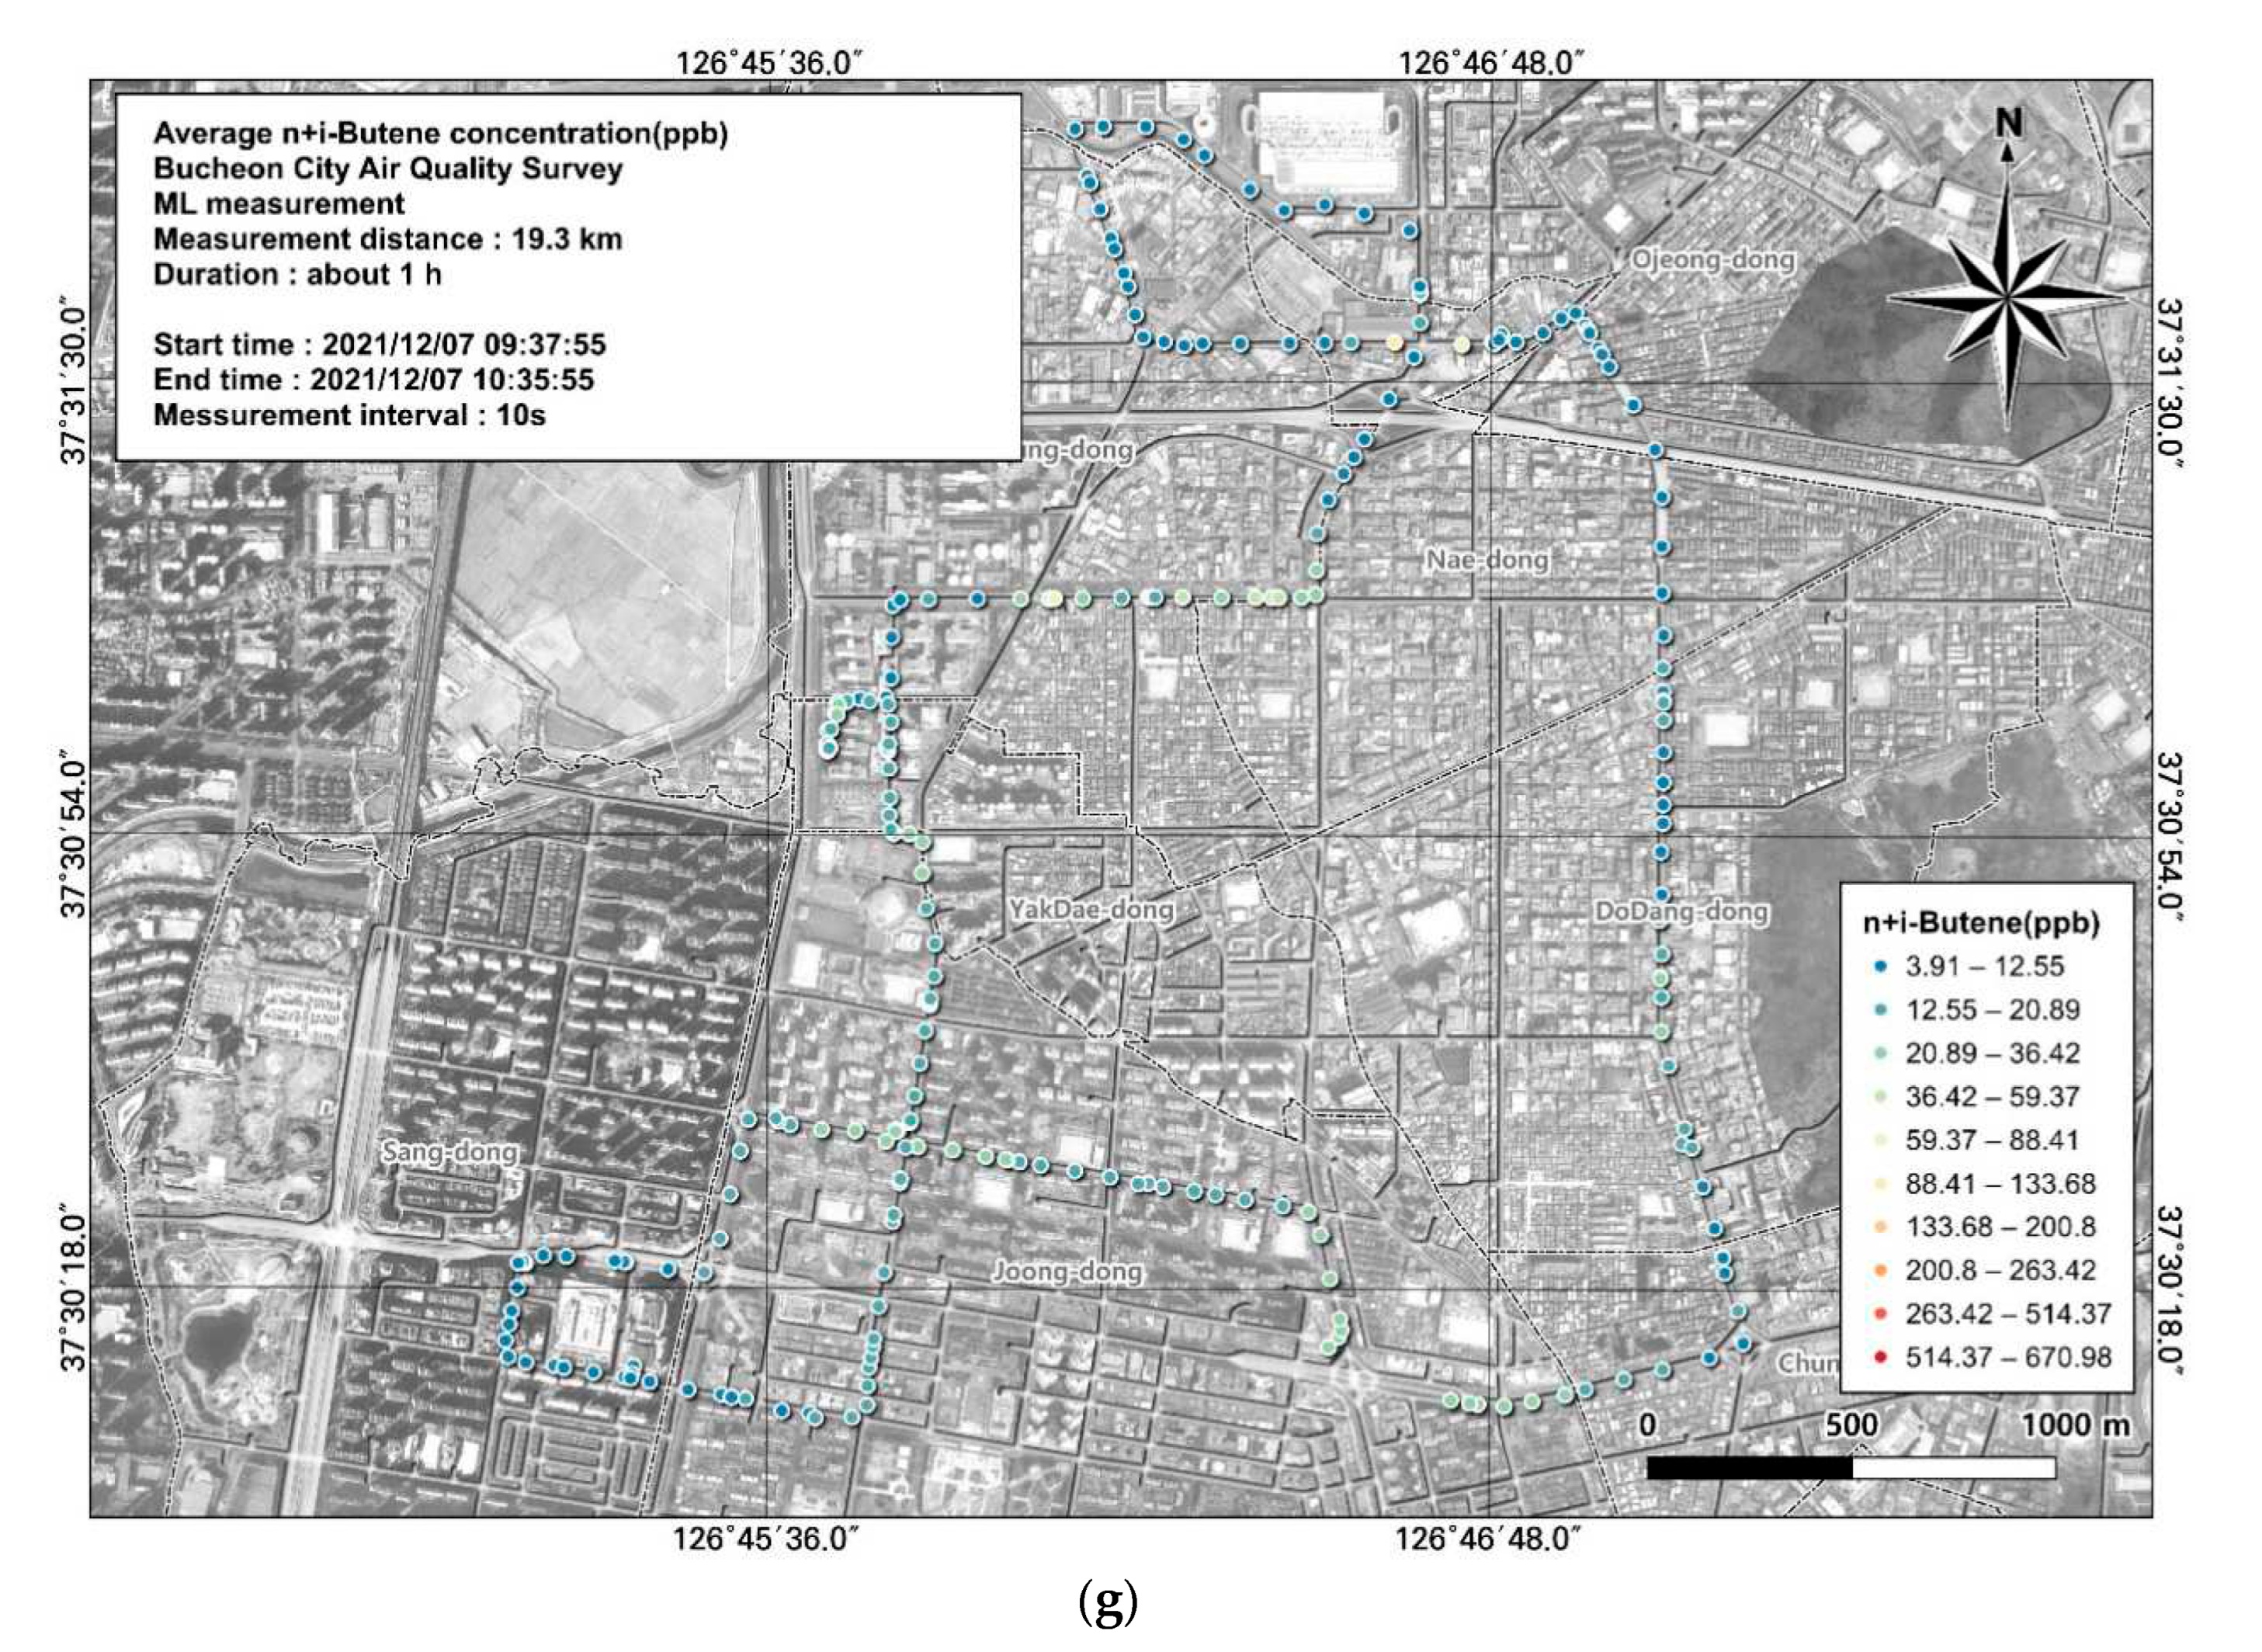
Figure 8.
Spatial and temporal distributions of VOC (n+i-butene) concentrations measured using the ML: (a) December 6, first run; (b) December 6, second run; (C) December 6, third run; (d) December 6, fourth run; (e) December 6, fifth run; (f) December 7, first run; (g) December 7, second run.
Figure 8.
Spatial and temporal distributions of VOC (n+i-butene) concentrations measured using the ML: (a) December 6, first run; (b) December 6, second run; (C) December 6, third run; (d) December 6, fourth run; (e) December 6, fifth run; (f) December 7, first run; (g) December 7, second run.
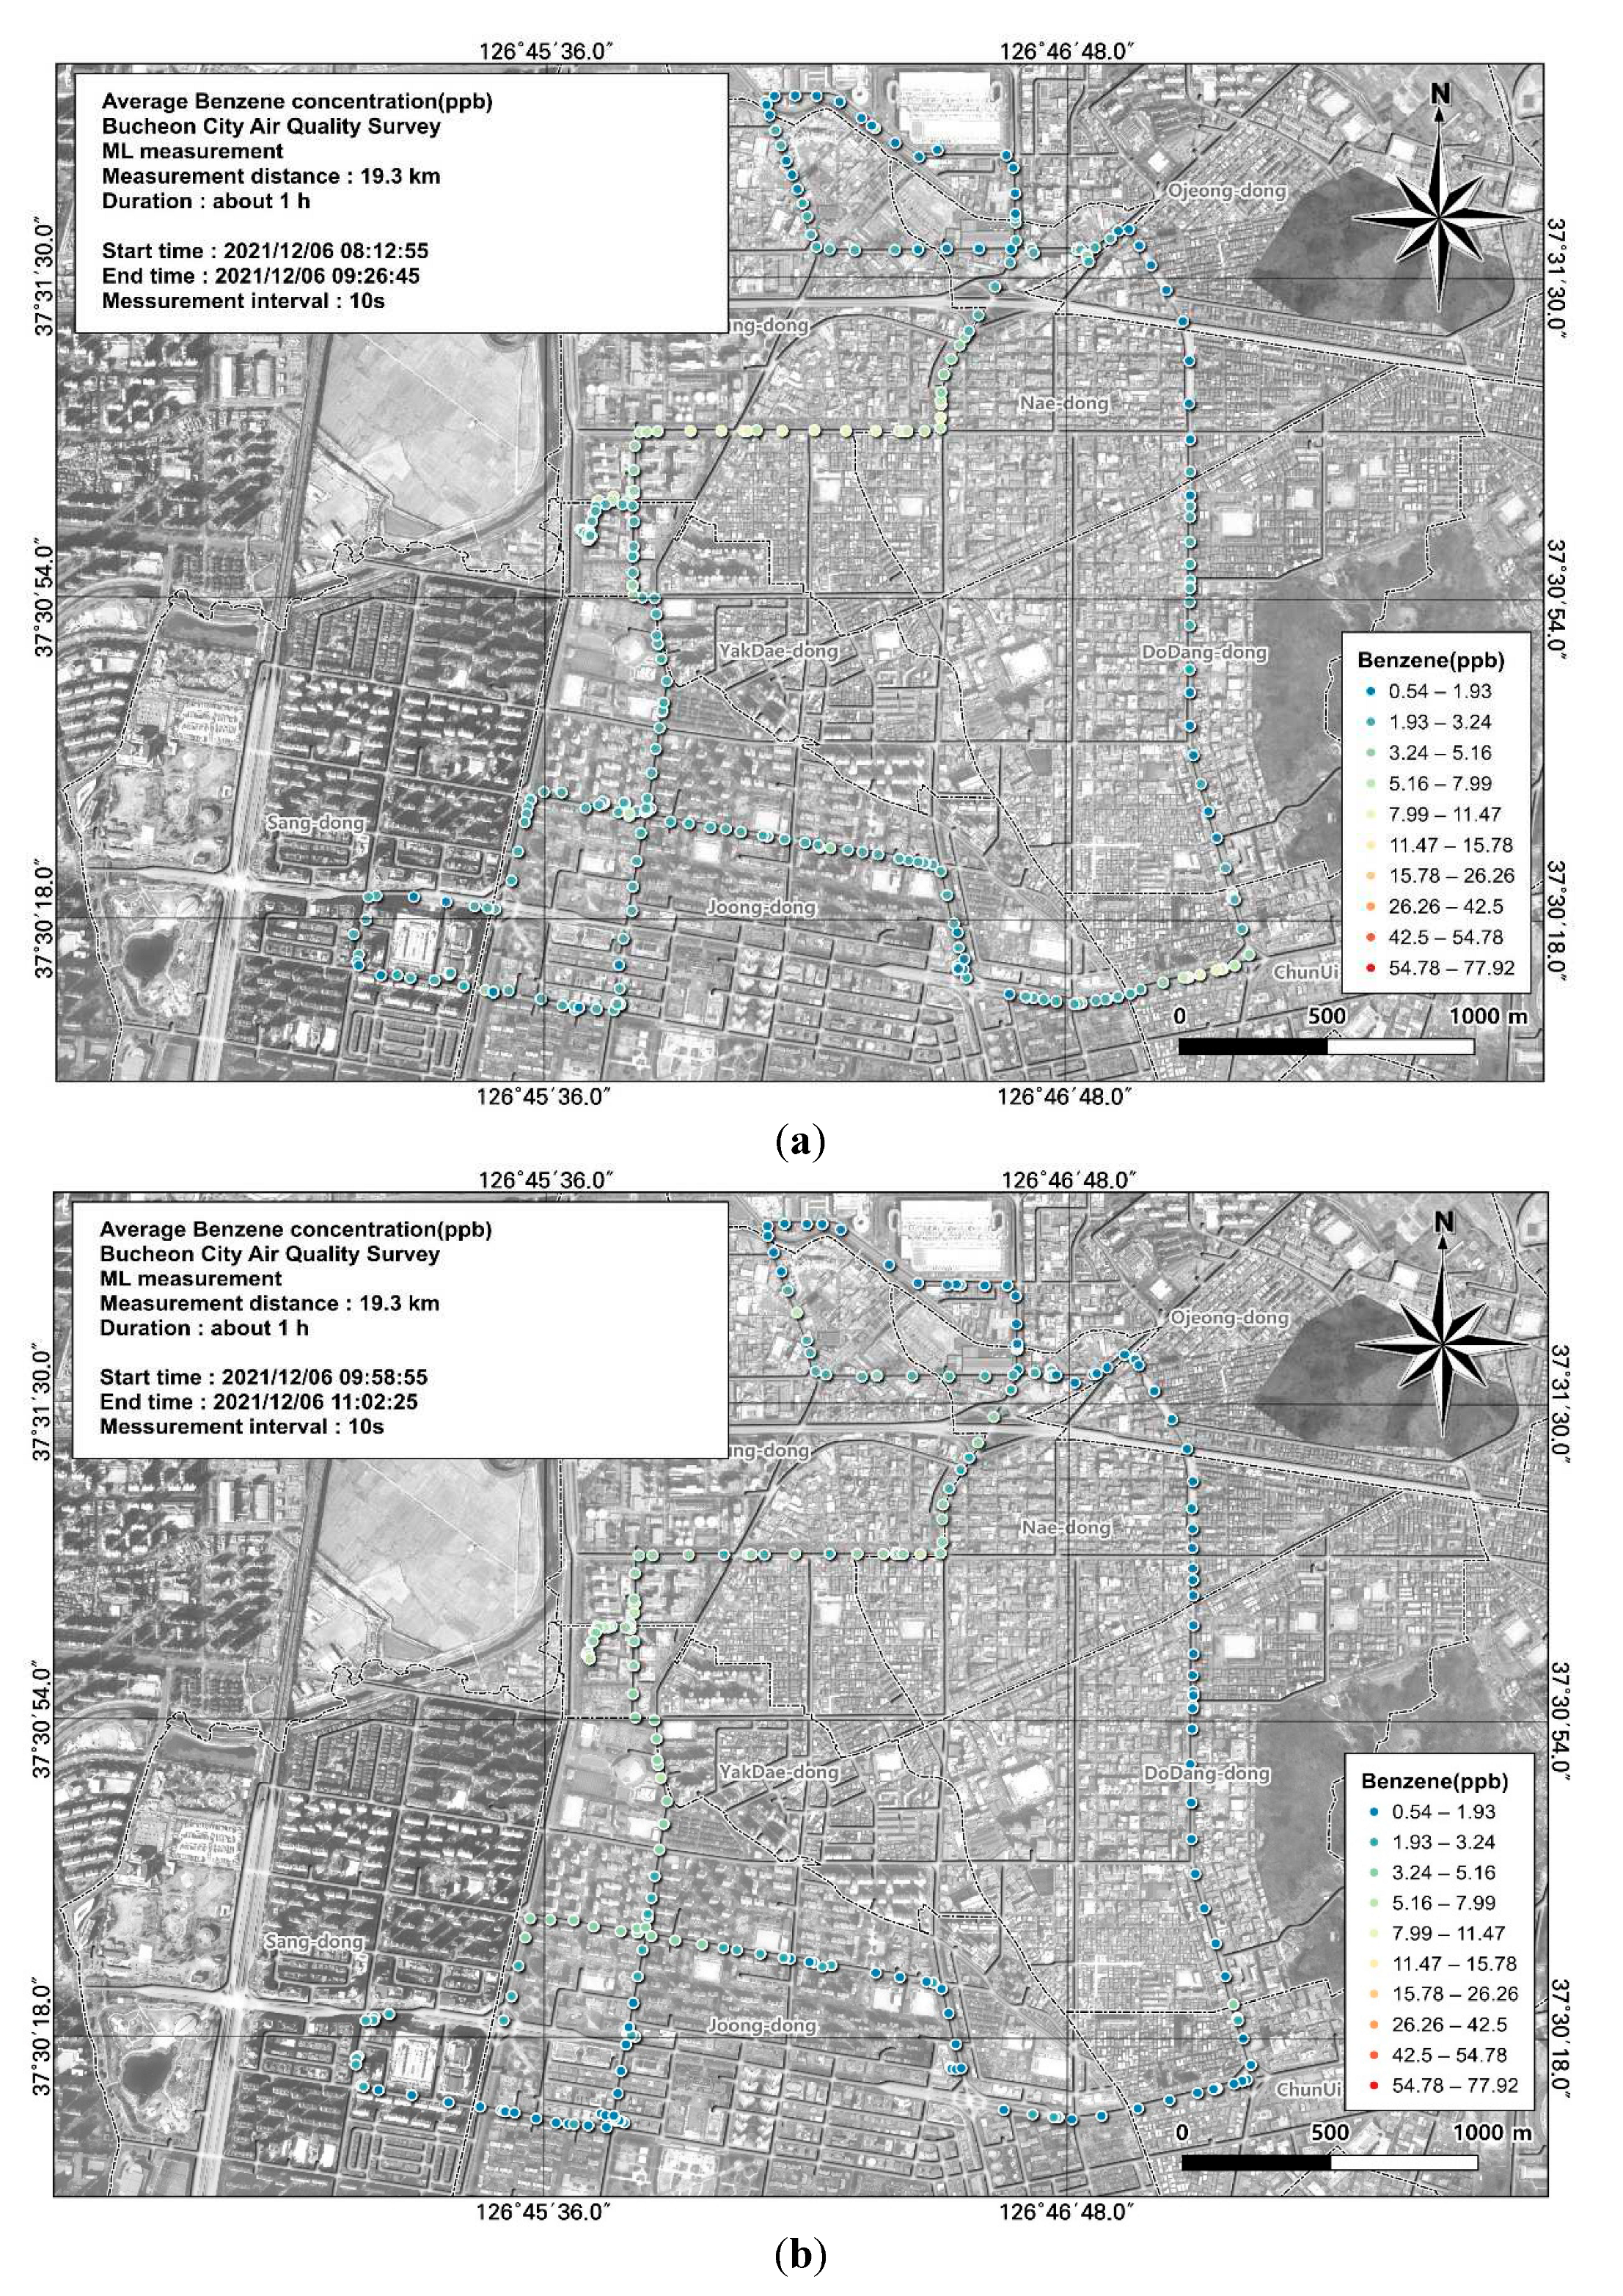
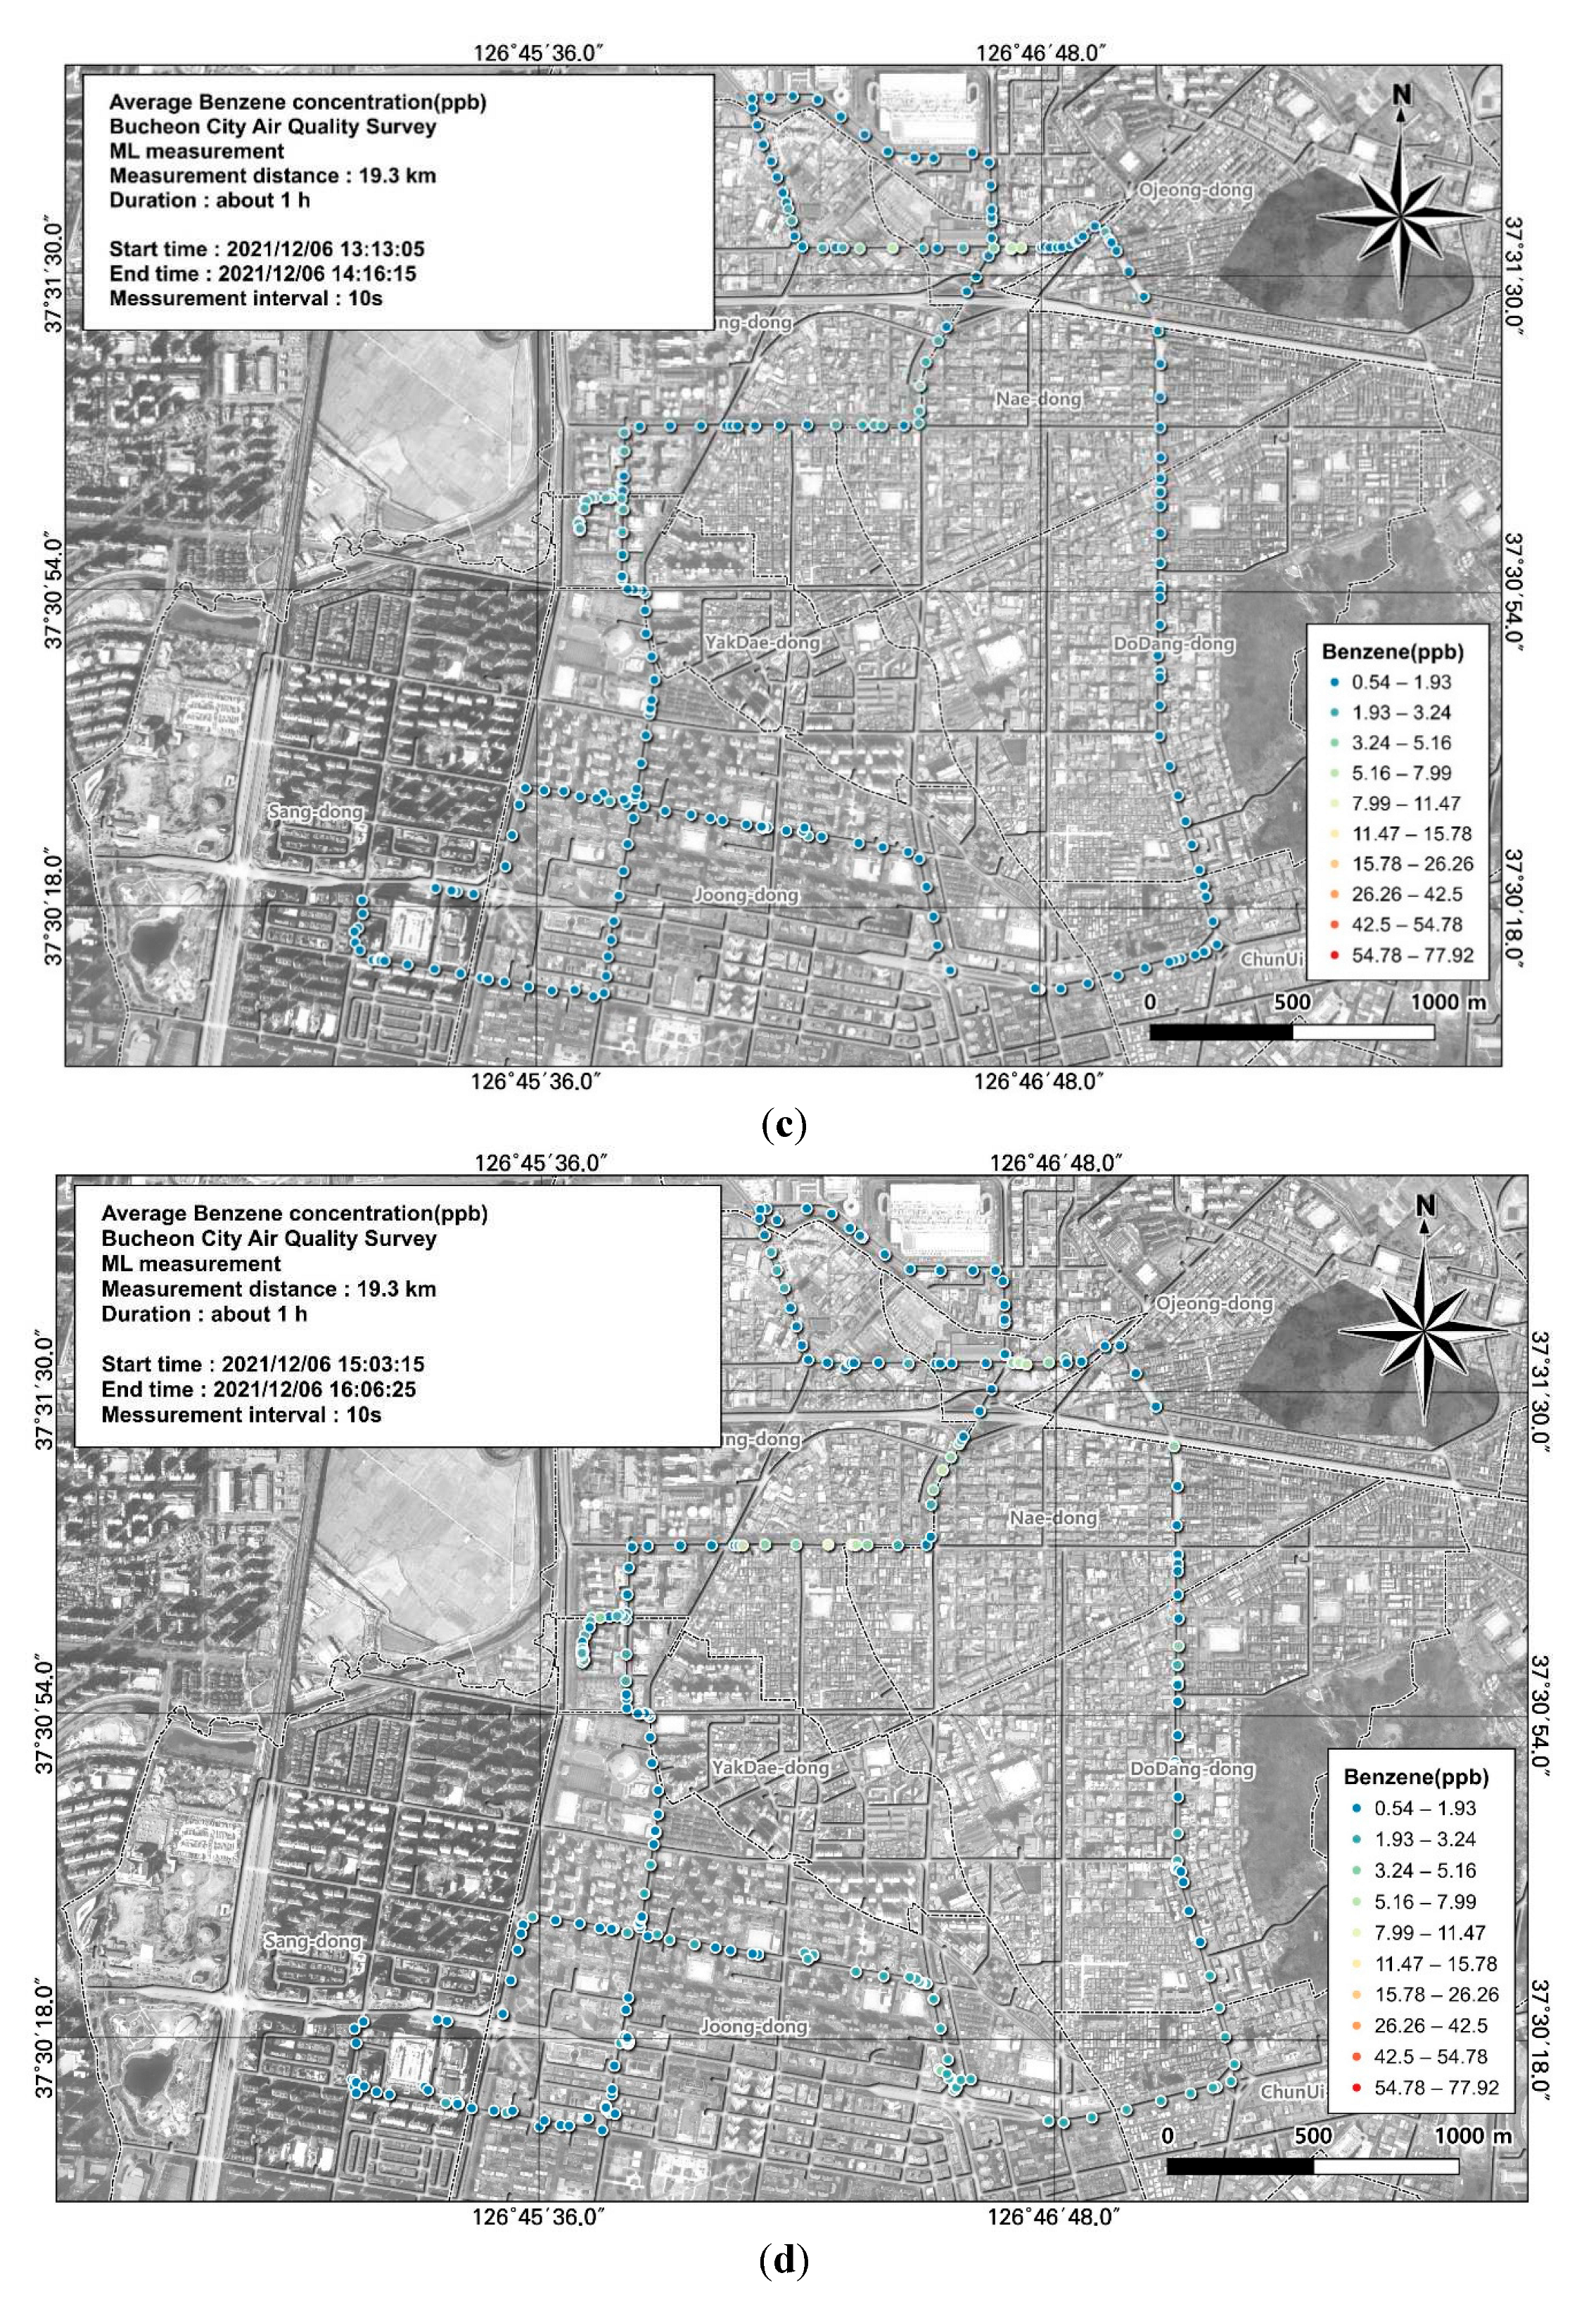
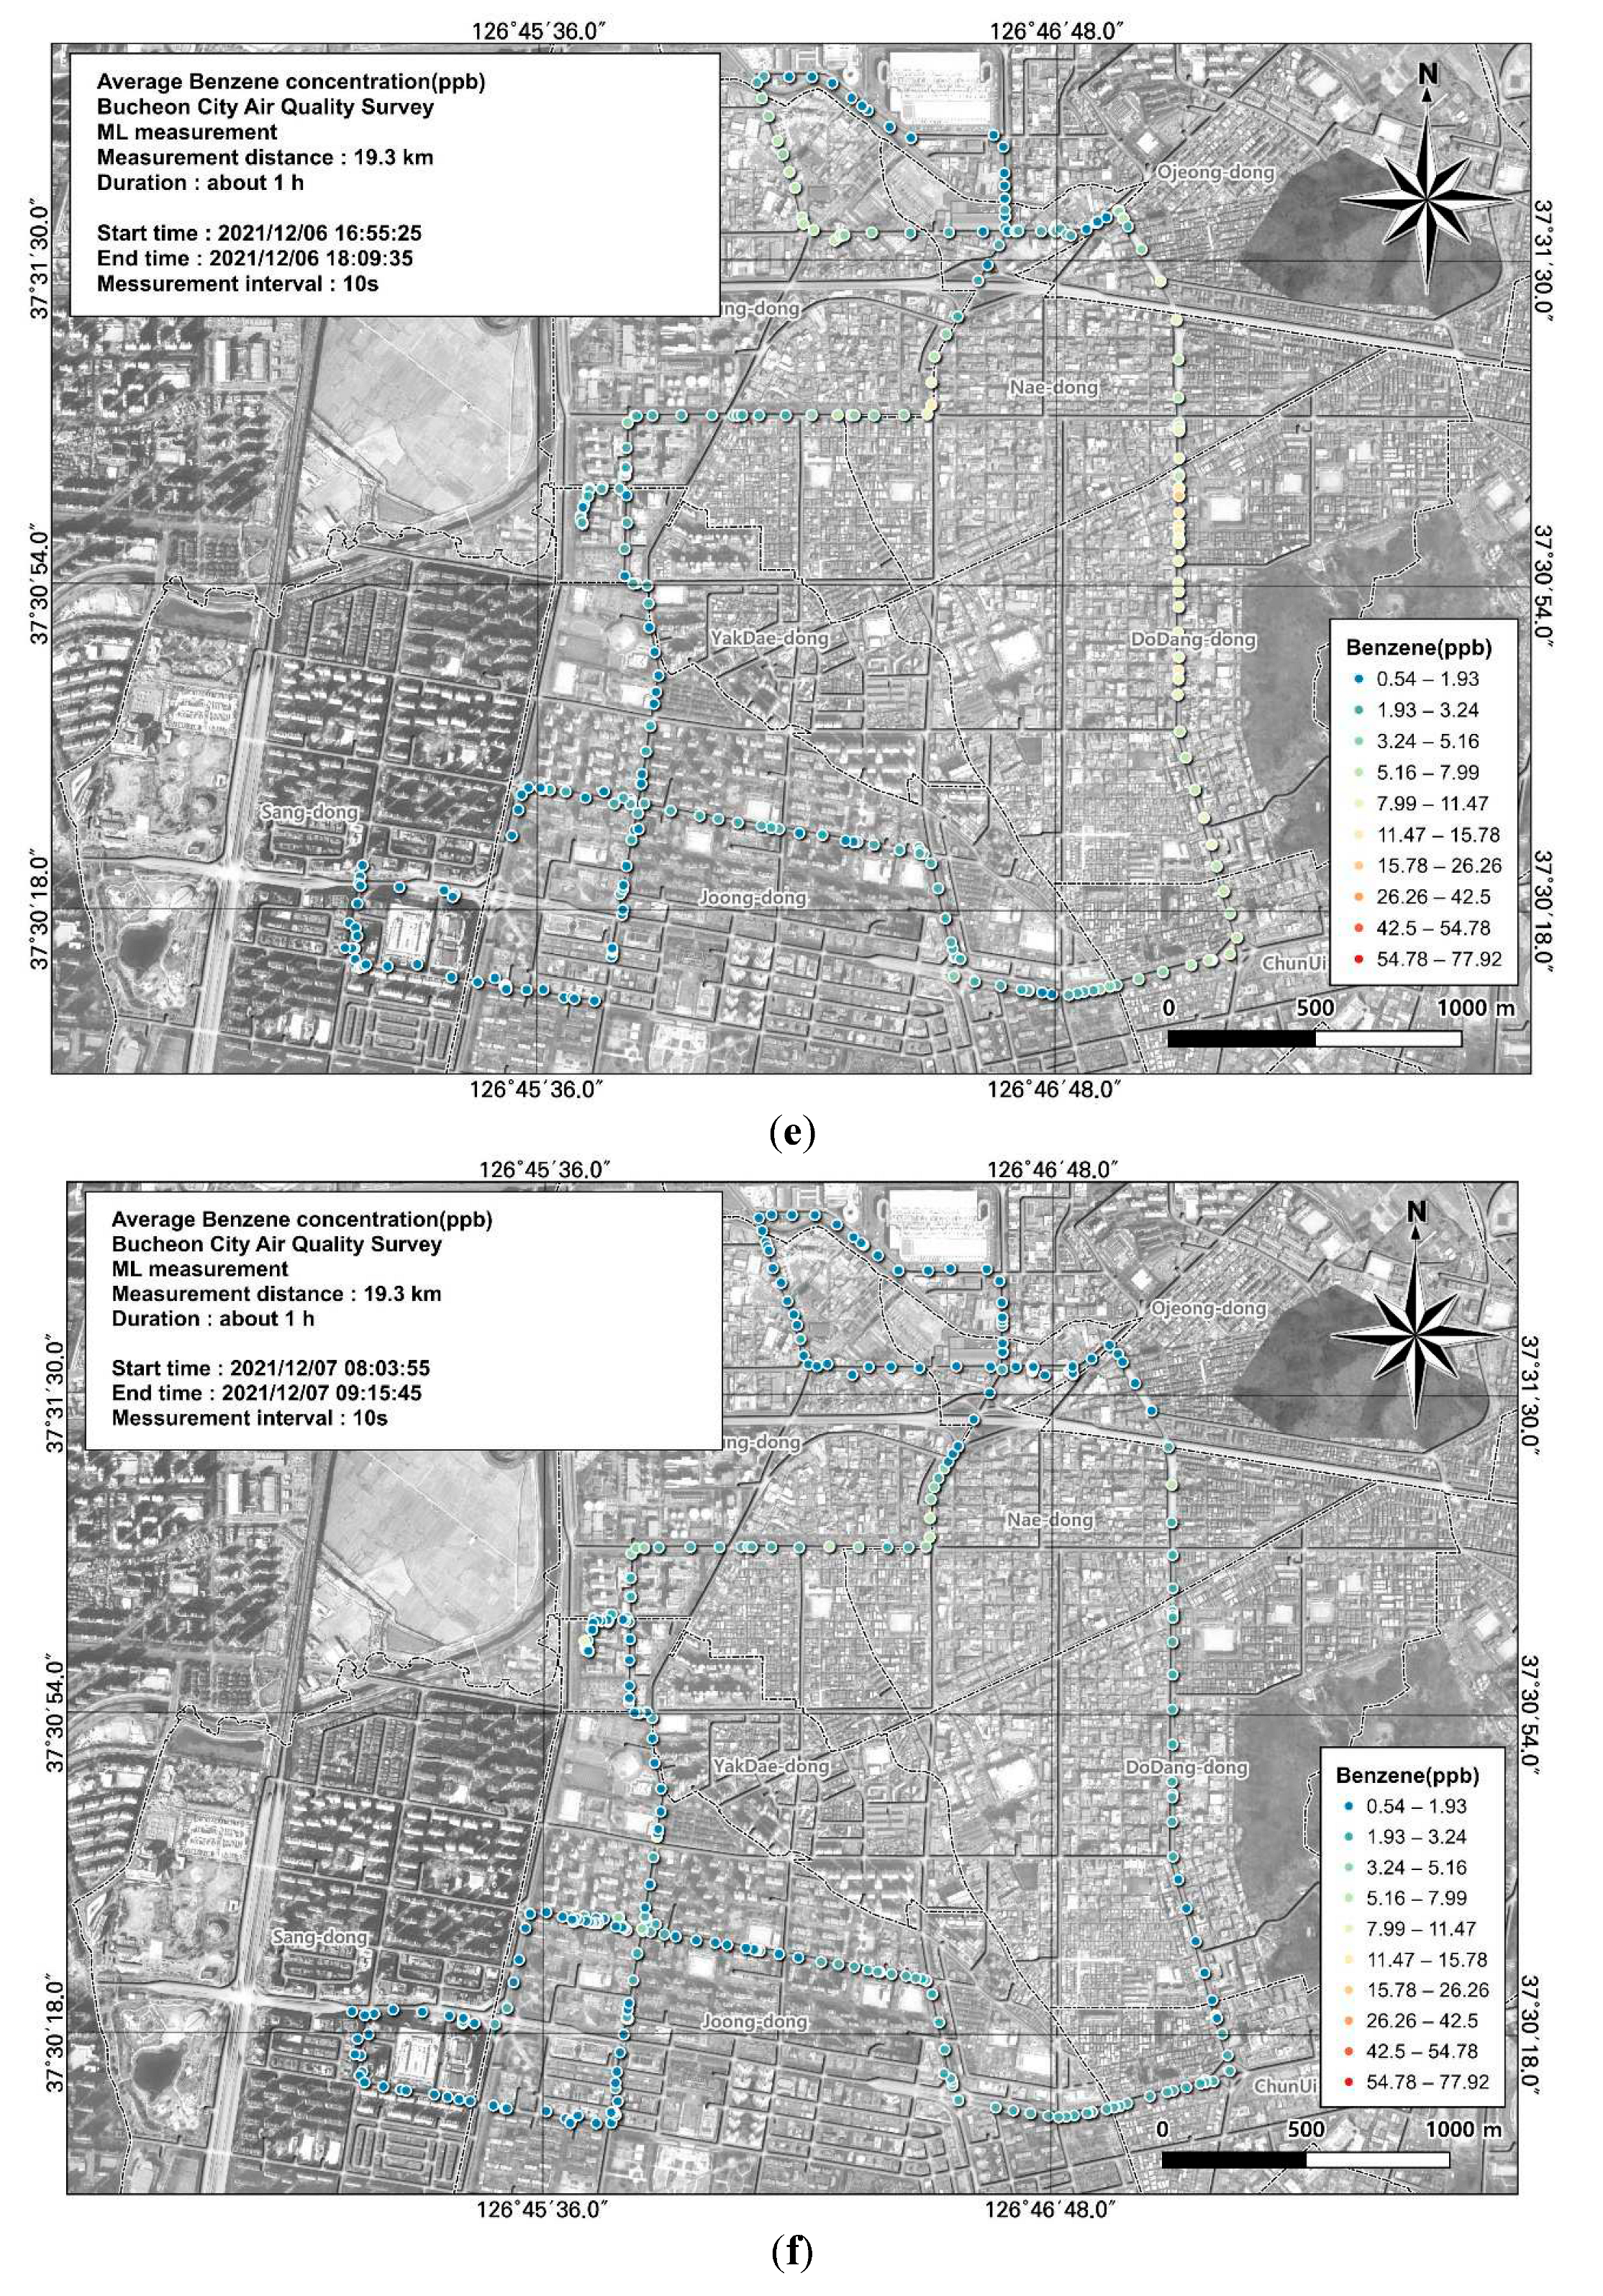
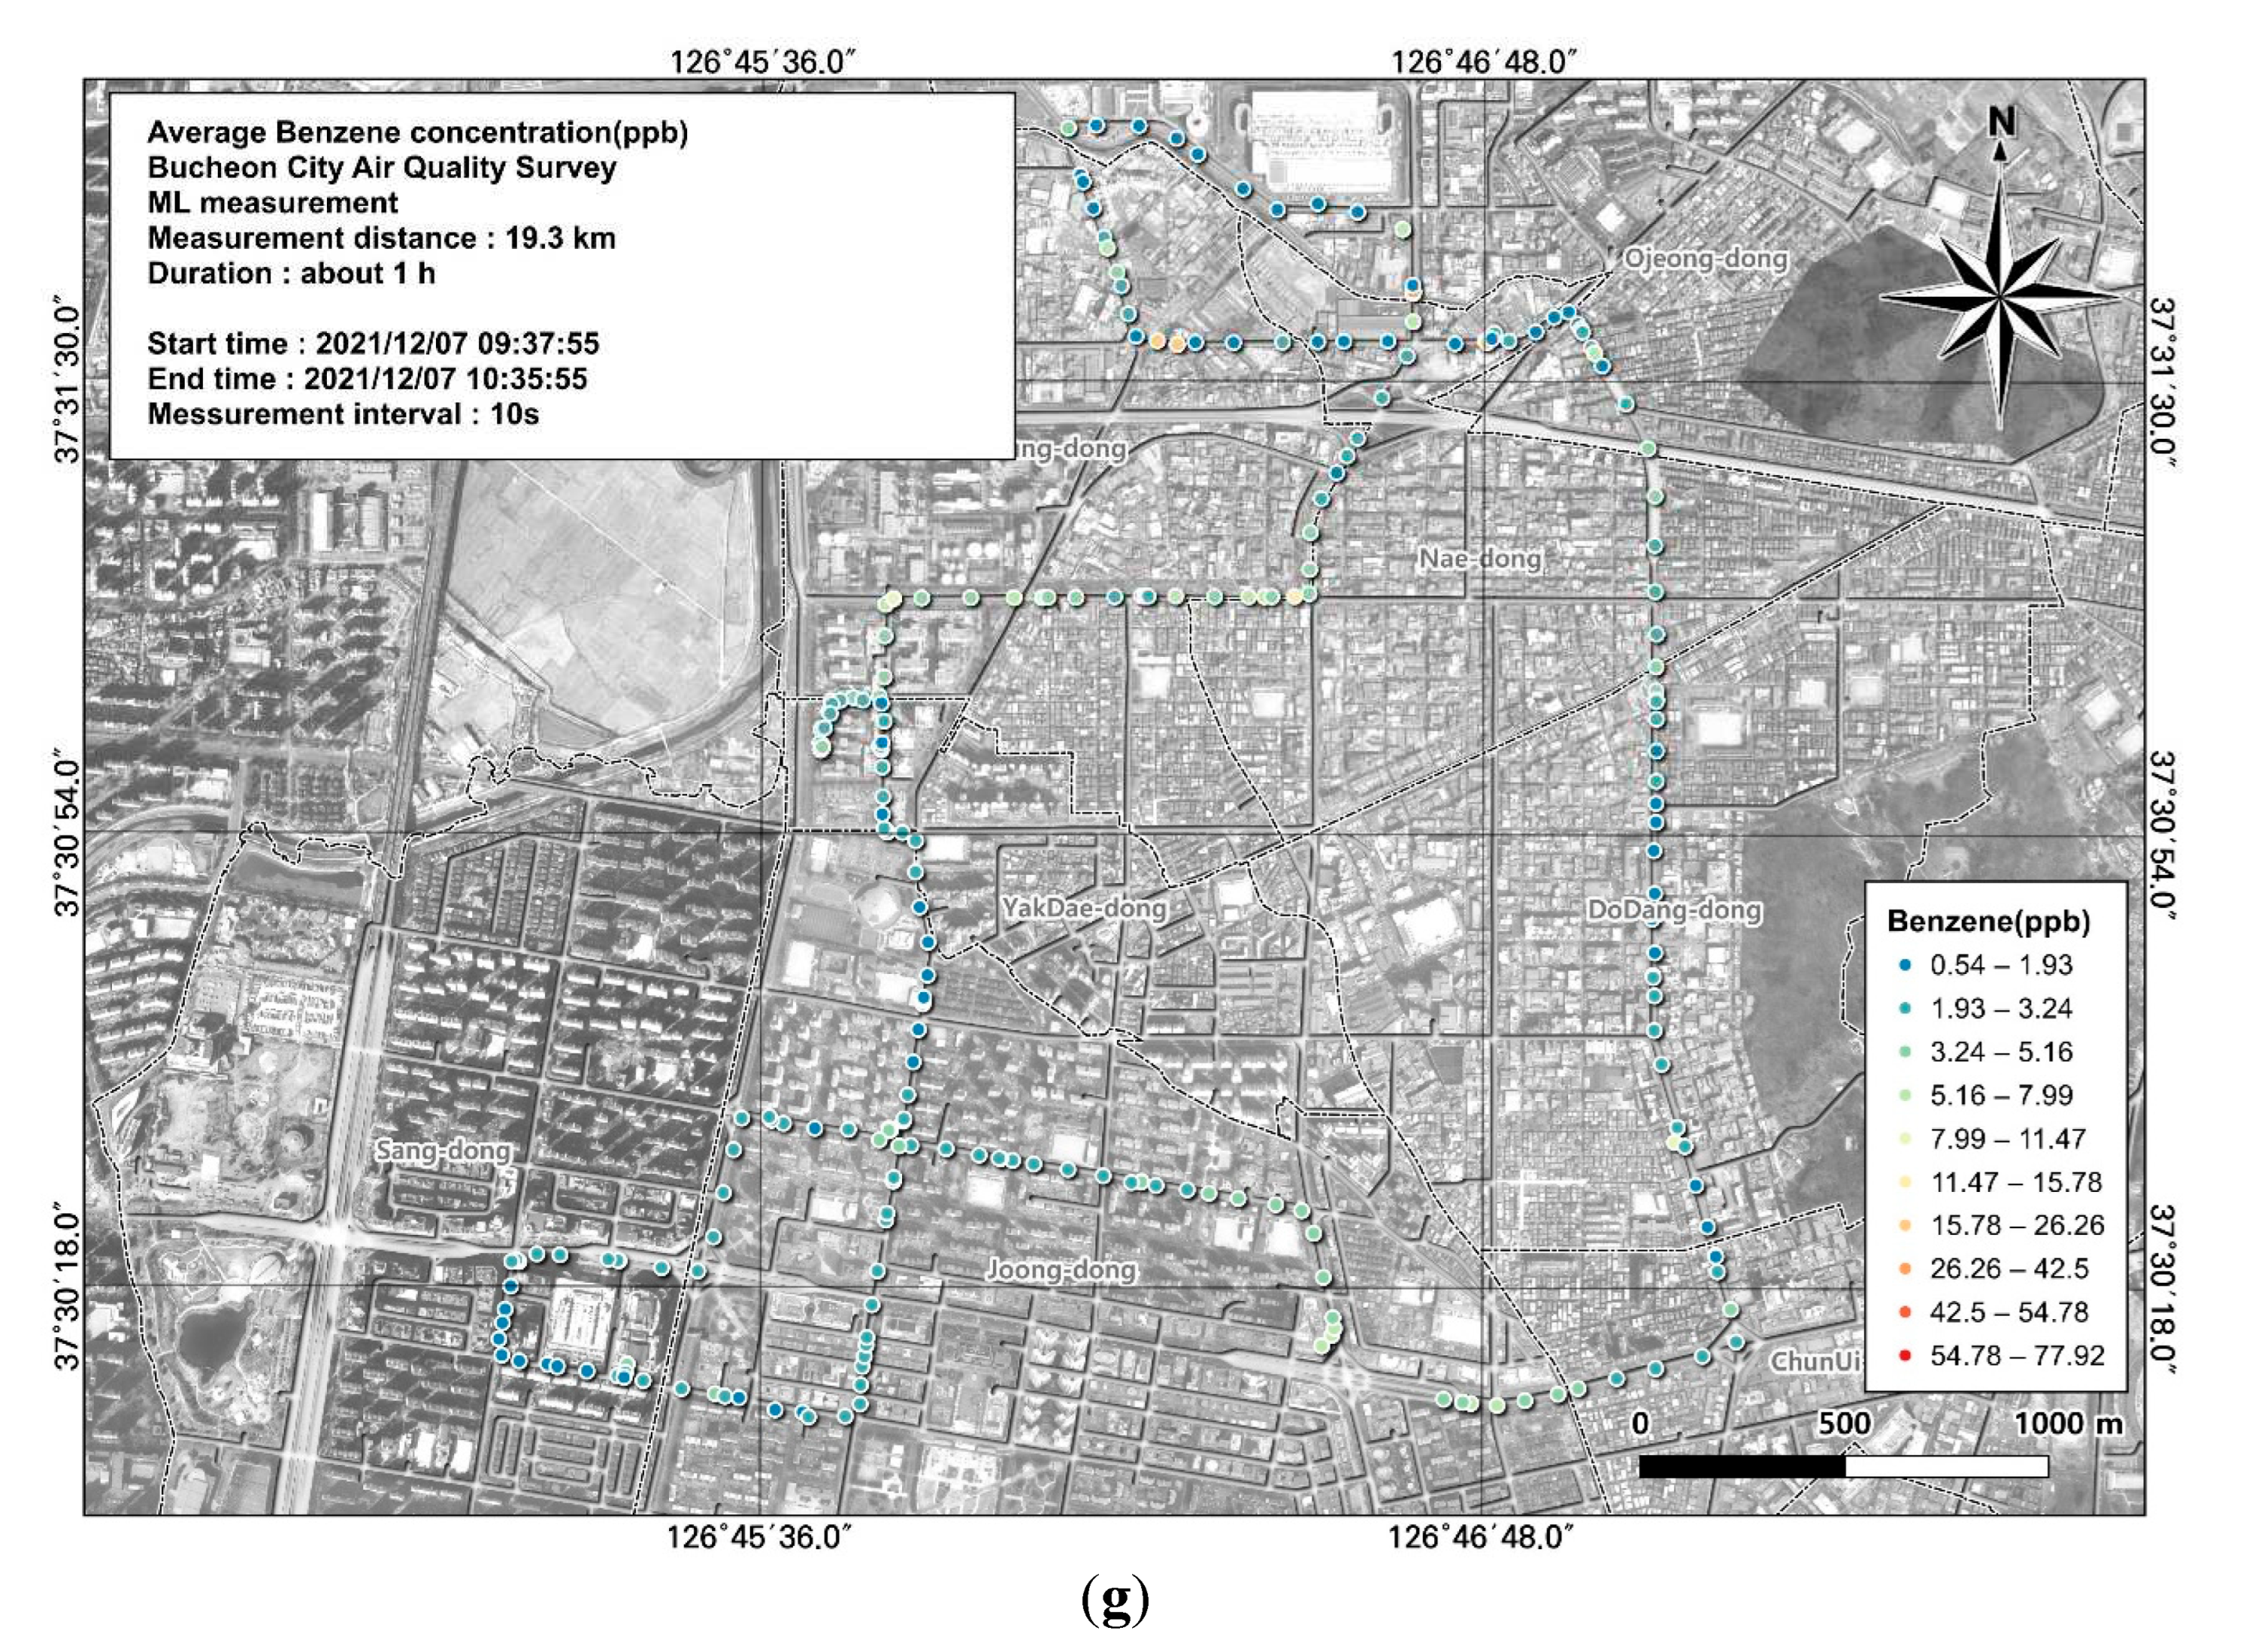
Figure 9.
Associations of VOC (toluene) concentrations with (a) average traffic speed and (b) estimated traffic volume during the morning rush hour, corresponding to Figure 5e.
Figure 9.
Associations of VOC (toluene) concentrations with (a) average traffic speed and (b) estimated traffic volume during the morning rush hour, corresponding to Figure 5e.
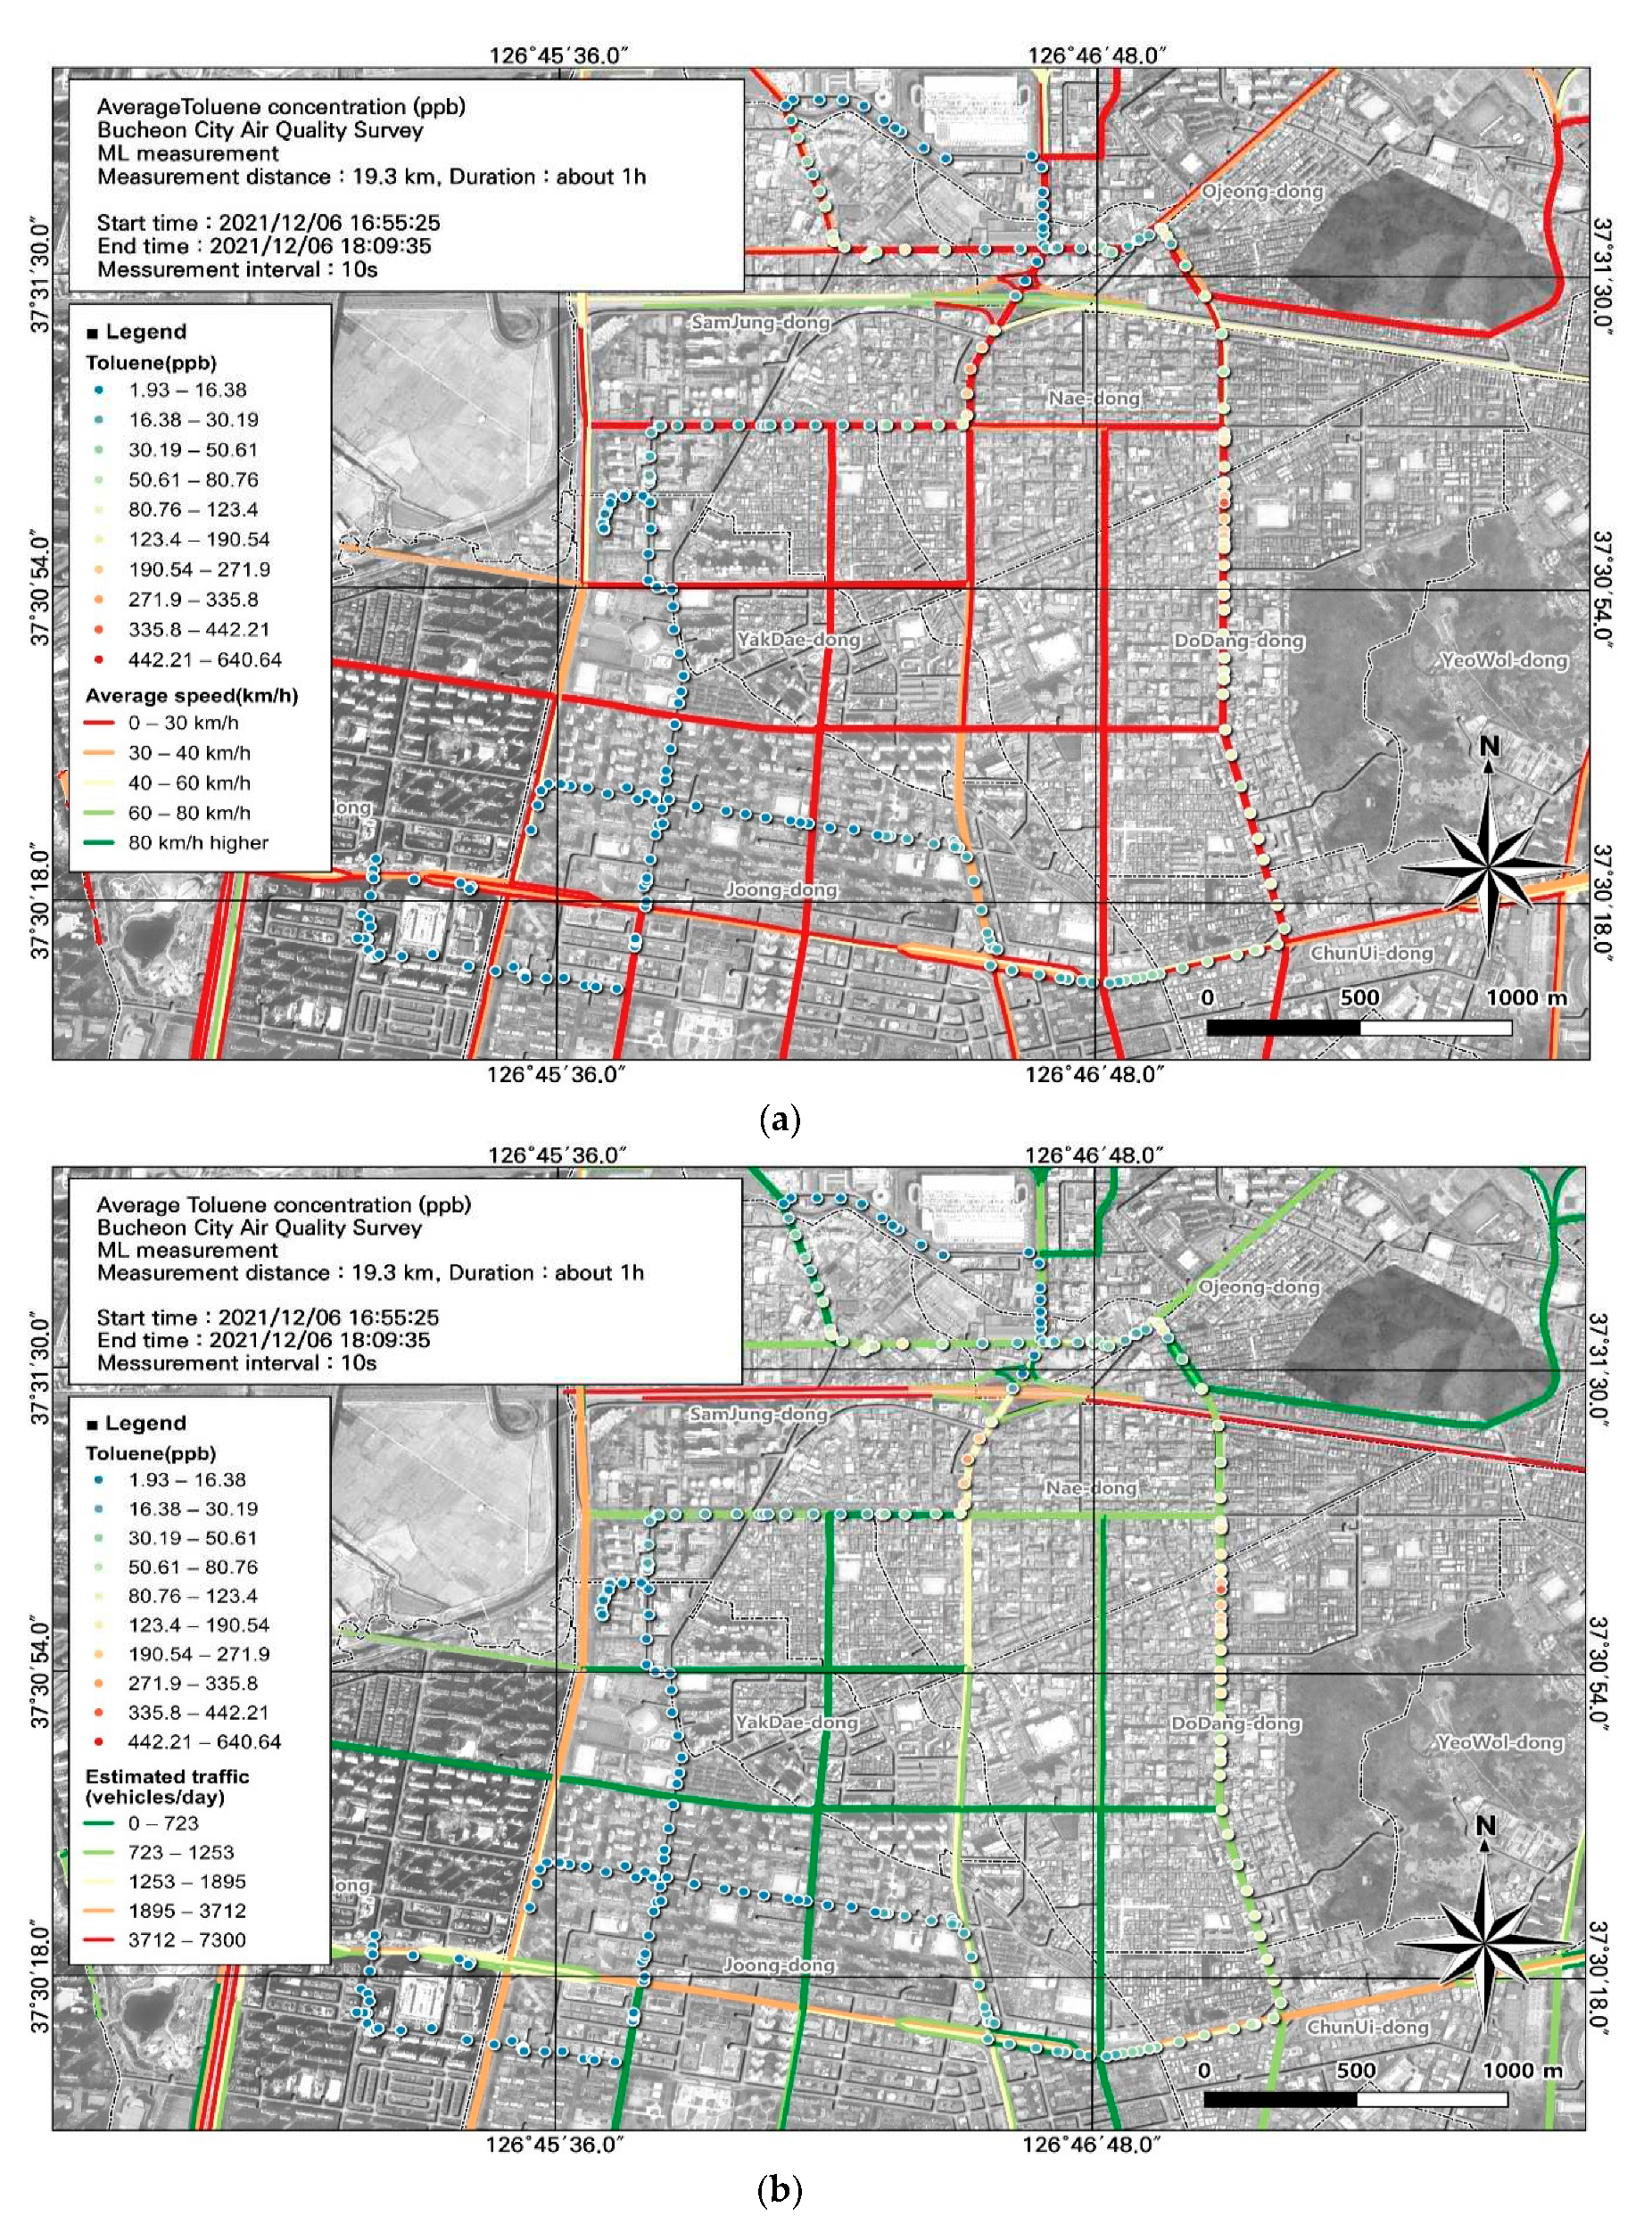
Figure 10.
Associations of VOC (methanol) concentrations with (a) average traffic speed and (b) estimated traffic volume during the morning rush hour, corresponding to Figure 6e.
Figure 10.
Associations of VOC (methanol) concentrations with (a) average traffic speed and (b) estimated traffic volume during the morning rush hour, corresponding to Figure 6e.
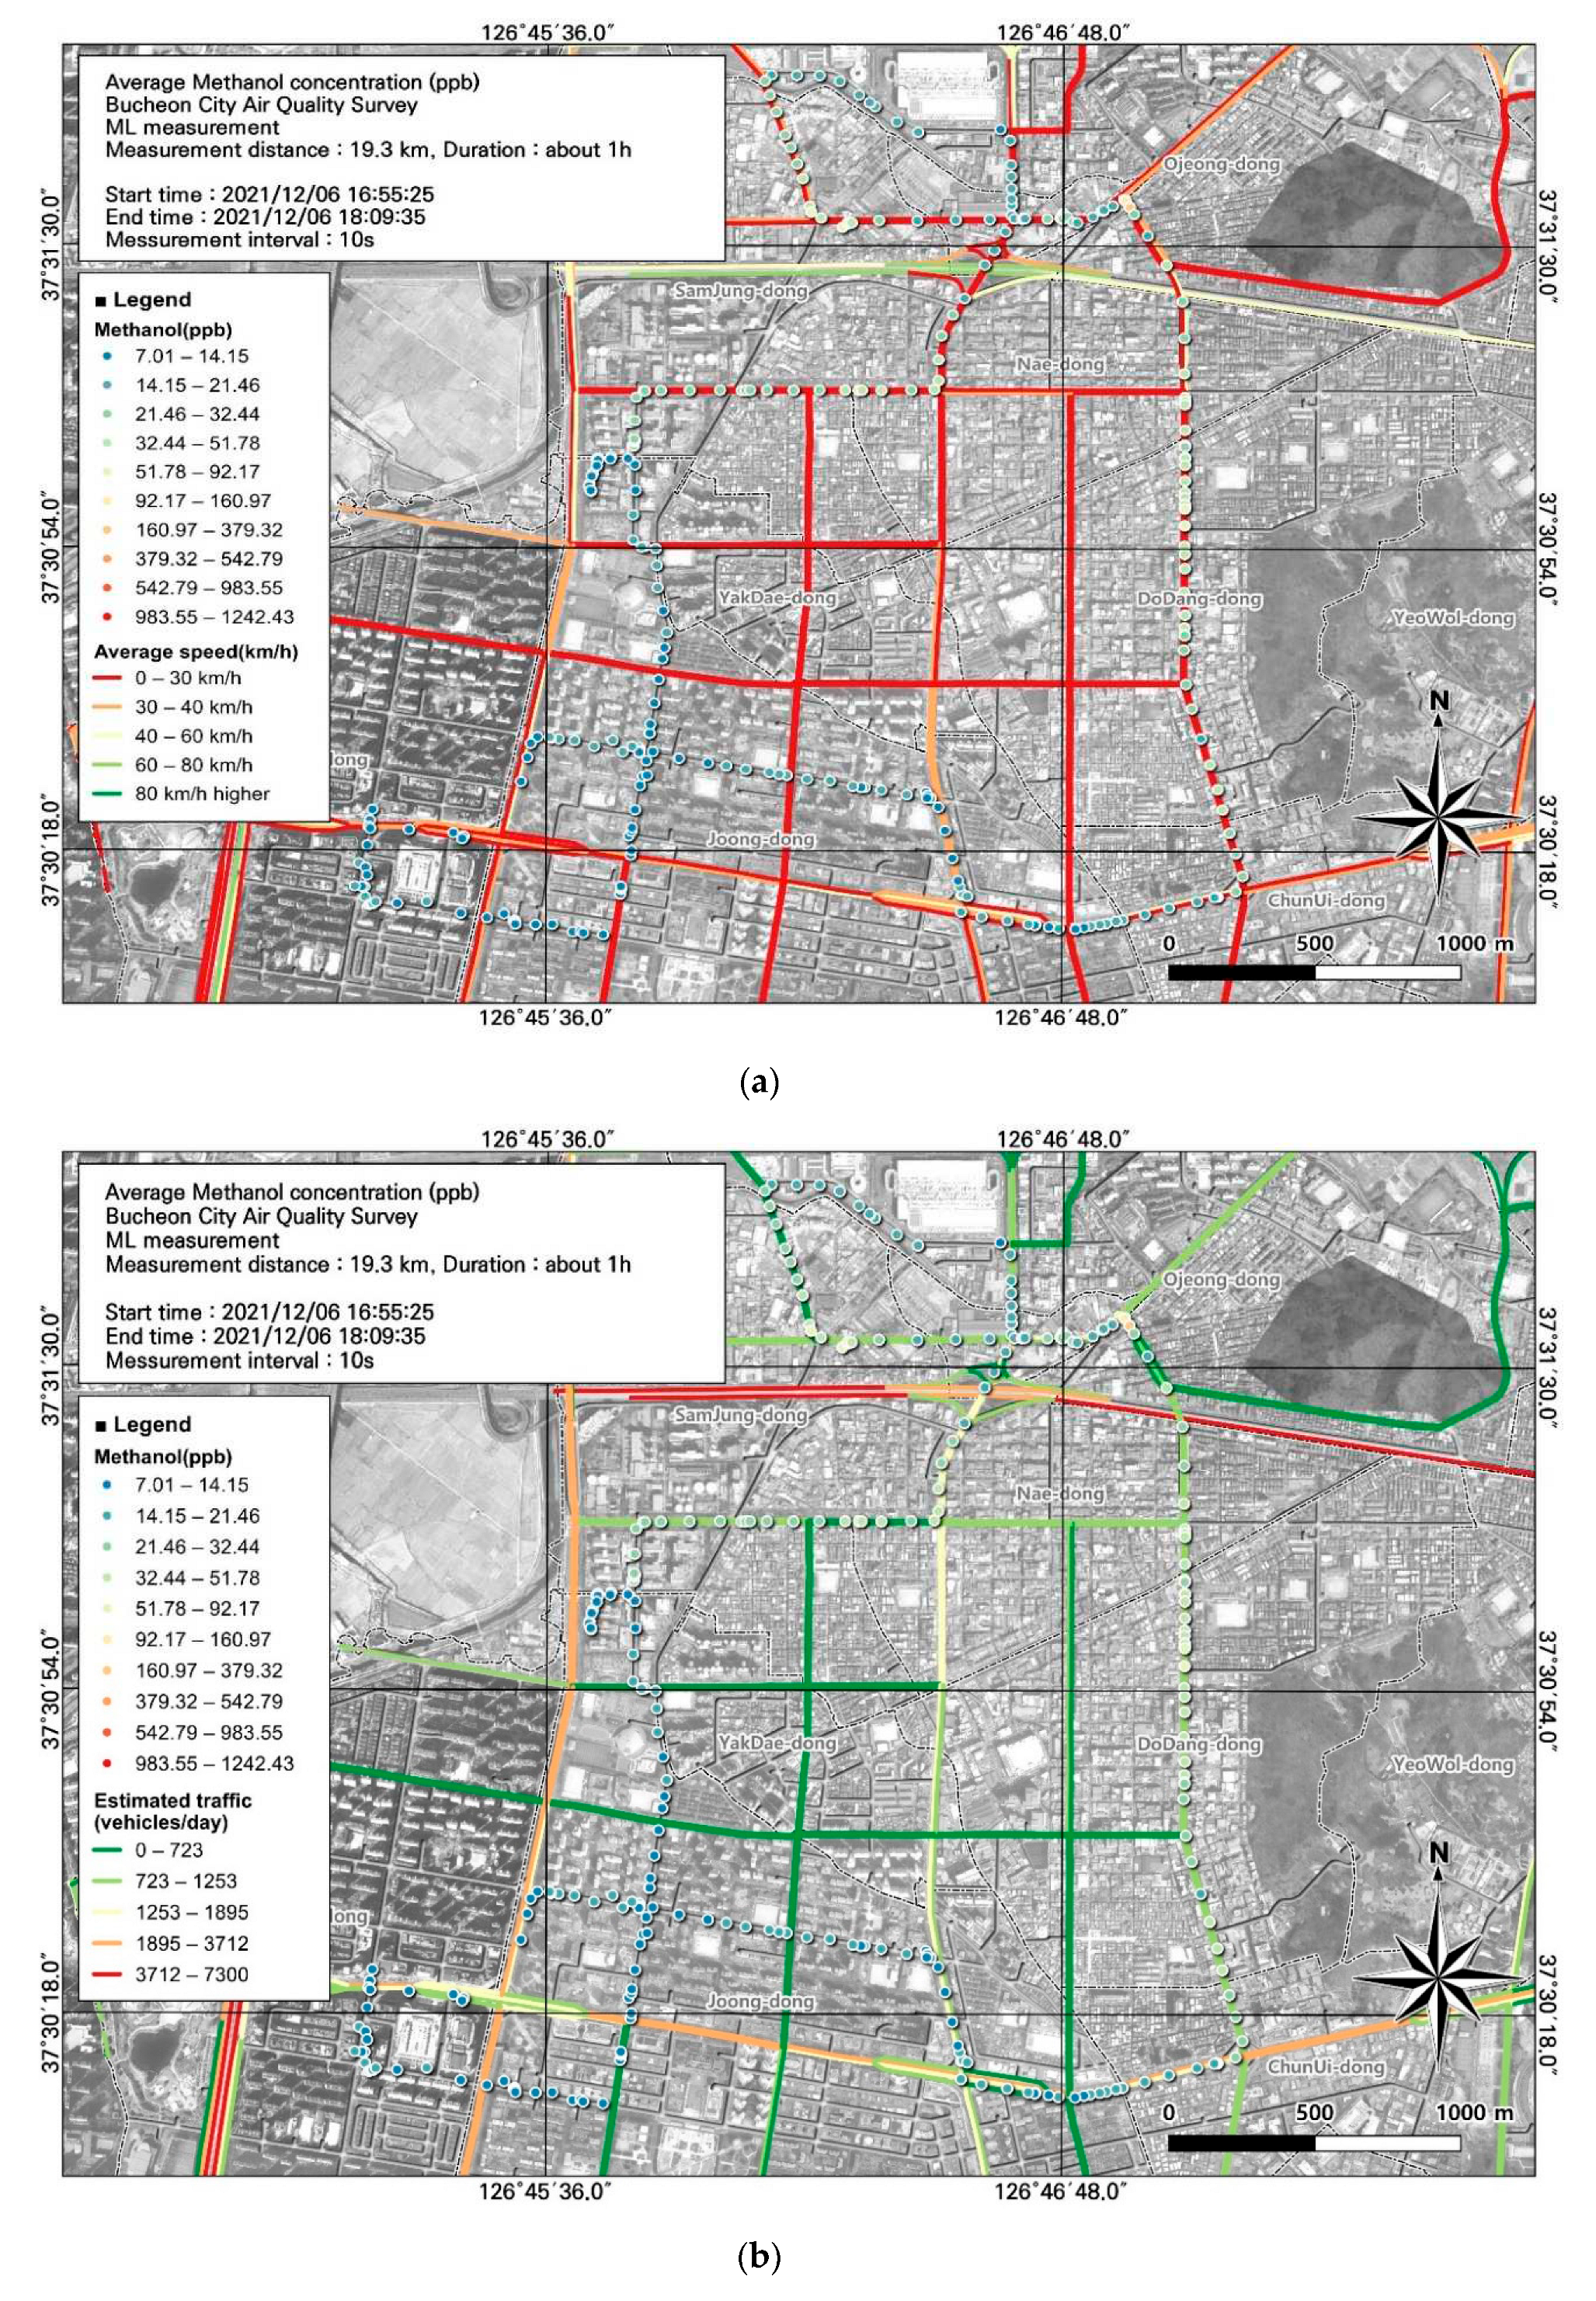
Figure 11.
Associations of VOC (n+i-butene) concentrations with (a) average traffic speed and (b) estimated traffic volume during the morning rush hour, corresponding to Figure 7e.
Figure 11.
Associations of VOC (n+i-butene) concentrations with (a) average traffic speed and (b) estimated traffic volume during the morning rush hour, corresponding to Figure 7e.
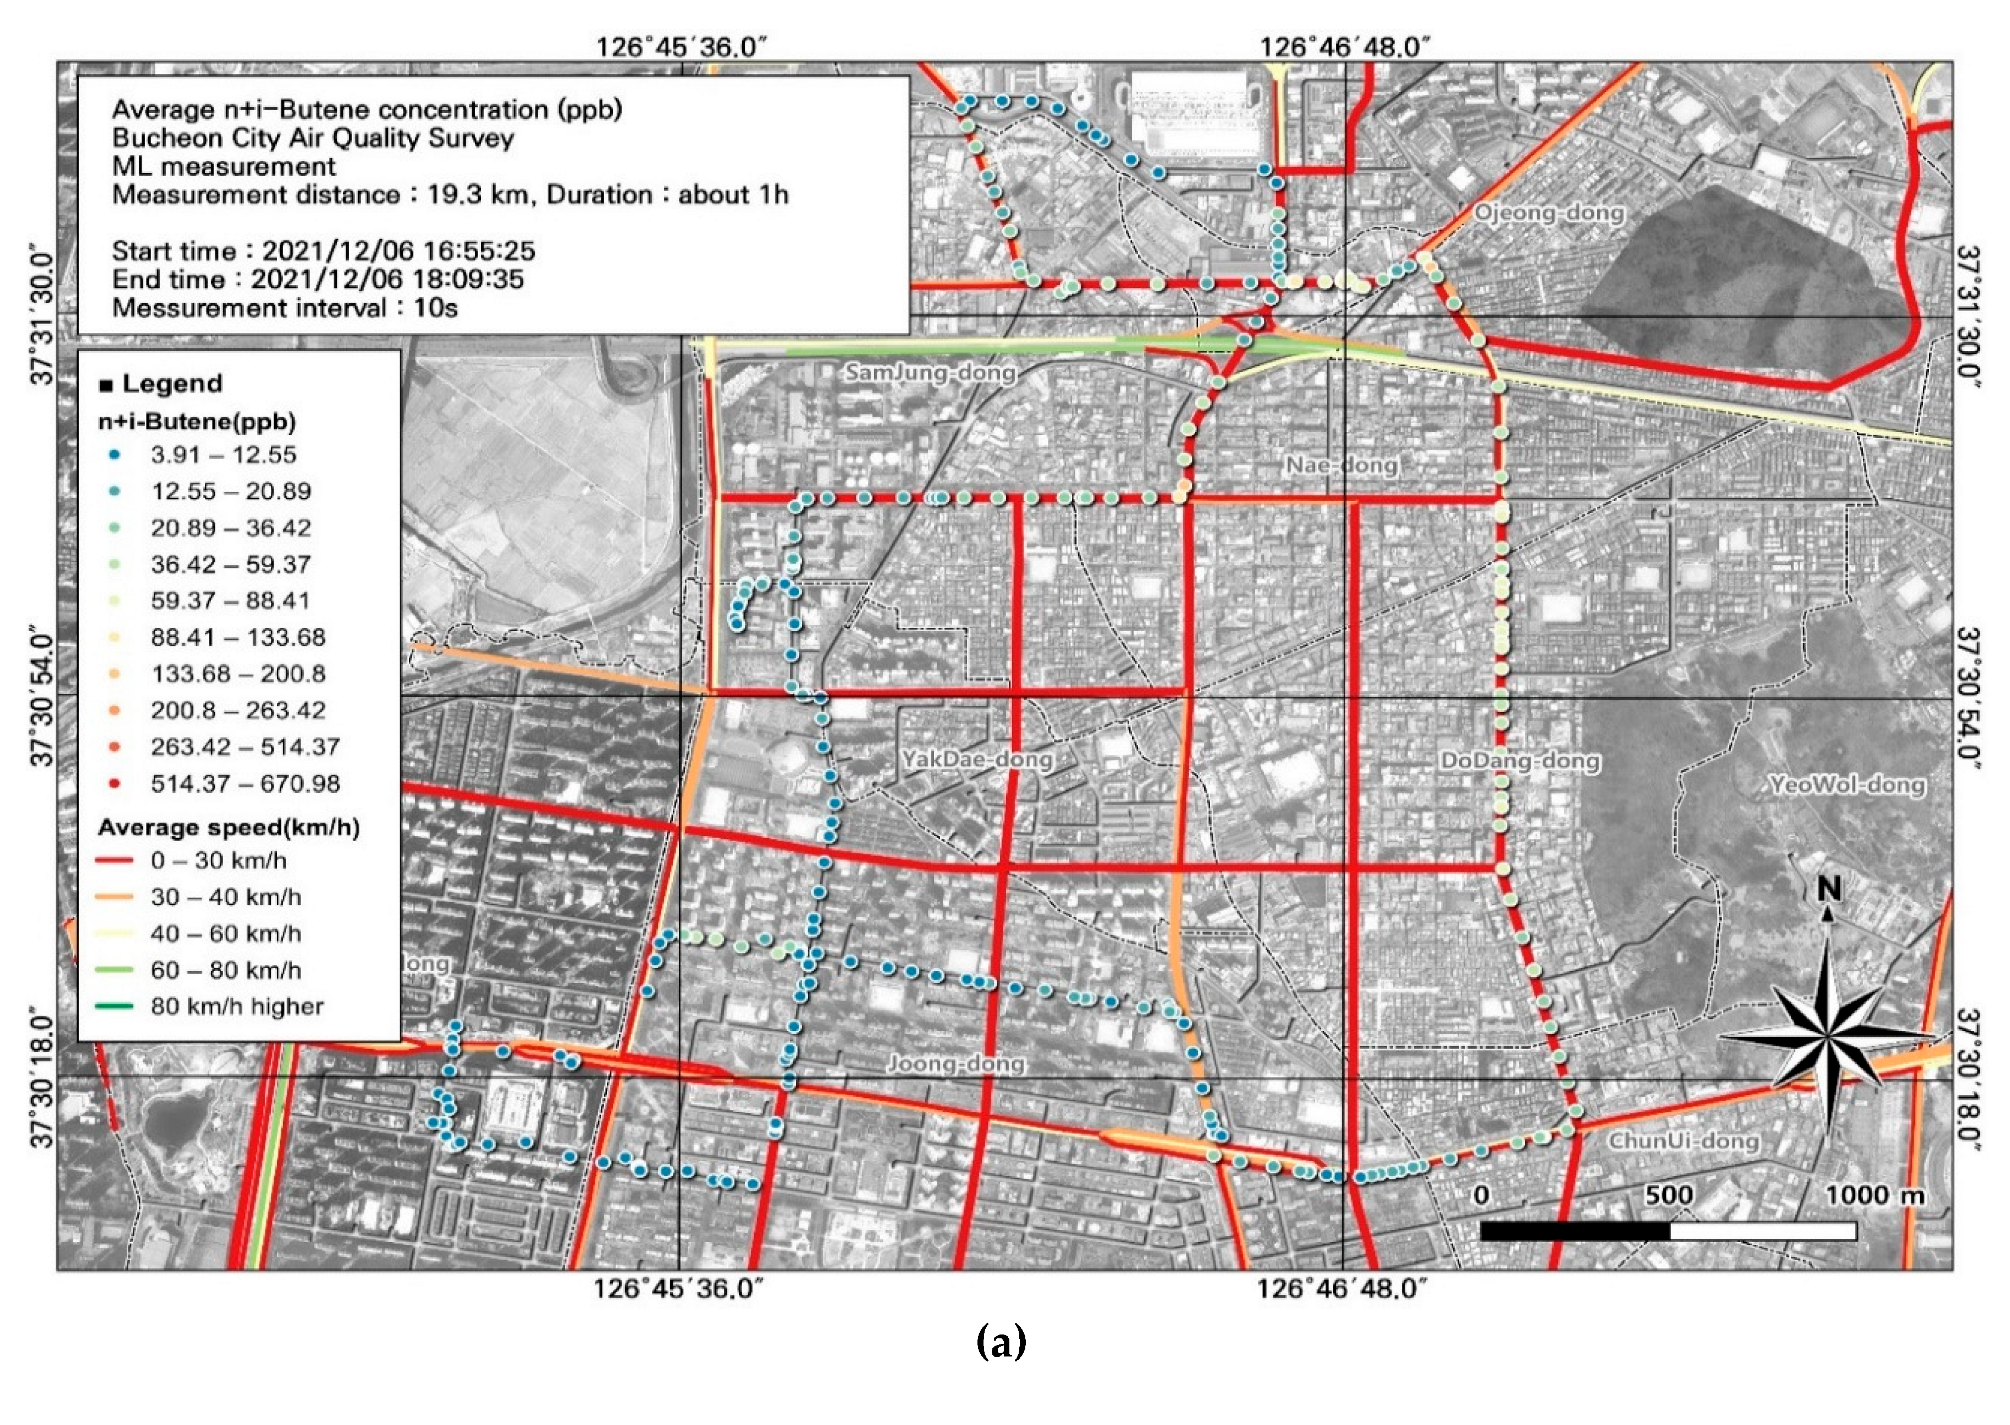
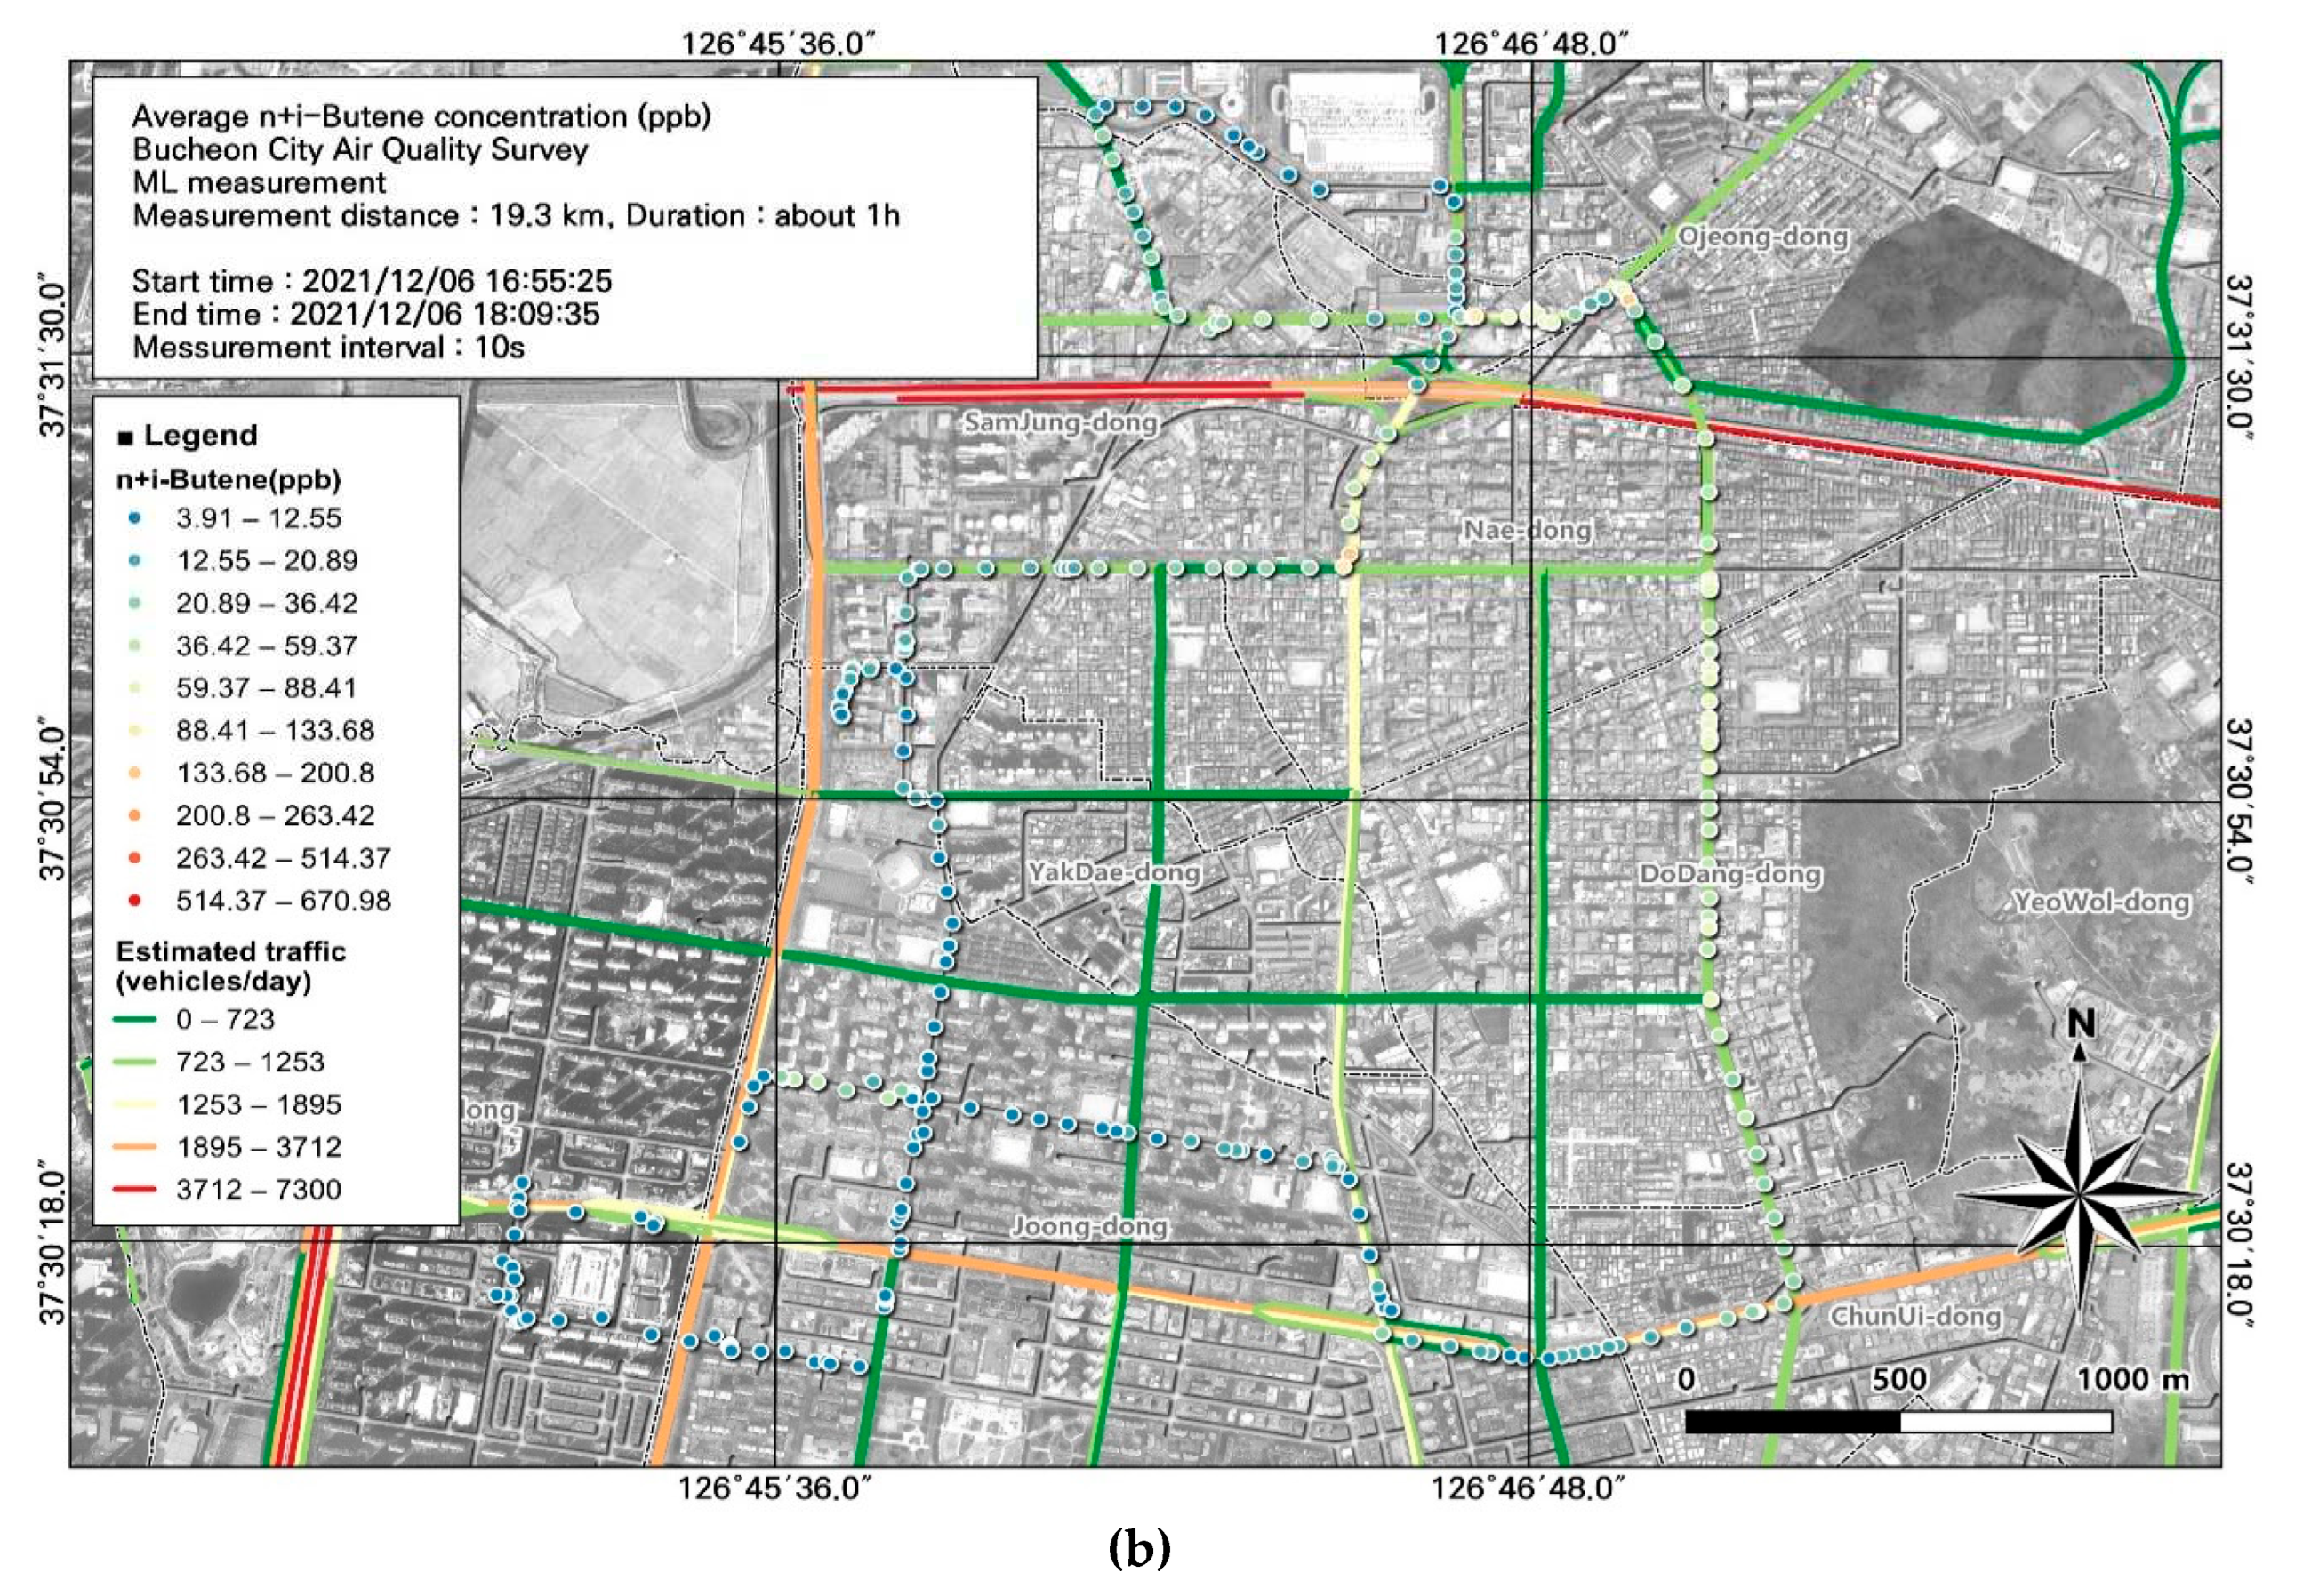
Table 2.
VOC targets analyzed using PRT-ToF-MS.
| Compound | Formula | Molar mass | Protonated mass | Chemical Abstracts Service # |
|---|---|---|---|---|
| Formaldehyde | CH2O | 30.026 | 31.018 | 50-00-0 |
| Methanol | CH4O | 32.04 | 33.033 | 67-56-1 |
| Acetonitrile | C2H3N | 41.053 | 42.034 | 75-05-8 |
| Propylene | C3H6 | 42.08 | 43.054 | 115-07-1 |
| Propane | C3H8 | 44.097 | 44.997 | 74-98-6 |
| Acetaldehyde | C2H4O | 44.053 | 45.033 | 75-07-0 |
| Acrylonitrile | C3H3N | 53.064 | 54.034 | 107-13-1 |
| 1,3-Butadiene | C4H6 | 54.0916 | 55.054 | 106-99-0 |
| n+i-Butene | C4H10 | 58.124 | 59.086 | 106-98-9 |
| Acetic acid | C2H4O2 | 60.052 | 61.028 | 64-19-7 |
| i+n-Pentane | C5H12 | 72.151 | 73.065 | 109-66-0 |
| Benzene | C6H6 | 78.114 | 79.054 | 71-43-2 |
| Toluene | C7H8 | 92.141 | 93.07 | 108-88-3 |
| Styrene | C8H8 | 104.15 | 105.07 | 100-42-5 |
| Ethanol+xylene | C8H10 | 106.168 | 107.086 | 100-41-4 |
| Trimethylbenzene | C9H12 | 120.195 | 121.101 | 95-63-6 |
Table 3.
Summary of VOC concentrations measured at the stationary observation site.
| Pollutant | Mean ± standard deviation (ppb) | Percentage | |
|---|---|---|---|
| December 6 | December 7 | ||
| Formaldehyde | 1.3 ± 0.2 | 1.2 ± 0.2 | 1.3% |
| Methanol | 17.5 ± 4.1 | 15.1 ± 2.9 | 17.0% |
| Acetonitrile | 1.4 ± 0.4 | 1.3 ± 0.2 | 1.4% |
| Propylene | 4.5 ± 3.7 | 3.7 ± 0.9 | 4.3% |
| Propane | 3.4 ± 0.4 | 3.1 ± 0.4 | 3.4% |
| Acetaldehyde | 8.1 ± 1.7 | 7.6 ± 2.1 | 8.2% |
| Acrylonitrile | 0.2 ± 0.1 | 0.2 ± 0.1 | 0.2% |
| 1,3-Butadiene | 2.6 ± 1.6 | 6.7 ± 10.6 | 4.8% |
| n+i-Butene | 12.3 ± 6.7 | 11.3 ± 2.7 | 12.3% |
| Acetic acid | 9.0 ± 6.8 | 10.1 ± 3.9 | 10.0% |
| i+n-Pentane | 8.0 ± 6.3 | 10.7 ± 4.4 | 9.7% |
| Benzene | 2.3 ± 0.5 | 1.8 ± 0.3 | 2.1% |
| Toluene | 15.1 ± 7.4 | 16.5 ± 3.9 | 16.5% |
| Styrene | 1.1 ± 0.4 | 0.7 ± 0.2 | 1.0% |
| Ethanol+xylene | 7.9 ± 1.6 | 5.1 ± 1.3 | 6.8% |
| Trimethylbenzene | 1.2 ± 0.3 | 0.8 ± 0.2 | 1.1% |
Table 4.
Daily concentration of each pollutant measured from the mobile laboratory.
| Pollutant | Mean ± standard deviation (unit: ppb) | ||||||
|---|---|---|---|---|---|---|---|
| December 6 | December 7 | ||||||
| 1st | 2nd | 3rd | 4th | 5th | 6th | 7th | |
| Formaldehyde | 1.6 ± 0.3 | 1.4 ± 0.3 | 1.2 ± 0.2 | 1.3 ± 0.2 | 1.4 ± 0.3 | 1.3 ± 0.2 | 1.3 ± 0.2 |
| Methanol | 19.7 ± 7.5 | 19.2 ± 9.6 | 10.8 ± 2.2 | 12.2 ± 5.4 | 34.4 ± 102.7 | 14.7 ± 5.7 | 14.9 ± 6.3 |
| Acetonitrile | 1.5 ± 0.4 | 1.3 ± 0.5 | 0.9 ± 0.2 | 1.0 ± 0.2 | 1.5 ± 0.7 | 1.3 ± 0.3 | 2.8 ± 6.0 |
| Propylene | 5.0 ± 2.2 | 4.6 ± 3.0 | 2.2 ± 1.2 | 3.0 ± 2.0 | 6.1 ± 6.4 | 4.0 ± 1.6 | 16.4 ± 46.4 |
| Propane | 4.1 ± 0.5 | 3.7 ± 0.5 | 3.1 ± 0.4 | 3.2 ± 0.4 | 3.7 ± 0.6 | 3.4 ± 0.5 | 3.3 ± 0.4 |
| Acetaldehyde | 12.2 ± 3.44 | 11.9 ± 2.9 | 7.6 ± 1.7 | 8.1 ± 1.4 | 12.4 ± 5.5 | 8.9 ± 2.3 | 10.2 ± 1.4 |
| Acrylonitrile | 0.2 ± 0.1 | 0.2 ± 0.1 | 0.1 ± 0.1 | 0.1 ± 0.1 | 0.2 ± 0.1 | 0.2 ± 0.1 | 0.2 ± 0.1 |
| 1,3-Butadiene | 3.3 ± 2.9 | 2.6 ± 1.5 | 1.4 ± 0.5 | 1.8 ± 0.8 | 2.6 ± 2.0 | 2.1 ± 0.8 | 5.1 ± 12.0 |
| n+i-Butene | 18.6 ± 22.1 | 14.4 ± 8.2 | 10.9 ± 30.0 | 15.9 ± 21.8 | 32.6 ± 57.7 | 15.2 ± 9.5 | 16.5 ± 12.9 |
| Acetic acid | 7.8 ± 8.1 | 12.0 ± 9.2 | 6.4 ± 3.3 | 10.2 ± 8.7 | 20.4 ± 28.0 | 9.2 ± 5.2 | 11.6 ± 8.2 |
| i+n-Pentane | 11.3 ± 24.8 | 9.5 ± 8.0 | 4.5 ± 2.5 | 6.6 ± 2.6 | 11.4 ± 12.5 | 8.7 ± 4.4 | 10.8 ± 7.6 |
| Benzene | 3.2 ± 2.1 | 2.7 ± 1.5 | 1.6 ± 1.1 | 2.3 ± 1.7 | 3.8 ± 3.2 | 2.1 ± 1.6 | 5.0 ± 10.3 |
| Toluene | 28.0 ± 44.5 | 27.5 ± 22.1 | 13.4 ± 28.5 | 21.4 ± 21.6 | 48.3 ± 67.2 | 23.6 ± 18.3 | 45.8 ± 82.1 |
| Styrene | 1.2 ± 0.7 | 1.2 ± 1.5 | 0.7 ± 0.6 | 0.9 ± 0.4 | 5.8 ± 16.9 | 0.9 ± 0.4 | 1.2 ± 1.1 |
| Ethanol+xylene | 10.8 ± 8.6 | 10.1 ± 7.1 | 4.9 ± 3.9 | 8.0 ± 5.2 | 15.5 ± 16.3 | 5.6 ± 4.4 | 12.1 ± 17.8 |
| Trimethylbenzene | 2.1 ± 2.7 | 1.6 ± 0.9 | 0.7 ± 0.1 | 1.4 ± 1.6 | 2.5 ± 3.2 | 1.1 ± 0.7 | 3.2 ± 6.4 |
Disclaimer/Publisher’s Note: The statements, opinions and data contained in all publications are solely those of the individual author(s) and contributor(s) and not of MDPI and/or the editor(s). MDPI and/or the editor(s) disclaim responsibility for any injury to people or property resulting from any ideas, methods, instructions or products referred to in the content. |
© 2024 by the authors. Licensee MDPI, Basel, Switzerland. This article is an open access article distributed under the terms and conditions of the Creative Commons Attribution (CC BY) license (http://creativecommons.org/licenses/by/4.0/).
Copyright: This open access article is published under a Creative Commons CC BY 4.0 license, which permit the free download, distribution, and reuse, provided that the author and preprint are cited in any reuse.


