
Submitted:
26 January 2024
Posted:
29 January 2024
You are already at the latest version
Abstract
My innovative entropy measure, Ismail entropy, namely, (IE) is an ultimate generalization to numerous generalized entropies within the literature. The fractal dimension of IE is identified in this paper. On another applicative note, this paper offers some potential applications of fractal dimension to smart cities. The paper ends with closing remarks combined with some challenging open problems and the next phase of research.
Keywords:
Fractal dimension((Df )
; Ismail entropy (IE)
; Information theory
; smart cities
I. Introduction
When defining the entropy in 1948 [1], Claude Shannon used the formula:
The probability of the event is given by the equation .This entropy, defines the concept of information in information theory. There are several additional entropic formalisms that can be used to approach the measure of information that each distribution contains in different ways.
More fundamentally, Ismail entropy, namely, IE [2] is defined by
, serve as any universal parameters, Notably, the choice of
reduces to the Tsallisian Entropy[3] of order
of (3) reduces to the Shannonian entropic formula (1).
The connection between entropy and lies in the statistical measurement of complexity within spatial dimensions. Fractals, which exhibit a unique scaling behavior, are used to quantify the capacity of a pattern to fill space. This relationship helps us understand the intricate relationship between information theory and the geometric properties of patterns [4,5,6,7]. In [8], Lewis Fry Richardson examined how the length of the stiff stick used to measure coasts can impact the length of the coastline as measured. Mandelbrot cited this previous work in [8,9,10].
In the context of studying , there are multiple formal mathematical definitions available. One such definition involves using formulas that relate the quantity of sticks (N) required to cover a coastline, the scaling factor (𝜀), and the fractal dimension (). These formulas help quantify the complexity and scaling properties of fractal patterns in spatial dimensions.:
Figure 1.
A section of the Grand Canyon in Arizona, which is visualized using satellite images from Google Earth and edited using the GNU Image Manipulation Program. These tools allow for the creation of painted portraits or visual representations of the canyon’s features[10].
Figure 1.
A section of the Grand Canyon in Arizona, which is visualized using satellite images from Google Earth and edited using the GNU Image Manipulation Program. These tools allow for the creation of painted portraits or visual representations of the canyon’s features[10].
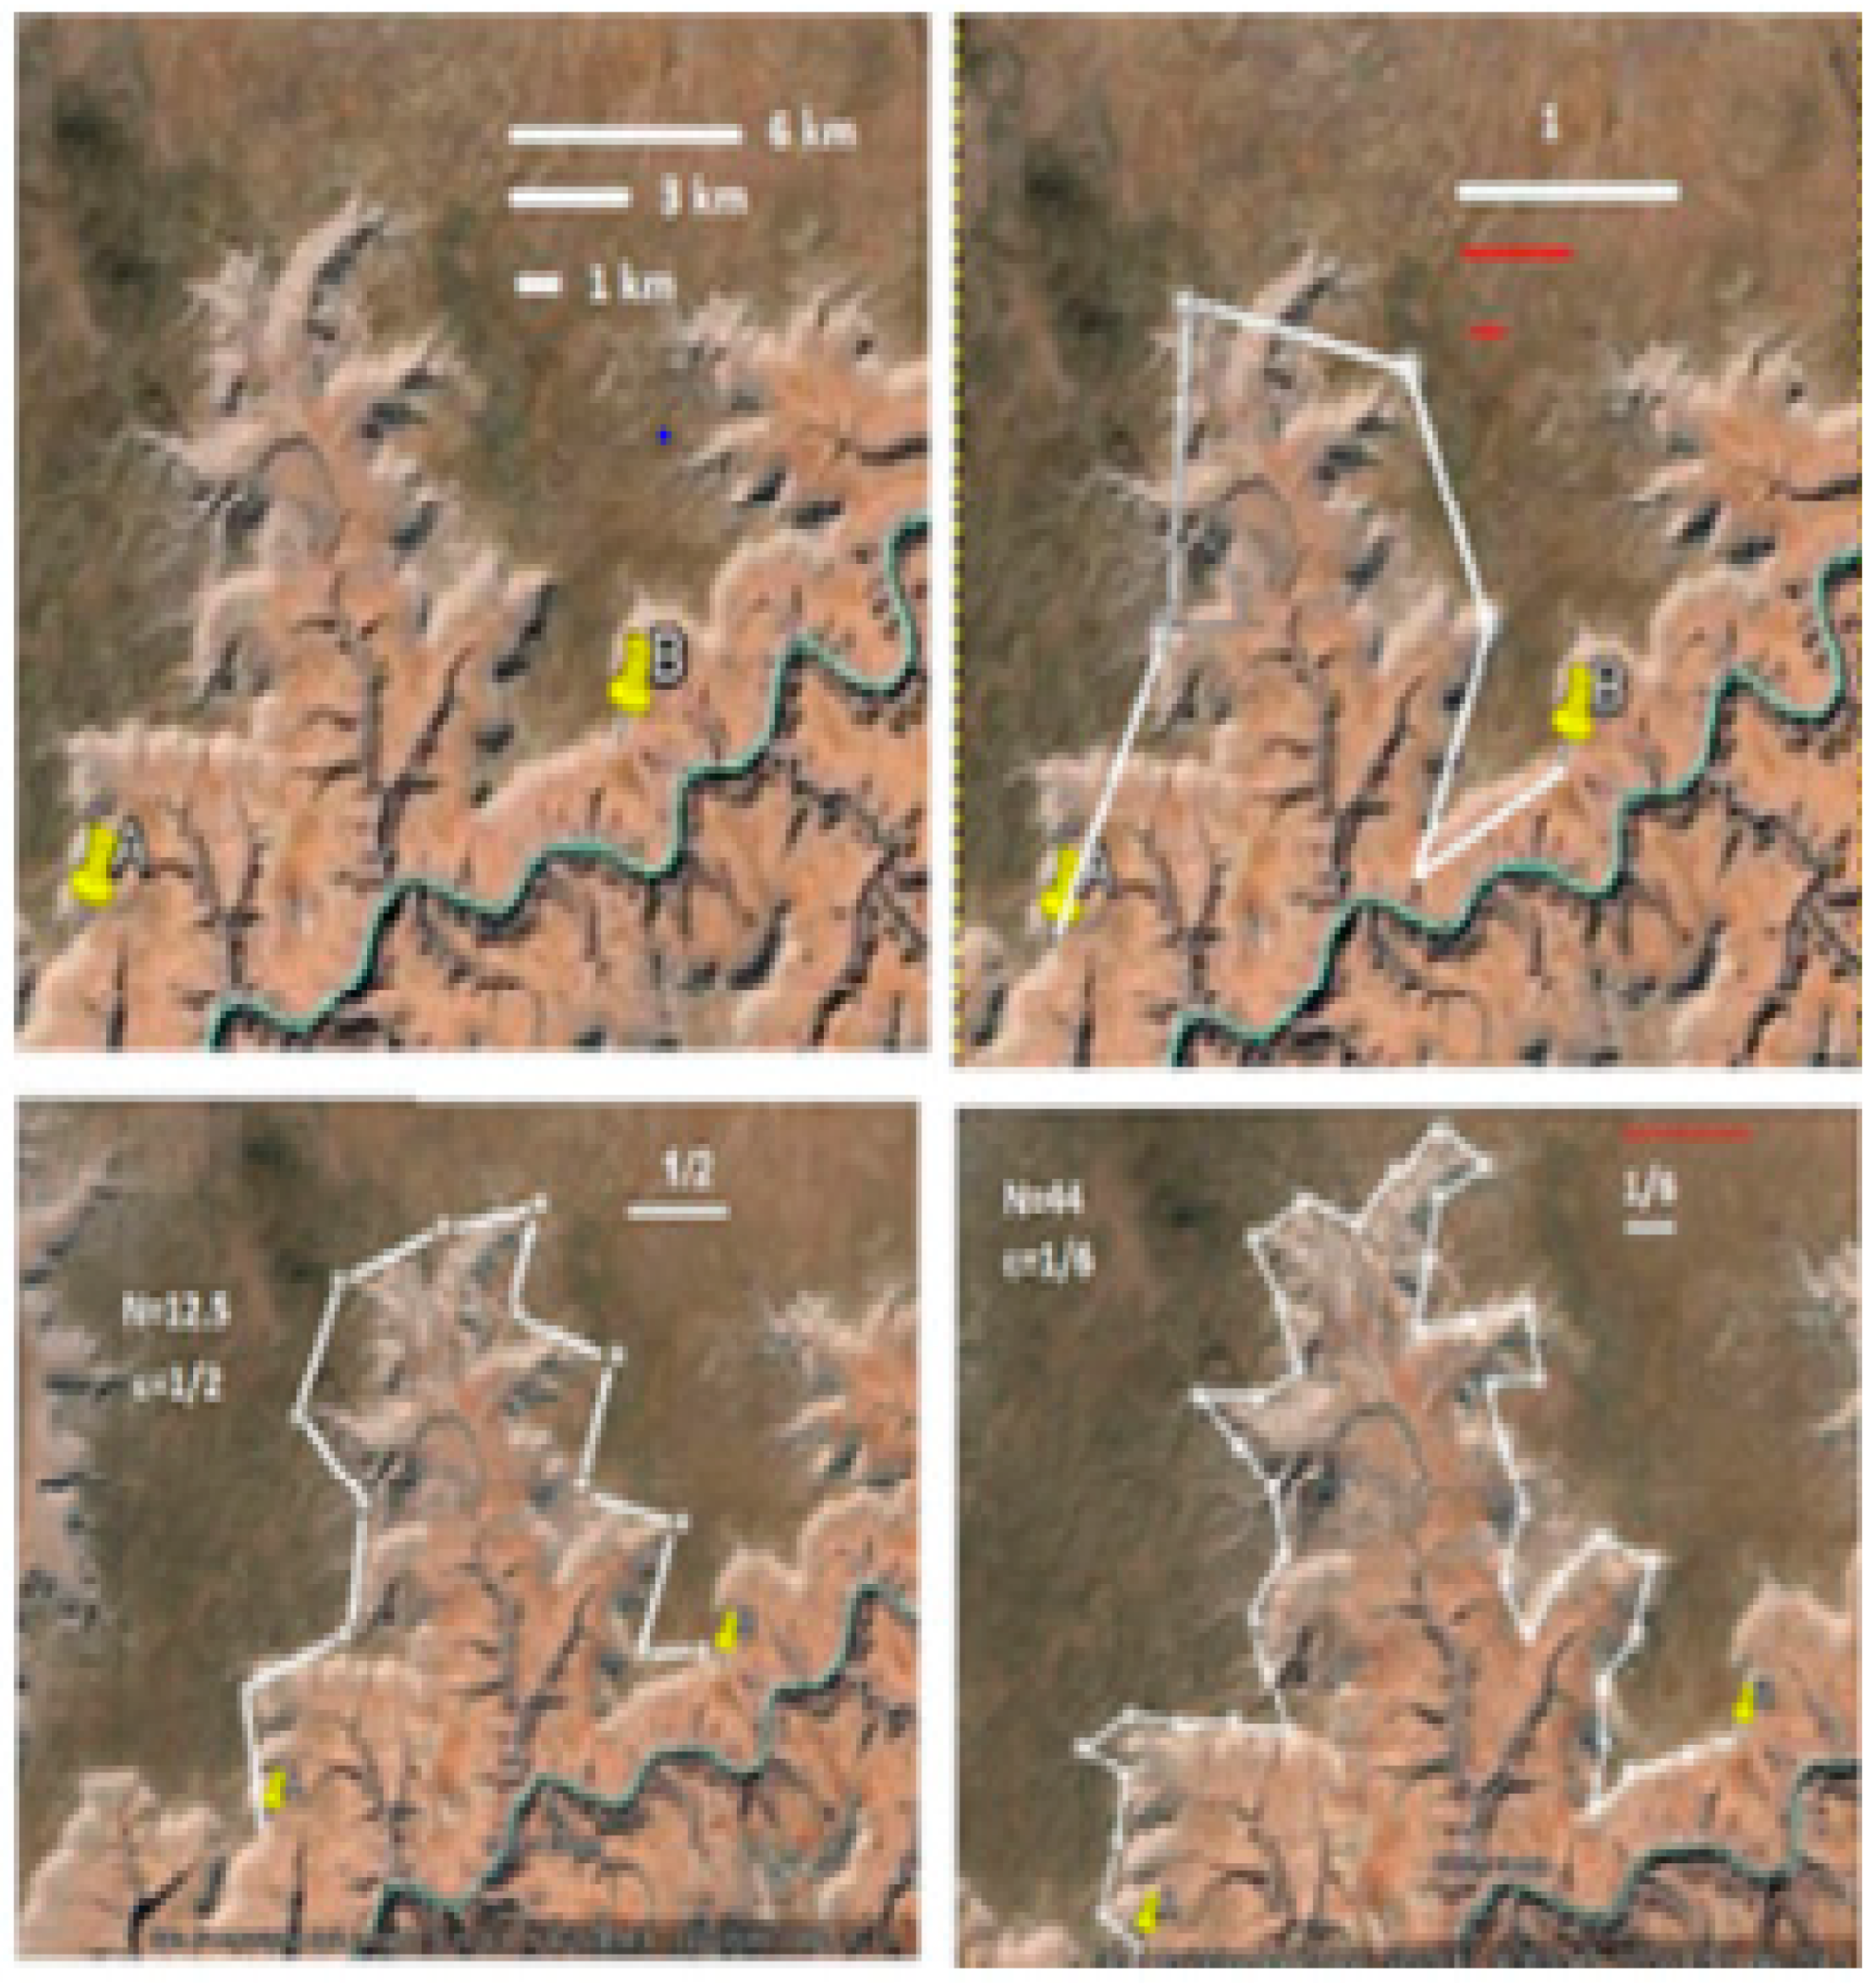
It can be seen how painted portraits were created using satellite images from Google Earth of a section of the Grand Canyon in Arizona. The reference length of 6 km was determined using the ruler tool in Google Earth, and this length was used to calculate of the canyon’s rim as shown by Figure 2 and Figure 3. Figure 2 shows that as the progressive increase of N (a variable) occurs, 𝜀 (another variable) experiences a drastic heavy-tailed declination, while Figure 3 demonstrates that both 𝜀 and decline simultaneously.
This paper’s road map is. A review of existing research on how fractal dimension can be derived using entropy concepts is given in section II, as well as the provision of the relationship between entropy and fractal dimension, specifically focusing on Shannon entropy and Rényi entropy. This survey of previous work provides insights into the entropic derivation of fractal dimension. Section III is dedicated to deriving new results and providing unquestionable supporting evidence that of IE is an ultimate generalization to many previously derived ’s in the literature. Section IV highlights applications to smart cities. Section IV provides a conclusion with some open problems and future pathways of research.
II. MATERIALS AND METHODS
In [10], an exposition of for Shannon entropy [1], Rényi entropy [3,11,12] and Tsallis entropy [13] was undertaken for events with equal probabilities, i.e., .
is defined by the Shannonian entropy [10] concept as follows:
The following definition applies to the "generalized dimension" or "Rényi dimension" of order [12]
III. RESULTS AND DISCUSSION
Theorem 1
For IE (c.f., (2), (IE) is given by
Proof
Engaging (2) and (5), we have
Engaging (6) and (7),the proof follows.
The following corollary reveals the significance of the findings of Theorem 1.
Corollary 2
(c.f., (8)) reduces toentropy, namely the fractal dimension of the Generalized Z-Entropy (Gze) [4] given by
Provided that,
Proof The choice of
Such that
Following (12), let such that:
By (13), we have
(14) can be re-written in the form:
Provided that
Engaging mathematical analysis and equation (15),
Since
Hence, it follows that
(contradiction), which immediately implies the that is well defined.
It is implied by (8), (11) and (12), that reduces to .
Corollary 2 is manifested by the fact that , the proven special case of , itself reduces to many important ’s for many known entropy measures. This is given by the following corollary[4].
Corollary 3
satisfies the following:
III. APPLICATIONS TO SMART CITIES
Local or microscopic chaos and global or macroscopic disorder are the two types of chaos covered by chaos theory[14]. Local chaos is mostly investigated by dissipative structure theory and synergetic theory since it primarily deals with the relationships and interconnections within a system. Chaos theory, on the other hand, focuses specifically on global chaos, which is described as deterministic patterns and behaviors that arise from complex systems.
[14] looked at the growth of smart cities, particularly in China, and stressed how evaluation and planning may suffer from a lack of a basic understanding of smart city systems. Consequently, [14] offered a complete framework for assessing and regulating the operations of smart cities that considers smart gadgets, ICT, and the dynamics of development. It also implied that the self-organizing system theory could potentially be able to accommodate for the complexity of smart cities.
Smart systems[14] are made up of several interrelated parts, including systems for energy, ICT, economics, security, and institutional culture. As smart city systems are developed, these systems, which are driven by internal institutional culture and ICT mechanisms, evolve from simple smart cell components to more complex entities. Figure 7 demonstrates how these open systems interact with the outside world to exchange information and energy to create a fully self-organizing framework.
An urban road network’s overall operation and service level are directly impacted by its structural characteristics [15]. Urban road networks can be analysed using fractal theory because of their self-similarity and scale invariance. To assess and improve urban road networks, this study calculates and analyses five fractal dimensions of nine districts in Harbin and looks at how they relate to other variables like area, population, road length, and building density.
Figure 8 portrays the map of Harbin, a Chinese city. The main urban area of Harbin has a total of 12,800 roads and the combined length of these roads is 9757.934 kilometres.
Data including the road network map, area, population, building area, road number, and building number were collected for 9 districts in Harbin, China, to compute the road work’s [15]. Shape files were utilized for downloading information about the metropolitan road network from Open Street Map (OSM). The use of this data to analyze the fractal properties of the Harbin Road network is shown in Figure 9.
In their research, [15] measured five different types of fractal dimensions using images in BMP file format (.bmp). The images in question had a black backdrop with white elements that represented roads and boundaries on them. Figure 10 illustrates the conversion of nine maps into the appropriate BMP format with varied sizes (width and height) and a resolution of 500 dpi from the GIS software-generated shape file data.
The urban climate is influenced by various factors[16] and understanding them can help mitigate heat stress in the context of urbanization and climate change. In a study focusing on European cities, it was found that the Urban Heat Island (UHI) phenomenon is influenced by city size, fractality (complexity of urban form), and anisometry (degree of stretching). The study revealed that UHI intensity increases with city size and fractal dimension but decreases with anisometry. Smaller, dispersed, and stretched cities are considered preferable for mitigating UHI, although trade-offs must be made considering the positive effects of large cities. The study focused on the 5,000 largest urban clusters in Europe and analyzed how the UHI intensity is influenced by the size, fractality, and anisometry of the city clusters during the summer months from 2006 to 2013.
- The city size is determined by multiplying the number of cells in a city cluster by the area of each cell. Due to Zipf’s law, which states that there are many small cities and few large ones, the logarithm of city is used to reduce the skewness in the data.
- To measure the fractal dimension of city clusters, [16] used the box counting method, which involves counting the number of square boxes needed to cover the structure. Figure 11 (a − c) of the study shows three examples of city clusters with different sizes and levels of fractality, illustrating the concept visually. The box-counting method is used to calculate of city clusters, which provides a measure of their compactness. By analyzing the linear regressions of the log-log scale plots of box-counting results, the slopes of the lines estimate the fractal dimensions, indicating that cities with larger values are generally more compact in shape.
- The anisometry of a city cluster describes how far a city deviates from a circular geometry. It is calculated from the main axis to minor axis ratio of the equivalent ellipse of the city cluster. A higher value of anisometry indicates that the city is more elongated or stretched in shape, as illustrated by the example of Belgrade in Figure 11 (a − c).
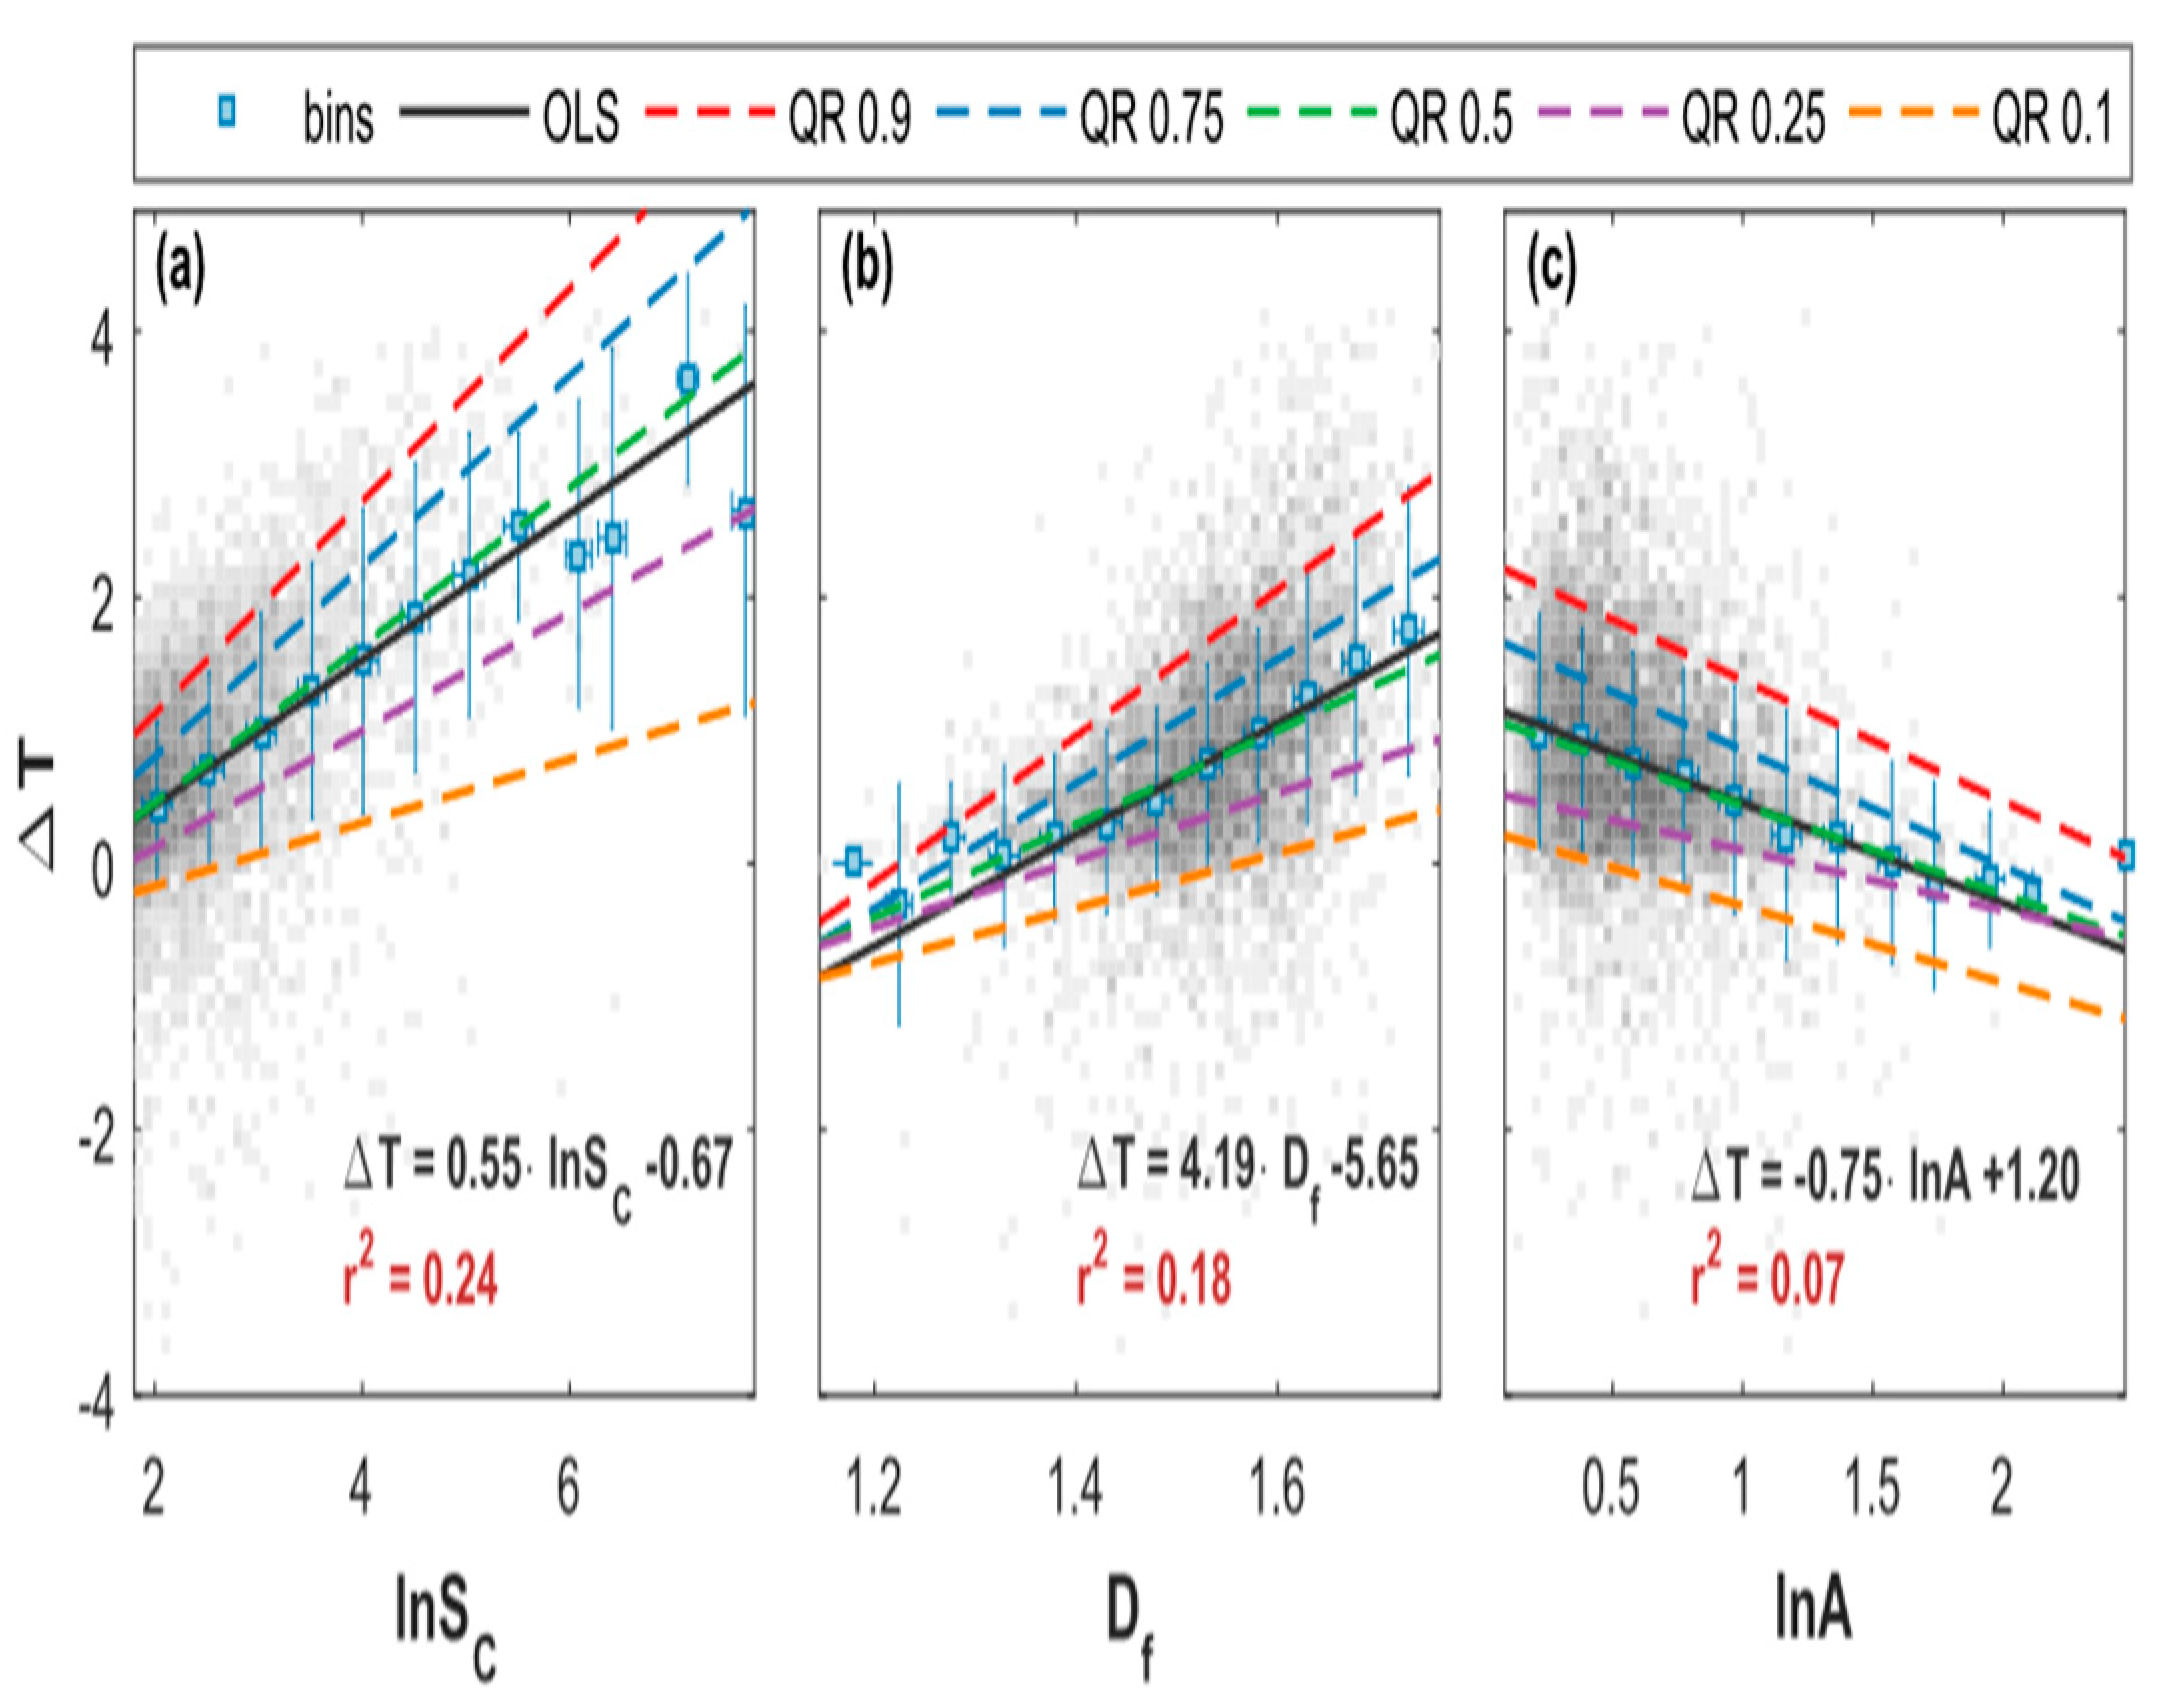
In the context given, scatterplots in Figure 12 (c.f., [16]) depict the relationships between the intensity of the midday UHI and three different parameters. Figure 12(a) shows that the UHI intensity rises with city size, with a doubling of city size resulting in an increase in UHI intensity of about 0.4 °C. Moreover, UHI intensity and population size is strongly related[16]. Additionally, quantile regressions reveal heteroscedasticity, indicating stronger spreading of UHI intensity among large cities. In Figure 12(b), the relationship between and UHI intensity is illustrated. The results indicate that as increases, the UHI intensity typically increases by around 2 °C, suggesting that more compact cities tend to have stronger UHI effects. Additionally, in Figure 12(c), it is observed that the UHI intensity decreases with increasing anisometry, with more circular cities exhibiting higher UHI intensities.
The UHI intensity is analyzed using quantile regressions and ordinary least square regression, with the results visualized through linear regressions and quantile regressions. The quantile regressions provide slopes for different quantiles, indicating the varying impact of the factors on UHI intensity[16].
IV. CONCLUSION AND FUTURE WORK
In this exposition, the of IE is determined. More potentially, this study has revealed how this discovery reveals the dominancy of IE, especially from a fractal dimension perspective. On another applicative note, some applications of fractal dimension to smart cities are addressed.
Here are some challenging open problems to be addressed:
Open Problem One
Is it possible to unlock the mathematical challenge to compute the threshold formalism of the derived fractal dimension of IE with respect to all the involved parameters?
Open Problem Two
Approaching the IE’s Snow Kochflake fractal dimension () and the Sierpiniski Gasket (), can we unlock the threshold of both fractal dimensions especially for the long-range interactions descriptor, namely to capture the missing link between statistical physics, randomness, thermodynamics, and fractal geometry?
Open Problem Three
Talking short- range interaction, in correspondence to (, what will be the solution for both open problems One and Two if it is solvable?
Open Problem Four
Is it possible to have negative values for the obtained fractal dimension of IE? If yes, then what are the physical interpretations for this case.
Open Problem Five
If open Problem Four is unlocked, can we solve this sophisticated open problem to get the corresponding value of ?
Open Problem Six
Is the open problem of determining the threshold parametric patterns for the undertaken generated Snow Kochflake and Sierpinski Gasket dimensions of Ismail’s Second, fourth [17] and the current entropies solvable? If yes, then how could we fine tune the discovered regions of increasability and decreasability?
The frontiers are open for unlimited explorations. The next phase of research includes answering the above open research problems and exploring more new avenues of applications to other scientific and other interdisciplinary themes of research will be addressed.
References
- A. Mageed and Q. Zhang, “An Introductory Survey of Entropy Applications to Information Theory, Queuing Theory, Engineering, Computer Science, and Statistical Mechanics,” In 2022 27th IEEE International Conference on Automation and Computing (ICAC) 2022, pp. 1-6. [CrossRef]
- A. Mageed and Q. Zhang, “ An Information Theoretic Unified Global Theory for a Stable M/G/1 Queue With Potential Maximum Entropy Applications to Energy Works,” In 2022 IEEE Global Energy Conference (GEC), 2022, pp. 300-305. [CrossRef]
- D. D. Kouvatsos and I. A. Mageed, V. Anisimov, and N. Limnios, “Non-Extensive Maximum Entropy Formalisms and Inductive Inferences of Stable M/G/1 Queue with Heavy Tails,” Advanced Trends in Queueing Theory,2021. [CrossRef]
- I. A. Mageed and A.H. Bhat, “Generalized Z-Entropy (Gze) and Fractal Dimensions,” Appl. Math, vol. 16, no. 5, 2022, p. 829-834. [CrossRef]
- L. Zhou, C. R. Johnson, and D. Weiskopf, “ Data-driven space-filling curves,” IEEE transactions on visualization and computer graphics, vol. 27, no. 2, 2020, p. 1591-1600. [CrossRef]
- W. J. Wang et al., “ Fractal growth of giant amphiphiles in langmuir-blodgett films,” Chinese Journal of Polymer Science, vol. 40, no. 6, 2022, p. 556-66. [CrossRef]
- Z. Sadem, B. Fathi, and L. Mustapha, “ Image edge detection and fractional calculation,” International Journal of Advanced Natural Sciences and Engineering Researches, vol. 7, no. 7, 2023, p. 222-225. [CrossRef]
- S. R. Nayak and J. Mishra, “ Analysis of medical images using fractal geometry,” In Research Anthology on Improving Medical Imaging Techniques for Analysis and Intervention, IG Global, 2023, p. 1547-1562. [CrossRef]
- G. L. Gao et al., “ Do the global grain spot markets exhibit multifractal nature? ”Chaos, Solitons & Fractals, vol. 164, 2022, p. 112663. [CrossRef]
- T. Zhao, Z. Li, and Y. Deng, “ Information fractal dimension of Random Permutation Set,” Chaos, Solitons & Fractals, vol. 174, 2023, p. 113883. [CrossRef]
- F. Pons, G. Messori, and D. Faranda, “ Statistical performance of local attractor dimension estimators in non-Axiom A dynamical systems,” Chaos: An Interdisciplinary Journal of Nonlinear Science, vo. 33, no. 7, 2023. [CrossRef]
- I. A. Mageed and Q. Zhang, “The Rényian-Tsallisian Formalisms of the Stable M/G/1 Queue with Heavy Tails Entropian Threshold Theorems for the Squared Coefficient of Variation,” electronic Journal of Computer Science and Information Technology, vol. 9, no. 1, 2023, p. 7-14.
- A. Mageed and Q. Zhang, “Inductive Inferences of Z-Entropy Formalism (ZEF) Stable M/G/1 Queue with Heavy Tails. In 2022 IEEE 27th International Conference on Automation and Computing (ICAC), 2022, p. 1-6. [CrossRef]
- J. Yan, J. Liu, and F. M. Tseng, “ An evaluation system based on the self-organizing system framework of smart cities: A case study of smart transportation systems in China,” Technological Forecasting and Social Change, vol. 153, 2020, p. 119371. [CrossRef]
- H. Deng, W. Wen, and W. Zhang, “Analysis of Road Networks Features of Urban Municipal District Based on Fractal Dimension,” ISPRS International Journal of Geo-Information, vol. 12, no. 5, 2023, p. 188. [CrossRef]
- B. Liu, X. Guo, and J. Jiang, “How Urban Morphology Relates to the Urban Heat Island Effect: A Multi-Indicator Study,” Sustainability., vol. 15, no. 14, 2023, p. 10787. [CrossRef]
- I. A. Mageed, "Fractal Dimension(Df) Theory of Ismail’s Second Entropy(Hq I) with Potential Fractal Applications to ChatGPT, Distributed Ledger Technologies(DLTs) and Image Processing(IP)," 2023 International Conference on Computer and Applications (ICCA), Cairo, Egypt, 2023, pp. 1-6. -6. [CrossRef]
- A. Mageed, "Fractal Dimension (Df) of Ismail’s Fourth Entropy with Fractal Applications to Algorithms, Haptics, and Transportation," 2023 International Conference on Computer and Applications (ICCA), Cairo, Egypt, 2023, pp. 1-6. -6. [CrossRef]
Figure 2.
Visualizing how N affects using illustrative data.
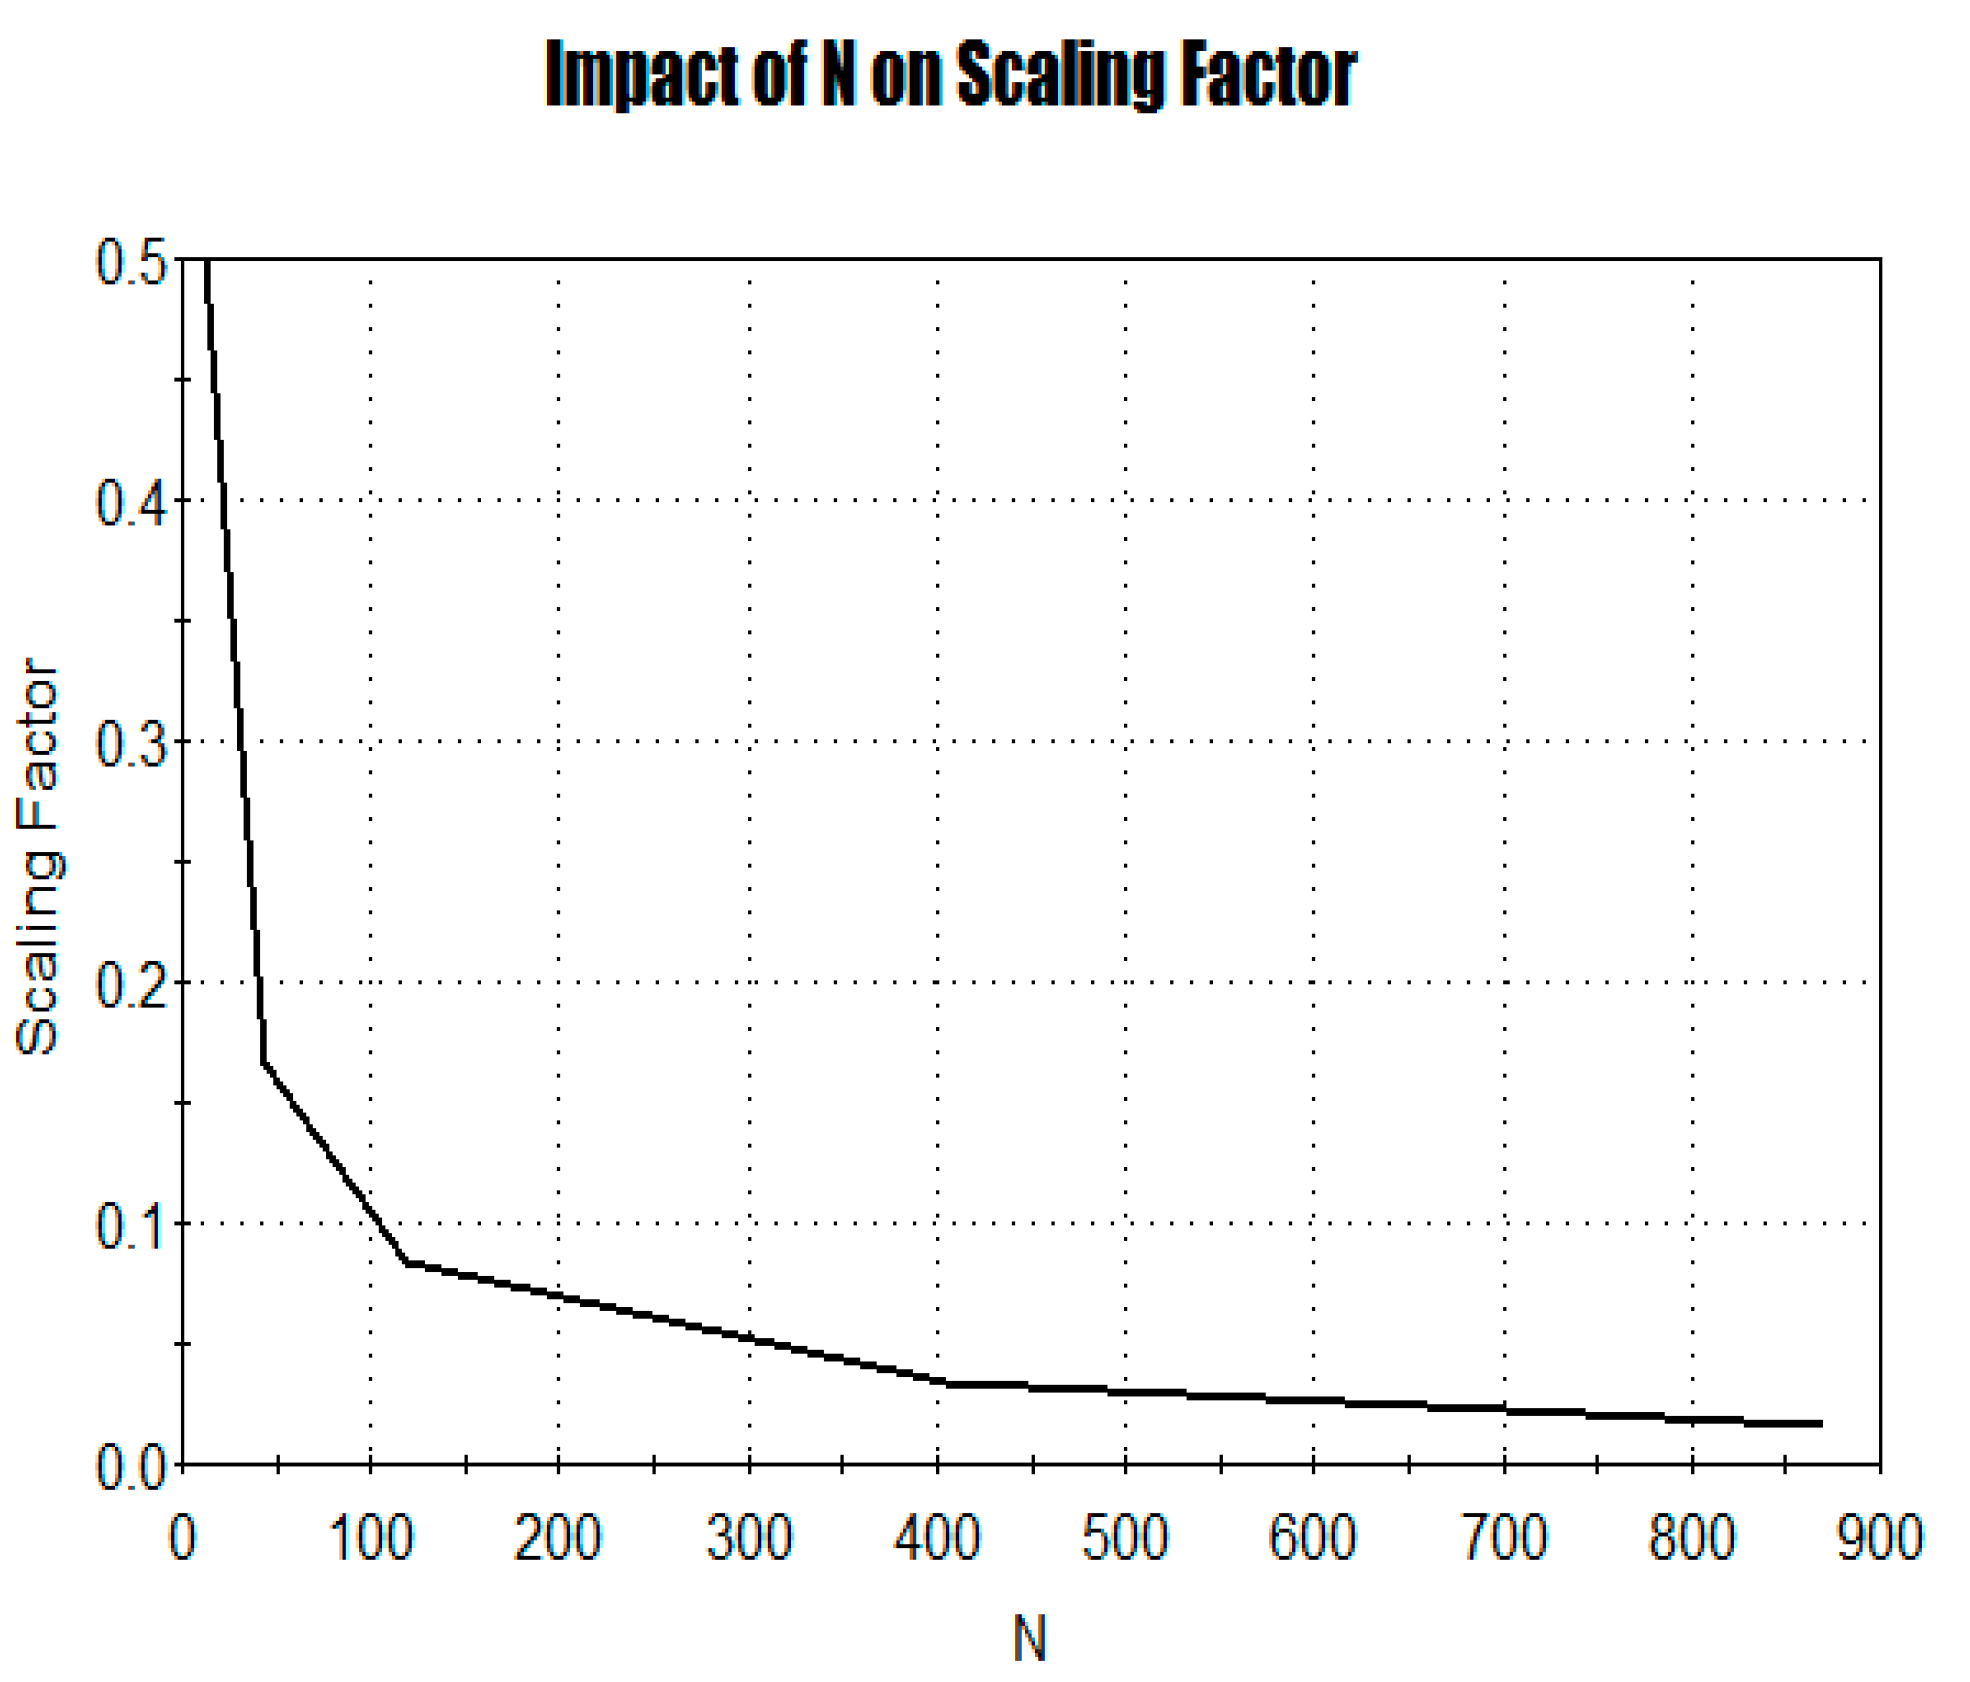
Figure 3.
An illustration on how influences using data.
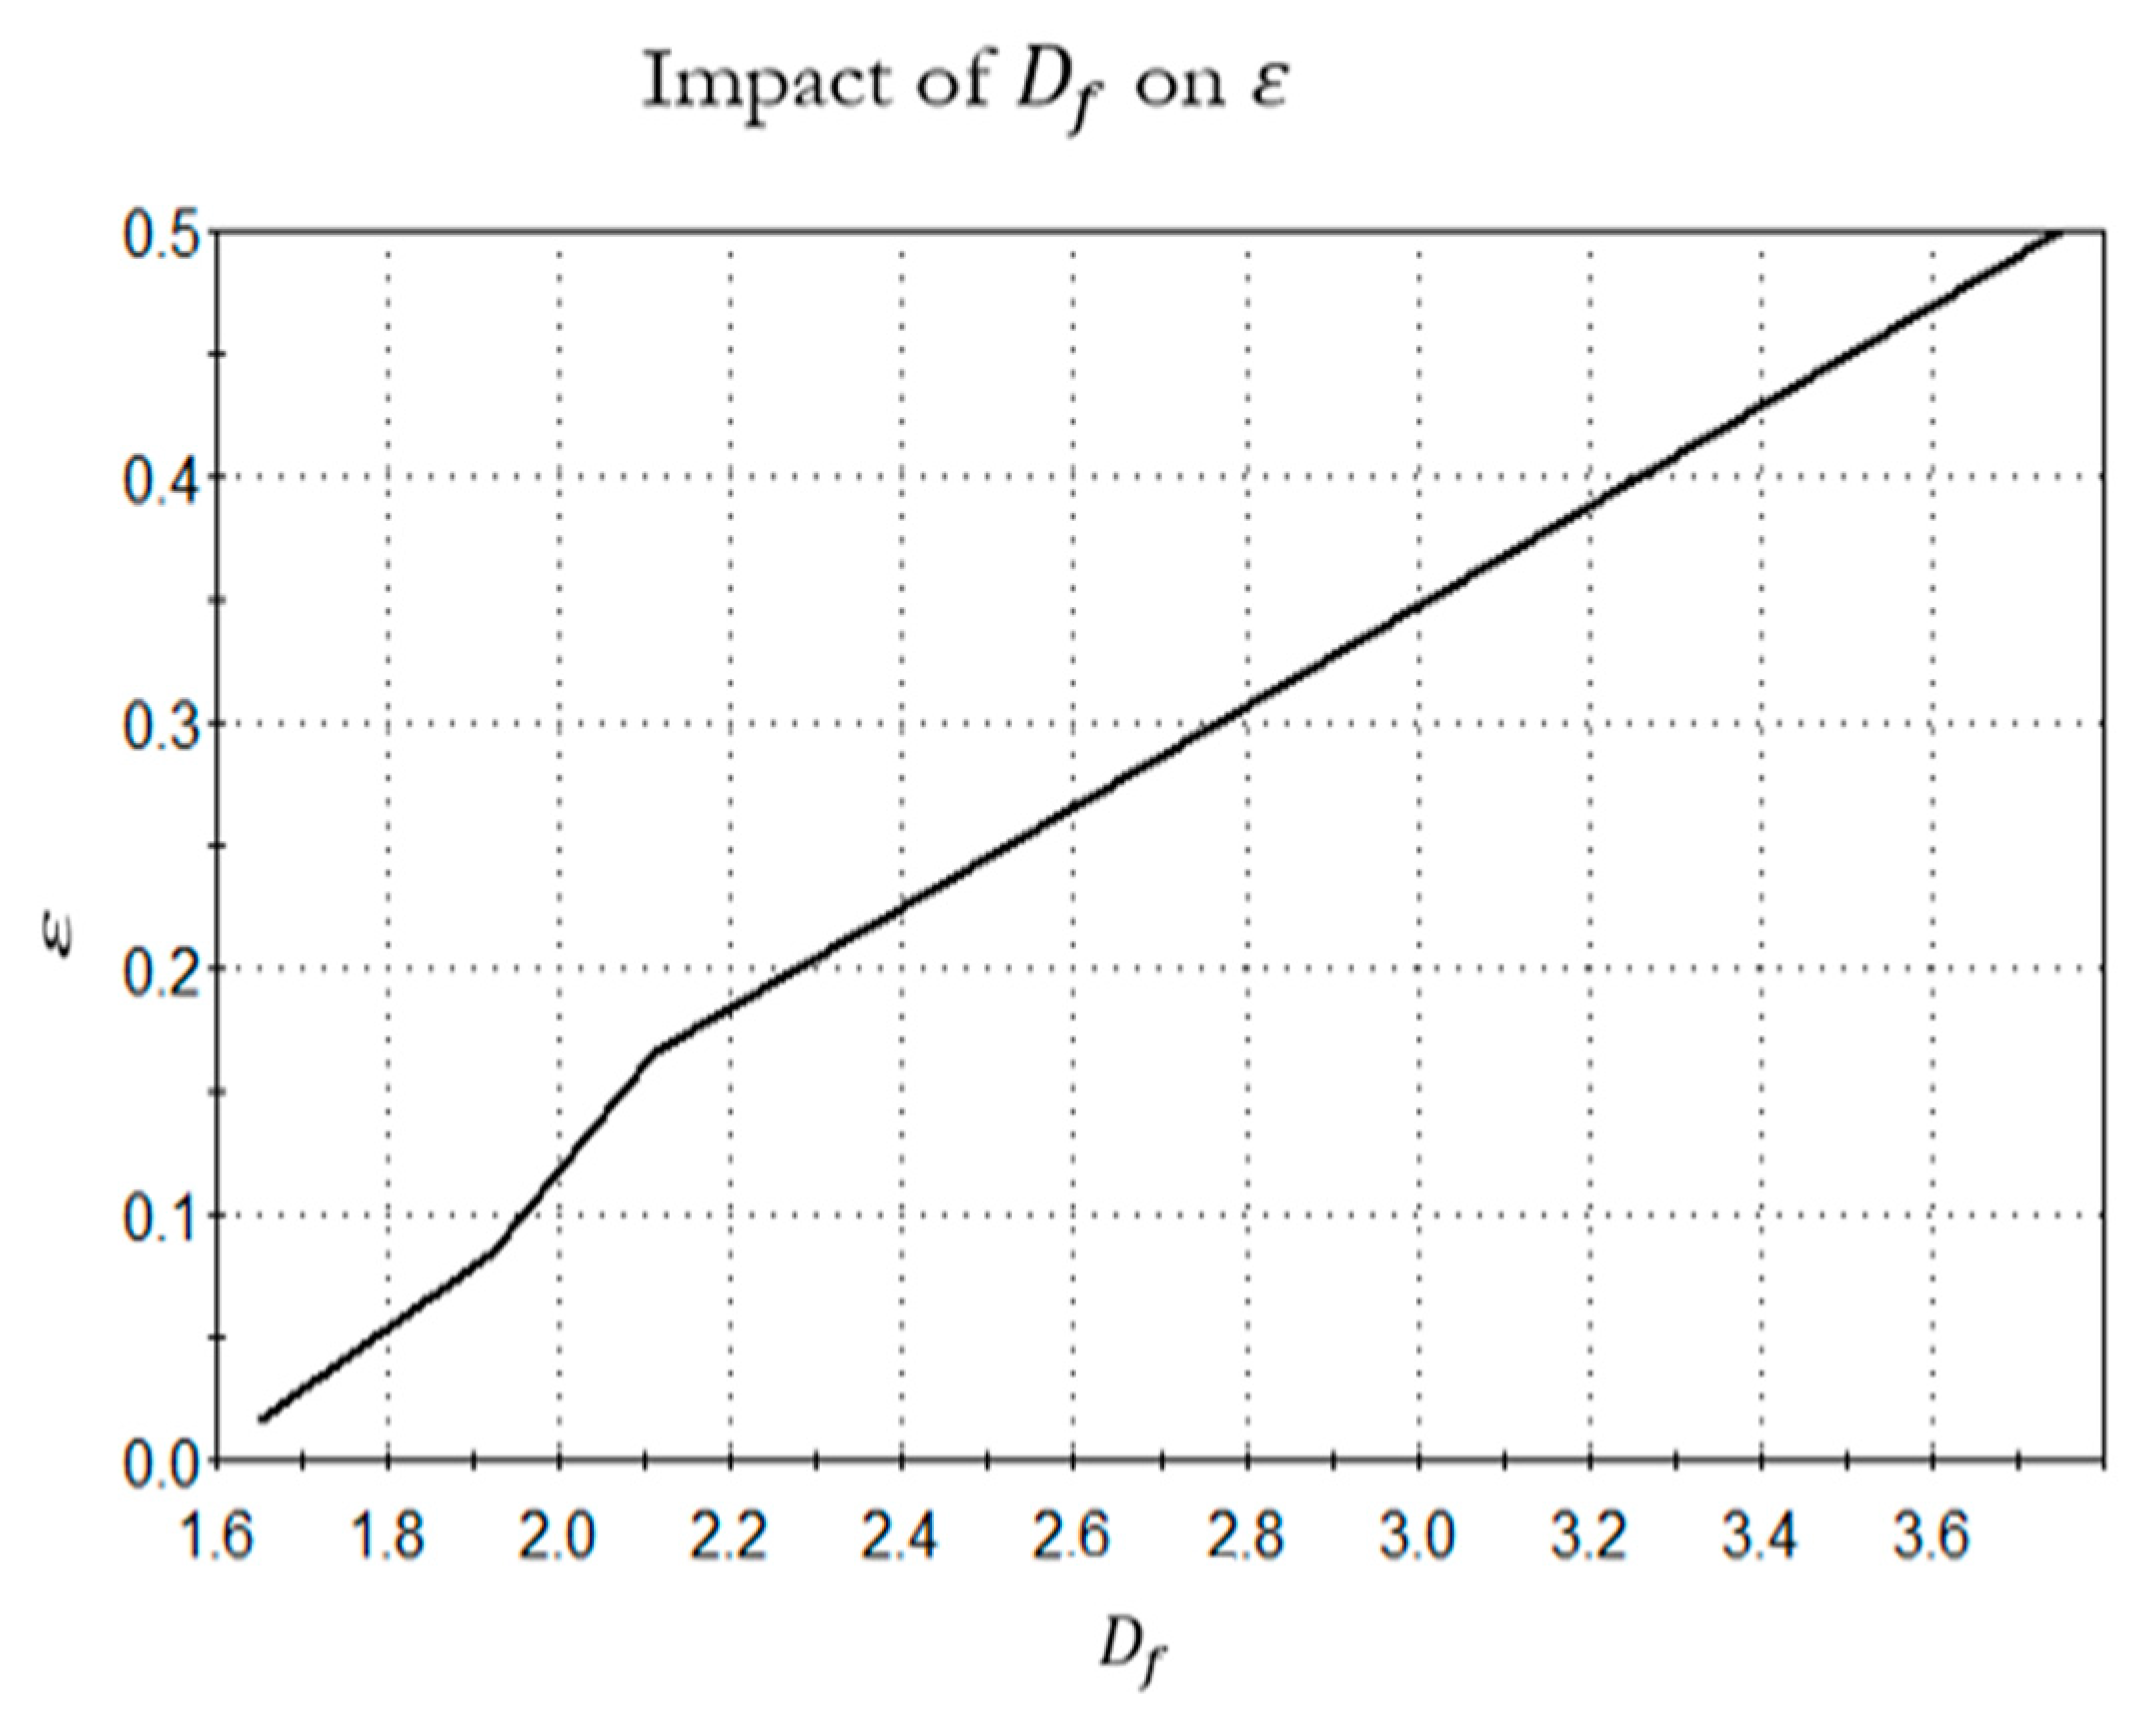
Figure 7.
The self-organizing system framework of a smart city refers to the interconnected and interdependent components that make up a smart city, including smart homes, businesses, governments, social groups, and more. These components, known as smart cells, evolve from simple phenomena into complex entities through the influence of institutional culture and information and communication technology (ICT). The framework operates as a self-organizing system, exchanging information and energy with the external world, and follows a hierarchical structure where smart cells form tissues, which form organs, and ultimately form the entire smart city system[14].
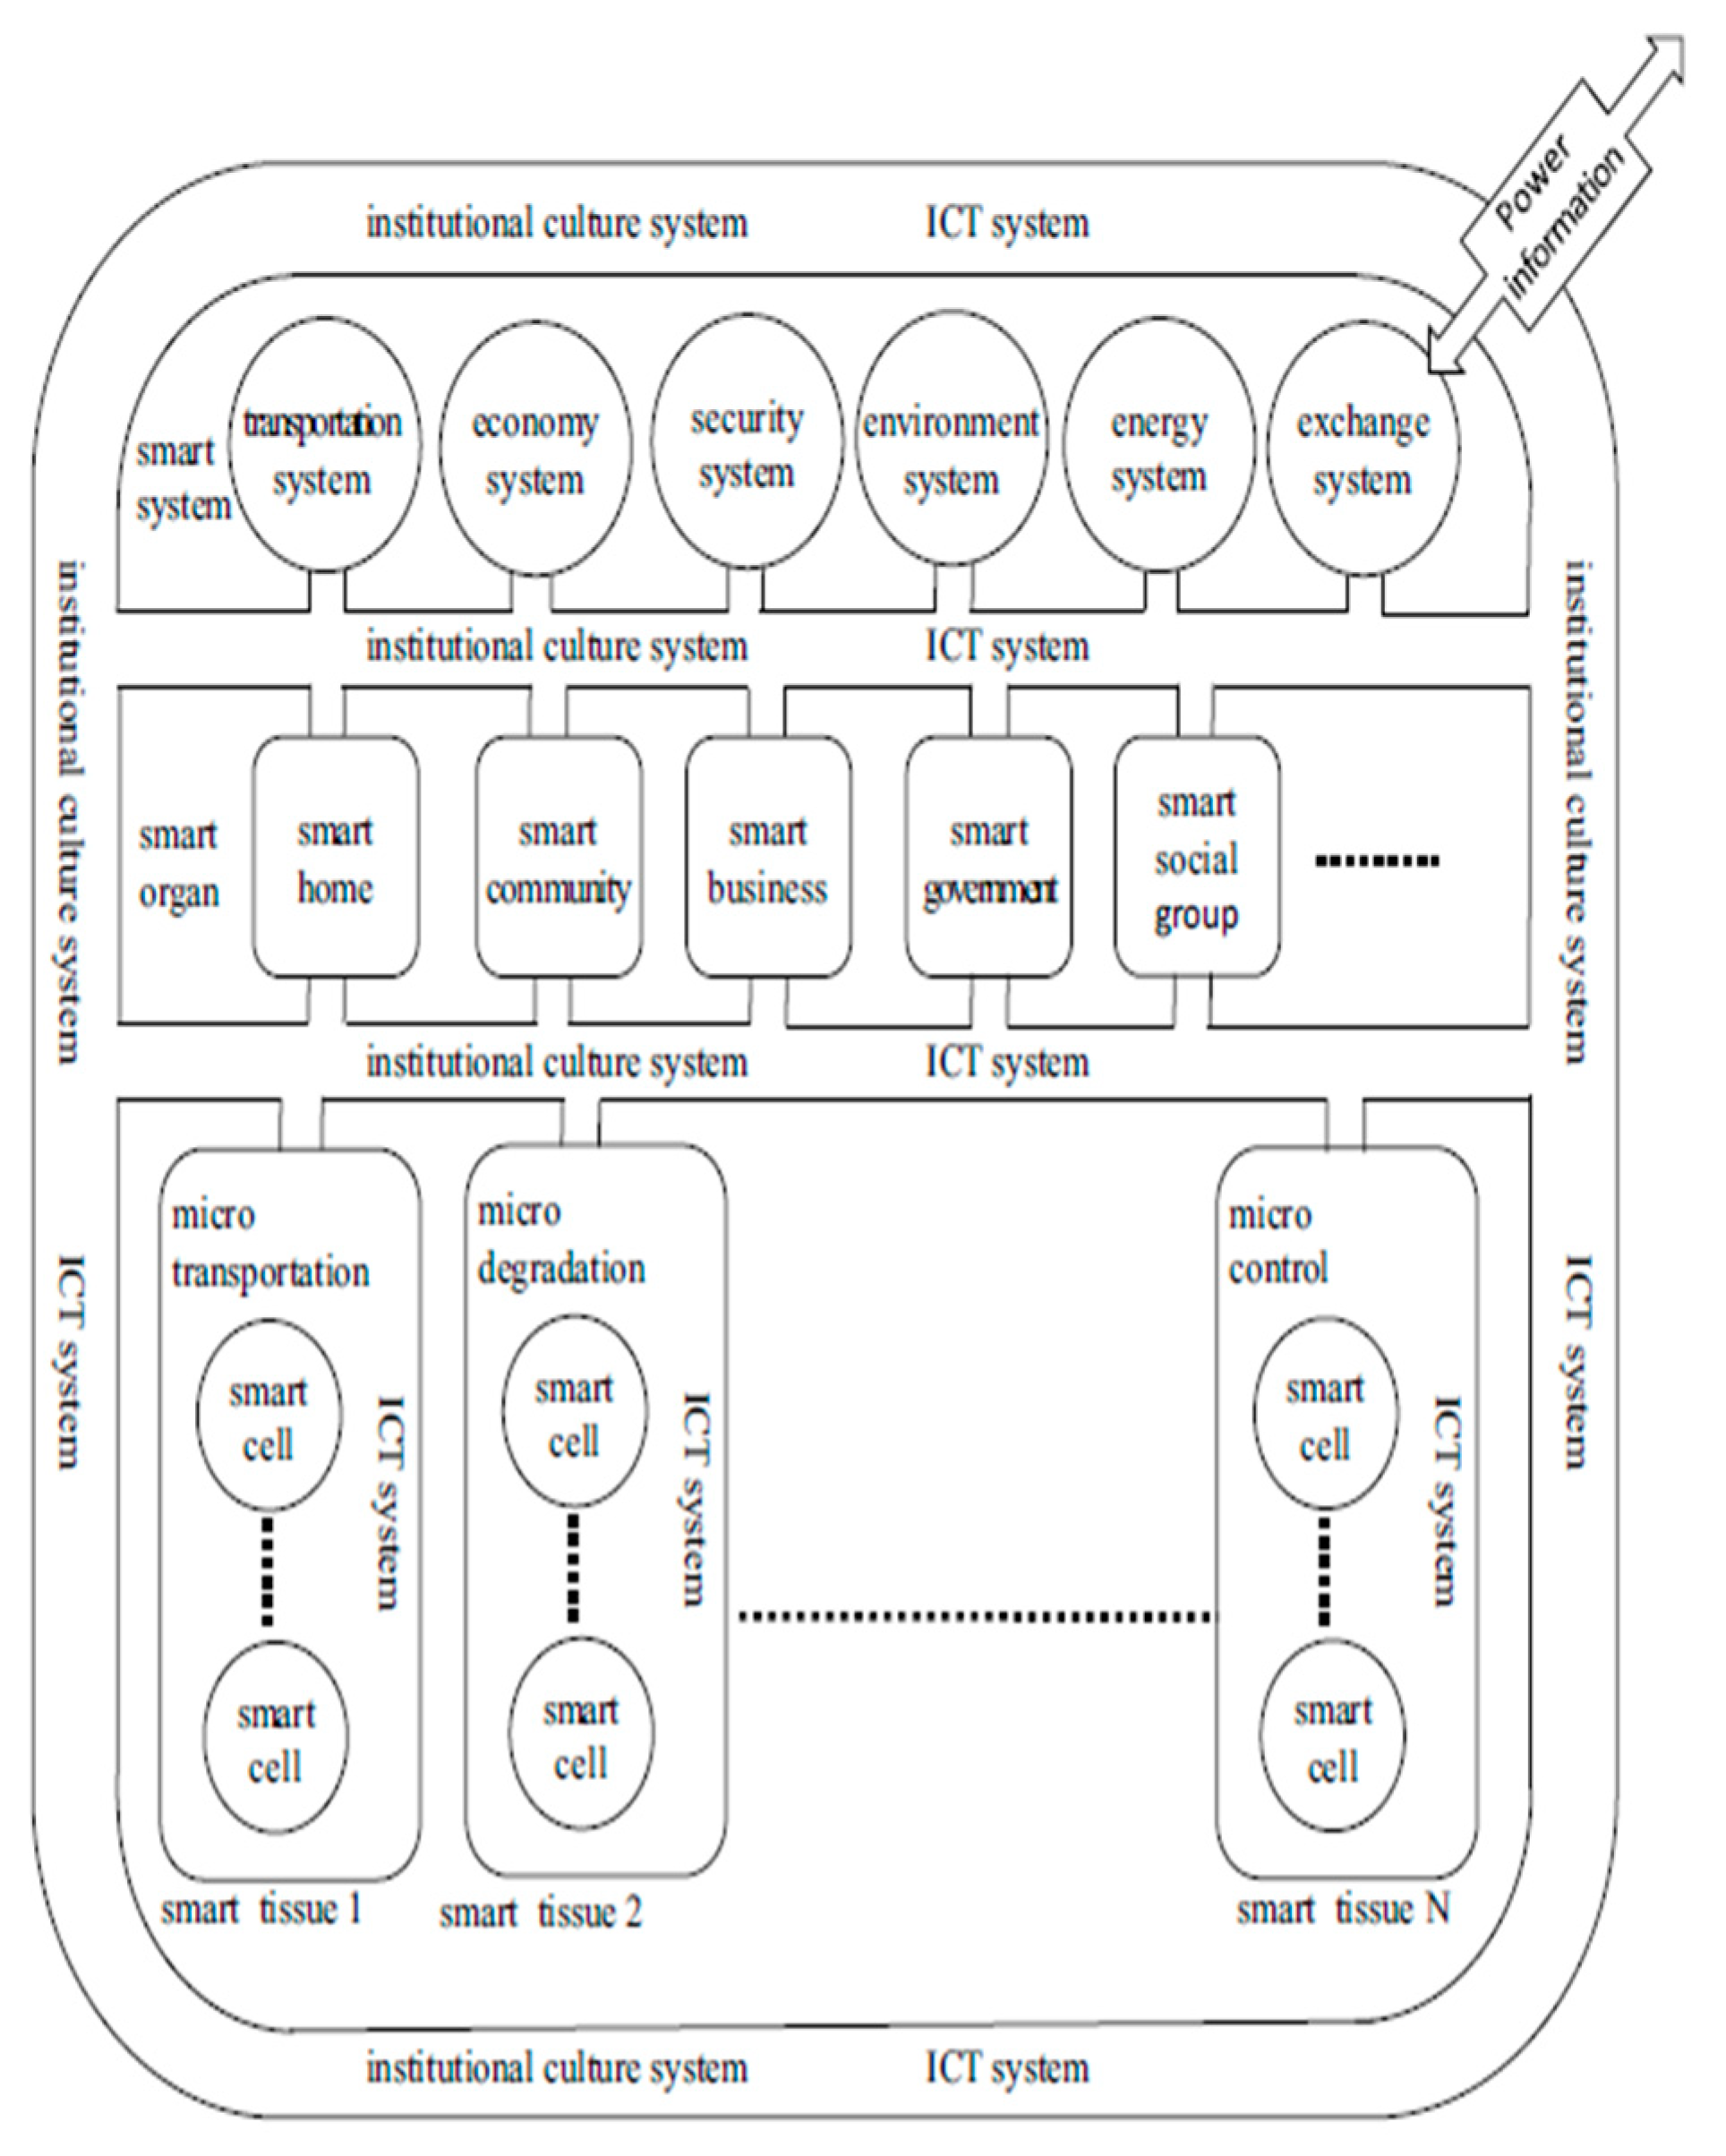
Figure 8.
the geographical location of the urban area of Harbin, China, which is depicted by the coloured areas within the red circle. Harbin is a city in China, and this information is relevant for the study or analysis being conducted in the context of the article[15].
Figure 8.
the geographical location of the urban area of Harbin, China, which is depicted by the coloured areas within the red circle. Harbin is a city in China, and this information is relevant for the study or analysis being conducted in the context of the article[15].
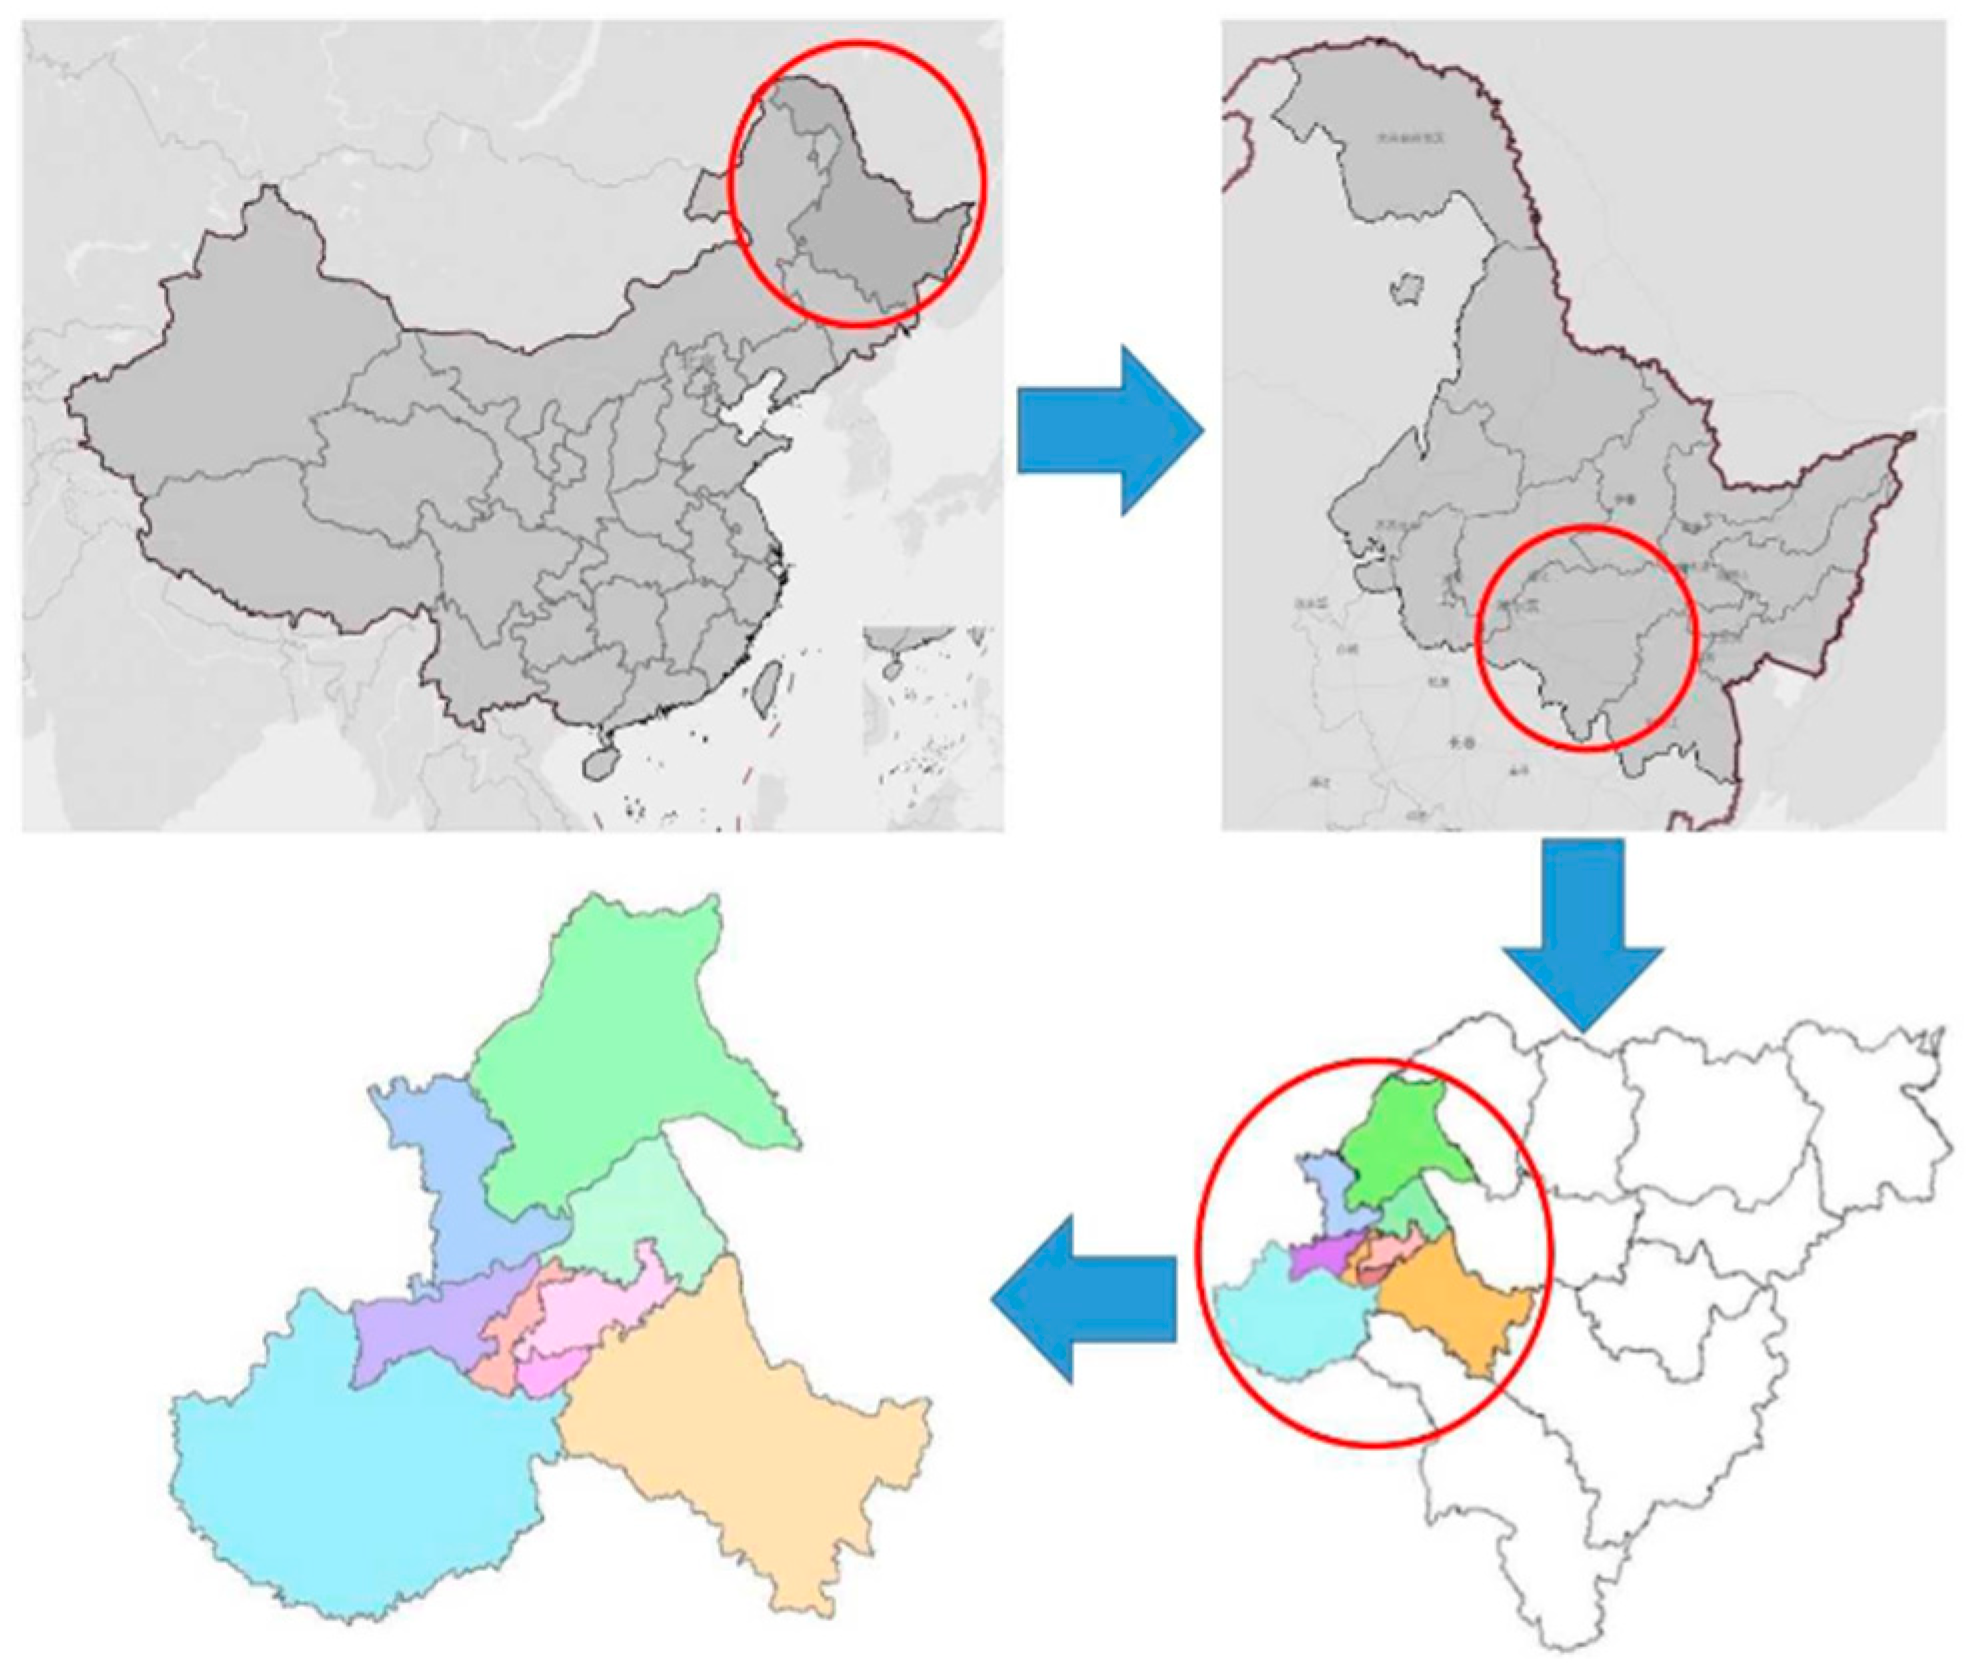
Figure 9.
When moving outward from the city center, the road network in Harbin’s urban municipal district shows a change from being densely connected to becoming less interconnected. As a result, the core districts have more roads and intersections, whereas as we move away from the city center, there are less roads and crossroads. By examining the data from the road network, it is possible to observe this spatial pattern of road distribution, which has consequences for urban and transportation development in Harbin[15].
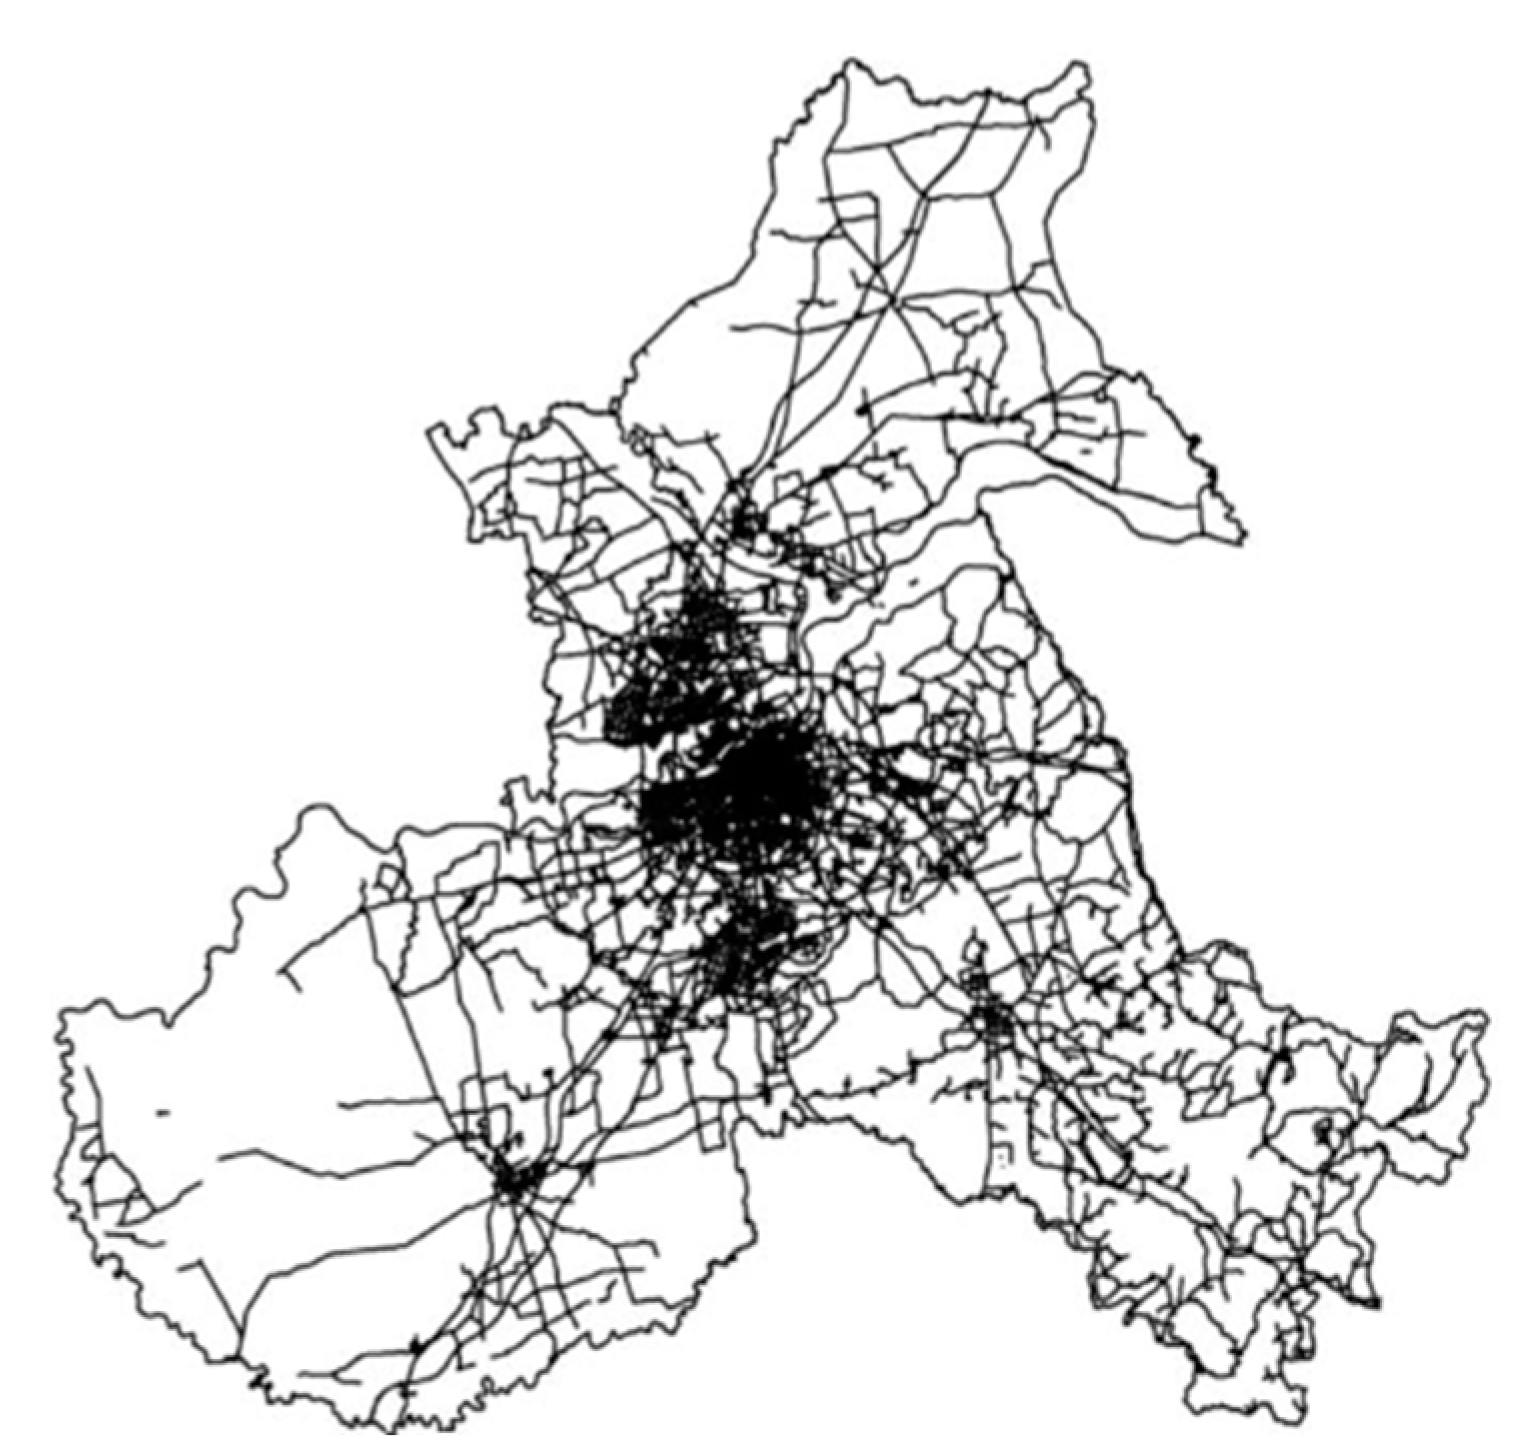
Figure 10.
The road networks of nine districts in Harbin, a city in China, at a resolution of 500 dots per inch (dpi). This means that the road maps of these districts have been digitally represented with a high level of detail and clarity, allowing for precise analysis and visualization of the road infrastructure in those areas[15].
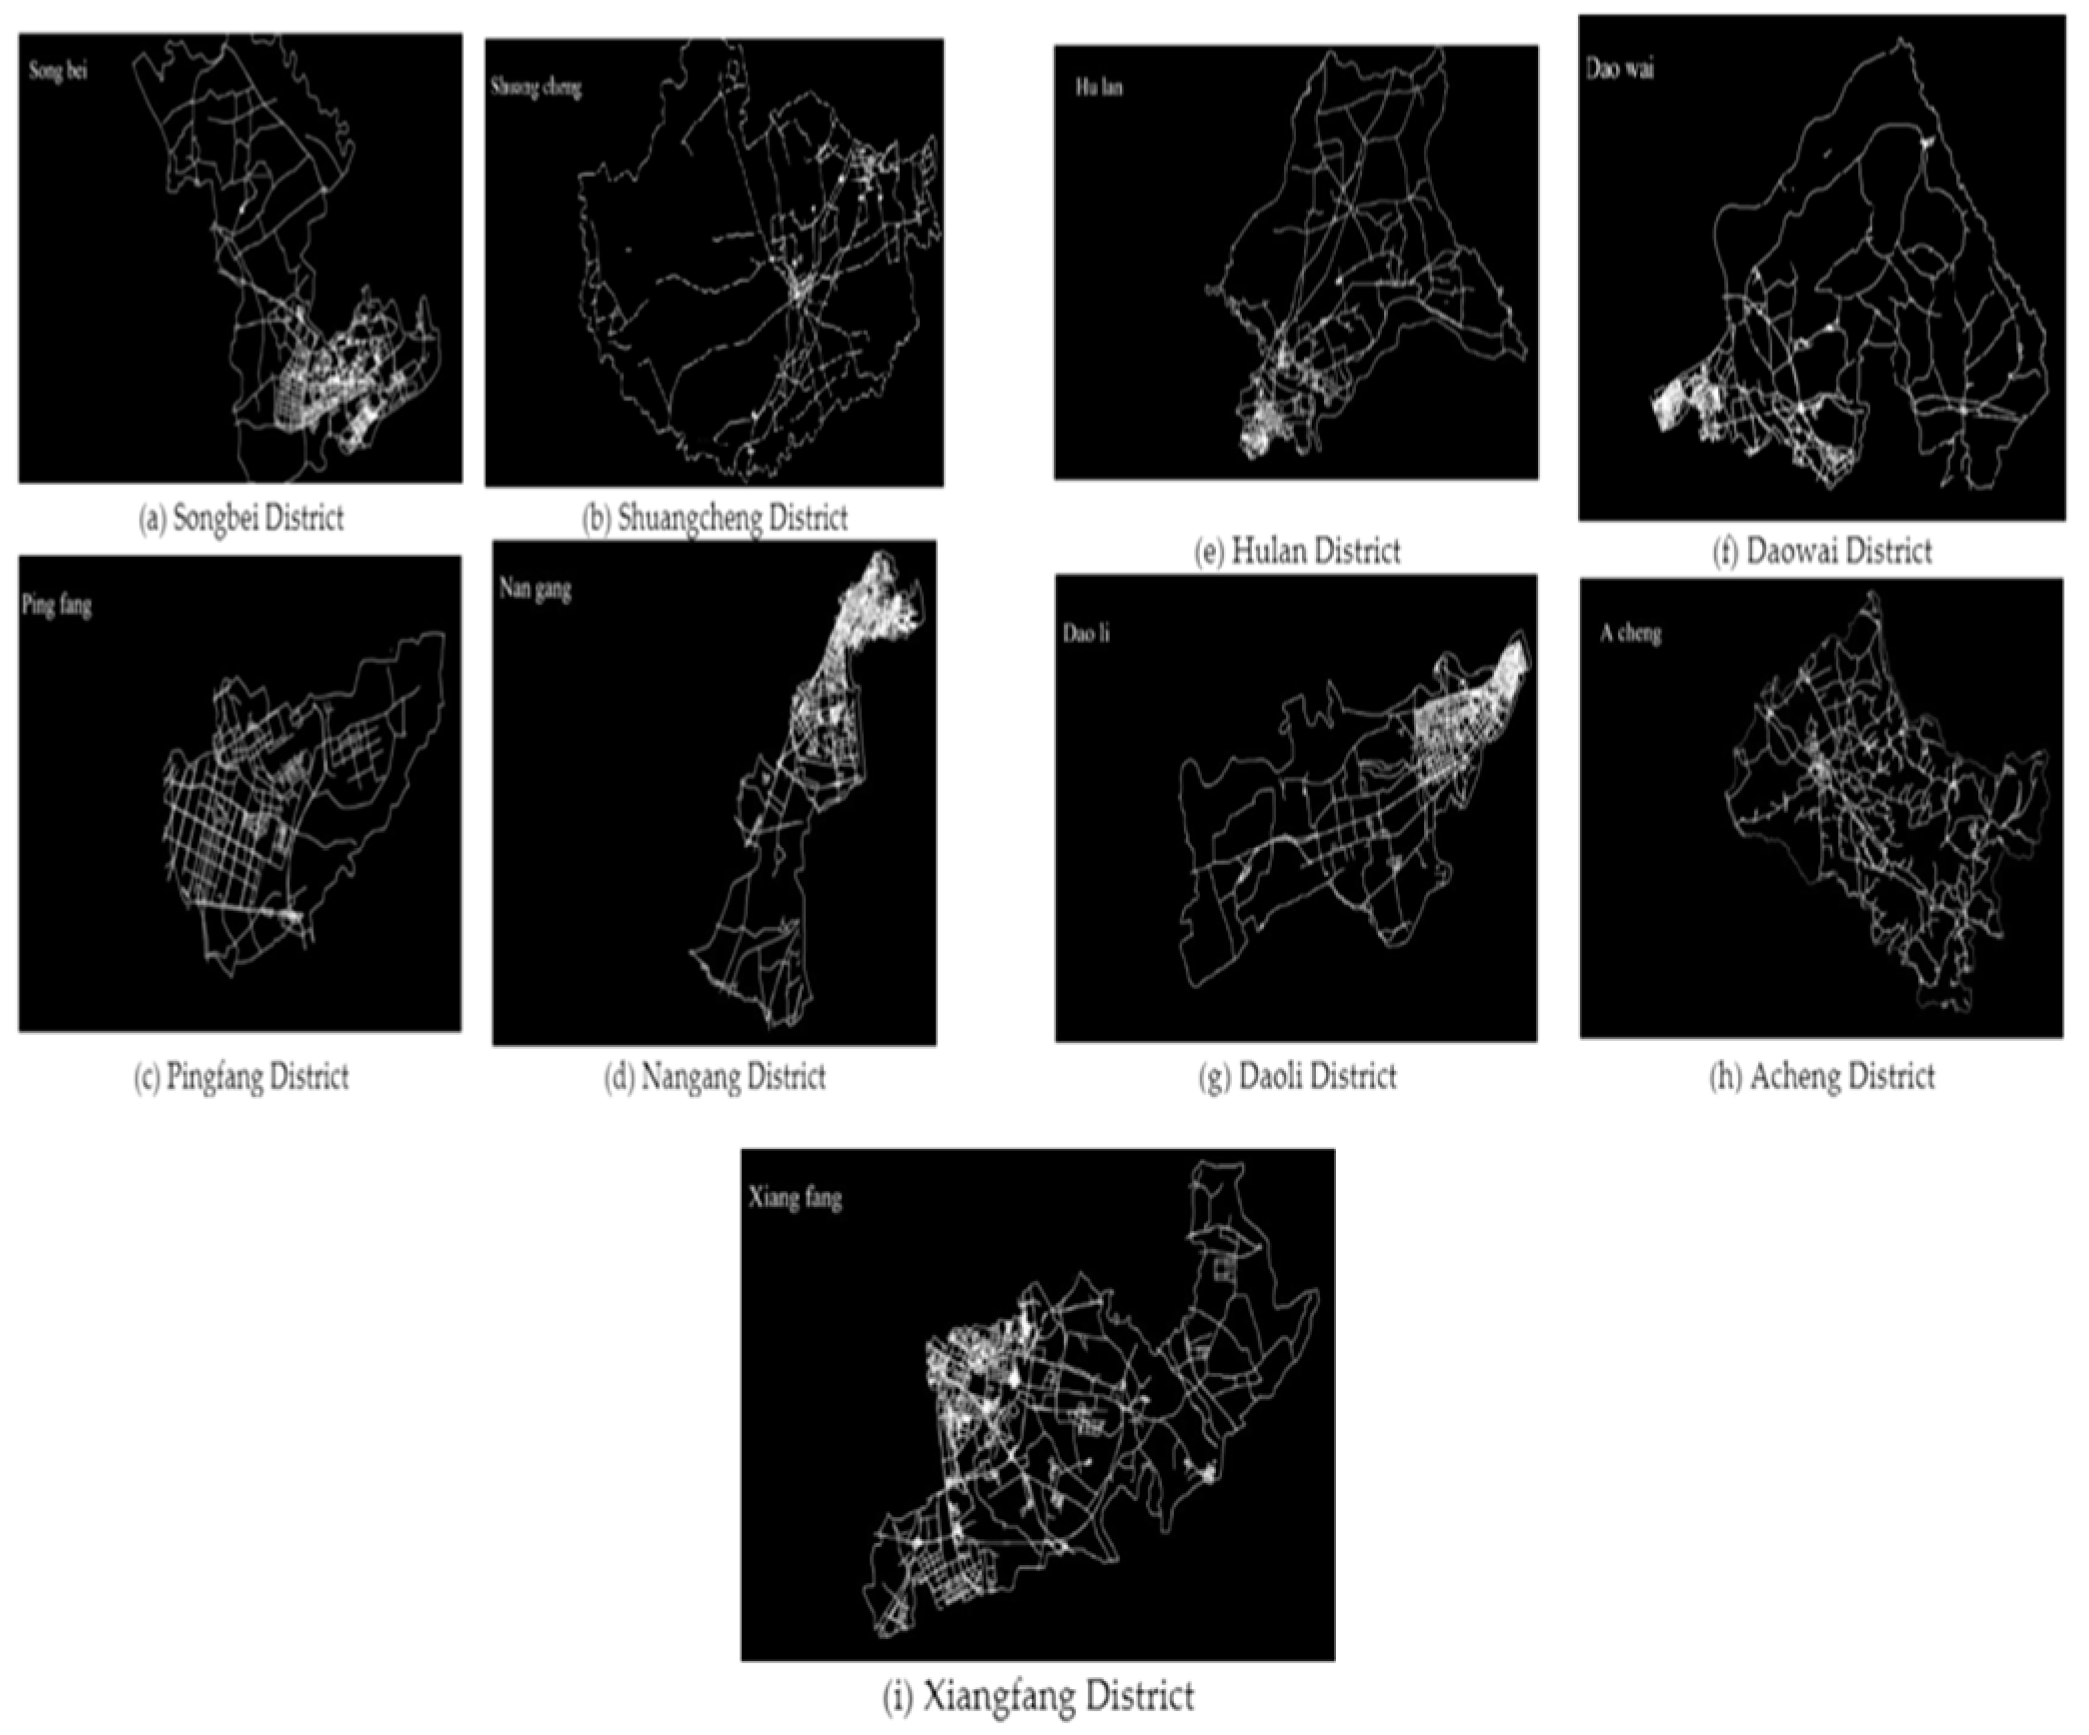
Figure 11.
Examples of city clusters and their corresponding box-counting results, which determine and the logarithm of anisometry (). The scatter plots in panels (a), (b), and (c) display the relationship between the daytime UHI intensity and the city size, and anisometry, respectively. The results indicate that larger cities tend to have higher UHI intensities, more compact cities exhibit greater UHI intensities, and more circular cities show elevated UHI intensities[16].
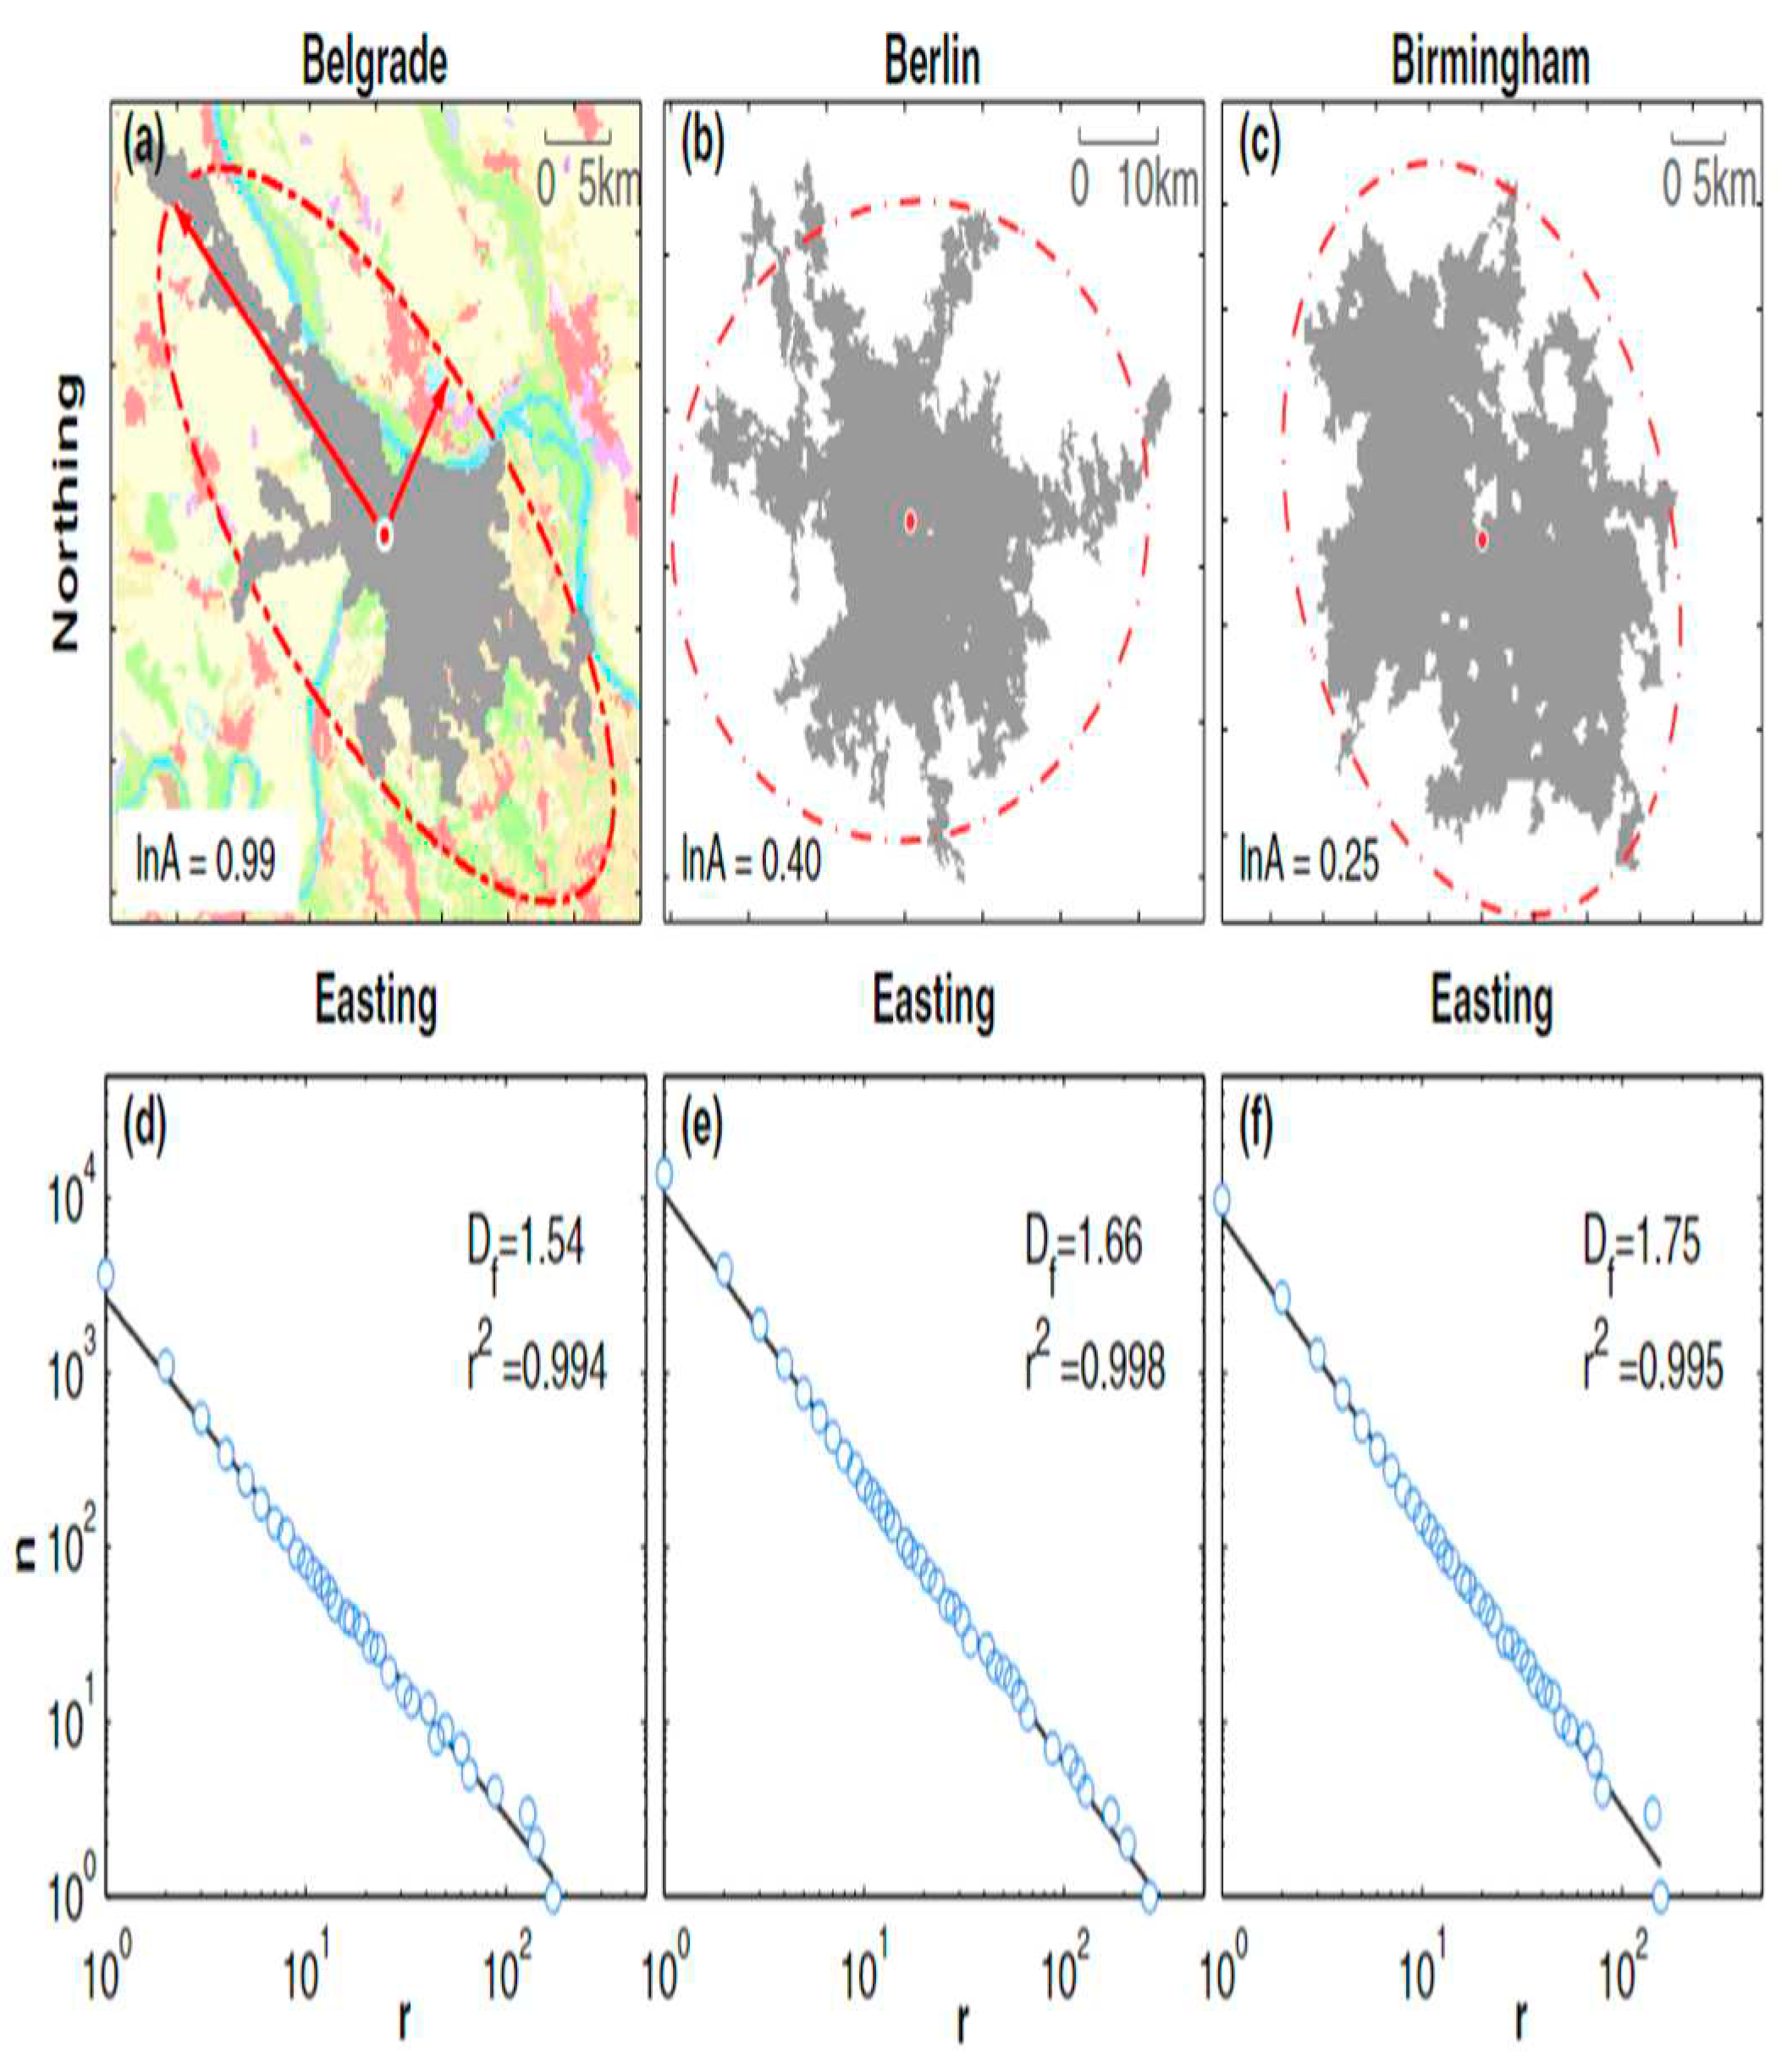
Figure 12.
The way Urban Heat Island (UHI) intensity and three factors: logarithm urban cluster size, fractal dimension, and logarithm of anisometry are related.
Figure 12.
The way Urban Heat Island (UHI) intensity and three factors: logarithm urban cluster size, fractal dimension, and logarithm of anisometry are related.
Disclaimer/Publisher’s Note: The statements, opinions and data contained in all publications are solely those of the individual author(s) and contributor(s) and not of MDPI and/or the editor(s). MDPI and/or the editor(s) disclaim responsibility for any injury to people or property resulting from any ideas, methods, instructions or products referred to in the content. |
© 2024 by the author. Licensee MDPI, Basel, Switzerland. This article is an open access article distributed under the terms and conditions of the Creative Commons Attribution (CC BY) license (http://creativecommons.org/licenses/by/4.0/).
Copyright: This open access article is published under a Creative Commons CC BY 4.0 license, which permit the free download, distribution, and reuse, provided that the author and preprint are cited in any reuse.


