National & Local Joint Laboratory of Engineering for Effective Utilization of Regional Mineral Resources from Karst Areas, Guiyang 550025, China
Guizhou Key Lab of Comprehensive Utilization of Nonmetallic Mineral Resources, Guiyang 550025, China, email: mnlljiang@163.com
1. Introduction
Red mud, an alkaline solid, is a byproduct of alumina synthesis. It is porous and has a good particle size distribution, with an average particle size of <0.1 mm and a specific surface area of ~10–25 m
2/g [
1]. It is used as an adsorbent for phosphorus removal, and its regeneration after phosphorus adsorption has garnered research attention. The desorption regeneration of red mud is an effective treatment method [
2,
3,
4] because it enables efficient adsorbent regeneration and target ion recycling. Hydrochloric acid is used as the desorbent for the desorption of modified red mud (as the adsorbent). Yaqin Zhao [
5] showed that hydrochloric acid achieved a high desorption efficiency of 90%; however, its use in the desorption of phosphorus from red mud was not clarified therein. Therefore, several studies were conducted to verify the use of phosphorus as a desorbent for red mud [
6,
7,
8].
Molecular dynamics simulation uses molecular force fields and computational methods developed based on Newtonian kinematics. It is used to analyze the movement of particles in a system [
9]. It yields highly accurate results in determining the dynamics and thermodynamic statistics of various systems and is used for various surface characterizations [
10]. Tang Gen used molecular dynamics and the radial distribution function (RDF) to determine the hydrogen bonding strength between two atoms[
11]. Xin Jing used molecular dynamics to investigate the relaxation in binding energy and transient regime and revealed that SO
42− primarily ensures electrostatic and hydrogen bonding during the desorption of oil film on the calcite surface [
12]. Xu Yao et al. used molecular dynamics simulations to study the adsorption characteristics of water molecules on the muscovite surface [
13]; however, the use of this method for studying phosphorus desorption is still in its infancy.
The Monte Carlo method uses mathematical models and randomly samples inputs from the probability distribution curve . Then, the lowest feasible result is determined. Based on the storage of the mathematical model for the calculation, this simulation is repeated to obtain statistical results. This method is widely used in mathematical and statistical research. The adsorption amount, heat of adsorption, adsorption isotherm, adsorption sites, and adsorption probability density are determined using the Monte Carlo method to determine the adsorption mechanism [
14], gas–solid interfacial adsorption, such as methane [
15] and hydrogen [
16] adsorption, and solid–liquid adsorption/desorption of water. Kim Ji-Shin et al. using this method to study the water adsorption mechanism of coal [
17]. Bahamon et al. studied the pollutant adsorption mechanism of activated carbon using this method [
18]. Longjiang Li studied the adsorption mechanism of phosphorus by the components of red mud [
19]. Square et al. studied the adsorption of phosphate anion on Pt(1 1 1) surface using the Monte Carlo method and density functional theory [
20]. Jie Wang studied the adsorption mechanism of phosphorus on calcite surface via first principles calculation [
21]. However, the Monte Carlo method has not been used to study the desorption of phosphorus. Surface reaction and molecular adsorption/desorption were also studied using this method [
22]. Microscopic molecular dynamics and Monte Carlo methods are not currently used for studying the adsorption/desorption of phosphorus by red mud. Therefore, these methods were used herein to simulate the desorption characteristics, optimize the activation of red mud components, determine the adsorbent mass, and develop the desorbent mass model based on the distribution of adsorbent concentration before and after adsorption and desorption. Based on the results, the interaction energy, RDF, MSD, diffusion coefficient, desorption isotherm, desorption sites, heat of desorption, and desorption energy after desorption were determined at the microscopic level.
2. Material and methods
2.1. Experimental raw materials
Modified red mud, used as an adsorbent herein, was prepared using charcoal powder (Henan Xingnuo Environmental Protection Materials Co., Ltd.), silica sol (Wuhan Jiye Sheng Chemical Co), and red mud (Guizhou Huajin Aluminum Co., Ltd). It contained 30% water and was dried at 50℃ for 12 h. The mixture was ground in a ball mill and sieved through a 0.075-mm sieve. The red mud mainly contained 21.94% of Fe2O3, 21.04% of Al2O3, 19.05% of SiO2, 17.95% of CaO, 8.96% of Na2O, and 11.06% of other components. Phosphorus wastewater (pH 4 and phosphorus content of 320 mg/L) obtained from a phosphorus ore dressing plant in Guizhou of China was used for simulation. The mass ratio of red mud:charcoal powder: silica sol was preset as for 92:5:3 after weighing and mixing, and a granulated mixture was obtained using a disc granulator. The water-to-cement ratio was 1:2 to obtain particle sizes of 1–2 mm. The activated particles were then placed in a muffle furnace and sintered for 30 min at 700℃. The red mud particles were mixed with phosphorus wastewater for adsorption. Then, desorption test was performed after the adsorbent was dehydrated naturally and dried at 60 ℃. The phosphorus wastewater contained tailings, and the main elements were 1278.0, 213.15, 401.40, 0.25, 0.02, 0.04, 66.35, and 66.35 mg/L of P, Ca, Mg, Al, Fe, Cr, K, and Na, respectively. Phosphorus wastewater is weakly acidic (pH 3–4) and contains phosphorus mainly as H2PO42−, which can be diluted to the required concentration using deionized water.
2.2. Mineral composition analysis
The adsorbents were analyzed for mineral phase composition using an X-ray diffractometer (XPert PRO MPD). X-ray powder diffraction and Cu-target Kα diffraction were performed at 40 kV and 40 mA at a scanning speed of 2°/s and scan range of 10°–80°. The spectrum was fitted via Rietveld refinement XRD using internally doped standard samples. The calculations were performed to quantitatively analyze the composition of crystalline phases in the red mud particles.
2.3. Molecular dynamics simulation methods
2.3.1. Construction of desorption model
The mineral composition of the activated red mud was obtained via XRD, and geometry optimization of each mineral was performed using the CASTEP module. Local density approximation (LDA) and generalized gradient approximation (GGA), including LDA-CA-PZ, GGA-RPBE, GGA-PBESOL, GGA-PBE, GGA-PW91, and GGA-WC, were used to obtain the structure that best matches the experimental test lattice parameters. The mass content and specific density were obtained using the amorphous cell module for constructing the activated red mud model [
19] using Forcite molecular dynamics. The adsorbent and desorbent were placed on the surface of the activated red mud model, and molecular dynamics relaxation was performed. The sorption module was used to determine the desorbent interactions in the activated red mud model based on the Monter Carlo method to investigate the microscopic mechanisms of adsorption and desorption.
2.3.2. Calculation of desorption concentration distribution curves for adsorbents of activated red mud particles
After kinetic calculations, the target atoms were selected and analyzed along the z-axis [
23]. Based on the comparison of the initial distance between phosphorus and the surface of the activated red mud particles and the calculated distance, the concentration distribution of phosphorus in each direction was derived. This allowed the analysis of spatial distribution of different adsorption/desorption agents to quantitatively represent the effect of desorption and the migration law of phosphorus.
2.3.3. Calculation of desorption interaction energy of activated red mud particles
The interaction energy can reflect the binding strength of the adsorbate and adsorbate surface, which is a measure of the interaction size of different components in a mixed system. It determines the overall system stability. A negative interaction energy implies that the adsorption state is stable and facilitates easy adsorption [
24,
25]. A higher binding energy implies that the system is more stable with better adsorption effect; the binding energy is the negative interaction energy [
26]. The interaction and binding energies were calculated for the system with and without the desorbent as follows:
where
is the energy of the whole system after the action,
is the energy of the representative adsorbent after the action,
is the energy of the adsorbent after the action,
is the interaction energy, and
is the binding energy. The magnitudes of the interaction and binding energies of the two systems were compared to determine the adsorption state of phosphorus on the surface of activated red mud particles and the effect of desorbent.
2.3.4. Calculation of desorption radial distribution function of activated red mud particles
By calculating the RDF between the active atoms, namely Ca, Al, Fe, and O, in the activated red mud particles and O in H
2PO
4−, the main appearing positions of phosphorus adsorption and desorption and intermolecular interactions. The RDF is the ratio of the area of the system at the reference particle to the average density of the system, which reflects the aggregate molecular size and internal microstructure of the system [
27]. By comparing r and the peak height, the mode and strength of interatomic interactions can be determined. The peaks in the RDF g(r) within 3.5 Å are mainly attributed to chemical and hydrogen bonding [
28], those at 3.5–5 Å are mainly van der Waals interactions, and those at >5.0 Å are attributed to very weak van der Waals interactions.
where
is the total number of molecules,
is the total computational time (number of steps),
is the set difference in distance, and
is the number of molecules between the
scores. In solids, the RDF curve shows a series of clear and stable peaks due to the relatively fixed position of molecules. In liquids, where the motion of the molecules is characterized by proximal order and remote disorder, the RDF curves show clear peaks only at short distances [
29].
2.3.5. Calculation of desorption mean-square displacement of activated red mud particles
For phosphorus in the desorption system from the starting position of the non-stop movement, the position of the phosphorus atoms at each instant is different. The particle diffusion trajectory was determined via mean-square displacement (MSD) calculations, which describe the movement of molecules in a macroscopic equilibrium state and the degree of intensity of molecular movement. Here,
is the position of the particle at time
; then, the MSD is represented by the average of the squared particle displacements [
30]:
According to the statistical principle, the calculation time is lengthy because of large number of molecules. Any instant of the system can be taken as the initial time, and the calculated average value is the same. MSD can be calculated as follows:
where
is the MSD of the molecule in the simulation time interval t,
is the position of the molecule
at moment
,
is the total number of molecules in the system, and
is the systematic mean value.
2.3.6. Calculation of adsorption/desorption diffusion coefficient of activated red mud particles
The diffusion coefficient of molecules indicate the diffusion ability of phosphorus in the liquid–solid system during adsorption by activated red mud particles. The diffusion ability depends on the substance and medium as well as the temperature and pressure. The diffusion coefficient D of liquid–solid systems can be calculated using the Einstein’s relational equation [
31], and the velocity correlation function (VACF) is determined using the Green–Kubo relation. The corresponding normalized velocity autocorrelation coefficient is defined as follows:
where
is the diffusion coefficient;
,
,
, and
are the displacement and velocity vectors of the particle
moments, respectively, and
is the average value of the system. The periodic boundary conditions were used herein to develop a three-dimensional model, and the NVT system was selected.
2.3.7. Monte Carlo simulation
The Monte Carlo method is a statistically based probabilistic research method used for solving the occurrence of a certain event. Typical characteristics of the problem are created and a mathematical probabilistic model is constructed, using which a solution that is close to the problem is determined. This simulation was performed herein using the giant regular system synthesized Monte Carlo method [
32]. Adsorption isotherms, adsorption isothermal heat, and adsorption sites were obtained using this method. Then, microscopic analyses were performed to obtain valuable results and microscopic details that are difficult to understand using conventional modeling.
3. Results and Analysis
3.1. Physical phase analysis of activated red mud particle
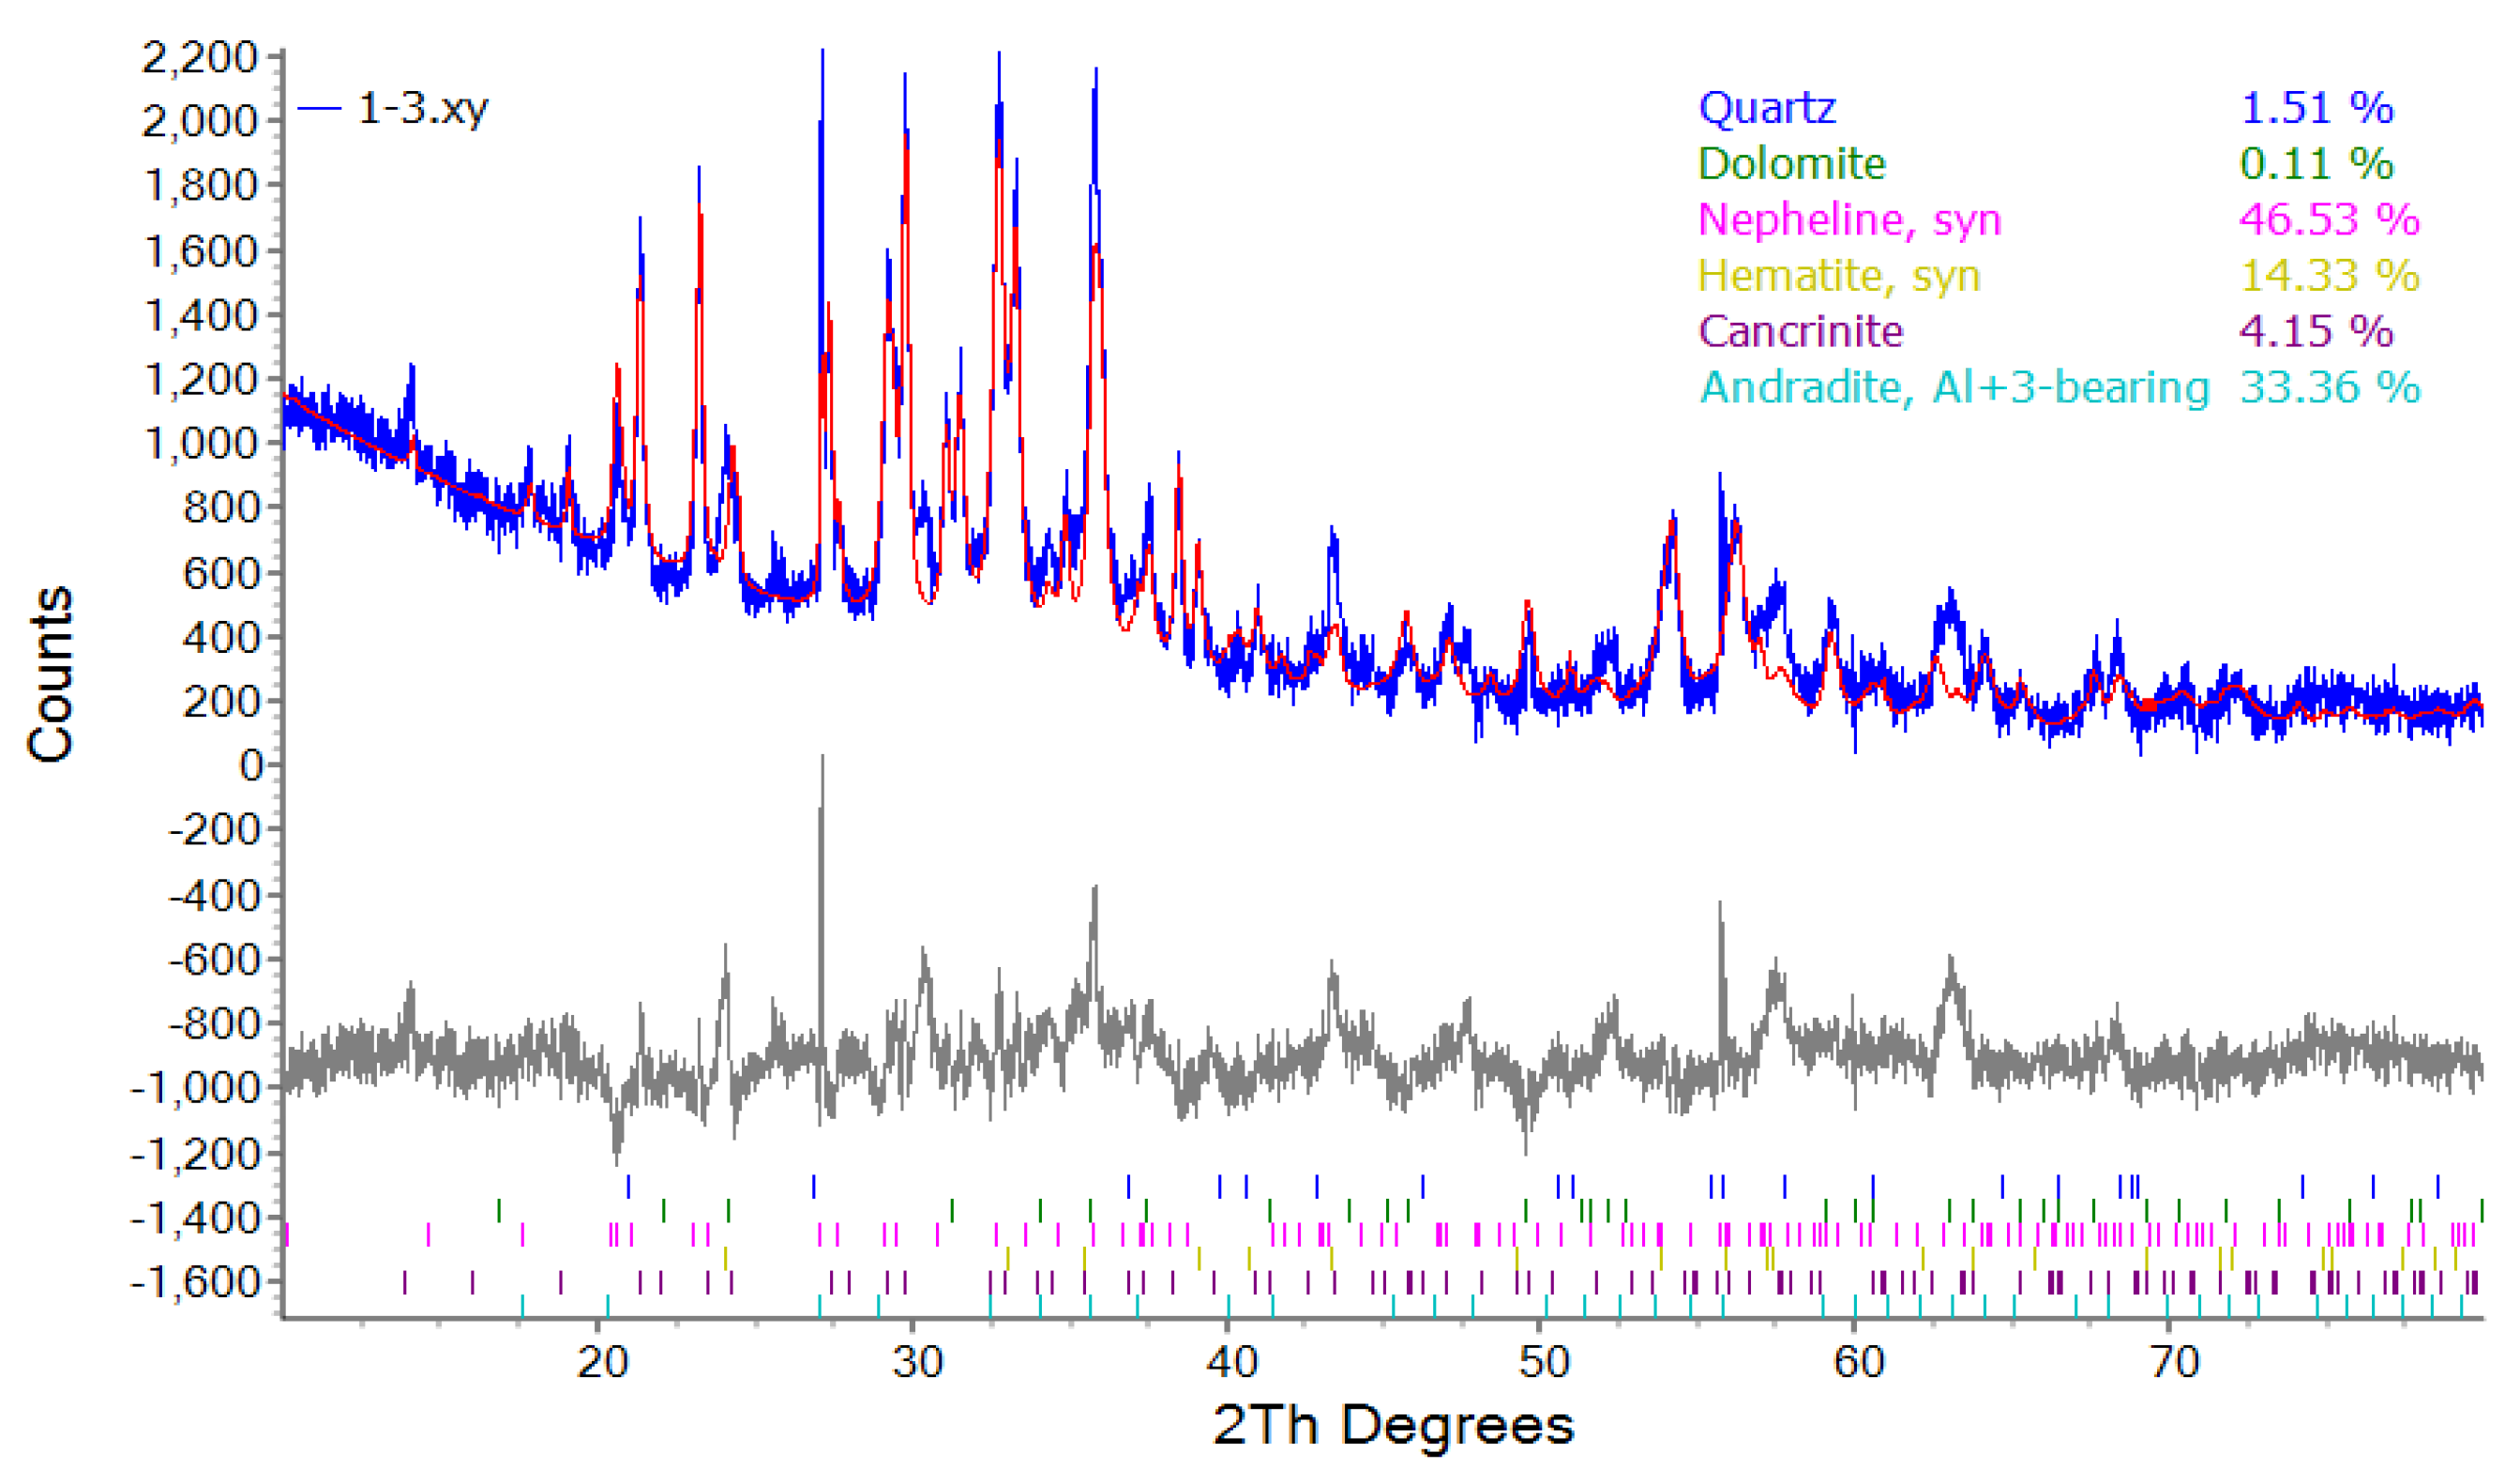
The mineral composition of activated red mud before and after adsorption was quantitatively analyzed using the Rietveld method.
Figure 1 shows the XRD results. The activated red mud contained the following minerals:
46.53%, 33.36%, 14.33%, 4.2%, 1.5%, and 0.1% of nepheline (Na7.15(Al7.2Si8.8O32)), andradite (Al0.536Ca3Fe1.656Si2.805O12), hematite (Fe2O3), cancrinite (Na7.262(CO3)0.932Al6Si6O24), quartz (SiO2), and dolomite (CaMg(CO3)2).
3.2. Optimization of the activated red mud components
The CASTEP module in Materials Studio was used for the geometry optimization of the model based on the density functional theory. Different exchange correlation functions were selected, and the convergence accuracy was set to Fine. The other parameters were set to default values.
Table 1 shows the calculation results. When the exchange correlation function is GGA-PW91, the total energy of the bulk phase is minimized and the structure is the most stable. Therefore, the PW91 gradient correction approximation under the GGA was used. The errors of lattice parameters under this condition were <5.5 %, closer to the experimental values.
3.3. Construction of desorption model for activated red mud particles
Using the amorphous cell module in the Materials studio 8.0 software, a density of 1.5 g/cm3 was selected to simulate the mass composition of activated red mud. The composition of each components was optimized as Na7.15(Al7.2Si8.8O32):Al0.536Ca3Fe1.656Si2.805O12:Fe2O3: (Na7.54(CO3))
(Si
6Al
6O
24)(H
2O)
1.5:SiO
2:CaMg(CO
3)
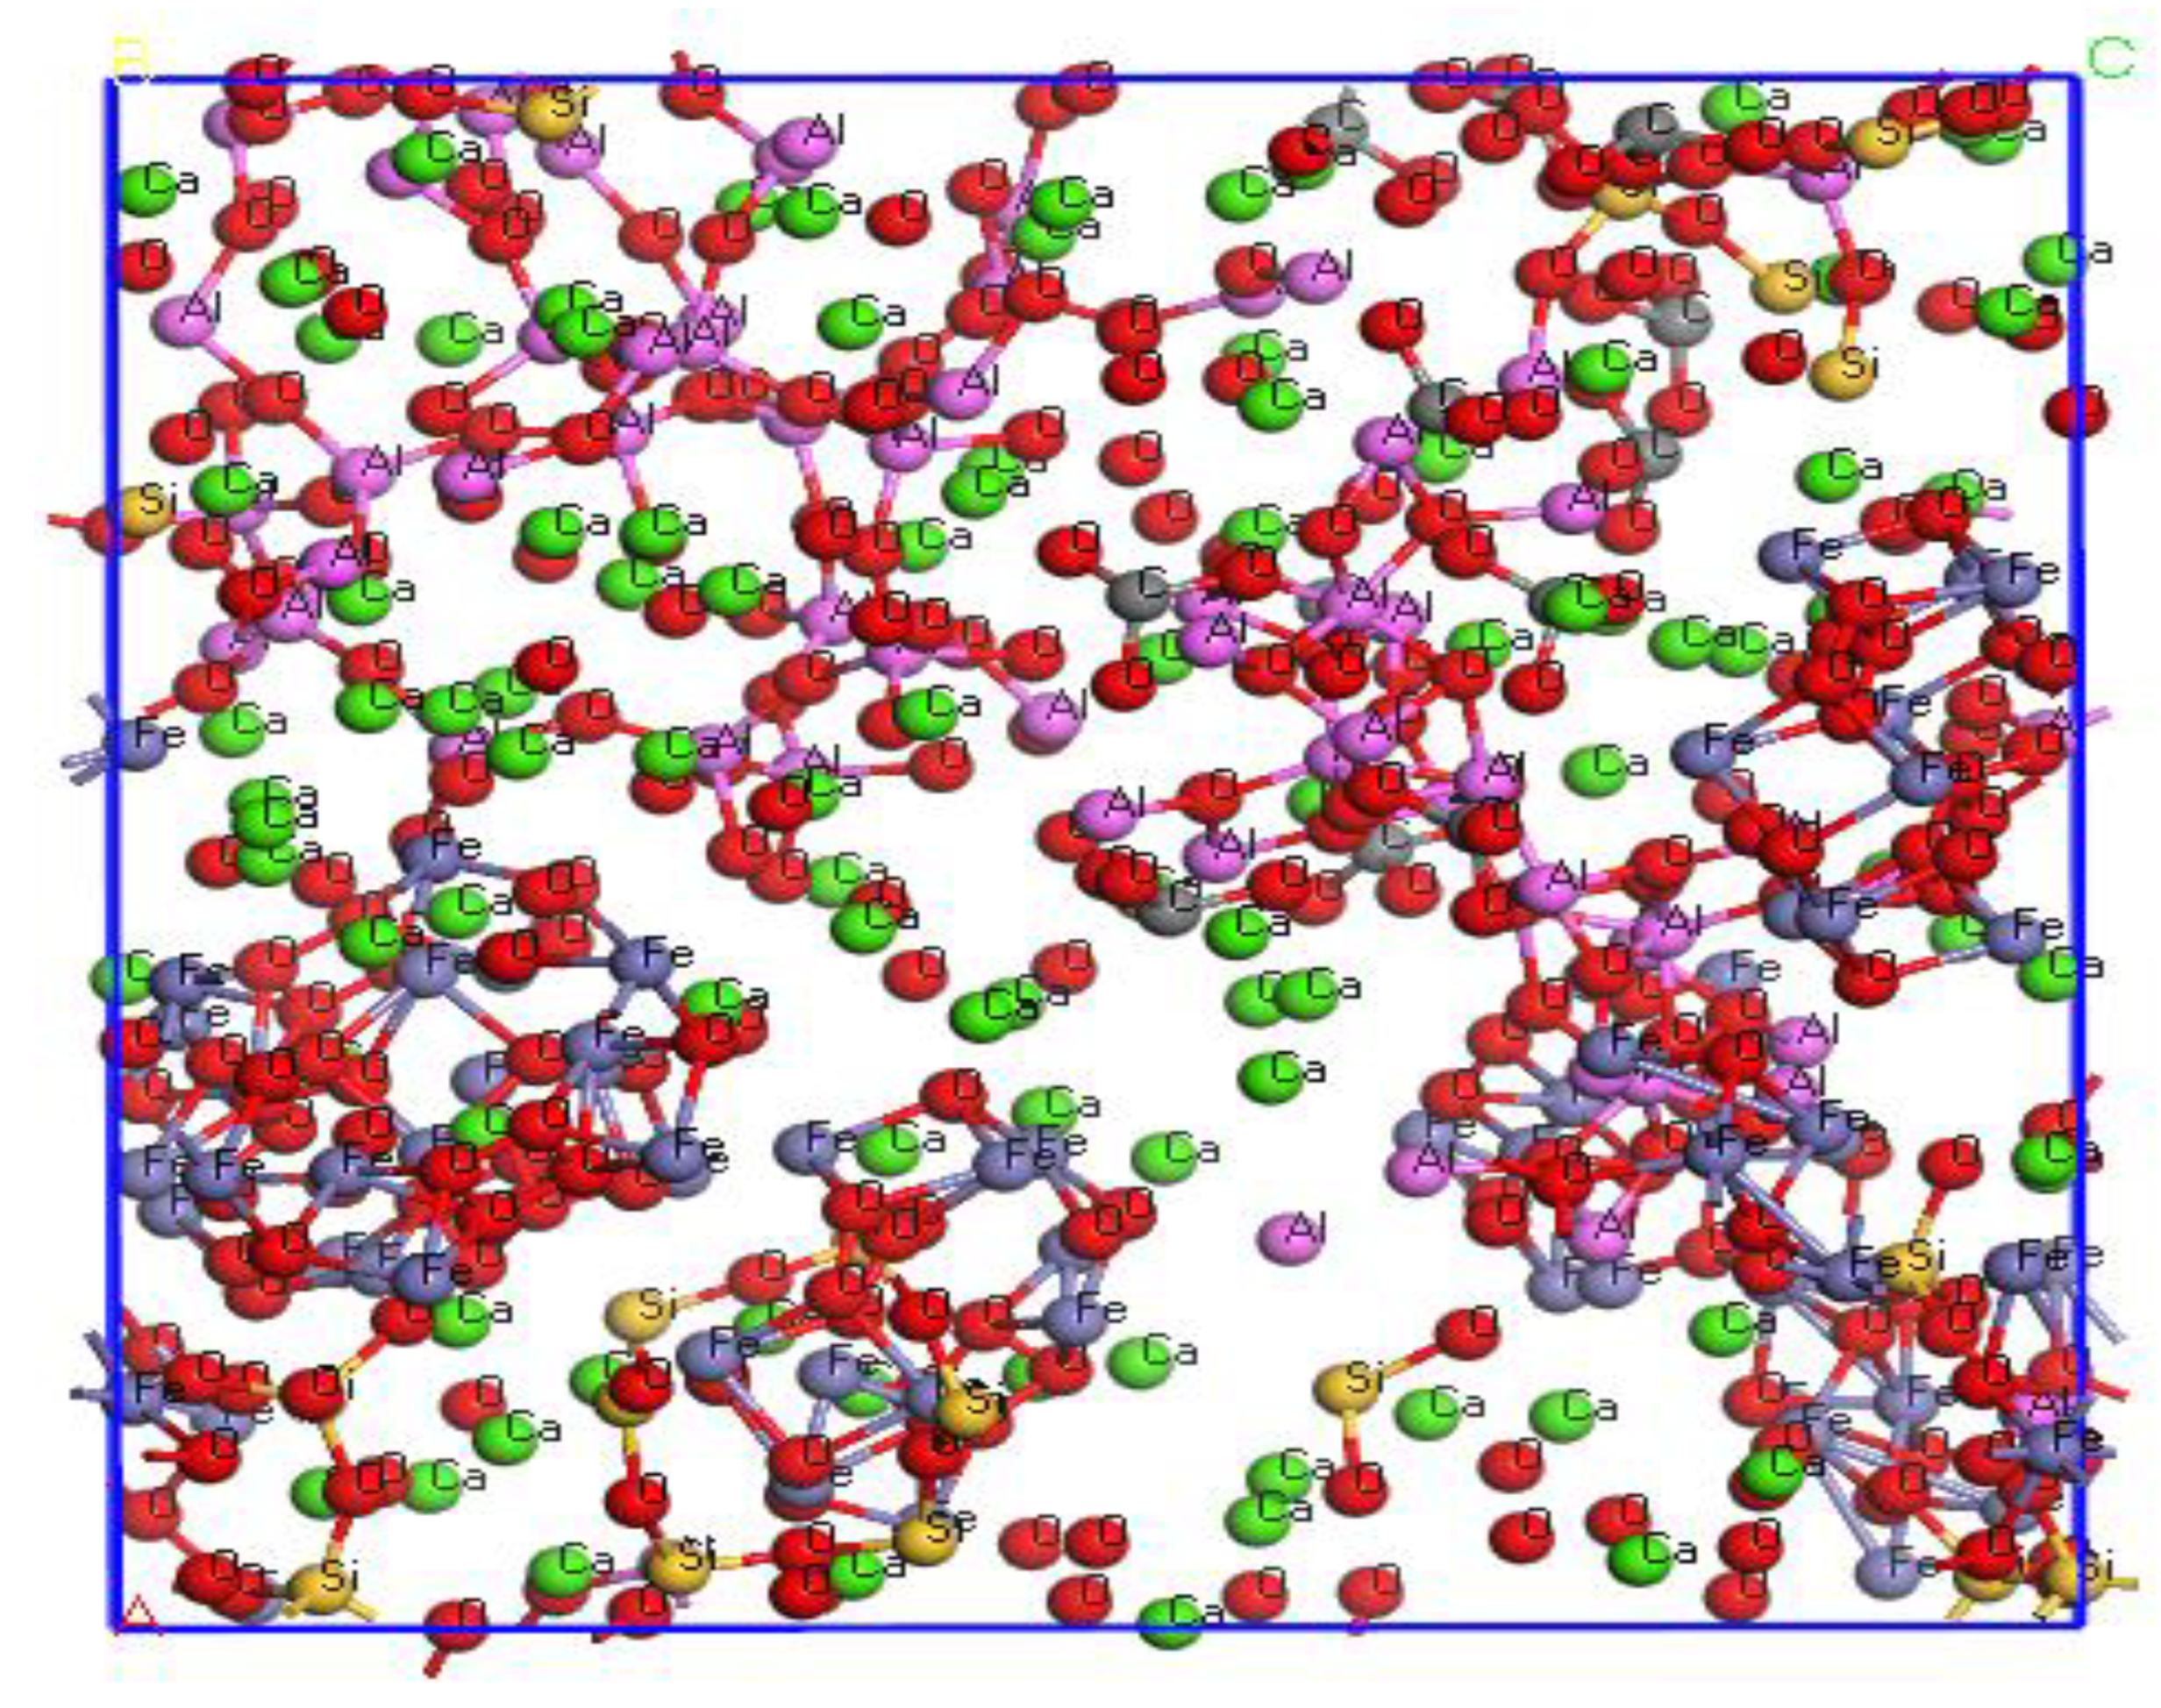
2(W/%) = 46.53%:33.36%:14.33%:4.15%:1.51%:0.11% of the periodically repeating unit cell in the 52.1 Å 52.1 Å 52.1 Å periodic box. As the hybrid system contained a large number of component structures, including covalent and proximate molecules, polymers, and and crystals, the universal force field was chosen for optimization(
Figure 2)[
19],the H
2PO
4-,HCl and H
2O structure were showed in
Figure 3.
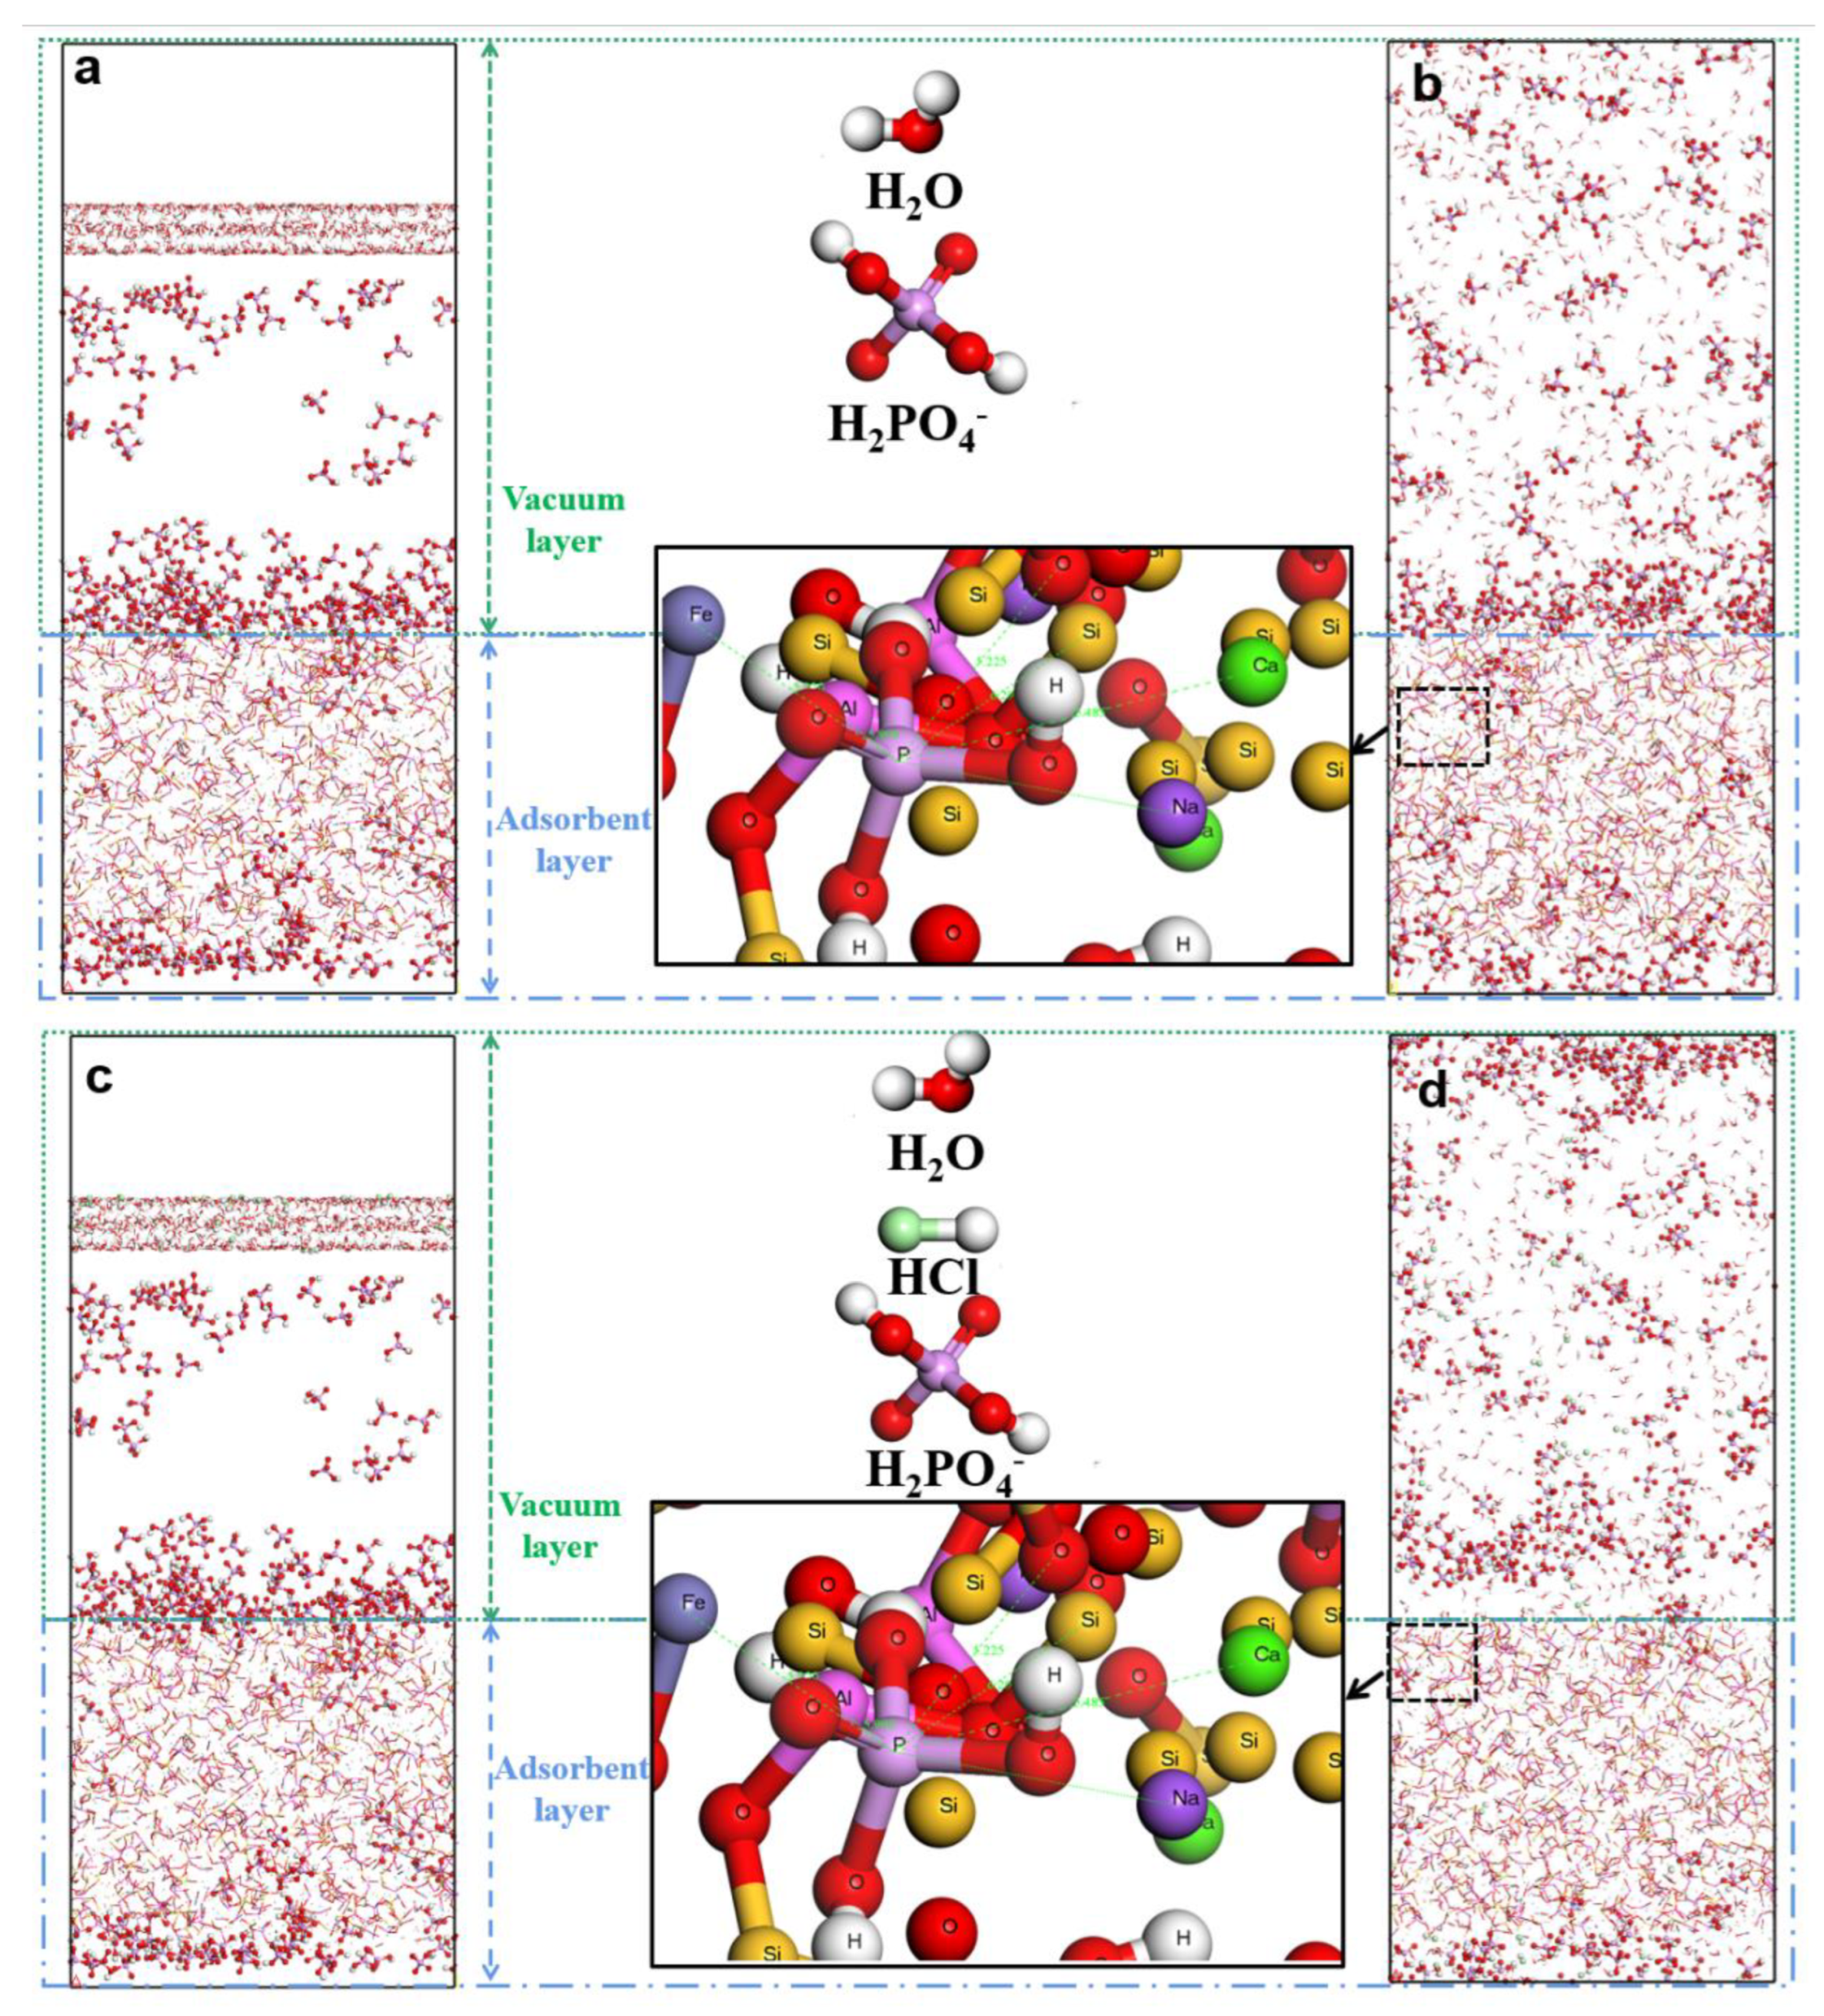
To analyze the surface of red mud containing H
2PO
4−, a layered interfacial supramolecular adsorption system modeled was Showed in
Figure 4. Phosphoric acid is a ternary acid with four forms of existence in aqueous solution, and the pH of the waste solution was 4. At pH 2.12–7.20, phosphorus in the solution mainly exists as H
2PO
4−. A cell containing 180 H
2PO
4− molecules and 1000 water media is placed on the red mud surface, and a 4-nm-thick vacuum layer was established on the model to eliminate the effect of periodic boundaries. The atoms in the red mud supercell were frozen during dynamic simulation to avoid interference with the simulation results. The steepest-descent method was used for geometry optimization under the Forcite module. The steepest-descent method was used to optimize the system structure, and molecular dynamics relaxation was performed for 10 ns under the NVT regular system. Then, the results were analyzed. Subsequently, H
2PO
4− molecules were adsorbed on the red mud surface, and a solution layer containing 10 hydrochloric acid molecules and 1000 water molecules was constructed to be placed on the surface after adsorption. For comparison, an aqueous layer containing 1000 water molecules without hydrochloric acid molecules was constructed to be placed on the surface after the adsorption of phosphorus by the adsorbent. To eliminate the effect of periodic boundaries, a 2-mm-thick vacuum layer was added in the direction perpendicular to the red mud surface. Geometry optimization was performed using the Forcite module, and the system structure was optimized using the steepest-descent method. Then, molecular dynamics relaxation was performed under the NVT regular system for 10 ns, and the results were analyzed. The first 9 ns were used for system equilibrium, and 1 ns was used for analyzing the results.
3.4. Analysis of concentration distribution of phosphorus before and after desorption of desorbent
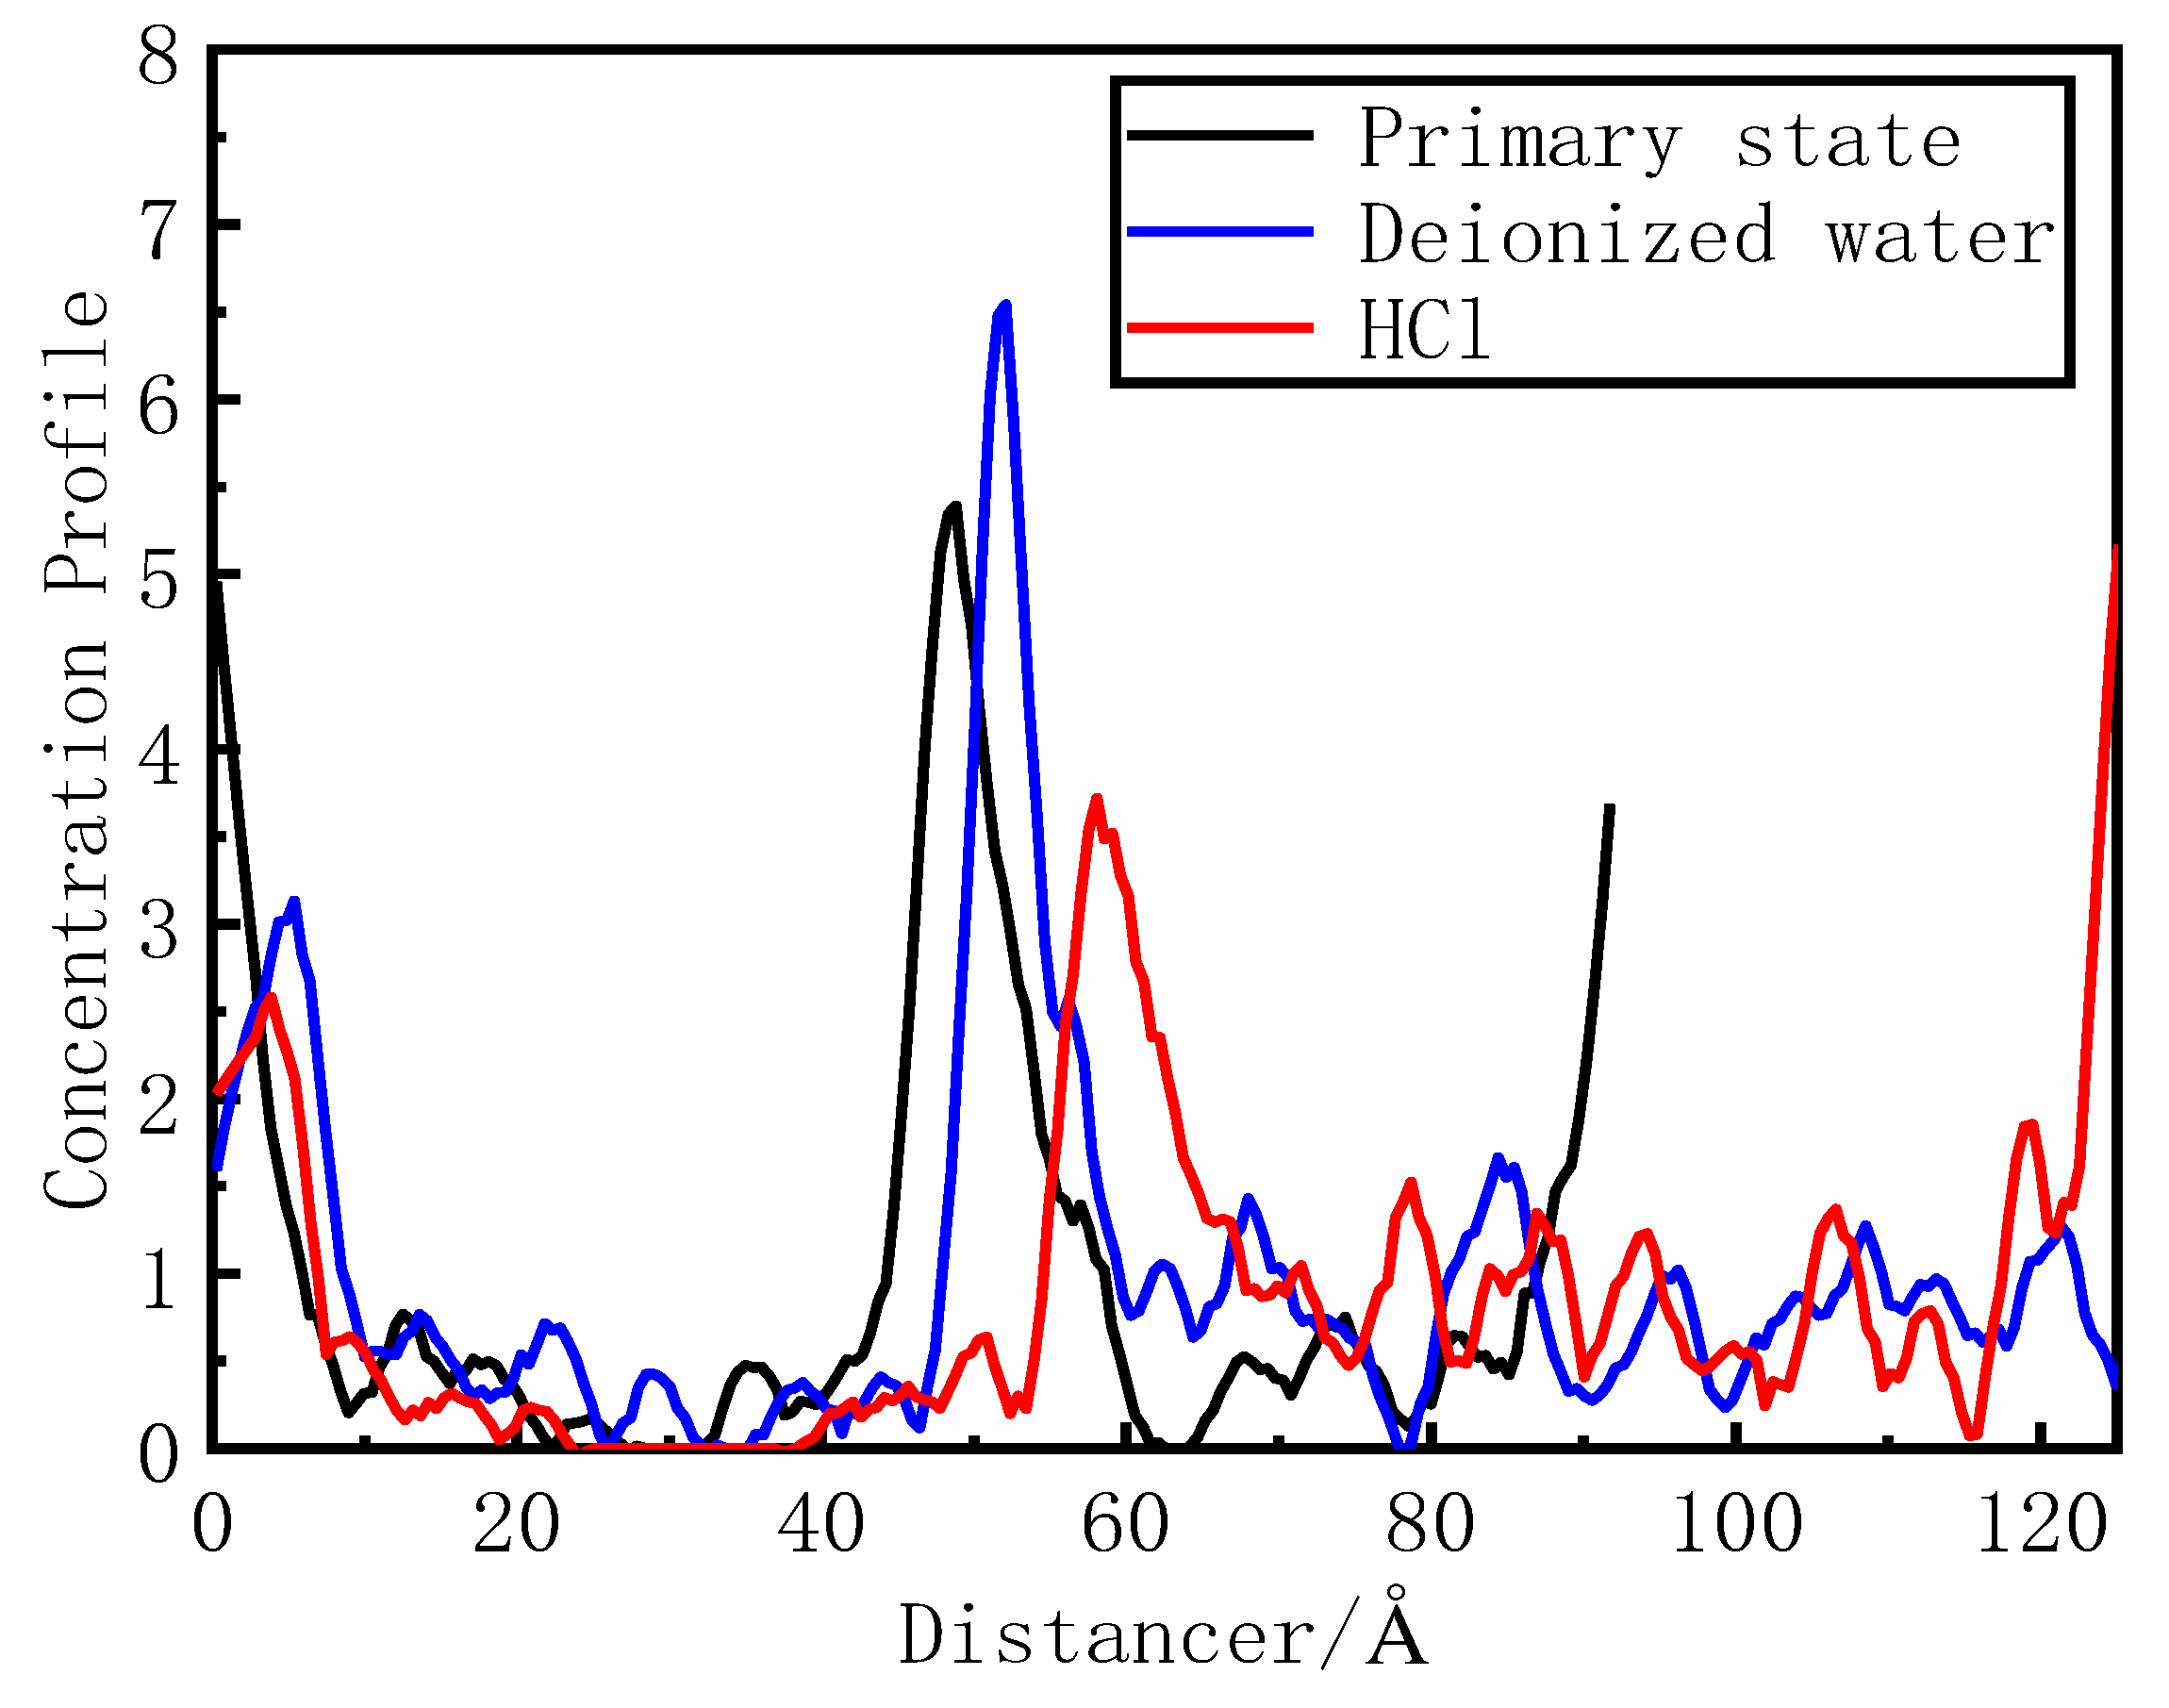
Figure 4 shows the phosphorus concentration in the deionized water and hydrochloric acid. The concentrations of phosphorus in its primary state, deionized water system, and hydrochloric acid system are 4.8, 5.2, and 5.8 nm and 7.8–12 nm. The relative concentration at the peak wave is >1 for five distributions. The desorption effect of the deionized water is general. Hydrochloric acid completely removed phosphorus from the red mud surface, and its peak is >1. Thus, hydrochloric acid accelerates the desorption of phosphorus on the activated red mud particle surface.
Figure 4.
Distribution of phosphorus concentration before and after phosphorus desorption using desorbents.
Figure 4.
Distribution of phosphorus concentration before and after phosphorus desorption using desorbents.
3.5. Interaction energy analysis of phosphorus desorption by desorbents
The interaction energy of the two desorption agents after desorption of phosphorus is shown in
Table 2, the interaction energy of the deionised water system (-427.31 kJ/mol) is significantly better than that of the Hydrochloric acid desorption agent system (-416.74 kJ/mol), and the binding energy of the deionised water system is larger than that of the Hydrochloric acid desorption agent system, which shows that The binding energy of the deionised water system was larger than that of the Hydrochloric acid desorbent system, indicating that the Hydrochloric acid desorbent played a certain desorption effect, and the stability of the system became worse.
3.6. Analysis of radial distribution function of phosphorus desorbed by desorbents
Figure 5 shows the RDFs between the active metals, namely Ca, Al, Fe, and O in activated red mud and O in H
2PO
4− after desorption.
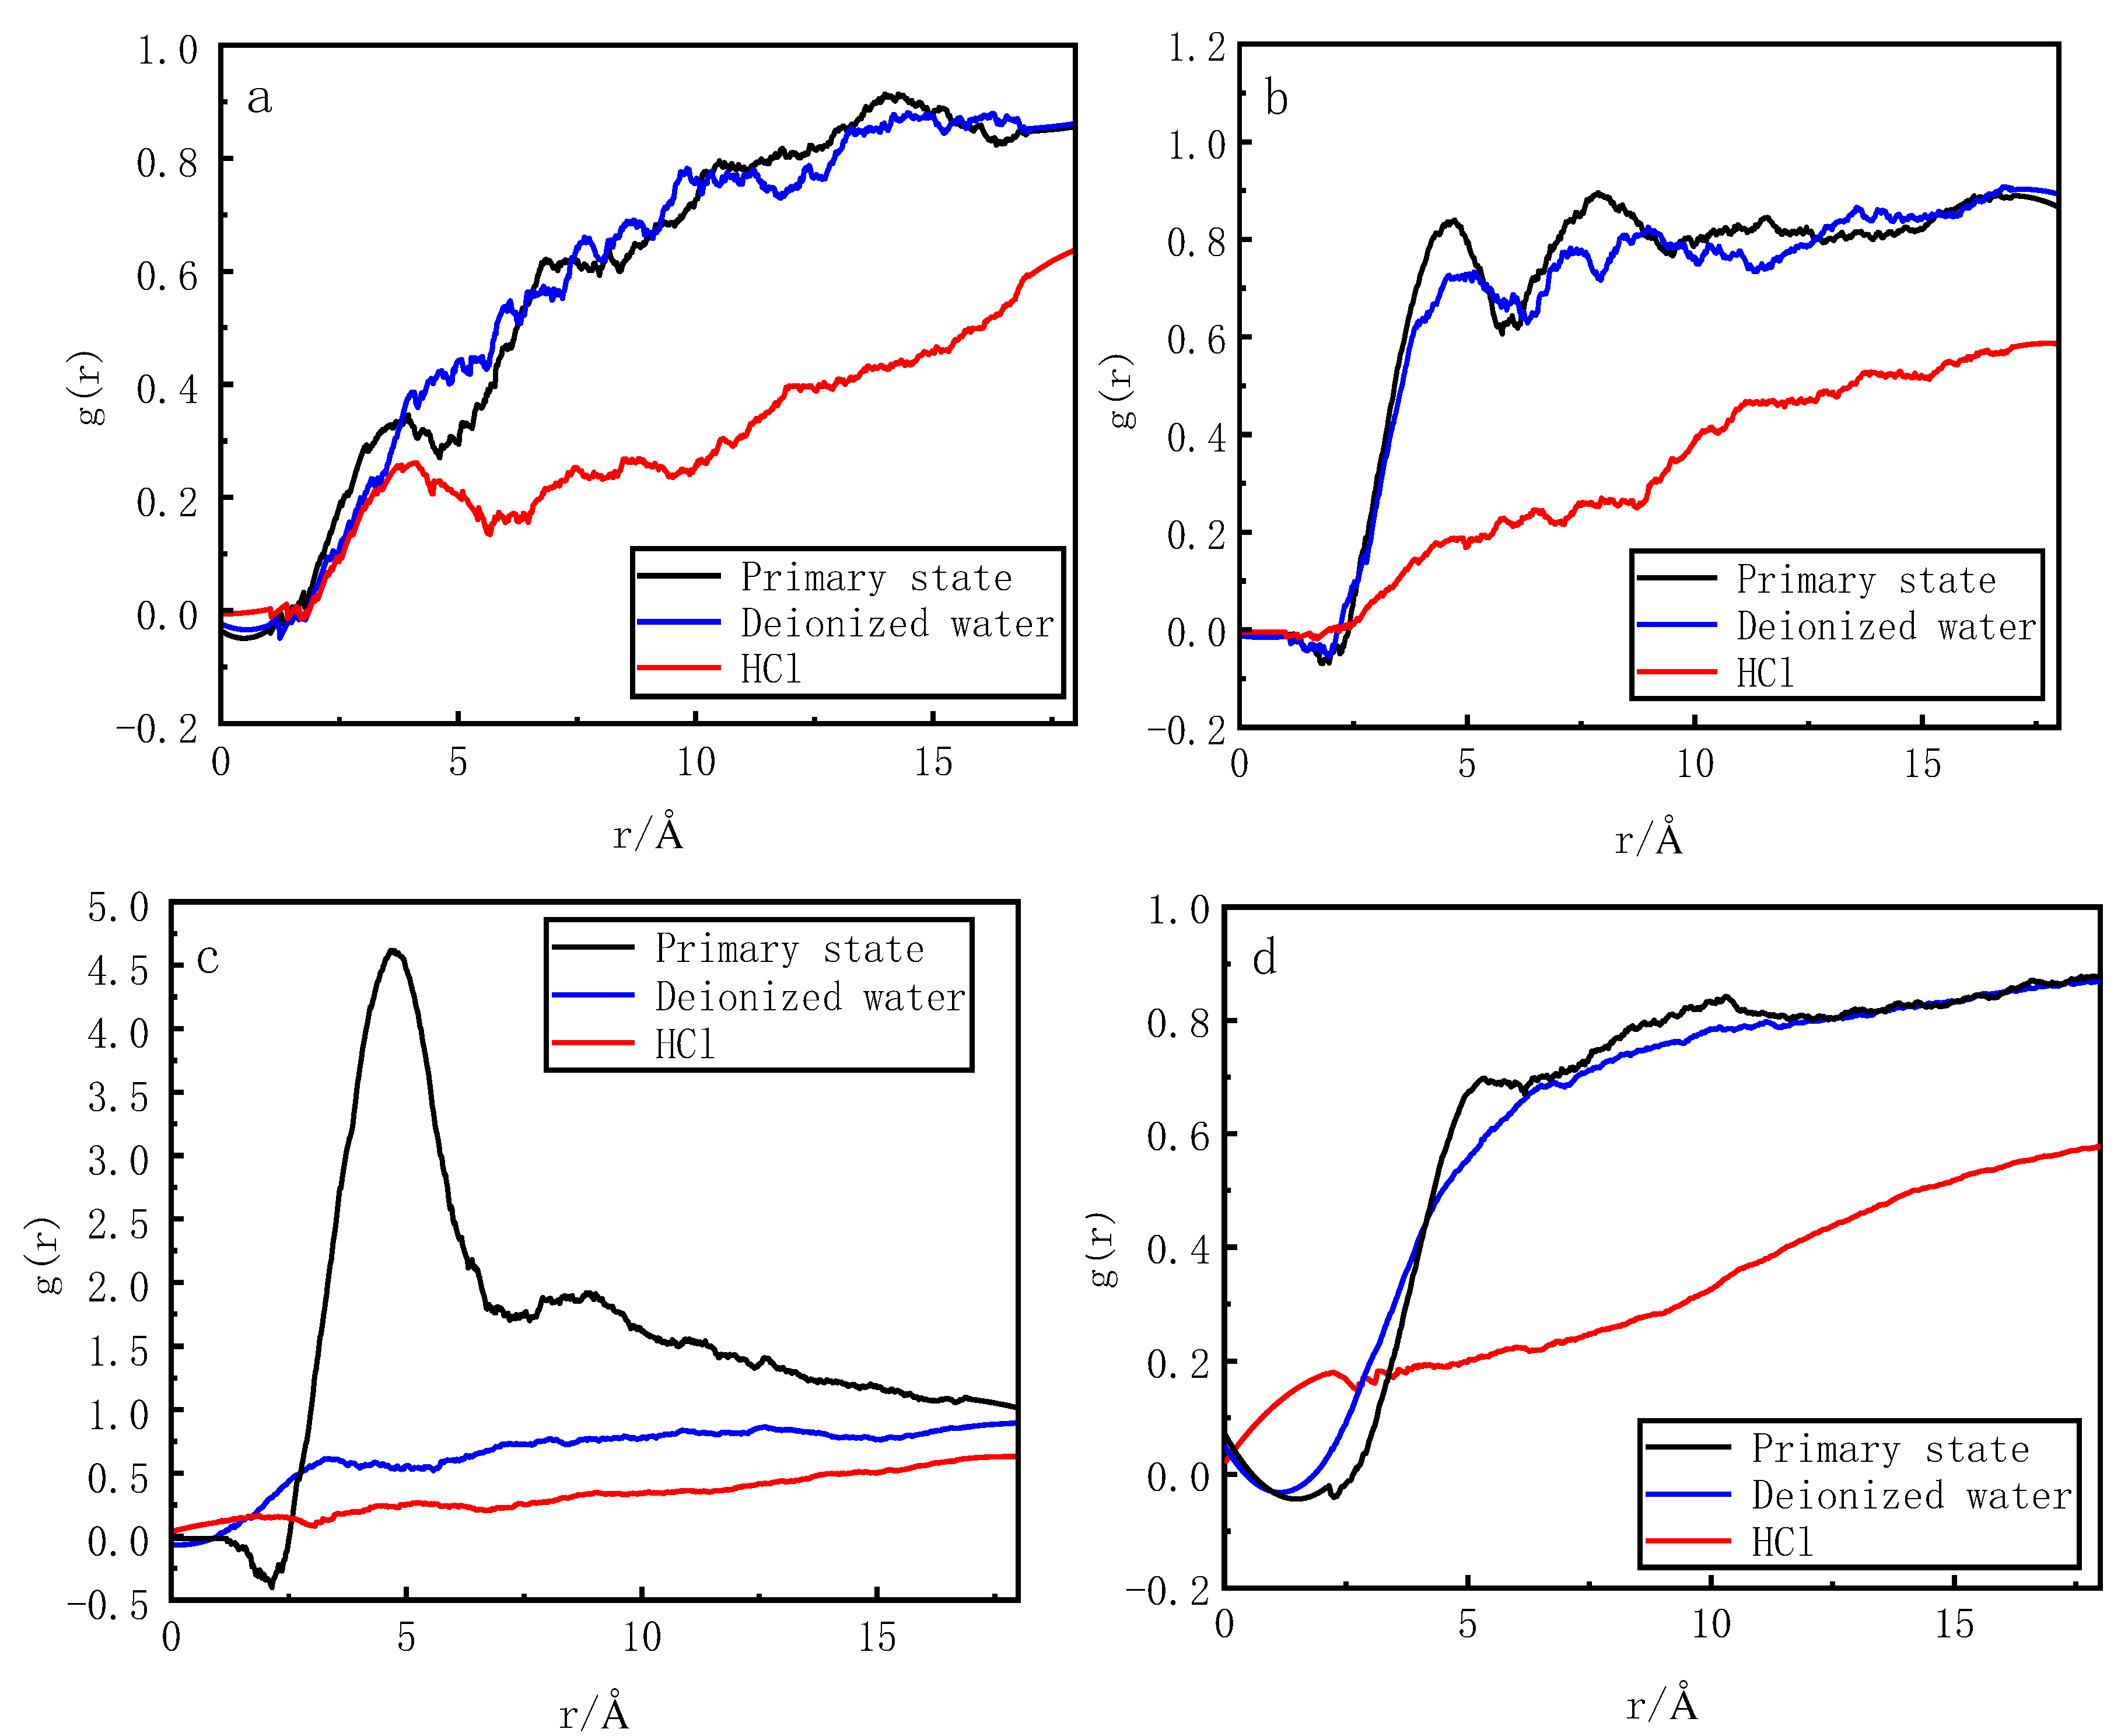
In the deionized water desorption system, O from H2PO4− and Al, Ca, and O from the activated red mud appeared at a distance of 0–3.5 Å interval of the g (r) values. Fe is in the range of 0–5 Å. The maximum g (r) peak of Ca is 0.35 in the initial state and 0.44 at 5 Å. The r-backward shift of g (r) peak increases, and the maximum g(r) peak of Al decreases from 0.85 at 4.73 Å in the initial state to 0.73 at 4.16 Å, with a decrease in the r-forward shifted g(r) peak. The g(r) peak of Fe decreases from 4.64 at 4.71 Å to 0.62 at 3.39 Å, with a more pronounced decrease in the r-forward shifted g(r) peak. The g(r) peak of O decreases from 0.67 at 5 Å to 0.55, with a decrease in the r-invariant g(r) peak. In the hydrochloric acid desorption system, O from H2PO4− and Al, Ca, and O atoms from the activated red mud undergo phase separation in the 0–3.5 Å interval of the g (r) value. In the 0–5 Å interval, the maximum g (r) peak of Ca is 0.35 at 3.95 Å in the initial state and 0.26 at 4.13 Å, indicating a decrease in the r-backward shift of the g (r) peak. The maximum g(r) peak of Al decreases from 0.85 at 4.73 Å in the initial state to 0.19 at 4.81 Å, indicating a decrease in the r-forward shift of g(r) peak. The g(r) peak of Fe decreases from 4.64 at 4.71 Å to 0.26 at 4.53 Å, indicating a decrease in the r-forward shift of g(r) peak. The g(r) peak of O decreases from 0.67 at 5 Å to 0.2 at 5 Å, with a more pronounced decrease in the r-invariant g(r) peak.
Thus, changes in the g(r) peak in the 0–3.5 Å interval shows that the addition of hydrochloric acid destroys the ionic and hydrogen bonding between O atoms in H2PO4− and the active metal and oxygen in red mud. Contrarily, deionized water only removes Fe and slightly influences the other interatomic interactions. The change in g(r) peak and peak position in the 5 Å interval shows that the van der Waals force is considerably reduced after the addition of hydrochloric acid. This indicates that the breaking of ionic and hydrogen bonds between H2PO4− and activated red mud surface due to hydrochloric acid accelerated the desorption of phosphorus from the red mud surface.
3.7. Mean-square displacement analysis of phosphorus desorption by desorbents
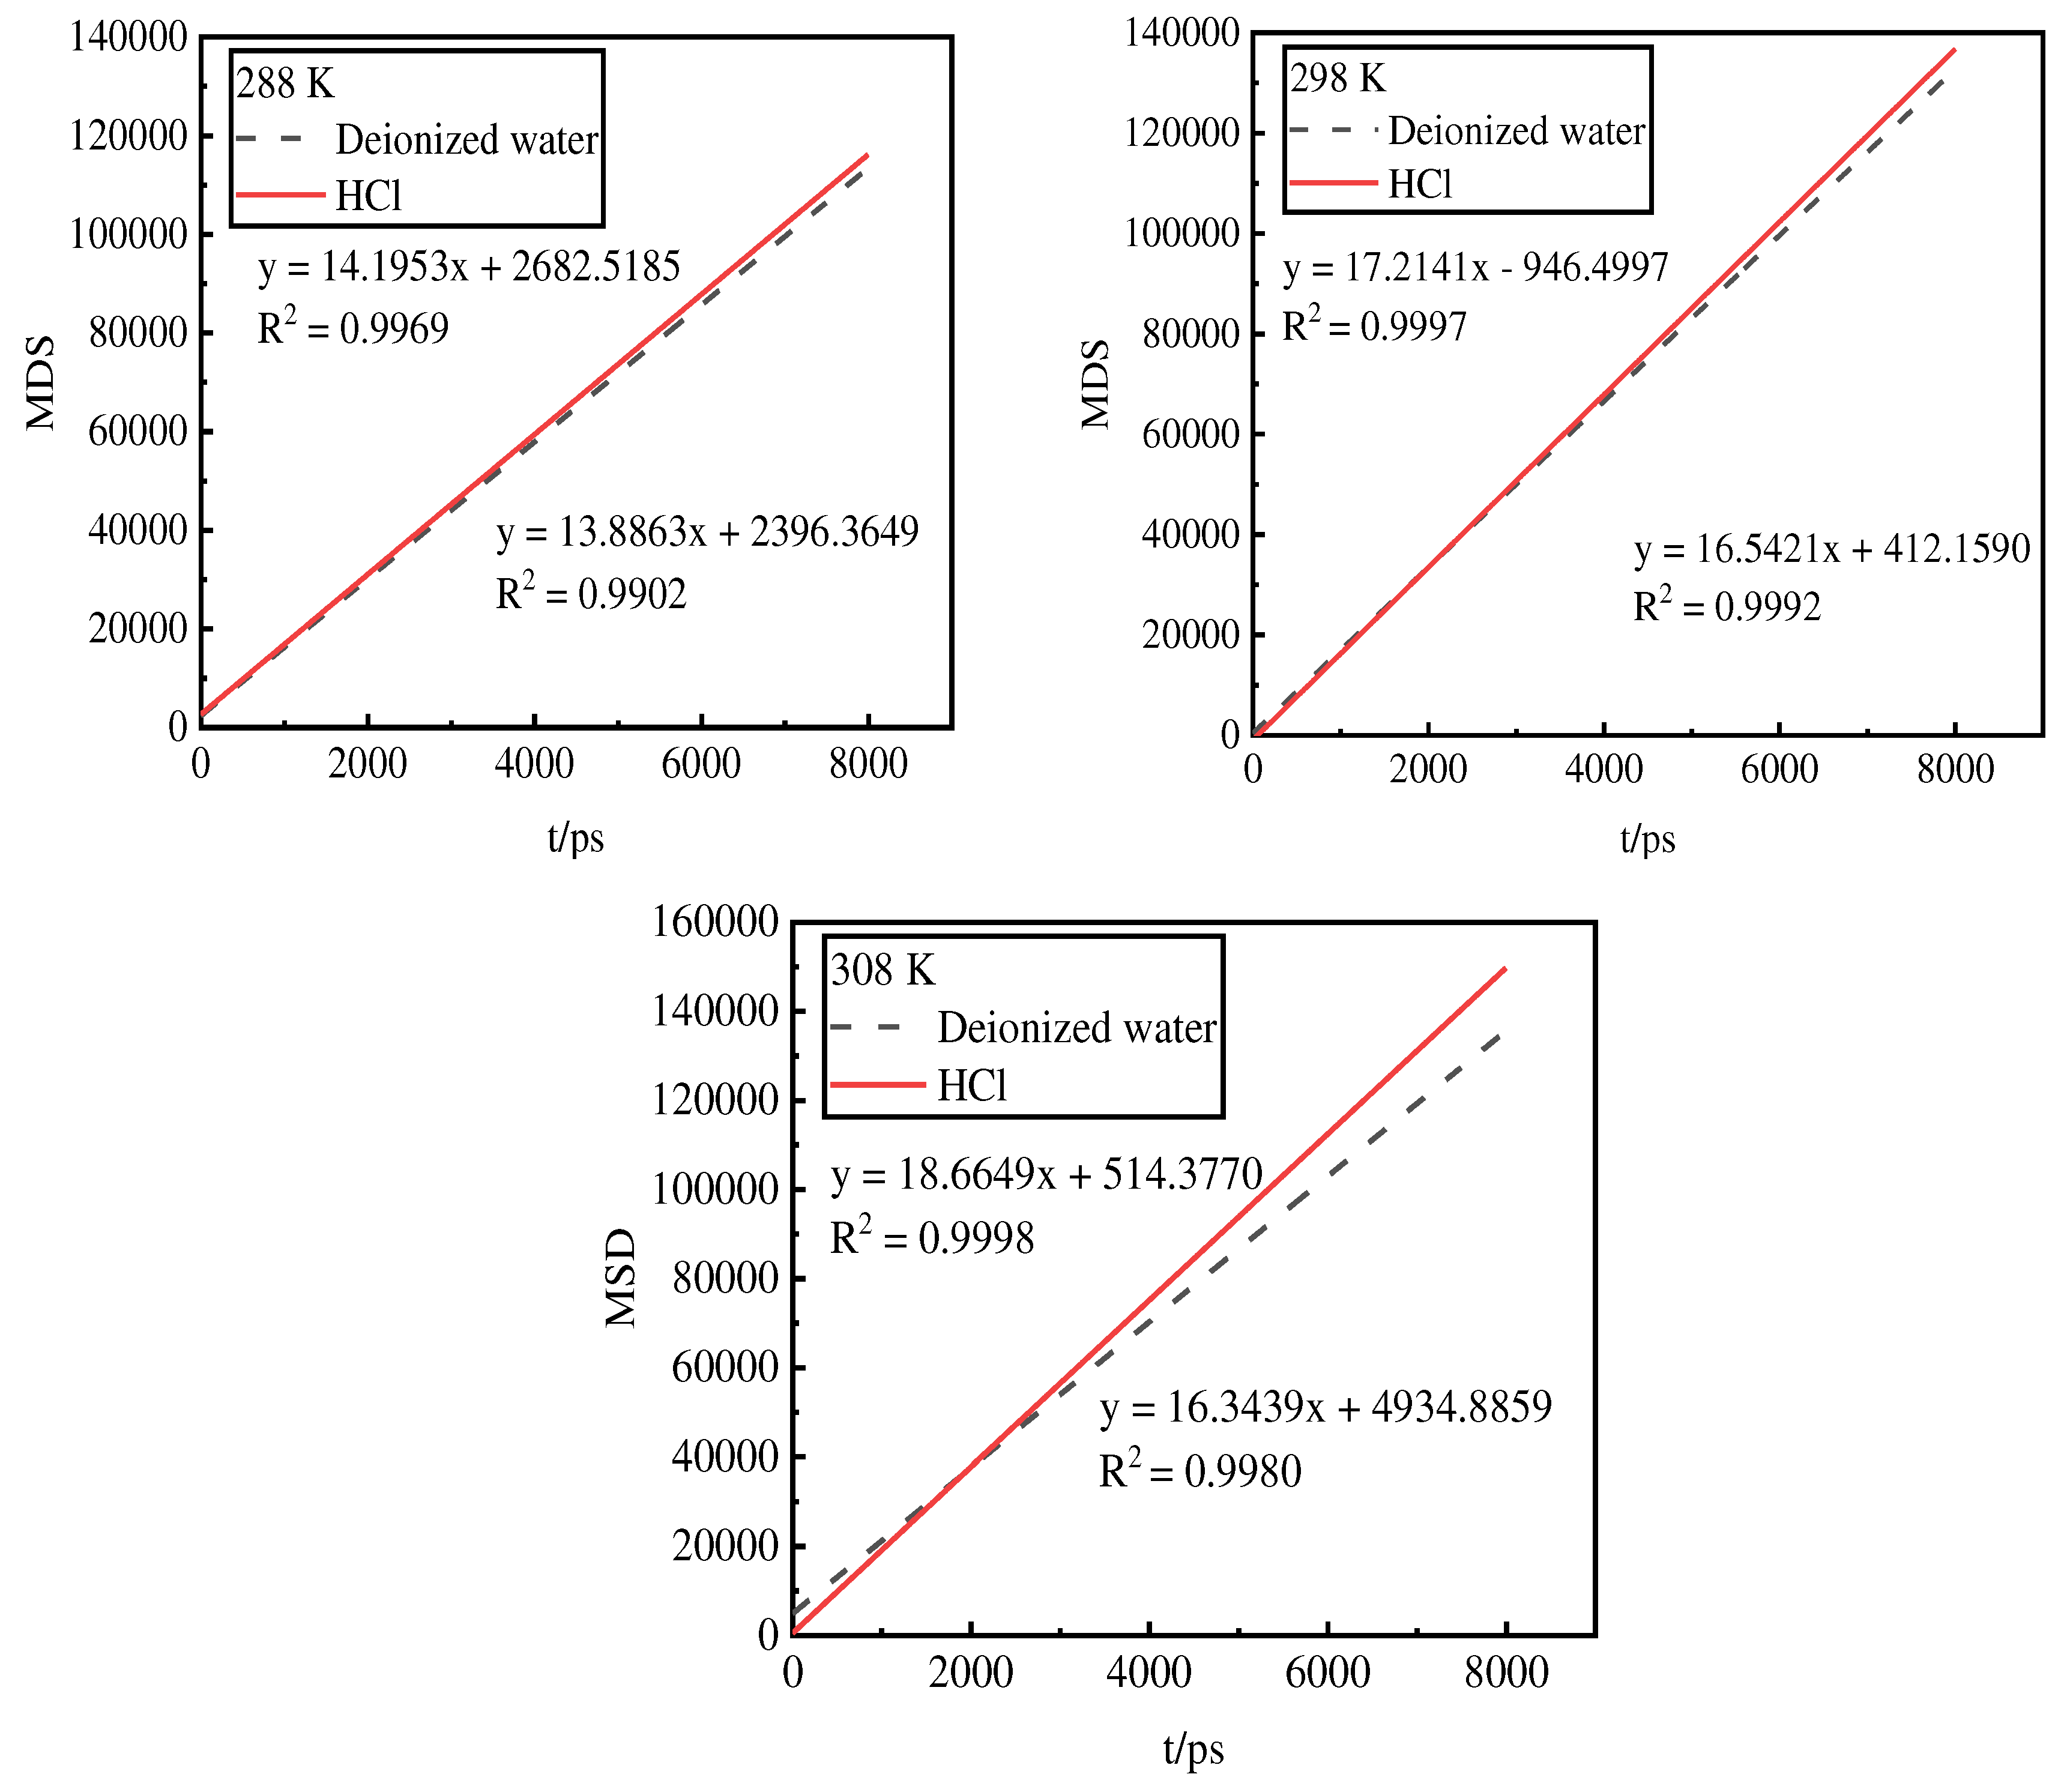
The micro-interfacial diffusion of phosphorus desorbed by the two desorbents was investigated via molecular dynamics simulation of the MSD curves of the activated red mud. The MSD curves were obtained by analyzing the trajectories of phosphorus in different simulated activated red mud samples using the analysis function in the Forcite module. The first 80% of the simulation time, i.e., 8000 ps, at 288, 298, and 308 K was used to minimize the effect of statistical errors (
Figure 6).
The MSD curve of deionized water is lower, indicating that the interaction between deionized water and phosphorus inhibits the diffusion. Moreover, the interaction energy is larger and the degree of adsorption. The MSD curve of hydrochloric acid is higher, indicating that its interaction with phosphorus promotes the diffusion. Moreover, the interaction energy is smaller and the degree of adsorption is poorer. Additionally, as the temperature increases, the MSD curve of hydrochloric acid reaches its peak, indicating a better desorption effect. Thus, the desorption of phosphorus by hydrochloric acid is a heat absorption reaction. The MSD curves of deionized water show less variation from 298 to 308 K, indicating that the desorption has reached equilibrium.
3.8. Diffusion coefficient analysis of phosphorus desorption by desorbents
MSD was used to calculate the diffusion coefficient of phosphorus in activated red mud and quantify the diffusion behavior of each component on the aggregate surface. As shown in
Table 3, the diffusion coefficient of hydrochloric acid is greater than that of deionized water. Moreover, the higher the temperature, the greater the diffusion coefficient and desorption capacity of the desorbent.
3.9. Monte Carlo simulation of phosphorus desorption by desorbents
3.9.1. Desorption isotherms
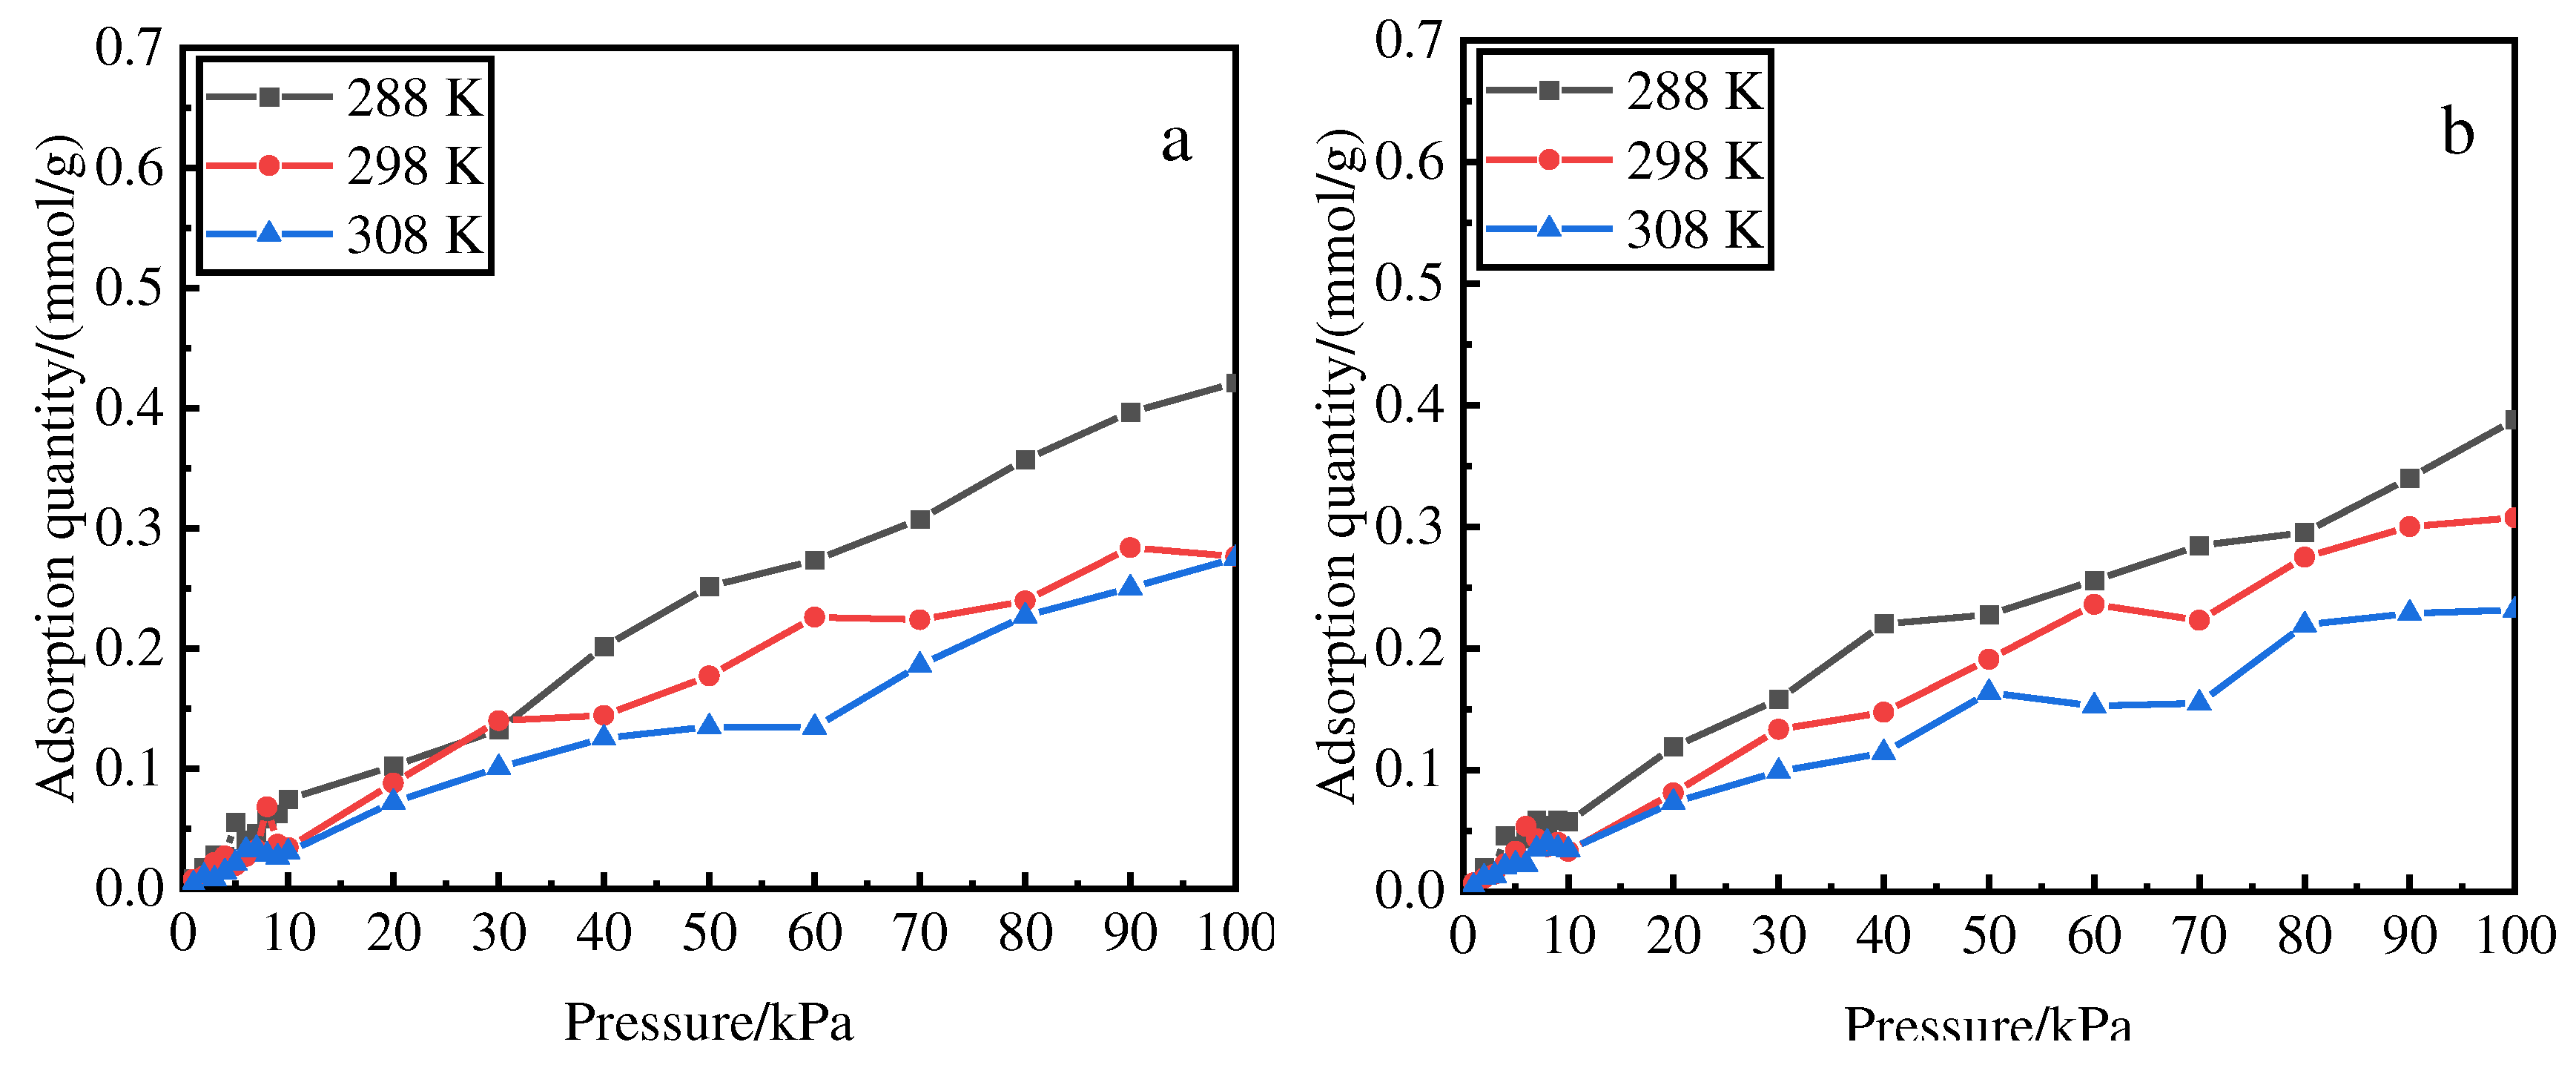
Figure 7 shows the desorption isotherms of deionized water and hydrochloric acid after desorption from 1 to 100 kPa at 288, 298, and 308 K. The adsorption amount at 1–10 kPa increased with pressure and that at 1–50 kPa increased linearly with temperature, which was favorable for desorption. The desorption amount of deionized water stabilized at 50–60 kPa and 308 K and that of hydrochloric acid stabilized at 50–70 kPa and 308 K. The increase in adsorption amount with pressure for hydrochloric acid is flat compared with that for deionized water. This indicates that hydrochloric acid has better adsorption effect than deionized water; moreover, temperature has a greater influence on the adsorption.
3.9.2. Heat of adsorption after desorption of phosphorus
The effect of different desorbents on the adsorption amount at various pressures and temperatures on the heat of adsorption can be determined from
Table 4. The heat of adsorption is lower for hydrochloric acid than that for deionized water, indicating that the former has a better desorption effect. The heat of adsorption considerably decreases with an increase in temperature. These results agree well with the results of the thermodynamics of desorption that temperature majorly influences the heat of adsorption than pressure.
3.9.3. Adsorption sites after phosphorus desorption
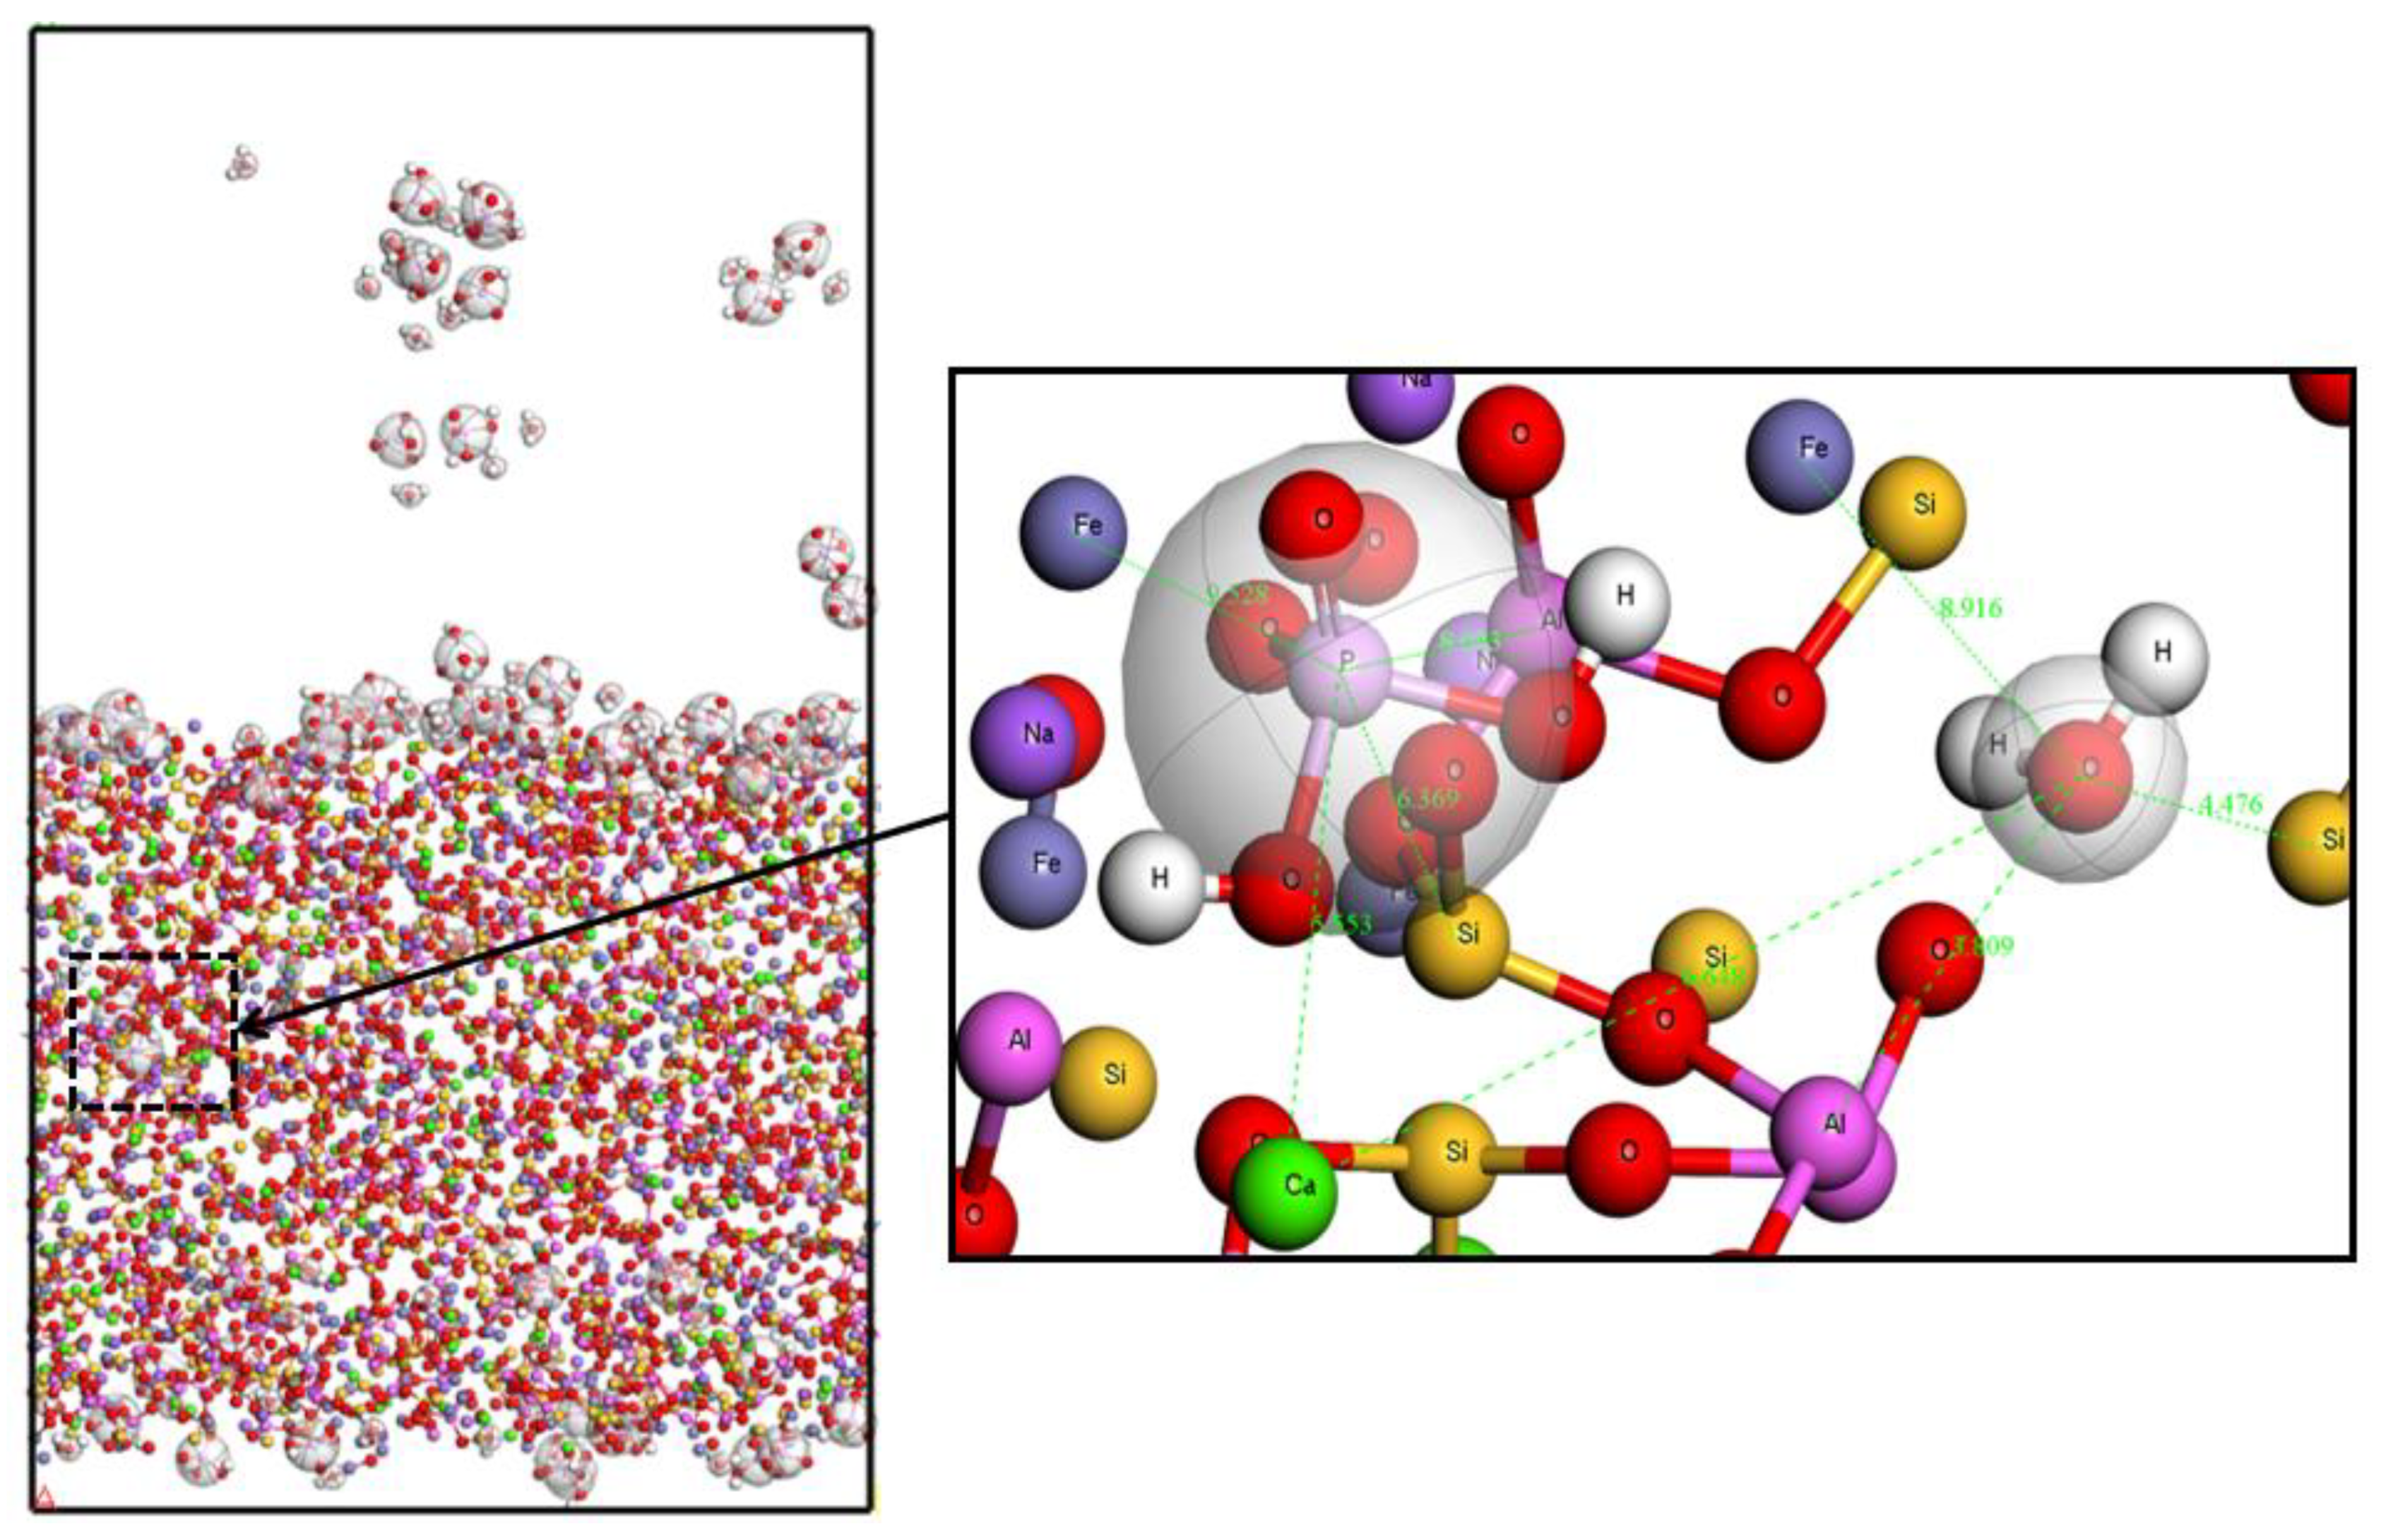
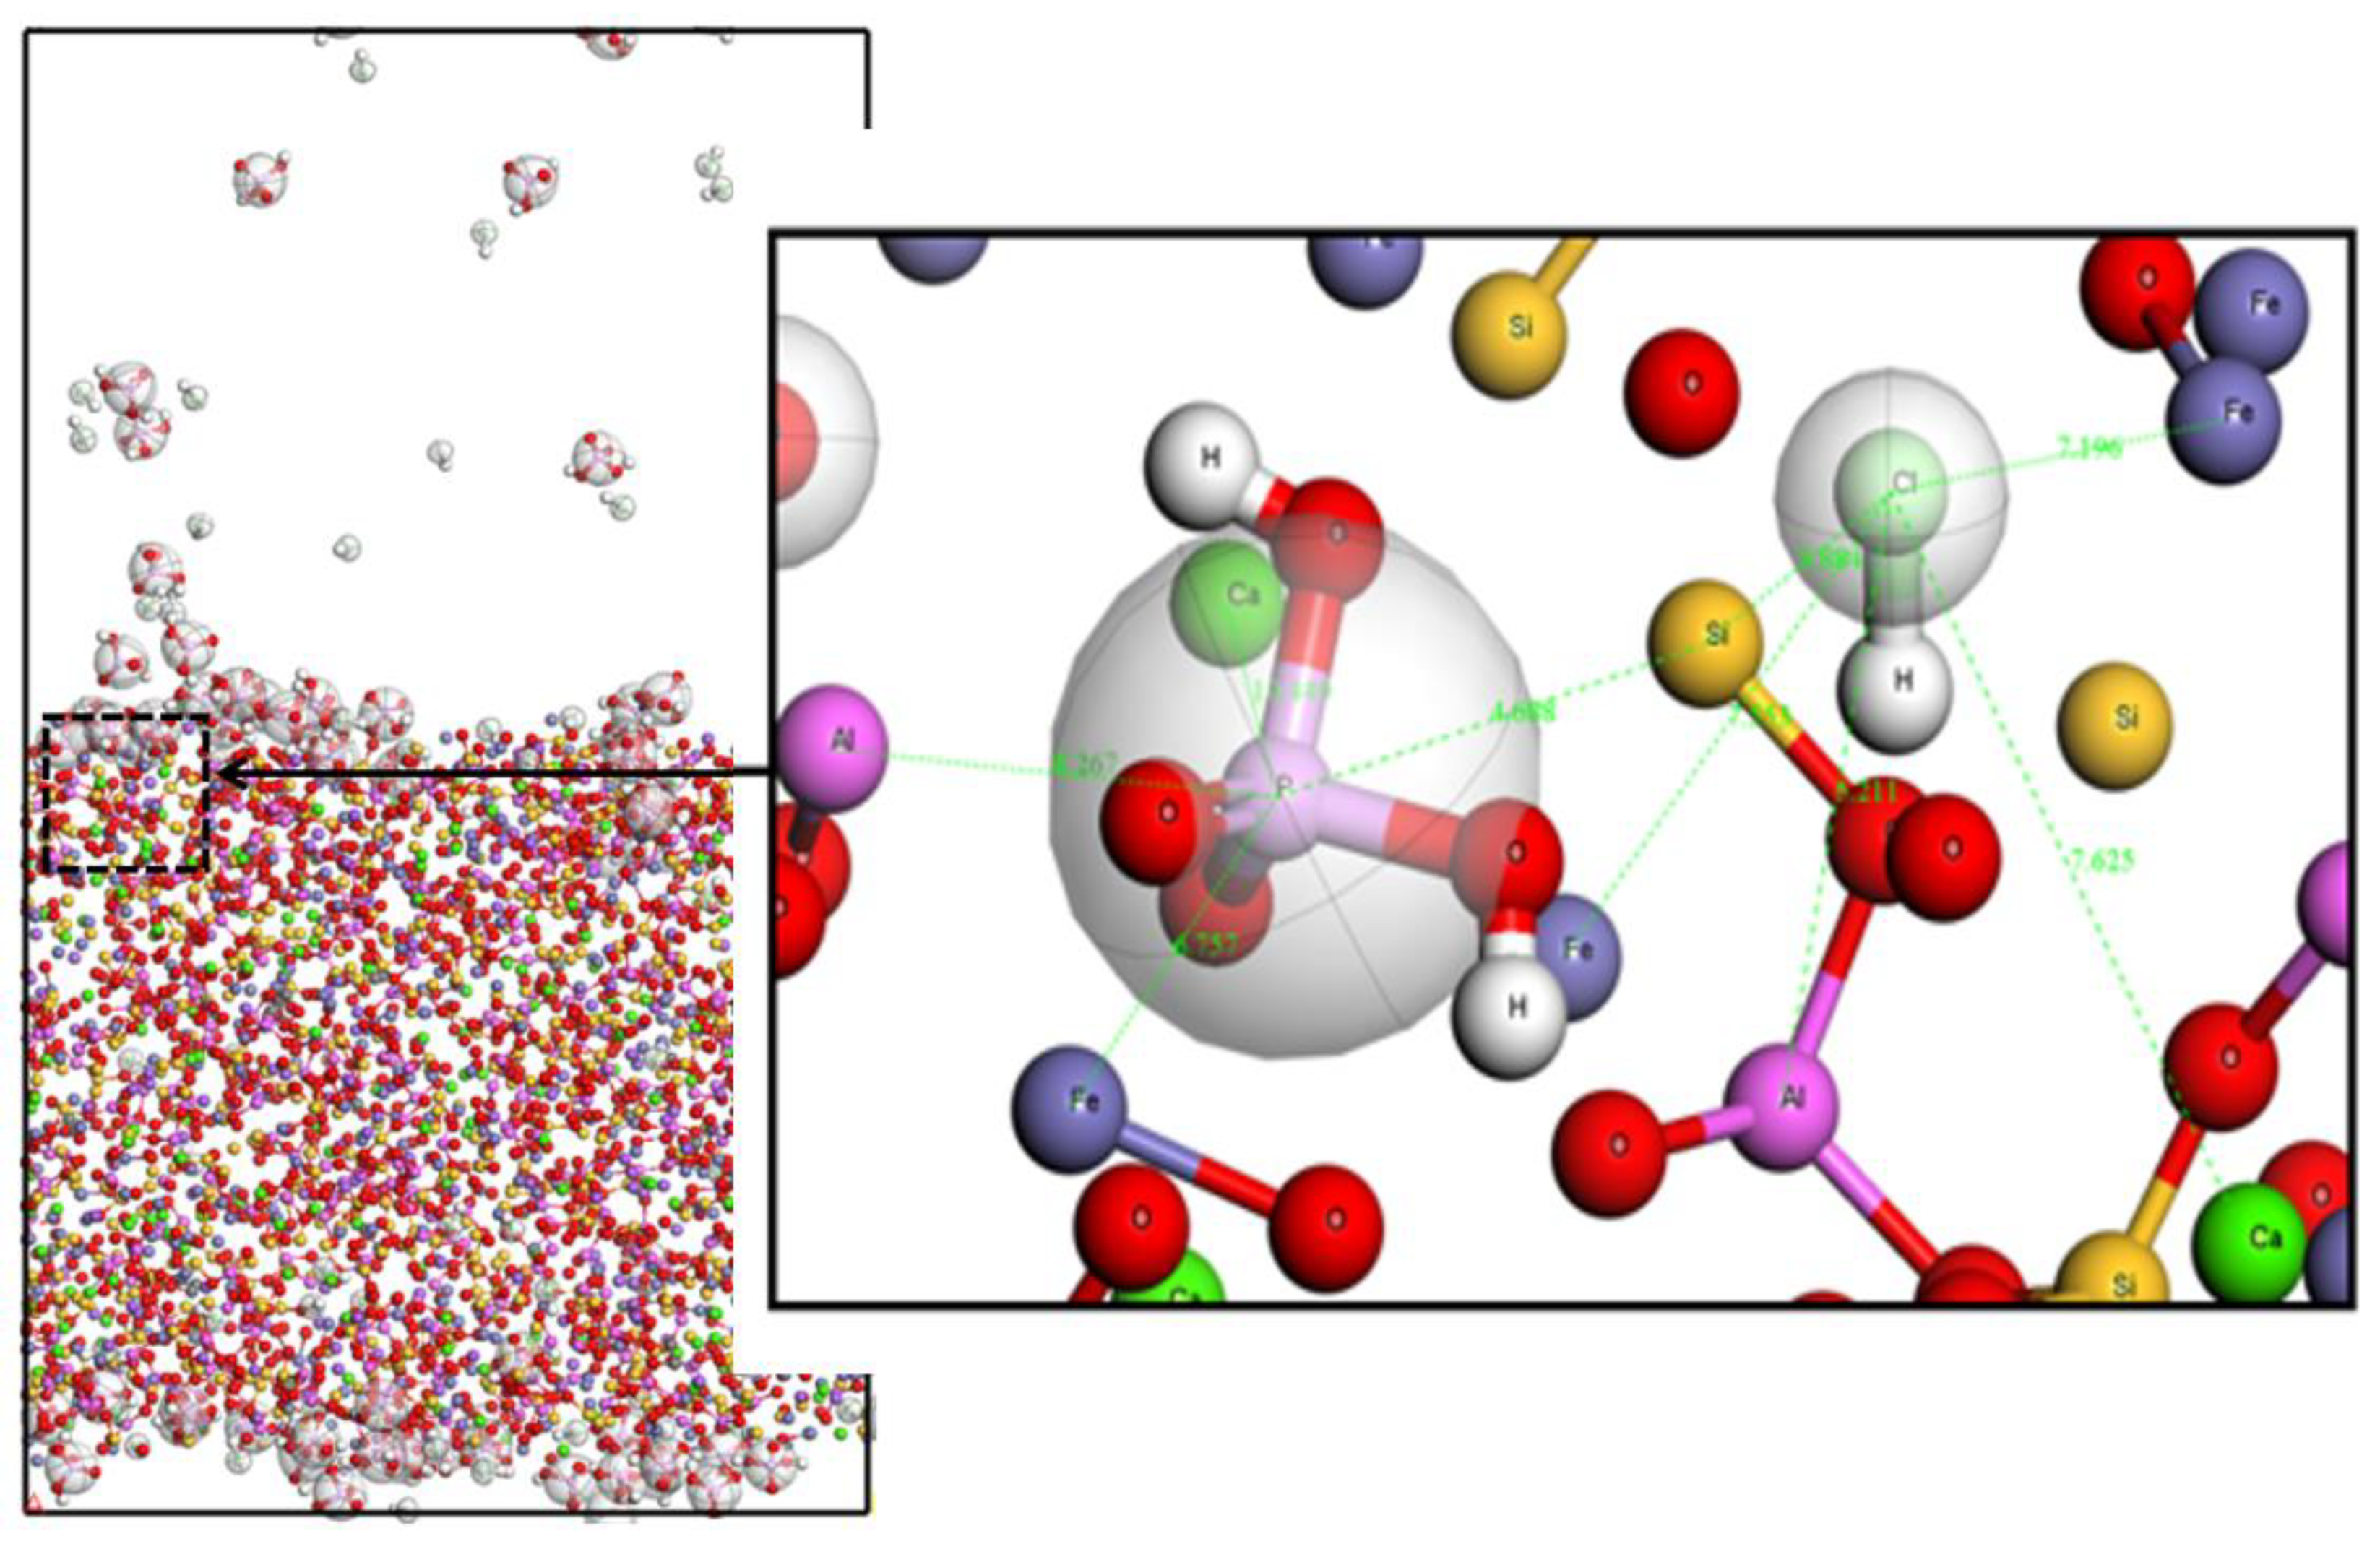
Deionized water only removes the phosphorus adsorbed on the surface of the activated red mud. Contrarily, hydrochloric acid removes majority of the phosphorus content from the surface and within the activated red mud. The interception of the more obvious XYZ for the phosphorus ions at the (26.52,6.47.28.60) for microscopic analysis. As shown in
Figure 8 that the phosphorus adsorbed by deionized water and Ca, Fe, Al, and Si in the activated red mud have atomic distances of 5.55, 9.528, 3.86, and 5.71 Å, respectively. The atomic distance increases after the removal of Fe, the other more than the initial adsorption distance has not changed greatly.
Figure 9 shows that the atomic distances between P and Ca, Fe, Al, and Si in hydrochloric acid were 10.46, 6.75, 8.27, and 4.68 Å, respectively, and the initial adsorption distances of Ca and Al considerably increased compared with those in the deionized water. These results are consistent with the molecular dynamics simulation results, indicating that hydrochloric acid mainly removed phosphorus in the vicinity of Ca and Al atoms.
3.9.4. Energy distribution after phosphorus desorption of phosphorus.
The adsorption sites and potential energy distribution after desorption are studied herein.
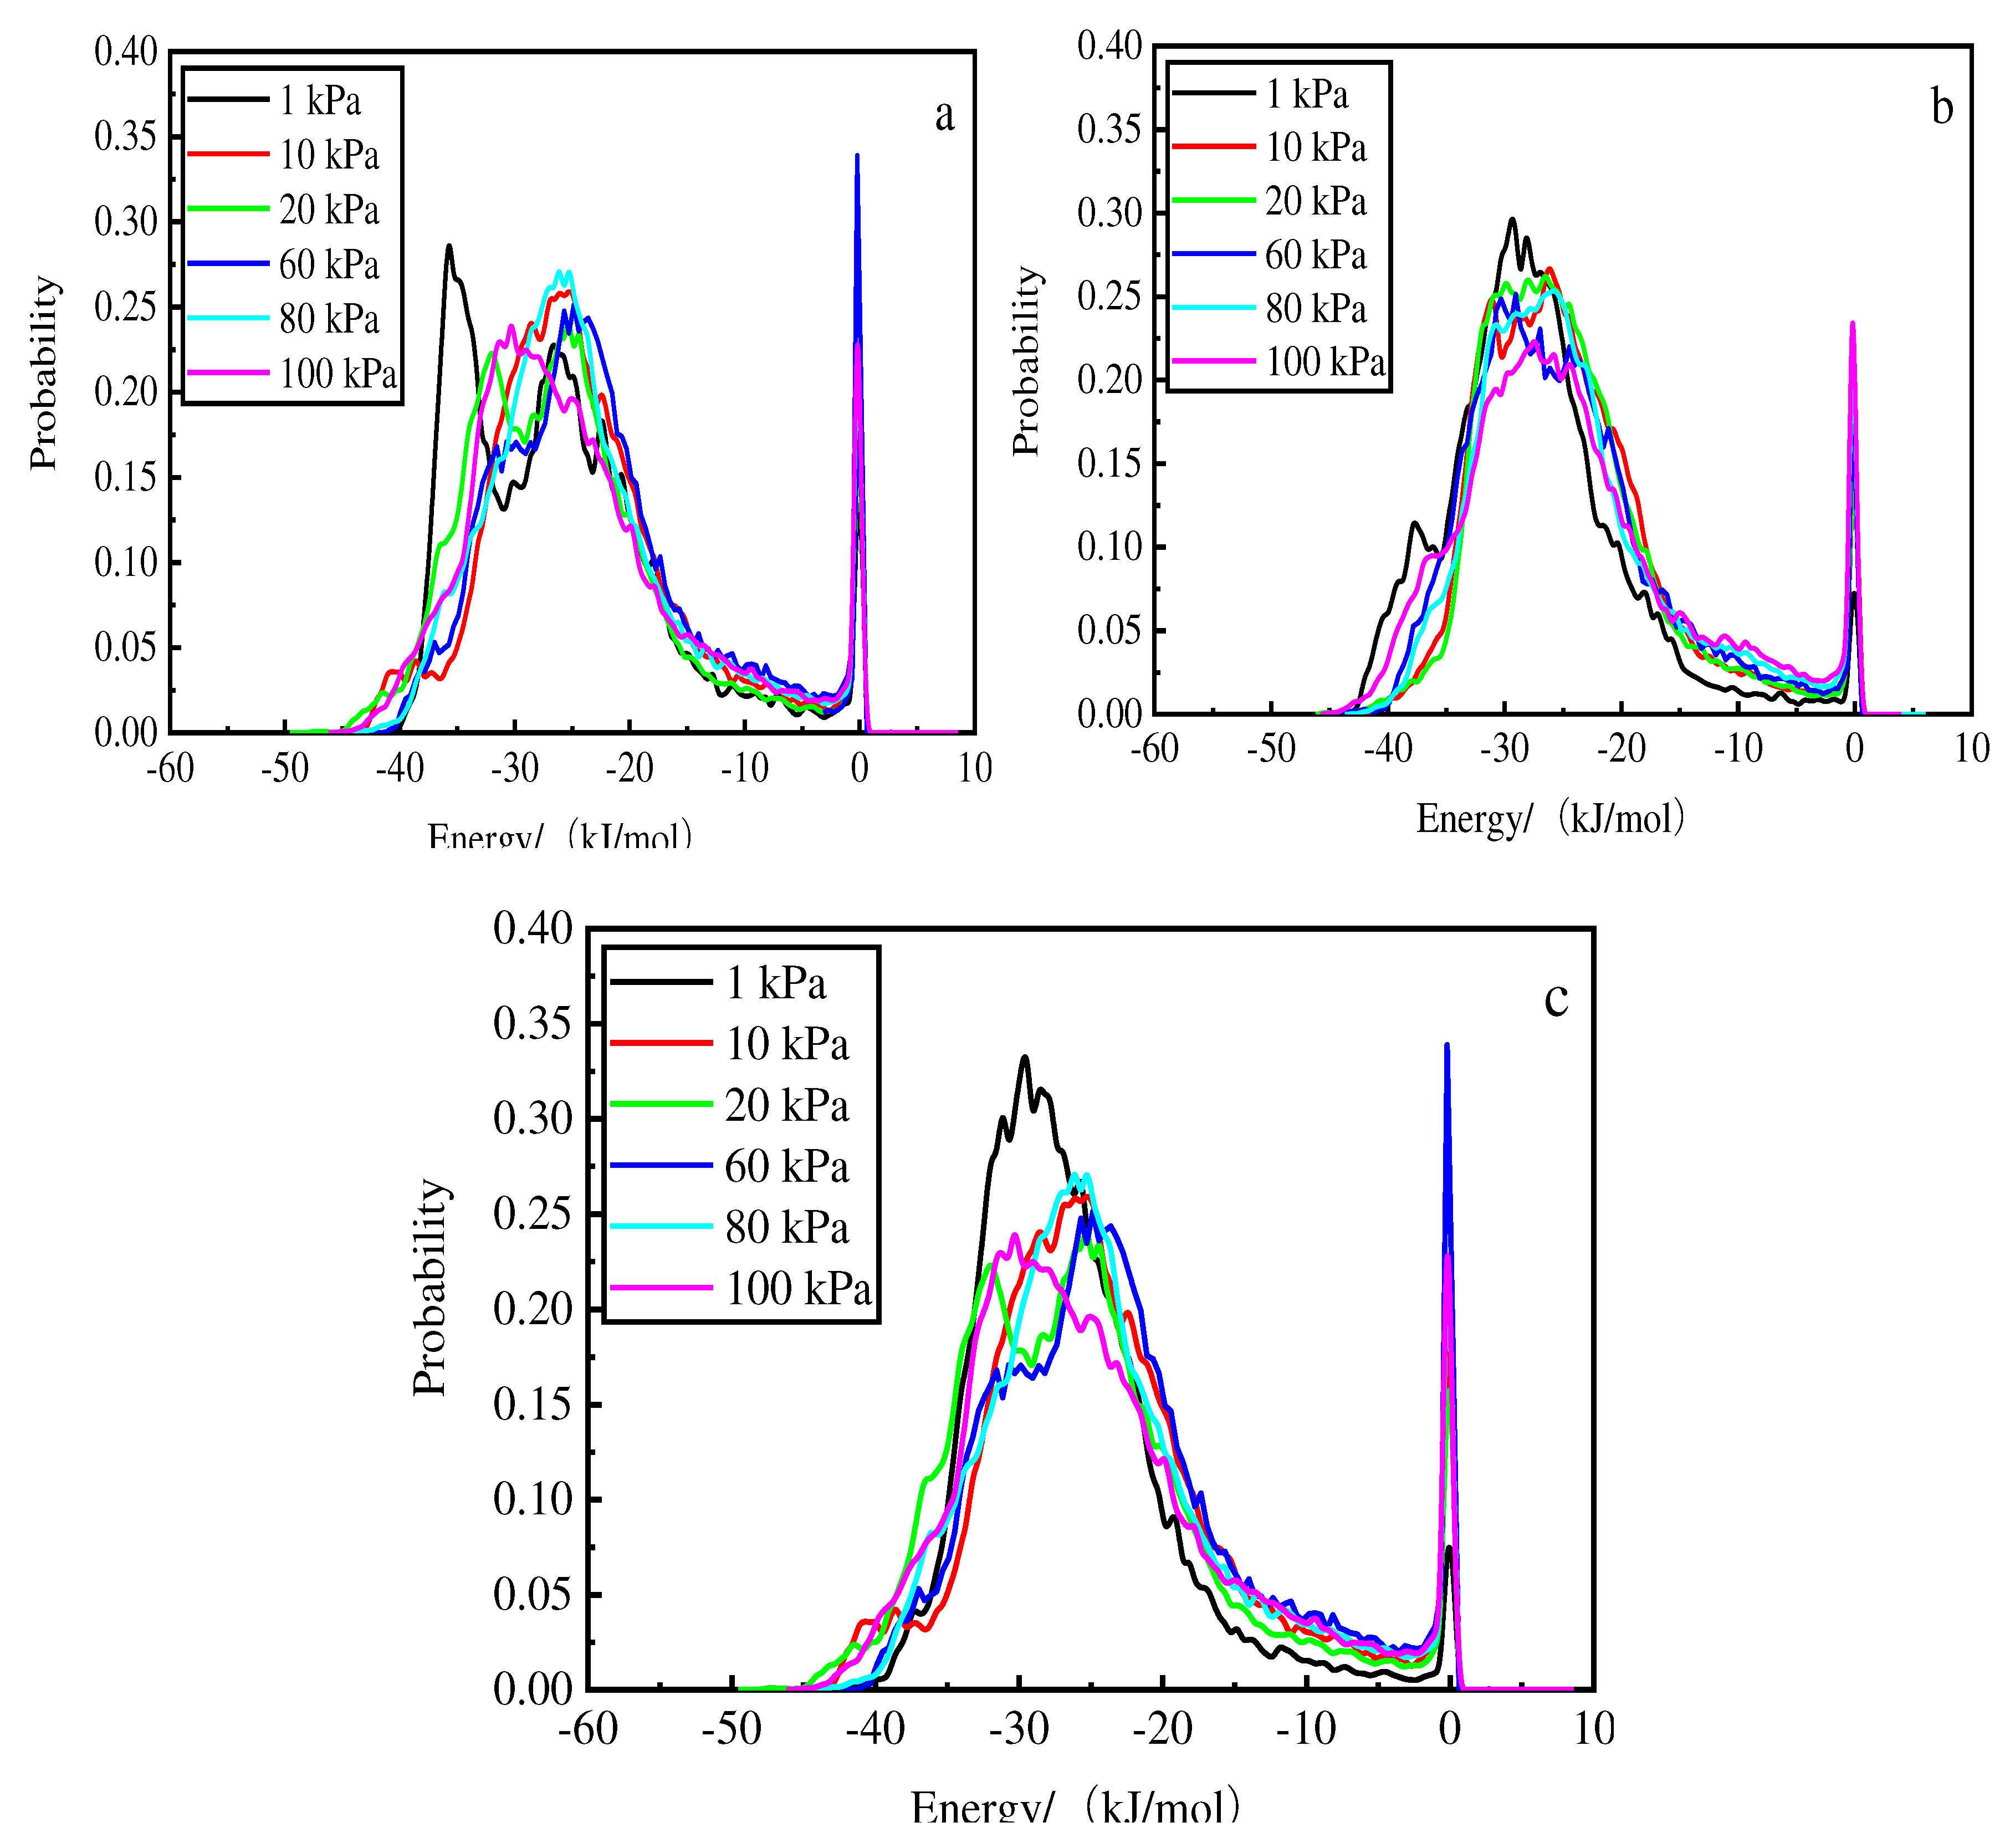
Figure 10 and
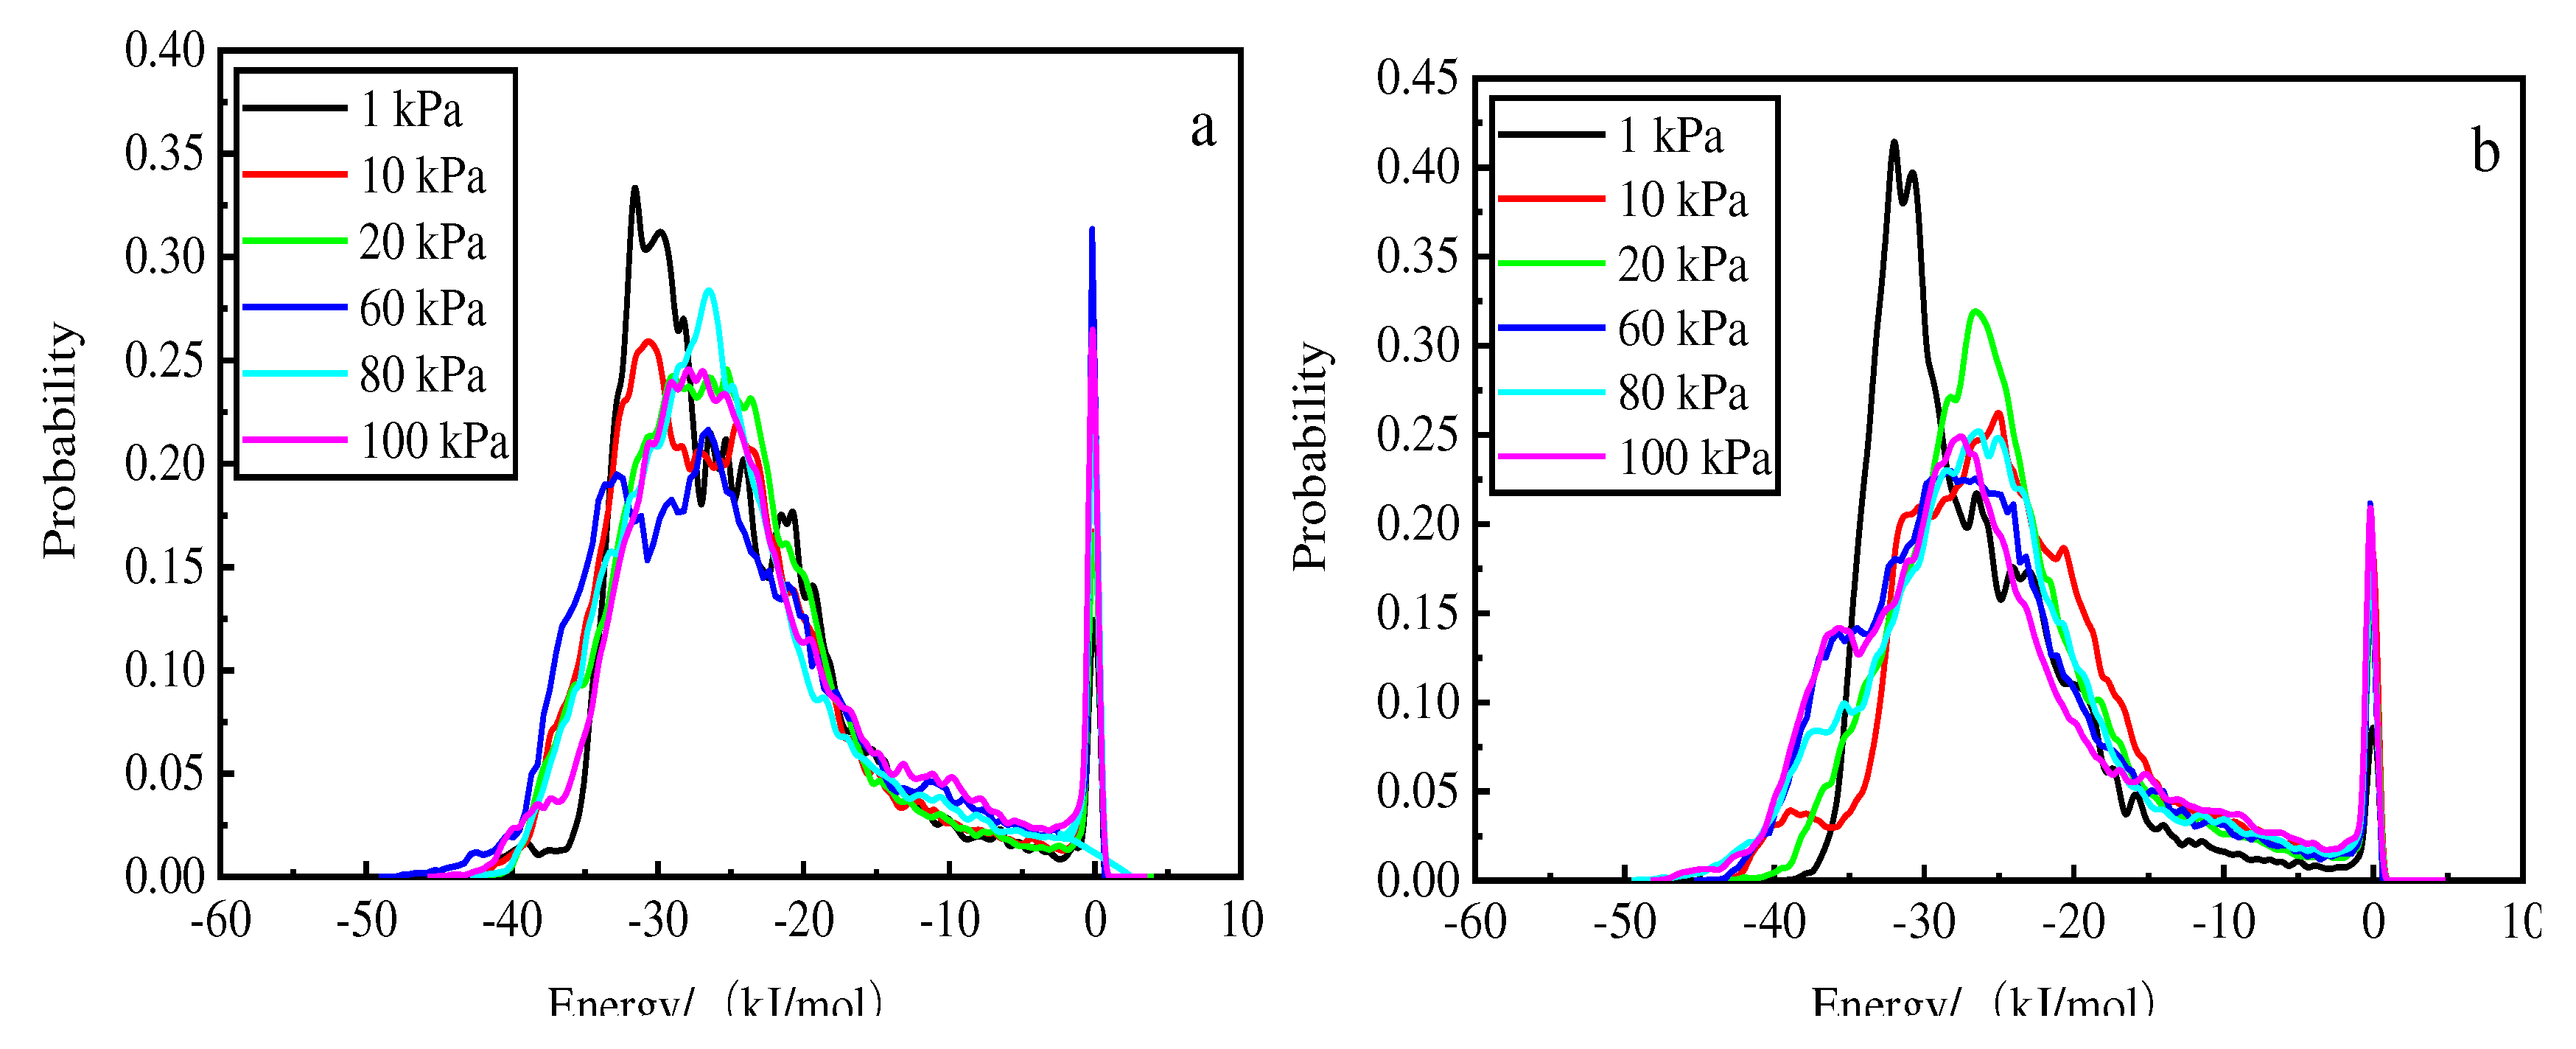
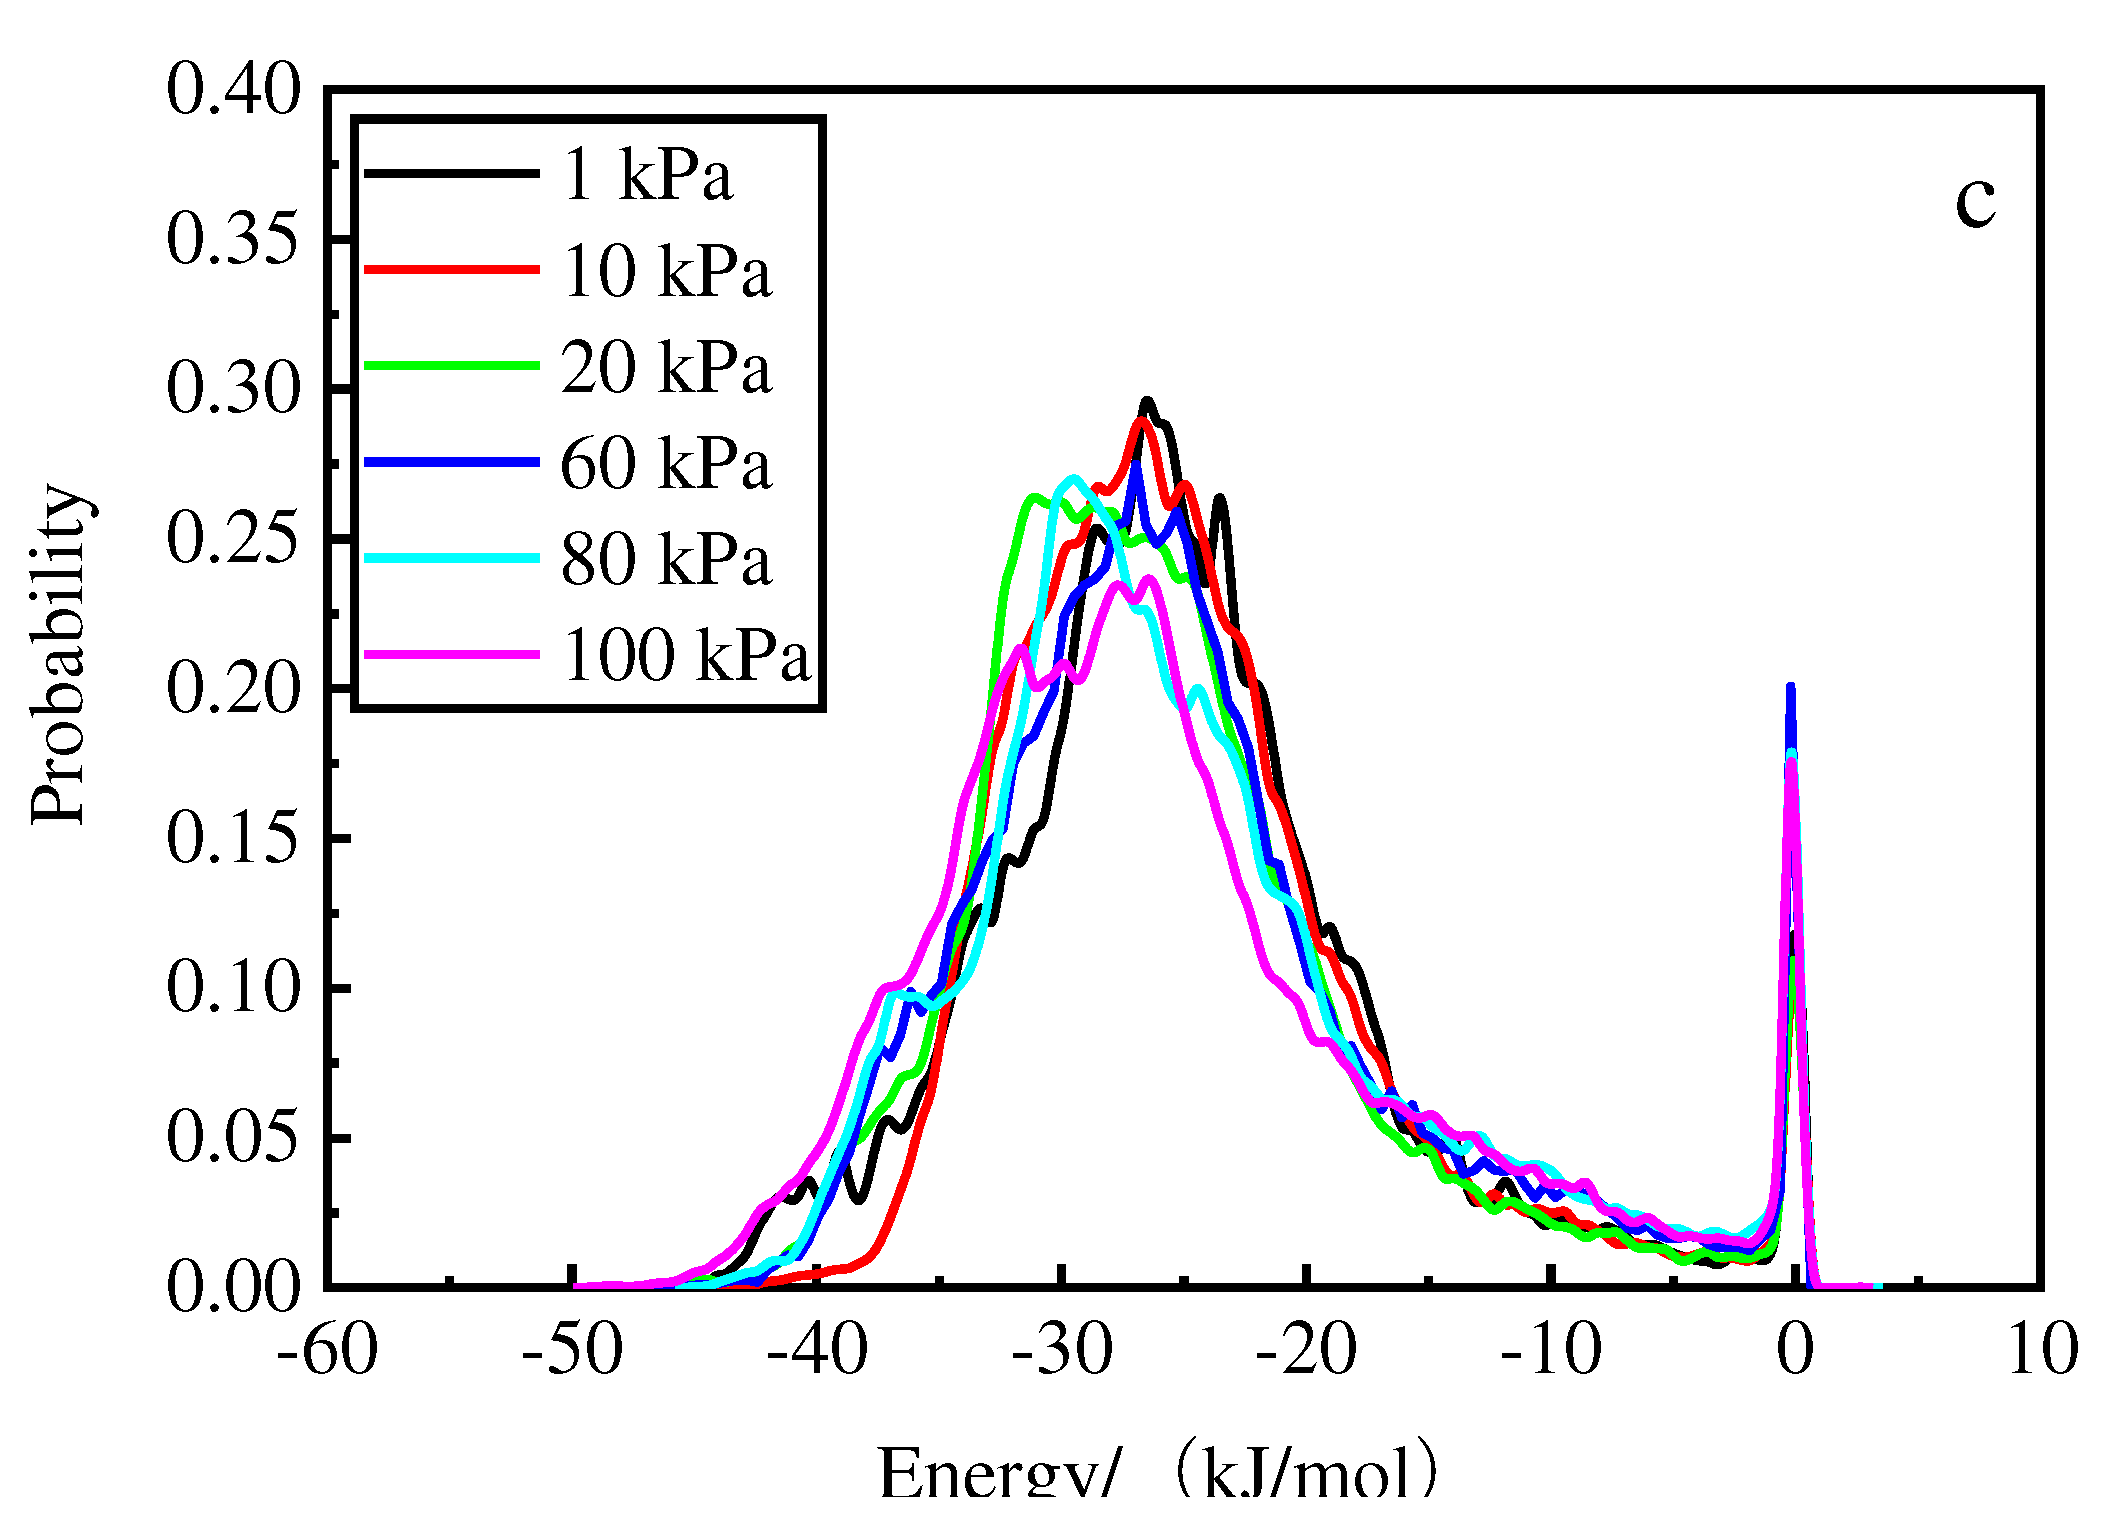
Figure 11 show the energy distribution of phosphorus with changes in pressure for the two desorbents at 288, 298, and 308 K.
Figure 10 shows that for the deionized water, the higher the temperature, the higher the energy of the main absorption peaks. At 1 kPa and 308 K, the energy of the main absorption peak is −35.7 kJ/mol. The probability of 0.3 in the vicinity of the first absorption peak increases with increasing pressure and the peak of the wave increases as the pressure decreases; the second absorption peak occurs near 0.
Figure 11 shows that for hydrochloric acid, the higher the temperature, the higher the energy and the higher the main absorption peak. At 1 kPa and 298 K, the energy is −29.7 kJ/mol for the main absorption peak. The probability of 0.4 in the vicinity of the first absorption peak increases with increasing pressure, and the wave peak considerably increases with decreasing pressure than that observed for deionized water; the second peak appears in the vicinity of 0. Thus, hydrochloric acid accelerated the decrease in the first absorption peak and backward shift of the wave peak.
4. Conclusions
Herein, molecular dynamics simulation was used to study the phosphorus adsorption mechanism via the hydrochloric acid desorption of activated red mud particles. The desorption process was simulated using 0.2 mol/L of hydrochloric acid and deionized water, and the results were compared. The main conclusions are as follows:
Hydrochloric acid accelerated the desorption of phosphorus on the surface of activated red mud particles than deionized water.
Desorption by hydrochloric acid mainly involved ionic bonding of H2PO4− to the surface of activated red mud particles and hydrogen bond breaking and decrease in van der Waals forces.
The interaction between hydrochloric acid and phosphorus accelerated diffusion, thereby decreasing the adsorption capacity. The diffusion coefficient and capacity increased with increasing temperature, whereas the smaller the adsorption amount decreased.
Hydrochloric acid mainly desorbed phosphorus adsorbed by Ca and Al in activated red mud particles, whereas deionized water could only desorb phosphorus on the surface layer.
Author Contributions
Longjiang Li: Supervision, Project administration, Data curation, Writing - review & editing. YangZhiWen: Methodology, Investigation, Data curation, Formal analysis, Writing - original draft. QiuYueqin and WangYaLan: Investigation, Data curation, Formal analysis, Writing - review & editing.
Funding
This research was funded by the National Natural Science Foundation of China ,grant number 51964010.
Institutional Review Board Statement
The study was conducted in accordance with the Declaration of Helsinki, and approved by the Institutional Review Board (or Ethics Committee) of NAME OF 106 INSTITUTE and not involving humans or animals.
Acknowledgments
Thanks to the National Natural Science Foundation of China (51964010) for funding 478,000 yuan, and thanks to the support of the Large Analysis and Testing Instrument Sharing Platform of Guizhou University.
Declaration of Competing Interest
The authors declare that they have no known competing financial interests or personal relationships that could have appeared to influence the work reported in this paper.
References
- Shengguo Xue, Zhu Feng, Kong Xiangfeng; et al. A review of the characterization and revegetation of bauxite residues (red mud). Environmental Science and Pollution Research International, 2016, 23, 1120–1132. [Google Scholar]
- S Sushil, VS Batra. Catalytic applications of red mud, an aluminium industry waste: a review. Applied Catalysis B, 2008, 81, 64–77. [Google Scholar] [CrossRef]
- M Balakrishnan, VS Batra, JSJ Hargreaves. Waste materials – catalytic opportunities: an overview of the application of large scale waste materials as resources for catalytic applications. Green Chem, 2011, 13, 16–24. [Google Scholar] [CrossRef]
- M Balakrishnan, VS Batra, JSJ Hargreaves. Hydrogen production from methane in the presence of red mud –making mud magnetic. Green Chem, 2009, 11, 42–47. [Google Scholar] [CrossRef]
- Yaqin Zhao, Yue Qinyan, Li Qian; et al. Characterization of red mud granular adsorbent (RMGA) and its performance on phosphate removal from aqueous solution. Chemical Engineering Journal (Lausanne), Switzerland, 1996, 2012, 193–194161. [Google Scholar]
- Xuguang G Li, Abdelbaky Hossam Elgarhy, Mohamed Elfatih Hassan. “Removal of inorganic and organic phosphorus compounds from aqueous solution by ferrihydrite decoration onto graphene.”. Environmental Monitoring and Assessment, 2020, 192, 410. [Google Scholar]
- JT Bunce, EN Dam, ID Ofiteru. “A review of phosphorus removal technologies and their applicability to small-scale domestic wastewater treatment systems.”. Frontiers in Environmental S Cience 2018, 6, 1–15. [Google Scholar] [CrossRef]
- Xu, Qianjin. Molecular dynamics simulation of starch adsorption on the monohydrate bauite (010) surface. Central South University, 2013. [Google Scholar]
- Mengfan Wang, Xiaoming Liu. “Applications of red mud as an environmental remediation material: a review.”. Journal of Hazardous Materials, 2021, 408, 124420. [Google Scholar] [CrossRef] [PubMed]
- Sven Reynaert, Paula Moldenaers, Jan Vermant. Interfacial rheology of stable and weakly aggregated two-dimensional suspensions. Physical Chemistry Chemical Physics: PCCP, 2007, 9, 6463–6475. [Google Scholar] [CrossRef]
- Yu Yanchun, Zhu Wei, Xiao Jijun. Molecular dynamics simulations of the binding energy and mechanical properties of a four-component high-energy system. Journal of Chemistry, 2010, 68, 1181–1187. [Google Scholar]
- Xin, crystal. Molecular dynamics simulation to study the desorption mechanism of calcite surface oil film. Journal of Atomic and Molecular Physics, 2019, 36, 373–379. [Google Scholar]
- Xu, Yao. Molecular dynamics simulation study of the cloud flotation system [D]. East China University of Science and Technology,, 2015. [Google Scholar]
- Arpan Kundu, Kaido Sillar, Joachim Sauer. Ab initio prediction of adsorption isotherms for gas mixtures by grand canonical Monte Carlo simulations on a lattice of sites. The Journal of Physical Chemistry Letters, 2017, 8, 2713–2718. [Google Scholar] [CrossRef] [PubMed]
- Li Xijian, Xu Hao. Feasibility analysis of MC simulation for methane adsorption and desorption in coal seam. Coal Technology, 2010, 29, 84–86. [Google Scholar]
- Sudarsan Karki. Chakraborty Somendra-Nath. A Monte Carlo simulation study of hydrogen adsorption in slit-shaped pores. Microporous and Mesoporous Materials 2021, 317. [Google Scholar]
- Jin Zhixin, Wu Shiyuan, Deng Cunbao; et al. Water adsorption mechanism of coal based on Monte Carlo method. Journal of the China Coal Society, 2017, 42, 2968–2974. [Google Scholar]
- Daniel Bahamon, Lourdes F Vega. Pharmaceutical removal from water effluents by adsorption on activated carbons: A Monte Carlo simulation study. Langmuir, 2017, 33, 11146–11155. [Google Scholar] [CrossRef] [PubMed]
- Li, Longjiang. Preparation of activated red mud adsorbent and its adsorption mechanism for phosphorus in phosphate ore flotation wastewater [D]. Guizhou University,, 2020. [Google Scholar]
- Lynndle-C Square, Arendse Christopher-J, Muller Theophillus-F-G. Adsorption of phosphoric acid anions on platinum (111). Adsorption, 2017, 23, 971–981. [Google Scholar] [CrossRef]
- Wang, Jie. Study on the First principles of calcite crystal structure and surface adsorption flotation reagent [D]. Guizhou University,, 2016. [Google Scholar]
- MIN Fan-Fei, Chen Jun, Peng Chen-Liang. Molecular dynamics simulation of surface hydration of fine kaolinite/montmorillonite particles in slime water. Journal of the China Coal Society, 2018, 43, 242–249. [Google Scholar]
- Li, Chi-Xuan. Research on the compatibility between modifier and asphalt and adhesion of modified asphalt based on molecular dynamics [D]. Nanjing Forestry University,, 2021. [Google Scholar]
- Y Duan, Z Liu, H Jing; et al. Novel microwave dielectric response of Ni/co-doped manganese dioxides and their microwave absorbing properties. Journal of Materials Chemistry, 2012, 22, 18291–18299. [Google Scholar] [CrossRef]
- Sun Changhai, Guo Jiabin, Chen Baitong; et al. Molecular simulation study on the effect of Al_2O_3 nanoparticles on the microscopic properties of vegetable insulating oil. Insulating Materials, 2021, 54, 14–20. [Google Scholar]
- Yu, Gongqi. Molecular dynamics study of heavy oil components and their dissolution mechanism[D]. China University of Petroleum (East China), 2013.
- Shi Wenyan, Wang Fengyun, Xia Mingzhu; et al. MD simulation of the interaction between carboxylic acid copolymers and calcite crystals. Journal of Chemistry, 2006, 17, 1817–1823. [Google Scholar]
- Li, LL. Molecular dynamics simulation of methane hydrate decomposition in porous media[D]. Southwest Petroleum University,, 2016. [Google Scholar]
- Wang Shaogang, Liu Cuixia, Jian Zengyun. Molecular dynamics simulation of diffusion coefficient of Al-Cu alloy. Journal of Xi’an University of Technology, 2018, 38, 559–564. [Google Scholar]
- Liu Juanfang, Zeng Danling, CAI Zhiyong; et al. Molecular dynamics simulation of diffusion coefficient. Journal of Engineering Thermophysics, 2006, 03, 373–375. [Google Scholar]
- HUO, Kai-zhong. Predictive modelling of coalbed methane resources in the eastern Ordos Basin[D]. China University of Petroleum (East China),, 2007. [Google Scholar]
- Liu, Lumeng. Application of Monte Carlo molecular simulation in indoor gaseous pollutant adsorption study [D]. Tianjin University,, 2018. [Google Scholar]
Figure 1.
Results of the quantitative mineralogical analysis of activated red mud samples.
Figure 1.
Results of the quantitative mineralogical analysis of activated red mud samples.
Figure 2.
Activated red mud protoplast configuration.
Figure 2.
Activated red mud protoplast configuration.
Figure 3.
H2PO4-,HCl and H2O structure.
Figure 3.
H2PO4-,HCl and H2O structure.
Figure 4.
Modelling of desorption in deionised water and hydrochloric acid. Deionized water before desorption model (a) and after-desorption model (b), hydrochloric acid before-desorption model (c)and after-desorption model (d).
Figure 4.
Modelling of desorption in deionised water and hydrochloric acid. Deionized water before desorption model (a) and after-desorption model (b), hydrochloric acid before-desorption model (c)and after-desorption model (d).
Figure 5.
Radial distribution function of H2PO4− (O) and red mud Ca (a), Al (b), Fe (c),.and O (d) after desorption.
Figure 5.
Radial distribution function of H2PO4− (O) and red mud Ca (a), Al (b), Fe (c),.and O (d) after desorption.
Figure 6.
Mean-square displacement of phosphorus desorbed by desorbents at different temperatures.
Figure 6.
Mean-square displacement of phosphorus desorbed by desorbents at different temperatures.
Figure 7.
Adsorption isotherms of phosphorus after desorption from deionized water (a) and hydrochloric acid (b) at different temperatures and pressures.
Figure 7.
Adsorption isotherms of phosphorus after desorption from deionized water (a) and hydrochloric acid (b) at different temperatures and pressures.
Figure 8.
Adsorption sites after phosphorus desorption by deionized water.
Figure 8.
Adsorption sites after phosphorus desorption by deionized water.
Figure 9.
Adsorption sites after desorption by hydrochloric acid.
Figure 9.
Adsorption sites after desorption by hydrochloric acid.
Figure 10.
Energy distribution at different pressures after phosphorus desorption by deionized water at 308 K (a), 298 K (b), and 288 K (c).
Figure 10.
Energy distribution at different pressures after phosphorus desorption by deionized water at 308 K (a), 298 K (b), and 288 K (c).
Figure 11.
Energy distribution at different pressures after phosphorus desorption by hydrochloric acid at 308 K (a), 298 K (b), and 288 K (c).
Figure 11.
Energy distribution at different pressures after phosphorus desorption by hydrochloric acid at 308 K (a), 298 K (b), and 288 K (c).
Table 1.
Calculated lattice parameters for different correlation functions.
Table 1.
Calculated lattice parameters for different correlation functions.
| Title |
a /Å |
b/ Å |
c/ Å |
a errors/% |
b errors/% |
c errors/% |
GGA-PW91/eV |
| Nepheline |
10.204 |
10.204 |
8.575 |
0.75 |
0.75 |
1.41 |
−80350.4366 |
| Calcite-iron garnet |
12.149 |
12.149 |
12.149 |
1.34 |
1.34 |
1.34 |
−4948.1662 |
| Ferric oxide |
4.788 |
4.788 |
13.588 |
5.25 |
5.25 |
1.54 |
−18272.9523 |
| Calcium chalcopyrite |
12.918 |
12.918 |
5.269 |
1.61 |
1.61 |
1.41 |
−26943.7928 |
| Sapphire |
5.069 |
5.069 |
5.55 |
4.10 |
4.10 |
3.48 |
−2958.9783 |
| Dolomite |
4.859 |
4.859 |
16.066 |
1.34 |
1.34 |
1.92 |
−14757.1343 |
Table 2.
Binding energies of the two mixed systems (kJ/mol).
Table 2.
Binding energies of the two mixed systems (kJ/mol).
| Systems |
Etotal
|
Esurface
|
Epolymer
|
Einteration
|
Ebin
|
Hydrochloric acid
Deionized water
|
13969.58
14014.18 |
447.03
439.16 |
13939.29
14002.33 |
−416.74
−427.31 |
416.74
427.31 |
Table 3.
Diffusion coefficient of phosphorus in deionized water and hydrochloric acid (unit: 10−8 m2/s).
Table 3.
Diffusion coefficient of phosphorus in deionized water and hydrochloric acid (unit: 10−8 m2/s).
| Temperature/K |
Deionized water |
Hydrochloric acid |
288
298
308
|
2.3143
2.7570
2.7240 |
2.3658
2.8690
3.1268 |
Table 4.
Equivalent heat of adsorption on the desorbent surface after desorption.
Table 4.
Equivalent heat of adsorption on the desorbent surface after desorption.
| Pressure/kPa |
Deionized water |
Hydrochloric acid |
288K/
(kJ/mol) |
298 K/
(kJ/mol) |
308 K/ (kJ/mol) |
288K/
(kJ/mol) |
298 K/(kJ/mol) |
308 K/(kJ/mol) |
1
10
20
60
80
100
|
28.49
25.41
26.71
27.65
27.87
28.50 |
29.59
26.54
26.63
26.79
26.08
26.26 |
28.33
26.12
27.78
24.90
26.01
26.75 |
27.09
26.94
27.96
27.03
26.89
27.81 |
28.76
25.60
26.44
27.76
27.10
27.54 |
27.13
27.22
26.80
26.66
26.48
25.46 |
|
Disclaimer/Publisher’s Note: The statements, opinions and data contained in all publications are solely those of the individual author(s) and contributor(s) and not of MDPI and/or the editor(s). MDPI and/or the editor(s) disclaim responsibility for any injury to people or property resulting from any ideas, methods, instructions or products referred to in the content. |
© 2024 by the authors. Licensee MDPI, Basel, Switzerland. This article is an open access article distributed under the terms and conditions of the Creative Commons Attribution (CC BY) license (http://creativecommons.org/licenses/by/4.0/).
