1. Introduction
Red mud is an alkaline solid produced during alumina production; it is a porous material with a satisfactory particle size distribution, an average particle size of less than 0.1 mm, and a specific surface area of ~10–25 m
2/g [
1]. Red mud has satisfactory adsorption characteristics, especially for the adsorption of phosphate ions, which it strongly adsorbs [
2,
3]. However, the adsorption by red mud of phosphorus in water has not been applied industrially, primarily because it is difficult to desorb after the adsorption of phosphorus by red mud particulate adsorbent (hereinafter called “red mud adsorbent”), which hinders regeneration and subsequent reuse. Desorption can regenerate red mud adsorbent and the recycling of phosphorus resources. Phosphate desorption generally involves the use of acid, alkali, and salt leaching to recover phosphate. Simple low-cost salts, such as NaCl and KCl, can desorb phosphate only on adsorbents with weak adsorption strengths and nonspecific adsorption [
4,
5]. High concentrations of these salts generally produce effective desorption [
6], which, because of the risk of high salinity, may be problematic if the phosphate in the desorbed solution is to be recovered or used for fertilizing and irrigating crops [
5]. Simple salts are ineffective in desorbing phosphate from adsorbents that strongly adsorb phosphate through specific adsorption mechanisms (e.g., ligand exchange or inner-sphere complexation) [
7].
Acids and bases can specifically and nonspecifically remove adsorbed phosphates because phosphorus adsorption occurs below pH 3–4 and above pH 8–10 [
8]. Phosphate adsorption below pH 3–4 decreases because, at low pH, phosphate exists primarily as nonionic H
3PO
4, which is very weakly adsorbed. At pH > 8–10, both the adsorbent and phosphate species in solution carry strong negative charges (HPO
42− and PO
43−), providing unfavorable conditions for adsorption toward the negatively charged adsorbent. In addition, the increase in the concentration of OH
− at high pH increases the competition with phosphate for adsorption, thereby reducing phosphate adsorption. If the precipitation causes phosphate removal at high pH, as occurs with Ca and Mg carbonates, then bases providing a high pH may not desorb phosphate [
7,
9]. Urano et al. [
10] used activated alumina and Al
2(SO
4)
3 as adsorbent to remove phosphate from water, and the adsorbed phosphate was desorbed by NaOH. Treatment with sodium hydroxide desorbes some of the sulfate from the adsorbent and dissolved some of the aluminum. Therefore, the desorbed adsorbent could not be reused and was regenerated by recirculating a solution of Al
2(SO
4)
3 and hydrochloric acid. After alkaline NaCl treatment, Kuzawa et al. [
11,
12,
13,
14] regenerated the adsorbent using 25% MgCl
2 to rebuild the adsorbent structure and restore its adsorptive capacity.
In mechanistic studies of desorbed red mud adsorbents, acids desorb phosphorus and concomitantly degrade the structure of the particle surfaces, bases reduce the adsorption capacity of the adsorbent, and salts desorb phosphate through an ion-exchange process [
15,
16,
17]. Commonly used salts include sodium chloride and potassium chloride; however, special salts are sometimes used to restore the structure of the adsorbent degraded in the desorption process. Zhao Yaqin [
12] et al. studied the desorption of phosphorus from calcined red mud and reported that the calcination temperature does not strongly affect phosphate desorption. In addition, they reported that the desorption efficiency of the adsorbent from red mud particles in NaOH solution is lower than that of HCl solution because desorption causes no notable loss of mass for the alkaline desorbent. However, it is slightly higher than that of deionized water. In addition to the <1% basic desorption caused by deionized water (related to physical adsorption), it is presumed to arise from the reverse reaction of phosphate adsorption [
18,
19]. To obtain the composites, Mingyang selected the following preparation conditions: raw material mass ratio red mud:fly ash:cement = 85:10:5, microwave power of 700 W, microwave duration of 15 min, roasting temperature of 800 °C, and roasting duration of 15 min. In particular, the microwave-roasted granules were obtained using a HCI solution with a NaOH solution as the desorption solution, and used at low concentrations. The low concentration of the HCI solution is considered as a more desirable desorbent as acid makes the particles unclogged pores, and the effective sites inside the particles are exposed for better resorption [
20].
Although both acid and alkali are good desorption agents, the final comprehensive use (i.e., after desorption) of the adsorbent must be considered to maximize the use of materials, regardless of the desorption agent. Because red mud itself is alkaline, the results of the study indicate that, after desorption, the red mud adsorbent has an increased risk of alkaline return in downstream industrial applications, especially in concrete processes. This result is due to the increase in pH, whereas red mud adsorbent desorbed with acid reduces the alkalinity of the red mud itself; hence, it has a minimal impact on the concrete process. Therefore, herein, red mud is used as the main raw material, charcoal powder modified by sintering is used as the pore-making agent, and silica sol is used as the bonding agent. It uses sintering to modify red mud and applies static adsorption and desorption tests with different concentrations of HCl and deionized water. Finally, surface micromorphology, energy spectroscopy analysis, mineral composition analysis, infrared analysis, and kinetic and thermodynamic fitting serve to determine the desorption mechanism.
2. Materials and Methods
2.1. Materials
The raw materials of the modified red mud adsorbent primarily included red mud, charcoal powder, and silica sol. The red mud was procured from Guizhou Huajin Aluminum Co., Ltd,China. with 30% water content. It was dried at 50 °C for 12 h and then sieved through 0.075 mm after grinding in a ball mill. Charcoal powder was procured from Henan Xingnuo Environmental Protection Materials Co., Ltd., and silica sol was purchased from Wuhan Jiye Sheng Chemical Co. The primary chemical components of red mud were Fe2O3 (21.94%), Al2O3 (21.04%), SiO2 (19.05%), CaO (17.95%), Na2O (8.96%), and others (11.06%). The wastewater simulation object consisted of ore-dressing phosphorus-containing wastewater from a phosphorous-ore-dressing plant in Guizhou. The red mud particles were activated to prepare for use as an adsorbent based on the following parametrization: the preset quality ratio of red mud:charcoal powder:silica sol = 92:5:3 through weighing and mixing with a disk granulator for granulation, the water–ash ratio was 1:2, made of 1–2-mm-diameter raw particles that were sintered in a muffle furnace for 30 min at 700 °C. The phosphorus-containing wastewater used in the test was the flotation tailings return water from a phosphorus-ore-dressing plant in Guizhou. The main elements in the wastewater were P (1278.0 mg/L), Ca (213.15 mg/L), Mg (401.40 mg/L), Al (0.25 mg/L), Fe (0.02 mg/L), Cr (0.04 mg/L), K (66.35 mg/L), and Na (0.25 mg/L). The adsorbent was prepared in a muffle furnace at 700 °C. The phosphorus-containing wastewater was weakly acidic (pH 3–4), and phosphorus mainly took the form of H2PO42−, which could be diluted to the required concentration by adding deionized water.
2.2. Test Methods for Adsorption and Desorption of Adsorbent from Activated Red Mud Particles
The initial pH was 4. The effects of the operating and environmental conditions on the adsorption of the adsorbent were investigated as a function of adsorbent dosage, adsorption time, and adsorption temperature to obtain the optimized adsorption conditions.
The initial phosphorus concentrations were 200, 250, 300, 400, 500, 600, 700, 900, and 1200 mg/L, the adsorption temperatures were 15 °C, 20 °C, 25 °C, 30 °C, 35 °C, and the adsorption times were 1, 2, 3, 6, 12, 18, and 24 h. Further, 40 mL of phosphorus-containing wastewater was poured into a conical flask, and 0.8, 1, 1.2, 1.4, 1.6, 1.8, 2, 2.2, and 2.4 g of granular adsorbent were added for static adsorption. The test was set up three times using a model ICP-7400 inductively coupled plasma emission spectrometer and a yttrium internal standard to measure the content of phosphorus and other ions in the supernatant. The removal rate,
, of phosphorus in the solution and the amount of adsorbent,
Q, adsorbed was calculated as follows [
21]:
where
is the removal rate of phosphorus in the solution (%),
is the concentration of phosphorus in the solution before adsorption (mg /L),
is the concentration of phosphorus in the solution after adsorption (mg/L),
Q is the amount of adsorbent adsorbed per unit mass of adsorbent (mg/g),
V is the volume of the solution (L), and
M is the mass of adsorbent after drying (g).
Phosphorus desorption test. Phosphorus-activated red mud adsorbent particles were removed and dried and then added to different types of desorbent: acid: 0.2-, 0.1-, and 0.05-mol/L HCl; alkali: 0.5-, 1-, and 2-mol/L NaOH; salt: 1- and 2-mol/L NaCl; adsorption temperature: 15 °C, 20 °C, 25 °C, 30 °C, 35 °C; desorption time: 1, 2, 3, 6, 12, 18, and 24 h. The concentration of phosphorus desorbed from the solution was determined at the end of the test. The desorption amount,
Y, and desorption rate,
y, of phosphorus were calculated using Eqs. (4) and (5) [
22].
where
is the phosphorus removed by activated red mud adsorbent (mg/g),
is the concentration of phosphate in the solution before the test (mg/L),
is the concentration of phosphate in the solution after the test (mg/L),
is the volume of solution used in the test (L),
is the amount of adsorbent added by activated red mud particles (g),
is the amount of phosphorus desorbed by activated red mud adsorbent per unit mass (mg/g),
is the concentration of phosphorus in the desorption solution (mg/L),
is the volume of desorption solution (L),
is the dry weight of the adsorbed phosphorus-saturated particles in the desorption solution (g); and
y is the desorption efficiency of the activated red mud particles adsorbed on the phosphorus (%).
Phosphorus adsorption test. After desorption, the activated red mud adsorbent was first rinsed with deionized water and then dried to be used again for phosphorus adsorption after the particles were dried. To obtain the optimal conditions of adsorption of the pharmaceutical, the steps are the same as those required for obtaining the optimal adsorption conditions of the activated red mud adsorbent.
2.3. Characterization and Analysis Methods
Specific surface area and porosity were determined using a specific surface and porosity analyzer model (Micromeritics APSP 2460), with a degassing temperature of 200 °C, degassing time of 8 h, and nitrogen adsorption gas. The specific surface area and pore volume of the red mud samples were calculated before and after activation using the BET and BJH models.
The elemental content and composition of red mud before and after the test were analyzed using an ARL PERFORM’X X-ray fluorescence spectrometer. The red mud to be tested was dried, ground, and filtered by a 200 mesh; 4 g of the sample was weighed and analyzed in vacuum.
Thermogravimetric analysis was performed using a synchronous PE thermogravimetric differential scanning calorimeter to determine the activation temperature by analyzing the change in the mass of charcoal powder and red mud as a function of temperature. The heating rate was 10 °C/min, the temperature range was 30 °C–1000 °C, and the atmosphere was nitrogen.
Surface microscopic morphology analysis and energy spectroscopy were performed using a TESCAN MIRA LMS scanning electron microscope to image and analyze the surface configuration of the red mud adsorbent. The morphology was enlarged to 2–5 μm, and the particle surfaces were scanned through energy-dispersive X-ray microanalysis (EDS) in spectral spot scanning mode to analyze the relative content of phosphorus and other elements on the surface of the samples.
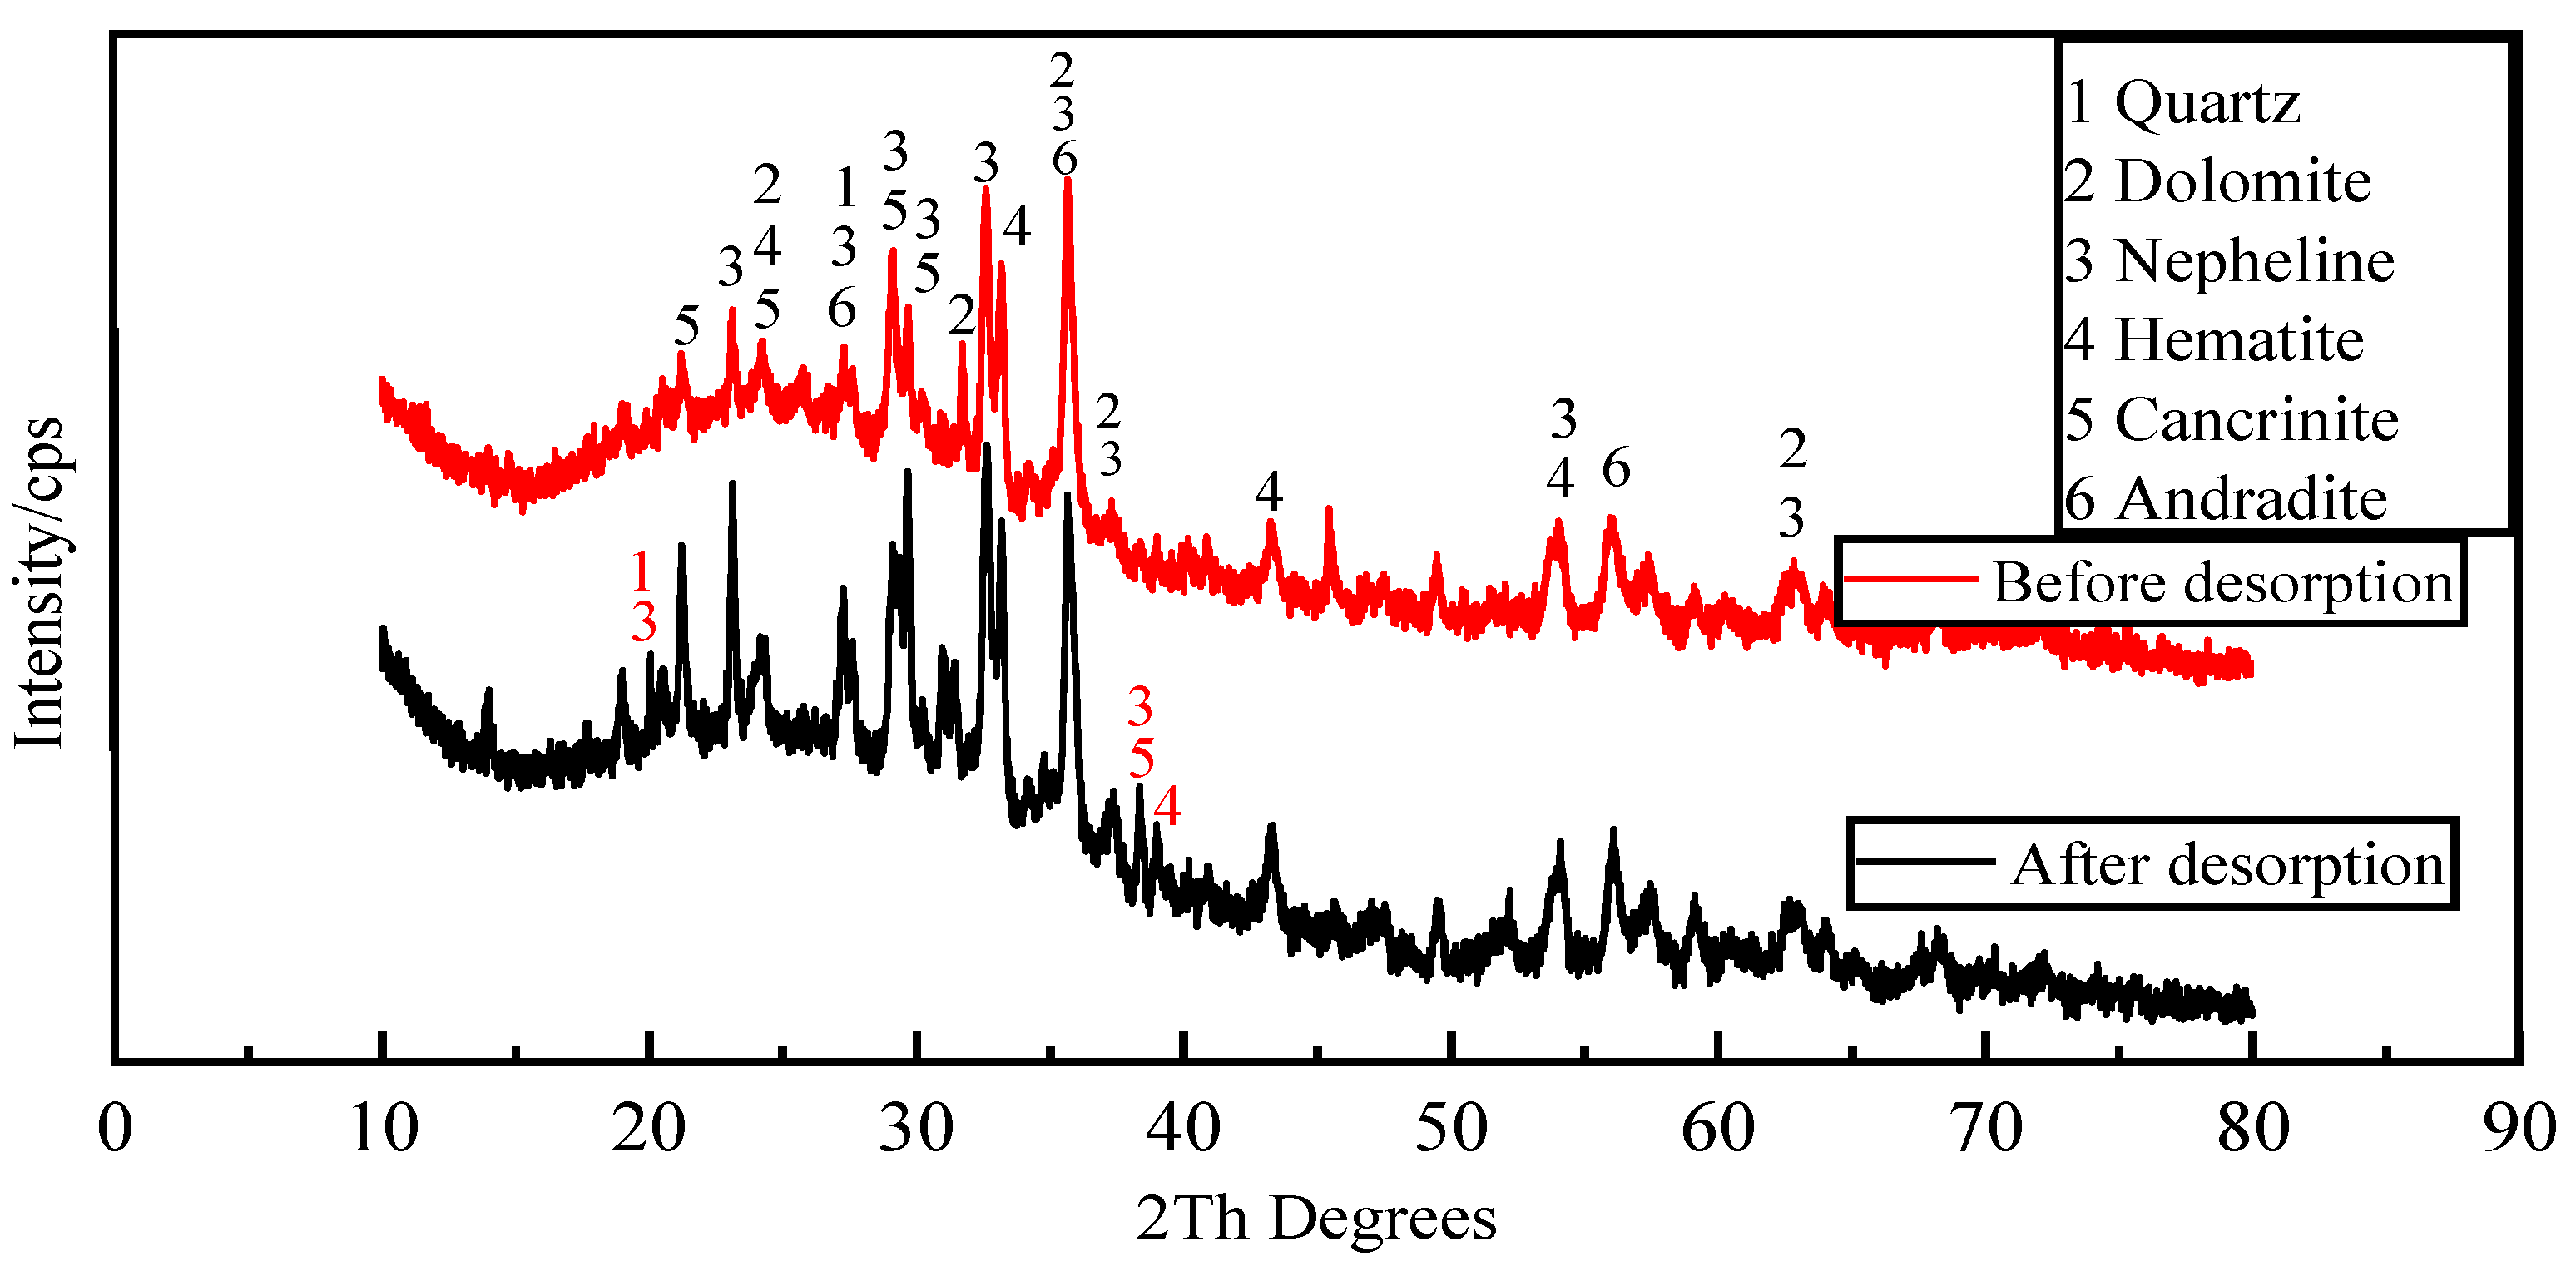
Mineral composition analysis was performed using an X-ray diffractometer model (XPert PRO MPD) to determine the mineral composition of the samples through powder X-ray diffraction (operating parameters: Cu Kα line: 40 kV and 40 mA, scanning speed: 2°/s, scanning range: 10°–80°).
The surface functional groups were analyzed using a Fourier infrared spectrometer model (Nicolet 670). The position and intensity of the Fourier infrared absorption peaks reflect the characteristics of the molecular structure and serve to identify the structural composition of the unknown substance or to determine its chemical composition. For infrared analysis of the bulk, a small amount of dried sample was mixed with potassium bromide powder, ground, and pressed in vacuum. The functional groups were then identified via infrared spectral scanning from 400 to 4000 cm−1.
2.4. Kinetic and Thermodynamic Methods
2.4.1. Desorption Isotherm Analysis
Desorption curves at different temperatures are nonlinear and can therefore be fitted by the Freundlich adsorption isotherm equation and Langmuir adsorption isotherm equation [
23]. The isotherms reveal the interaction between (i) the adsorbent and desorbent and (ii) the adsorbate at the interface of the two phases to derive the desorption properties and mechanism [
24]. The D–R model provides the ideal state, assuming that the adsorbent pore space is filled with solute. The Freundlich adsorption isotherm model (Eq. (6)) and the Langmuir adsorption isotherm model (Eq. (7)) were used to analyze the adsorption isotherms.
where
K is the Freundlich constant of adsorption and desorption, exponent
is the Freundlich affinity coefficient for adsorption–desorption intensity,
a and
b are the Langmuir adsorption–desorption capacity and binding strength, respectively,
is the phosphate concentration at adsorption–desorption equilibrium,
is the equilibrium adsorption amount (mmol/g),
is the theoretical maximum adsorption amount (mmol/g),
and
are constants, and
.
2.4.2. Desorption Thermodynamic Analysis
Thermodynamics is applied from the energy point of view to explain a possible desorption mechanism, explore the energy conversion law, and use thermodynamic parameters to understand the characteristics of the following thermodynamic equations [
25]:
where
is the change in the Gibbs free energy,
is a thermodynamic constant,
is the change in enthalpy,
is the change in entropy,
is the universal gas constant, and
T is the absolute temperature. Using Eqs. (10) and (11) provides
2.4.3. Analysis of Desorption Kinetics
Desorption kinetic models were used to evaluate the adsorption–desorption behavior of red mud for phosphate as a function of reaction time [
26]. Ruthven used an adsorption dynamics model to calculate and investigate the relation between desorption and adsorption penetration curves, indicating the difference between the two based on the equilibrium theory applied to the desorption process [
27]. The kinetic models used in this study are based on a pseudo-first-order kinetic linear model (Eq. 13) [
27], a pseudo-second-order kinetic linear model (Eq. 14) [
28], and an intraparticle diffusion model (Eq. 15) [
29,
30] to fit the following kinetics of phosphate adsorption by activated red mud adsorbent:
where
k1 is the pseudo-first-order kinetic linear model rate constant,
k2 is the pseudo-second-order kinetic linear model rate constant,
ki is the intraparticle diffusion constant,
qt is the amount of phosphate desorbed by the adsorbent at the desorption volume time (h), and
C is the amount of diffusion.
3. Results and Discussion
3.1. Influence of Different Desorbents on Phosphorus Desorption
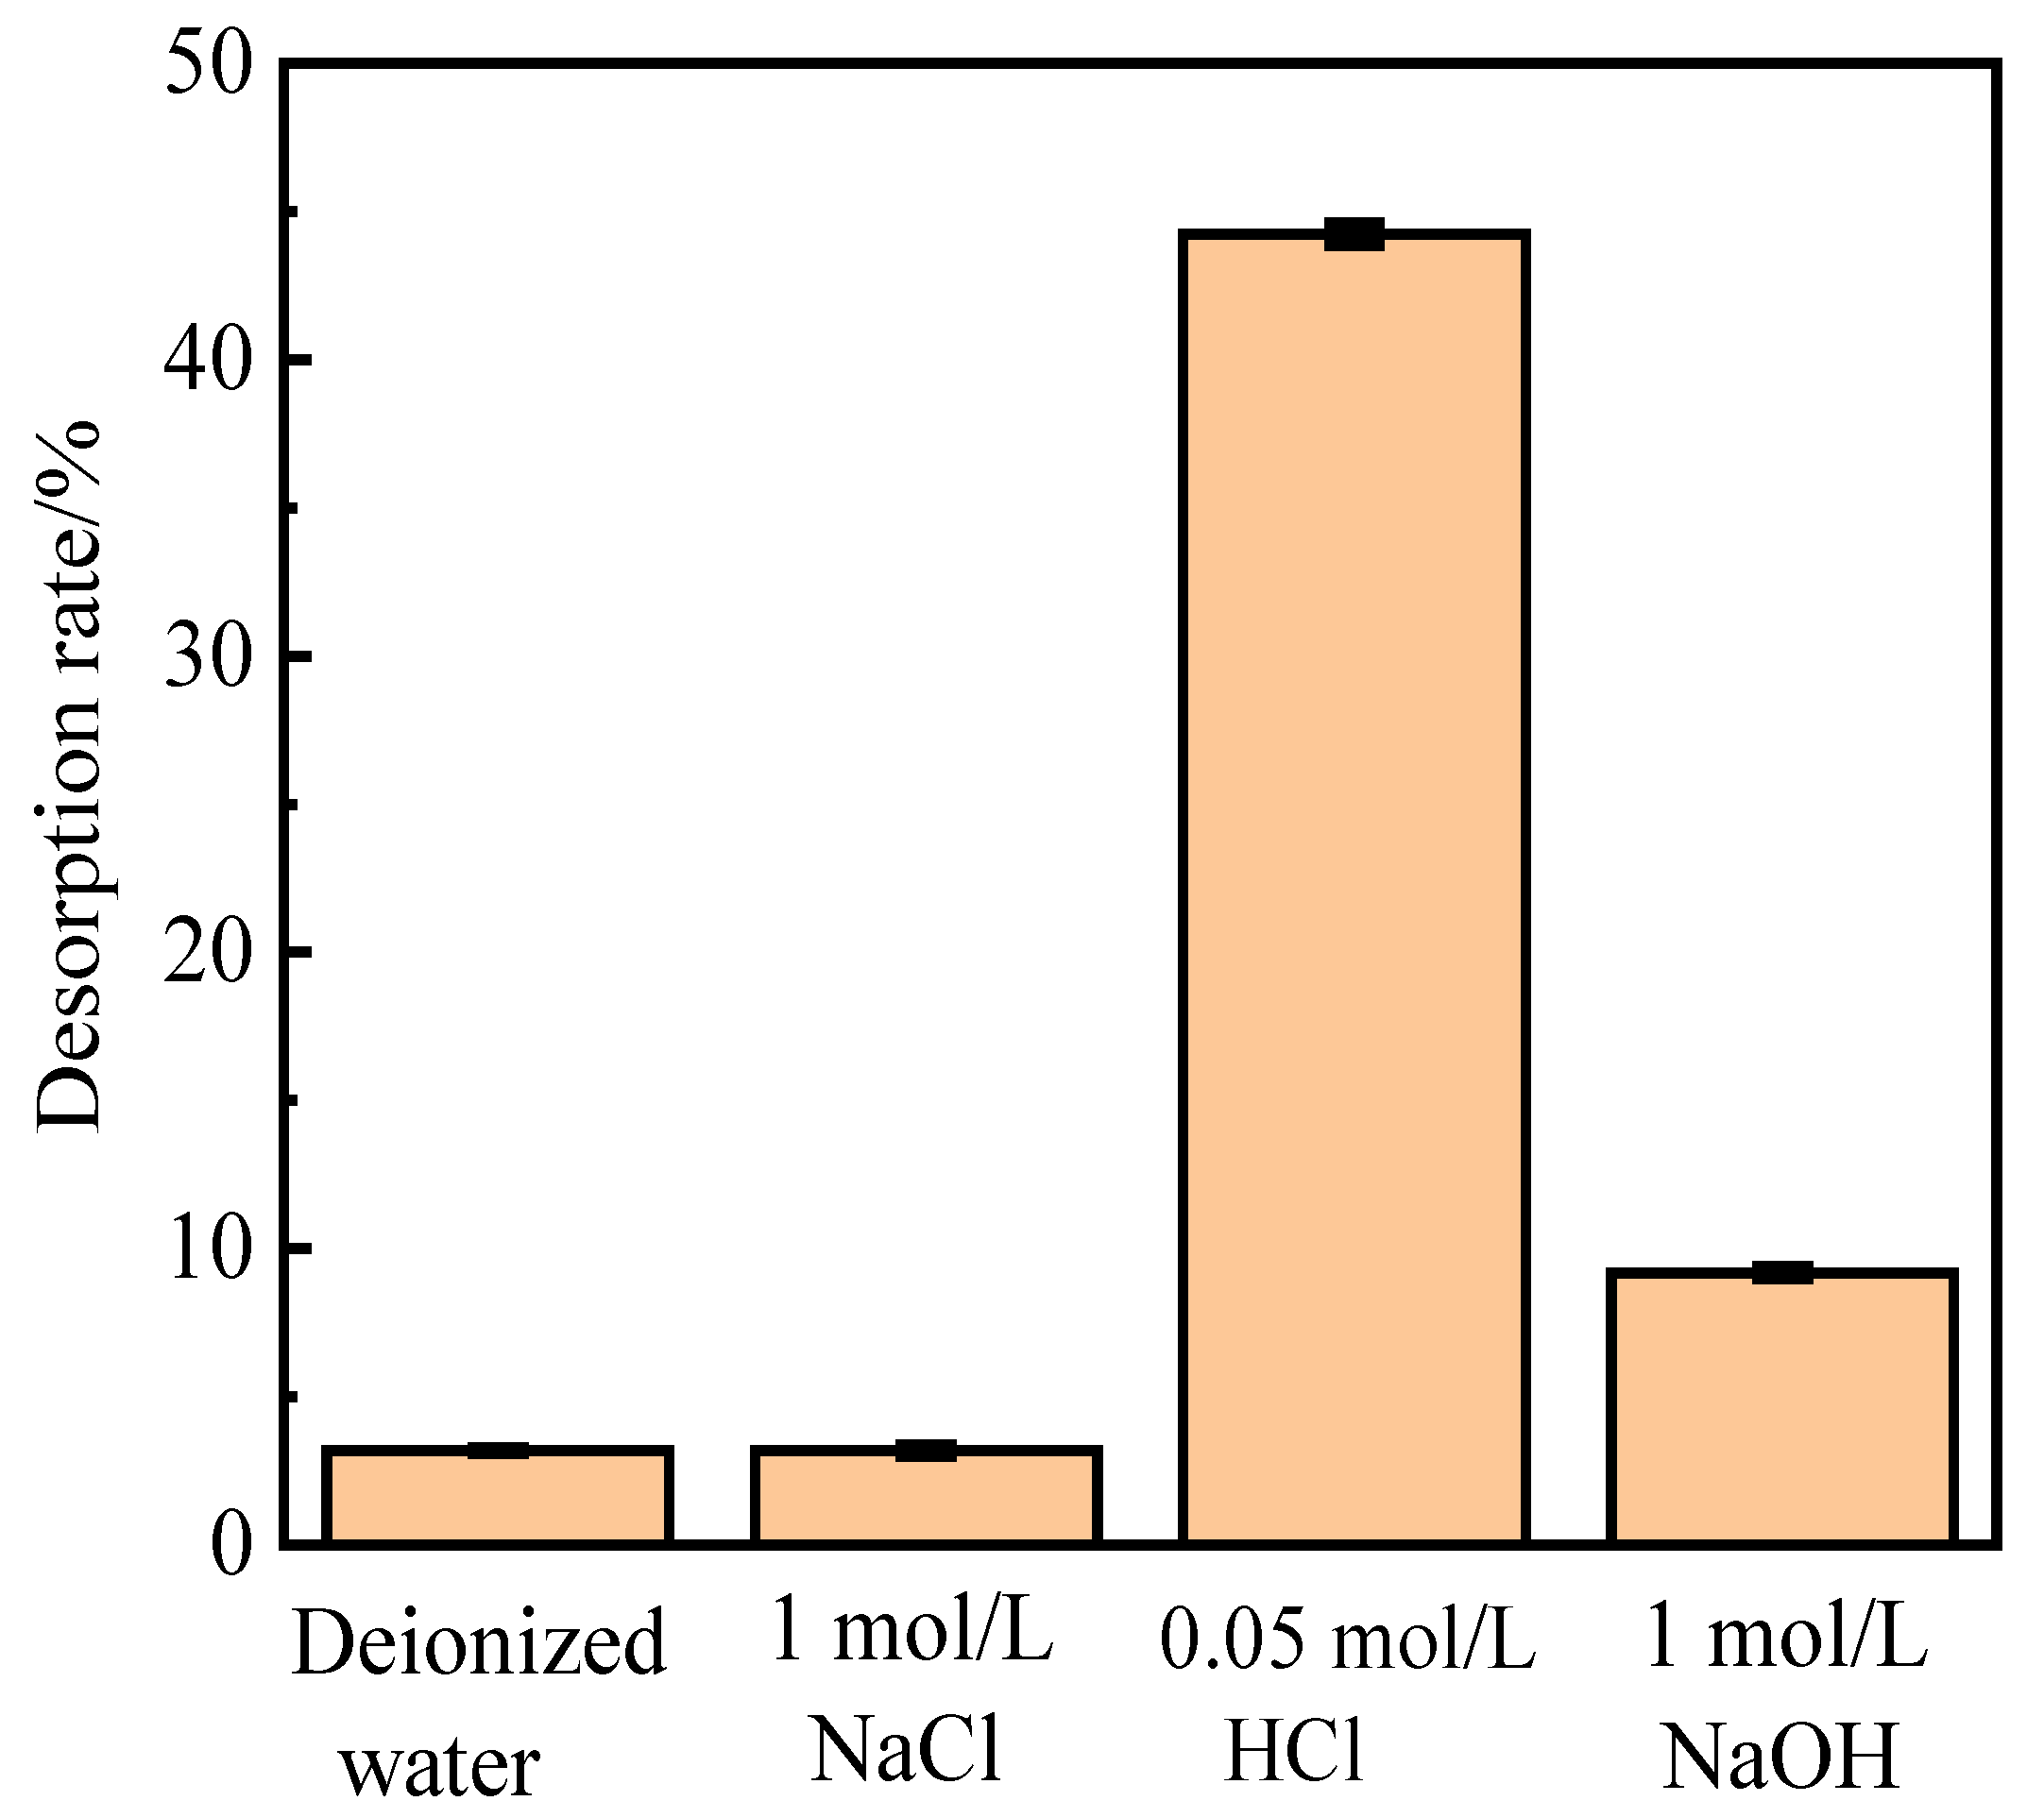
Alkali (NaOH), acid (HCl), salt (NaCl), and deionized water were used to investigate the influence of different absorbents on phosphorus desorption at a liquid–solid ratio of 0.15 L/g at 35 ℃ for 18 h.
Figure 1 shows the desorption of activated red mud particles after adsorption. The results indicate that after 3 h of desorption in deionized water and NaCl solution, the desorption rate of phosphorus is less than 10%, which is much lower than those for HCl and NaOH solutions under the same desorption conditions. The desorption rate of activated red mud particles for phosphorus is in the following order: HCl solution > NaOH solution > NaCl solution > deionized water. However, the desorption of 1.0-mol/L NaOH solution is insignificant, which may be due to the insufficient desorption time or to the concentration of the desorbent.
3.2. Readsorption Performance of Activated Red Mud Adsorbent
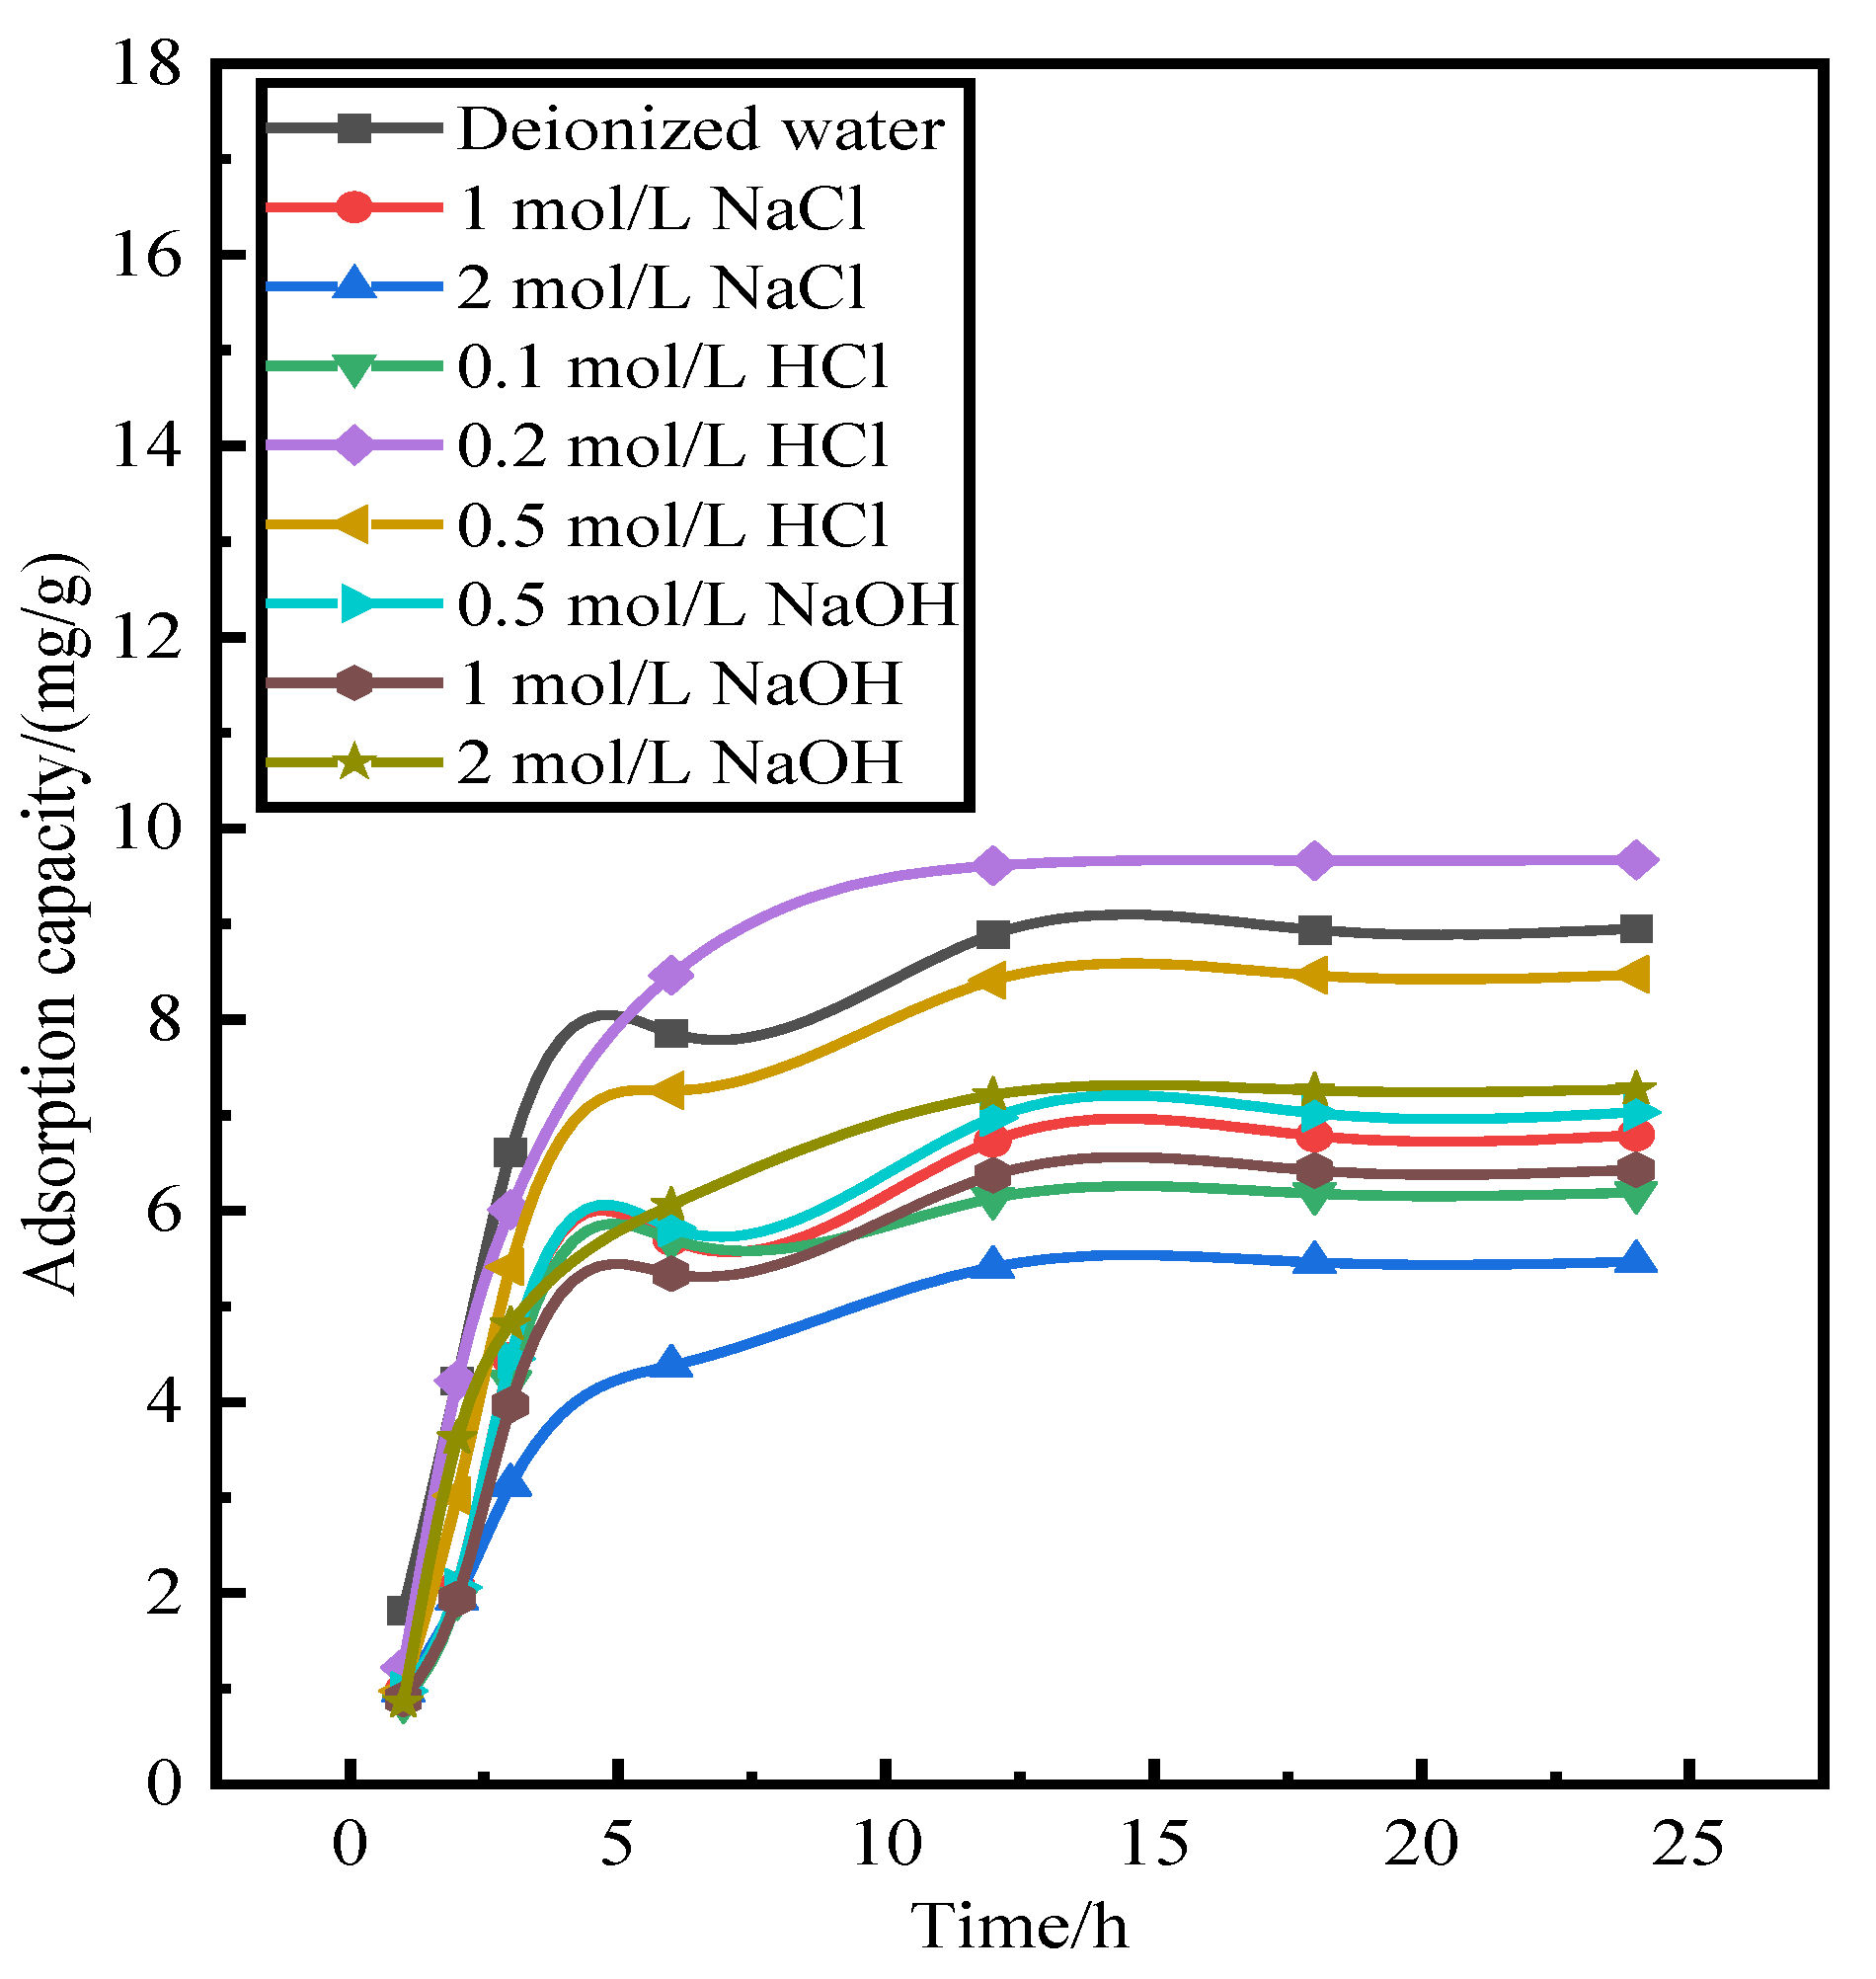
The activated red mud adsorbent after desorption of phosphorus was used to readsorb phosphorus in the solution. Further, 25 g/L of activated red mud adsorbent was injected into a 40 mL conical flask in a phosphorus-containing solution of 300 mg/L and a constant temperature of 35 °C to undergo static adsorption for 1, 2, 3, 6, 12, 18, and 24 h. The concentration of phosphorus contained in the solution supernatant was determined through inductively coupled plasma emission spectrometry (ICP).
Figure 2 shows the amount of adsorbent on the phosphorus after desorption. The adsorption of the activated red mud adsorbent on phosphorus after desorption by deionized water and 0.2- and 0.5-mol/L HCl solutions is considerably better than that of the low-concentration HCl solution and the NaOH solution at any concentration.
Figure 2 shows that 0.2–0.5-mol/L HCl does not destroy the particle structure and even dredges the particle pores, thereby exposing the effective sites inside the particles. This explains why a 0.2–0.5-mol/L HCl solution is better than deionized water. By combining desorption–readsorption and the loss of particles, a 0.2-mol/L HCl solution can serve as a desorbent for desorption and subsequent phosphorus readsorption studies of activated red mud adsorbent.
3.3. Effect of Desorbent Input on Phosphorus Desorption
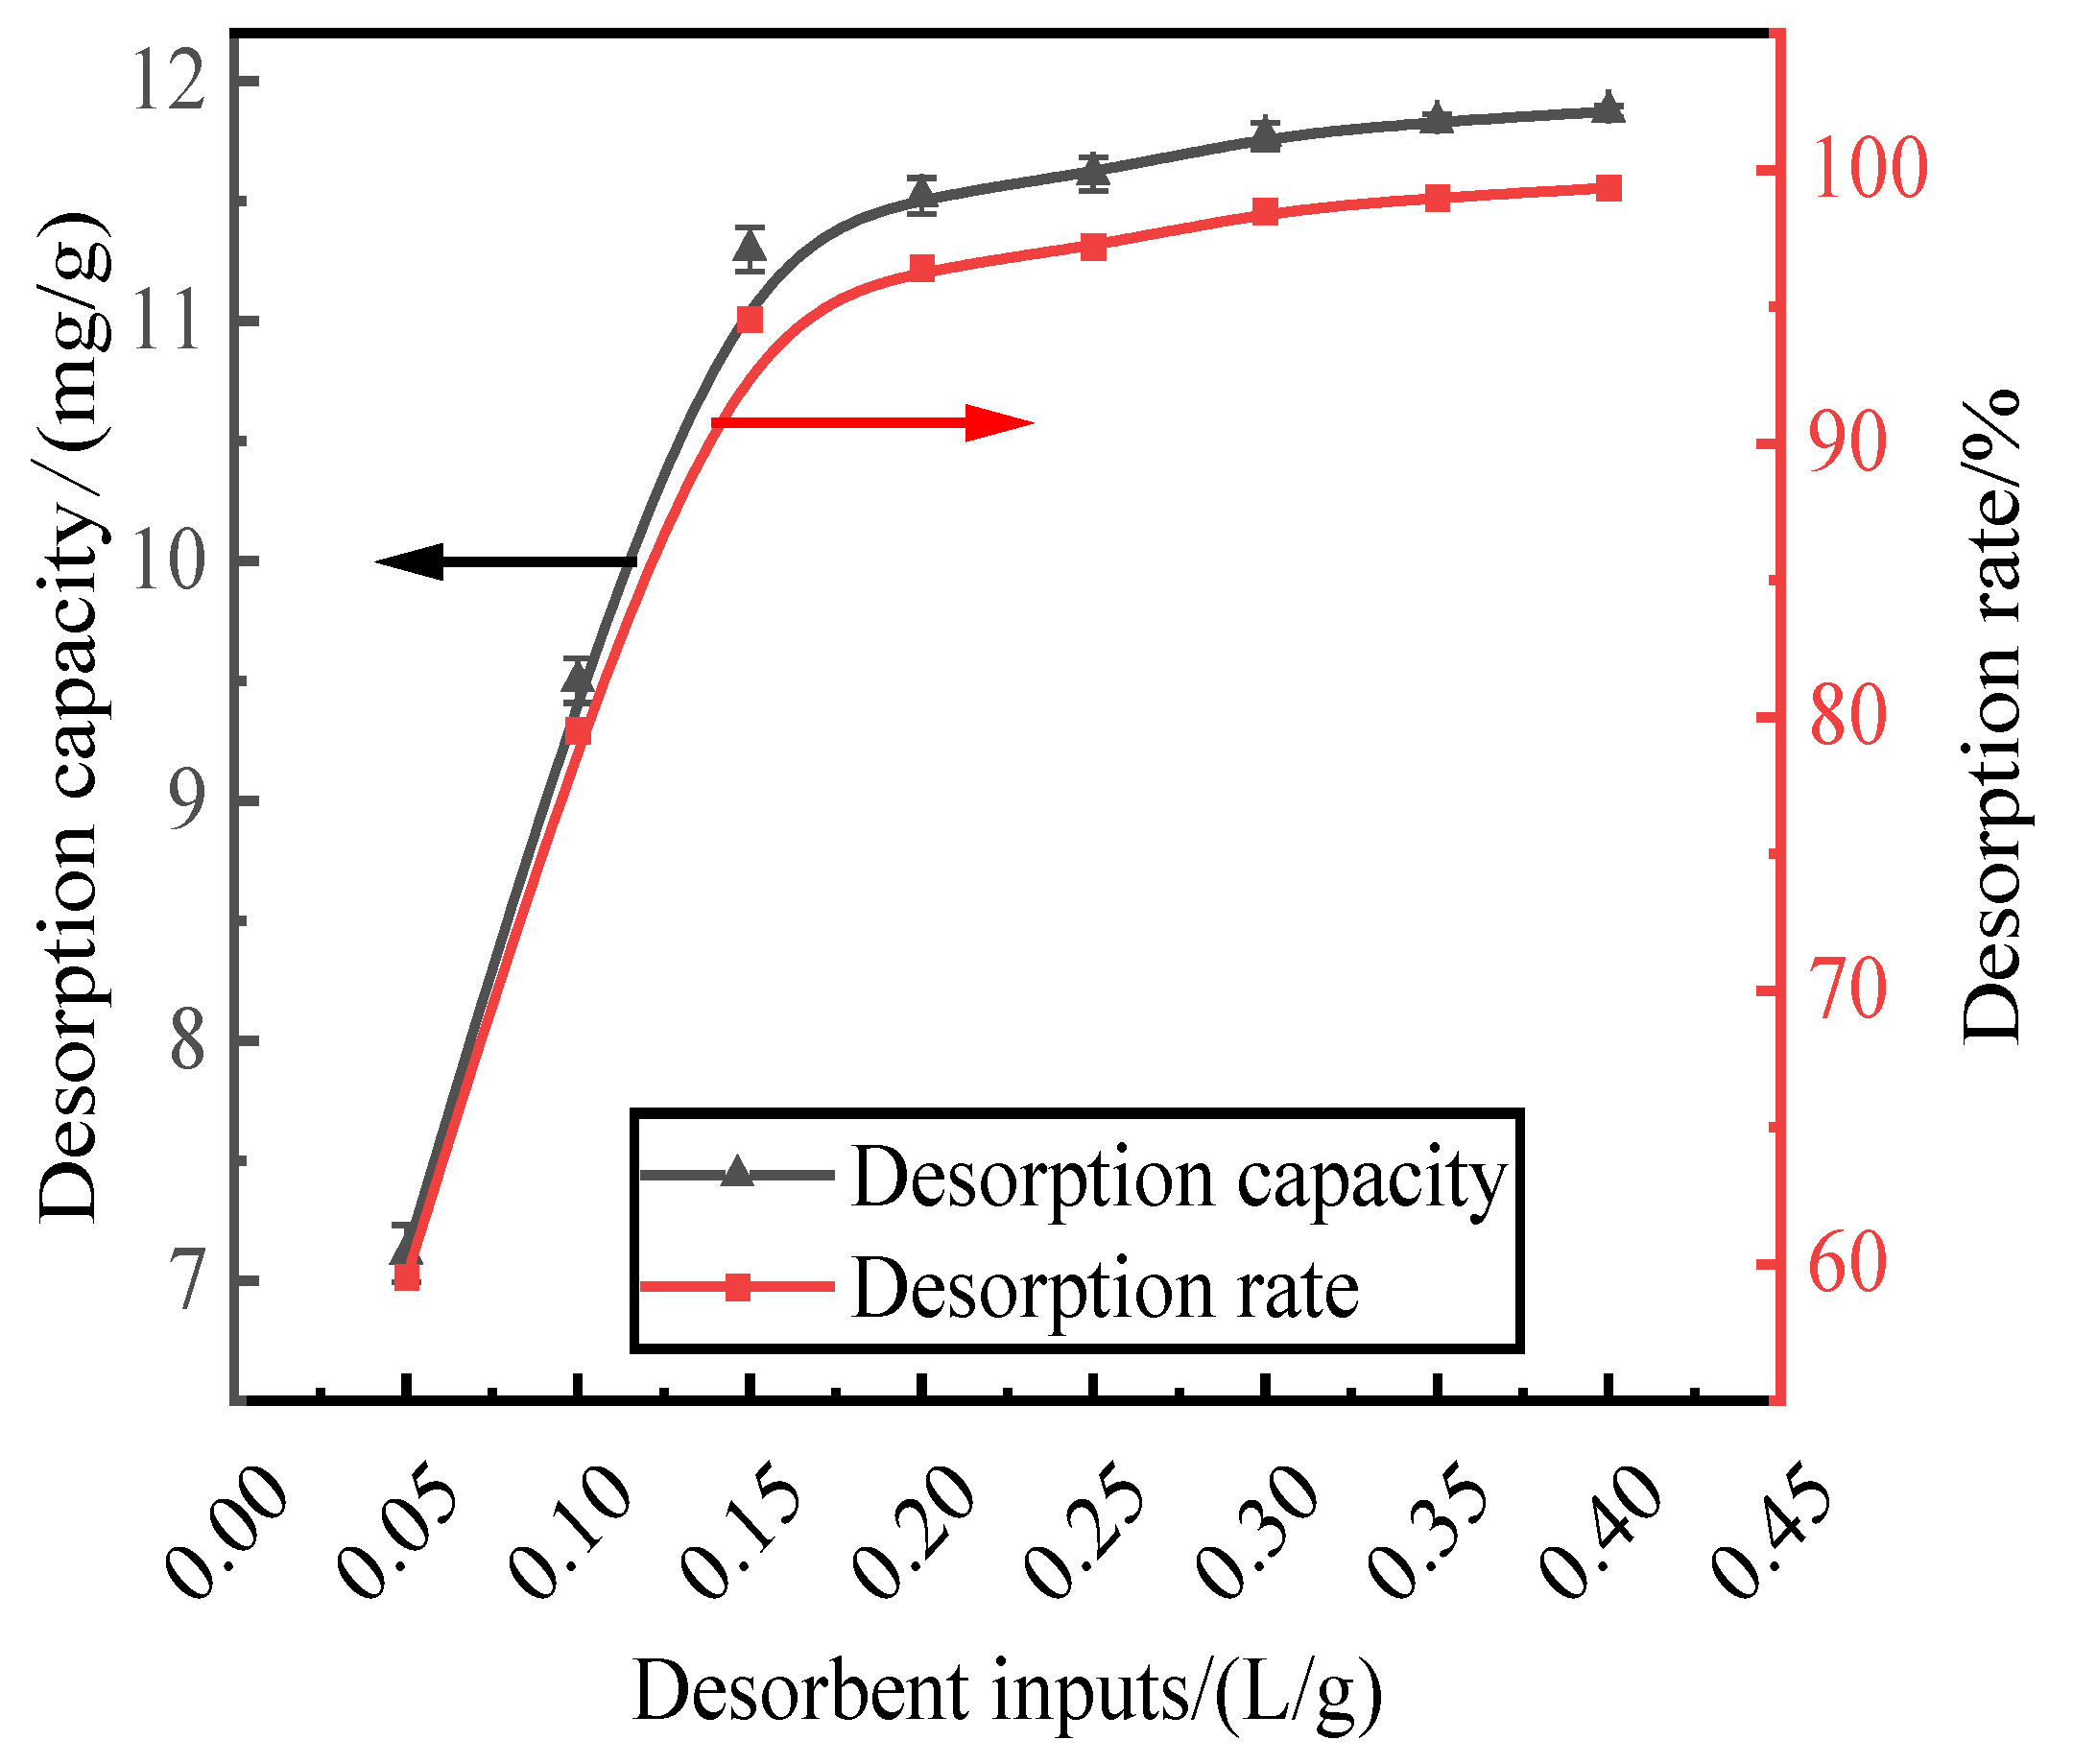
With a HCl desorbent concentration of 0.2 mol/L, phosphorus-containing wastewater at an initial concentration of 300 mg/L was adsorbed by activated red mud adsorbent, which was then dried at 105 °C for 2 h. The liquid-to-solid ratio of the adsorbent were 0.05, 0.1, 0.15, 0.2, 0.25, 0.3, 0.35, and 0.4 L/g, and static desorption was performed at 35 °C for 12 h. The test was performed at the same time in a conical flask with a liquid-to-solid ratio of the adsorbent. The phosphorus concentration in the supernatant of the solution was determined via ICP after the test, and the results were expressed in terms of the amount and rate of phosphorus desorption, as shown in Fig. 3. The desorption rate and amount of desorption of the resorbent leveled off after the liquid–solid ratio exceeds 0.15 L/g. The desorption rate increased to 94.54%, and the desorption amount increased to 11.29 mg/g. The optimum desorbent dosage (0.15 L/g) was used for phosphorous desorption.
Figure 3.
Effect of desorbent input on phosphorus.
Figure 3.
Effect of desorbent input on phosphorus.
3.4. Effect of Initial Adsorption on Phosphorus Desorption
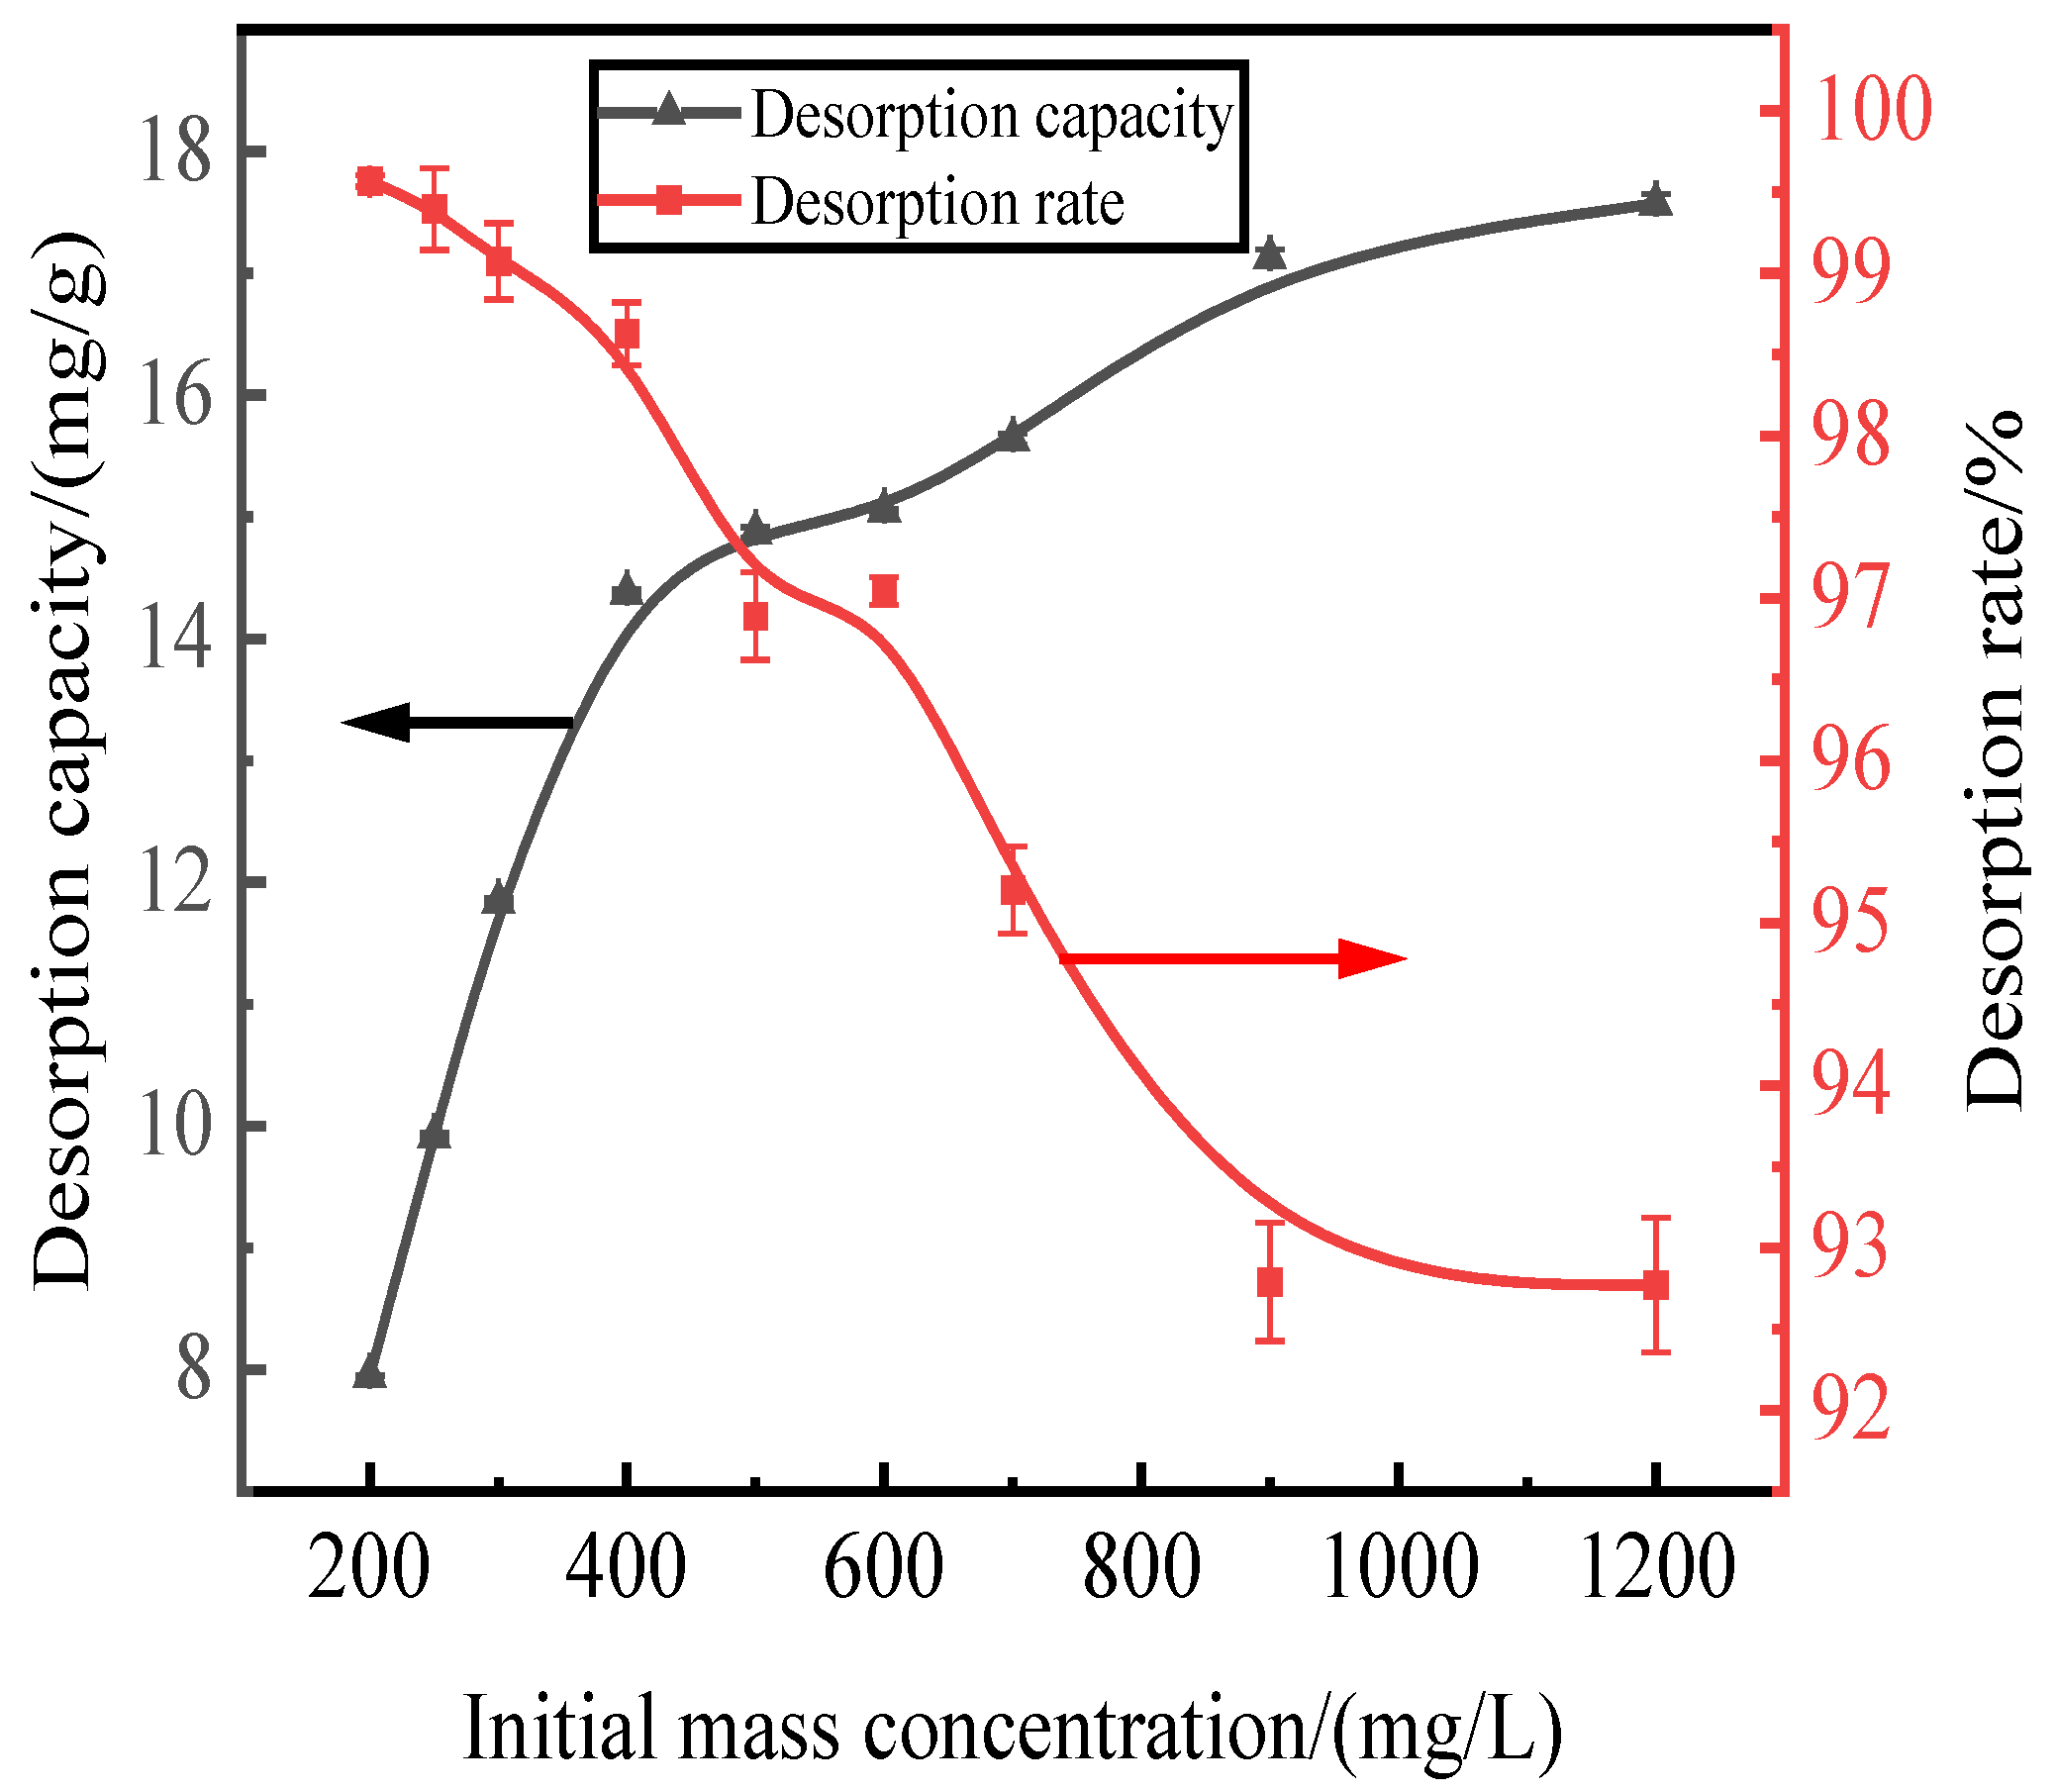
Here, we discuss the adsorption at initial concentrations of 200, 250, 300, 400, 500, 600, 700, 900, and 1200 mg/L of activated red mud adsorbent (105 °C for 2 h) and the static desorption of 0.2 mol/L of HCl desorbent with a desorbent input to the adsorbent with a liquid–solid ratio of 0.15 L/g (35 °C in a conical flask for 12 h). Once the phosphorous concentration in the solution supernatant is determined through ICP, the results are based on the amount of desorbed phosphorus. After the test, the phosphorus concentration in the solution supernatant was determined via ICP; the results were expressed in terms of the amount of phosphorus desorbed and the desorption rate, as shown in Fig. 4. With an increase in the initial phosphorus concentration, the desorption of the desorbent for the phosphorus adsorbed by the adsorbent of the activated hematite particles increased. The phosphorus desorption was 7.98 mg/g for an initial concentration of 200 mg/L, with a desorption rate of 99.57%, which was mainly attributed to the higher adsorption rate. The main reason for this result is that higher adsorption rates drove the desorption of the desorbent to the adsorbent, which increased the number of adsorption sites used on the particle surfaces, leading to better desorption. The desorption rate decreased with an increase in the initial phosphorus concentration, which was consistent with the adsorption process. The particles in Fig.4 show that the desorption rate of phosphorus adsorbed by the adsorbent exceeded 99% when the initial concentration was less than 300 mg/L. Thus, high-efficiency phosphorus removal was realized.
Figure 4.
Effect of initial adsorption on phosphorus desorption.
Figure 4.
Effect of initial adsorption on phosphorus desorption.
3.5. Effect of Reaction Time on Phosphorous Desorption
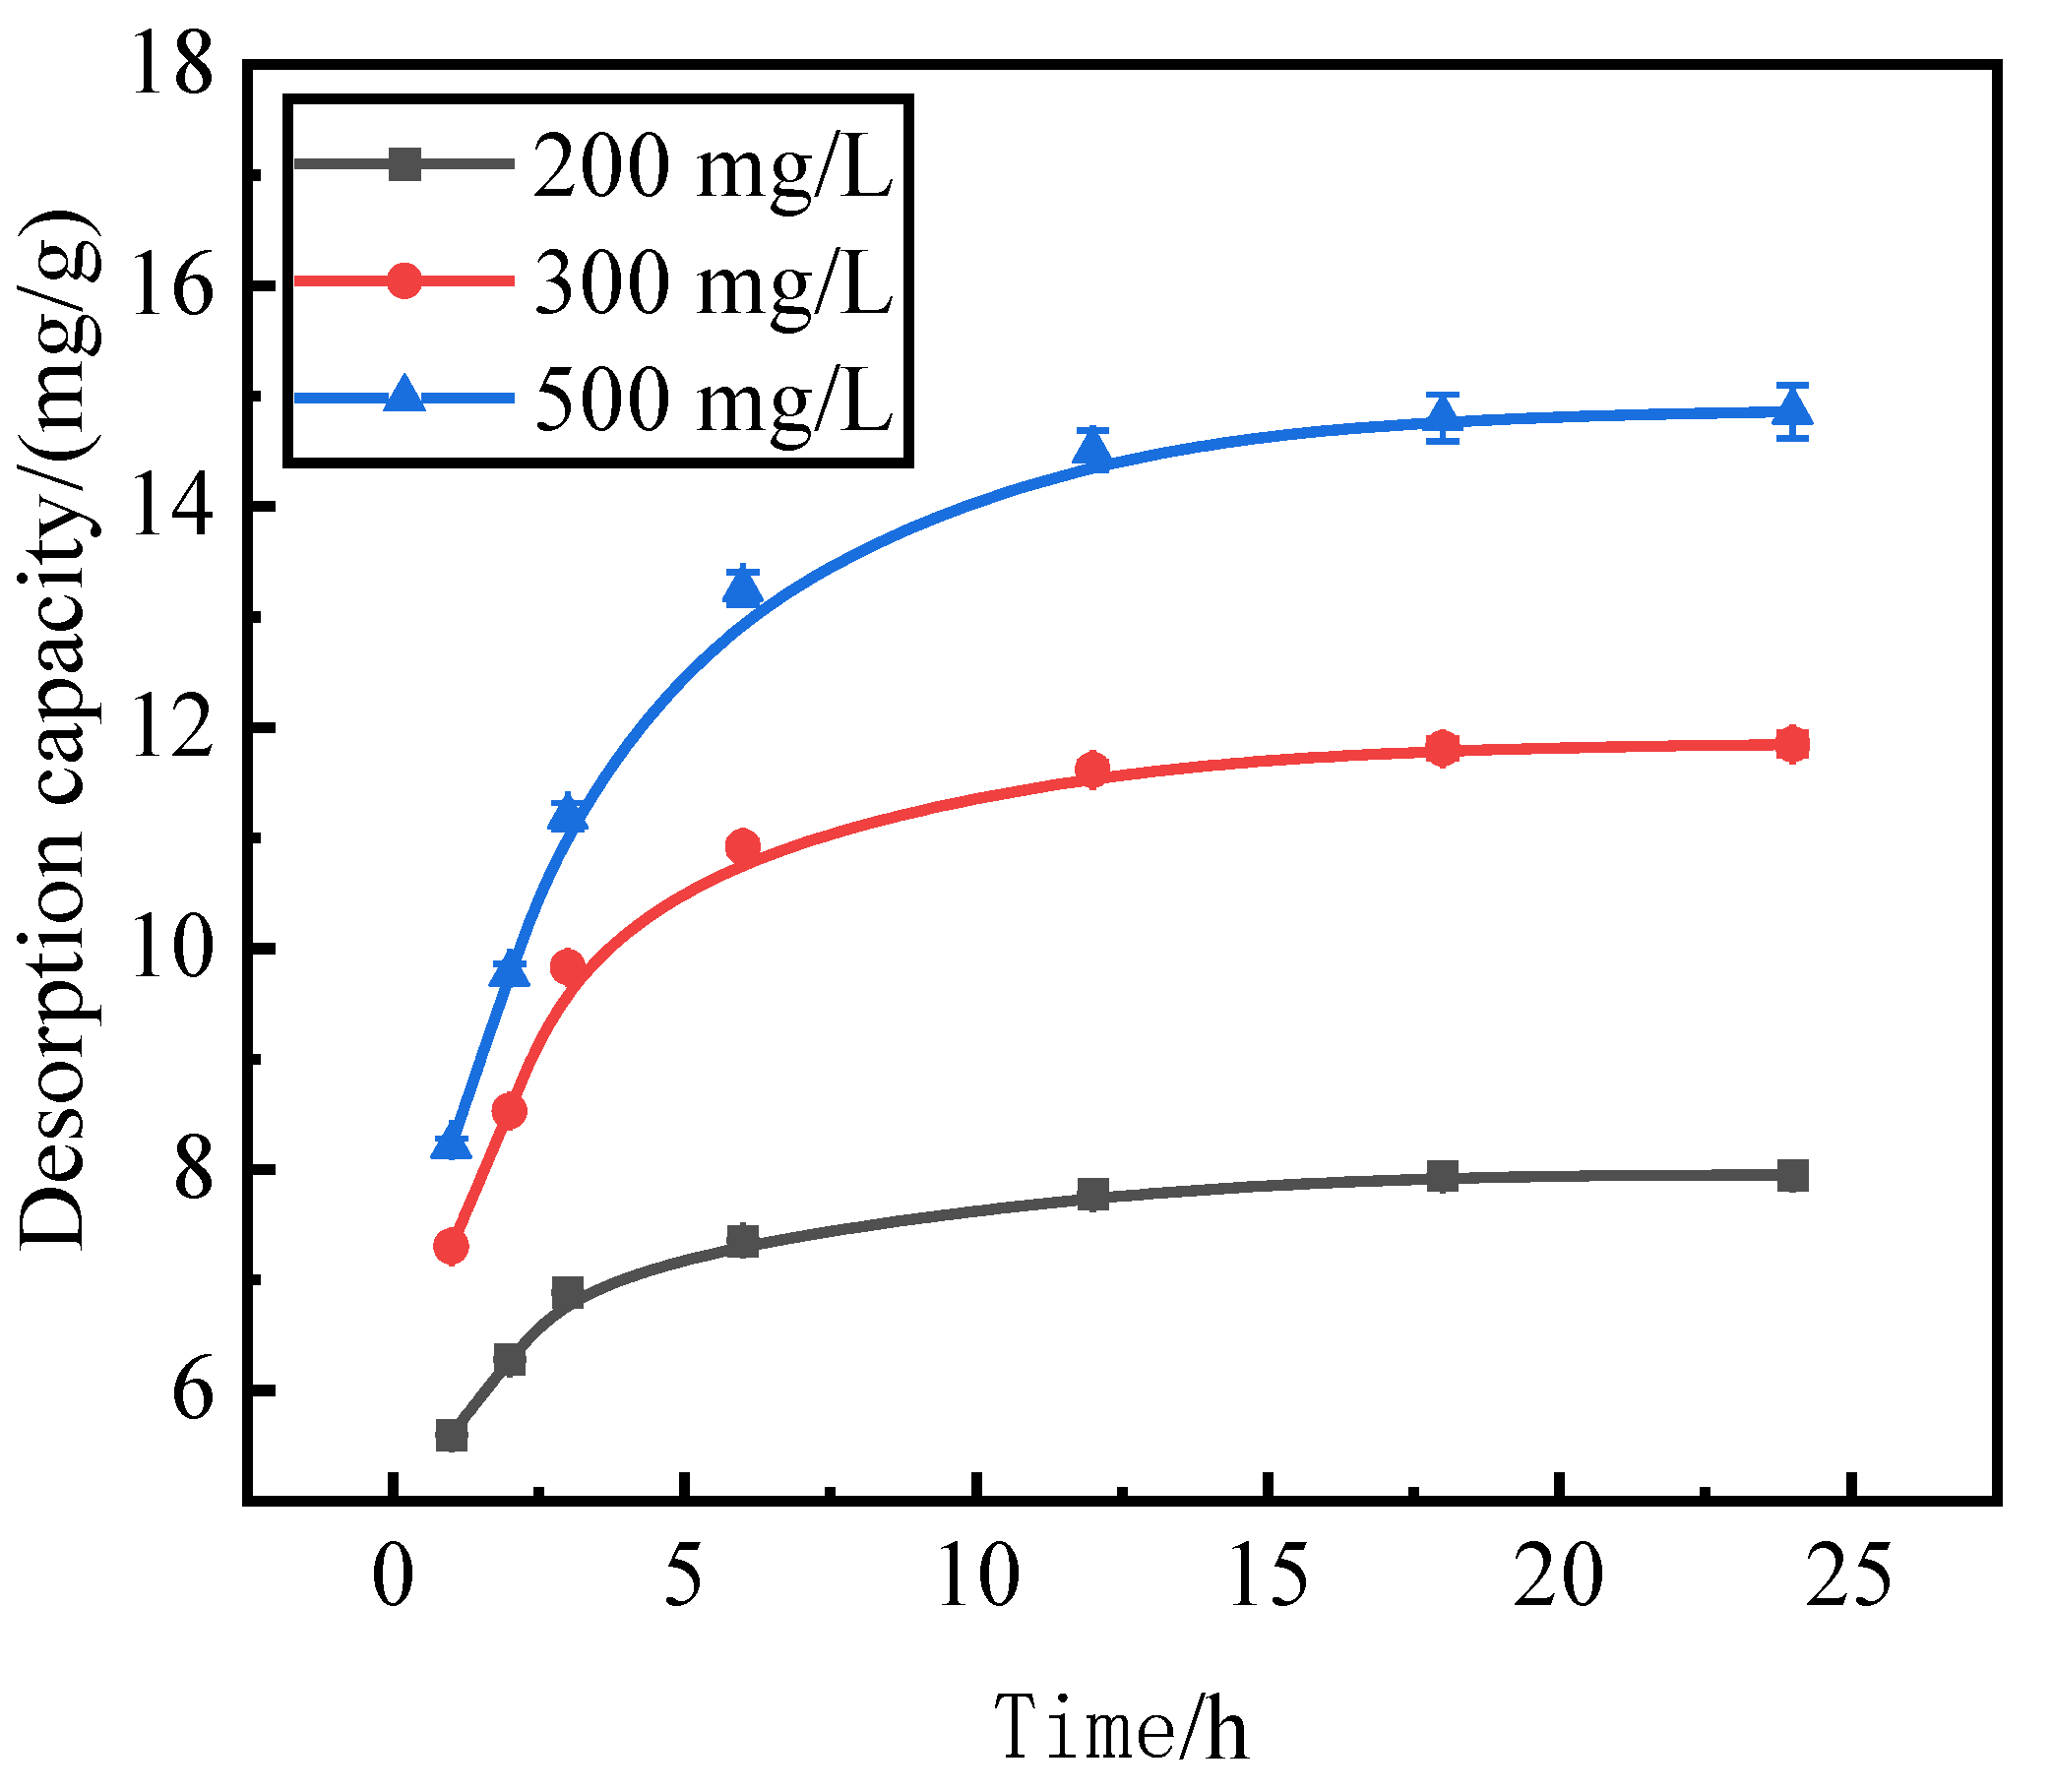
Reaction time is also an important factor affecting the desorption effect of the desorbent on the pollutants. We use activated red mud adsorbent for adsorption at 105 °C (drying for 2 h), a desorbent and adsorbent liquid–solid ratio of 0.15 L/g, and initial concentrations of 200, 300, and 500 mg/L of the desorbent solution at 35 °C in a conical flask for static desorption for 1, 2, 3, 6, 12, 18, and 24 h. The tests were performed via ICP to determine the effect of phosphorus desorption. After each test, the phosphorus concentration in the supernatant of the solution was determined via ICP, with the results expressed in terms of the amount of phosphorus desorbed (Fig. 5).
The trend of the desorption amount of phosphorus adsorbed by the desorbent for the activated red mud adsorbent remained consistent for different initial phosphorus concentrations, and the increase in the desorption amount of the desorbent for an initial solution of 200 mg/L was considerably less than that for the initial solutions of 300 and 500 mg/L for the first 12 h of the reaction. This result is attributable to the lower concentration of phosphorus in the initial phosphorus solution of 200 mg/L, which resulted in less phosphorus adsorbed by the activated red mud adsorbent, which in turn increased the desorption rate. The desorption was lower when phosphorus adsorbed on the adsorbent desorbed after 12 h of reaction under the condition of a low concentration.
Figure 5.
Phosphorus desorption capacity as a.
Figure 5.
Phosphorus desorption capacity as a.
3.6. Effect of Reaction Temperature on Phosphorous Desorption
Reaction temperature is also an important factor affecting the desorption effect of the desorbent on pollutants.
Figure 6 shows the results in terms of the phosphorus desorption rate. The desorption rate and the amount of desorbent desorbed for a liquid–solid ratio of 0.15 L/g, the initial concentration of 300 mg/L of 150 mL of desorbent solution at 15 °C, 20 °C, 25 °C, 30 °C, 35 °C for static desorption, static desorption in a conical flask for 12 h, the test by the ICP to determine the concentration of phosphorus in the solution supernatant. The phosphorus desorption rate increased with increasing reaction temperature. At 35 °C, the phosphorus desorption rate was 99.11%, and the desorption rate stabilized above 25 °C, indicating that the desorption process was heat absorbing. The increase in temperature accelerated the intermolecular thermal motion and the diffusion of phosphorus.
Figure 6.
Phosphorous desorption rate as a function of time.
Figure 6.
Phosphorous desorption rate as a function of time.
3.7. Desorption Isotherm
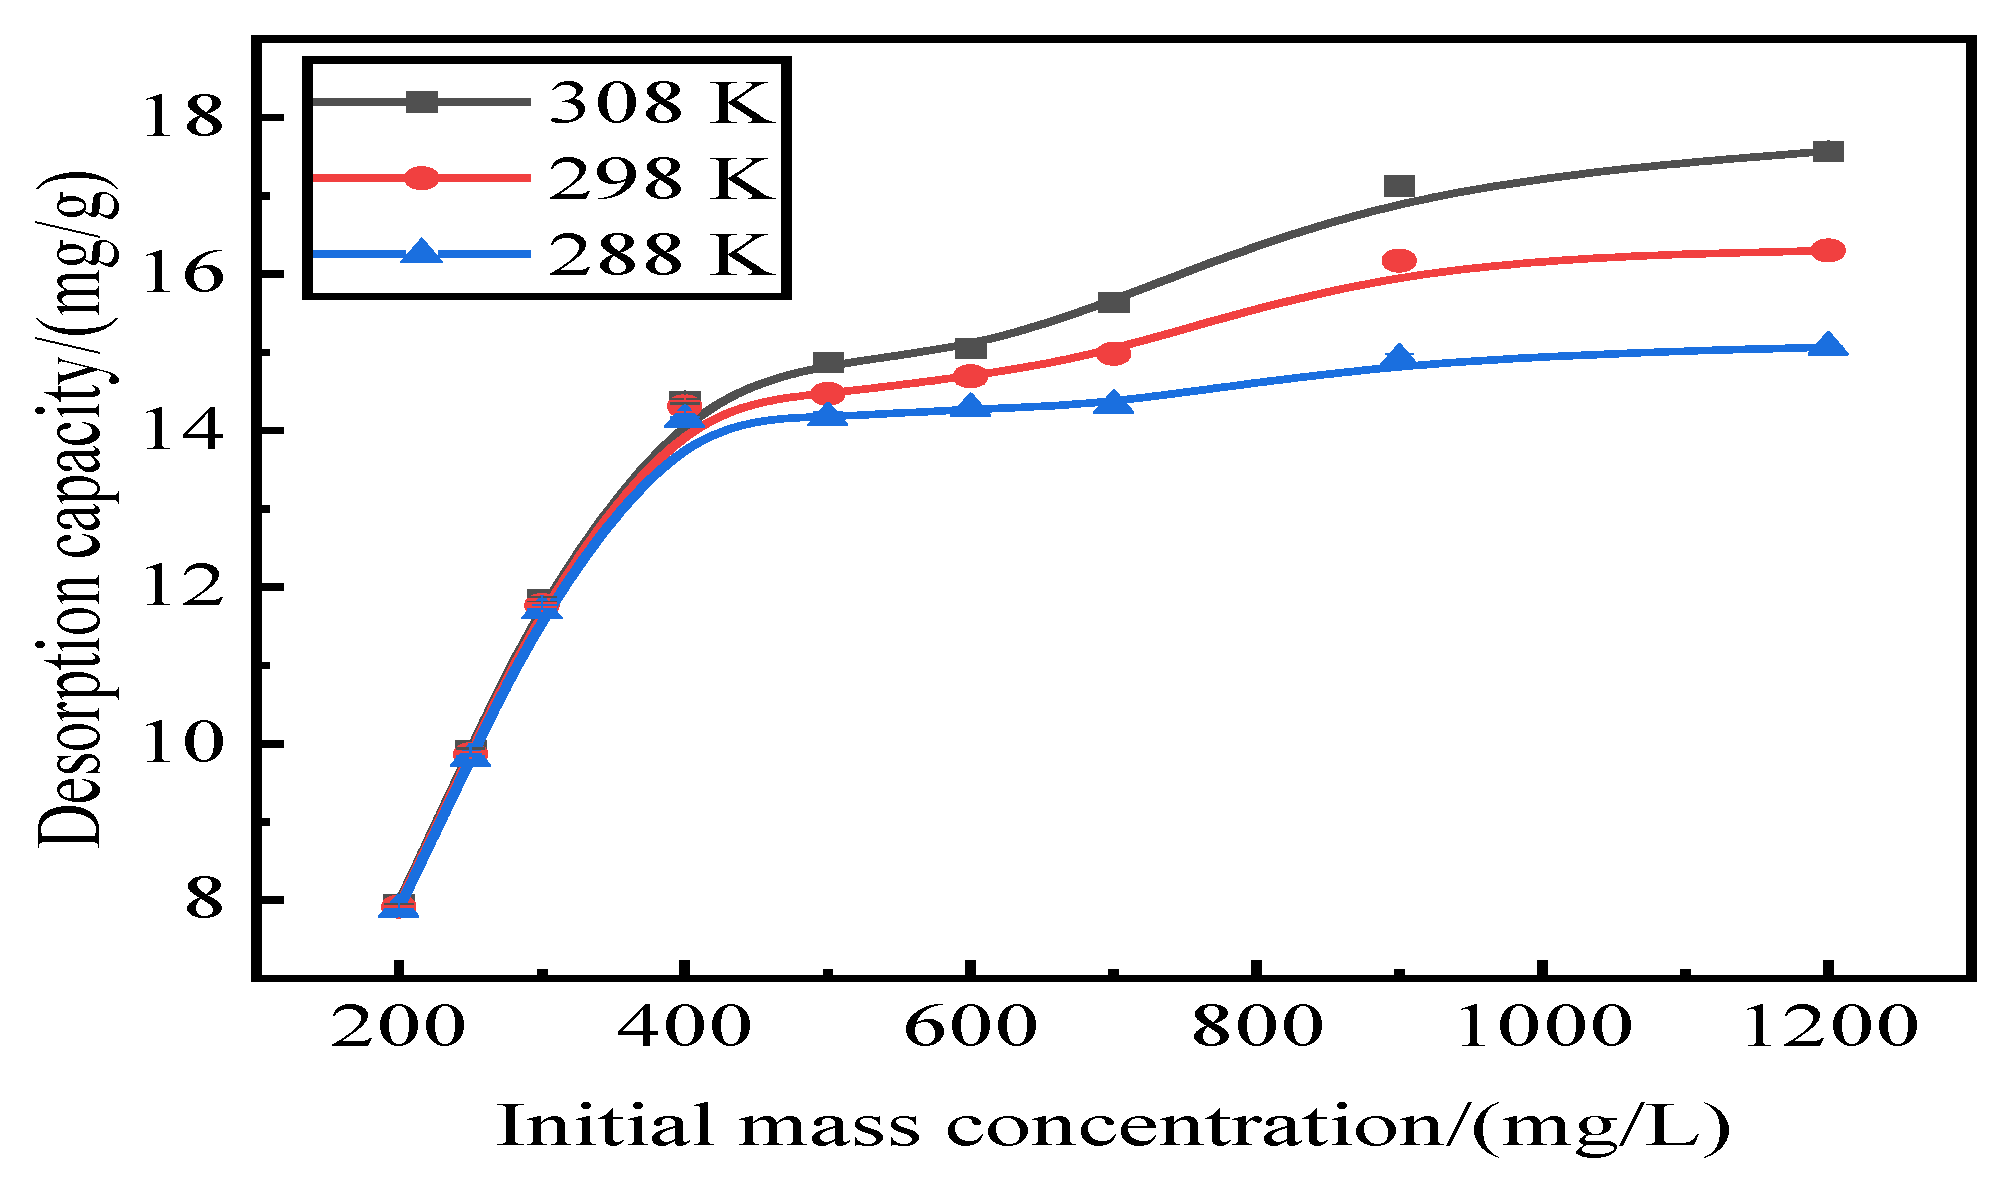
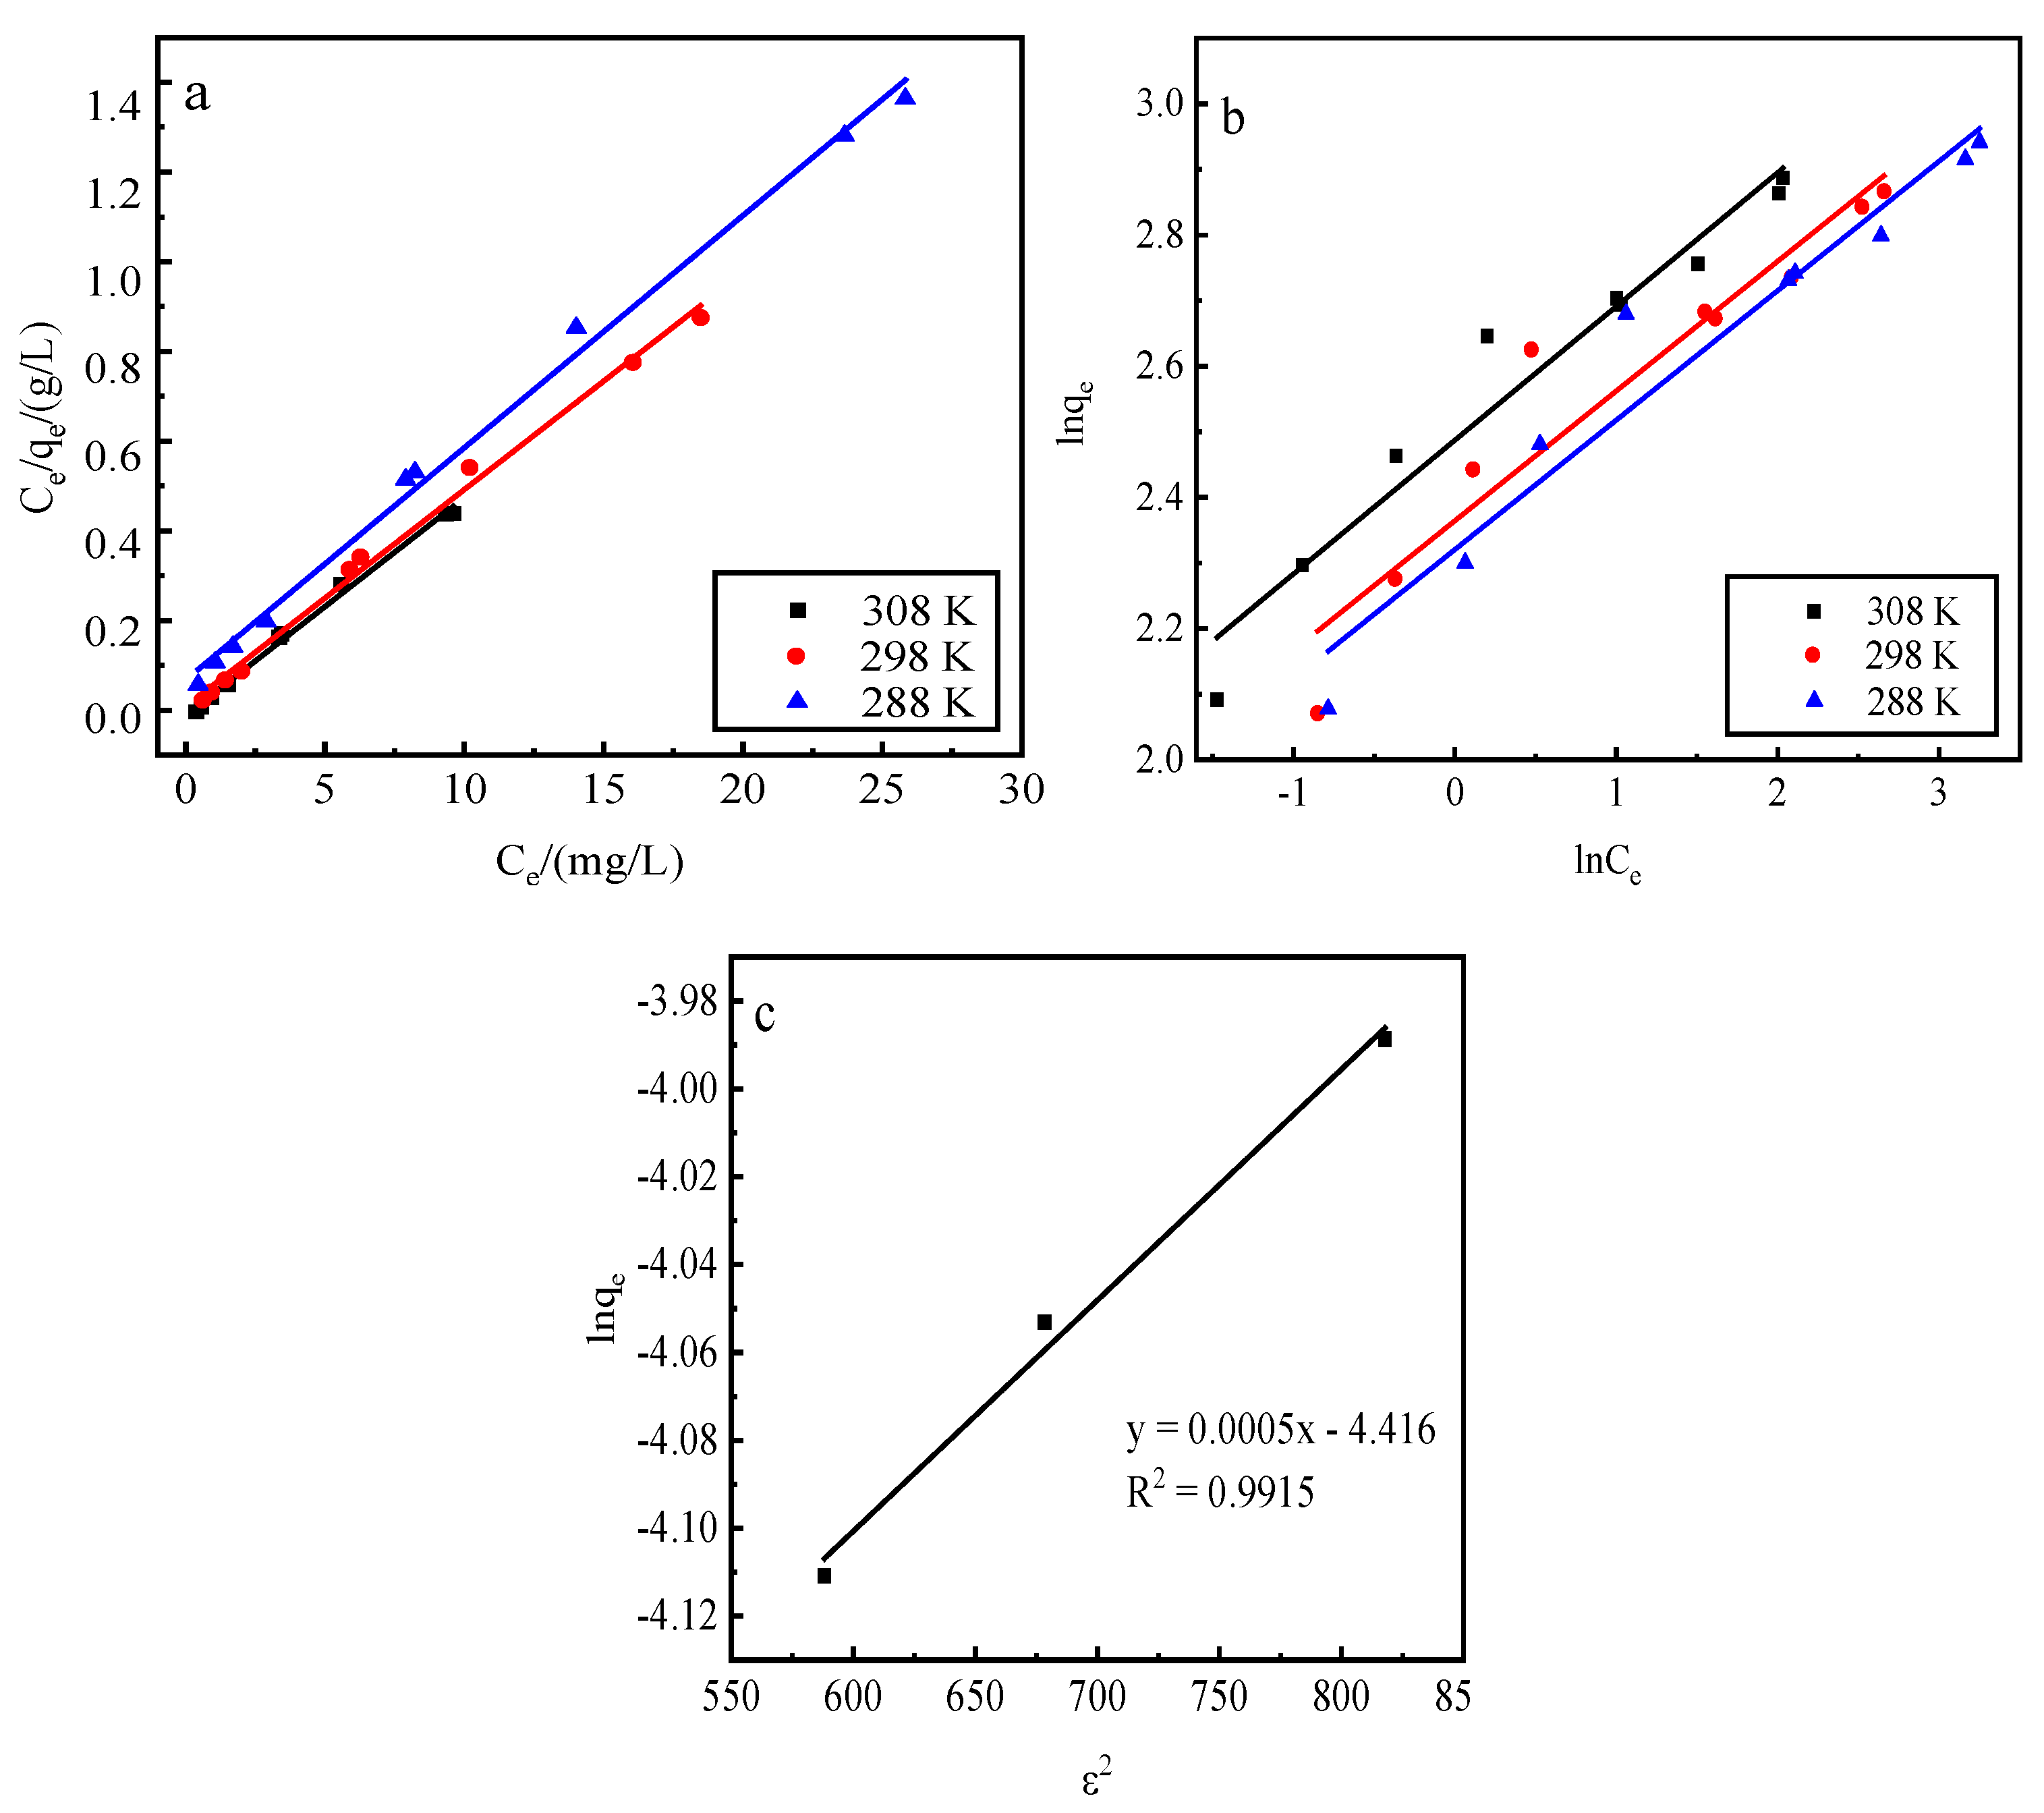
Adsorption by activated red mud adsorbent for initial concentrations of 200, 250, 300, 400, 500, 600, 700, 900, and 1200 mg/L, adsorption after drying at 105 °C for 2 h, desorption of 0.2 mol/L of HCl desorbent, desorbent input to the solid–liquid ratio of adsorbent is 0.15 L/g, and constant temperatures of 15 °C, 25 °C, and 35 °C. Static desorption was performed in a conical flask for 18 h. The desorption effect of the desorbent on phosphorus was investigated at different ambient temperatures, with the results expressed as the desorption rate of phosphorus (Fig. 7). The experimental results are fit with Langmuir and Freundlich isotherms and a D–R model, and the results of the fits are shown in Fig. 8 and
Table 1. The Freundlich model explains the desorption of multimolecular layers on the surface, and the Langmuir model describes the homogeneous desorption reaction, wherein pollutants are desorbed as a monomolecular layer with homogeneous active sites on the surface of the desorbent [
31].
Figure 7.
Effect of reaction temperature on phosphate desorption.
Figure 7.
Effect of reaction temperature on phosphate desorption.
Figure 8.
Fits of three desorption isotherm models. a: Langmuir model, b: Freundlich model, c: D–R model.
Figure 8.
Fits of three desorption isotherm models. a: Langmuir model, b: Freundlich model, c: D–R model.
Table 1.
Desorption isotherm parameters.
Table 1.
Desorption isotherm parameters.
| Desorption isotherm |
Const |
| 308 K |
298 K |
288 K |
| Langmuir |
R = 0.9947
a (mg/g) = 19.4175
b (L/mg) = 1.8392 |
R = 0.9946
a (mg/g) = 19.3798
b (L/mg) = 1.0639 |
R = 0.9950
a (mg/g) = 19.3050
b (L/mg) = 0.7674 |
Freundlich
D–R
|
R = 0.9400
N = 4.7393
KF (mg1−n/g Ln) = 12.0637
R = 0.9916
qm (mmol/L) = 0.03255
k (mol2/kJ2) = 0.0005
E (kJ/mol) = −31.6228 |
R = 0.9118
n = 4.8852
KF/(mg1−n/g Ln) = 10.8038
|
R = 0.9438
n = 5.0684
KF/(mg1−n/g Ln) = 10.1808
|
The desorption is mainly affected by the Langmuir isothermal adsorption model, indicating that there is a monomolecular layer desorption of phosphorus on the surface of the adsorbent of red mud particles activated by HCl. The average adsorption free energy |E| obtained using the D–R model is 31.62 kJ/mol, which exceeds 16 kJ/mol, indicating that the desorption is chemical.
3.8. Desorption Kinetics
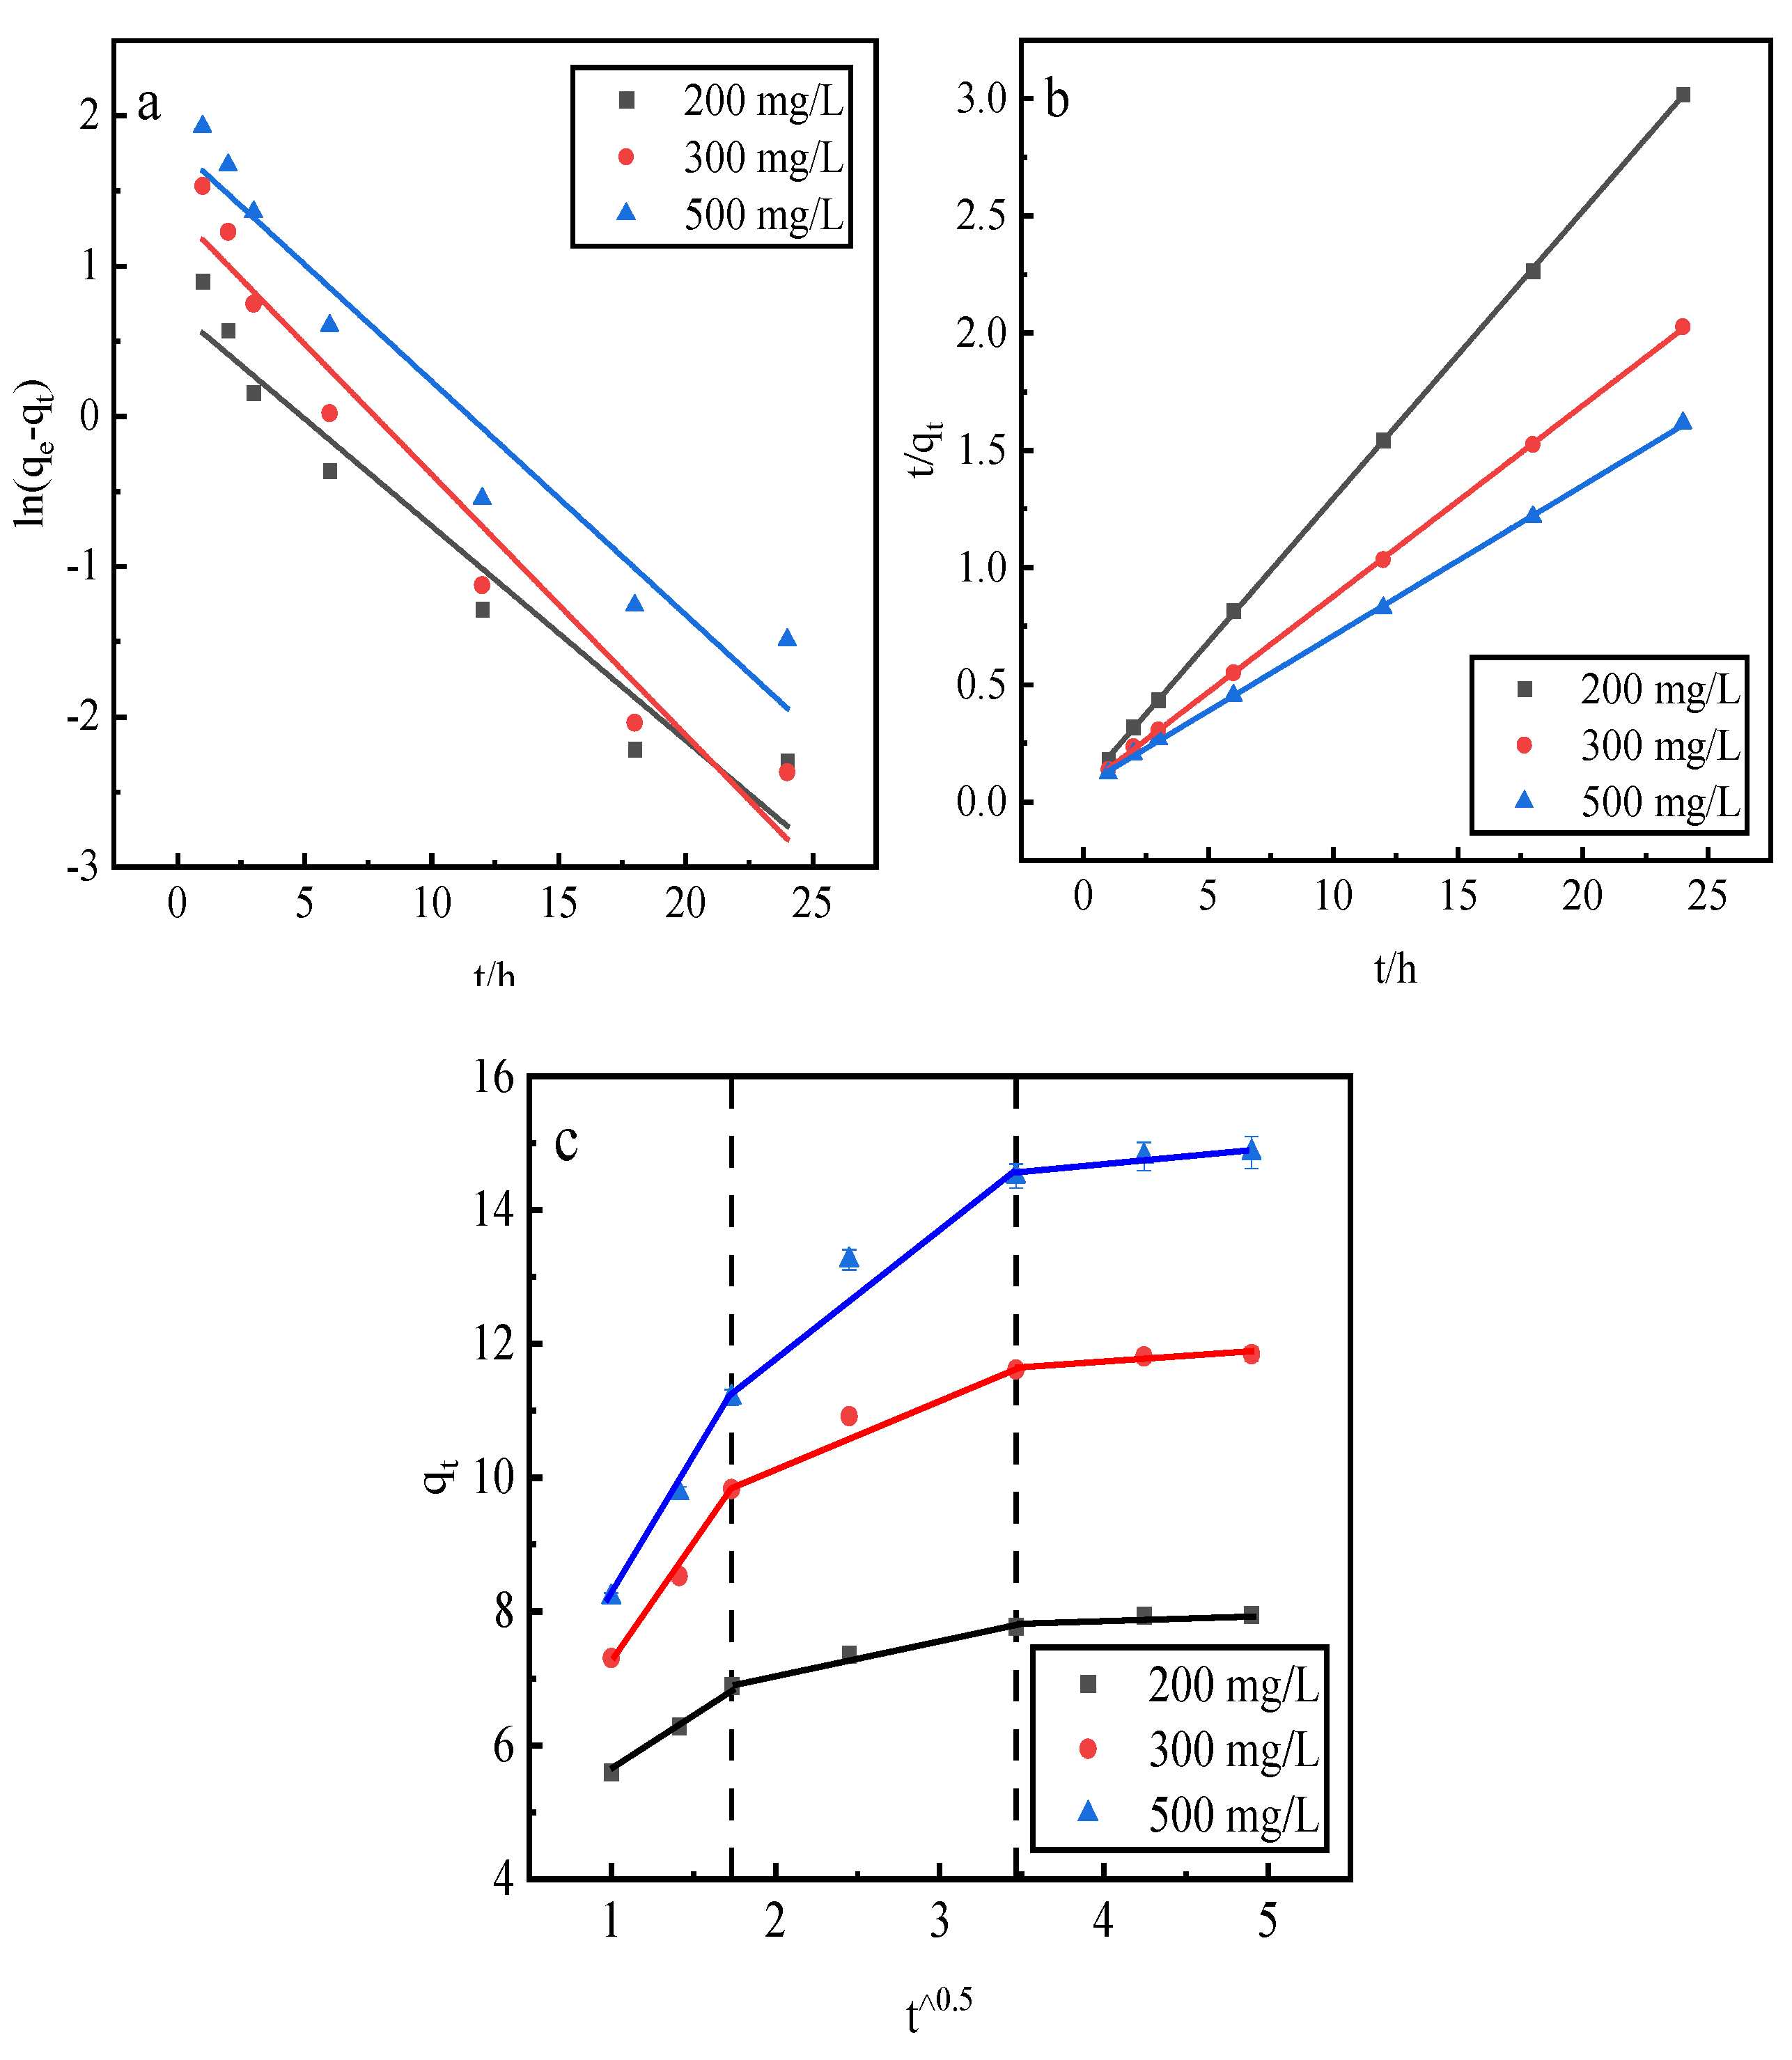
This study uses a pseudo-first-order kinetic linear model, a pseudo-second-order kinetic linear model, and an intraparticle diffusion model to fit the phosphorus kinetic properties of adsorption by the desorbent desorption of activated red mud adsorbent . The adsorption of activated red mud adsorbent with different initial concentrations of 200, 300, and 500 mg/L was dried at 105 °C for 2 h after adsorption. The desorbent was 0.2-mol/L HCl, and the solid–liquid ratio of the desorbent input to the adsorbent was 0.15 L/g. Static desorption was conducted at a constant temperature of 35 °C in conical flasks for 1, 2, 3, 6, 12, 18, and 24 h. The fitting results are given in Fig. 9 and
Table 2.
The correlation coefficients, R2, of the pseudo-second-order kinetic model were better than those of the pseudo-first-order kinetic model, and the theoretical equilibrium detachment amounts were 15.073 mg/g at a concentration of 500 mg/L, 11.898 mg/g at a concentration of 300 mg/L, and 8.102 mg/g at a concentration of 200 mg/L. The theoretical equilibrium detachment amounts obtained are close to the experimental result qe, which indicates that chemical detachment limits its rate. The calculated qe is greater than the actual desorption maximum, which is also related to precipitation from the chemical reaction on the red mud surface. According to the intraparticle diffusion model, three main stages are fit: the first stage is the initial stage, i.e., the rapid desorption stage, which is primarily manifested in the chemical precipitation of metal ions and phosphorus and the reaction occurring in the desorption agent. The second stage is slower, mainly through the activation of the well-developed pore structure of the red mud to perform the desorption. The third stage of the slowest desorption process is gradually transformed to relative equilibrium. Because the internal diffusion curve of the particles does not pass through the origin of the coordinates, the larger the concentration of the solution, the farther the curve deviates from the origin, which indicates that internal diffusion is not the main mechanism of phosphorus desorption. Rather, desorption is dominated by the chemical reaction removal of phosphorus in the form of precipitation on the adsorbent surface of activated red mud particles.
Figure 9.
Fits of three desorption kinetic models. (a) Pseudo-first-order model. (b) Pseudo-second-order model. (c) Intraparticle diffusion model.
Figure 9.
Fits of three desorption kinetic models. (a) Pseudo-first-order model. (b) Pseudo-second-order model. (c) Intraparticle diffusion model.
Table 2.
Desorption kinetic parameters.
Table 2.
Desorption kinetic parameters.
| Adsorption kinetics |
Constant |
500 mg/L |
300 mg/L |
200 mg/L |
| Pseudo-first-order dynamic linear model |
qe (mg/g)
k1 (1/h)
R2
|
5.9817
0.1554
0.9438 |
3.8551
0.1734
0.9537 |
2.0100
0.1427
0.9433 |
| Pseudo-second-order dynamical linear model |
qe (mg/g)
k2 (1/h)
R2
|
15.5763
0.0613
0.9998 |
12.2549
0.1102
0.9999 |
8.1499
0.2221
0.9999 |
| Intraparticle diffusion model |
Phase I
Phase II
Phase III |
ki (mg/g h1/2) = 3.9826
C (mg/g) = 4.2189
R2 = 0.9978
ki (mg/g·h1/2) = 1.9701
C (mg/g) = 7.9605
R2 = 0.9462
ki (mg/g·h1/2) = 0.2629
C (mg/g) = 13.6168
R2 = 0.9138 |
ki (mg/g h1/2) = 1.7320
C (mg/g) = 3.8600
R2 = 0.9984
ki (mg/g·h1/2) = 0.5040
C (mg/g) = 6.0442
R2 = 0.9889
ki (mg/g·h1/2) = 0.1053
C (mg/g) = 7.4382
R2 = 0.8535 |
ki (mg/g·h1/2) = 3.2657
C (mg/g) = 4.0257
R2 = 0.9929
ki (mg/g·h1/2) = 1.0750
C (mg/g) = 8.0460
R2 = 0.9525
ki (mg/g h1/2) = 0.1749
C (mg/g) = 11.0230
R2 = 0.9120 |
3.9. Surface Morphology Analysis after Desorption
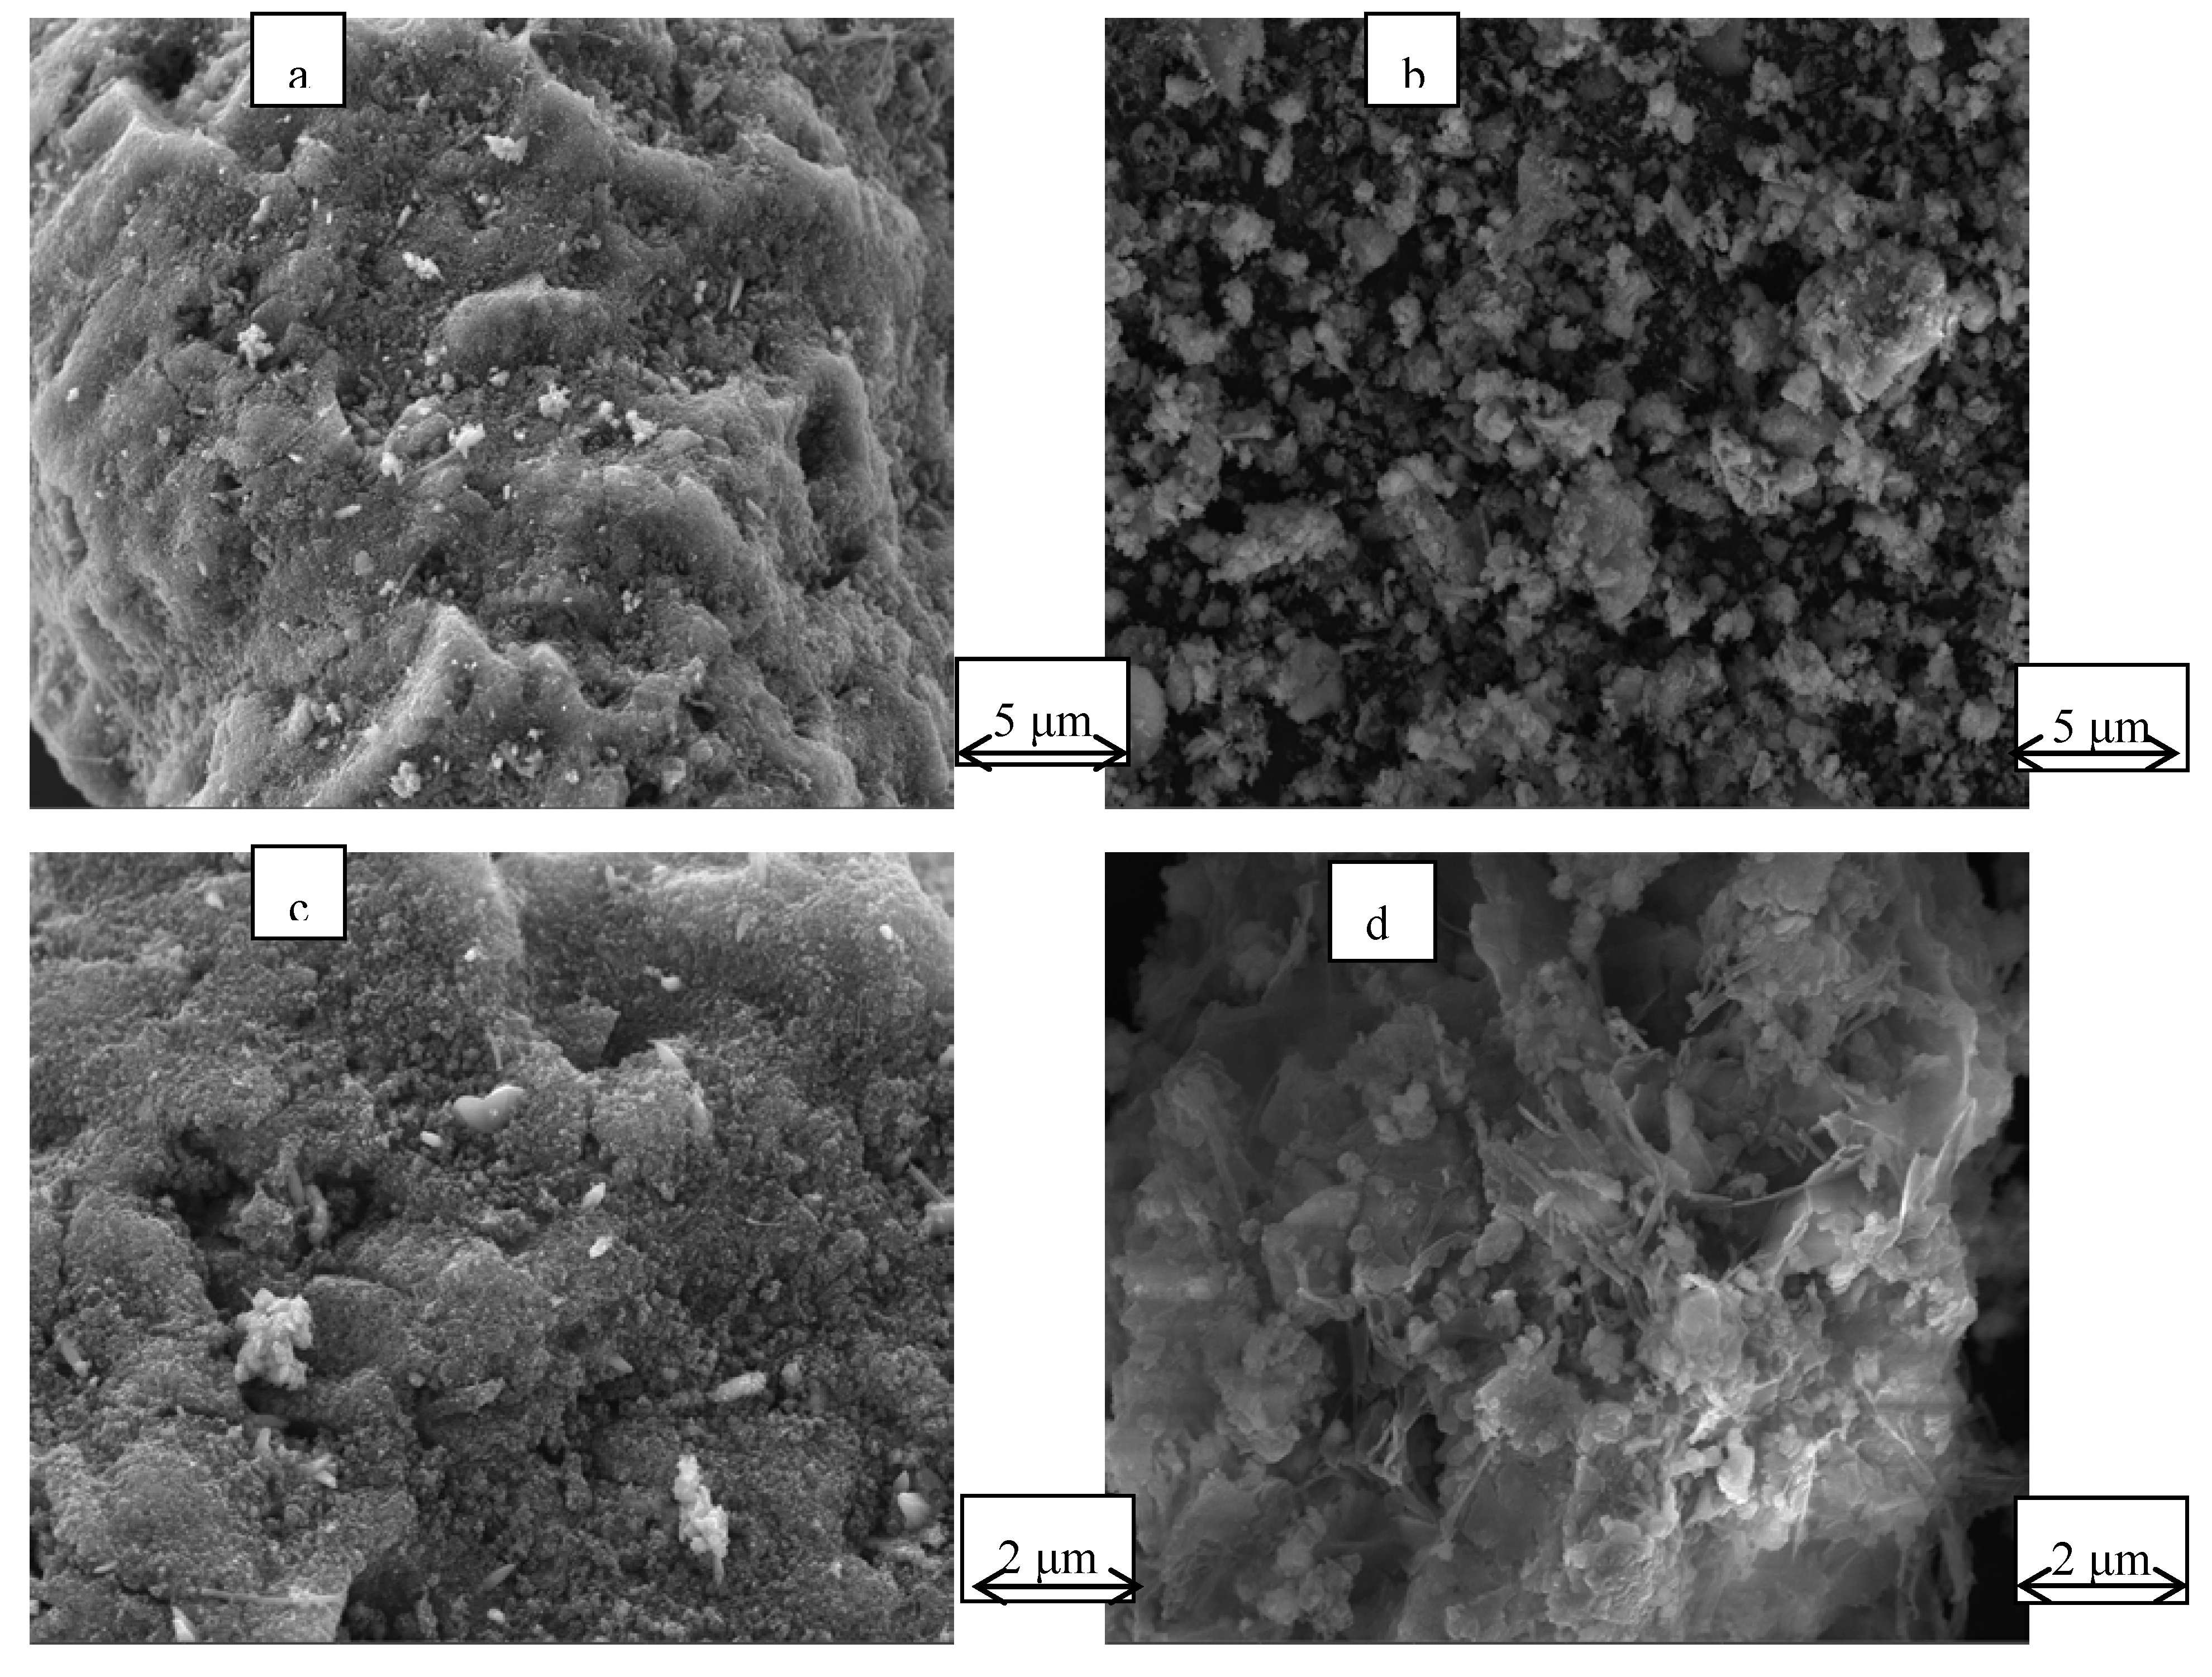
Scanning electron microscopy (SEM) was used to image the surface morphology of the activated terracotta particle adsorbent before (Fig. 10(a)) and after (Fig. 10(b)) desorption and the surface morphology of the activated terracotta particle adsorbent before (Fig. 10(c)) and after (Fig. 10(d)) desorption at 25 000× magnification. The pores on the surface of the activated red mud adsorbent before desorption are covered by precipitate, showing crystallization, multilayer adsorption on the surface of the activated red mud adsorbent, and precipitation products covering the surface of the material. The surface of the adsorbent after desorption of the red mud adsorbent revealed notable corrosion after the destruction of the particle structure. To a certain extent, due to the acid making the particles sparse in the pores, the effective points inside the particle pores were exposed.
Figure 10(c) and
Figure 10(d) show that the surface after desorption by the desorbent has a laminated structure, which indicates surface disintegration, meaning that the desorption of phosphorus is primarily caused by the particles disintegrating easily under the strong acid conditions of the desorbent.
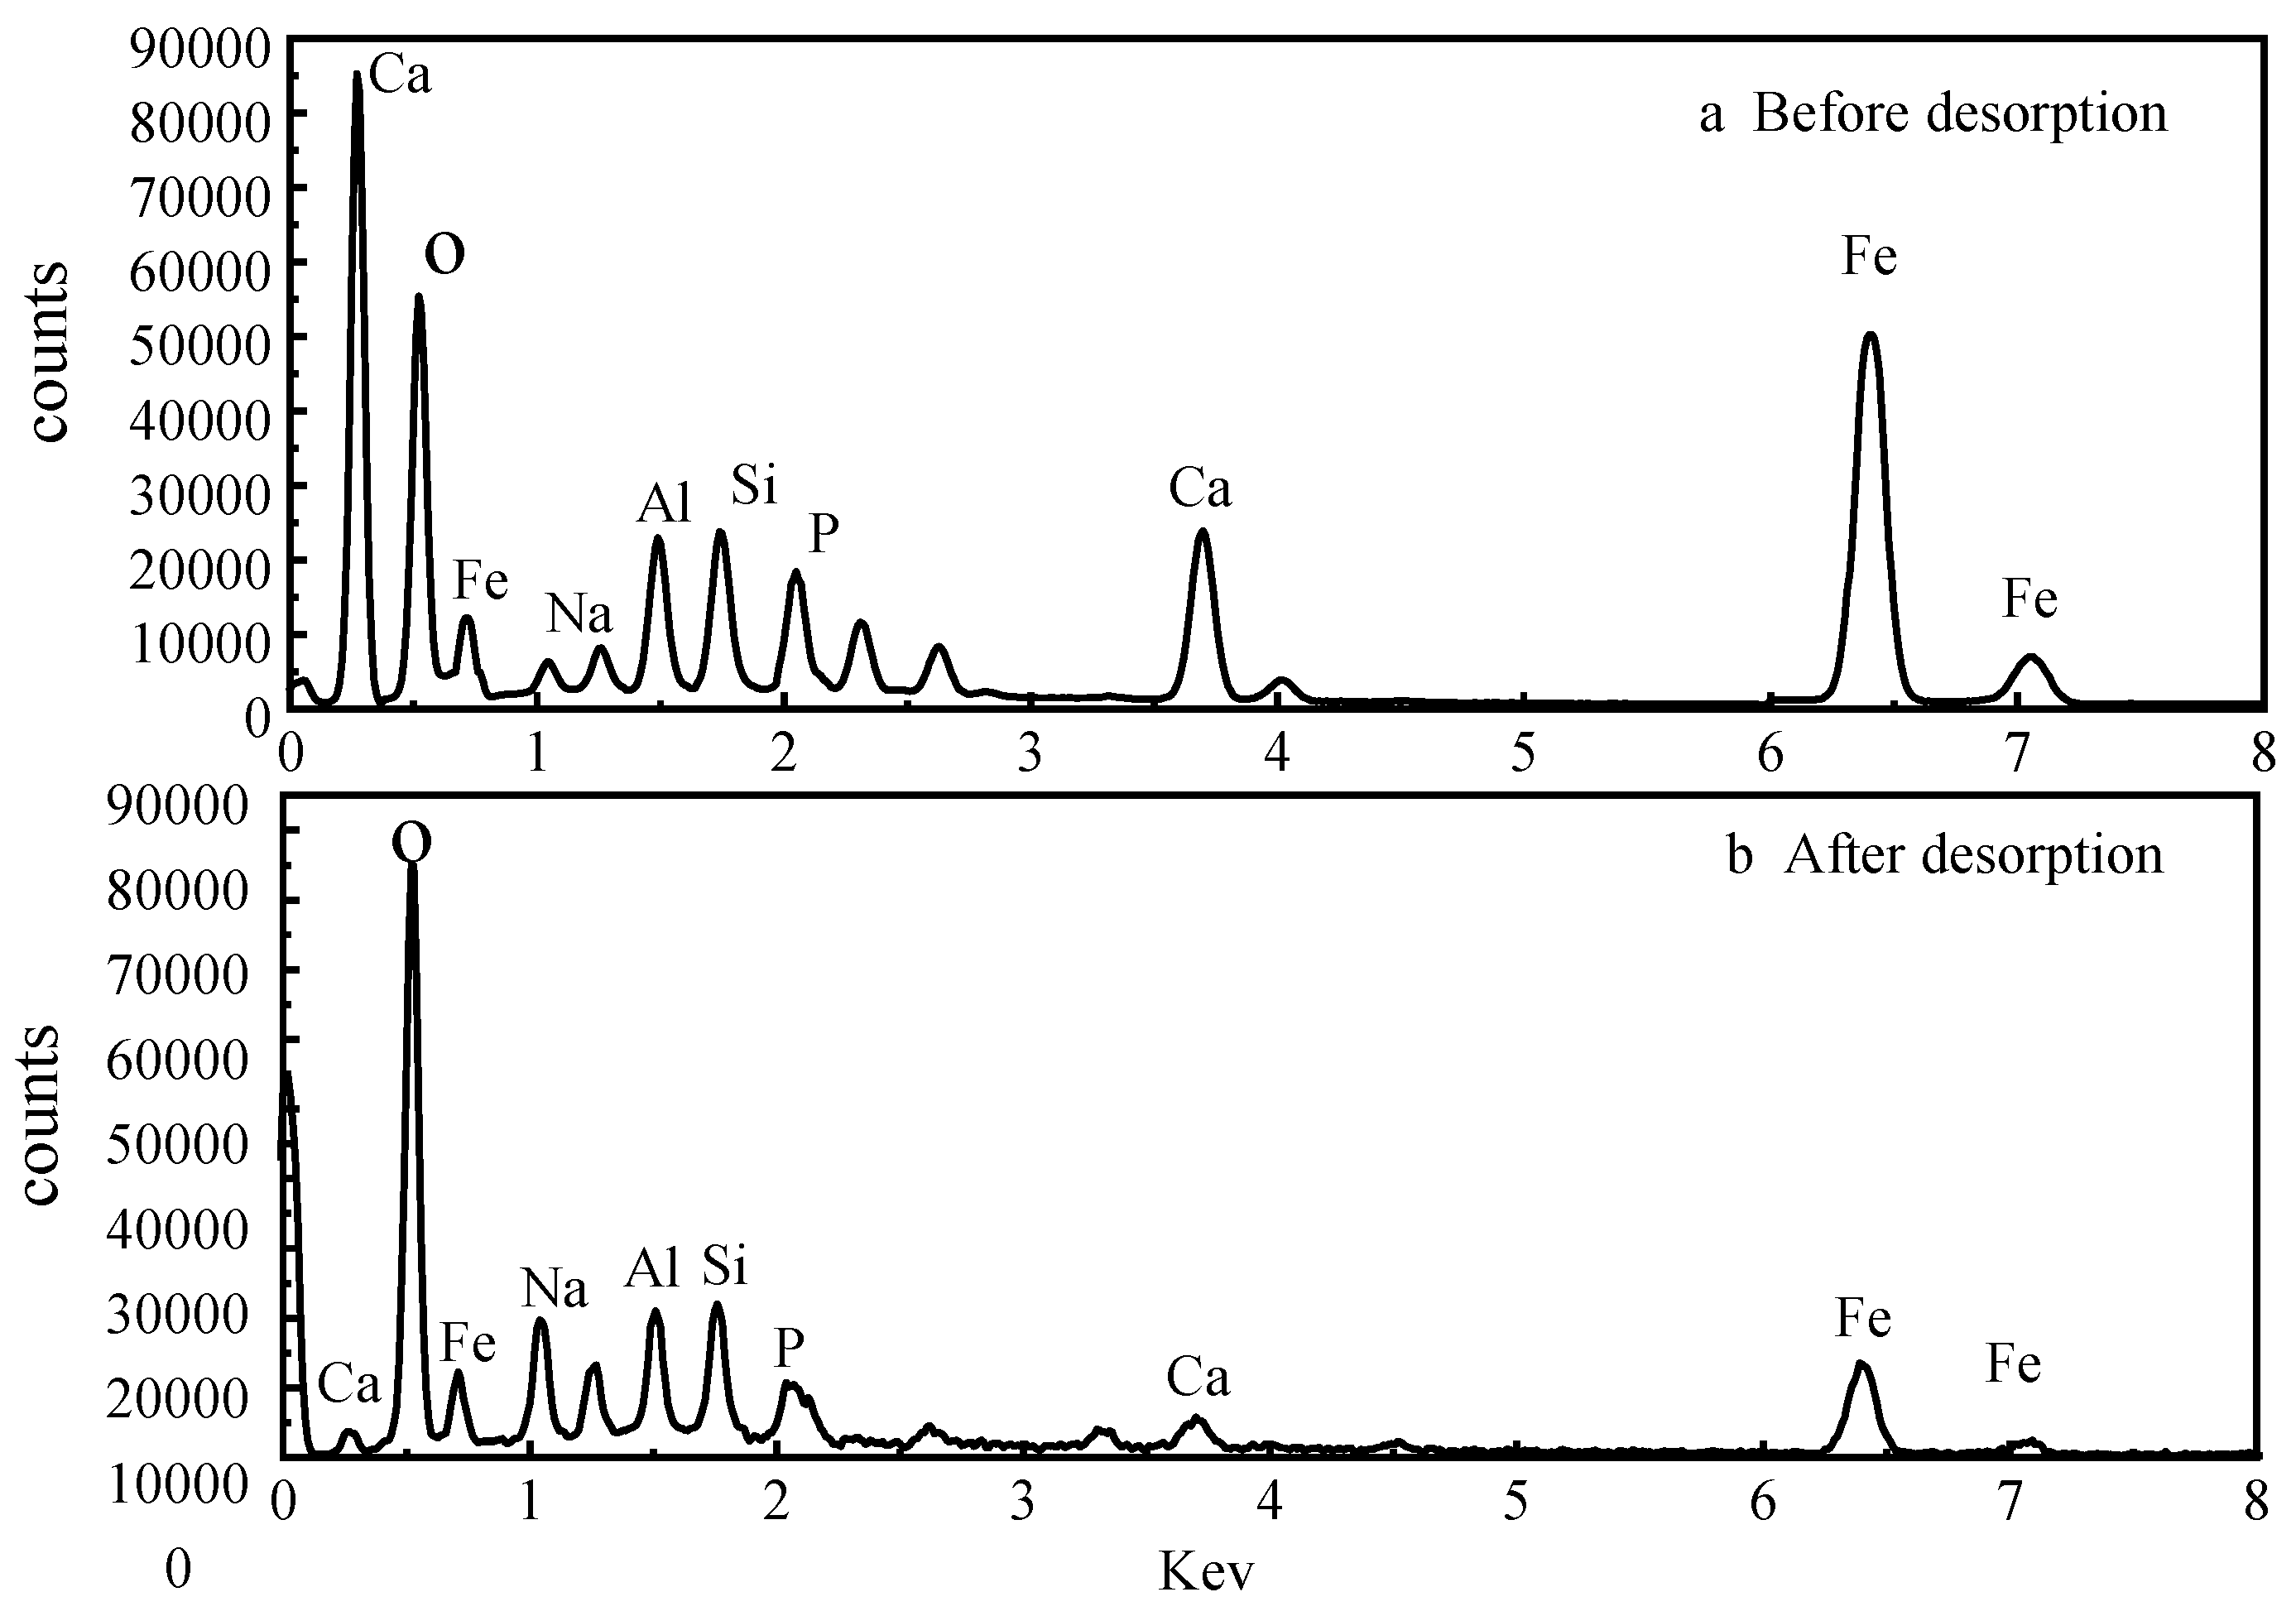
Comparing the energy spectroscopic measurements before and after the desorption of activated red mud adsorbent reveals that the desorbent may have led to the disintegration of the adsorbent, as observed through SEM imaging. To explore the changes of the surface elements, EDS analyses were performed before and after desorption of the activated red mud adsorbent, and the surface of the particulate adsorbent before and after desorption was subjected to a narrow sweep of elements such as O, Ca, Al, Na, Si, Fe, and P, as shown in Fig. 11.
Figure 11(a) shows the narrow sweep of EDS before desorption, and Fig. 11(b) shows the narrow sweep of EDS after desorption.
Comparing Fig. 11(a) with Fig. 11(b) and
Table 3 shows that the elemental phosphorus on the surface of the adsorbent decreases after desorption, which is consistent with the SEM surface images in Fig. 10. Less elemental calcium appeared on the surface of the granular adsorbent after desorption than before desorption, which indicated that the dissolution of elemental Ca in the activated red mud adsorbent under acidic conditions was linked to the reaction between the desorbent and the (Ca)
3(PO
4)
2 precipitation on the surface of the adsorbent, causing certain desorption of phosphorus. In addition, the specific surface elements before and after the desorption of phosphorus from the adsorbent were measured, with the results expressed in terms of elemental mass. The phosphorus adsorbed by the adsorbent on activated red mud particles after desorption decreased from 4.84% to 0.84%, Ca decreased from 15.54% to 8.97%, Al decreased from 6.47% to 5.48%, and Fe decreased from 13.65% to 12.65%, which also demonstrated that the desorbent reacted with the reactive elements in the red mud to cause the adsorption of the adsorbent on the surface by the active elements on the adsorbent surface. This result indicated that the desorbent reacted with the active elements in red mud, removing phosphorus originally adsorbed on the surface of the adsorbent. This was especially the case for the considerable reduction of elemental Ca, which may react with Cl
− in the desorbent to form water-soluble CaCl
2. The corrosive effect caused these elements to detach from the surface of the activated red mud particles dissolved in the water and accompanied by the desorption of phosphorus.
Figure 11.
Narrow sweep of EDS before and after the desorption of activated red mud adsorbent.
Figure 11.
Narrow sweep of EDS before and after the desorption of activated red mud adsorbent.
Table 3.
Elemental composition mass fraction (%) of activated red mud adsorbent before and after desorption.
Table 3.
Elemental composition mass fraction (%) of activated red mud adsorbent before and after desorption.
| Element |
Before desorption |
After desorption |
O
Na
Al
Si
P
Ca
Fe
Total
|
51.04
2.21
6.47
6.25
4.84
15.54
13.65
100.00 |
61.03
3.84
5.48
7.22
0.84
8.97
12.62
100.00 |
3.10. Analysis of Morphological Changes
Figure 12 shows the mineral composition of the activated red mud adsorbent before and after desorption. Compared with before desorption, the intensity of the characteristic peaks of chalcopyrite, calcium chalcopyrite, and calcium ferrogarnet decreased considerably after desorption. This result is related to the disintegration and dissolution of elements such as Ca, Fe, and Si in the process of phosphorus desorption in water. Variations in crystal type and mineral composition are insignificant, indicating that activated red mud adsorbent can continue to adsorb phosphorus after desorption. Thus, the adsorbent may be reused.
3.11. Fourier Transform Infrared Analysis
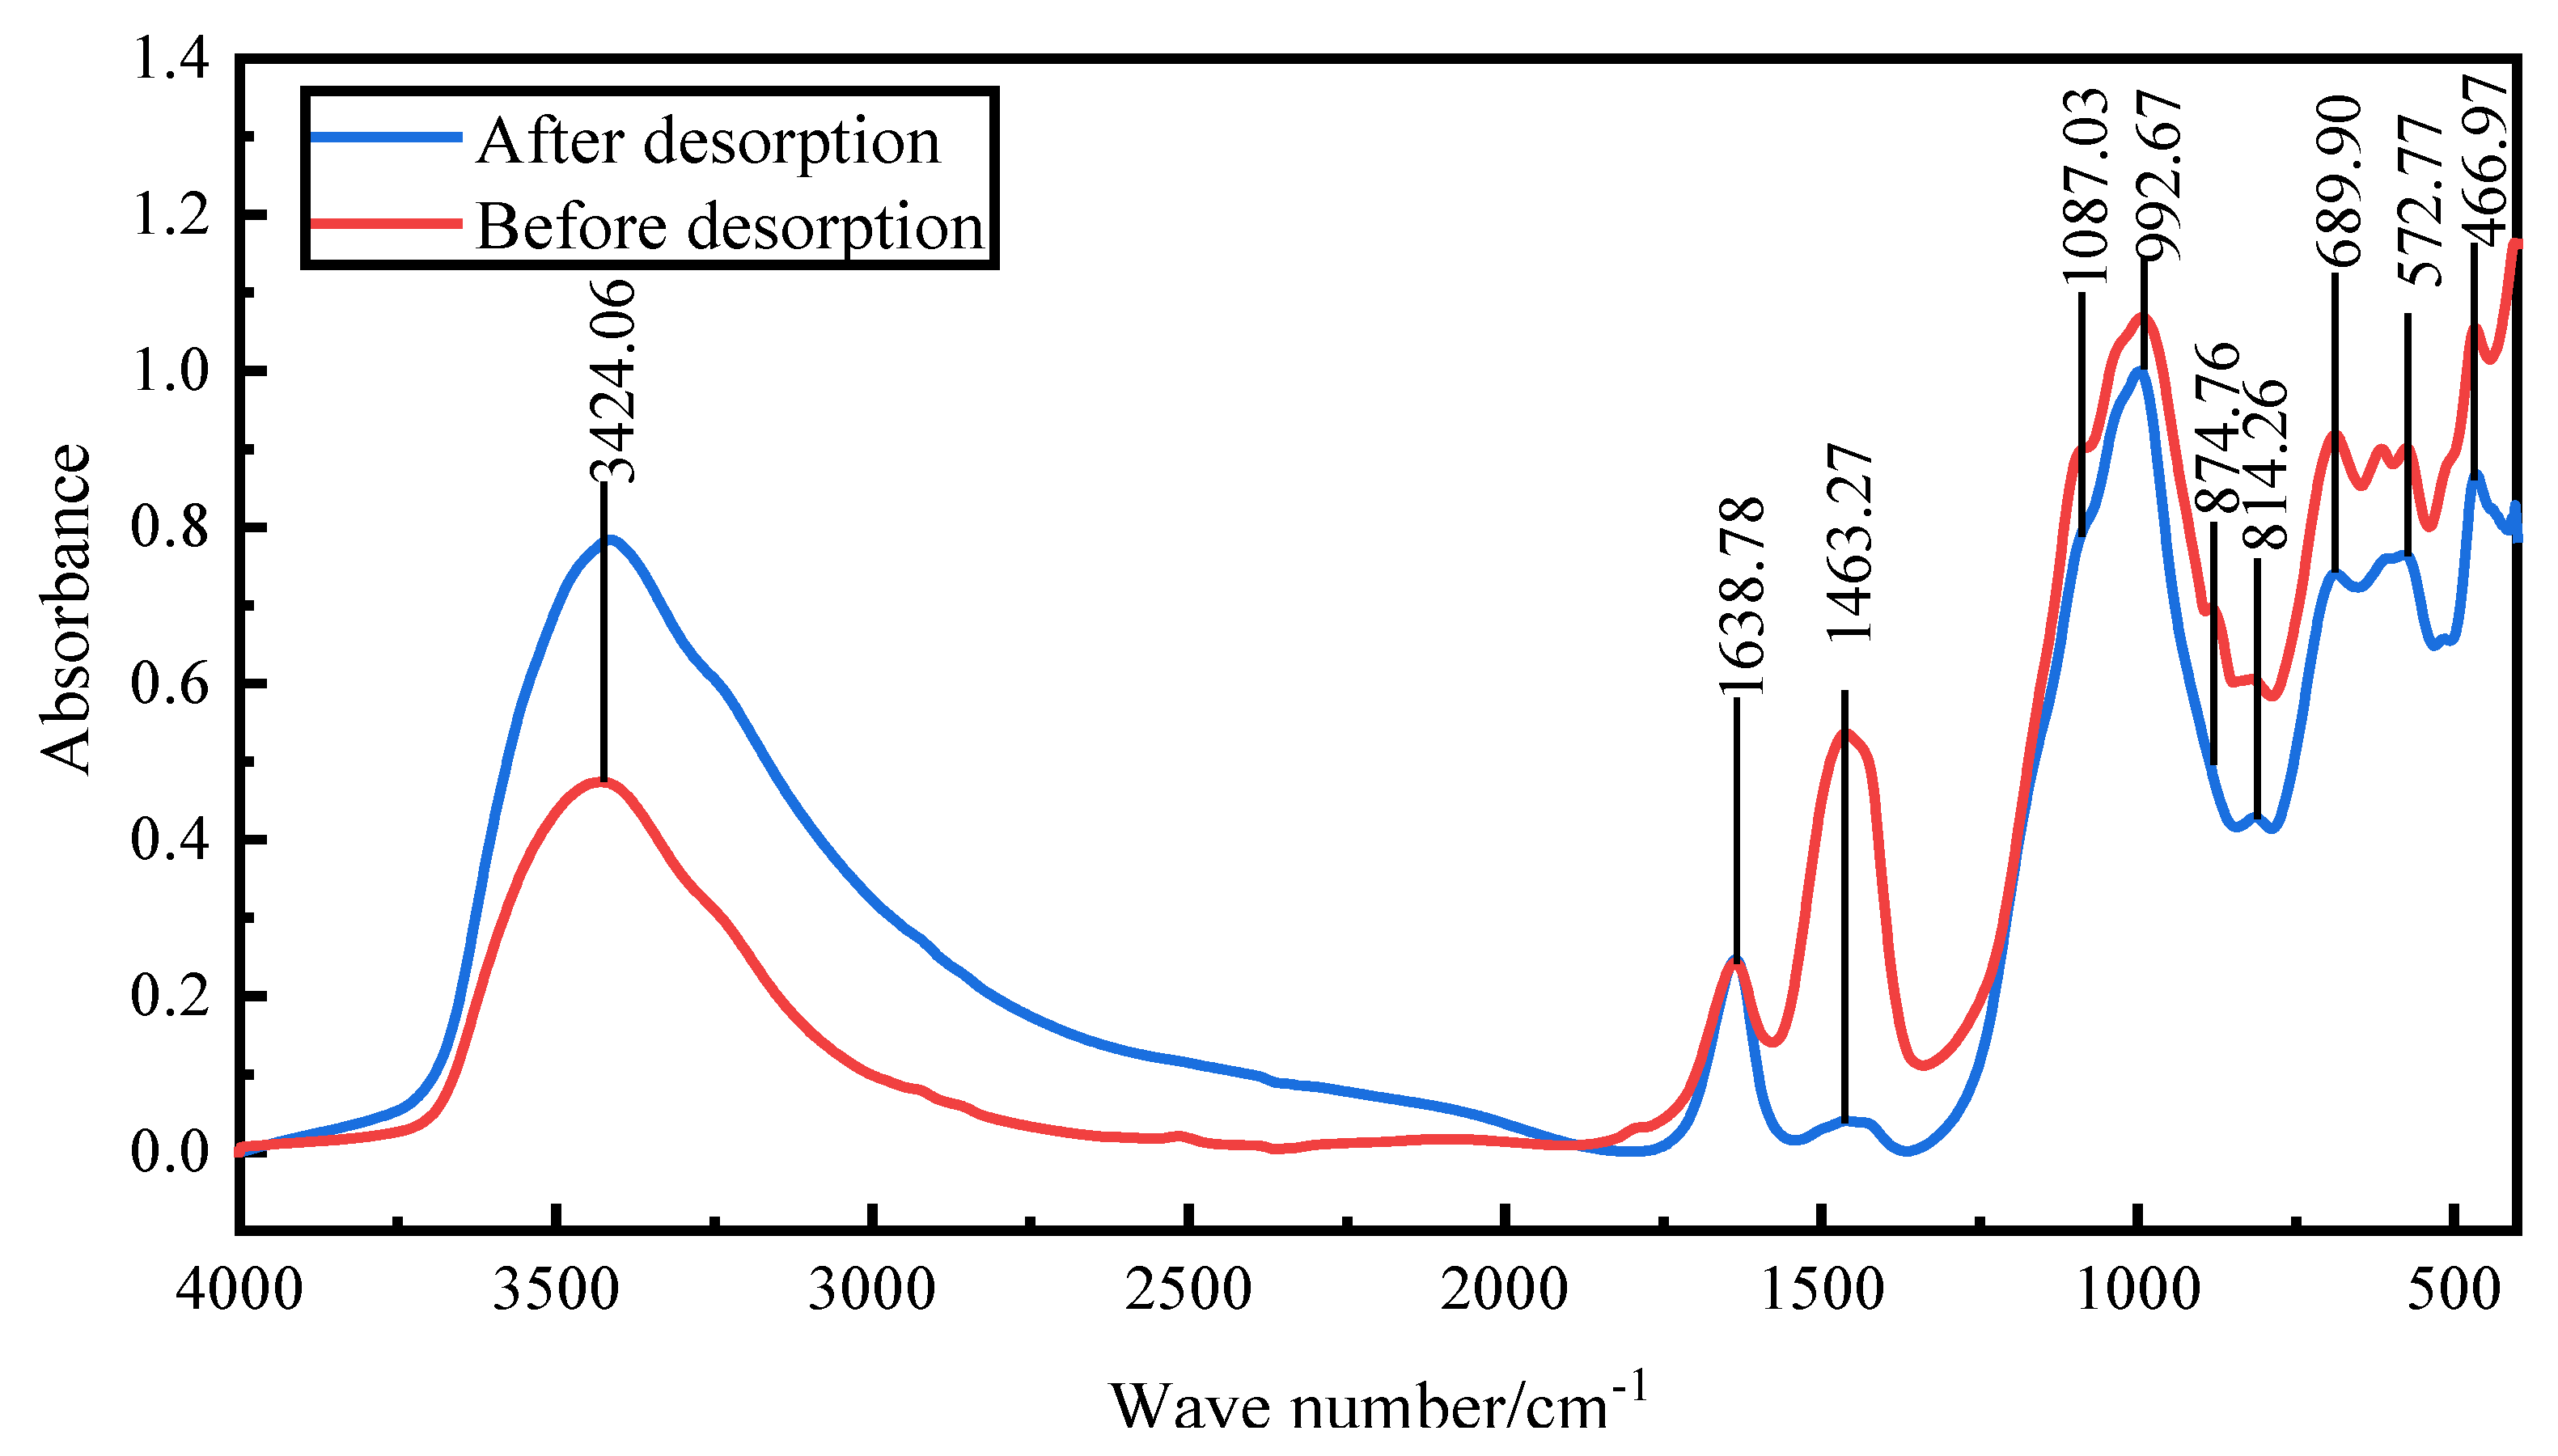
Fourier transform infrared spectroscopy was conducted to examine the changes in structure and chemical groups of the activated red mud adsorbent before and after desorption. The goal was to verify the phosphorus fugacity state on the activated hematite particulate adsorbent from 400 to 1500 cm
−1.
Figure 13 shows the spectral maps before and after desorption. After desorption, the peaks at 992 cm
−1 were considerably strengthened mainly by the Si(AlIV)-O telescopic vibration as shelly silicate or chalcocite, which was consistent with the increase of elemental Si obtained via EDS. The peaks at 814, 874.76, and 1463 cm
−1 disappeared, the main desorption agent led to the dissociation of elemental Ca and Fe, and the vibration of [SiO
4]
4− group calcite or aragonite group of calcite-iron garnet basically disappeared. The peaks at 3600–3000 cm
−1 were due to water crystallization, which indicated that the desorption process was accompanied by water desorption. Overall, the material changes before and after desorption were more obvious than before desorption, especially for Ca and Fe compounds. After desorption, the strong peaks for PO
43− groups at 1087.03 cm
−1 and 572 cm
−1 decreased considerably, which indicated that the desorption of phosphorus in the activated red mud adsorbent was accompanied by a chemical reaction.
4. Conclusions
(1) For static desorption, the comprehensive desorption effect may be ranked as HCl > NaOH > NaCl > deionized water. The higher the concentration of desorbent, the greater the desorption, and the better the desorption of 0.1–0.2 mol/L of HCl in the resorption process. Regeneration improves due to acid, which cleans the pores of red mud particles, thereby exposing the effective sites inside the pores.
(2) The desorption thermodynamics and kinetics show that the desorption conforms to the average adsorption free-energy reaction obtained by the D–R model. The desorption isotherm correlates well with the Langmuir model, indicating that the desorption is dominated by surface desorption of the monomolecular layer. The thermodynamics shows that the desorption of phosphorus by the desorbent proceeds spontaneously and high temperature promotes desorption. The process of desorption thus includes both physical and chemical desorption.
(3) Kinetics indicates that the desorption process conforms to the pseudo-second-order kinetic linear simulation, which indicates that chemical desorption restricts the desorption rate. The particle diffusion model indicates that the desorbent removes phosphorus in the form of precipitation from the surface of the activated red mud particle adsorbent primarily via a chemical reaction.
(4) Microanalysis before and after desorption of the desorbent and surface elemental analysis demonstrated that P was removed and that the metal element Ca was dissolved the most, followed by Al and Fe, indicating that the desorbent reacted with the active elements in red mud. The corrosive effect made the elements at the surface of the activated red mud adsorbent disintegrate and dissolve in water. This was accompanied by phosphorus desorption; hence, the characteristic peak intensities of chalcopyrite, calcite chalcopyrite, and calcite garnet decreased more than the peak of the activated red mud adsorbent. The characteristic peak intensity decreased more, and after the desorption, the mineral composition was similar because the adsorbent reuse had a negligible impact on adsorption. The functional groups of calcium–iron garnet [SiO4]4− group calcite or aragonite vibration basically disappeared, the PO43− group peak intensity decreased considerably, and the desorption of phosphorus was accompanied by a chemical reaction.
Author Contributions
Longjiang Li: Supervision, Project administration, Data curation, Writing - review & editing. YangZhiWen: Methodology, Investigation, Data curation, Formal analysis, Writing - original draft. QiuYueqin and WangYaLan: Investigation, Data curation, Formal analysis, Writing - review & editing.
Funding
This research was funded by the National Natural Science Foundation of China ,grant number 51964010.
Institutional Review Board Statement
The study was conducted in accordance with the Declaration of Helsinki, and approved by the Institutional Review Board (or Ethics Committee) of NAME OF 106 INSTITUTE and not involving humans or animals.
Acknowledgements
Thanks to the National Natural Science Foundation of China (51964010) for funding 478,000 yuan, and thanks to the support of the Large Analysis and Testing Instrument Sharing Platform of Guizhou University.
Declaration of Competing Interest
The authors declare that they have no known competing financial interests or personal relationships that could have appeared to influence the work reported in this paper.
References
- Chen, W. Exploratory study on the preparation of modified red mud porous material and wastewater treatment[D]. China University of Geosciences (Beijing), 2010.
- Wang YB, Zhu XF, Zhang XL, et al. Removal of high concentration phosphorus wastewater by red mud[J]. Chemical Progress, 2010, 29(9): 1771-1774.
- Azizian, S. Kinetic models of sorption: a theoretical analysis[J]. Journal of Colloid and Interface Science, 2004, 276(1): 47-52. [CrossRef]
- Xing X, Gao B, Yue Q, et al. Sorption of phosphate onto giant reed based adsorbent: FTIR, Raman spectrum analysis and dynamic sorption/desorption properties in filter bed[J]. Bioresource Technology, 2011, 102(9): 5278-5282. [CrossRef]
- Johir MAH, George J, Vigneswaran S, et al. Removal and recovery of nutrients by ion exchange from high rate membrane bio-reactor (MBR) effluent[J]. Desalination, 2011, 275(1-3): 197-202. [CrossRef]
- Park KY, Song JH, Lee SH, et al. Utilization of a selective adsorbent for phosphorus removal from wastewaters[J]. Environmental Engineering Science, 2010, 27(9): 805-810. [CrossRef]
- Cheng X, Huang X, Wang X, et al. Phosphate adsorption from sewage sludge filtrate using zinc–aluminum layered double hydroxides[J]. Journal of Hazardous Materials, 2009, 169(1-3): 958-964. [CrossRef]
- Urano K, Tachikawa H. Process development for removal and recovery of phosphorus from wastewater by a new adsorbent. 1. Preparation method and adsorption capability of a new adsorbent[J]. Industrial & Engineering Chemistry Research, 1991, 30(8): 1897-1899. [CrossRef]
- Delaney P, McManamon C, Hanrahan JP, et al. Development of chemically engineered porous metal oxides for phosphate removal[J]. Journal of Hazardous Materials, 2011, 185(1): 382-391. [CrossRef]
- Urano K, Tachikawa H. Process development for removal and recovery of phosphorus from wastewater by a new adsorbent. 3. Desorption of phosphate and regeneration of adsorbent[J]. Industrial & Engineering Chemistry Research, 1992, 31(6): 1510-1513. [CrossRef]
- Jie Ye,Xiangna Cong,Panyue Zhang,Guangming Zeng,Erhard Hoffmann,Yang Liu,Yan Wu,Haibo Zhang,Wei Fang,Hermann H. Hahn. Application of acid-activated Bauxsol for wastewater treatment with high phosphate concentration: Characterization, adsorption optimization, and desorption behaviors. Journal of Environmental Management,2,2016. [CrossRef]
- Zhao Y, Yue Q, Li Q, et al. The regeneration characteristics of various red mud granular adsorbents (RMGA) for phosphate removal using different desorption reagents[J]. Journal of Hazardous Materials, 2010, 182(1-3): 309-316. [CrossRef]
- Zhang G, Liu H, Liu R, et al. Removal of phosphate from water by a Fe–Mn binary oxide adsorbent[J]. Journal of Colloid and Interface Science, 2009, 335(2): 168-174.
- Zeng L, Li X, Liu J. Adsorptive removal of phosphate from aqueous solutions using iron oxide tailings[J]. Water Research, 2004, 38(5): 1318-1326. [CrossRef]
- Ajmal Z, Muhmood A, Usman M, et al. Phosphate removal from aqueous solution using iron oxides: Adsorption, desorption and regeneration characteristics[J]. Journal of Colloid and Interface Science, 2018, 528,145-155. [CrossRef]
- Urano K, Tachikawa H. Process development for removal and recovery of phosphorus from wastewater by a new adsorbent. 3. Desorption of phosphate and regeneration of adsorbent[J]. Industrial & Engineering Chemistry Research, 1992, 31(6): 1510-1513. [CrossRef]
- Kuzawa K, Jung YJ, Kiso Y, et al. Phosphate removal and recovery with a synthetic hydrotalcite as an adsorbent[J]. Chemosphere, 2006, 62(1): 45-52. [CrossRef]
- Li Y, Liu C, Luan Z, et al. Phosphate removal from aqueous solutions using raw and activated red mud and fly ash[J]. Journal of Hazardous Materials, 2006, 137(1): 374-383. [CrossRef]
- Yaqin, Z. Preparation and characterisation of new red mud particle adsorbent material and its performance on phosphorus removal from water body [D]. Shandong University, 2013.
- Xu, MY. Preparation, characterisation and properties of red mud-based granular phosphorus removal materials [D]. China University of Mining and Technology, 2020.
- Qinbin, H. Research on the removal of nitrate and phosphate in water by adsorption of organically modified aluminium-manganese composite oxides [D]. Xi'an University of Architecture and Technology, 2018.
- Wu, J. Preparation of red mud base polymer porous material and its adsorption performance [D]. Guangxi University, 2016.
- Jiang Y, Ma X, Guo Y, et al. Adsorption and desorption characteristics of zinc in different layered soils[J]. Journal of Northeast Forestry University, 2021, 49(03): 99-107.
- Deihimi N, Irannajad M, Rezai B. Equilibrium and kinetic studies of ferricyanide adsorption from aqueous solution by activated red mud[J]. Journal of Environmental Management, 2018, 227-285. [CrossRef]
- Zhu C, Luan Z, Wang Y, et al. Removal of cadmium from aqueous solutions by adsorption on granular red mud (GRM)[J]. Separation and Purification Technology, 2007, 57(1): 161-169. [CrossRef]
- Liya, X. Effects of pH and organic matter on the adsorption-desorption characteristics of zinc in soil[J]. Energy Environmental Protection, 2021, 35(03): 39-45.
- Huqing Y, Liu X, Ma Z, et al. Kinetics of water desorption on zeolite[J]. Journal of Nanjing University of Technology (Natural Science Edition), 1990(03): 6-11.
- Ahmed MJ, Dhedan SK. Equilibrium isotherms and kinetics modeling of methylene blue adsorption on agricultural wastes-based activated carbons[J]. Fluid Phase Equilibria, 2012, 317: 9-14. [CrossRef]
- Cheung WH, Szeto YS, McKay G. Intraparticle diffusion processes during acid dye adsorption onto chitosan[J]. Bioresource Technology, 2007, 98(15): 2897-2904. [CrossRef]
- Weber WJ, Morris JC. Kinetics of adsorption on carbon from solution[J]. Journal of the Sanitary Engineering Division, 1963, 89(2): 31-59. [CrossRef]
- Wu HL, Wei SN, Cui SL. Introduction and application of adsorption isotherms[J]. Dyeing and Finishing Technology, 2006, (10): 12-14.
|
Disclaimer/Publisher’s Note: The statements, opinions and data contained in all publications are solely those of the individual author(s) and contributor(s) and not of MDPI and/or the editor(s). MDPI and/or the editor(s) disclaim responsibility for any injury to people or property resulting from any ideas, methods, instructions or products referred to in the content. |
© 2024 by the authors. Licensee MDPI, Basel, Switzerland. This article is an open access article distributed under the terms and conditions of the Creative Commons Attribution (CC BY) license (http://creativecommons.org/licenses/by/4.0/).
