Submitted:
30 January 2024
Posted:
30 January 2024
You are already at the latest version
Abstract
Keywords:
1. Introduction
2. Materials and Methods
2.1. Animals
2.2. Mouse warm IRI
2.3. Rat partial liver transplantation
2.4. Liver enzymes and platelet counts
2.5. Histology
2.6. Quantitative analysis of hepatic microcirculation
2.7. Measurement of plasma ADAMTS13 activity
2.8. Immunofluorescence
2.9. Real-time reverse-transcription polymerase chain reaction (RT-PCR)
2.10. Immunohistochemistry
2.11. Apoptosis assay
2.12. Statistical analysis
3. Results
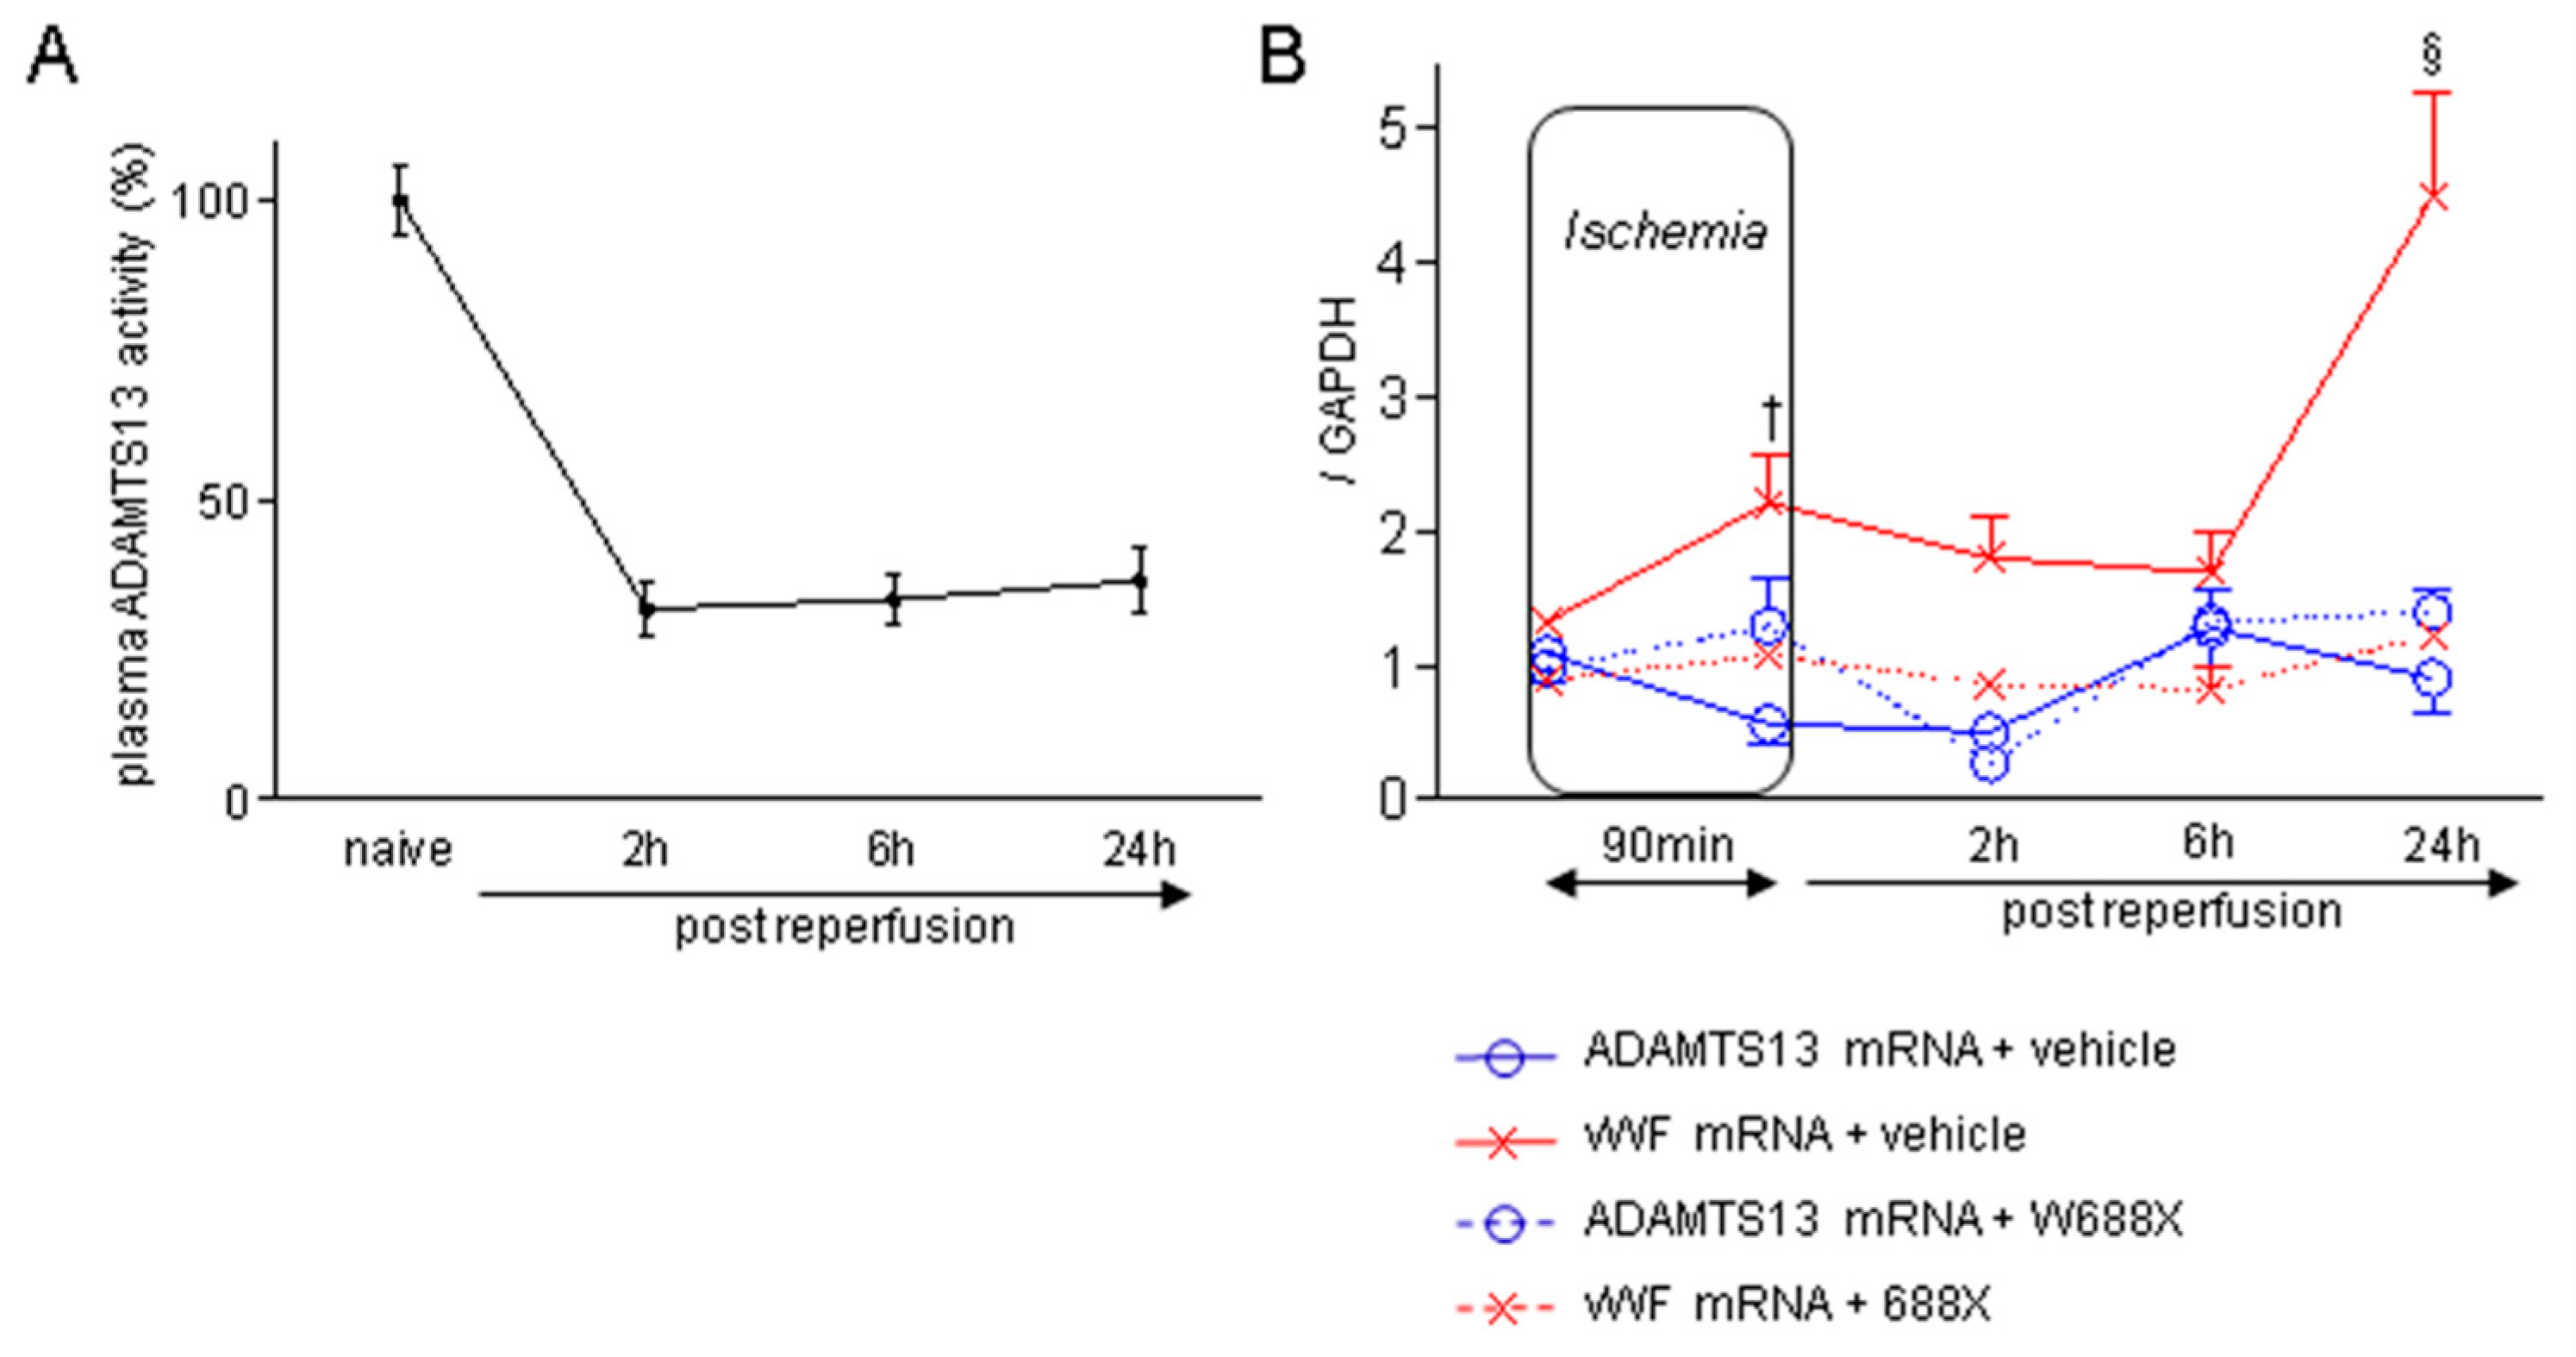
3.1. Liver IRI down-regulates ADAMTS13 and provokes imbalance between ADAMTS13 and vWF
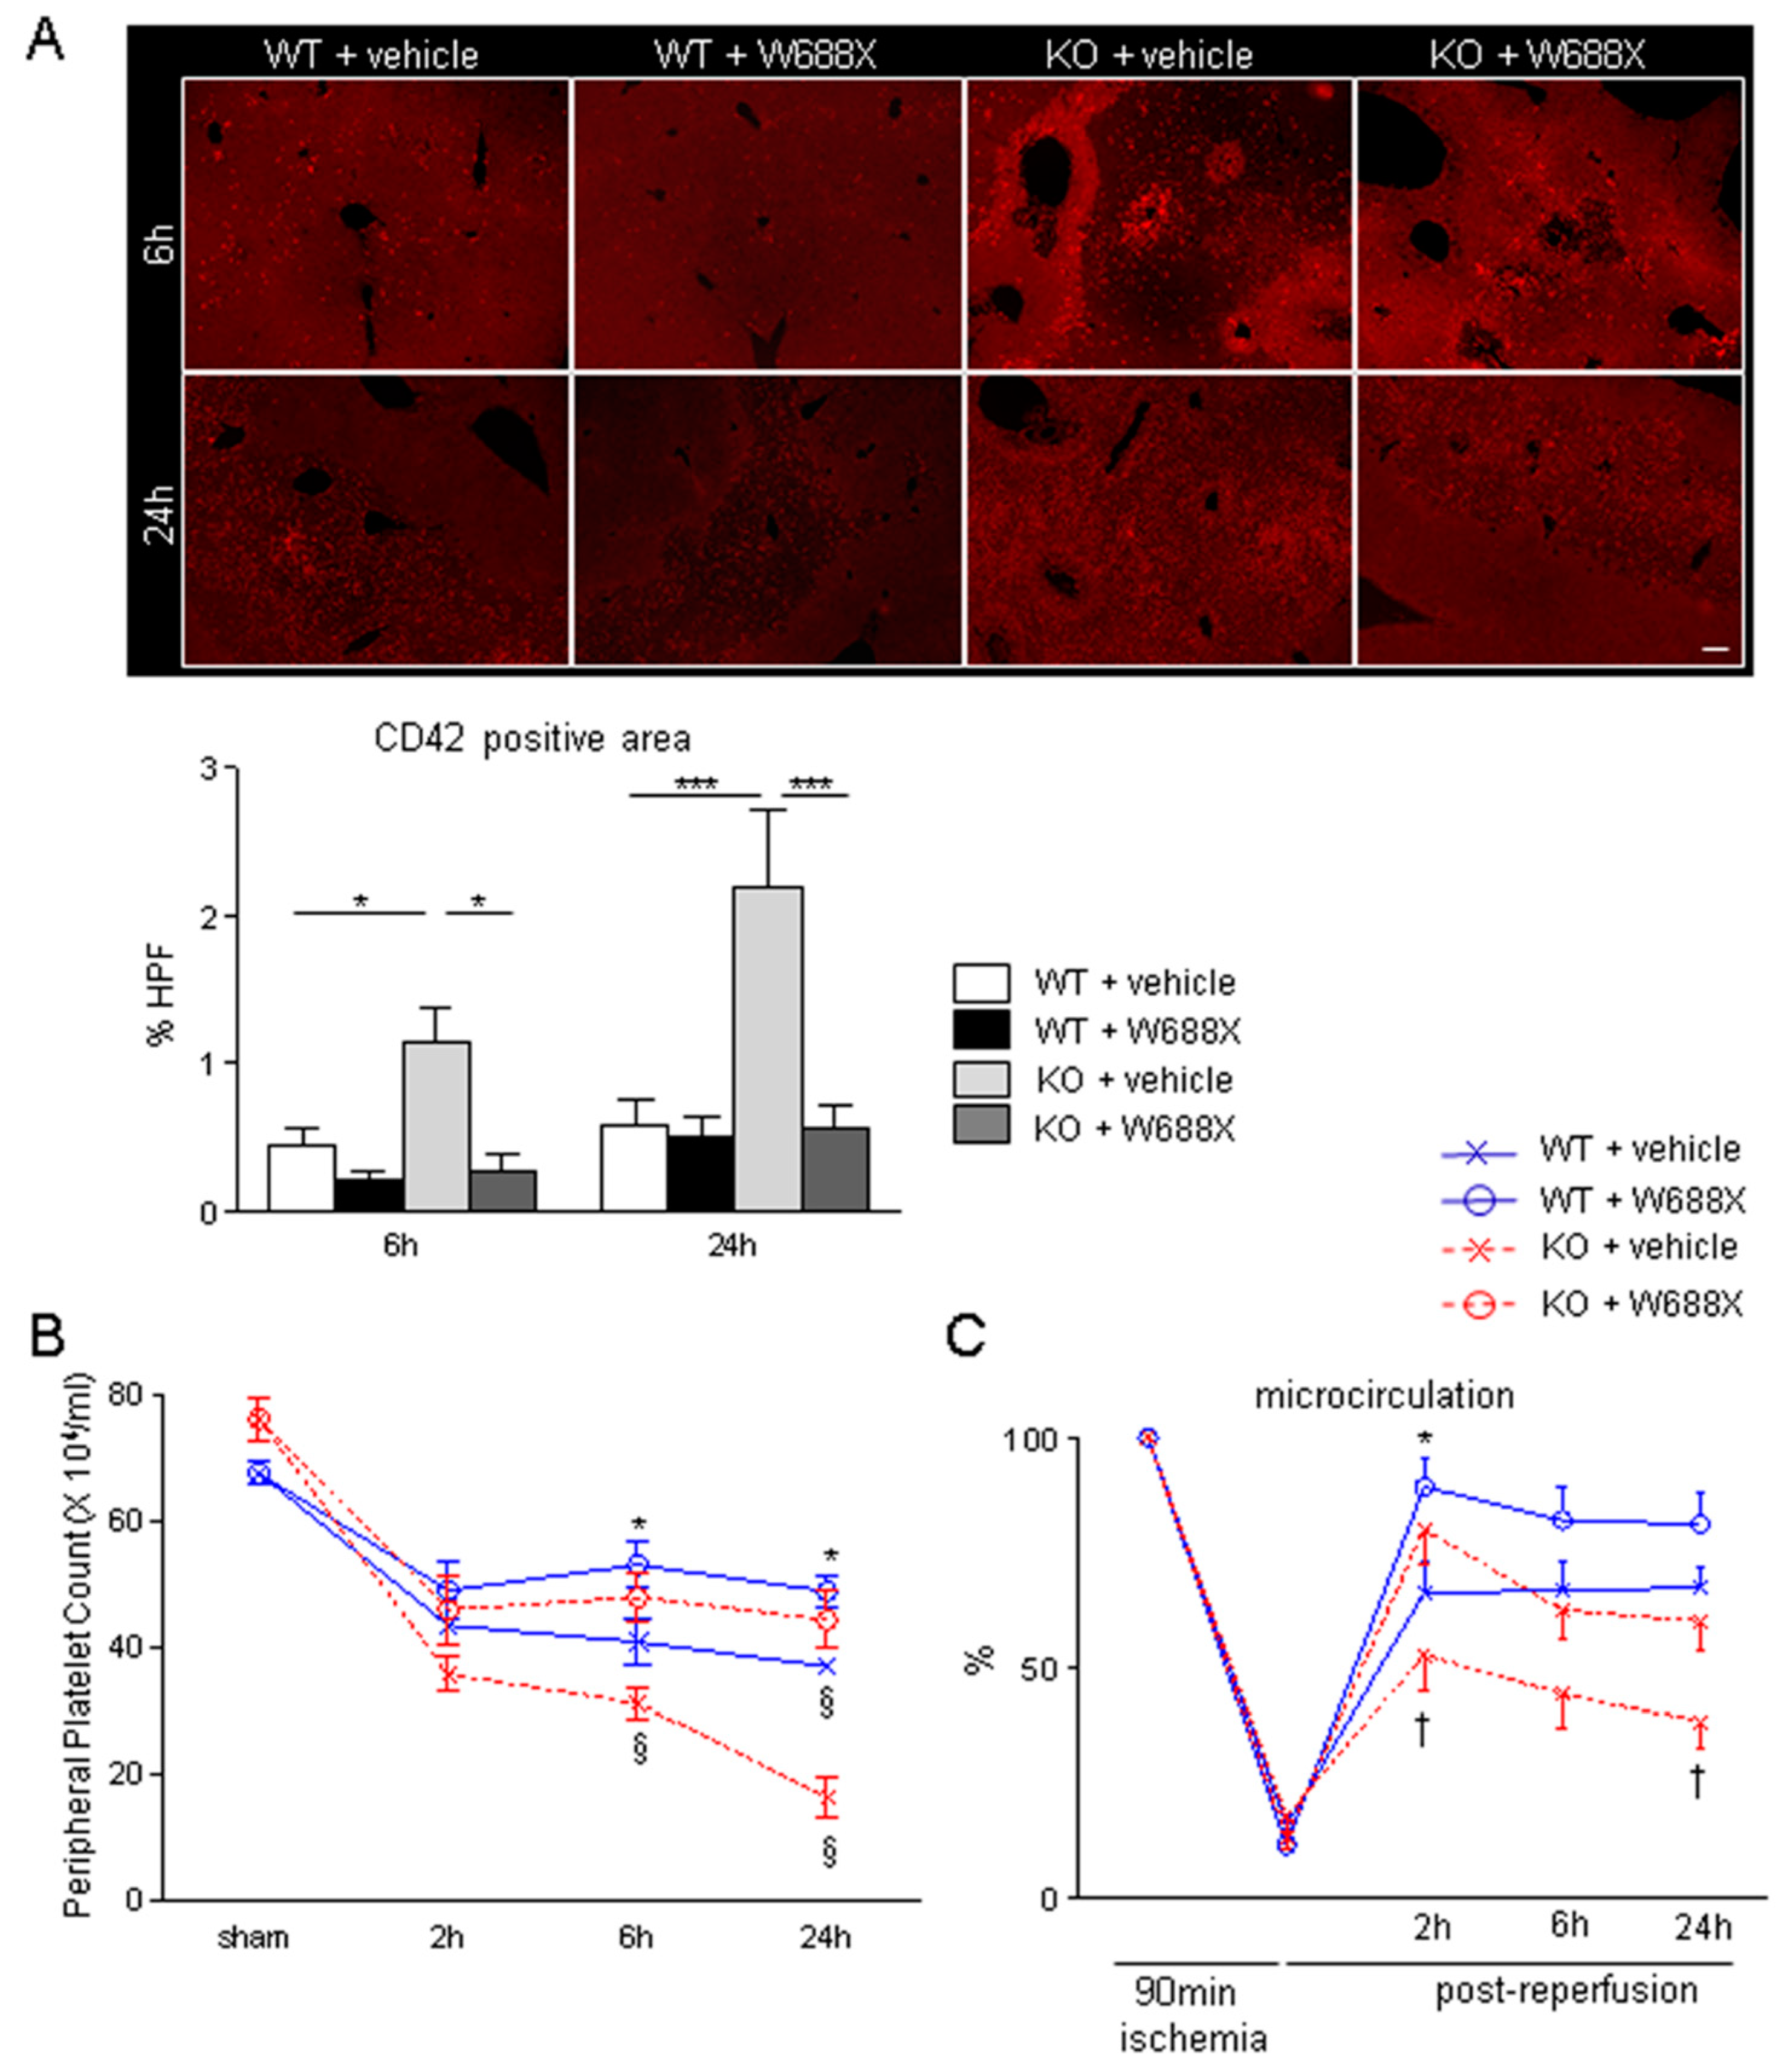
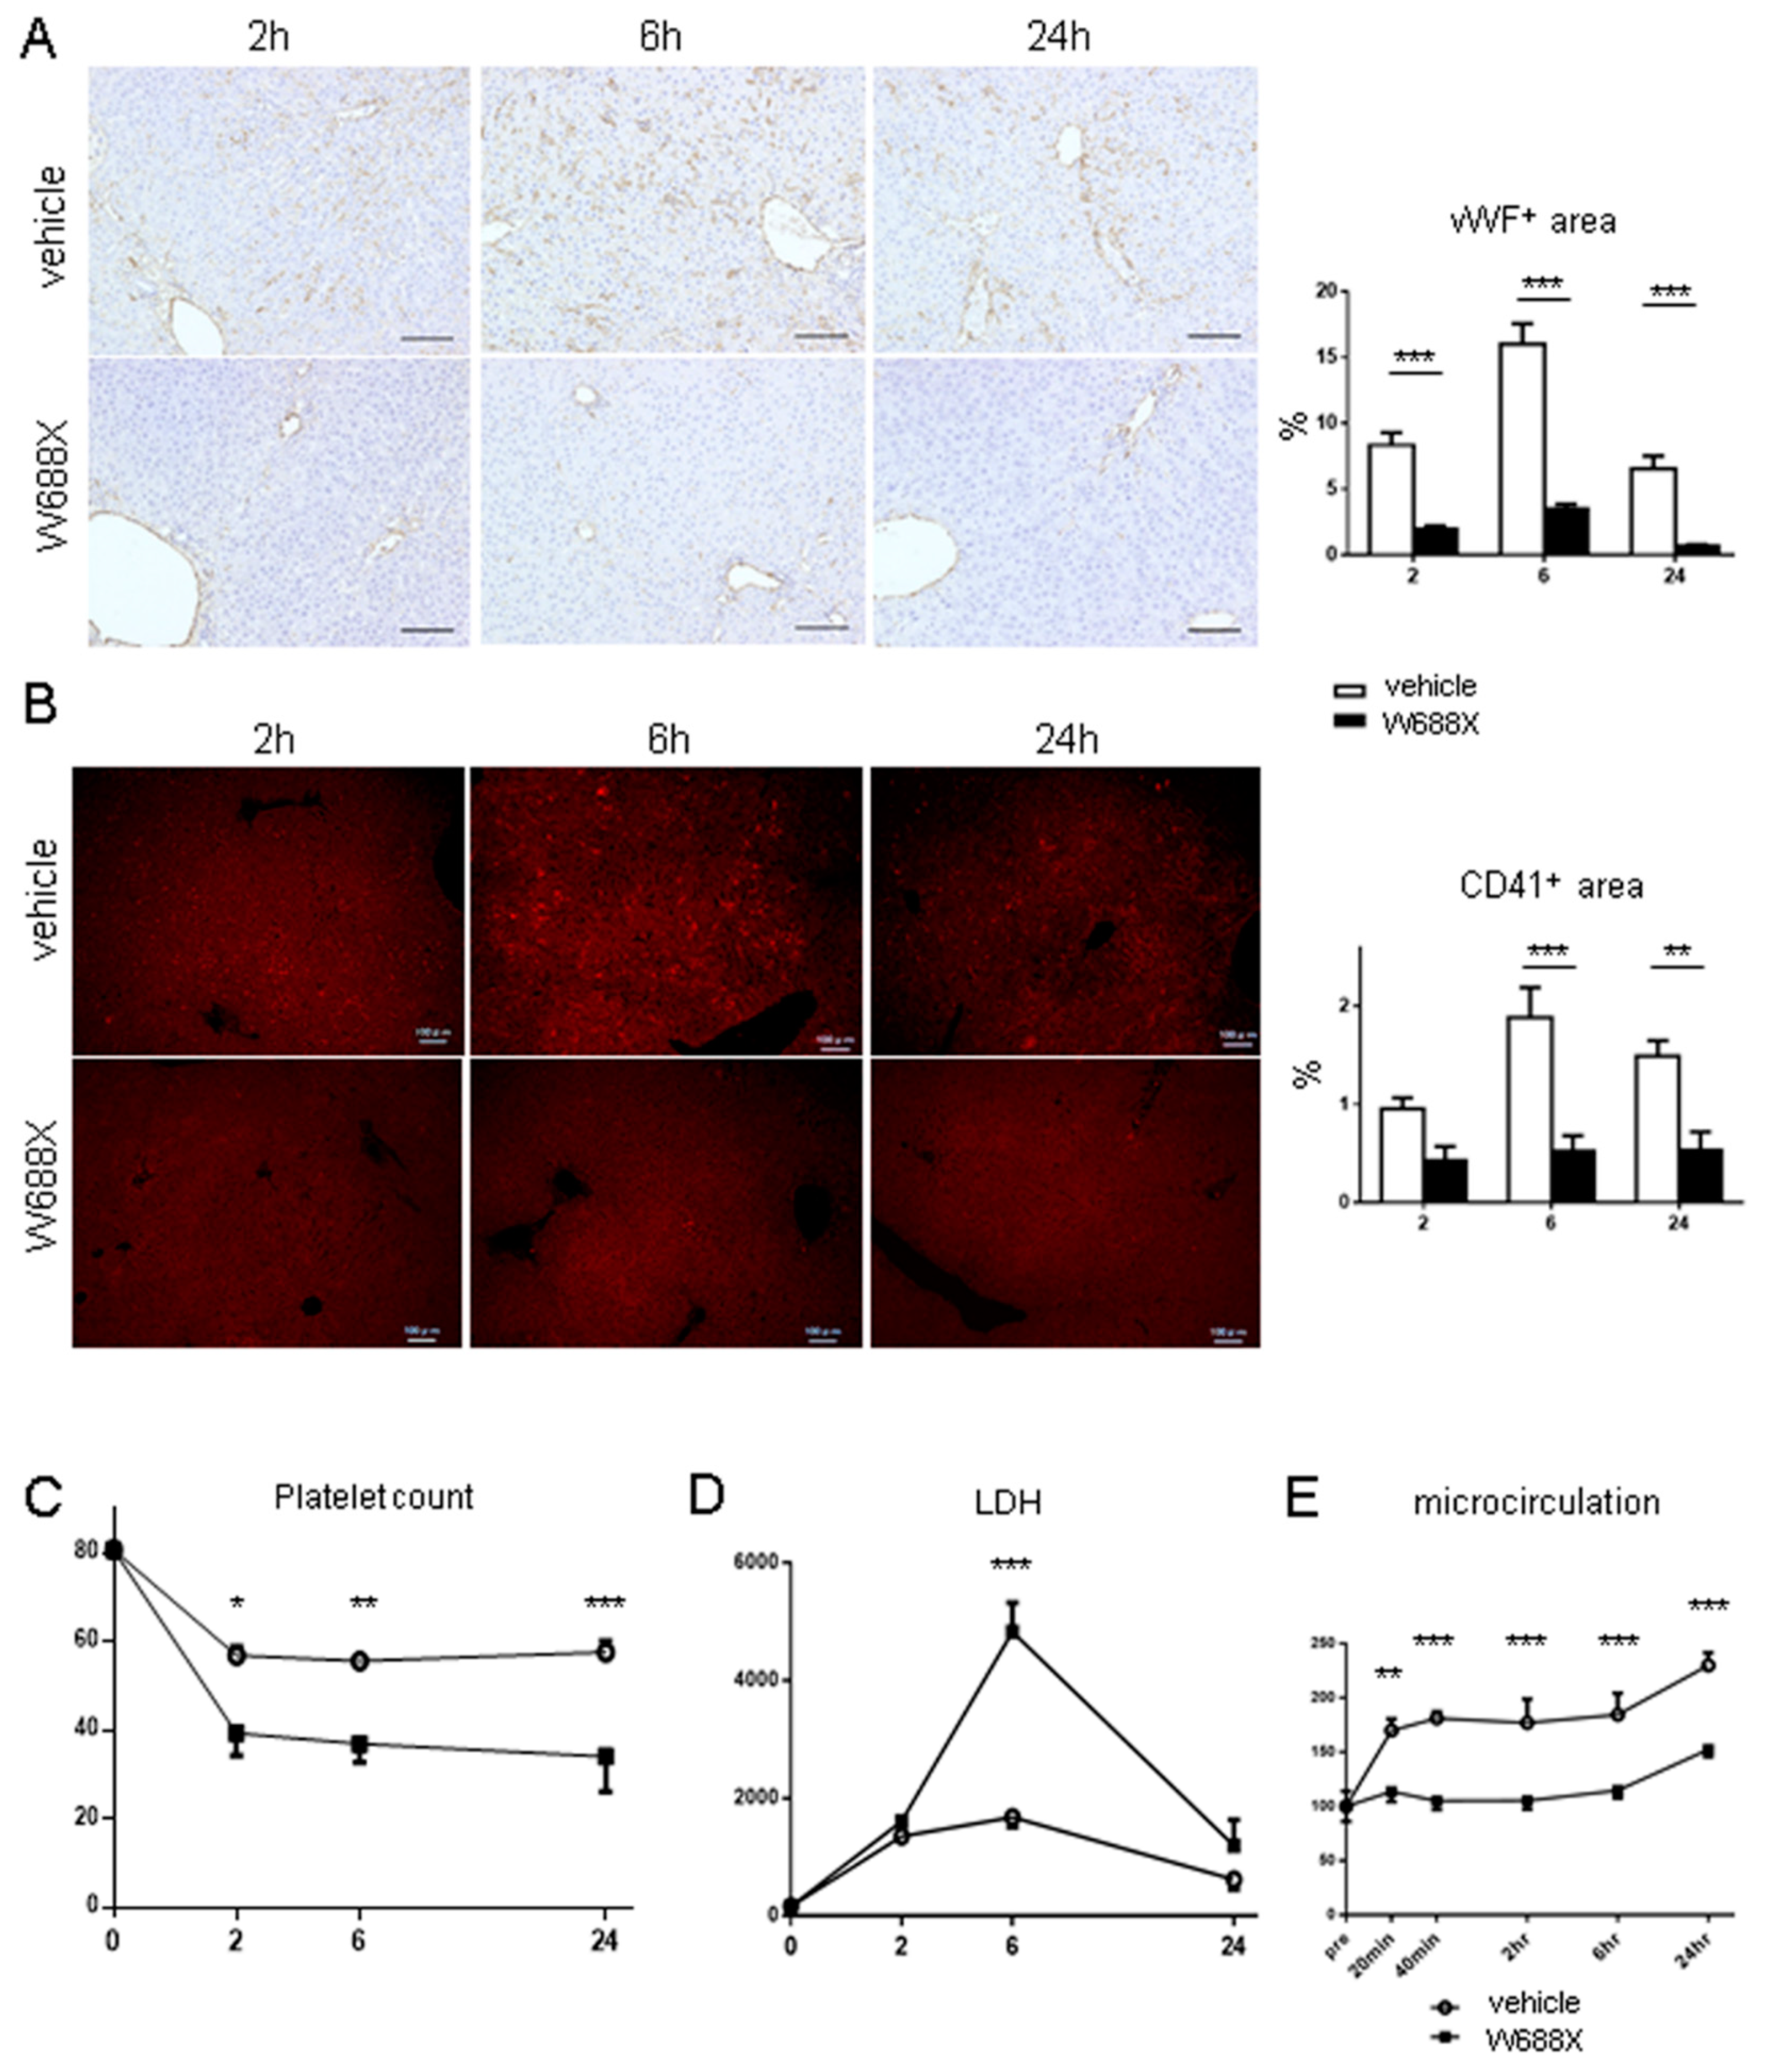
3.2. ADAMTS13-null mutation results in massive platelet aggregation within hepatic sinusoids and impairment of hepatic microcirculation during IRI
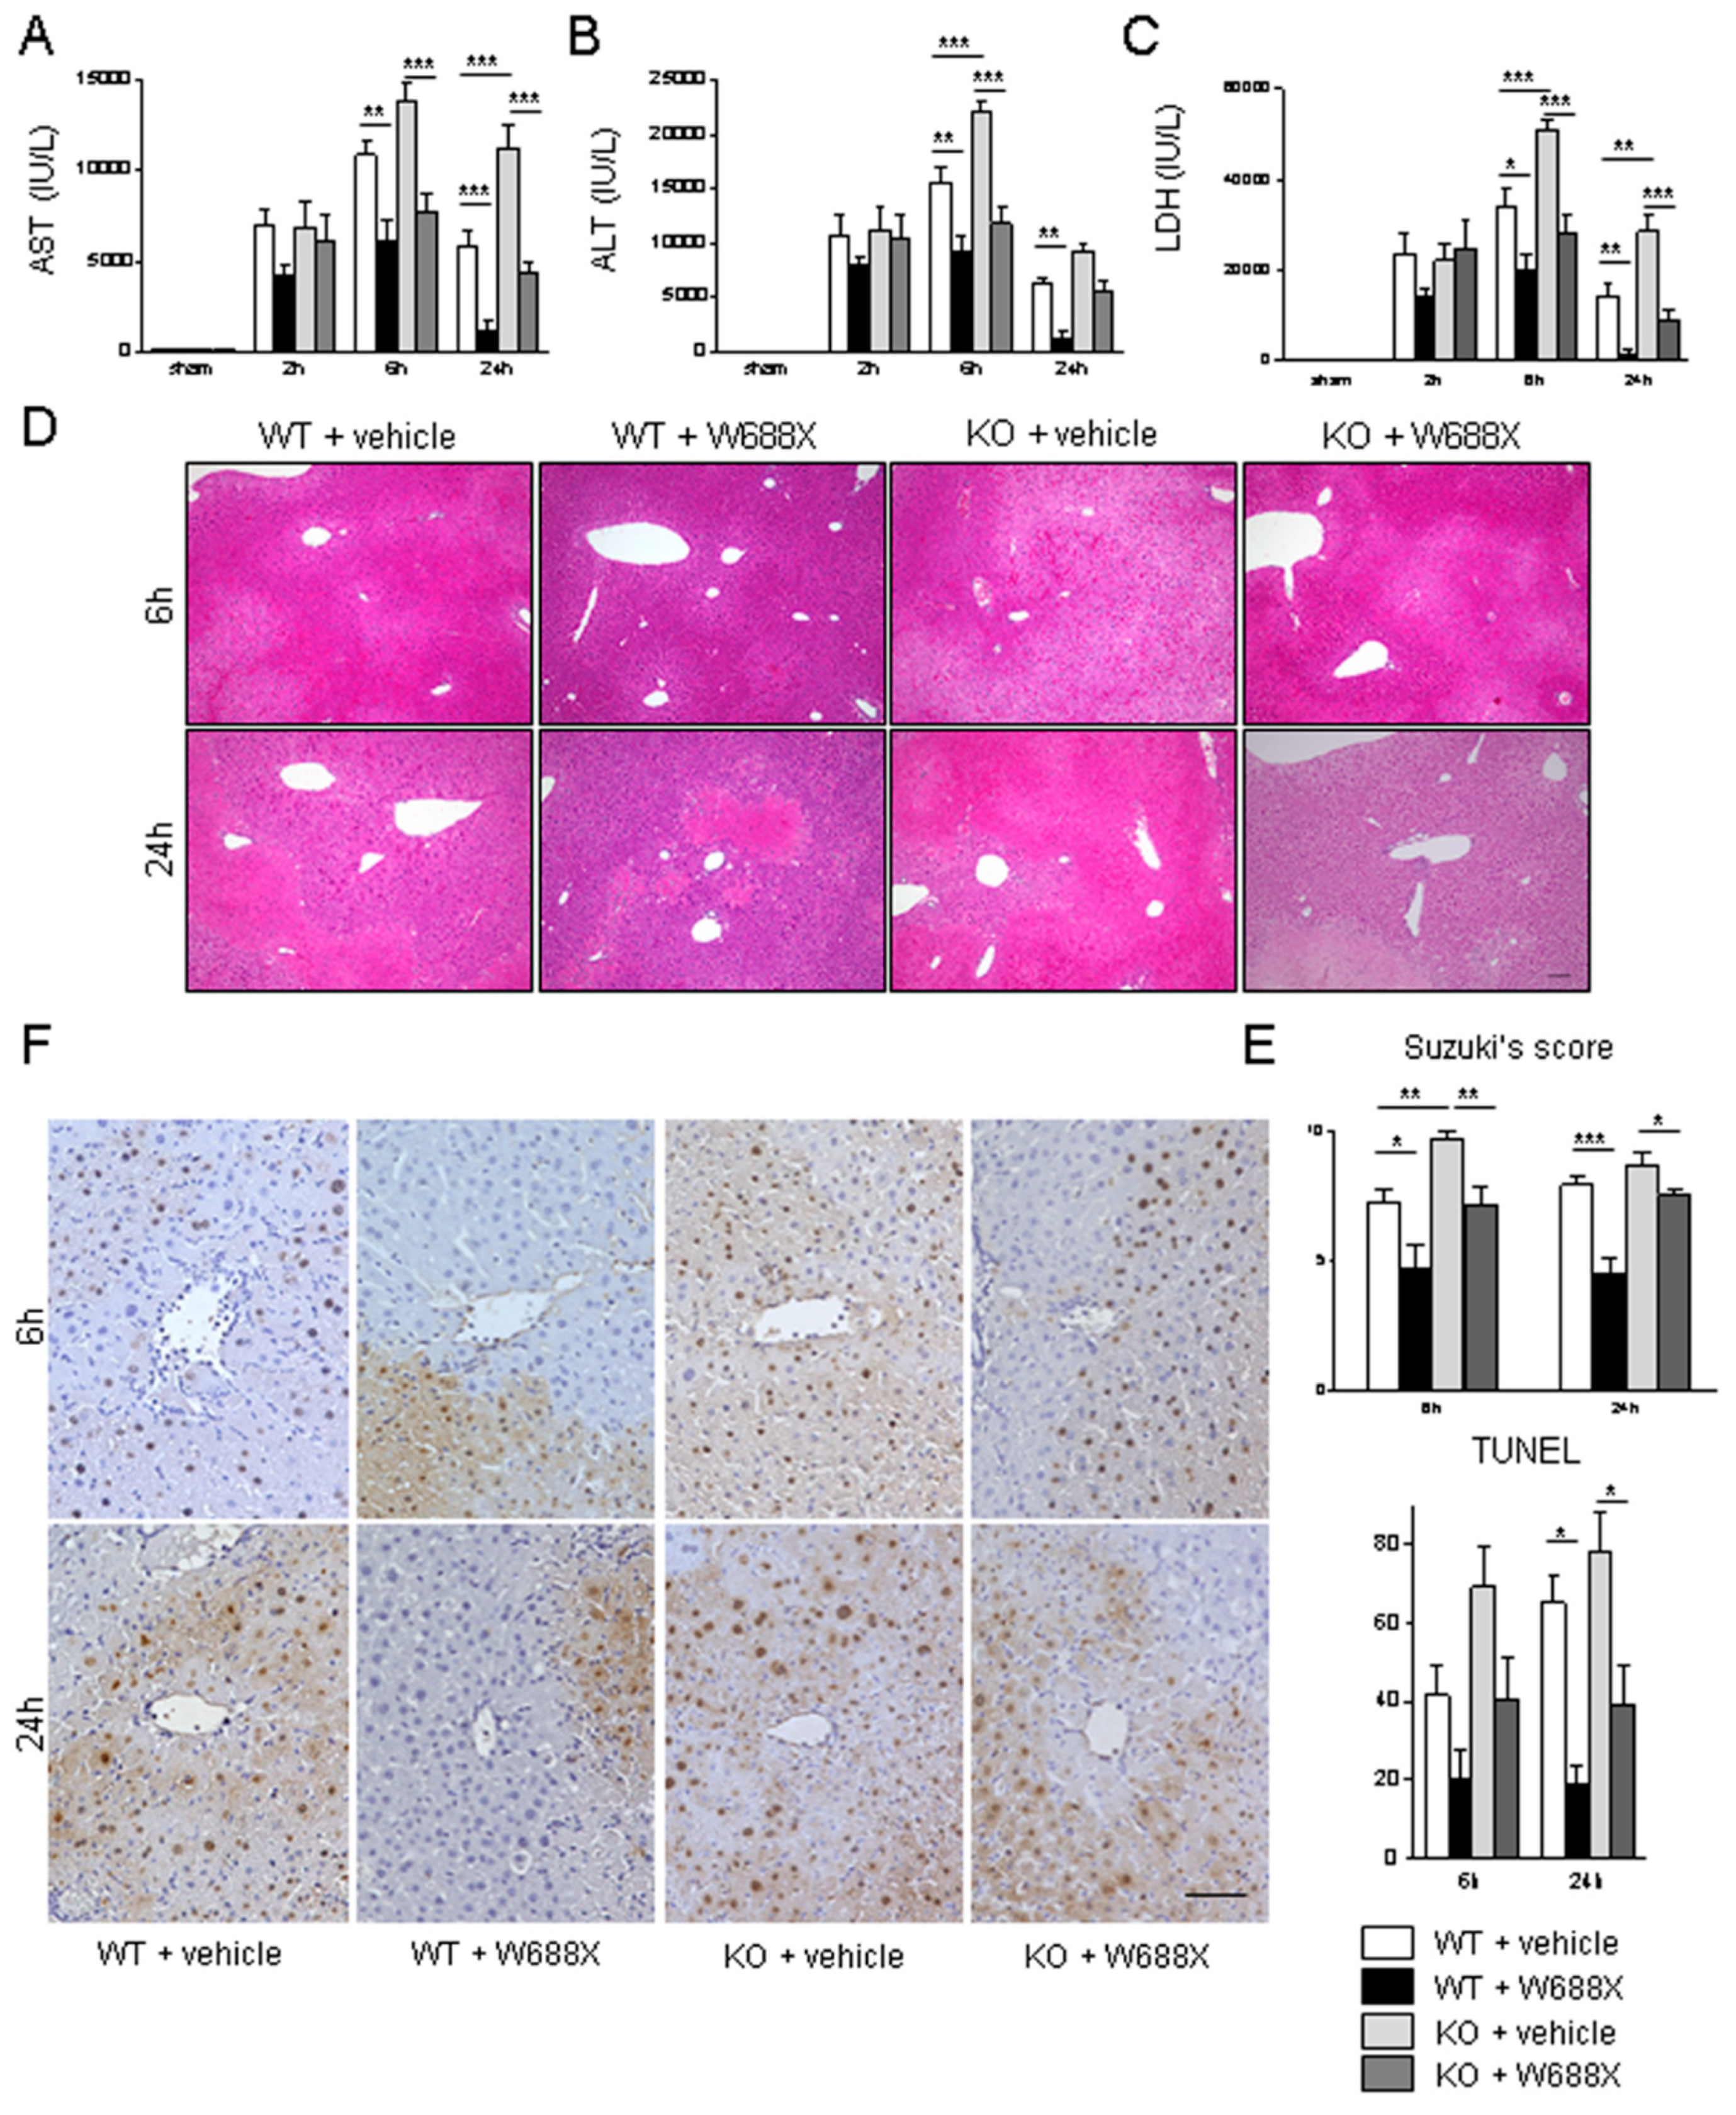
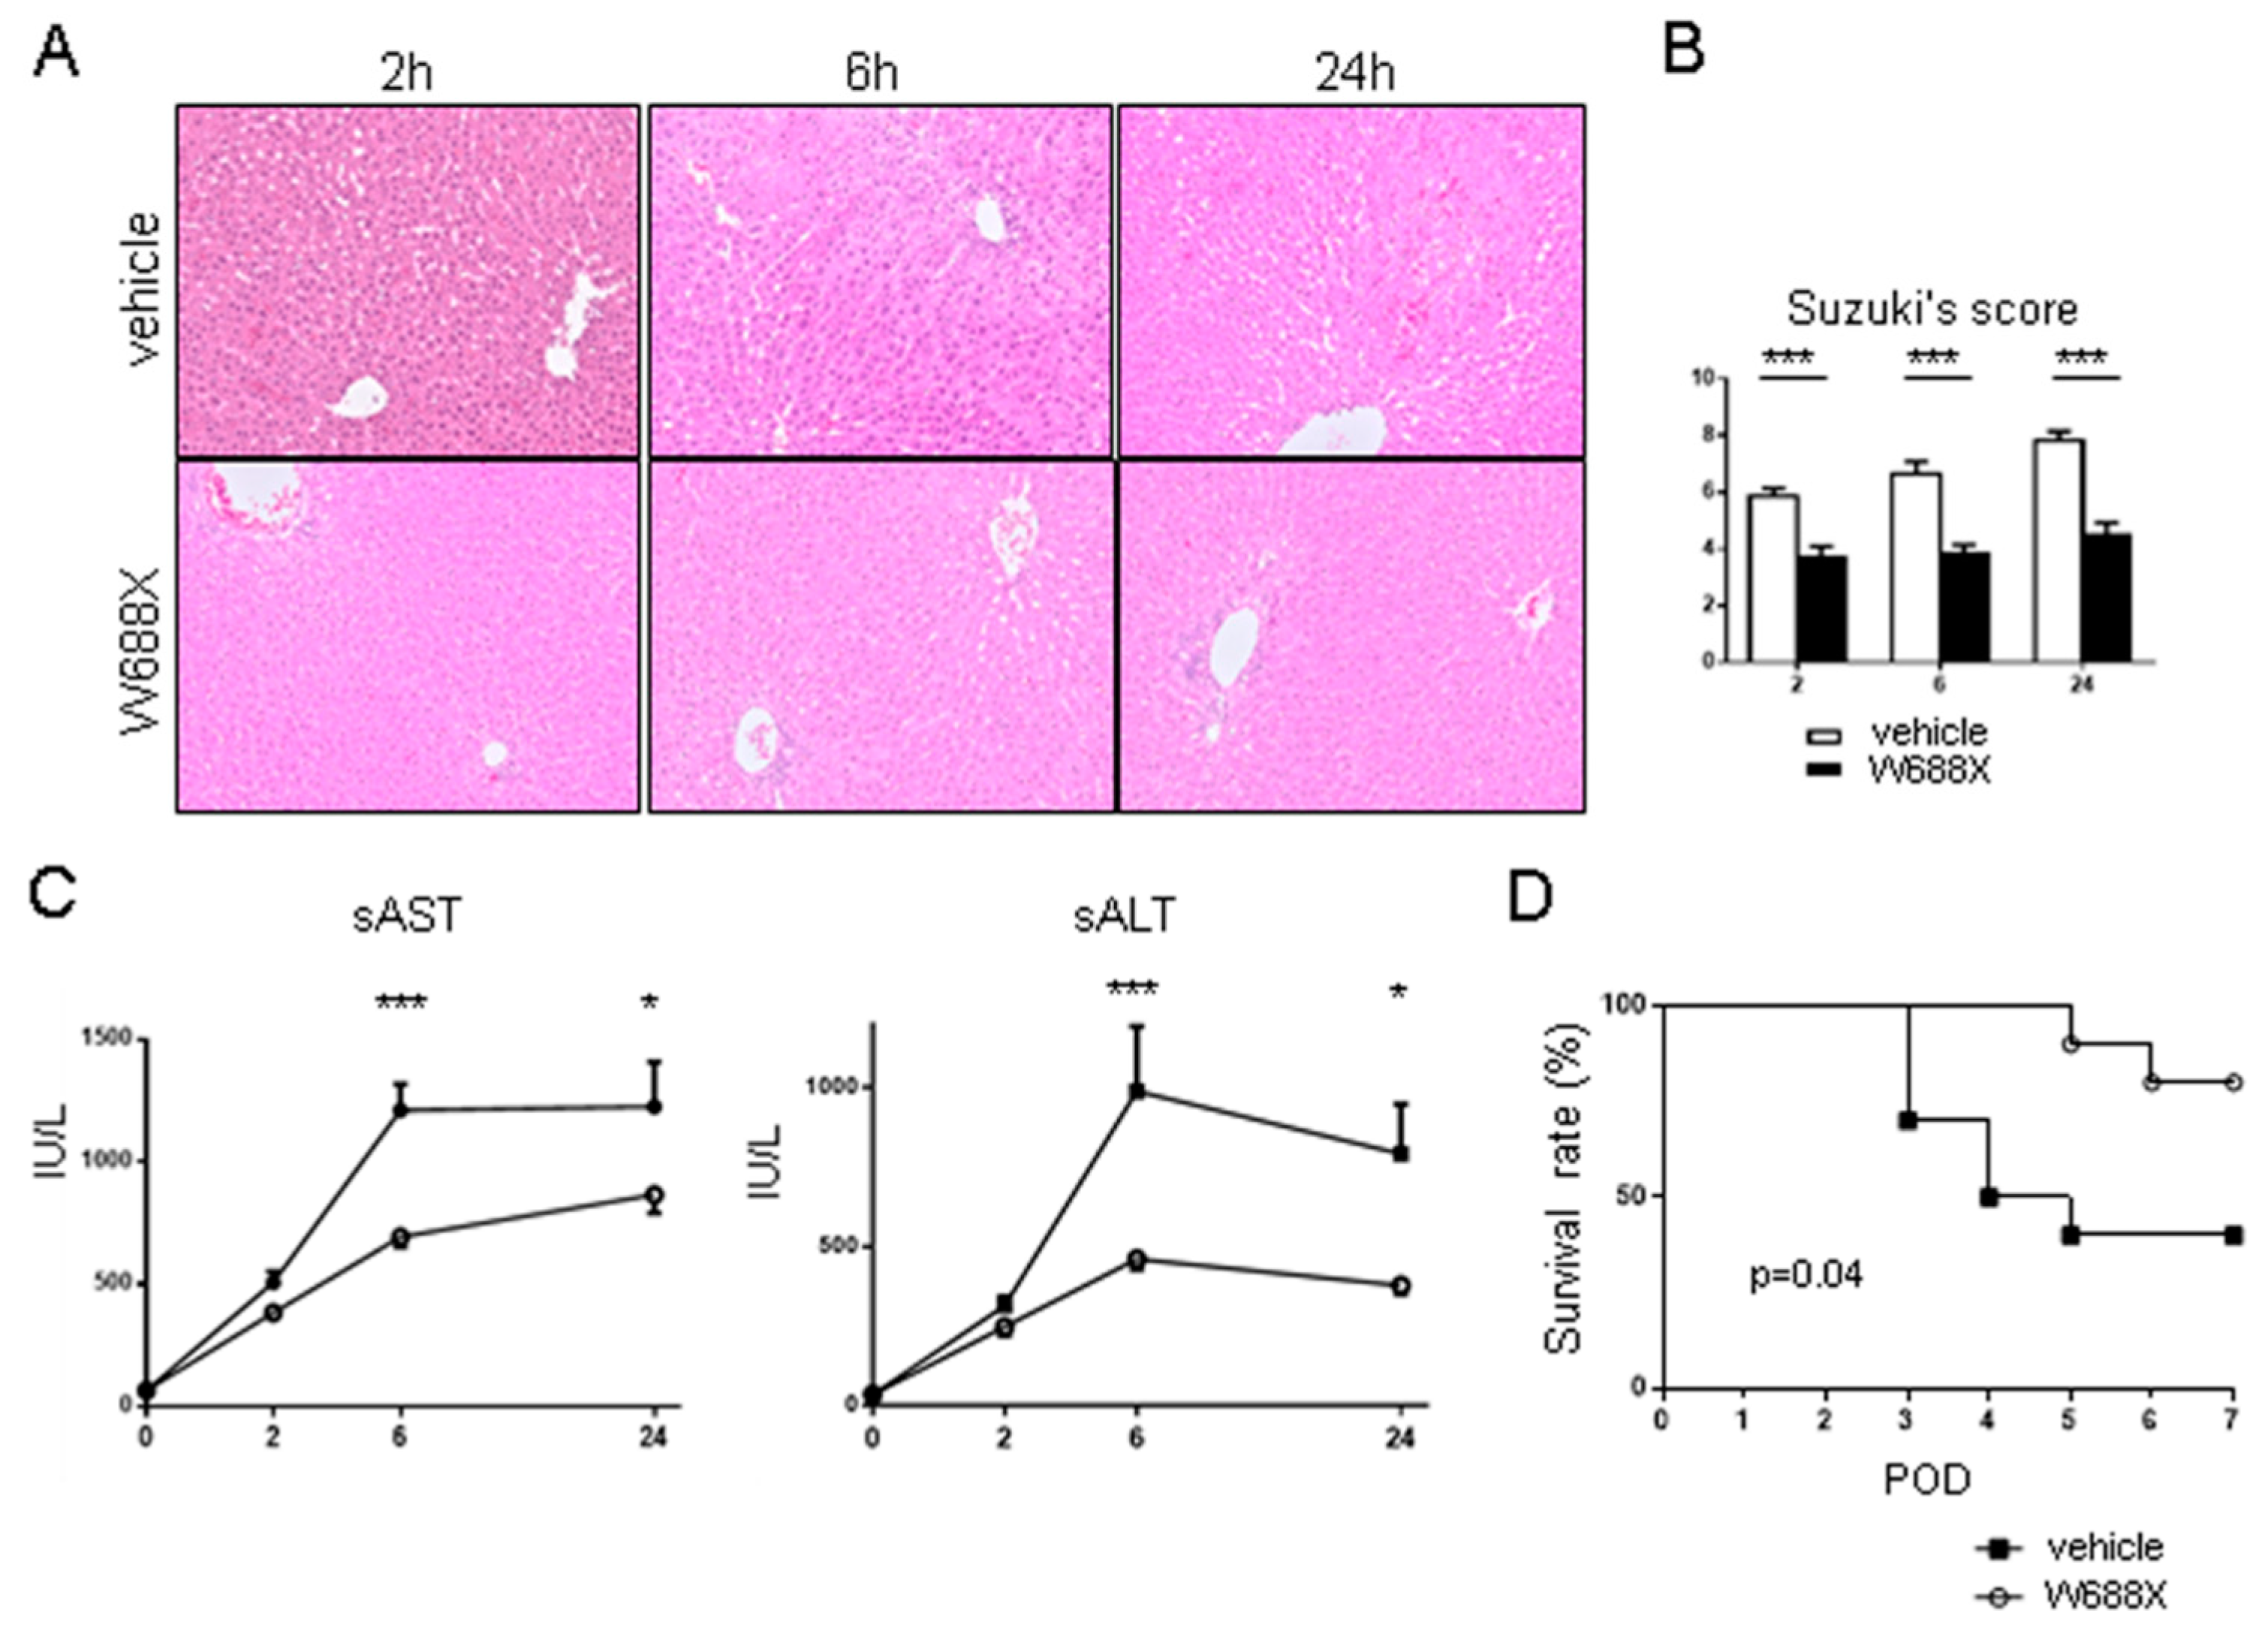
3.3. ADAMTS13 ameliorates IR-induced parenchymal damage
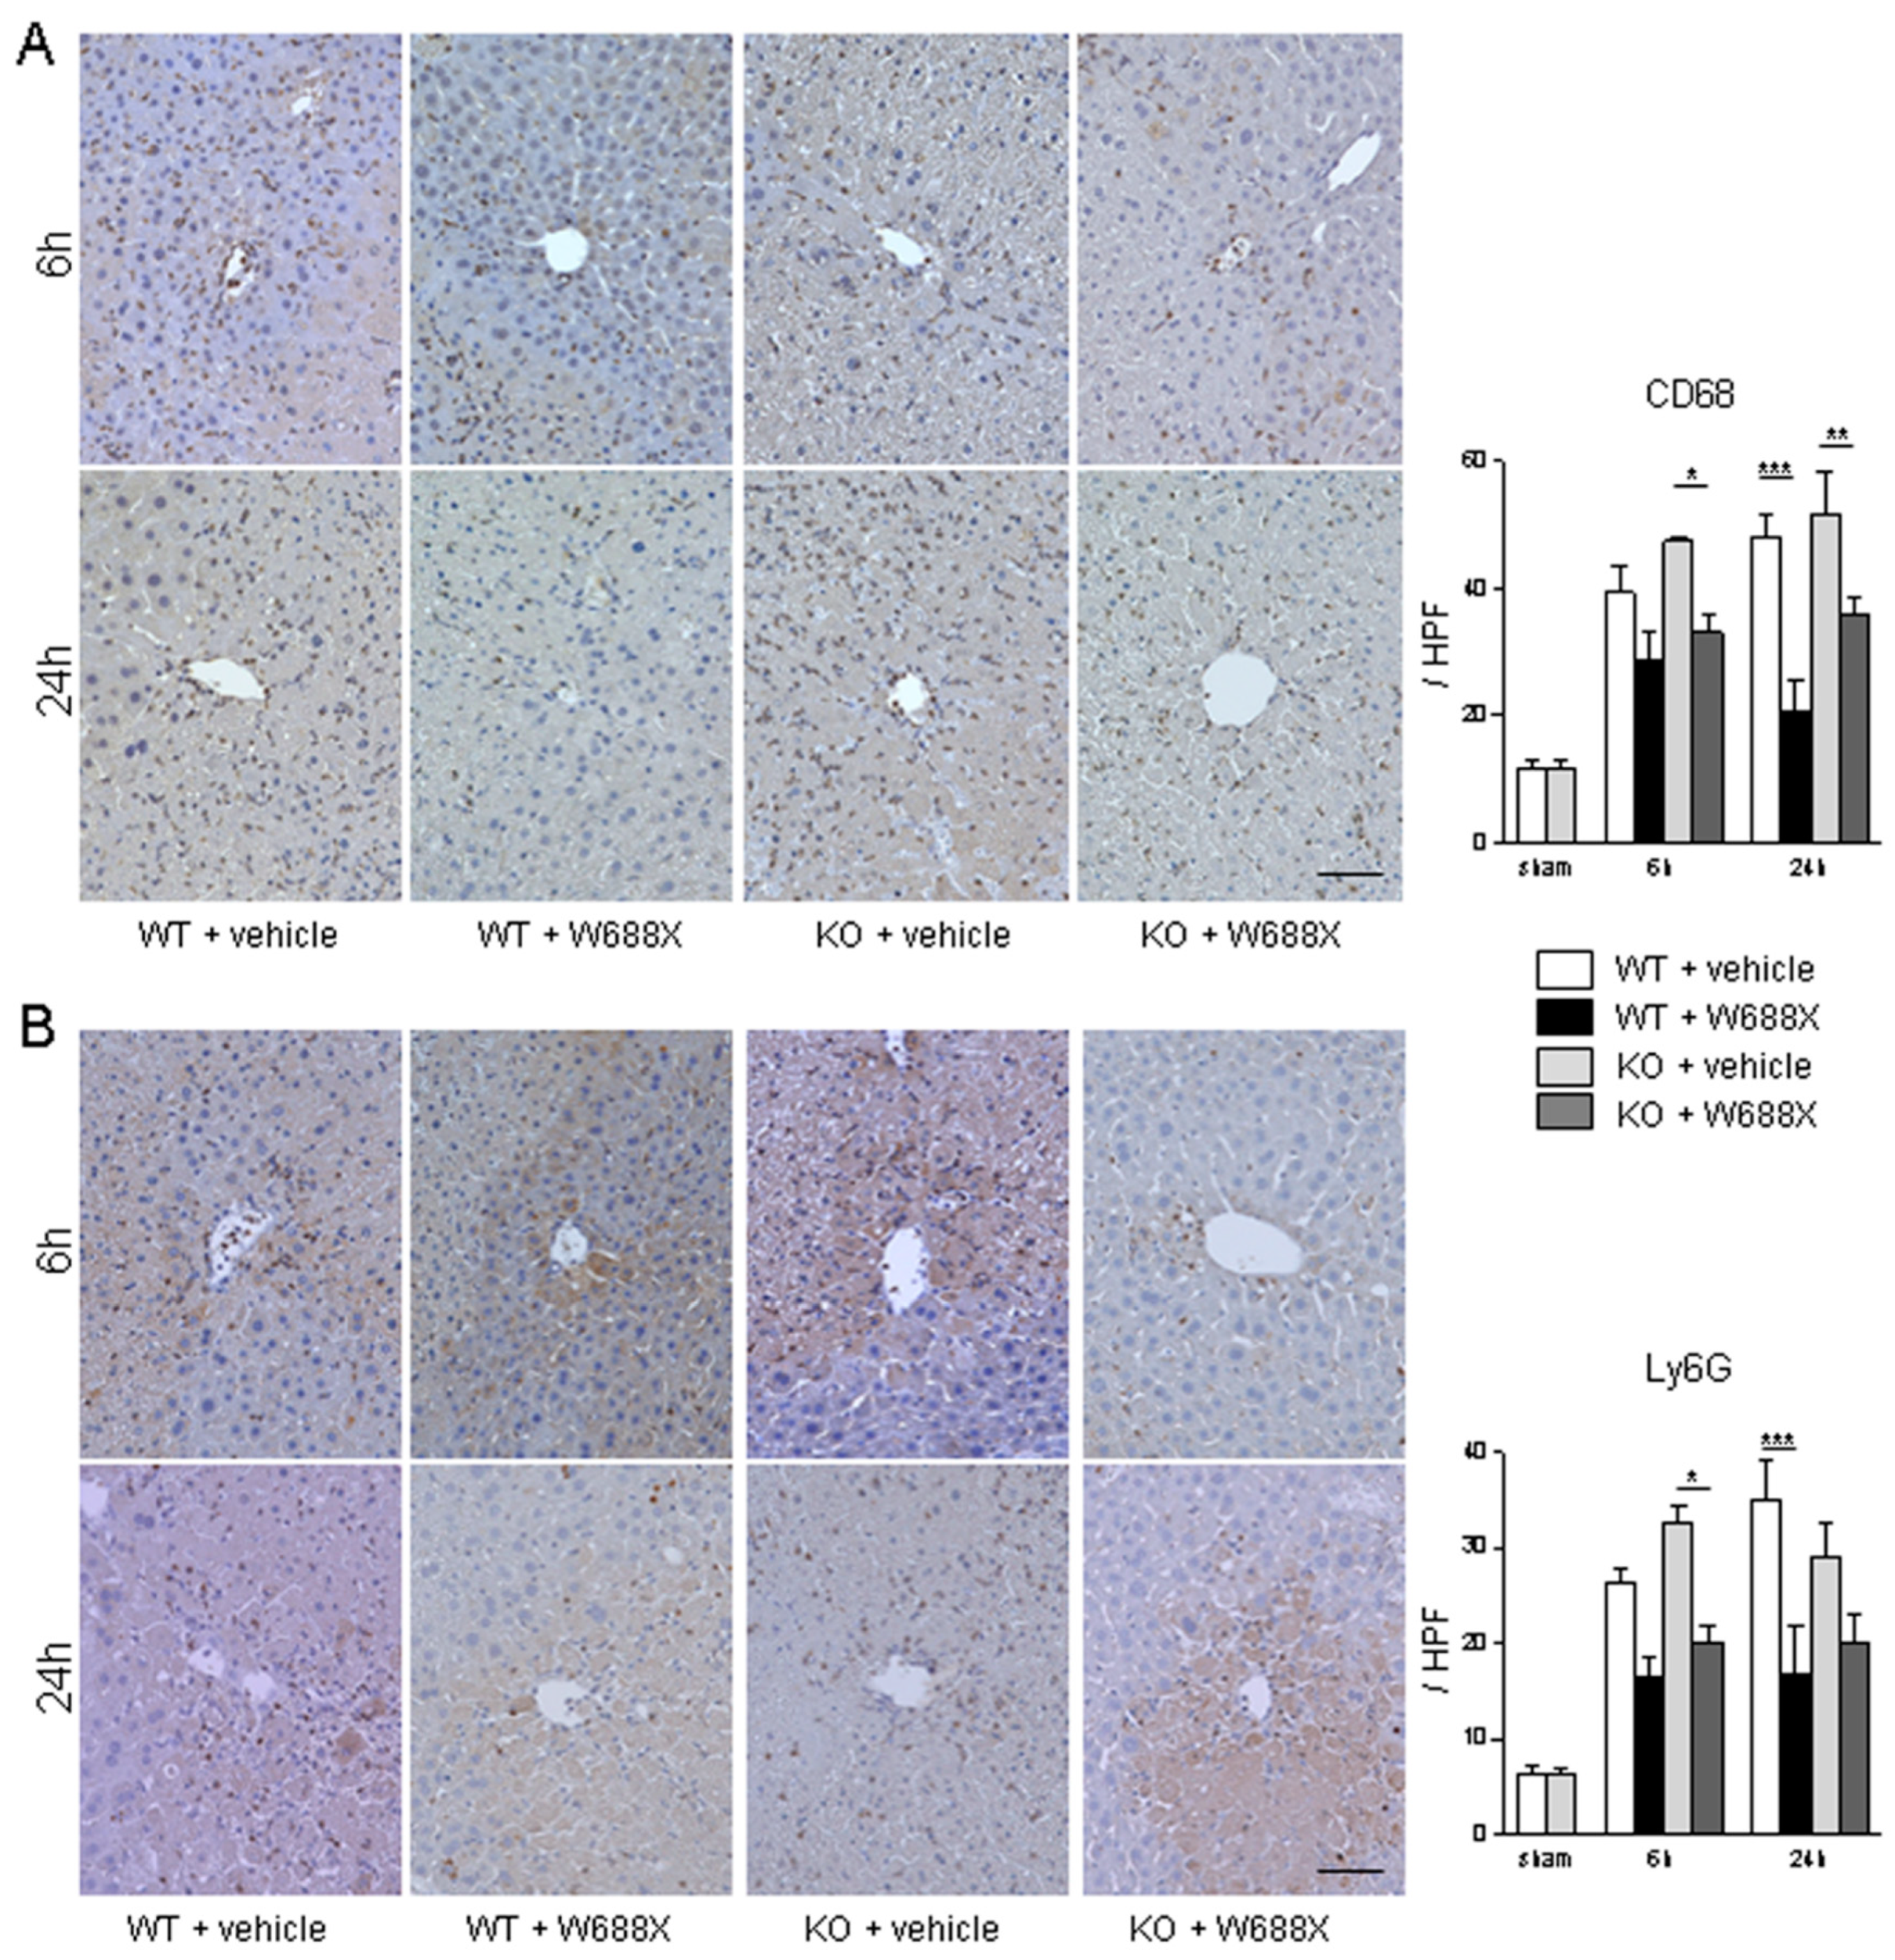
3.4. ADAMTS13 attenuates the infiltration of macrophages and neutrophils after hepatic IRI
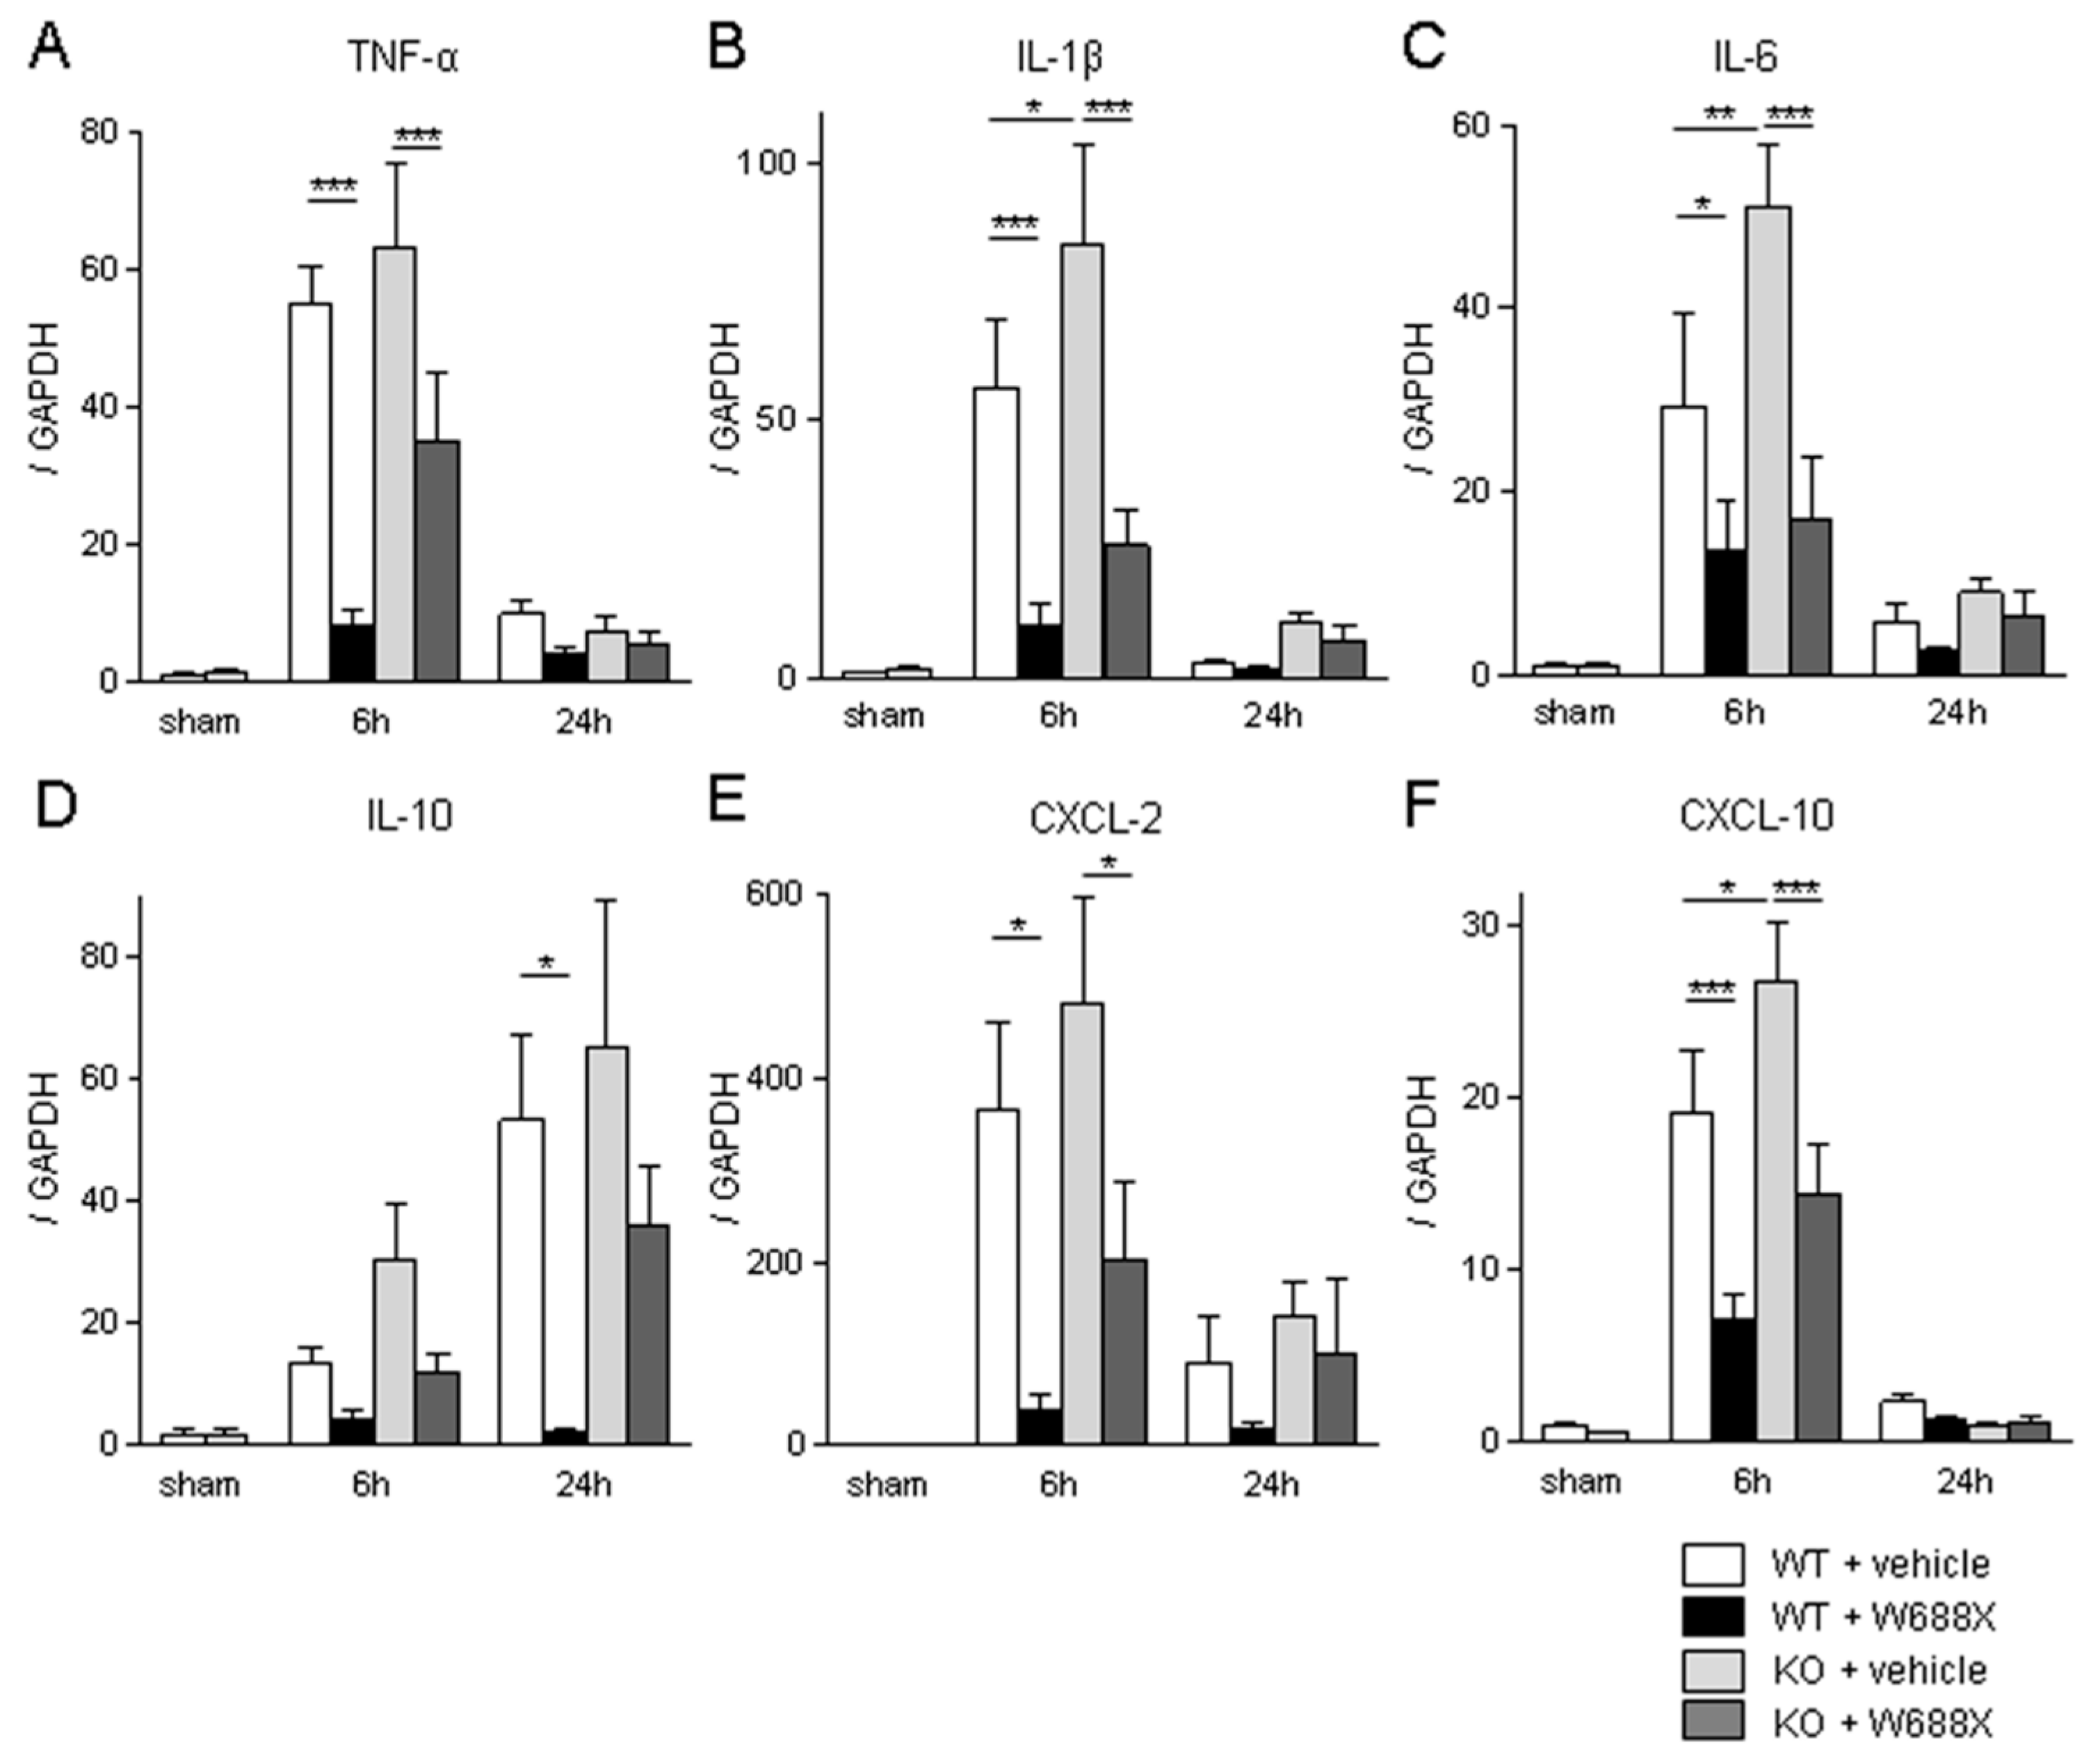
3.5. Influence of ADAMTS13 on pro-inflammatory cytokines and chemokines
3.6. ADAMTS13 suppresses LT stress-induced vWF upregulation and platelet aggregation within hepatic sinusoids and attenuates hepatic microcirculation
3.7. ADAMTS13 protects partial liver allografts from LT-related tissue damage
3.8. ADAMTS13 suppress tissue inflammatory cytokines and endothelin-1
4. Discussion
Supplementary Materials
Funding
Conflicts of Interest
References
- Balzan, S.; Belghiti, J.; Farges, O.; Ogata, S.; Sauvanet, A.; Delefosse, D.; Durand, F. The “50-50 criteria” on postoperative day 5: an accurate predictor of liver failure and death after hepatectomy. Ann Surg 2005, 242, 824-8, discussion 828-9. [Google Scholar] [CrossRef]
- Rahbari, N.N.; Reissfelder, C.; Koch, M.; Elbers, H.; Striebel, F.; Büchler, M.W.; Weitz, J. The predictive value of postoperative clinical risk scores for outcome after hepatic resection: a validation analysis in 807 patients. Ann Surg Oncol 2011, 18, 3640–9. [Google Scholar] [CrossRef]
- Paugam-Burtz, C.; Janny, S.; Delefosse, D.; Dahmani, S.; Dondero, F.; Mantz, J.; Belghiti, J. Prospective validation of the “fifty-fifty” criteria as an early and accurate predictor of death after liver resection in intensive care unit patients. Ann Surg 2009, 249, 124–8. [Google Scholar] [CrossRef]
- D.G. Farmer, F. Amersi, J. Kupiec-Weglinski, and R.W. Busuttil.
- Hirao, H.; Nakamura, K.; Kupiec-Weglinski, J.W. Liver ischaemia-reperfusion injury: a new understanding of the role of innate immunity. Nature reviews. Gastroenterology & hepatology 2022, 19, 239–256. [Google Scholar]
- Strong, R.W.; Lynch, S.V.; Ong, T.H.; Matsunami, H.; Koido, Y.; Balderson, G.A. Successful liver transplantation from a living donor to her son. The New England journal of medicine 1990, 322, 1505–7. [Google Scholar] [CrossRef] [PubMed]
- Riddiough, G.E.; Christophi, C.; Jones, R.M.; Muralidharan, V.; Perini, M.V. A systematic review of small for size syndrome after major hepatectomy and liver transplantation. HPB : the official journal of the International Hepato Pancreato Biliary Association 2020, 22, 487–496. [Google Scholar] [CrossRef]
- Uemura, T.; Wada, S.; Kaido, T.; Mori, A.; Ogura, Y.; Yagi, S.; Fujimoto, Y.; Ogawa, K.; Hata, K.; Yoshizawa, A.; Okajima, H.; Uemoto, S. How far can we lower graft-to-recipient weight ratio for living donor liver transplantation under modulation of portal venous pressure? Surgery 2016, 159, 1623–1630. [Google Scholar] [CrossRef] [PubMed]
- Coppo, P.; Veyradier, A.; Durey, M.A.; Fremeaux-Bacchi, V.; Scrobohaci, M.L.; Amesland, F.; Bussel, A. [Pathophysiology of thrombotic microangiopathies: current understanding]. Ann Med Interne (Paris) 2002, 153, 153–66. [Google Scholar] [PubMed]
- Rieger, M.; Ferrari, S.; Hovinga, J.A.K.; Konetschny, C.; Herzog, A.; Koller, L.; Weber, A.; Remuzzi, G.; Dockal, M.; Plaimauer, B.; Scheiflinger, F. Relation between ADAMTS13 activity and ADAMTS13 antigen levels in healthy donors and patients with thrombotic microangiopathies (TMA). Thromb Haemost 2006, 95, 212–20. [Google Scholar] [PubMed]
- Obert, V.B.; Houllier, A.; Meyer, D.; Girma, J.P. Specific von Willebrand factor-cleaving protease in thrombotic microangiopathies: a study of 111 cases. Blood 2001, 98, 1765–72. [Google Scholar]
- Bianchi, V.; Robles, R.; Alberio, L.; Furlan, M.; Lämmle, B. Von Willebrand factor-cleaving protease (ADAMTS13) in thrombocytopenic disorders: a severely deficient activity is specific for thrombotic thrombocytopenic purpura. Blood 2002, 100, 710–3. [Google Scholar] [CrossRef]
- Levy, G.G.; Nichols, W.C.; Lian, E.C.; Foroud, T.; McClintick, J.N.; McGee, B.M.; Yang, A.Y.; Siemieniak, D.R.; Stark, K.R.; Gruppo, R.; Sarode, R.; Shurin, S.B.; Chandrasekaran, V.; Stabler, S.P.; Sabio, H.; Bouhassira, E.E.; Upshaw, J.D.; Ginsburg, D.; Tsai, H.M. Mutations in a member of the ADAMTS gene family cause thrombotic thrombocytopenic purpura. Nature 2001, 413, 488–94. [Google Scholar] [CrossRef]
- Zhao, B.Q.; Chauhan, A.K.; Canault, M.; Patten, I.S.; Yang, J.J.; Dockal, M.; Scheiflinger, F.; Wagner, D.D. von Willebrand factor-cleaving protease ADAMTS13 reduces ischemic brain injury in experimental stroke. Blood 2009, 114, 3329–34. [Google Scholar] [CrossRef] [PubMed]
- Meyer, D.S.F.; Savchenko, A.S.; Haas, M.S.; Schatzberg, D.; Carroll, M.C.; Schiviz,, A.; Dietrich, B.; Rottensteiner, H.; Scheiflinger, F.; Wagner, D.D. Protective anti-inflammatory effect of ADAMTS13 on myocardial ischemia/reperfusion injury in mice. Blood 2012, 120, 5217–23. [Google Scholar] [CrossRef]
- Doi, M.; Matsui, H.; Takeda, H.; Saito, Y.; Takeda, M.; Matsunari, Y.; Nishio, K.; Shima, M.; Banno, F.; Akiyama, M.; Kokame, K.; Miyata, T.; Sugimoto, M. ADAMTS13 safeguards the myocardium in a mouse model of acute myocardial infarction. Thromb Haemost 2012, 108, 1236–8. [Google Scholar] [CrossRef]
- Gandhi, C.; Motto, D.G.; Jensen, M.; Lentz, S.R.; Chauhan, A.K. ADAMTS13 deficiency exacerbates VWF-dependent acute myocardial ischemia/reperfusion injury in mice. Blood 2012, 120, 5224–30. [Google Scholar] [CrossRef] [PubMed]
- Remuzzi, G.; Galbusera, M.; Noris, M.; Canciani, M.T.; Daina, E.; Bresin, E.; Contaretti, S.; Caprioli, J.; Gamba, S.; Ruggenenti, P.; Perico, N.; Mannucci, P.M.; I.R.o.R.a.F.H.T.T.t.p.h.u. syndrome, von Willebrand factor cleaving protease (ADAMTS13) is deficient in recurrent and familial thrombotic thrombocytopenic purpura and hemolytic uremic syndrome. Blood 2002, 100, 778–85. [Google Scholar] [CrossRef]
- Zheng, X.; Majerus, E.M.; Sadler, J.E. ADAMTS13 and TTP. Curr Opin Hematol 2002, 9, 389–94. [Google Scholar] [CrossRef] [PubMed]
- Gandhi, C.; Khan, M.M.; Lentz, S.R.; Chauhan, A.K. ADAMTS13 reduces vascular inflammation and the development of early atherosclerosis in mice. Blood 2012, 119, 2385–91. [Google Scholar] [CrossRef] [PubMed]
- Jin, S.Y.; Tohyama, J.; Bauer, R.C.; Cao, N.N.; Rader, D.J.; Zheng, X.L. Genetic ablation of Adamts13 gene dramatically accelerates the formation of early atherosclerosis in a murine model. Arterioscler Thromb Vasc Biol 2012, 32, 1817–23. [Google Scholar] [CrossRef]
- Soejima, K.; Mimura, N.; Hirashima, M.; Maeda, H.; Hamamoto, T.; Nakagaki, T.; Nozaki, C. A novel human metalloprotease synthesized in the liver and secreted into the blood: possibly, the von Willebrand factor-cleaving protease? J Biochem 2001, 130, 475–80. [Google Scholar] [CrossRef]
- Zheng, X.; Chung, D.; Takayama, T.K.; Majerus, E.M.; Sadler, J.E.; Fujikawa, K. Structure of von Willebrand factor-cleaving protease (ADAMTS13), a metalloprotease involved in thrombotic thrombocytopenic purpura. J Biol Chem 2001, 276, 41059–63. [Google Scholar] [CrossRef] [PubMed]
- Uemura, M.; Tatsumi, K.; Matsumoto, M.; Fujimoto, M.; Matsuyama, T.; Ishikawa, M.; Iwamoto, T.A.; Mori, T.; Wanaka, A.; Fukui, H.; Fujimura, Y. Localization of ADAMTS13 to the stellate cells of human liver. Blood 2005, 106, 922–4. [Google Scholar] [CrossRef] [PubMed]
- Suzuki, M.; Murata, M.; Matsubara, Y.; Uchida, T.; Ishihara, H.; Shibano, T.; Ashida, S.; Soejima, K.; Okada, Y.; Ikeda, Y. Detection of von Willebrand factor-cleaving protease (ADAMTS-13) in human platelets. Biochem Biophys Res Commun 2004, 313, 212–6. [Google Scholar] [CrossRef] [PubMed]
- Turner, N.; Nolasco, L.; Tao, Z.; Dong, J.F.; Moake, J. Human endothelial cells synthesize and release ADAMTS-13. J Thromb Haemost 2006, 4, 1396–404. [Google Scholar] [CrossRef]
- Manea, M.; Kristoffersson, A.; Schneppenheim, R.; Saleem, M.A.; Mathieson, P.W.; Mörgelin, M.; Björk, P.; Holmberg, L.; Karpman, D. Podocytes express ADAMTS13 in normal renal cortex and in patients with thrombotic thrombocytopenic purpura. Br J Haematol 2007, 138, 651–62. [Google Scholar] [CrossRef]
- Banno, F.; Kokame, K.; Okuda, T.; Honda, S.; Miyata, S.; Kato, H.; Tomiyama, Y.; Miyata, T. Complete deficiency in ADAMTS13 is prothrombotic, but it alone is not sufficient to cause thrombotic thrombocytopenic purpura. Blood 2006, 107, 3161–6. [Google Scholar] [CrossRef]
- Hirao, H.; Uchida, Y.; Kadono, K.; Tanaka, H.; Niki, T.; Yamauchi, A.; Hata, K.; Watanabe, T.; Terajima, H.; Uemoto, S. The protective function of galectin-9 in liver ischemia and reperfusion injury in mice. Liver Transpl 2015. [Google Scholar] [CrossRef]
- Soejima, K.; Matsumoto, M.; Kokame, K.; Yagi, H.; Ishizashi, H.; Maeda, H.; Nozaki, C.; Miyata, T.; Fujimura, Y.; Nakagaki, T. ADAMTS-13 cysteine-rich/spacer domains are functionally essential for von Willebrand factor cleavage. Blood 2003, 102, 3232–7. [Google Scholar] [CrossRef]
- Suzuki, S.; Toledo-Pereyra, L.H.; Rodriguez, F.J.; Cejalvo, D. Neutrophil infiltration as an important factor in liver ischemia and reperfusion injury. Modulating effects of FK506 and cyclosporine. Transplantation 1993, 55, 1265–72. [Google Scholar]
- Nagai, K.; Yagi, S.; Afify, M.; Bleilevens, C.; Uemoto, S.; Tolba, R.H. Impact of venous-systemic oxygen persufflation with nitric oxide gas on steatotic grafts after partial orthotopic liver transplantation in rats. Transplantation 2013, 95, 78–84. [Google Scholar] [CrossRef]
- Li, C.H.; Ge, X.L.; Pan, K.; Wang, P.F.; Su, Y.N.; Zhang, A.Q. Laser speckle contrast imaging and Oxygen to See for assessing microcirculatory liver blood flow changes following different volumes of hepatectomy. Microvasc Res 2017, 110, 14–23. [Google Scholar] [CrossRef]
- Kokame, K.; Nobe, Y.; Kokubo, Y.; Okayama, A.; Miyata, T. FRETS-VWF73, a first fluorogenic substrate for ADAMTS13 assay. Br J Haematol 2005, 129, 93–100. [Google Scholar] [CrossRef]
- Schneider, C.A.; Rasband, W.S.; Eliceiri, K.W. NIH Image to ImageJ: 25 years of image analysis. Nat Methods 2012, 9, 671–5. [Google Scholar] [CrossRef]
- Baruch, Y.; Neubauer, K.; Ritzel, A.; Wilfling, T.; Lorf, T.; Ramadori, G. Von Willebrand gene expression in damaged human liver. Hepatogastroenterology 2004, 51, 684–8. [Google Scholar]
- Hulstein, J.J.; van Runnard Heimel, P.J.; Franx, A.; Lenting, P.J.; Bruinse, H.W.; Silence, K.; de Groot, P.G.; Fijnheer, R. Acute activation of the endothelium results in increased levels of active von Willebrand factor in hemolysis, elevated liver enzymes and low platelets (HELLP) syndrome. J Thromb Haemost 2006, 4, 2569–75. [Google Scholar] [CrossRef] [PubMed]
- Rerolle, J.P.; Akposso, K.; Lerolle, N.; Mougenot, B.; Ponnelle, T.; Rondeau, E.; Sraer, J.D. Tacrolimus-induced hemolytic uremic syndrome and end-stage renal failure after liver transplantation. Clinical transplantation 2000, 14, 262–5. [Google Scholar] [CrossRef] [PubMed]
- Ramasubbu, K.; Mullick, T.; Koo, A.; Hussein, M.; Henderson, J.M.; Mullen, K.D.; Avery, R.K. Thrombotic microangiopathy and cytomegalovirus in liver transplant recipients: a case-based review. Transplant infectious disease : an official journal of the Transplantation Society 2003, 5, 98–103. [Google Scholar] [CrossRef] [PubMed]
- Shindoh, J.; Sugawara, Y.; Akamatsu, N.; Kaneko, J.; Tamura, S.; Yamashiki, N.; Aoki, T.; Sakamoto, Y.; Hasegawa, K.; Kokudo, N. Thrombotic microangiopathy after living-donor liver transplantation. American journal of transplantation : official journal of the American Society of Transplantation and the American Society of Transplant Surgeons 2012, 12, 728–36. [Google Scholar] [CrossRef] [PubMed]
- Hori, T.; Kaido, T.; Oike, F.; Ogura, Y.; Ogawa, K.; Yonekawa, Y.; Hata, K.; Kawaguchi, Y.; Ueda, M.; Mori, A.; Segawa, H.; Yurugi, K.; Takada, Y.; Egawa, H.; Yoshizawa, A.; Kato, T.; Saito, K.; Wang, L.; Torii, M.; Chen, F.; Baine, A.M.; Gardner, L.B.; Uemoto, S. Thrombotic microangiopathy-like disorder after living-donor liver transplantation: a single-center experience in Japan. World J Gastroenterol 2011, 17, 1848–57. [Google Scholar] [CrossRef] [PubMed]
- Green, D.; Tian, L.; Greenland, P.; Liu, K.; Kibbe, M.; Tracy, R.; Shah, S.; Wilkins, J.T.; Huffman, M.D.; Liao, Y.; Jones, D.L.; McDermott, M.M. Association of the von Willebrand Factor-ADAMTS13 Ratio With Incident Cardiovascular Events in Patients With Peripheral Arterial Disease. Clin Appl Thromb Hemost 2016. [Google Scholar] [CrossRef] [PubMed]
- Qu, L.; Jiang, M.; Qiu, W.; Lu, S.; Zhao, Y.; Xia, L.; Ruan, C. Assessment of the Diagnostic Value of Plasma Levels, Activities, Their Ratios of von Willebrand Factor and ADAMTS13 in Patients with Cerebral Infarction. Clin Appl Thromb Hemost 2016, 22, 252–9. [Google Scholar] [CrossRef] [PubMed]
- Sedaghat, S.; de Vries, P.S.; Boender, J.; Sonneveld, M.A.; Hoorn, E.J.; Hofman, A.; de Maat, M.P.; Franco, O.H.; Ikram, M.A.; Leebeek, F.W.; Dehghan, A. von Willebrand Factor, ADAMTS13 Activity, Decline in Kidney Function: A Population-Based Cohort Study. Am J Kidney Dis 2016, 68, 726–732. [Google Scholar] [CrossRef]
- Sonneveld, M.A.; Franco, O.H.; Ikram, M.A.; Hofman, A.; Kavousi, M.; de Maat, M.P.; Leebeek, F.W. Von Willebrand Factor, ADAMTS13, the Risk of Mortality: The Rotterdam Study. Arterioscler Thromb Vasc Biol 2016, 36, 2446–2451. [Google Scholar] [CrossRef]
- Caprioli, J.; Remuzzi, G.; Noris, M. Thrombotic microangiopathies: from animal models to human disease and cure. Contrib Nephrol 2011, 169, 337–50. [Google Scholar] [PubMed]
- Darmon, M.; Azoulay, E.; Thiery, G.; Ciroldi, M.; Galicier, L.; Parquet, N.; Veyradier, A.; Le Gall, J.R.; Oksenhendler, E.; Schlemmer, B. Time course of organ dysfunction in thrombotic microangiopathy patients receiving either plasma perfusion or plasma exchange. Crit Care Med 2006, 34, 2127–33. [Google Scholar] [CrossRef] [PubMed]
- Federici, L.; Klouche, K.; Amigues, L.; Kanouni, T.; Lopez-Martinez, E.; Latry, P.; Beraud, J.J.; Rossi, J.F. Outcome and prognosis of severe thrombotic microangiopathies treated by plasma exchange. Med Sci Monit 2006, 12, CR302–7. [Google Scholar]
- Nguyen, T.C.; Han, Y.Y. Plasma exchange therapy for thrombotic microangiopathies. Organogenesis 2011, 7, 28–31. [Google Scholar] [CrossRef]
- Pisoni, R.; Ruggenenti, P.; Remuzzi, G. Drug-induced thrombotic microangiopathy: incidence, prevention and management. Drug Saf 2001, 24, 491–501. [Google Scholar] [CrossRef]
- Zakarija, A.; Bennett, C. Drug-induced thrombotic microangiopathy. Semin Thromb Hemost 2005, 31, 681–90. [CrossRef]
- Urokinase: new indication. Thrombosed venous and dialysis catheters: when heparin fails. Urokinase clears about 75% of thrombosed venous catheters intended for long-term use with a dose-related increase in the bleeding risk. Prescrire Int 2009, 18, 118.
- Singer, J.O.C.; Berkefeld, M.W.; Lorenz, J.; Fiehler, G.W.; Albers, M.G.; Lansberg, A.; Kastrup, A.; Rovira, D.S.; Liebeskind, A.; Gass, C.; et al. Investigators, Risk of symptomatic intracerebral hemorrhage in patients treated with intra-arterial thrombolysis. Cerebrovasc Dis 2009, 27, 368–74. [Google Scholar] [CrossRef] [PubMed]
- Vora, N.A.; Gupta, R.; Thomas, A.J.; Horowitz, M.B.; Tayal, A.H.; Hammer, M.D.; Uchino, K.; Wechsler, L.R.; Jovin, T.G. Factors predicting hemorrhagic complications after multimodal reperfusion therapy for acute ischemic stroke. AJNR Am J Neuroradiol 2007, 28, 1391–4. [Google Scholar] [CrossRef] [PubMed]

Disclaimer/Publisher’s Note: The statements, opinions and data contained in all publications are solely those of the individual author(s) and contributor(s) and not of MDPI and/or the editor(s). MDPI and/or the editor(s) disclaim responsibility for any injury to people or property resulting from any ideas, methods, instructions or products referred to in the content. |
© 2024 by the authors. Licensee MDPI, Basel, Switzerland. This article is an open access article distributed under the terms and conditions of the Creative Commons Attribution (CC BY) license (http://creativecommons.org/licenses/by/4.0/).


