
Submitted:
30 January 2024
Posted:
30 January 2024
You are already at the latest version
Abstract
Cities are especially vulnerable to heavy rainfall events and the associated flooding. Urban drainage systems are not dimensioned to handle extreme heavy rainfall events, there is a need to enhance the resilience of those systems. Nature-based solutions (NBS) have the potential to retrofit existing urban drainage systems by providing, among other benefits, storage volume. This study presents an approach for including NBS with different degrees of implementation in a 1D/2D model and investigates their potential for flood mitigation in a study area in Berlin. The analyzed NBS are infiltration systems (e.g. infiltration swales) dimensioned to return periods of T = 5 and 100 years, various green roofs and tree locations (e.g. tree trenches). The NBS are represented by SWMM LID elements. The results show that overall the mitigation effect of NBS declines with increasing rainfall intensities. However, infiltration systems dimensioned to T = 100 years achieve almost three times the flood reduction compared to systems dimensioned to T = 5 years, even during extreme heavy rainfall events (100 mm), resulting in a reduced total flood volume of 15.1% to 25.8%. Overall, green roofs (excluding extensive green roofs) provide the greatest flood reduction (33.5%), while tree locations have the least effect.
Keywords:
NBS
; SWMM LID
; 1D/2D flood modelling
; flood mitigation
; infiltration systems
; swales
; green roofs
; tree trenches
1. Introduction
The negative impacts of the climate change like an increase in heavy rainfall events [1,2], affects cities in particular: High levels of surface sealing intensifies the runoff, which leads to flooding. With around 57% of the global population living in cities (83% in North America and 75% in Europe [3], the number of people affected is very high and ever increasing: It is expected, that in 2030 the figure is 60% [4]. In addition to the risk to life, there is also the economic damage caused by flooding due to the high accumulation of tangible assets in cites. Urban drainage systems are traditionally grey infrastructure with the goal to convey the stormwater out of urban areas [5]. However, they cannot be dimensioned for extreme rainfall events due to technical and economic reasons [6]. Thus, there is a need to improve the resilience of existing urban drainage systems against extreme heavy rainfall events [7].
The above-mentioned problems are considered to be mitigated by nature-based solution (NBS). NBS describe both natural and engineered systems that use and enhance physical, chemical and microbiological treatment processes [8]. According to the European Commission, they are inspired by nature, cost-efficient and promote resilience towards the impacts due to climate change [9]. From an urban drainage perspective, there are a number of other names for NBS: Sustainable urban drainage systems (SUDS), low impact development (LID) and blue-green infrastructure (BGI) to name a few [5]. NBS can be categorized in central and decentral NBS: Central NBS are incorporated in the drainage system, for example a rainwater retention basin at the outlet of a catchment. Decentral NBS are located at the source of the runoff before it enters the drainage system and are therefore widespread over the study area. In this study, decentral NBS are investigated and will be just referred to as NBS in the following. Examples of measures are infiltration swales, green roofs and unsealing of paved surfaces, which promote infiltration and storing as well as delaying of stormwater runoff. Other positive effects are the reduction of heat stress through evapotranspiration and increasing biodiversity [10,11]. Existing urbane drainage system can be retrofitted with NBS, which detain or delay the runoff before entering the sewer and thus improve the resilience of the drainage system.
The quantitative reduction in flooding due to NBS is highly case sensitive to the case study area. For the quantification, mainly models are used due to the lack of data from actual field measurements or other data [12]. The main model approaches used in urban drainage are 1D, 2D or 1D/2D coupled models. 1D models cannot simulate the flooding on the 2D surface [13], whereas 2D models do not consider the drainage systems. Dual-drainage concepts as 1D/2D coupled models provide the most detailed representation of an urban catchment with its topography, path-modifying elements (buildings, curbs) and the sewer system [14,15].
Webber et al. apply a cellular automata-based rapid framework to predict the effect of different green infrastructure scenarios in an urban catchment (approx. 15 km²) in Melbourne [16]. The scenarios are implemented in the model by editing the rainfall input for areas occupied by green infrastructure. Haghighatafshar et al. investigate the efficiency of blue-green stormwater retrofits in a catchment (19.3 ha) in Augustenborg, Malmö [17]. The stormwater control measures are represented in the 2D zone with an infiltration rate and a storage volume of the infiltration layer. However, with this approach it is not possible to model the underdrain of a green roof. Ortega Sandoval et al. use a 1D/2D model in a densely populated catchment (50 ha) of Bogota to evaluate the effect of SUDS represented by the SWMM LID [18].
There is a need to determine the effect of NBS for flood mitigation on a mesoscale level in an urban catchment with a 1D/2D coupled model, including detailed modelling of NBS elements. The Storm Water Management Model (SWMM) [19] is widely used for the representation of NBS with its LID elements [18,13]. A lot of studies have been conducted where the observed data from experimental NBS was used for the validation and calibration of the LID model approach in SWMM [20,21,22]. For this reason, the SWMM LID elements are used to represent the NBS in this study.
This study presents a method to implement NBS in a 1D/2D coupled model with the aim to quantify their effectiveness in flood mitigation in a densely populated catchment. The effect of different infiltration systems, green roofs as well as tree trenches and tree pits is compared based on design rains with varying return periods and rainfall distributions. In addition, the influence of the spatial distribution of NBS in the study area is investigated.
2. Materials and Methods
2.1. Study area and 1D/2D-Model
The topographically flat study area is located in the center of Berlin, Germany and covers an area of 3.4 km². Figure 1 shows catchment area, which is delineated by its sewer catchment and in the north, east and south by bodies of waters. The highly urbanized area consists of 0.98 km² roofs, 0.76 km² streets, 0.62 km² yard and walk or bikeways and 1.03 km² of pervious green area. There are 3256 street trees located in the study area.
A 1D/2D surface runoff model was created for the study area using the software InfoWorks ICM (version 2023.2). The 1D sewer model was provided by the municipal water services of Berlin (Berliner Wasserbetriebe (BWB)). It is a combined sewer system and consists of 1,382 manholes, 1.,619 conduits, 1 pumping station and 19 stormwater overflows. In addition, the BWB provided the location of 1,801 street inlets, which were integrated into the model. The street inlets and the manholes act as coupling points between the 1D sewer and the 2D surface model.
The 2D surface model was set up using open geo data from the geoportal of Berlin (FIS-Broker) from the Senate Department for Urban Development, Building and Housing [23]. It is based on the digital elevation model with a resolution of 1 m² (DEM1). As impervious surfaces, the street and yard as well as the walk- and bikeway areas are modelled 2D and the rainfall is applied directly to them. The roof areas are modelled as subcatchments, which are connected to nearest manhole. Table 1 lists the impervious surfaces with their corresponding discharge and roughness coefficient. The discharge coefficients are based on the recommended values from the German guideline DWA-A 138-1 [24] for the dimensioning of infiltration systems, the roughness coefficients are from literature [25]. The roof area has no roughness coefficient because it is modelled as a subcatchment and not as a 2D surface.
All other areas are defined as pervious. It is assumed that this pervious area is green space. The soil type in the entire study area is medium sand so the infiltration process can be modelled with one set of parameters. The infiltration of the green space with medium sand as natural soil is modelled using the Horton infiltration approach, whereby the following parameters are used:
- Initial infiltration rate: 127 mm/hr
- Final infiltration rate: 8.34 mm/hr
- Decay constant: 64 1/h
The roughness coefficient of the green area is selected as n = 0.0286 s · m-1/3 the value for green space in urban areas according to Hürter [25].
The 1D/2D-Model without NBS described here will be referred to as the base model in the following.
2.2. Description and dimensioning of the decentral NBS
Figure 2 shows the various investigated decentral NBS. They are categorised in infiltration systems (swale, infiltration trench, swale-trench-element), green roofs (intensive and extensive green roof, retention roof) and tree locations (tree pit, tree trench).
In a swale, stormwater runoff from impervious surfaces, such as roofs and streets, is collected and infiltrated through the natural soil. The infiltration trench is an underground storage for stormwater runoff, from where the stormwater exfiltrates in the soil. The swale-trench-element is a combination of a swale with an infiltration trench underneath [26]. In this element the overflow from the swale by-passes the soil layer and enters the infiltration trench directly via a pipe.
Extensive green roofs are vegetated with low-maintenance vegetation like moos, succulent and grass. Under the comparatively thin substrate layer is a drainage layer. Intensive green roofs can be vegetated with a large variety of plants: With simple grass, shrubs or even small trees. The substrate layer is bigger and there is also a drainage layer underneath. Retention roofs can be designed as either extensive or intensive green roofs: the special feature is the retention layer under the substrate layer, in which stormwater is stored in a porous medium.
In a tree pit, the stormwater runoff from adjacent roads and sideways is channeled directly to the tree grid. In addition, a tree trench has an infiltration trench at the bottom of the planting pit [27].
2.2.1. Dimensioning of the infiltration systems
In a first step, the infiltration systems were pre-designed for return periods of 5- and 100-years according to the German DWA guideline DWA-A 138-1 [24]. The systems were implemented into the model with the determined areas from the pre-design. The system areas were adjusted based on simulation results with the aim, that an overflow from the system only occurs for a rainfall load with a return period higher than the return period from the pre-design. Table 2 lists final dimensions of the infiltration systems.
The AIS : Aim ratio is the main output: It is the ratio between the area of the infiltration system and the connected impervious area of 1000 m². This ratio can be used to calculate the required area of infiltration systems depending on the connected impervious area:
AIS = (AIS : Aim) · 0,01 · AIM
However, this only applies to this study area with its specific rainfall data and soil properties.
2.2.2. Structure of the green roofs
In contrast to infiltration systems, green roofs are not designed to manage specific storm events. The effect on stormwater runoff is not a design goal. There are a variety of combinations of vegetation, soil layer substrate and thickness as well as drainage elements. For this reason, a representative structure is defined for each of the three types of green roofs - extensive, intensive and retention roof (Table 3). The structures are mainly based on recommendations from the German guideline for green roofs [28].
2.2.3. Structure and dimensioning tree pits and tree trenches
Contrary to the other NBS, the system size of the tree pits and the tree trench are not adjusted based on the connected impervious area. Instead, a standard setup is defined for both systems and the connectable impervious area is adjusted. The reason for this is the boundary conditions: A minimum volume of the planting pit must be provided for the development of the tree and the size of the system must not fall below this volume. The maximum volume of the planting pit is also restricted due to the limited space available in the street space where the tree locations are located.
The structure of the tree pit and the tree trench (Table 4) are based on the recommendations and practical experience on vital tree sites from the BlueGreenStreets project [27]. The dimension of the tree pit and the tree trench are as followed:
- Tree grid: area of 6 m² (minimum area according to the German guideline for tree plantings [29]
- Planting pit: area of 9 m², total volume of 13.5 m³ for the tree pit and 18.9 m² for the tree trench (recommended minimum volume of the planting pit of 12 m³ according to the German guideline for tree plantings [29]
The tree pit and tree trench were implemented in the model with the here described standard setups and simulations carried out while adjusting the connected impervious area. The calibration goal was that an overflow out of the tree locations only occurs from a rainfall load with a return period higher than T = 5 a. For the tree pit an impervious area of 78 m² respectively 120 m² for the tree trench can be connected.
2.3. Modelling of the NBS and model parameters
2.3.1. Model approach
In the simulation software InfoWorks ICM NBS are modelled as Sustainable Urban Drainage System (SUDS) elements, which are based on the Low Impact Development (LID) objects from SWMM and use the same model approach. The SUDS elements have a horizontal layer structure. Figure 3 shows a bio-retention cell with its corresponding layers as a generic example of a SUDS element. The detailed modelling approaches for each layer are describes in Rossman and Huber [30].
Table 5 lists the investigated NBS and their representation in the model as SUDS elements with the corresponding layers. The swale-trench-element is modelled as an infiltration trench, which is made up of the surface and the storage layer. The soil layer is not represented in the model as it is by-passed in extreme events. The water infiltrates directly into the infiltration trench, and ponding in the swale occurs only after the infiltration trench is completely filled.
The retention roof is modelled with the SUDS element bio-retention cell. This allows for the integration of a storage layer.
For all NBS the evaporation process is disregarded because the focus of this work are short intense heavy rainfall events.
2.3.2. Model parameters
Table 6 lists the selected model parameters and layers for NBS. The soil parameters of the swale are the standard parameters for sand in InfoWorks ICM / SWMM [31]. The storage layer of the infiltration trench has a storage void ratio of 9, which corresponds to a pore volume of 90%. The seepage rate of 120.4 corresponds to the hydraulic conductivity of the soil sand.
2.4. Integration of the NBS in the 1D/2D-Model
2.4.1. Implementation of the NBS
Scenarios with varying degrees of NBS implementation were modelled and evaluated. In all scenarios only roof areas were connected to infiltration systems while streets and sidewalks were connected to tree pitches and tree trenches. The reason why only roofs and no other impervious areas are connected to infiltration systems is due to 1D/2D model approach: the roofs are already implemented as 1D subcatchments and can be easily modified to represent infiltration systems or green roofs. Other impervious areas like courtyards are modelled 2D. To connect them to an infiltration system, they must be inserted into the model again as a 1D subcatchment, which is very time-consuming.
The infiltration systems are incorporated into the roofs subcatchments. This has the great advantage that no additional subcatchment has to be modelled for each roof. In the case of swales or swale-trench-elements, the infiltration area is added to the connected roof to consider the precipitation on the swale. For infiltration trenches, the roof area does not need to be enlarged because they are underground and not exposed to precipitation. The overflow from infiltration systems and trees as well as the underdrain of green / retention roofs is connected to the sewer system via the nearest manhole.
The modelling approach slightly overestimates the runoff from the green areas as the precipitation on swales is considered twice: on the added virtual infiltration area in the roof subcatchment and on the green space where the swale would be normally located. For the swales dimensioned to T = 5 a and an implementation degree of 100% the additional precipitated green area is 6.5 ha, which corresponds to an increase of 6.3%.
The maximum street area that can be connected to a tree pit is 78 m² and 120 m² to a tree trench. For the implementation in the model, the street area is divided into 78 m² or 120 m² polygons. The locations of the street trees in the study area are known (3256 in total). Figure 4 shows a street section which is divided into 120 m² polygons and the location of street trees. It is assumed that each street tree can be converted into a tree pit or a tree trench. The polygons containing a street tree are selected and imported as subcatchments into the model. The subcatchments are connected to the corresponding tree locations which are defined as tree trenches. Rain falling on subcatchments is conveyed to the tree location and not applied to the 2D surface. Runoff from a 2D surface without an overlaying subcatchment can still flow to an adjacent street area with a subcatchment, as the underlying infiltration zone continues to represent the 2D surface (though not directly irrigated).
2.4.2. Spatial distribution of the NBS
Concerning the spatial distribution of NBS heterogeneous and homogeneous scenarios were considered. Figure 5 illustrates a scenario using the example of green roofs with a degree of implementation of 50%. In the heterogeneous scenario, 50% of the roofs are converted into green roofs. In the homogeneous scenario 50% of each individual roof area is designed as a green roof. This approach allows to change the degree of implementation in the study area at one time without selecting individual roofs manually. The two approaches are transferable to the other NBS.
2.5. Rainfall data and model configurations
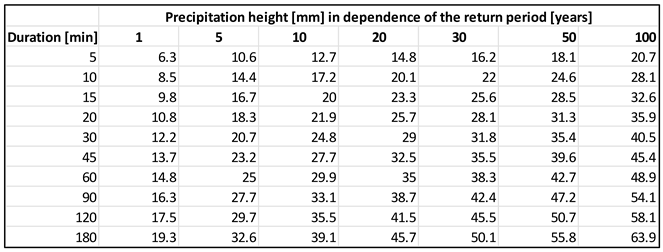
Design rains with different return periods and rainfall distribution were used. Table 7 shows the characteristics of the selected rainfall events. Block rains with return periods of 5- and 100-years and a duration of 60 min (R0B and R1B) were used to for the dimensioning of the infiltrations systems and the tree locations. According to the data [34] published by the German Weather Service (Deutscher Wetter Dienst), the corresponding precipitation heights are 25 mm (R0B) and 48.9 mm (R1B) in the study area (Appendix Table A1). For the effect evaluation of the NBS in flood mitigation Euler type 2 rainfall distribution were selected (R1E and R2E). Figure 6 shows the Euler type 2 rainfall distribution in comparison to a block rain for R1E respectively R1B: the amount of precipitation is the same, just distributed differently. The Euler type 2 rainfall distribution is the standard design rain in Germany. In addition to R1E, an extreme rainfall event with a precipitation height of 100 mm was selected.
In total, 96 simulations were carried out. The simulation runs are composed of 94 runs with the homogenous spatial distribution of NBS (Table 8) and 2 with the heterogenous distribution. The simulations with a considered period of 75 min were carried out on a PC with a 6 core CPU (i5-9600k), 32 GB RAM (DDR4) and a dedicated GPU (RTX 2070). The simulation duration of each individual run was between 2.5 - 3 hours with the 1D/2D-Model consisting of 1,744,349 mesh elements.
3. Results
The simulation results of the base model and the models with NBS are compared to assess the effect of NBS on flood reduction. The flood volume is calculated from the maximum water level in each mesh element and the area of the associated mesh element (approx. 1 m² in size). The total flood volume in the study area is calculated as the sum over all affected mesh elements. Only potentially hazardous water levels of 10 cm or more are considered. Flow velocities are not used for the evaluation as the study area is very flat. In the following, the effect of NBS with a homogenous distribution in the study area is investigated, the effect of the heterogenous approach is investigated separately in chapter 3.4.
3.1. Influence of the degree of NBS implementation on flood mitigation
The impact of the degree of NBS implementation on flood mitigation is demonstrated through the use of swales as an example. Figure 7 shows the total flood volumes in the study area for the base model and different implementation degrees of swales dimensioned for a return period of T = 5 a (Type 5a) and 100 a (Type 100a). The diagrams show the results for the design rains R1E and R2E. A degree of implementation of 100% means, that all roof areas are completely connected to swales.
In this scenario, swales of Type 5a reduce the flooding volume of the 100-year design rain R1E (precipitation height 48.9 mm) by 6.1% to 21.6%, while the swales of Type 100a reduce it by 12.2% to 33.7%. As expected, the relative reduction is lower in case of the design rain R2E (precipitation height 100 mm) with 1.3% to 5.4% for the Type 5a swales and 3.9% to 15.1% for the Type 100a swales.
In case of R1E the decrease in flood volume is not linear to the increase of the implementation degree of swales. Connecting 25% of the roof area to Type 5a swales results in a 6.1% reduction in total flood volume while an increasing degree of implementation from 75% to 100% only reduces the volume by 4.4% (from 82.7% to 78.4%). This non-linearity is even more pronounced for the swales of Type 100a. Connecting 25% of the roof area to such swales results in a 12.2% reduction in total flood volume while an increase of implementation from 75% to 100% only reduces the volume by 3.6% (from 69.9% to 66.3%). For the less intensive rain R1E, lower degrees of implementation have a comparatively bigger effect on flood reduction. This effect is even stronger for the Type 100a swales in comparison to the Type 5a swales.
With the more intensive rain R2E, the correlation between the implementation degrees in terms of the reduction in total flood volume is almost linear: For the Type 5a swales, the reduction is 1.3% at an implementation degree of 25 %. Between the implementation degrees 75% and 100%, the reduction is 1.5% (from 96.1% to 94.6%). For the Type 100a swales, the reduction is 3.9% at an implementation degree of 25%. Between the implementation degrees 75% and 100%, the reduction is 3.7% (from 88.6% to 84.9%). For the more intense rain R2E, the degrees of implementation have comparatively almost the same effect on flood reduction.
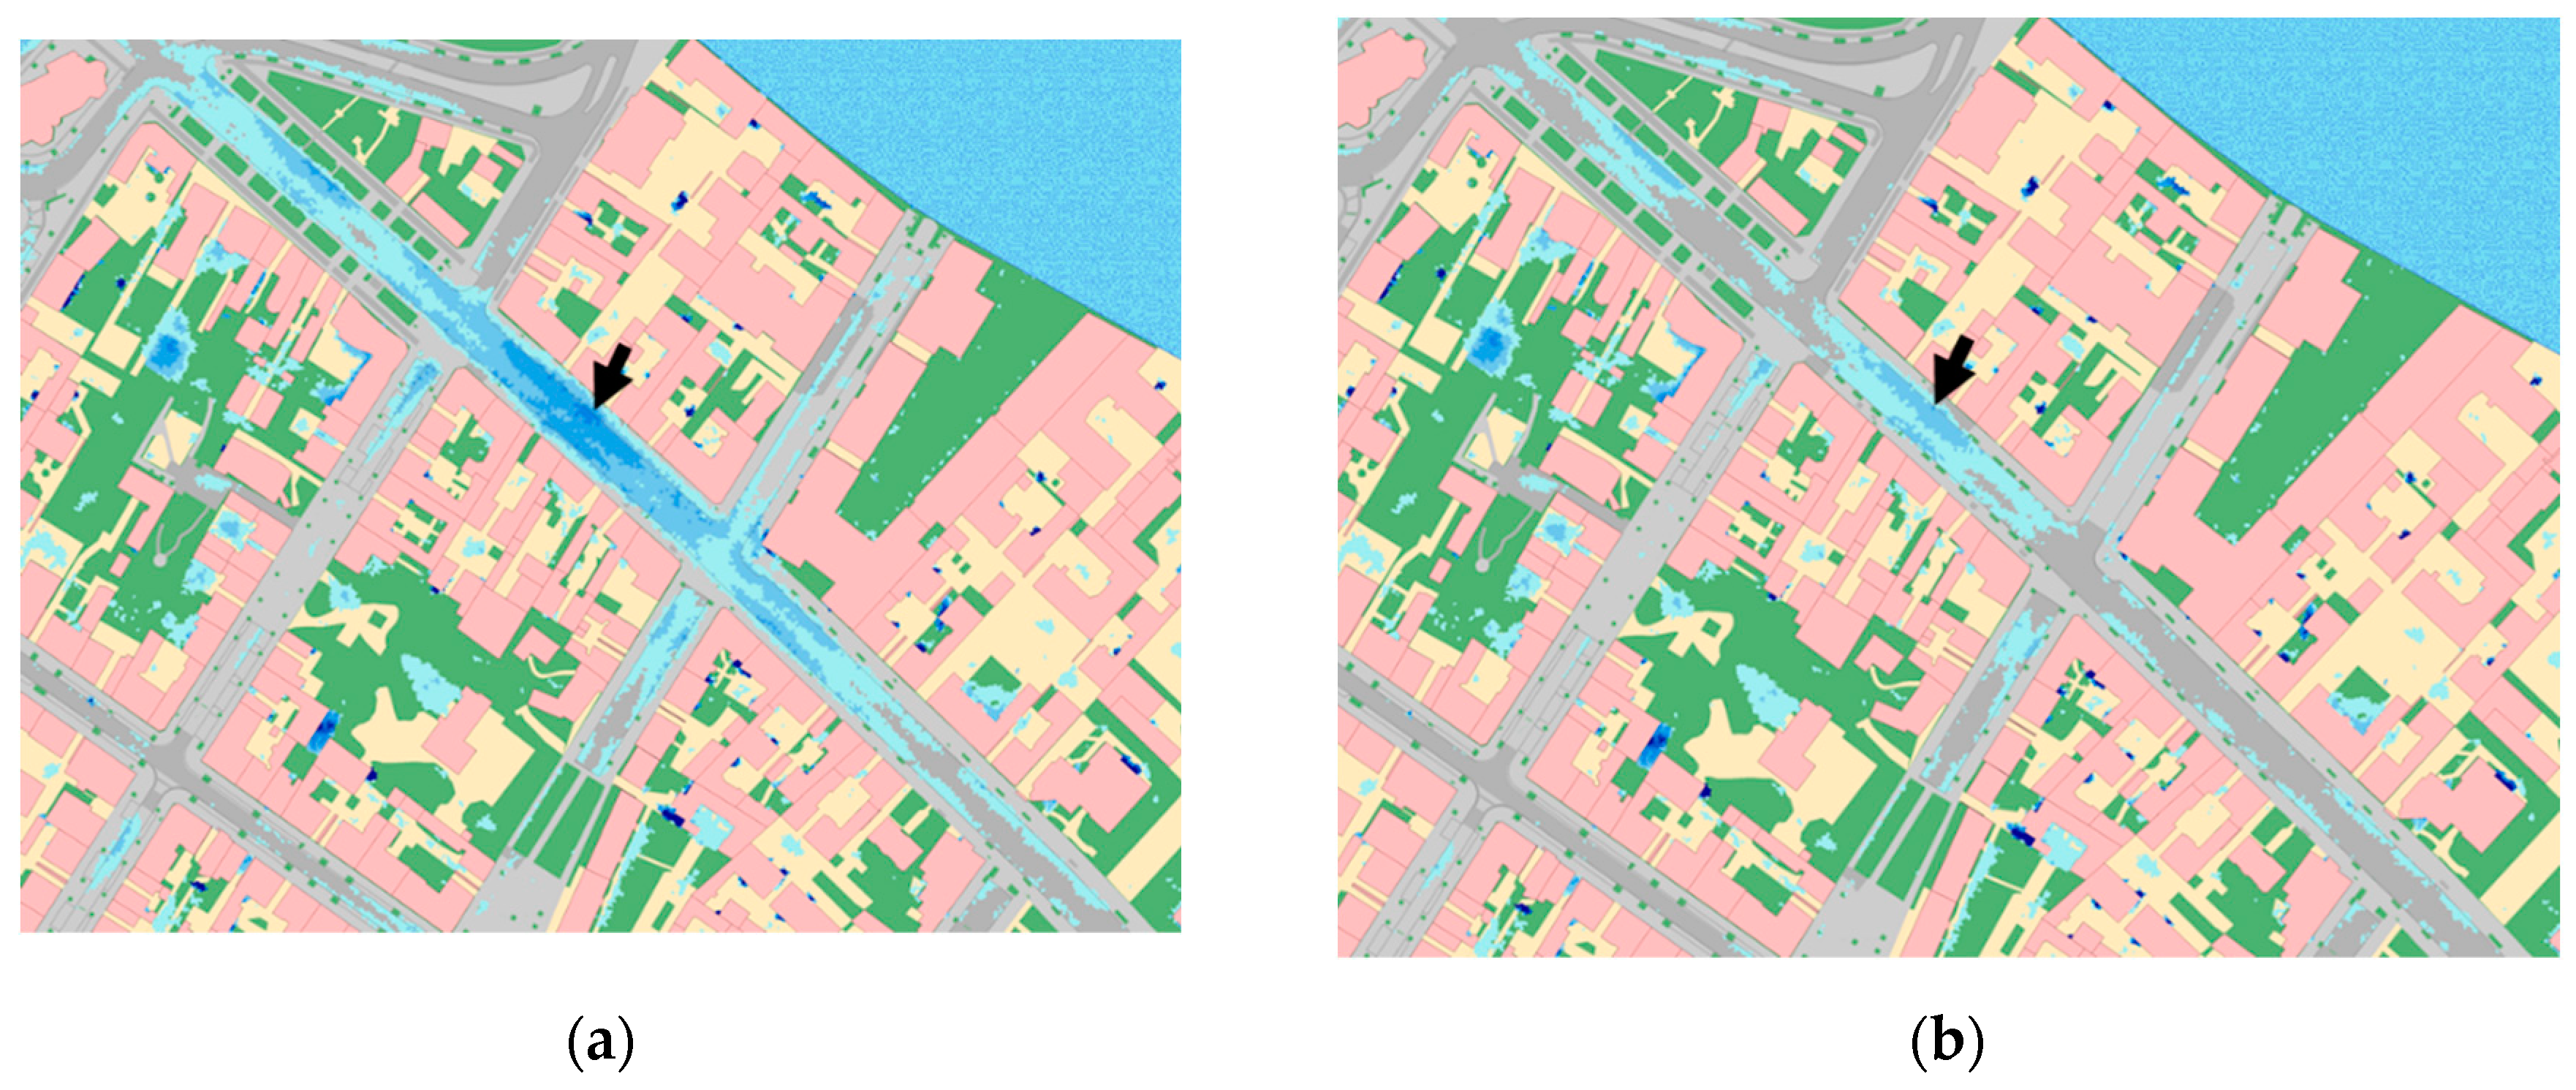
Figure 8 shows the maximum water levels (flood depths of at least 10 cm) in the center of flooding (see Figure 10 (c)) in the north east of the study area as a result of R1E, simulated with the base model and for the swales Type 100a at implementation degrees of 50% and 100%. The comparison shows a significant reduction in flooding when swales are implemented. The black arrows mark the lowest point in the street: here the maximum water levels are 56 cm for the base model and 46 cm and 28 for the swales Type 100a with implementation degrees of 50% and 100%. The swales reduce the maximum water level by 10 cm and 28 cm respectively.
3.2. Effect of the various NBS for flood mitigation
Table 9 shows a comparison of the effects of the various NBS on flood reduction for the design rainfall events R1E and R2E with an NBS implementation degree of 100%. In addition, the total overflow volume for infiltration systems and tree location respectively the total underdrain volume for green roofs is listed. The sewer overflow volume is the total volume that is discharged from the manholes and street drains onto the 2D surface during the simulation.
In the rainfall scenario R1E (T = 100 a) the infiltration systems of Type 5a reduce the flooding by 21.6% to 24.8%, with the swale-trench-elements achieving the highest reduction. The infiltration systems Type 100a retain the runoff from the roofs completely, reducing the flood volume by 32.3% to 33.8%.
Like the infiltration systems of Type 100a, intensive green roofs and retention roofs retain the rainfall volume of R1E entirely, resulting in the same effect on flood reduction (33.7%). Extensive green roofs have a slightly lower effect on flood reduction (31.8%).
The more extreme rainfall scenario R2E (100 mm in 60 min) exceeds the capacity of all infiltration systems investigated. While the Type 5a infiltration systems only reduce the flood volume by 5.4% to 9.3%, the Type 100a systems reduce the flood volume by 15.1% to 25.8%. The effect of the swale-trench-elements is significantly higher compared to the swales and infiltration trenches.
The retention roofs can retain even the rainfall R2E completely, resulting in a flood reduction of 33.6%. This was expected as the storage layer of these roofs already has an effective depth of 90 mm. Intensive green roofs have almost the same effect with an underdrain volume of only 4,200 m³ reducing the flood volume by 33.5%. The detention capacity of extensive green roofs is clearly exceeded. The effect on flood reduction declines to 13.8%. Compared to the infiltration systems, the performance of the extensive green roofs comes close to a performance of swales Type 100a. The performance of the intensive green and retention roofs corresponds to a dimensioning of T >> 100 a.
The tree locations have the least effect for flood mitigation with only 4.3% and 7.0% for R1E. However, it must be taken into account that there is much less impervious area connected to the tree pits (25.4 ha street area) and tree trenches (39.1 ha street area) compared to the other NBS (97.8 ha roof area). In relation to the space required, a tree pit reduces the flood volume by 1.47%/ha (system area), a tree trench by 2.34%/ha and swale Type 5a by 3.34%/ha. For the rainfall scenario R2E, the reduction in flooding is negligible for the tree pits with 1.6% and the tree trenches with 2.2%.
3.3. Influence of the rainfall dsitribution
Figure 9 shows the total flood volume and percentage difference for the base model and various NBS (implementation degree 100%) between an Euler type 2 and a block rain distribution for R1E respectively R1B. The chosen rainfall distribution has a strong influence on the simulated flood volume: the percentage difference is between 17.8% and 31% with the base model showing the biggest percentage difference. The difference in the results of the two rainfall scenarios is in the same order of magnitude as the effects NBS themselves.
The pronounced intensity peak of the Euler type 2 rain leads to higher maximum flood levels, which are crucial for the calculation of the total flood volume (maximum flood height occurred during simulation multiplied with the corresponding mesh element). For the infiltration system Type 5a the percentage difference between the rainfall distributions is 18% to 20.2% compared to the system Type 100a with differences of 17.8% to 18.7%. All in all, the percentage difference is slightly less for the system dimensioned to T = 100 a. The reason for this is that even for Euler type 2 distribution, the flooding is not so sever because of the NBS and therefore the difference in flood volumes between the Euler type 2 and the block rain is percentage wise is lower. The same effect occurs in the simulation of the intensive green roofs and retention roof with no underdrain. For the extensive green roofs, the difference between block and Euler rain is only 14.5%.
3.4. Influence of the spatial distribution of the NBS
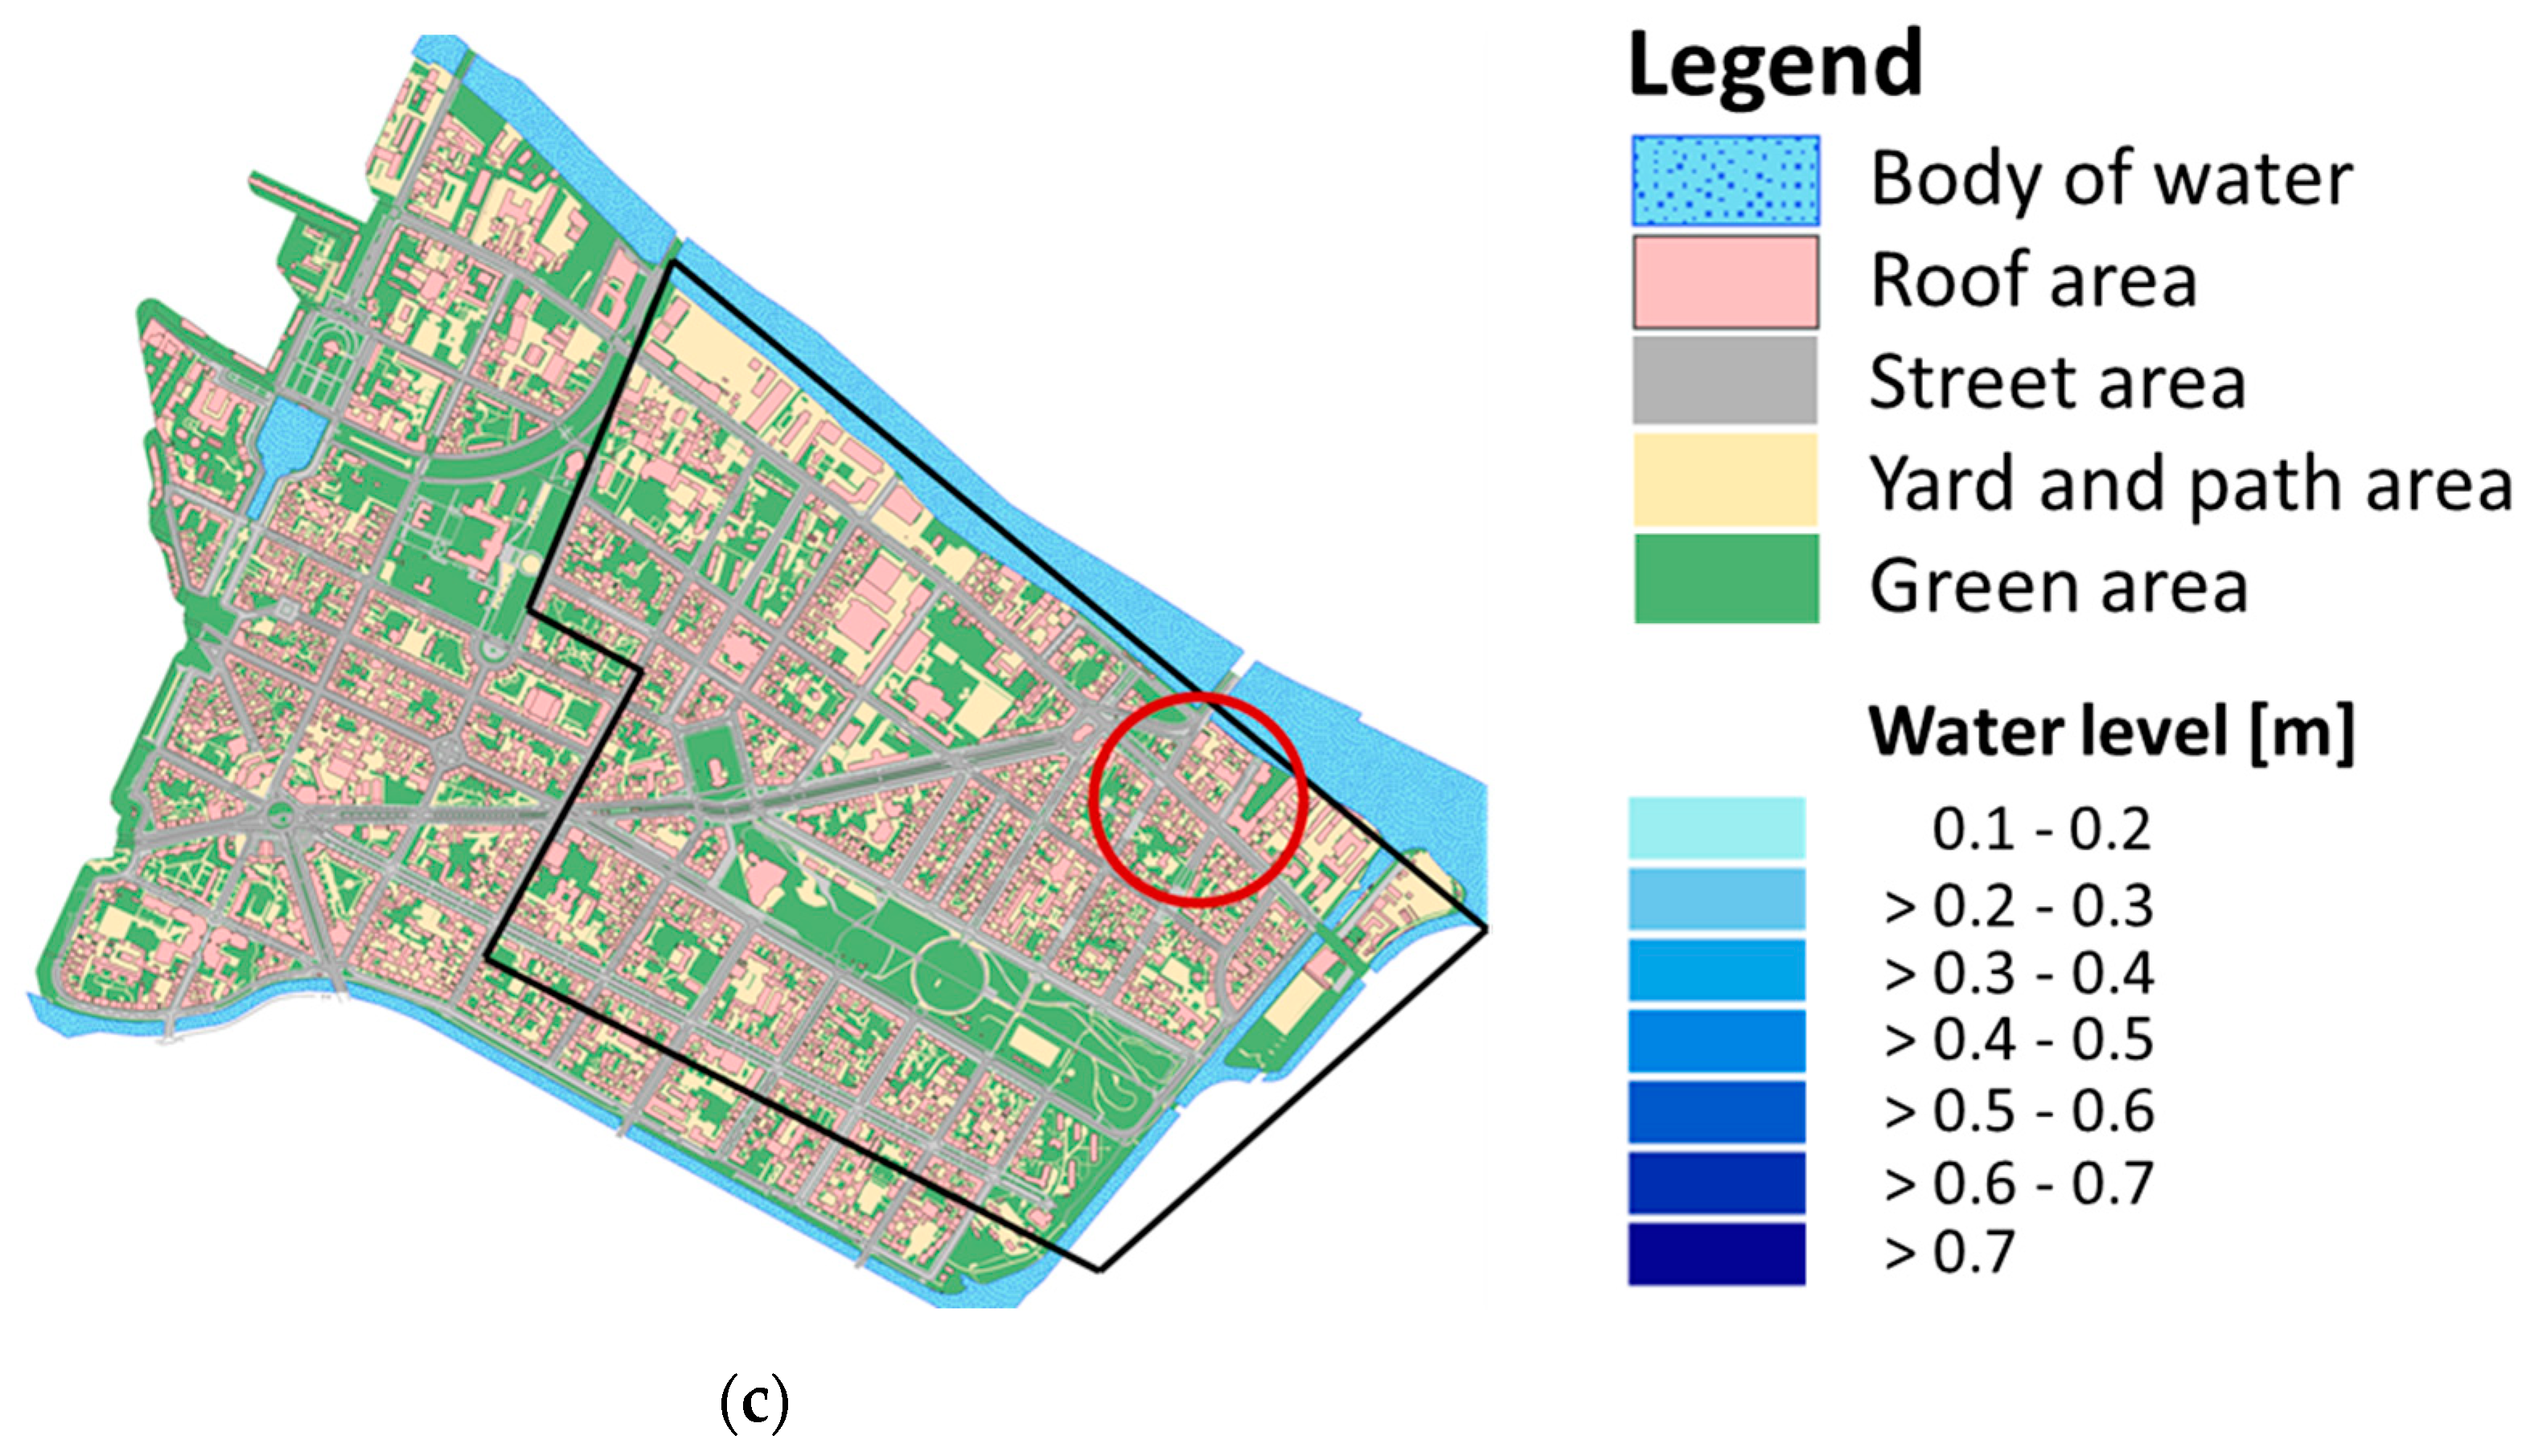
The results shown so far have all been simulated with the homogenous distribution of NBS in the study area. In the following the effect of heterogeneity in the spatial distribution is addressed. Figure 10 (c) shows the study area with the center of flooding marked in red. The black polygon marks the area around this flooding hot spot that contains 50.3% of all roofs. As an example of a heterogenous distribution, roofs inside the polygon are modeled as retentions roofs to 100%. For the homogenous distribution, roofs in the entire study area are converted into retention roofs with an implementation degree of 50.3%.
Figure 10 shows the maximum flood heights in the center of flooding with retention roofs and an implementation degree of 50.3% for the homogenous distribution (a) and the heterogenous distribution (the black arrows indicate the lowest points in the street area) with maximum flood heights of 45 cm (homogenous distribution) and 31 cm (heterogeneous distribution). When comparing the flood volume in the entire study area the difference is much smaller with 49,411 m³ for the homogenous and 48,982 m³ for the heterogenous approach.
Figure 10.
Maximum flood heights in the center of flooding with R1E, the black arrows indicate the lowest point in the street area: (a) Homogenous distribution of retention roofs, implementation degree: 50,3%; (b) Heterogenous distribution of retention roofs, implementation degree: 50.3%; (c) Center of flooding marked by a red circle. In the black polygon 50.3% of the roofs are located.
4. Discussion
As anticipated, the extent of NBS implementation has the greatest impact on flood reduction. However, for the rainfall event R1E (precipitation height of 48.9 mm, T = 100 a), there is a non-linear correlation between flood reduction and the degree of implementation: lower degrees of implementation result in greater flood reduction in relation to connected impervious area. This effect is more pronounced for the NBS dimensioned to return periods of T = 100 a and beyond. The reason for this the overloading of the drainage system: even with a lower degree of NBS runoff can be avoided that would otherwise fully be conveyed on the surface if there are no NBS. For higher implementation degrees of NBS, the flooding in the study area is already not so sever, so an even higher degree does not have a big impact. For the more intensive rainfall event R2E (precipitation height of 100 mm) the correlation between the implementation degree and the flood reduction is almost linear for both the systems dimensioned for a return period of T = 5 and 100 a. Overall, even lower implementation degrees of NBS can have significant effect on flood reduction for the rain event with a return period of T = 100 a. The authors are aware that implementation degrees of just 25% are almost impossible to achieve in existing inner-city areas. It was also neglected, if there is even green space for infiltration system in the vicinity of roofs available and whether roofs can be converted into green roofs at all. However, in this study the potential of NBS is the focus, why certain limitations are overlooked.
The comparison of the NBS for flood mitigation reveals that infiltration systems dimensioned to T = 5 and 100 a can significantly reduce flooding for R1E. With R2E the effectiveness of the systems Type 5a declines significantly. It is widely known in the literature that the effectiveness of NBS for flood mitigation decreases with more intense rain events [16,18,13]. However, infiltration systems Type 100a can still effectively reduce flooding and achieve almost three times the flood reduction compared to systems Type 5a. The extension of infiltration systems beyond their usual dimensioning significantly increases the resilience of urban drainage systems in case of extreme heavy rainfall events. The swale-trench-elements have the greatest effect on flood reduction of the infiltration systems. For the green roofs, the retention roofs can even fully retain R2E and the intensive green roofs can almost fully retain R2E. These two NBS have the biggest effect on flood reduction and corresponds to a dimensioning of T >> 100 a compared to the infiltration systems. The extensive green roofs have a bigger effect on flood reduction compared to infiltration systems dimensioned to T = 5 a, but their performance drastically declines for R2E. Their performance comes close to a performance of swales Type 100a. The tree pits and tree trenches are both dimensioned to T = 5 a and have the least effect on flood reduction. However, for rainfall events up to a return period of T = 100 a they can be used in combination with other NBS: roofs areas are connected to swales and the runoff from street areas is conveyed to the tree locations.
The rainfall distribution selected has a significant impact on flooding in the study area. The peak intensity of the Euler type 2 rainfall results in higher maximum flood heights, which is more pronounced in the base model than in the models with NBS. The relative differences in flood volume are quite similar when comparing the NBS, suggesting that the NBS react similar to the different rainfall distributions.
The arrangement of the NBS in the study area has a major influence on the inundation heights in the center of flooding. For maximum flood protection, the NBS should be centered around the flooding area. Webber et al. support these findings, stating that local NBS strategies can delay flood peaks in areas of severe flooding [16].
However, it is important to note that the results of this study are only transferable to a limited extent. The occurrence of flooding in an area depends heavily on the topography and the performance of the urban drainage system, which are unique to each catchment. This study presents the results of a study area with a very flat topography. For this reason, it is planned to carry out the investigations in a second, steeper study area and compare the results. Additionally, the impact of additional NBS on flood mitigation, such as rainwater harvesting tanks will be analyzed.
5. Conclusions
In this study, a method was presented to implement NBS in a 1D/2D coupled model to evaluate their potential for flood mitigation. The effectiveness in flood reduction of different infiltration systems, green roofs and tree locations was compared based on design rains with varying return periods and rainfall distributions. Additionally, the influence of the spatial distribution of NBS in the study area was investigated. From these case-specific quantitative results, the following more general qualitative conclusions can be drawn.
While overall the effect of NBS declines with an increase in rainfall intensity, infiltration systems dimensioned to 100-years still have a major effect in flood reduction even for extreme rainfall events. Overall, the intensive green and the retention roof have the biggest effect in flood reduction. The performance of the extensive green roof comes close to a swale dimensioned to a return period of 100-years. The tree trenches and tree pits have the least effect for flood mitigation, but can be used in combination with other NBS. If a retrofit of existing street trees to tree pits is possible, no additional space is used.
The rainfall characteristic has a major influence on flooding, but the NBS are robust to different rainfall distributions. For maximum flood protection, the NBS should be located around the center of flooding.
Author Contributions
Conceptualization, U.D., C.S., J.N.; methodology, J.N., C.S.; software, J.N.; formal analysis, J.N.; investigation, J.N.; resources, U.D.; data curation, J.N.; writing—original draft preparation, J.N.; writing—review and editing, U.D., C.S.; visualization, J.N.; supervision, U.D.; project administration, C.S.; funding acquisition, U.D., C.S. and JN. All authors have read and agreed to the published version of the manuscript.
Funding
This research was funded by the German Federal Ministry of Education and Research (BMBF) under the funding code 02WEE1624 as part of the WaX (Water Extreme Events) funding program for the project AMAREX. The authors would like to express their sincere thanks for this project funding.
Data Availability Statement
The geo data from the study area is available in the geoportal of Berlin (FIS-Broker), except for the 1D sewer data and the yard, walk and bike areas due to privacy reasons.
Acknowledgments
The authors would like to thank Berliner Wasserbetriebe, the municipal water services of Berlin, for providing the data for the development of the model.
Conflicts of Interest
The authors declare no conflict of interest.
Appendix A

Table A1.
KOSTRA-DWD-2020 data for grid field 105190 (location of the study area).
 |
References
- IPCC. Climate Change 2023: Synthesis Report. Contribution of Working Groups I, II and III to the Sixth Assessment Report of the Intergovernmental Panel on Climate Change [Core Writing Team, H. Lee and J. Romero (eds.)]. 2023. IPCC, Geneva, Switzerland, 184 pp. [CrossRef]
- Westra, S.; Fowler, H.; Evans, J.; Alexander, L.; Berg, P.; Johnson, F.; Kendon, E.; Lenderink, G.; Roberts, N. Future changes to the intensity and frequency of short-duration extreme rainfall. Rev. Geophys. 2014, 52, 522–555. [Google Scholar] [CrossRef]
- Share of urban population worldwide in 2023, by continent - Statista. Available online: https://www.statista.com/statistics/270860/urbanization-by-continent/ (accessed on 16.01.2024).
- The largest cities worldwide 2023 - Statistisches Bundesamt Deutschland (Destatis). Available online: https://www.destatis.de/EN/Themes/Countries-Regions/International-Statistics/Data-Topic/Population-Labour-Social-Issues/DemographyMigration/UrbanPopulation.html#:~:text=International%20statistics%20The%20largest%20cities%20worldwide%202023&text=Mid%2D2023%20approximately%204.6%20of,57%25%20of%20the%20global%20population (accessed on 16.01.2024).
- Fletcher, T.; Shuster, W.; Hunt, W.; Ashley, R.; Butler, D.; Arthur, S.; Trowsdale, S.; Barraud, S.; Semadeni-Davies, A.; Bertrand-Krajewski, J.-L.; Mikkelsen, P.; Rivard, G.; Uhl, M.; Dagenais, D.; Viklander, M. SUDS, LID, BMPs, WSUD and more – The evolution and application of terminology surrounding urban drainage. Urban Water J. 2015, 12, 525–542. [Google Scholar] [CrossRef]
- Schmitt, T.; Thomas, M.; Ettrich, N. Analysis and modeling of flooding in urban drainage systems. J. Hydrol. 2004, 299, 300–311. [Google Scholar] [CrossRef]
- Butler, D.; Ward, S.; Sweetapple, C.; Astaraie-Imani, M.; Diao, K.; Farmani, R.; Fu, G. Reliable, resilient and sustainable water management: the Safe & SuRe approach. Global Challenges 2017, 1, 63–77. [Google Scholar] [CrossRef] [PubMed]
- O'Hogain, S.; McCarton, L. A Technology Portfolio of Nature Based Solutions 1st ed, Springer International Publishing: Cham, Switzerland, 2018.
- Definition NBS - European Comission. Available online: https://research-and-innovation.ec.europa.eu/research-area/environment/nature-based-solutions_en (accessed on 17.01.2024).
- Shafique, M.; Kim, R. Application of green blue roof to mitigate heat island phenomena and resilient to climate change in urban areas: A case study from Seoul, Korea. J. Water Land Dev. 2017, 33, 165–170. [Google Scholar] [CrossRef]
- Cirkel, D.; Voortman, B.; van Veen, T.; Bartholomeus, R. Evaporation from (Blue-)Green Roofs: Assessing the Benefits of a Storage and Capillary Irrigation System Based on Measurements and Modeling. Water 2018, 10, 1253. [Google Scholar] [CrossRef]
- Almaaitah, T.; Appleby, M.; Rosenblat, H.; Drake, J.; Joksimovic, D. The potential of Blue-Green infrastructure as a climate change adaptation strategy: a systematic literature review. Blue-Green Syst. 2021, 3, 223–248. [Google Scholar] [CrossRef]
- Mu, J.; Huang, M.; Hao, X.; Chen, X.; Yu, H.; Wu, B. Study on Waterlogging Reduction Effect of LID Facilities in Collapsible Loess Area Based on Coupled 1D and 2D Hydrodynamic Model. Water 2022, 14, 3880. [Google Scholar] [CrossRef]
- Chang, T.-J.; Wang, C.-H.; Chen, A. A novel approach to model dynamic flow interactions between storm sewer system and overland surface for different land covers in urban areas. J. Hydrol. 2015, 524, 662–679. [Google Scholar] [CrossRef]
- Blanc, J.; Hall, J.; Roche, N.; Dawson, R.; Cesses, Y.; Burton, A.; Kilsby, C. Enhanced efficiency of pluvial flood risk estimation in urban areas using spatial–temporal rainfall simulations. J. Flood Risk Manage. 2012, 5, 143–152. [Google Scholar] [CrossRef]
- Webber, J.; Fletcher, T.; Cunningham, L.; Fu, G.; Butler, D.; Burns, M. Is green infrastructure a viable strategy for managing urban surface water flooding? Urban Water J. 2020, 17, 598–608. [Google Scholar] [CrossRef]
- Haghighatafshar, S.; Nordlöf, B.; Roldin, M.; Gustafsson, L.-G.; La Cour Jansen, J.; Jönsson, K. Efficiency of blue-green stormwater retrofits for flood mitigation - Conclusions drawn from a case study in Malmö, Sweden. J. Environ. Manage. 2018, 207, 60–69. [Google Scholar] [CrossRef] [PubMed]
- Ortega Sandoval, A.; Sörensen, J.; Rodríguez, J.; Bharati, L. Hydrologic-hydraulic assessment of SUDS control capacity using different modeling approaches: a case study in Bogotá, Colombia. Water Sci. Technol. 2023, 87, 3124–3145. [Google Scholar] [CrossRef] [PubMed]
- Rossman, L. A. & Simon, M. A. Storm Water Management Model User’s Manual Version 5.2. U.S. Environmental Protection Agency (EPA), 2022, Cincinnati, OH, USA.
- Iffland, R.; Förster, K.; Westerholt, D.; Pesci, M.; Lösken, G. Robust Vegetation Parameterization for Green Roofs in the EPA Stormwater Management Model (SWMM). Hydrology 2021, 8, 12. [Google Scholar] [CrossRef]
- Lisenbee, W.; Hathaway, J.; Winston, R. Modeling bioretention hydrology: Quantifying the performance of DRAINMOD-Urban and the SWMM LID module. J. Hydrol. 2022, 612, 1–16. [Google Scholar] [CrossRef]
- Gülbaz, S.; Kazezyılmaz-Alhan, C. An evaluation of hydrologic modeling performance of EPA SWMM for bioretention. Water Sci. Technol. 2017, 76, 3035–3043. [Google Scholar] [CrossRef] [PubMed]
- FIS-Broker - Senate Department for Urban Development, Building and Housing (SenBW). Available online: https://fbinter.stadt-berlin.de/fb/index.jsp (accessed on 17.01.2024).
- DWA. DWA-A 138-1, Entwurf. Teil 1: Planung, Bau, Betrieb Anlagen zur Versickerung von Niederschlagswasser, Deutsche Vereinigung für Wasserwirtschaft Abwasser und Abfall: Hennef, November 2020.
- Hürter, H. Erarbeitung gebietsspezifischer Anwendungsempfehlungen für bi-direktional gekoppelte 1D-2D-Überflutungsberechnungen. Kaiserslautern, 2018.
- Sieker, F. On-site stormwater management as an alternative to conventional sewer systems: A new concept spreading in Germany. Water Sci. Technol. 1998, Vol. 38, 65–71. [CrossRef]
- BlueGreenStreets. BlueGreenStreets Toolbox – Teil B. Multifunktionale Straßenraumgestaltung urbaner Quartiere, März 2022, Hamburg. Erstellt im Rahmen der BMBF-Fördermaßnahme „Ressourceneffiziente Stadtquartiere für die Zukunft“ (RES:Z).
- FLL. Dachbegrünungsrichtlinien - Richtlinien für Planung, Bau und Instandhaltung von Dachbegrünungen, Forschungsgesellschaft Landschaftsentwicklung Landschaftsbau e. V.: Bonn, 2018.
- FLL. Empfehlungen für Baumpflanzungen. Teil 2: Standortvorbereitungen für Neupflanzungen; Pflanzgruben und Wurzelraumerweiterung, Bauweisen und Substrate, Forschungsgesellschaft Landschaftsentwicklung Landschaftsbau e. V.: Bonn, 2010.
- Rossman, L.A., Huber, W.C. Storm Water Management Model Reference Manual Volume III – Water Quality. U.S. Environmental Protection Agency (EPA), 2016, Cinncinati, OH, USA.
- Rawls, W. J.; Brakensiek, D. I.; Miller, N. Green Ampt infiltration parameters from soils data. 1983, available at http://soilphysics.okstate.edu/teaching/soil-6583/references-folder/rawls%20et%20al%201983.pdf.
- Peng, Z.; Stovin, V. Independent Validation of the SWMM Green Roof Module. J. Hydrol. Eng. 2017, 22, 1–12. [Google Scholar] [CrossRef]
- Jeffers, S.; Garner, B.; Hidalgo, D.; Daoularis, D.; Warmerdam, O. Insights into green roof modeling using SWMM LID controls for detention-based designs. J. Water Manage. Model. 2022, 30: C484. [CrossRef]
- KOSTRA-DWD-2020 Datensatz - Deutscher Wetterdienst. Available online: https://opendata.dwd.de/climate_environment/CDC/grids_germany/return_periods/precipitation/KOSTRA/KOSTRA_DWD_2020/gis/ (accessed on 17.01.2024).
Figure 1.
Study area in the center of Berlin.
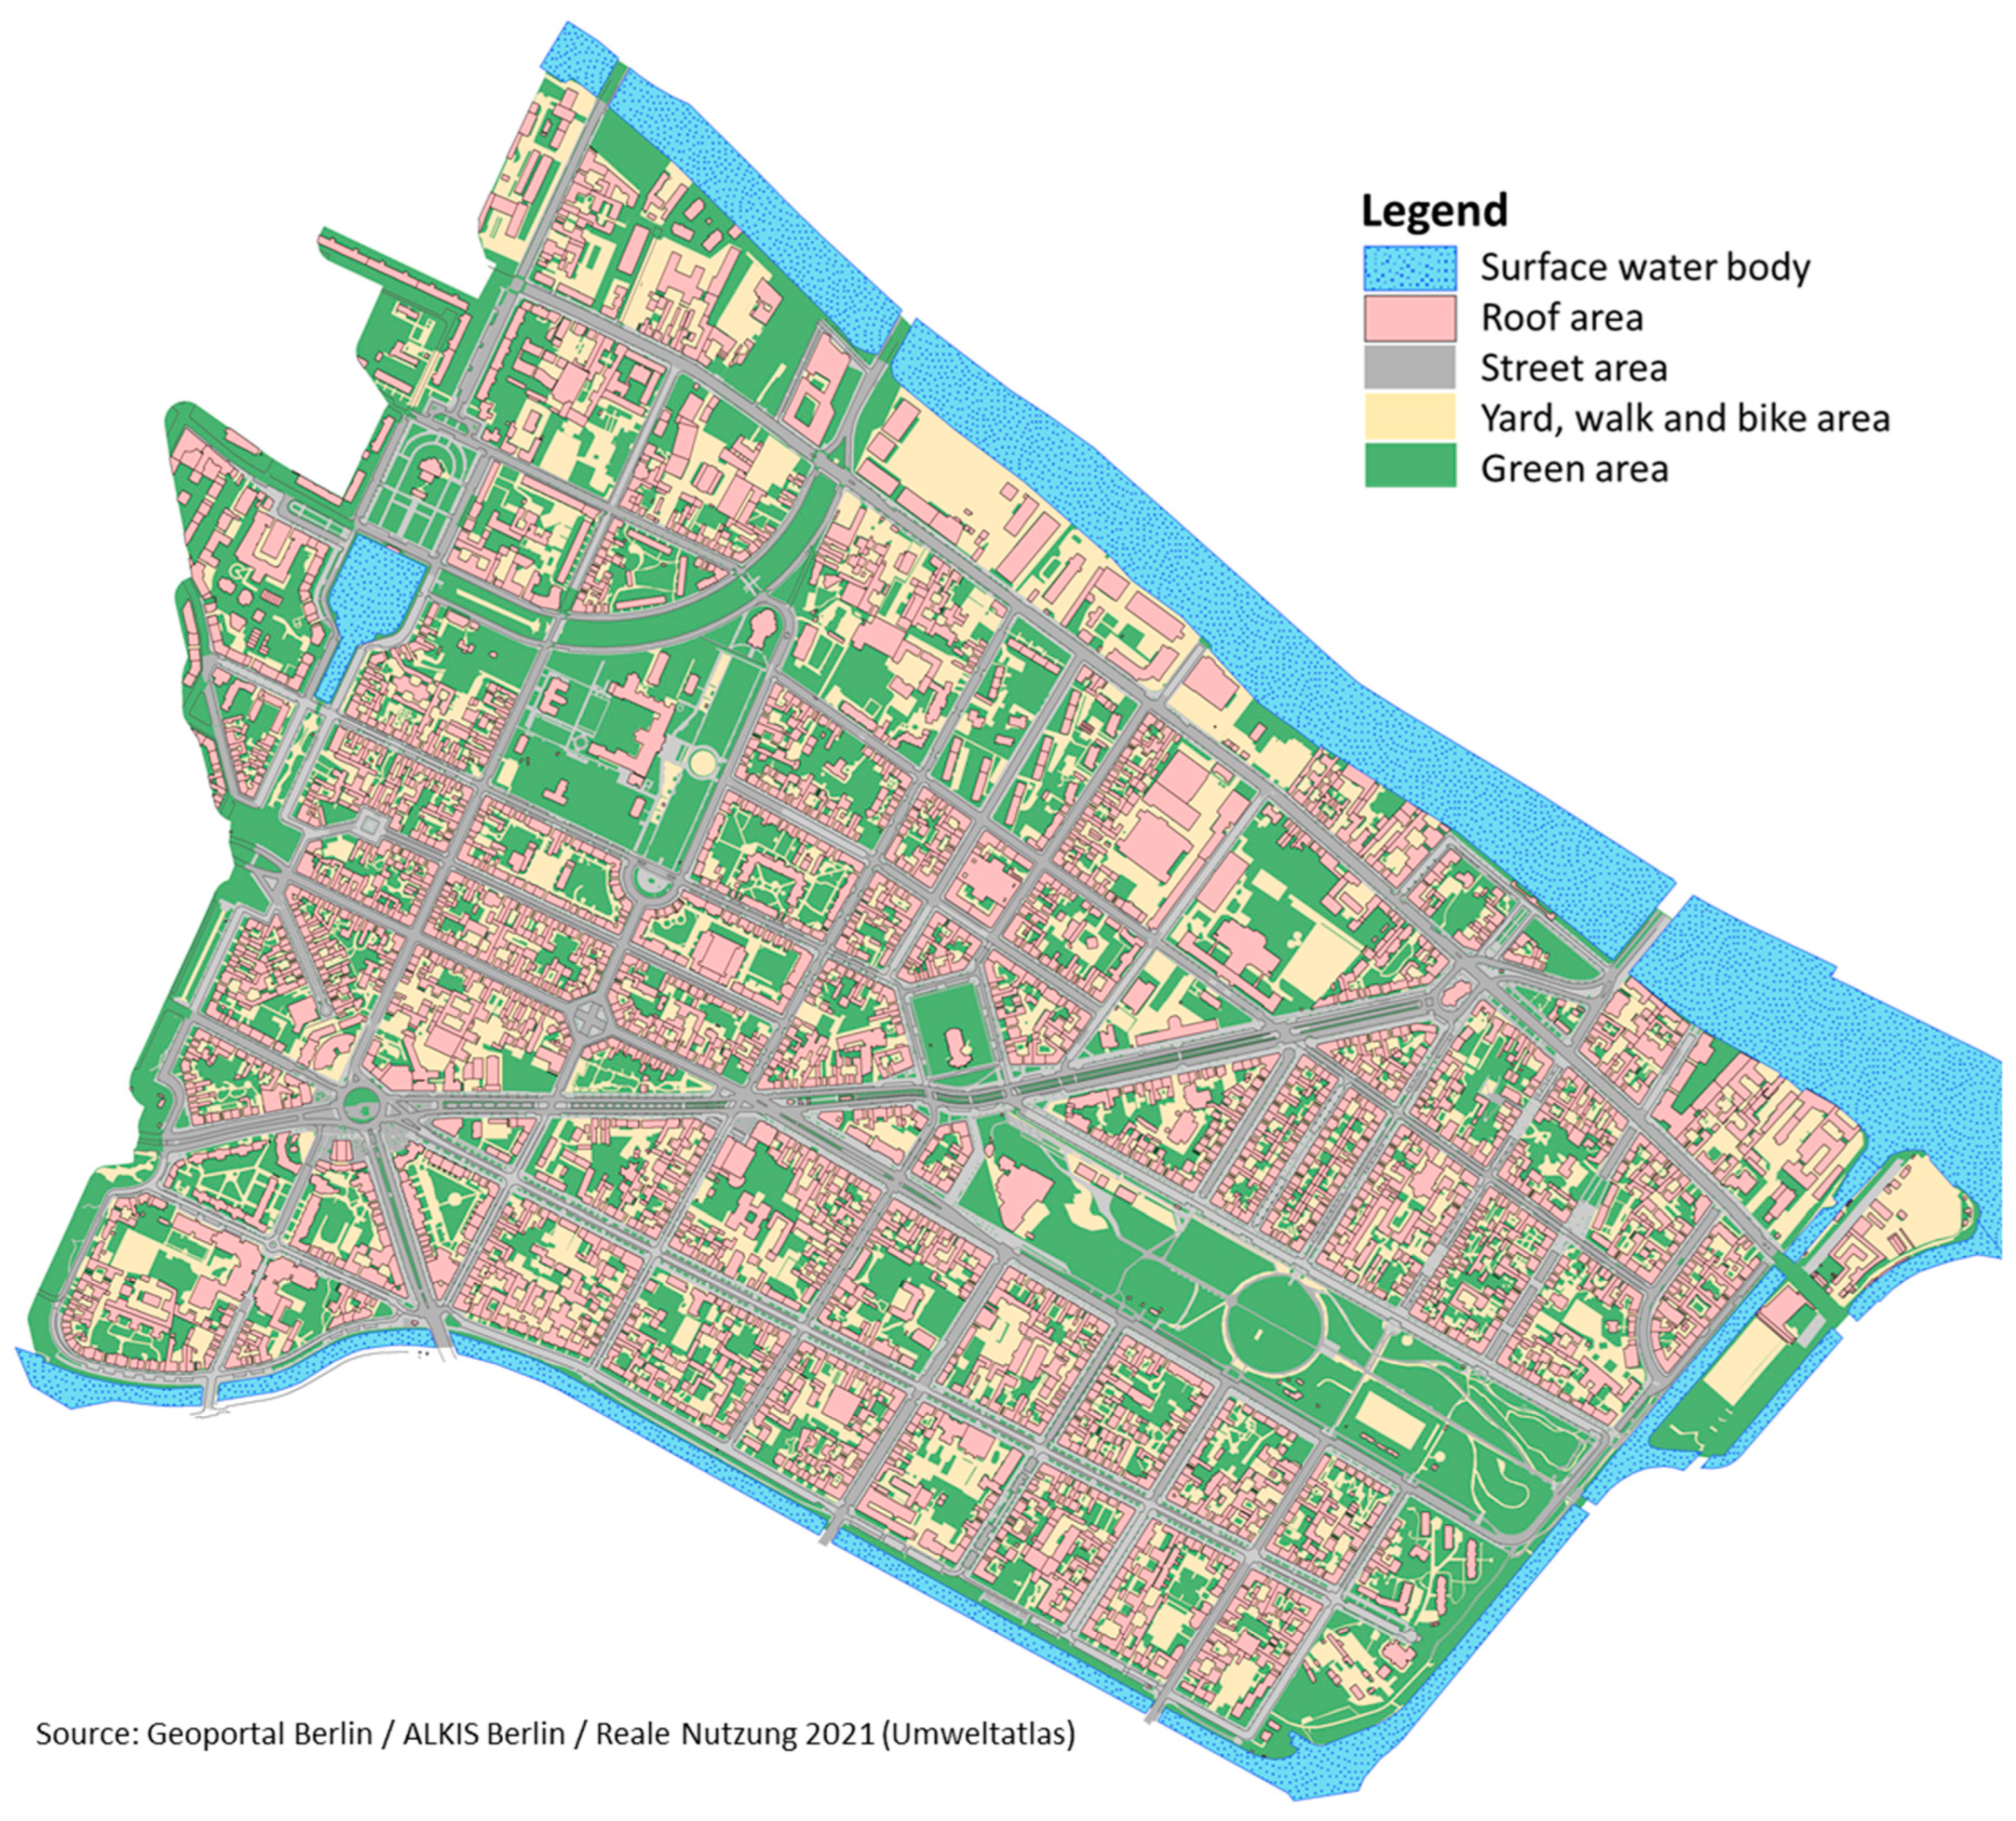
Figure 2.
Investigated decentral NBS. Infiltration systems: (a) Swale; (b) Infiltration trench; (c) Swale-trench-element; green roofs: (d) Extensive green roof; (e) Intensive green roof; (f) Retention roof; tree locations: (g) Tree pit; (h) Tree trench.
Figure 2.
Investigated decentral NBS. Infiltration systems: (a) Swale; (b) Infiltration trench; (c) Swale-trench-element; green roofs: (d) Extensive green roof; (e) Intensive green roof; (f) Retention roof; tree locations: (g) Tree pit; (h) Tree trench.
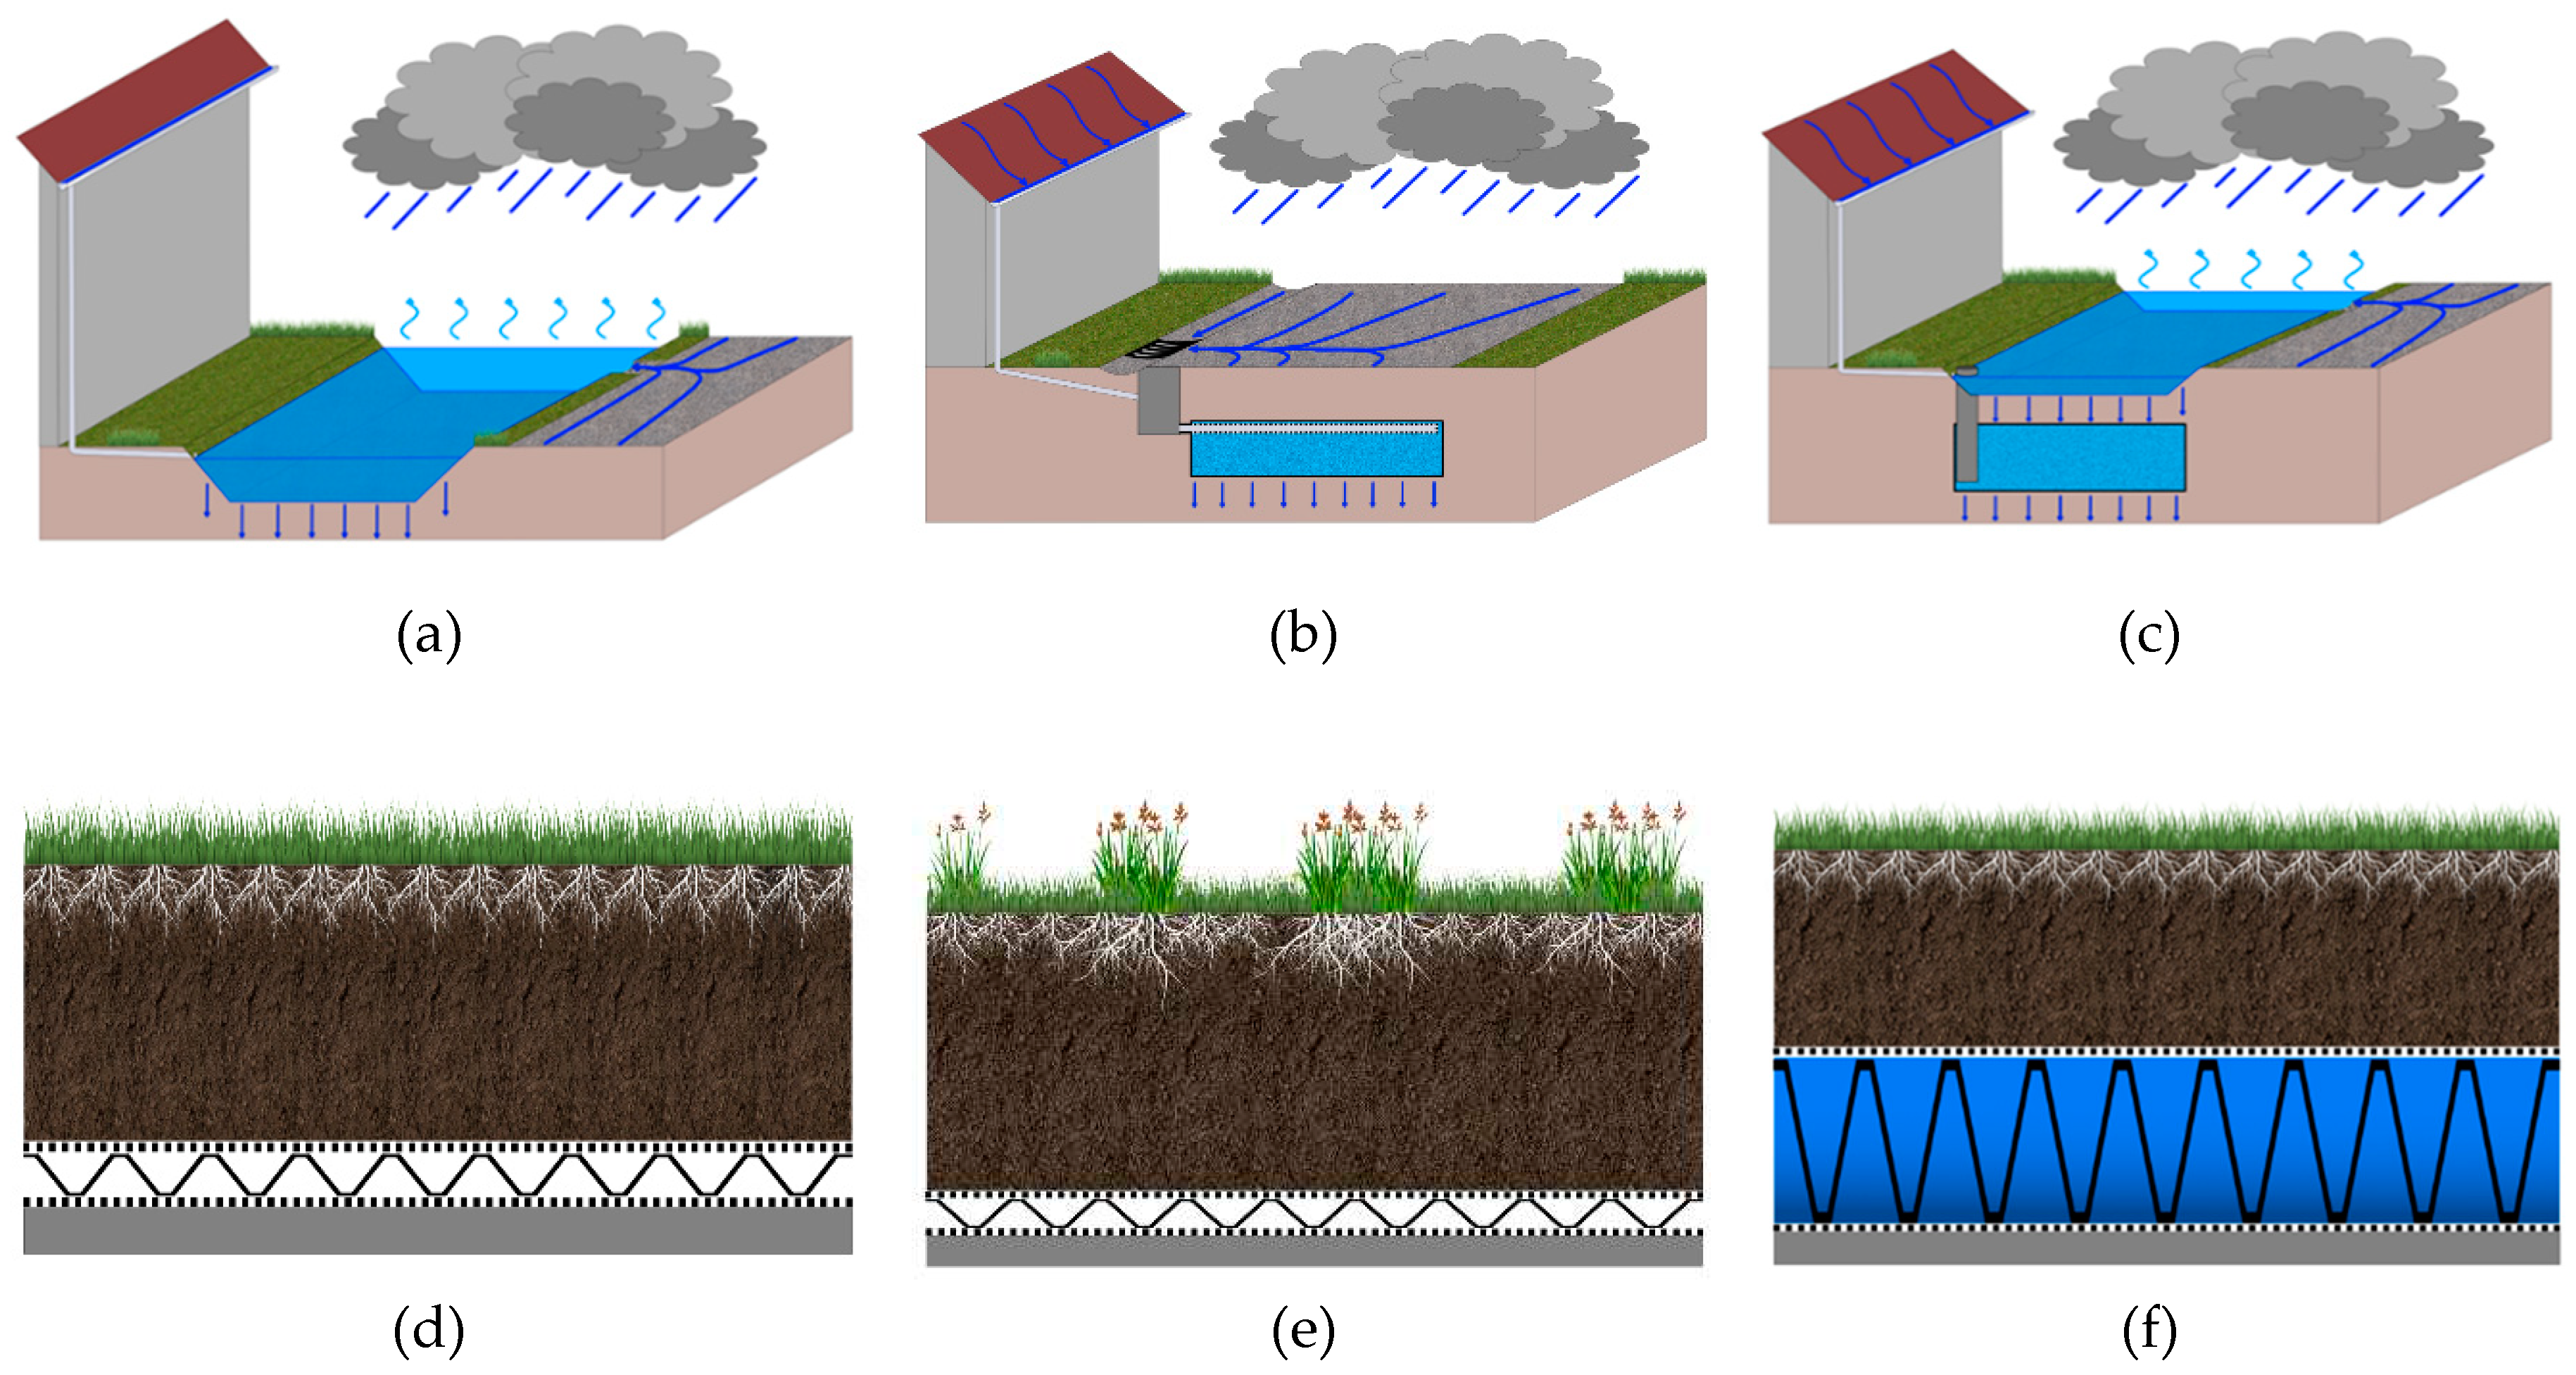
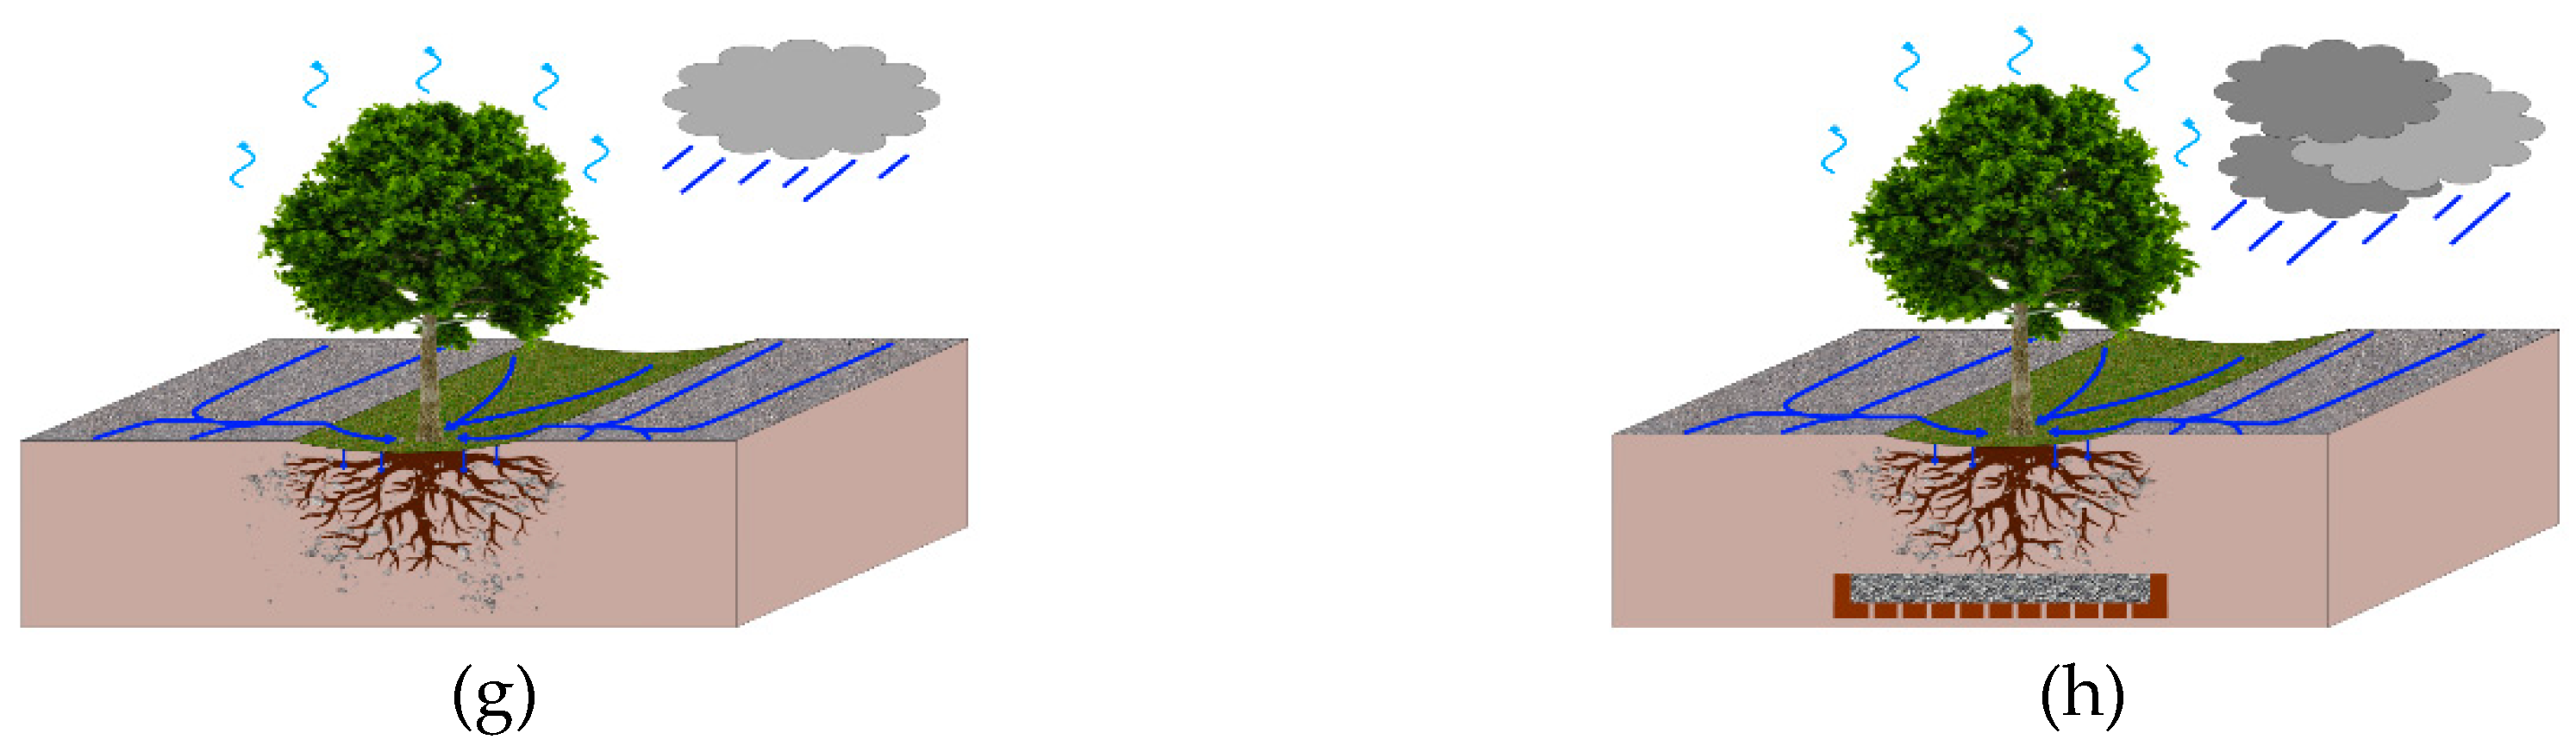
Figure 3.
Layer structure of the SUDS element bio-retention cell in InfoWorks ICM / SWMM (Own illustration based on Rossman and Huber [30]).
Figure 3.
Layer structure of the SUDS element bio-retention cell in InfoWorks ICM / SWMM (Own illustration based on Rossman and Huber [30]).
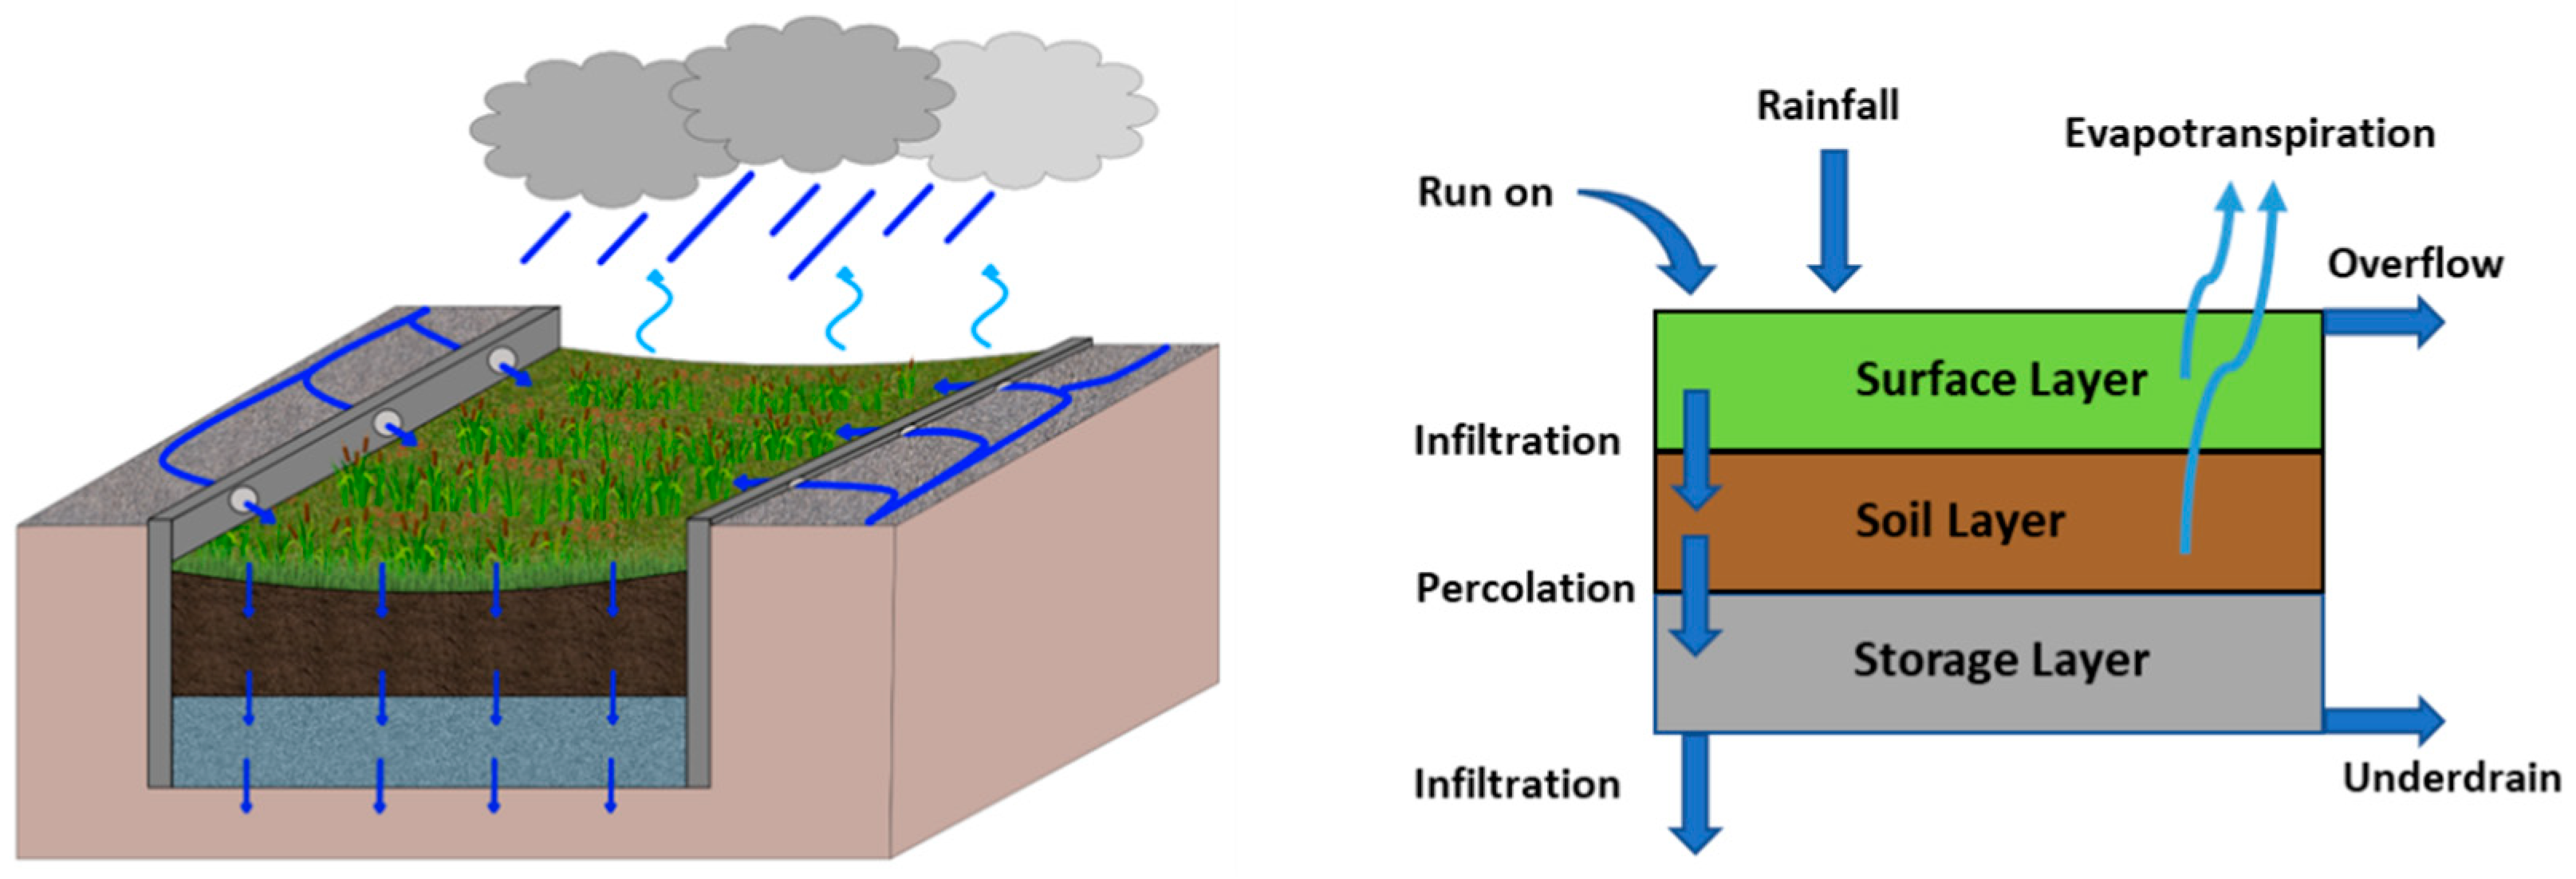
Figure 4.
(a) Street area, divided into 120 m² polygons (blue) and the locations of street trees (green); (b) Selected polygons which are represented as subcatchments connected to a tree trench in the model.
Figure 4.
(a) Street area, divided into 120 m² polygons (blue) and the locations of street trees (green); (b) Selected polygons which are represented as subcatchments connected to a tree trench in the model.
Figure 5.
(a) Heterogenous distribution of the green roofs: 50% of the roofs area implemented as green roofs; (b) Homogeneous distribution: 50% each individual roof area is designed as a green roof.
Figure 5.
(a) Heterogenous distribution of the green roofs: 50% of the roofs area implemented as green roofs; (b) Homogeneous distribution: 50% each individual roof area is designed as a green roof.
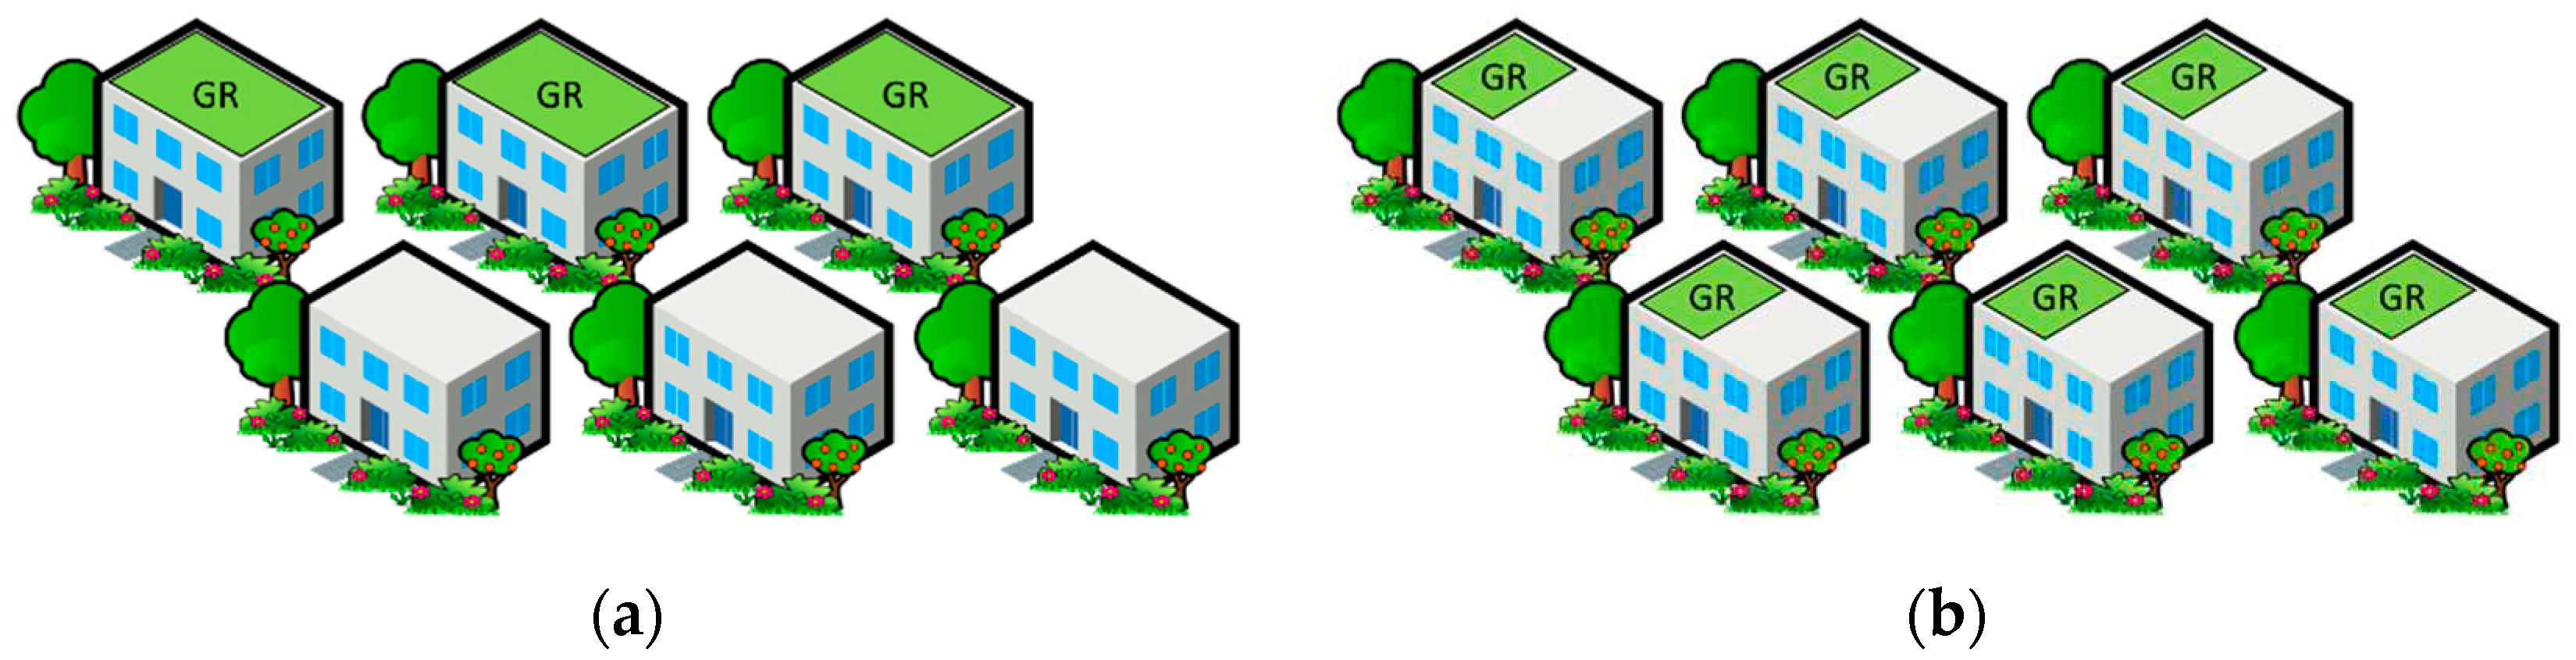
Figure 6.
(a) Euler type 2 rainfall distribution; (b) Block rain distribution.
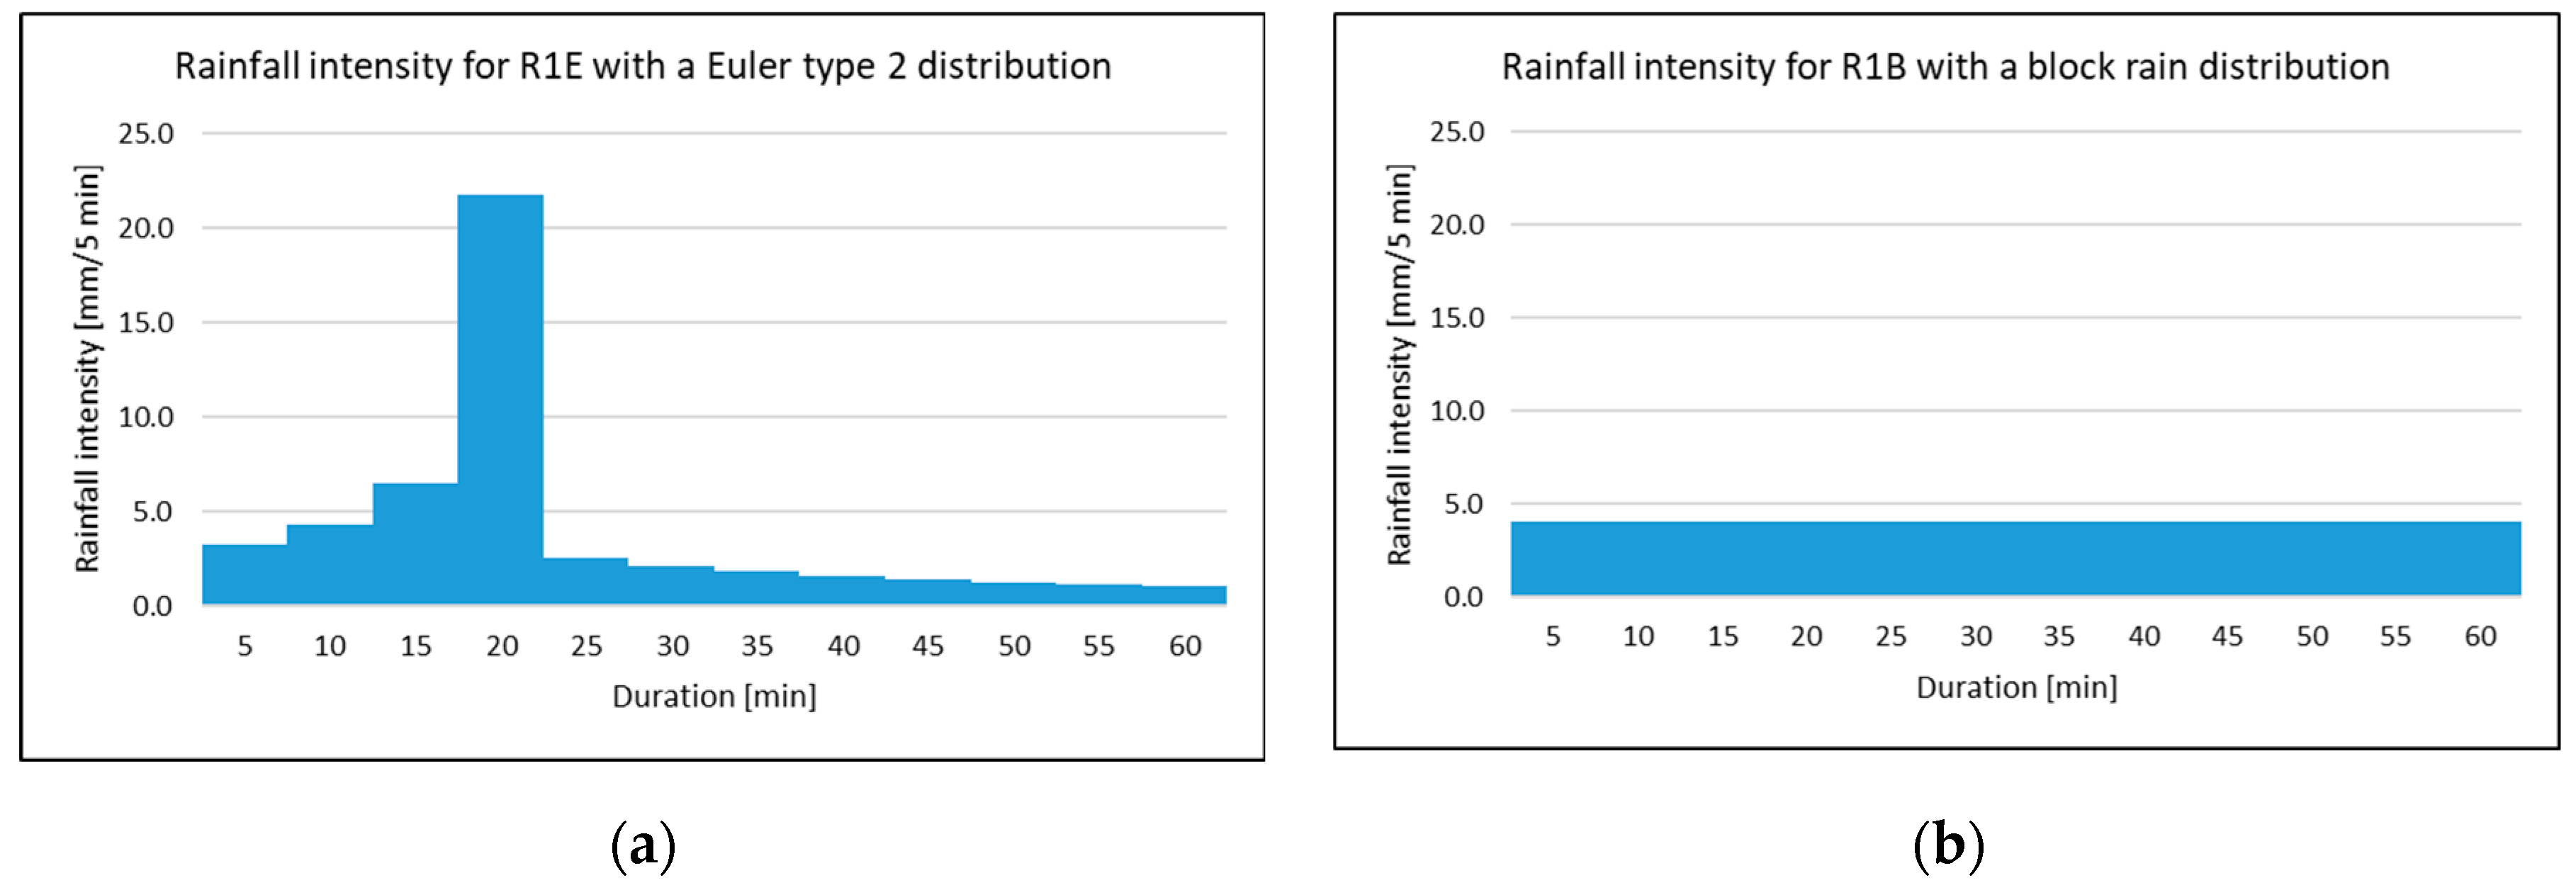
Figure 7.
Total flood volume in the study area for the base model and with swales (dimensioned to T = 5 and 100 a) with different degrees of implementation: (a) Total flood volume for R1E (precipitation height: 48.9 mm); (b) Total flood volume for R2E (precipitation height: 100 mm).
Figure 7.
Total flood volume in the study area for the base model and with swales (dimensioned to T = 5 and 100 a) with different degrees of implementation: (a) Total flood volume for R1E (precipitation height: 48.9 mm); (b) Total flood volume for R2E (precipitation height: 100 mm).
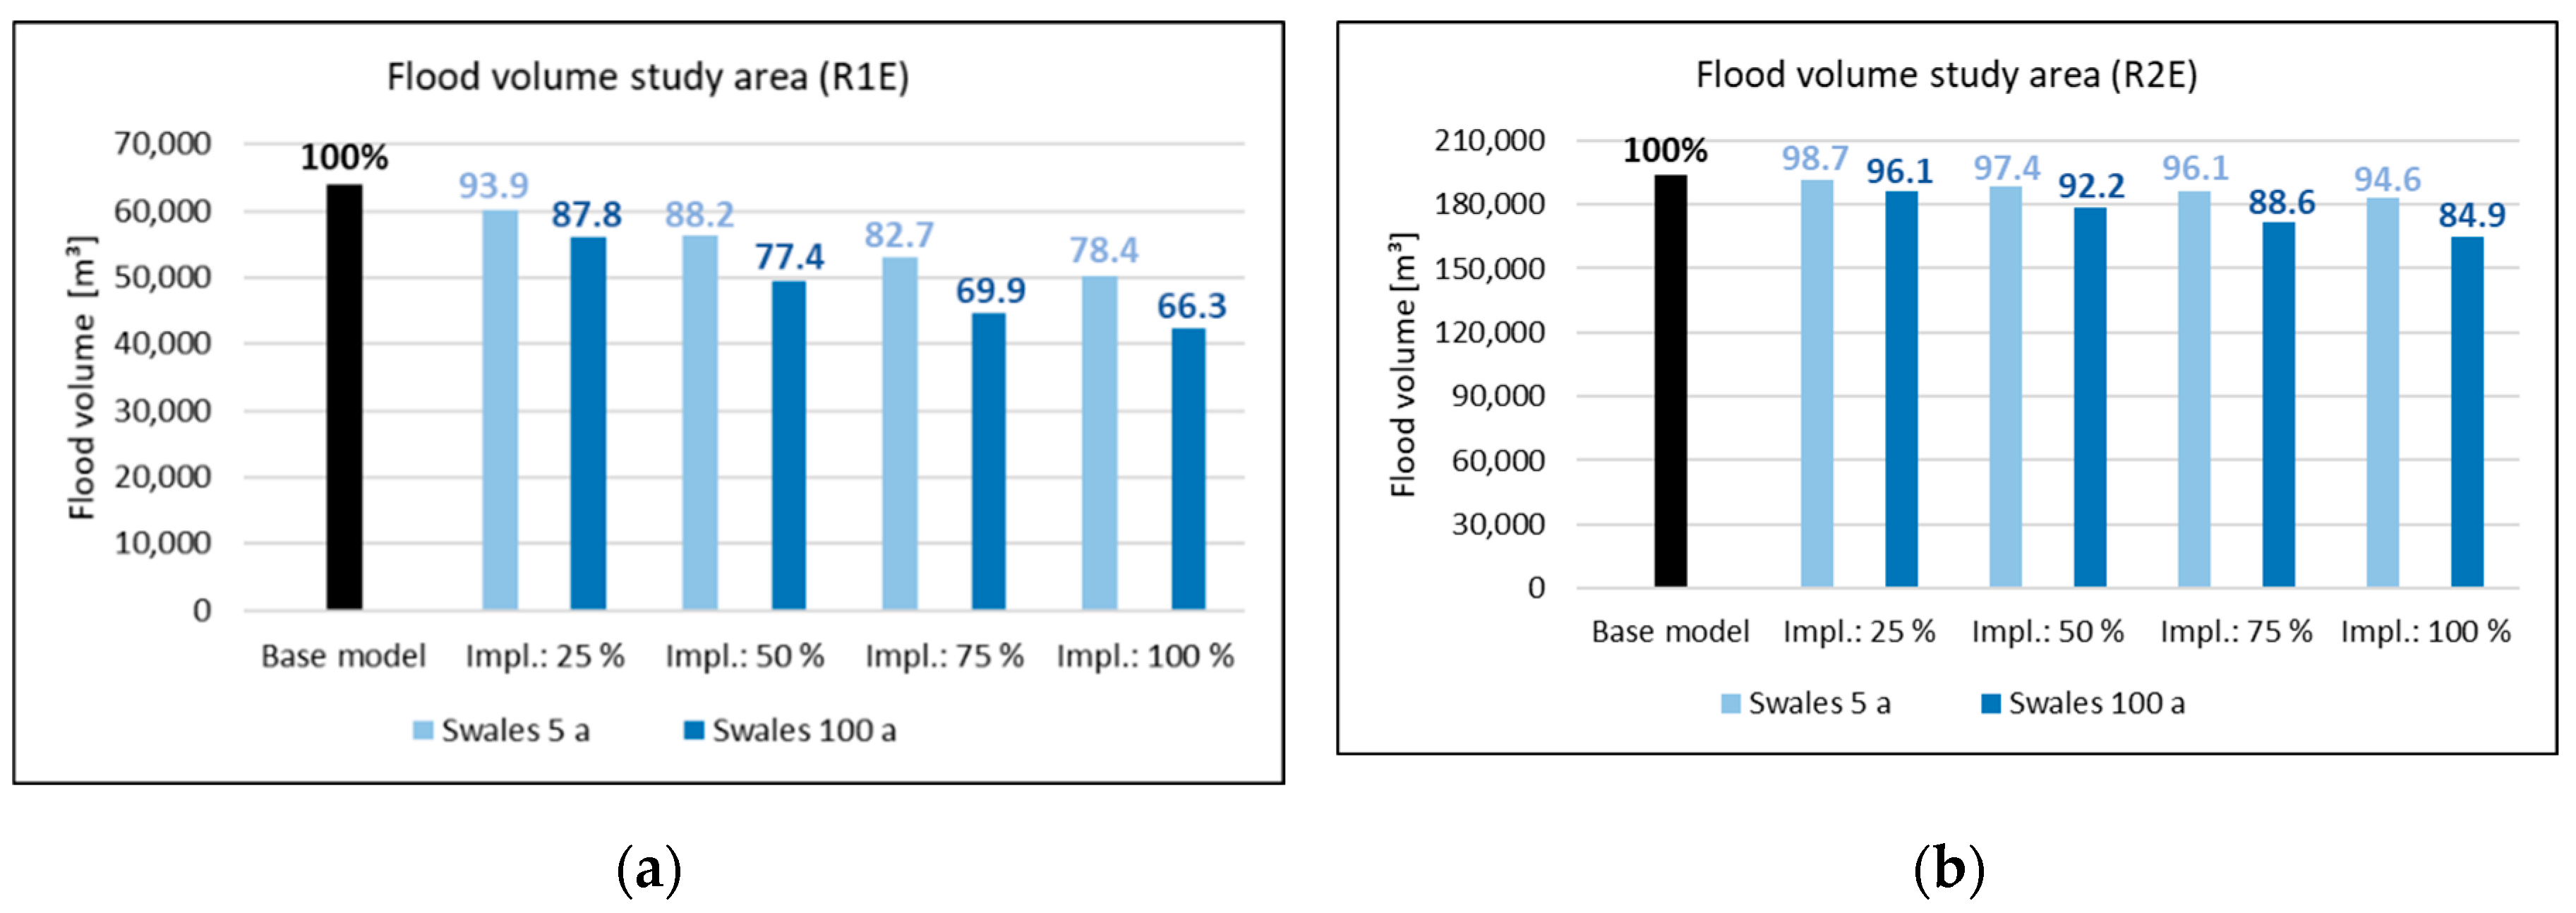
Figure 8.
Maximum flood heights in the center of flooding: (a) Base model; (b) Swales (T = 100 a), degree of implementation: 50%; (c) Swales (T = 100 a), degree of implementation: 100%. The black arrows indicate the lowest point the street.
Figure 8.
Maximum flood heights in the center of flooding: (a) Base model; (b) Swales (T = 100 a), degree of implementation: 50%; (c) Swales (T = 100 a), degree of implementation: 100%. The black arrows indicate the lowest point the street.
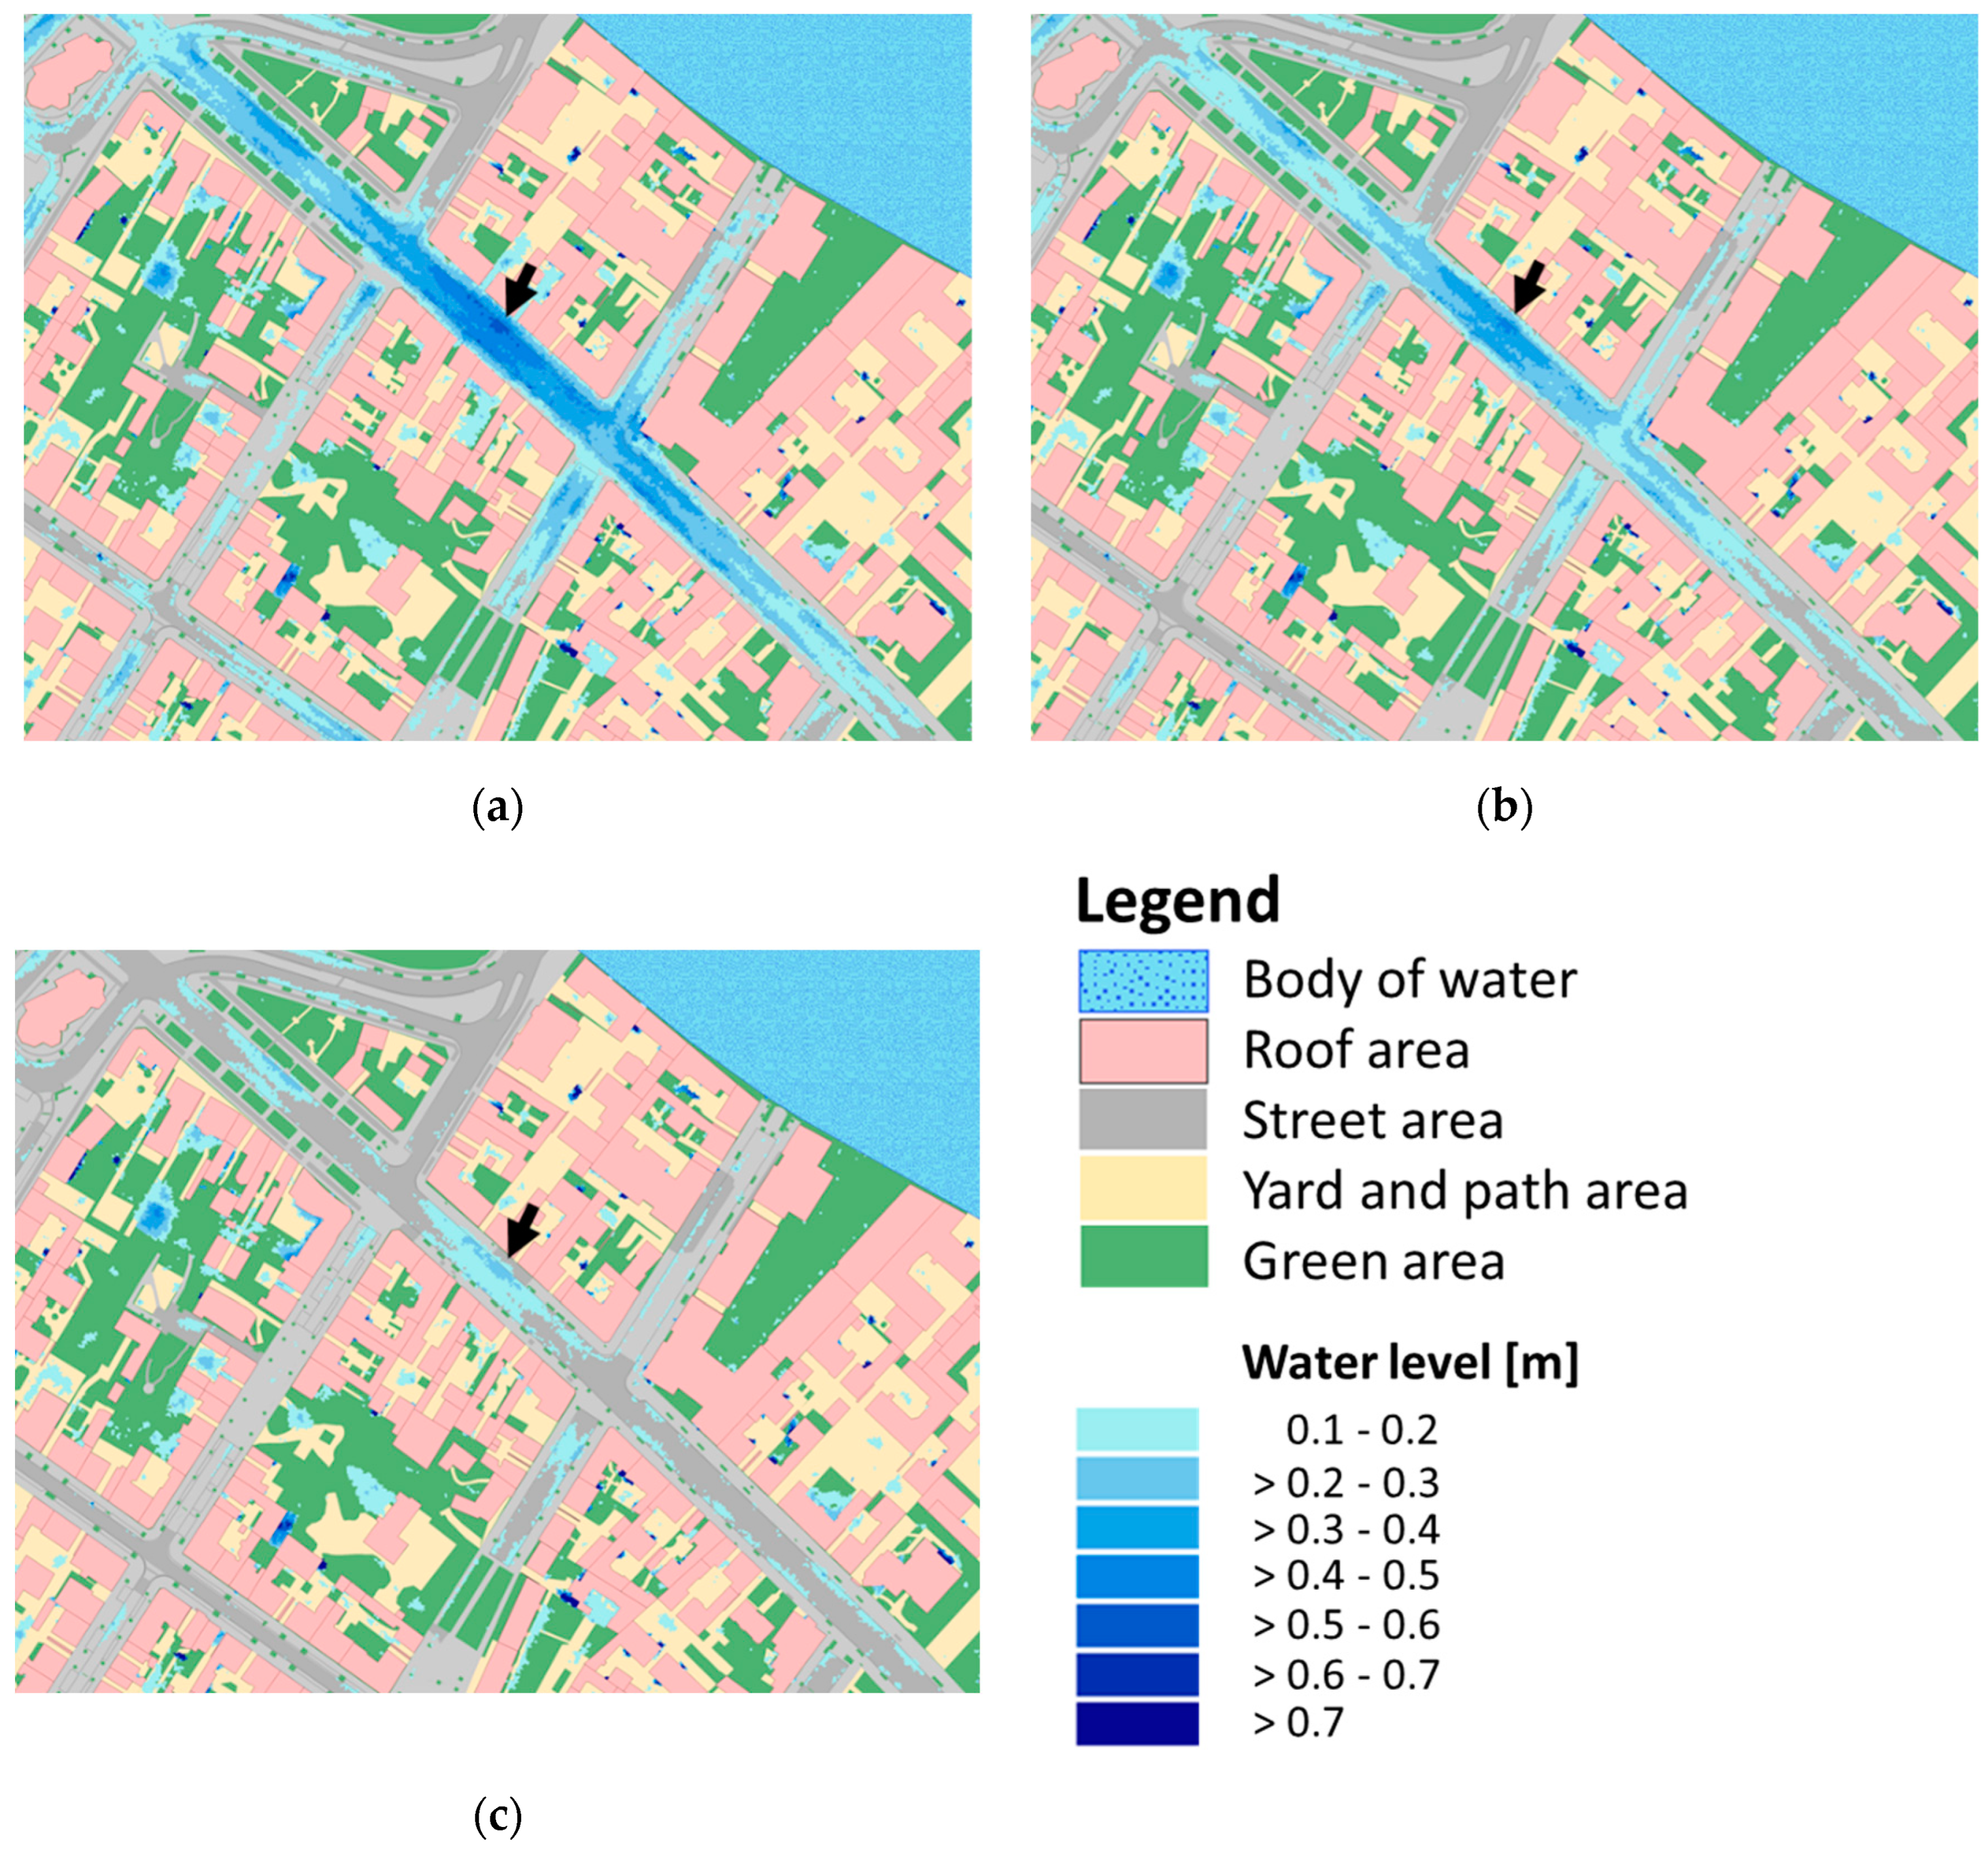
Figure 9.
Total flood volume and percentage difference for the base model and various NBS (implementation degree 100%) between an Euler type 2 and block rain distribution for R1E respectively R1B.
Figure 9.
Total flood volume and percentage difference for the base model and various NBS (implementation degree 100%) between an Euler type 2 and block rain distribution for R1E respectively R1B.
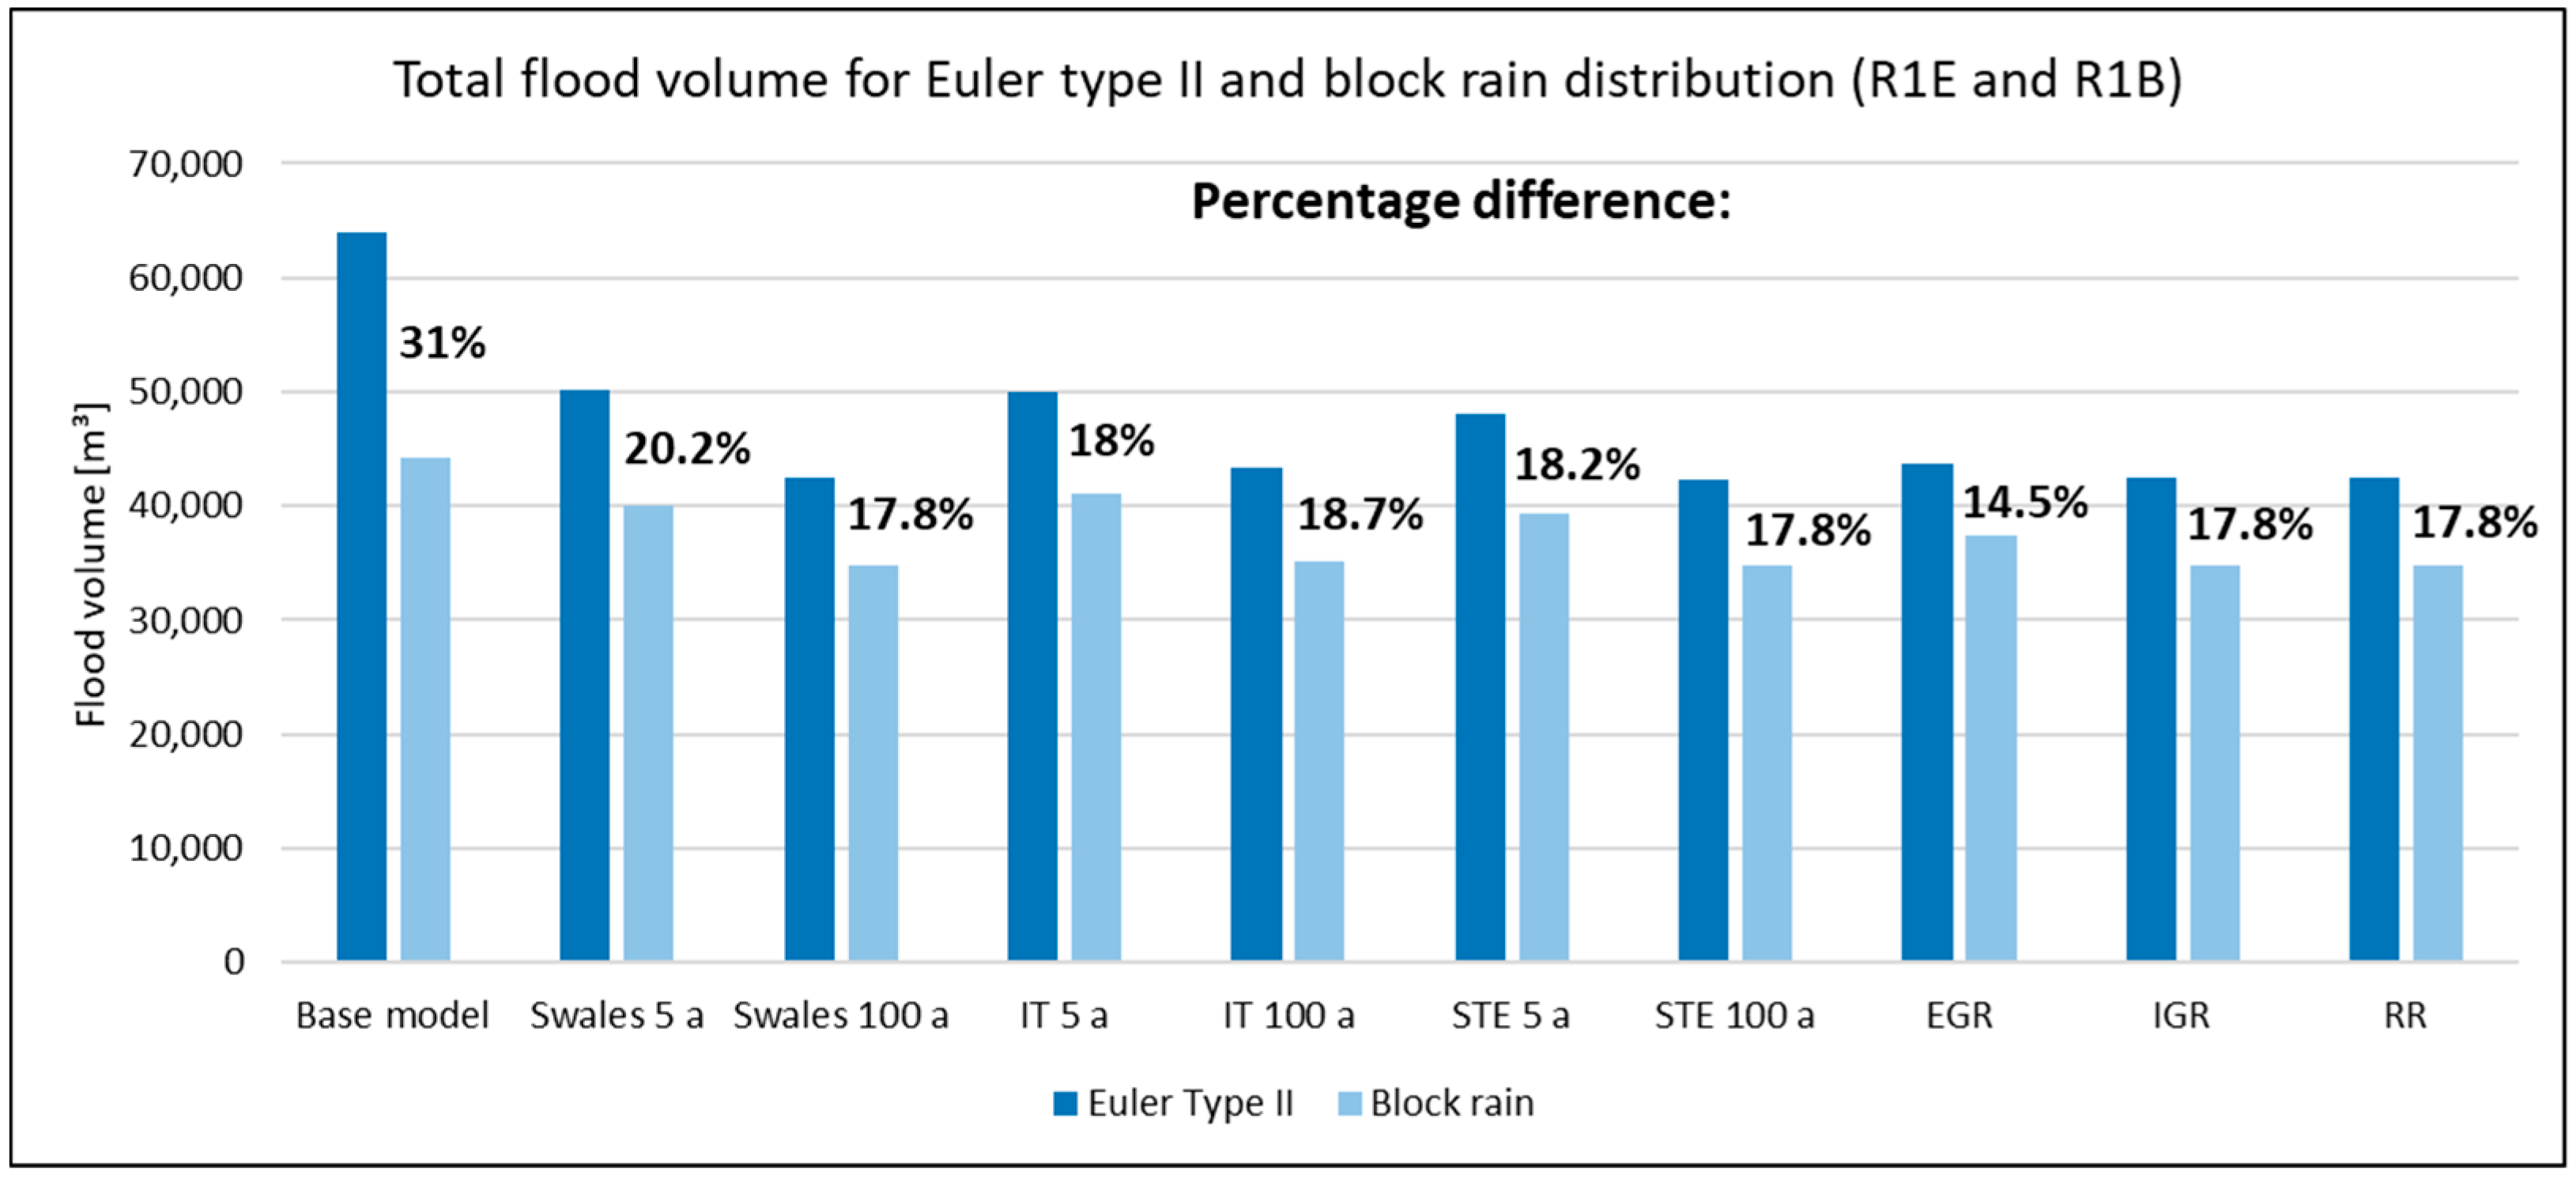
Table 1.
Runoff and roughness coefficients of the impervious surfaces.
| Area | Discharge coefficient | Roughness coefficient n |
| [-] | [-] | [s · m-1/3] |
| Roofs | 1.0 | - |
| Streets | 0.97 | 0.0143 |
| Yards and walk / bikeways | 0.85 | 0.02 |
Table 2.
Final dimensions of the infiltration systems; Aim: connected impervious area (100% runoff), HS: height of the swale, HIT: height of the infiltration trench, AIS: area of the infiltration system, AIS : Aim: ratio between area of the infiltration system and connected impervious area.
Table 2.
Final dimensions of the infiltration systems; Aim: connected impervious area (100% runoff), HS: height of the swale, HIT: height of the infiltration trench, AIS: area of the infiltration system, AIS : Aim: ratio between area of the infiltration system and connected impervious area.
| Infiltration system | Return period | Aim | HS | HIT | AIS | VIS | AIS : Aim |
| [a] | [m²] | [m] | [m] | [m] | [m³] | [%] | |
| Swale | 5 | 1000 | 0.3 | - | 66.2 | 19.86 | 6.62 |
| 100 | 1000 | 0.3 | - | 138.2 | 41.46 | 13.82 | |
| Infiltration trench | 5 | 1000 | - | 0.6 | 38.2 | 22.92 | 3.82 |
| 100 | 1000 | - | 0.6 | 75.6 | 45.36 | 7.56 | |
| Swale-trench-element | 5 | 1000 | 0.3 | 0.331 | 39.5 | 24.92 | 3.95 |
| 100 | 1000 | 0.3 | 0.523 | 83.3 | 32.51 | 8.33 |
Table 3.
Representative structure of the selected green roofs; EGR: extensive green roof, IGR: intensive green roof, RR: retention roof.
Table 3.
Representative structure of the selected green roofs; EGR: extensive green roof, IGR: intensive green roof, RR: retention roof.
| Layer | Thickness [mm] | Description | ||
| EGR | IGR | RR | ||
| Vegetation | - | - | - | Moos, succulent and grass vegetation for EGRs and RRs; grass and shrubs for IGRs |
| Soil | 100 | 300 | 150 | Vegetation substrate for multi-layer green roofs |
| Filter fleece | 10 | 10 | 10 | Fleece to protect the drainage / retention layer |
| Drainage / Retention | 25 | 25 | 125 | Drainage elements made of hard plastic |
| Protective fleece | 15 | 15 | 15 | Fleece to protect the roof waterproofing |
Table 4.
Structure of the tree pit and the tree trench.
| Tree location | Layer | Thickness [cm] | Description |
| Tree pit | Tree grid | 5 | Swale shaped tree grid |
| Tree substrate | 40 | Replaced substrate with a pore volume of 35% | |
| Existing soil | 110 | Existing soil up to 1.5 m depth with a pore volume of 20% | |
| Tree trench | Tree grid | 20 | Swale shaped tree grid |
| Tree substrate | 150 | Optimised tree substrate with a pore volume of 25% | |
| Infiltration trench | 30 | Infiltration trench (sand/split/gravel) with a pore volume of 30% | |
| Storage | 30 | Storage (sand/gravel) with a pore volume of 30%, sealed (not completely) by e.g. clay |
Table 5.
NBS and SUDS element with the corresponding layers.
| NBS | SUDS element | Layer | |||
| Surface | Soil | Storage | Drainage mat | ||
| Swale | Rain garden | x | x | - | - |
| Infiltration-trench | Rain barrel | - | - | x | - |
| Swale-trench-element | Infiltration trench | x | - | x | - |
| Intensive green roof | Green roof | x | x | - | x |
| Extensive green roof | Green roof | x | x | - | x |
| Retention roof | Bio-retention cell | x | x | x | - |
| Tree pit | Rain garden | x | x | - | - |
| Tree Trench | Bio-retention cell | x | x | x | - |
Table 6.
Model parameters; S: swale, IT: infiltration trench, STE: swale-trench-element, EGR: extensive green roof, IGR: intensive green roof, RR: retention roof, TP: tree pit, TT: tree trench.
Table 6.
Model parameters; S: swale, IT: infiltration trench, STE: swale-trench-element, EGR: extensive green roof, IGR: intensive green roof, RR: retention roof, TP: tree pit, TT: tree trench.
| Layer | Parameter | Unit | Infiltration systems | Green Roofs | Tree locations | |||||
| S | IT | STE | EGR | IGR | RR | TP | TT | |||
| Surface | Berm height | [mm] | 300 | - | 300 | 10 | 10 | 10 | 33.3 | 133.3 |
| Vegetation volume fraction | [vol fr.] | 0.1 | - | 0.1 | 0.1 | 0.2 | 0.1 | 0.1 | 0.1 | |
| Surface roughness | [s· m-1/3] | 0.2 | - | 0.2 | 0.2 | 0.5 | 0.2 | 0.2 | 0.2 | |
| Surface slope | [m/m] | 0.02 | - | 0.02 | 0.02 | 0.02 | 0.02 | 0.02 | 0.02 | |
| Soil | Soil thickness | [mm] | 500 | - | - | 110 | 310 | 160 | 1500 | 1500 |
| Soil porosity | [vol fr.] | 0.437 | - | - | 0.45 | 0.45 | 0.45 | 0.24 | 0.24 | |
| Field capacity | [vol fr.] | 0.062 | - | - | 0.3 | 0.3 | 0.3 | 0.190 | 0.190 | |
| Wilting point | [vol fr.] | 0.024 | - | - | 0.05 | 0.05 | 0.05 | 0.085 | 0.085 | |
| Conductivity | [mm/h] | 120.4 | - | - | 881 | 881 | 881 | 180 | 180 | |
| Conductivity slope | [-] | 48 | - | - | 50 | 50 | 50 | 55.4 | 55.4 | |
| Suction head | [mm] | 49.0 | - | - | 110 | 110 | 110 | 110 | 110 | |
| Seepage rate | [mm/h] | 120.4 | - | - | - | - | - | 120.4 | - | |
| Storage | Storage thickness | [mm] | - | 600 | 331/523 * | - | - | 125 | - | 600 |
| Storage void ratio | [-] | - | 9 | 9 | - | - | 9 | - | 0.429 | |
| Seepage rate | [mm/h] | - | 120.4 | 120.4 | - | - | 0.5 | - | 12.04 | |
| Storage clogging factor | [-] | - | 0 | 0 | - | - | 0 | - | 0 | |
| Coefficient for flow | [mm/h] | - | 0 | 0 | - | - | 200 | - | 26.68 | |
| Flow exponent | [-] | - | 0 | 0 | - | - | 0 | - | 0 | |
| Offset height | [mm] | - | 0 | 0 | - | - | 100 | - | 300 | |
| Drainage mat | Mat thickness | [mm] | - | - | - | 25 | 25 | - | - | - |
| Mat void fraction | [vol fr.] | - | - | - | 0.6 | 0.6 | - | - | - | |
| Mat roughness | [s· m-1/3] | - | - | - | 0.03 | 0.03 | - | - | - | |
* Storage thickness of 331 mm for the dimensioning with a return period of T = 5 a, 523 mm for a return period of T = 100 a.
Table 7.
Characteristics of the rainfall events.
| Name | Rainfall distribution |
Return period | Duration | Precipitation height |
|---|---|---|---|---|
| [-] | [a] | [min] | [mm] | |
| R0B | Block rain | 5 | 60 | 25 |
| R1B | Block rain | 100 | 60 | 48.9 |
| R1E | Euler type 2 | 100 | 60 | 48.9 |
| R2E | Euler type 2 | >> 100 | 60 | 100 |
Table 8.
Simulation runs with homogenous NBS distribution; S: swale, IT: infiltration trench, STE: swale-trench-element, EGR: extensive green roof, IGR: intensive green roof, RR: retention roof, TP: tree pit, TT: tree trench.
Table 8.
Simulation runs with homogenous NBS distribution; S: swale, IT: infiltration trench, STE: swale-trench-element, EGR: extensive green roof, IGR: intensive green roof, RR: retention roof, TP: tree pit, TT: tree trench.
| Rain fall load | Degree of Implementation |
Base model |
Infiltration systems | Green Roofs | Tree locations | ||||||||
| S | IT | STE | EGR | IGR | RR | TP | TT | ||||||
| 5 a | 100 a | 5 a | 100 a | 5 a | 100 a | - | - | - | 5 a | 5 a | |||
| R1E Euler type 2 |
- | x | x | x | |||||||||
| 25% | x | x | x | x | x | x | x | x | x | ||||
| 50% | x | x | x | x | x | x | x | x | x | ||||
| 75% | x | x | x | x | x | x | x | x | x | ||||
| 100% | x | x | x | x | x | x | x | x | x | x | x | ||
| 50.3% | x | ||||||||||||
| R2E Euler type 2 |
- | x | x | x | |||||||||
| 25% | x | x | x | x | x | x | x | x | x | ||||
| 50% | x | x | x | x | x | x | x | x | x | ||||
| 75% | x | x | x | x | x | x | x | x | x | ||||
| 100% | x | x | x | x | x | x | x | x | x | x | x | ||
| 50.3% | x | ||||||||||||
| R1B Block rain |
- | x | |||||||||||
| 100% | x | x | x | x | x | x | x | x | x | ||||
Table 9.
Simulation results for R1E and R2E with an NBS implementation degree of 100 %.
| R1E | R2E | |||||||
| Model |
Flood volume |
Reduction | Overflow or underdrain | Sewer overflow |
Flood volume |
Reduction | Overflow or underdrain | Sewer overflow |
| [m³] | [%] | [m³] | [m³] | [m³] | [%] | [m³] | [m³] | |
| Base model | 63,958 | - | - | 13,859 | 193,818 | - | - | 50300 |
| Swales (T = 5 a) | 50,122 | 21.6 | 21,947 | 4,422 | 183,273 | 5.4 | 74,661 | 42,116 |
| Swales (T = 100 a) | 42,398 | 33.7 | 0 | 53 | 164,641 | 15.1 | 50,418 | 27,824 |
| Infiltration trenches (T = 5 a) | 50,067 | 21.7 | 20,859 | 4,324 | 181,988 | 6.1 | 70,829 | 41,532 |
| Infiltration trenches (T = 100 a) | 43,290 | 32.3 | 0 | 326 | 162,744 | 16.0 | 44,444 | 27,174 |
| Swale-trench-elements (T = 5 a) | 48,071 | 24.8 | 19,542 | 3,034 | 175,776 | 9.3 | 66,257 | 36,147 |
| Swale-trench-elements (T = 100 a) | 42,368 | 33.8 | 0 | 48 | 143,814 | 25.8 | 29,435 | 13,540 |
| Extensive green roofs | 43,651 | 31.8 | 14,945 | 658 | 167,052 | 13.8 | 64,396 | 32,258 |
| Intensive green roofs | 42,393 | 33.7 | 0 | 51 | 128,917 | 33.5 | 4,200 | 2,948 |
| Retention roof | 42,393 | 33.7 | 0 | 51 | 128,785 | 33.6 | 0 | 2,752 |
| Base model tree pits | 64,786 | - | - | 18,717 | 195,860 | - | - | 65,024 |
| Tree pits | 61,972 | 4.3 | 5,982 | 16,452 | 192,817 | 1.6 | 18,536 | 61,906 |
| Base model tree trenches | 64,757 | - | - | 21,509 | 196,316 | - | - | 73,641 |
| Tree trenches | 60,256 | 7.0 | 9,128 | 17,688 | 191,915 | 2.2 | 28,607 | 69,027 |
Disclaimer/Publisher’s Note: The statements, opinions and data contained in all publications are solely those of the individual author(s) and contributor(s) and not of MDPI and/or the editor(s). MDPI and/or the editor(s) disclaim responsibility for any injury to people or property resulting from any ideas, methods, instructions or products referred to in the content. |
© 2024 by the authors. Licensee MDPI, Basel, Switzerland. This article is an open access article distributed under the terms and conditions of the Creative Commons Attribution (CC BY) license (http://creativecommons.org/licenses/by/4.0/).
Copyright: This open access article is published under a Creative Commons CC BY 4.0 license, which permit the free download, distribution, and reuse, provided that the author and preprint are cited in any reuse.


