1. Introduction
1.1. General Introduction
Nepal has enormous hydropower potential that could be exported to neighboring countries India and Bangladesh having limited energy reserves. So, Nepal has strategic economic opportunities for power trade. Nepal has huge hydropower potential. Out of 83 GW 43 GW is technically and commercially feasible for power generation [
1]. The Nepal Electricity Authority (NEA)— the sole government-owned organization responsible for generation, transmission, and distribution— has projected that many hydropower projects will have commissioned with cumulative installed capacity above 6000 MW and the peak load on the Integrated Nepalese Power System (INPS) will be only 3000 MW. NEA has projected that Nepal will be self-reliant in energy after 2025 and will have more than 20 TWh of surplus energy in the system by 2028. In addition to that, Government of Nepal has also outlined the vision of harnessing 15 GW of electricity from hydropower and other renewables by 2030 [
2]. Based on past data on the trend of electricity demand and per capita electricity consumption in the nation, Nepal is unlikely to consume its entire generation.
Despite having bulk surplus energy in the system to export power to the neighboring countries, many prevailing barriers may push back the materialization of Nepal’s dream of bulk power trade. Against this backdrop, this paper analyzes Nepal's present and future energy production scenarios based on the secondary data and ranking of barriers using quantitative technique. Also, this paper assesses Nepal’s infrastructure policy and organizational setup for analyzing the readiness for cross border electricity trade in the second part of this study.
Cross Border Electricity Trade (CBET) has already begun worldwide. The Greater Mekong Sub–region (GMS) Energy Program, The Central American Electricity Interconnection System (SIEPAC), The South African Power Pool (SAPP), and the Nordic Power Pool (Denmark, Finland, Norway, and Sweden) are the international agreements for power pool that are already in the advanced stages of development. In order to follow the success stories of cross border electricity trade. Several researches have flagged the CBET opportunities and benefits of Nepal’s hydropower in the South Asian Region, particularly the Bhutan –Bangladesh- India –Nepal (BBIN) sub-region. These studies highlight that generating cost savings, enhanced system reliability, and reduced carbon emission are the key drivers of CBET [
3]. Studies also show that regional trade in electricity can help reduce costs, increase reliability, mitigate power outages, facilitate de-carbonization, and benefit from market integration and extension [
4].
Working together, countries in South Asia can reduce the cost of energy by trading energy with each other and with other countries in the region. This will help to meet the growing demand for energy and make sure that there is ample and reliable energy sources available. [
5,
6]
Robust cooperation among member countries allows the South Asia Region to benefit from power trade. Cross-border electricity trade can attract foreign investment to ensure the availability of electricity and the cost-effective expansion of renewable electricity [
7]. Indian Energy Exchange (IEX) outlined that enhanced energy access and security, integrated power market, competitive power price, transparent and efficient power procurement, and resource optimization are the significant benefits of regional power trade (Indian Energy Exchange, 2022). Haq et al., [
9] revealed that lack of price-based energy cost for energy trading, low generation capacity, and underperforming financial institutions are the barriers to cross-border electricity trade in the South Asian Association for Regional Co-operation (SAARC) region. Ogino et al., [
10] found that geopolitical instability and political instability created delays in the construction of hydropower; these are primary barriers to hydropower trading. Dhakal et al., [
3] identified that the declining cost of renewable energy systems globally, especially solar and wind, inadequate trans-border transmission line interconnections, and huge initial investment required for developing projects are the significant barriers for Nepal in cross-border electricity trade with India. Nag [
11] declares that Nepal’s transmission capacity is a barrier to electricity trade with India. Strahorn [
12] pointed to the legacy of decade-long failed hydro–diplomacy as a barrier to electricity trade between Nepal and India. Mcbennet et al., [
13] suggested that the benefit of energy trading is the net energy export from Nepal to India can be increased up to threefold, hydro curtailment can lessen, and the production cost of hydropower in both countries can be drastically reduced.
1.2. Statement of problem and authors’ contributions
Few studies in the past have already revealed the potential and the benefits of CBET to Nepal and the globe. Furthermore, studies have identified the CBET opportunities and benefits of Nepal’s hydropower in South Asia and the Bangladesh-Bhutan-India-Nepal (BBIN) sub-region in both qualitative [
14,
15,
16] and quantitative terms [
17,
18].
However, this paper not only finds the barriers of CBET but also analyzes the present and future power generation, which is essential to examine the status of Nepal’s preparedness for bulk cross-border electricity trade. This paper addresses the literature gap by analyzing Nepal's preparedness for energy business with its neighboring countries.
Some of the novel questions this research has investigated are: i) What is the current and future scenario of Power Generation in Nepal? ii) How is Nepal ready for bulk cross-border electricity trade with neighboring countries? iii) What would be the result of applying the AHP method to assess the barriers to cross-border electricity trading?
This research is divided into two parts: the first part represents a literature review and the opinion of the experts to prepare a questionnaire; the second part describes the outcomes of the interview and the analysis of data collected through the questionnaire. Multi–Criteria Decision Making (MCDM) was used to quantitatively analyze barriers using the Python library AHPy for the Analytical Hierarchy Process (AHP). The reliability of the survey was also calculated through a statistical approach using Python. Moreover, the country’s readiness for CBET was assessed qualitatively. MCDM -AHP is employed here in this research as we have to reveal the sectorial barrier identified through literature review which is most prevalent for the CBET in the context of Nepal.
A notable strength of this paper is that it will not only point out the barriers to cross-border electricity trade but also propose remedies to the barriers identified. The finding of this study will have significant implications for other cross-national situations involving collaboration in energy trading, particularly regarding prospects.
2. Literature Review
2.1. Review of Electricity Export Potential
With more than 6,000 rivers electricity generation in Nepal is predominantly hydro-based. Nepal's government utility, NEA and independent power producers generate power from their plants. Many hydro-powers owned by the private sector are in different stages of development, and Nepal is making significant progress in the electricity generation sector. However, the transmission infrastructure development is a current major challenge in the power system development in Nepal which may hinder power trade. Due to the lack of transmission lines, many hydropower projects could not operate at their full capacities [].
Despite huge hydropower potential, Nepal Electricity Authority (NEA) still depends on energy imported from India to meet domestic demands, corresponding to 32% of its total electricity import from India in 2021 [
2]. Nepal is expected to be a net energy exporter by 2025. Nepal has already started exporting part of its generated electricity in the wet season to India, which is negligible compared to its import.
Nepal has multiple sellers and a single buyer in a nominal generation market structure. NEA is the sole purchaser of electricity at the wholesale level [
3]. Prevailing power purchase agreements (PPA) between NEA and IPPs are on a take-or-pay basis. That means the buyer, viz., NEA, must pay the contract rate of their electricity price irrespective of consumption or sale. Because of this modality of energy procurement, NEA may bear substantial financial losses if the cross-border electricity trade with neighboring countries does not materialize as expected.
The move towards a shared electricity market pool could cover the sub-regional and, ultimately, the regional level [
20]. This was perceived as the solution to India's growing energy demand and an economic boost for Nepal by decreasing its trade deficit.
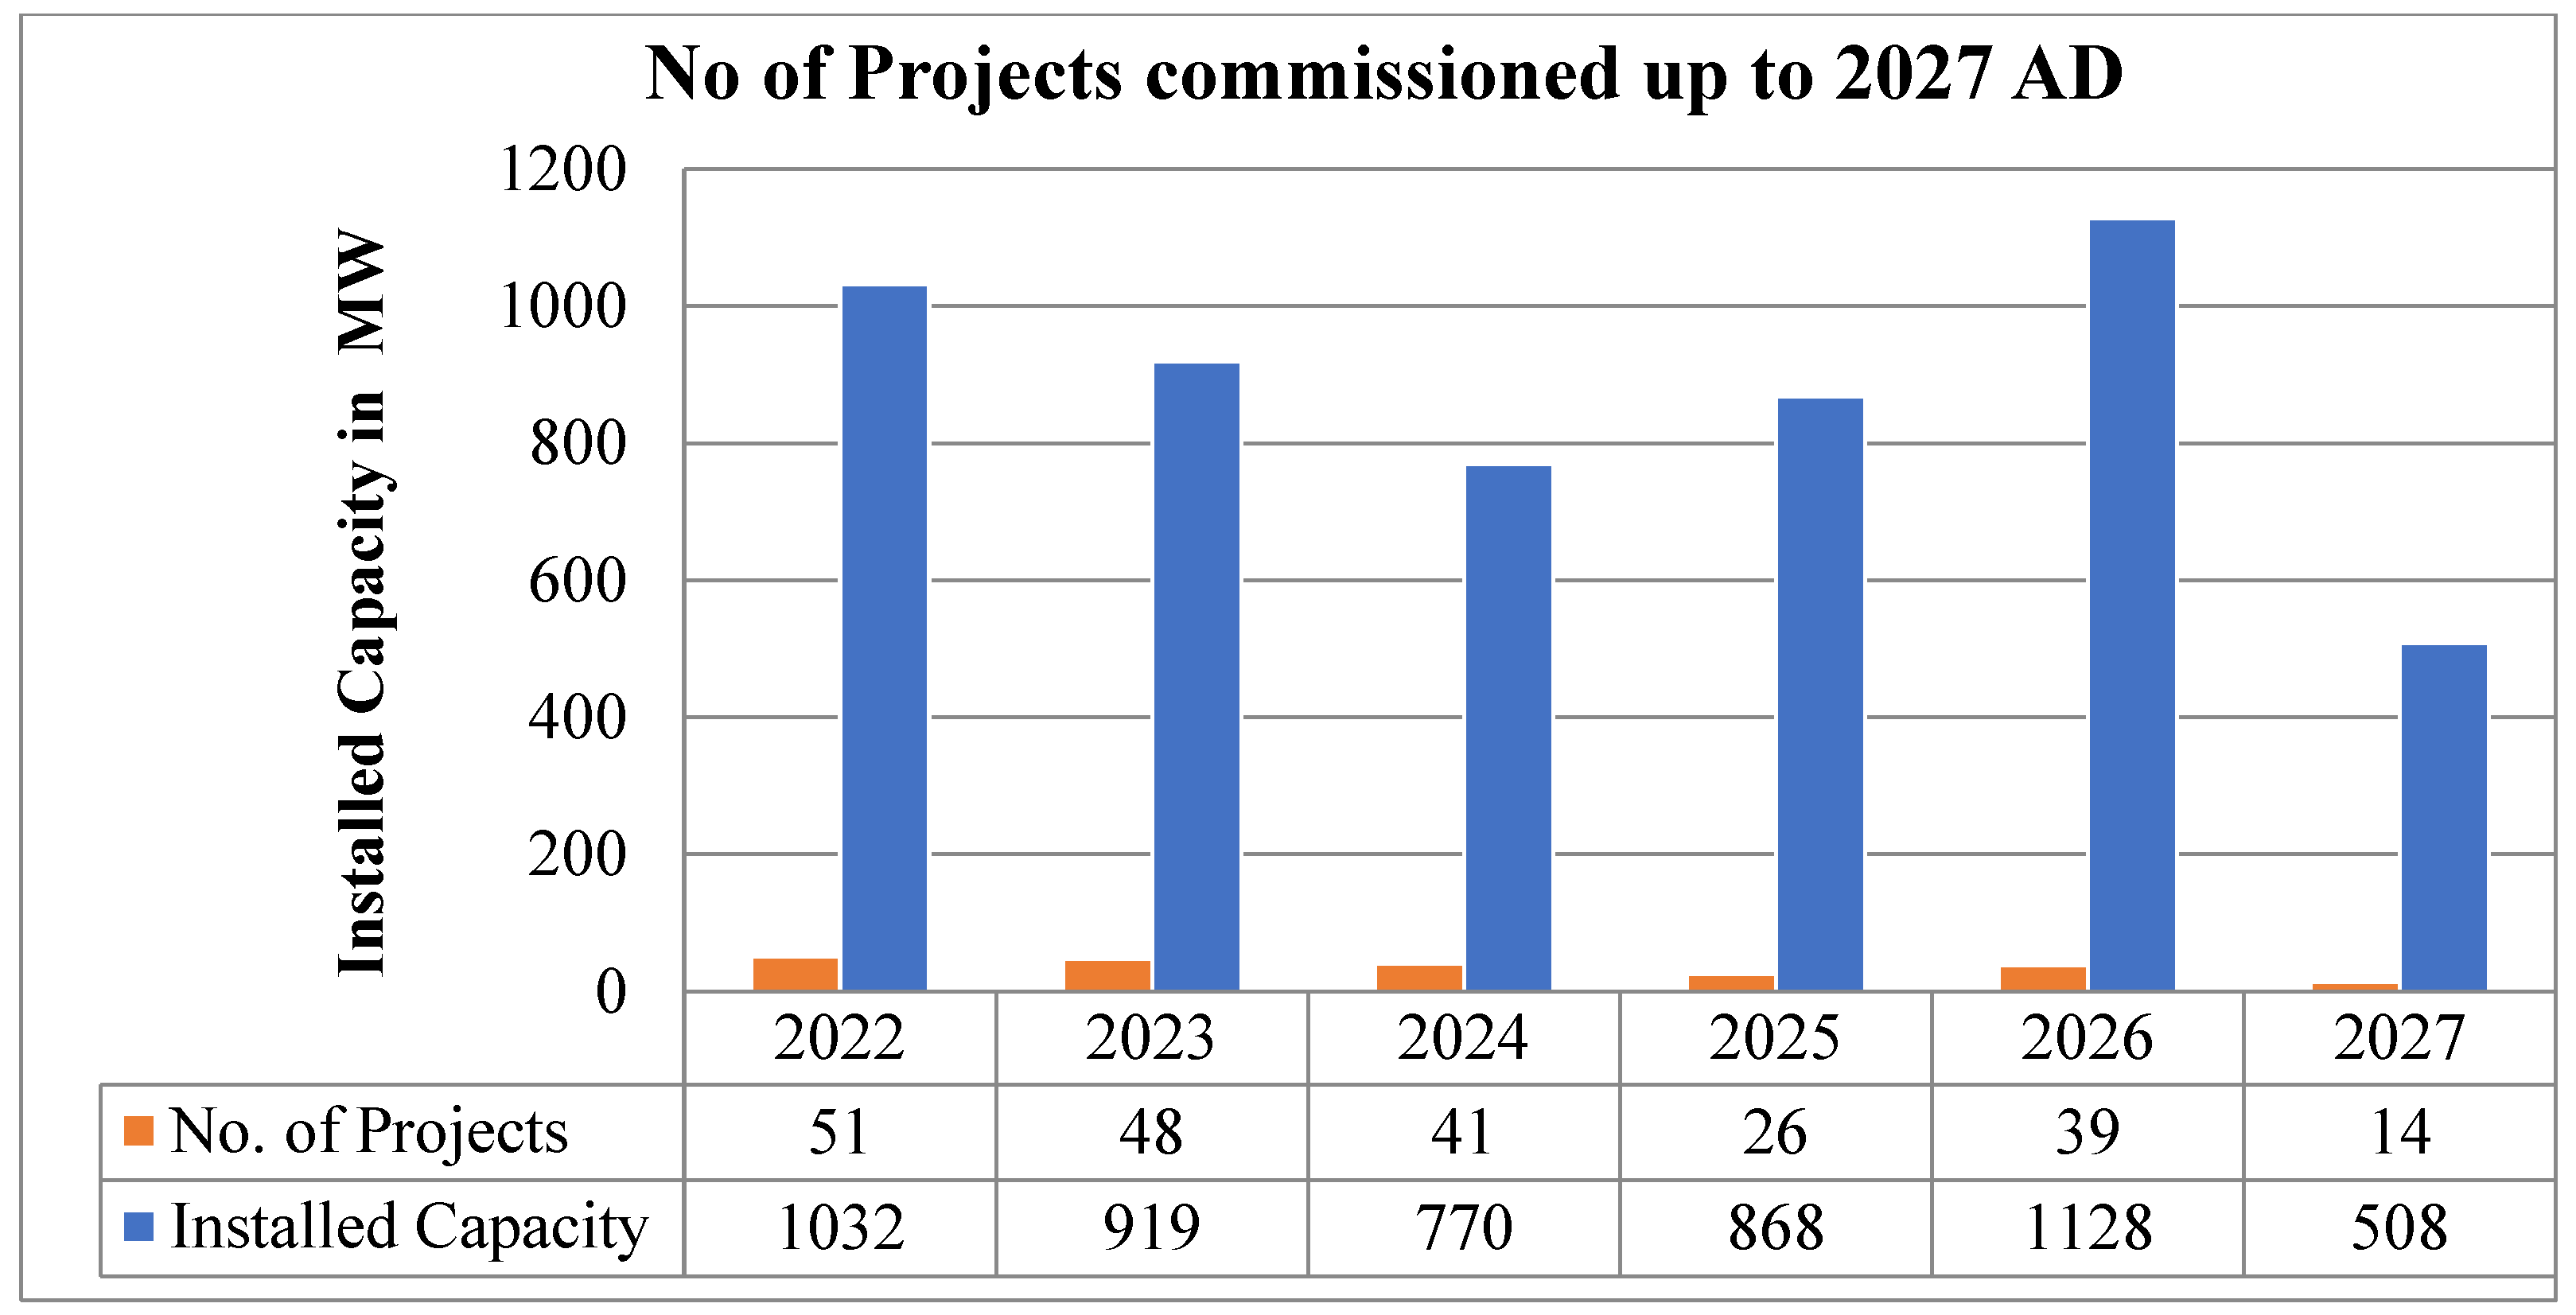
After prolonged waiting, Nepal is on the verge of selling its surplus energy to neighboring countries. Therefore, Nepal is swiftly transitioning from a chronic power deficit to a power surplus country. This shift from deficit to surplus marks a paradigm shift in cross-border electricity trade between Nepal and its neighboring countries. According to NEA’s forecast based on the hydropower plants’ Required Commercial Operation Date (RCOD), Nepal will have an installed capacity of around 4000 MW by 2026. However, it is not a significant figure compared to the commercial potential of hydropower production in Nepal. So, the Government of Nepal (GoN) has further planned to develop hydropower projects with an installed capacity of above 10,000 MW to meet domestic needs and facilitate cross-border trade. With limited power infrastructure facilities and a small economy, there is less chance of a sharp increase in the electricity consumption for all energy generated within Nepal. NEA has projected the hydropower project from independent power producers at different stages of development and commissioned up to 2028 as shown in
Figure 1, this illustrates the number of projects commencing from 2022 to 2027 seems to have the highest installed capacity of 1128 MW by the year 2026. It also shows 219 hydropower projects commissioned up to 2027 AD with a cumulative capacity of around 5300 MW. This data shows that the number of hydropower projects will be commissioned in the next four years.
2.2. Hydro Projects of Independent Power Producers (IPPs) in the Pipeline
After decades of paving the way for the private sector, the electricity sector has received significant contributions from private power project generators in INPS. The private sector contributed 36.5 % of the total systems energy in the INPS in 2021 [
2]. The trend of contribution has grown significantly. But, the rapid development of Runoff- River (ROR) hydropower projects has created the risk of a financial burden on the NEA [
3]. The ROR-type hydropower projects have created a huge seasonal imbalance of energy, posing a great challenge for the INPS in wet and dry seasons.
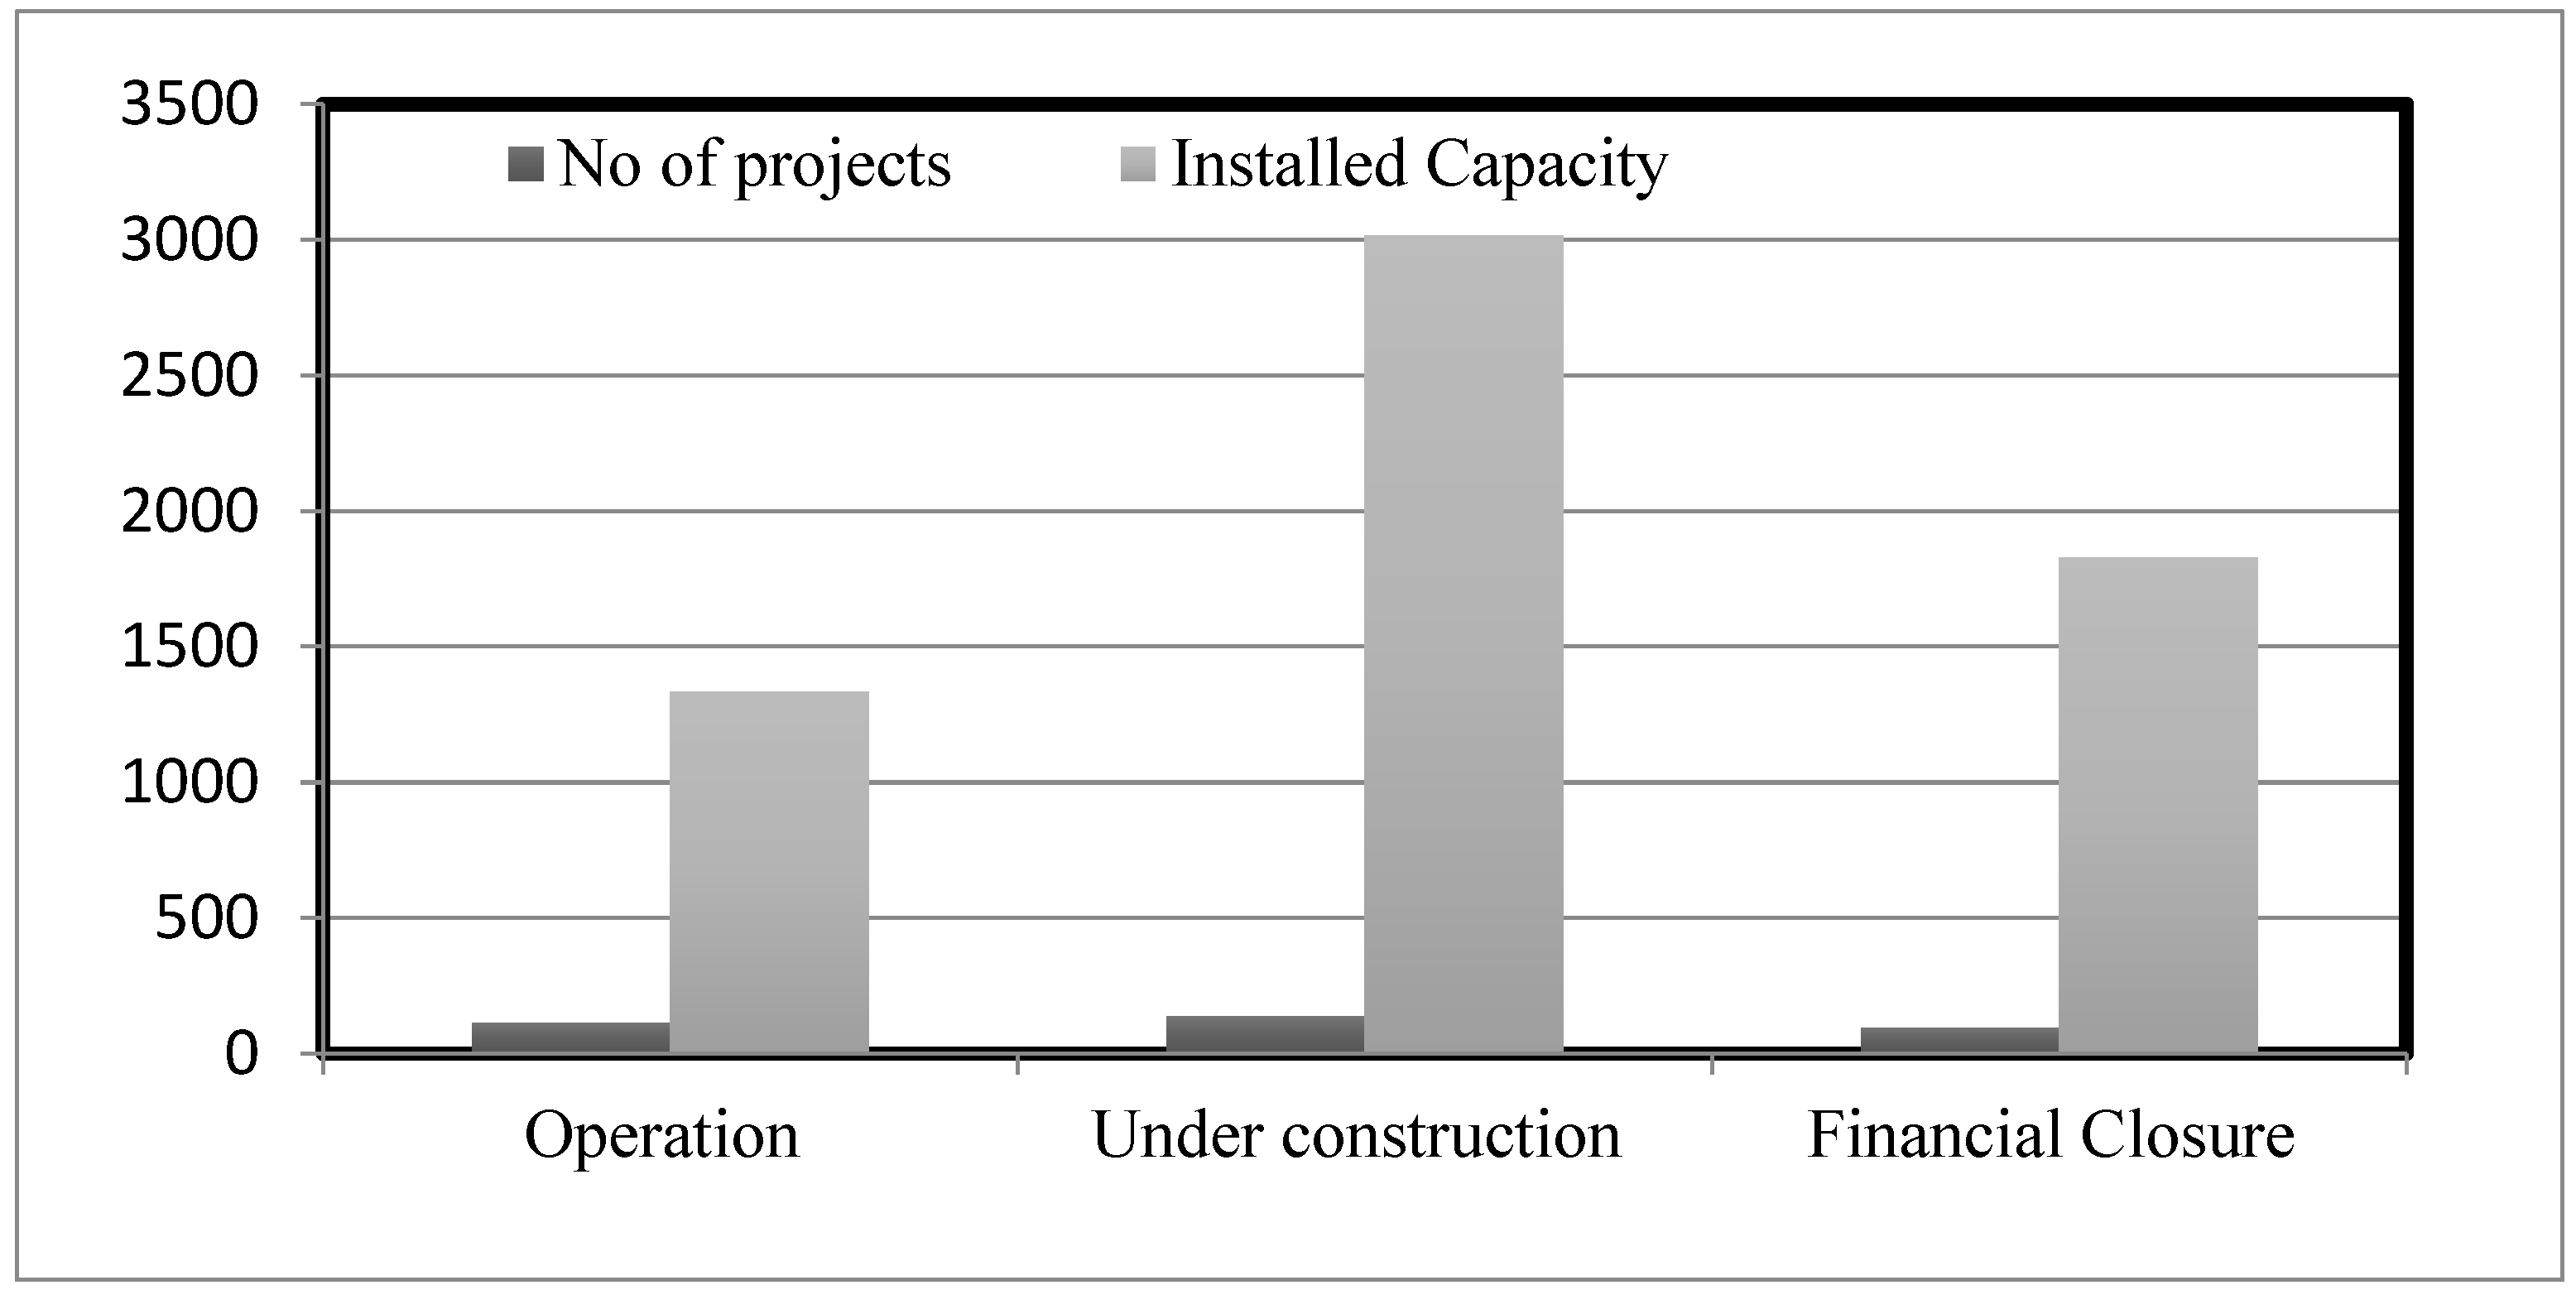
The above
Figure 2 provides a comprehensive visual representation of private hydropower projects, categorizing them based on their development stages, highlighting those with substantial installed capacity, and shedding light on the private sector's significant investment in the hydropower sector.
Though the generation is increasingly more expressive than the growth of internal electricity consumption, the average energy consumption growth in the last ten years, as shown in
Table 1, seems to be only 8.3 %. The
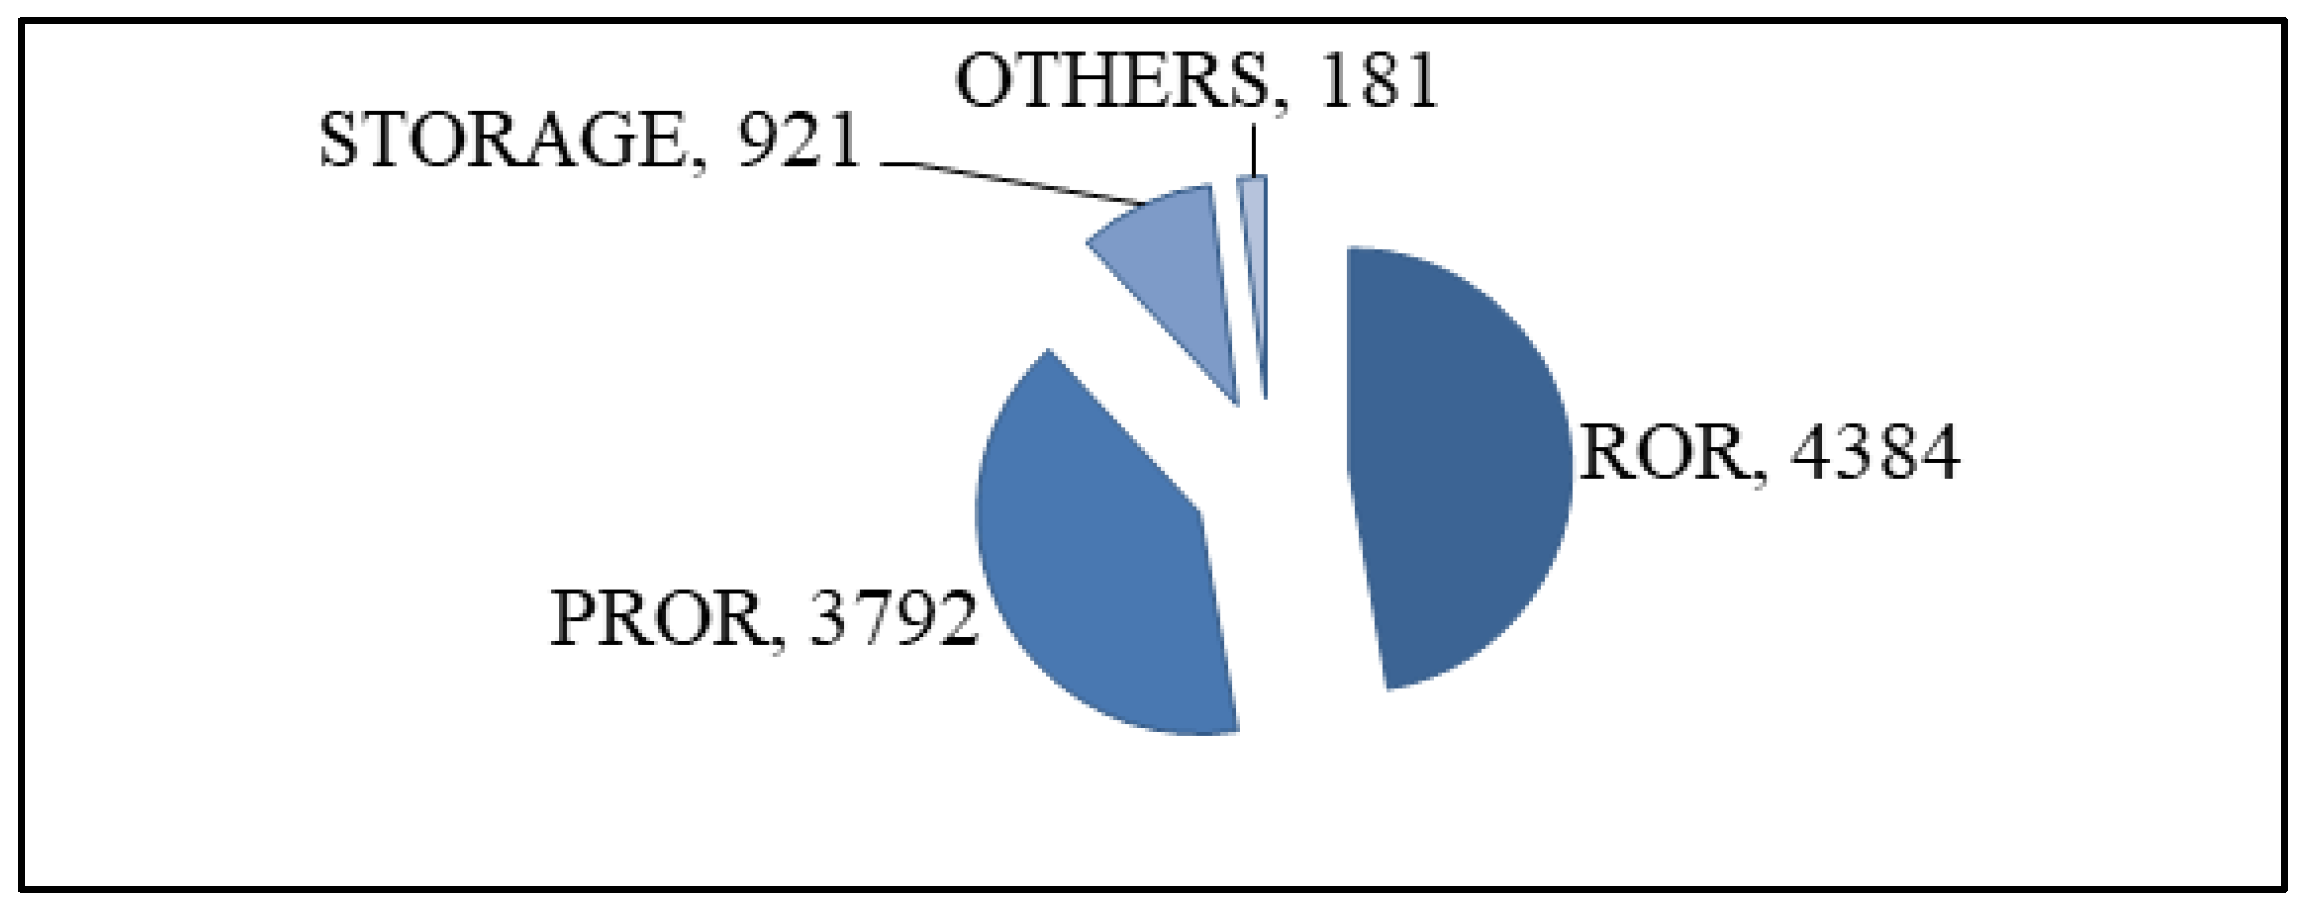
Figure 3 below shows the cumulative capacity of private sector developers if power plants waiting for PPA approval from NEA in MW.
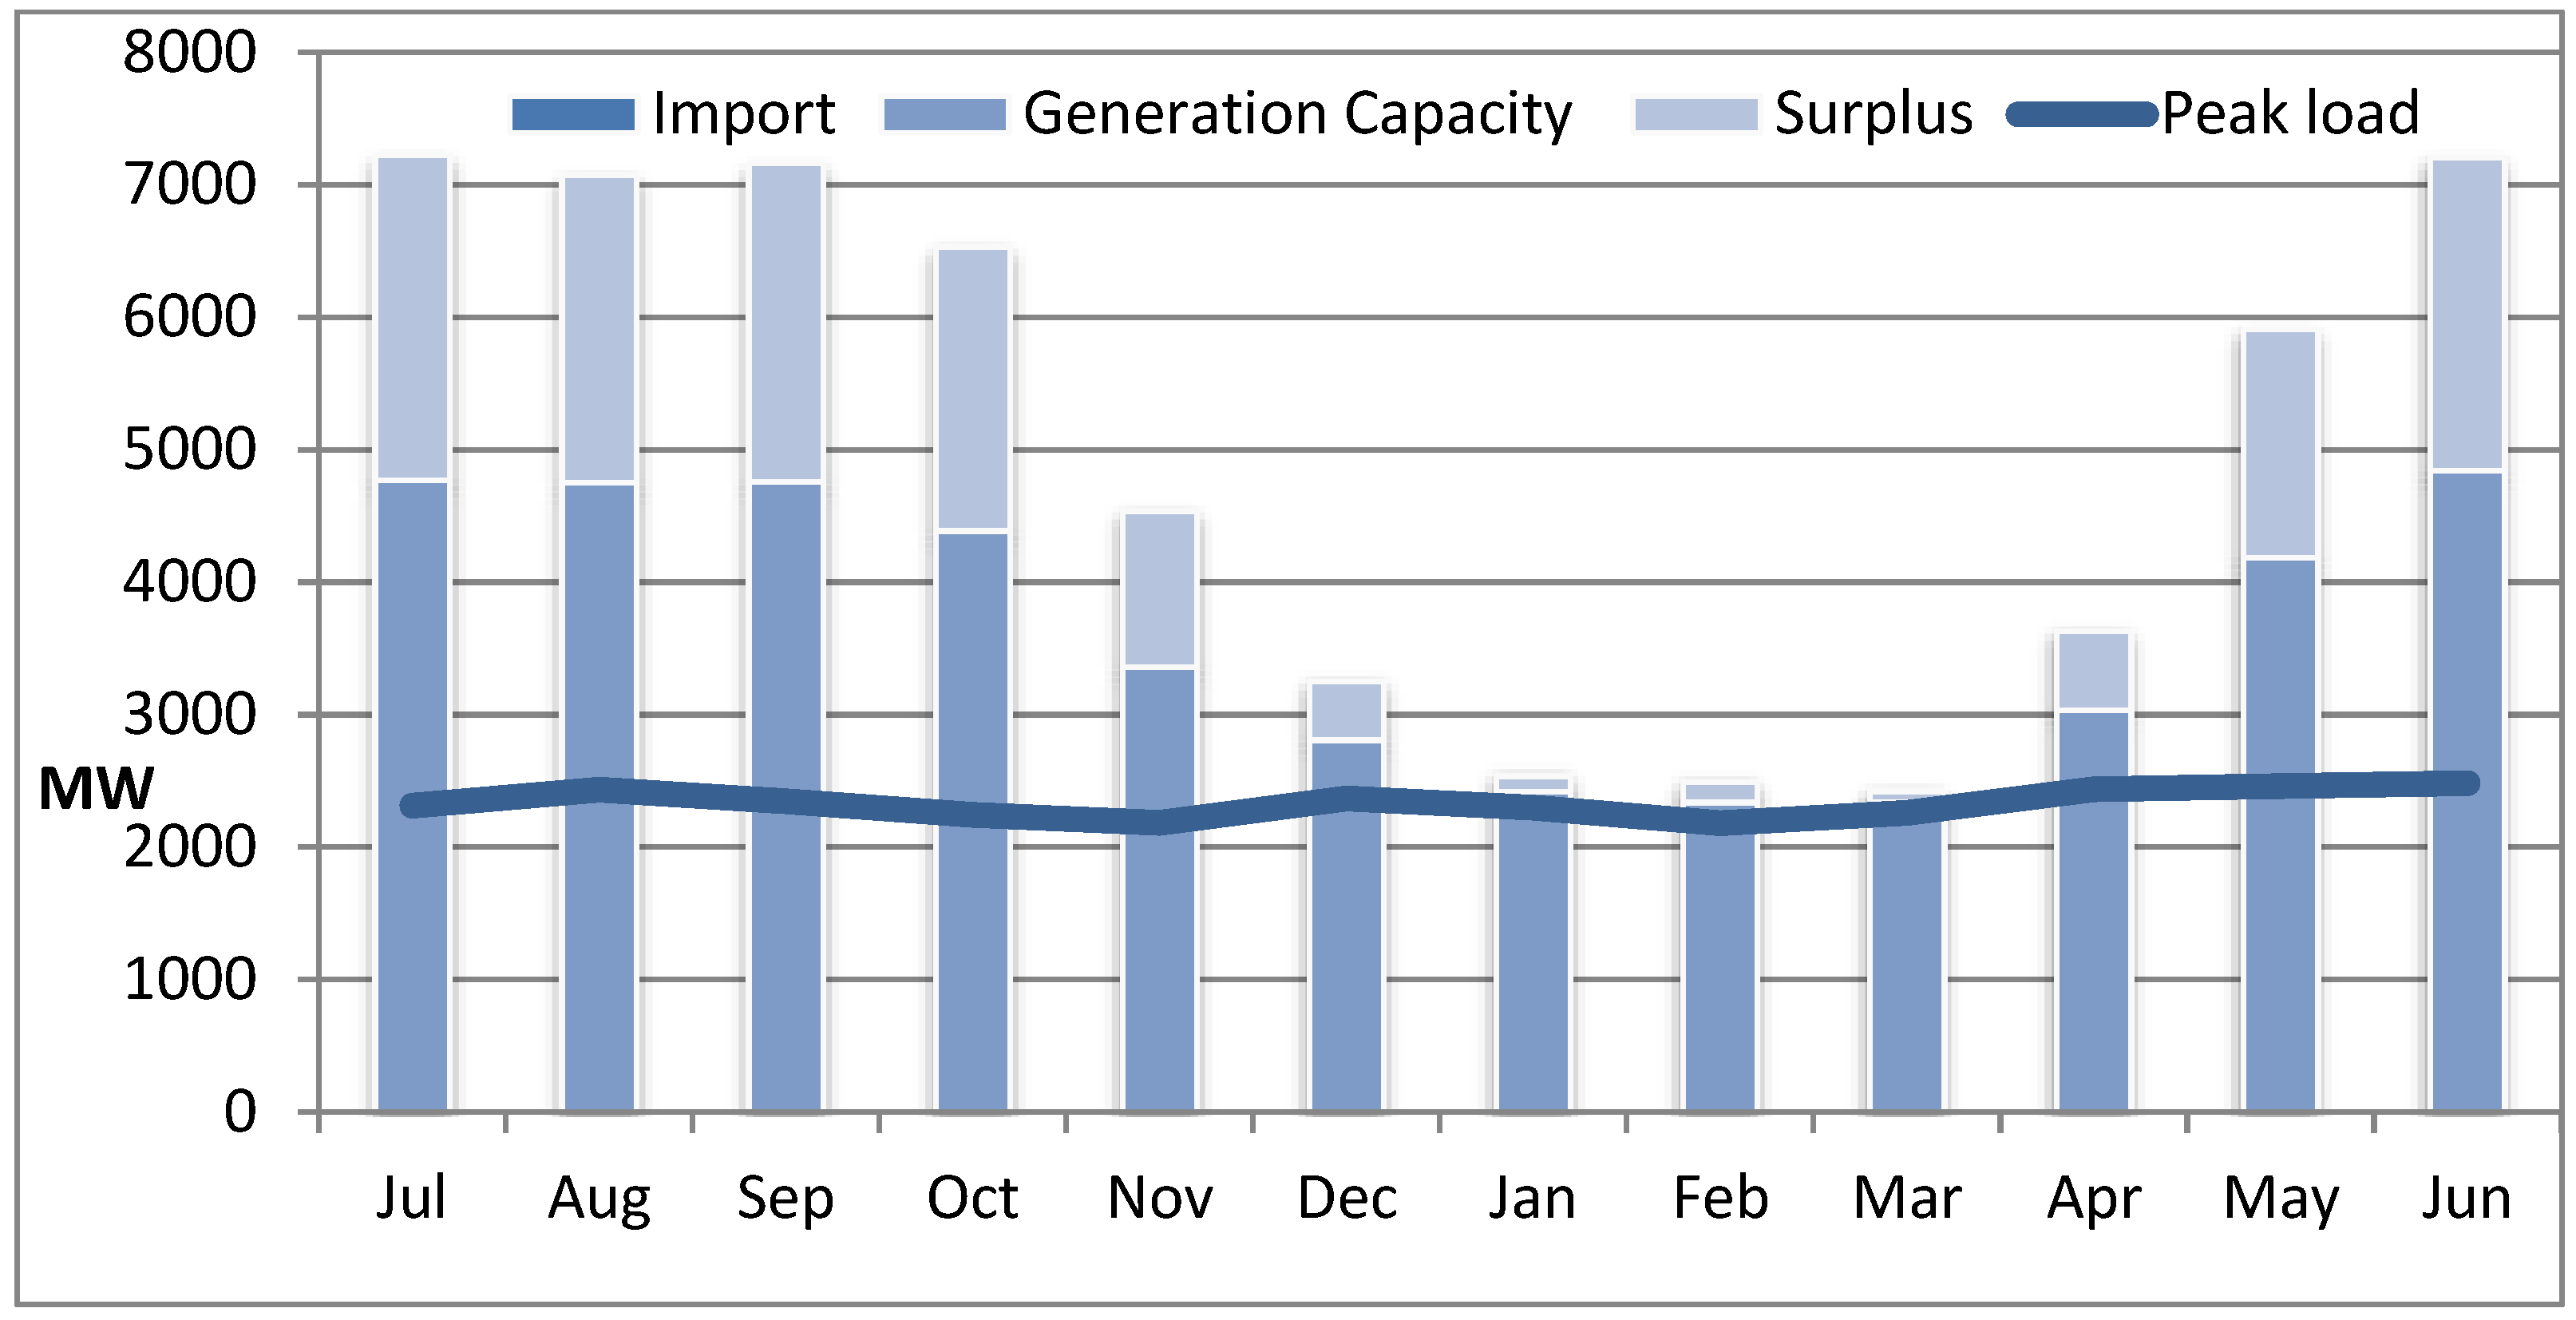
The
Figure 4 below shows the Integrated Nepalese power systems (INPS) import; generation capacity, surplus, and peak load within these years and also indicate that Nepal has been importing dry-season energy from India. The
Figure 5 below clearly illustrates that the INPS will have a huge surplus of energy available in the system due to the Runoff River (ROR) hydropower projects. A study by the Government of Nepal, Water, and Energy Commission Secretariat, forecasts that 14.8 TWh will be available by 2025. In contrast, the peak demand will be only 2.95 GW [
22]. This is creating a major challenge for NEA to manage the wet season surplus as India has approved buying only 364 MW of surplus power from Nepal via the Indian Energy Exchange (IEX) [
23]. Therefore, Cross Border Electricity Trade is essential during this time and will be instrumental in saving the NEA from substantial financial losses [
3].
2.3. Review of Electricity Demand in neighboring countries
India
Electricity production from fossil fuels has contributed to more than thirty percent of greenhouse gas emissions globally [
24]. Nepal has two neighbors, India and Bangladesh, which are heavily dependent on fossil fuels to generate electricity. As the world's largest coal consumer, India imports costly coal for electricity generation. India has the 5th largest electricity generating capacity and is the 6th largest energy consumer, with around 3.4 % of global energy consumption. Coal is India’s top energy source, with a share of 44% in 2020, followed by petroleum products (24%) [
25]. More than 80 % of energy is fulfilled by using fossil fuels, coal, oils, and solid biomass. More than 660 million people do not have access to clean fuel technologies. India is the largest emitter of carbon dioxide, and the power sector is a major contributor to carbon emissions [
26]. Recently, India disclosed its commitment to i) developing 500 GW Non- Fossil energy capacity by 2030, ii) fulfilling50 % of energy demand from a renewable source, and iii) achieving the target of net zero emissions by 2070 on the 26th session of the conference of the parties [
27].
The Nepalese hydropower can replace India’s coal generation. Moreover, hydropower offers more flexibility and grid stability than wind and solar power. Therefore, India's Cross Border energy trade guideline imposed the Hydropower Purchase Obligation (HPO) requirement for imported power [
23]. This is a recent opportunity for Nepal to export its electricity to India. Wijayatunga et al., [
28] found that large hydropower resources in Nepal, high growth, of demand, coal-dominated power system, and coal shortage in India could be the key drivers of electricity trade between Nepal and India.
Bangladesh
Bangladesh's power sector is facing numerous challenges. So, Bangladesh has already started importing electricity from India since 2013 to lessen the domestic energy crisis. Similar to India, fossil fuels covers more than ninety percent of the total installed capacity for electricity generation. Also, Bangladesh is compelled to operate at a reduced capacity due to the shortage of natural gas. Therefore, imported electricity can be an alternative to Bangladesh's in-house generation. The hydroelectricity brought from abroad can reduce the use of expensive pollution-intensive fuels, Green House Gas emissions, huge investments for energy infrastructure expansion, and the government's subsidy burden of dirty fuel. Therefore, Bangladesh has also signed a MoU for the power trade with Nepal by developing large hydropower on their investment. So, Bangladesh is eager to develop hydropower in Nepal to import energy to Bangladesh [
29]. It is another opportunity for Nepal to sell clean energy to Bangladesh.
2.4. Existing and planned transmission line infrastructure for CBET with India
Power transactions between Nepal and India started in the mid-sixties of the 20th Century. The power trade between Nepal and India also facilitates cooperation in cross-border power exchange and trading through enhanced transmission interconnection of grid connectivity.
Table 2 and
Table 3 show the status of cross–border transmission interconnection between Nepal and India. According to
Table 2, the cross-border transmission interconnection between Nepal and India has a capacity of whirling power of 1035 MW.
Table 2.
Existing cross-border links and quantum of power with Nepal and India [
23].
Table 2.
Existing cross-border links and quantum of power with Nepal and India [
23].
| Interconnection Points |
Voltage Level (KV) |
Import/Export Capacity (MW) |
| Dhalkebar (Nepal)–Muzzafarpur (India) |
400 |
600 |
| Kusaha (Nepal)– Katiya (India) |
132 |
205 |
| Parwanipur (Nepal) – Rauxal (India) |
132 |
90 |
| Gandak (Nepal)- Ram Nagar (India) |
132 |
65 |
| MahendraNagar (Nepal) – Tanakpur (India) |
132 |
75 |
| Total |
|
1035 |
Table 3.
Planned India-Nepal 400 KV cross-border interconnection [
23].
Table 3.
Planned India-Nepal 400 KV cross-border interconnection [
23].
| Interconnection |
Expected date of commissioning |
| Sitamarhi – Dhalkebar 400kV D/c (Quad) line |
April 2023 |
| Gorakhpur – New Butwal 400kV D/c (Quad) line |
2025-2026 |
| Purnea (New) – Inaruwa 400kV D/c (Quad) line |
2026-2027 |
| Bareilly – Lumki (Dododhara) 400kV D/c (Quad) line |
2027-2028 |
Table 4.
Identified barriers to cross-border electricity trade for Nepal.
Table 4.
Identified barriers to cross-border electricity trade for Nepal.
| Category |
ID |
Barriers description |
| Policy Barrier (PB) |
PB1 |
No provision of cross border Electricity transmission in Electricity Act 1992 [16]. |
| PB2 |
Lack of private sector involvement in CBET [30, 7] |
| PB3 |
Lack of Open and non-discriminatory transmission Grid access for CBET [16]. |
| PB4 |
Absence of regional mechanisms (market modality) for cross-border electricity trade [7]. |
| PB5 |
Ambiguous policies related to CBET issued by India to control trading in the region and threat of similar policies in the future [Dhakal et al.,2019) |
| PB6 |
Absence of regional mechanisms Market modality for cross-border electricity trade [16]. |
| PB7 |
No separate supranational institution/entity responsible for CBET in south Asia [16]. |
| PB8 |
Lack of regulatory harmonization [7]. |
| Technical Barriers (TB) |
|
|
| TB1 |
Lack of sufficient number of cross Borders inter-connections [14]. |
| TB2 |
Rising domestic generation (including solar power) in India [14]. |
| TB3 |
Lack of generation capacity for fulfilling domestic demand in the dry season [31]. |
| TB4 |
Lack of Grid Code Synchronization between Nepal and its neighboring countries [30]. |
| Financial Barriers (FB) |
|
|
| FB1 |
Relatively higher cost of hydro energy [14]. |
| FB2 |
Need of huge investment for construction cross border inter-connection [14]. |
| FB3 |
Declining cost of renewable energy (especially solar power) in India [14]. |
| Socio and Geo-Political Barriers (SGB) |
|
|
| SGB1 |
Internal pressure of prioritization of domestic consumptions over exports [14]. |
| SGB2 |
Lack of continuity in political support for energy projects development and weak political capacity to facilitate regional electricity cooperation [14]. |
| SGB3 |
National energy security concerns and trust deficit issue among the neighboring countries [30,14]. |
| SGB4 |
Lack of transmission line facilities via India’s grid to export power from Nepal to Bangladesh [14]. |
Table 5.
Comparison scale under AHP model.
Table 5.
Comparison scale under AHP model.
| Importance |
Explanation |
| 1 |
Two sub-criteria seem equally important to the objective |
| 3 |
Importance of sub-criteria i is slightly more than that of j to the objective |
| 5 |
Importance of criteria i is strongly higher than that of j to the objective |
| 7 |
Importance of criteria i is very strongly than that of j to the objective |
| 9 |
Importance of criteria i is absolutely higher than that of j to the objective |
| 2, 4, 6, 8 |
Used to represent intermediate values |
| Reciprocal value |
Importance of criteria j is more important than i to the objective |
2.5. Review of Readiness of Nepal for cross-border electricity trade
The goal of preparedness assessment is to allow policymakers and regulators to quickly measure the effectiveness of the current policy and regulatory framework. This assessment also gauges how existing policy and regulatory framework facilitate cross-border electricity trade. Vaidya et al., [
16] identified six critical factors for the successful operation of the CBET based on global experiences in the regional power pool such as provisions of CBET, third-party transmission access, domestic power sector reforms, power trading protocols, regional institutions with supranational authority, cross border interconnections Similarly, ISER performed readiness analysis on the energy transition of Indonesia by political and regulatory, investment and finance, techno-economic and social sector [
32]. Moreover, National Renewable Energy Laboratory assesses twenty-one criteria over system characteristics, policy, and regulations for the readiness of utility-scale renewable energy systems [
33]. Those factors may not be applied to all regions equally because of different local, social, and political scenarios but may help assess readiness for CBET [
16].
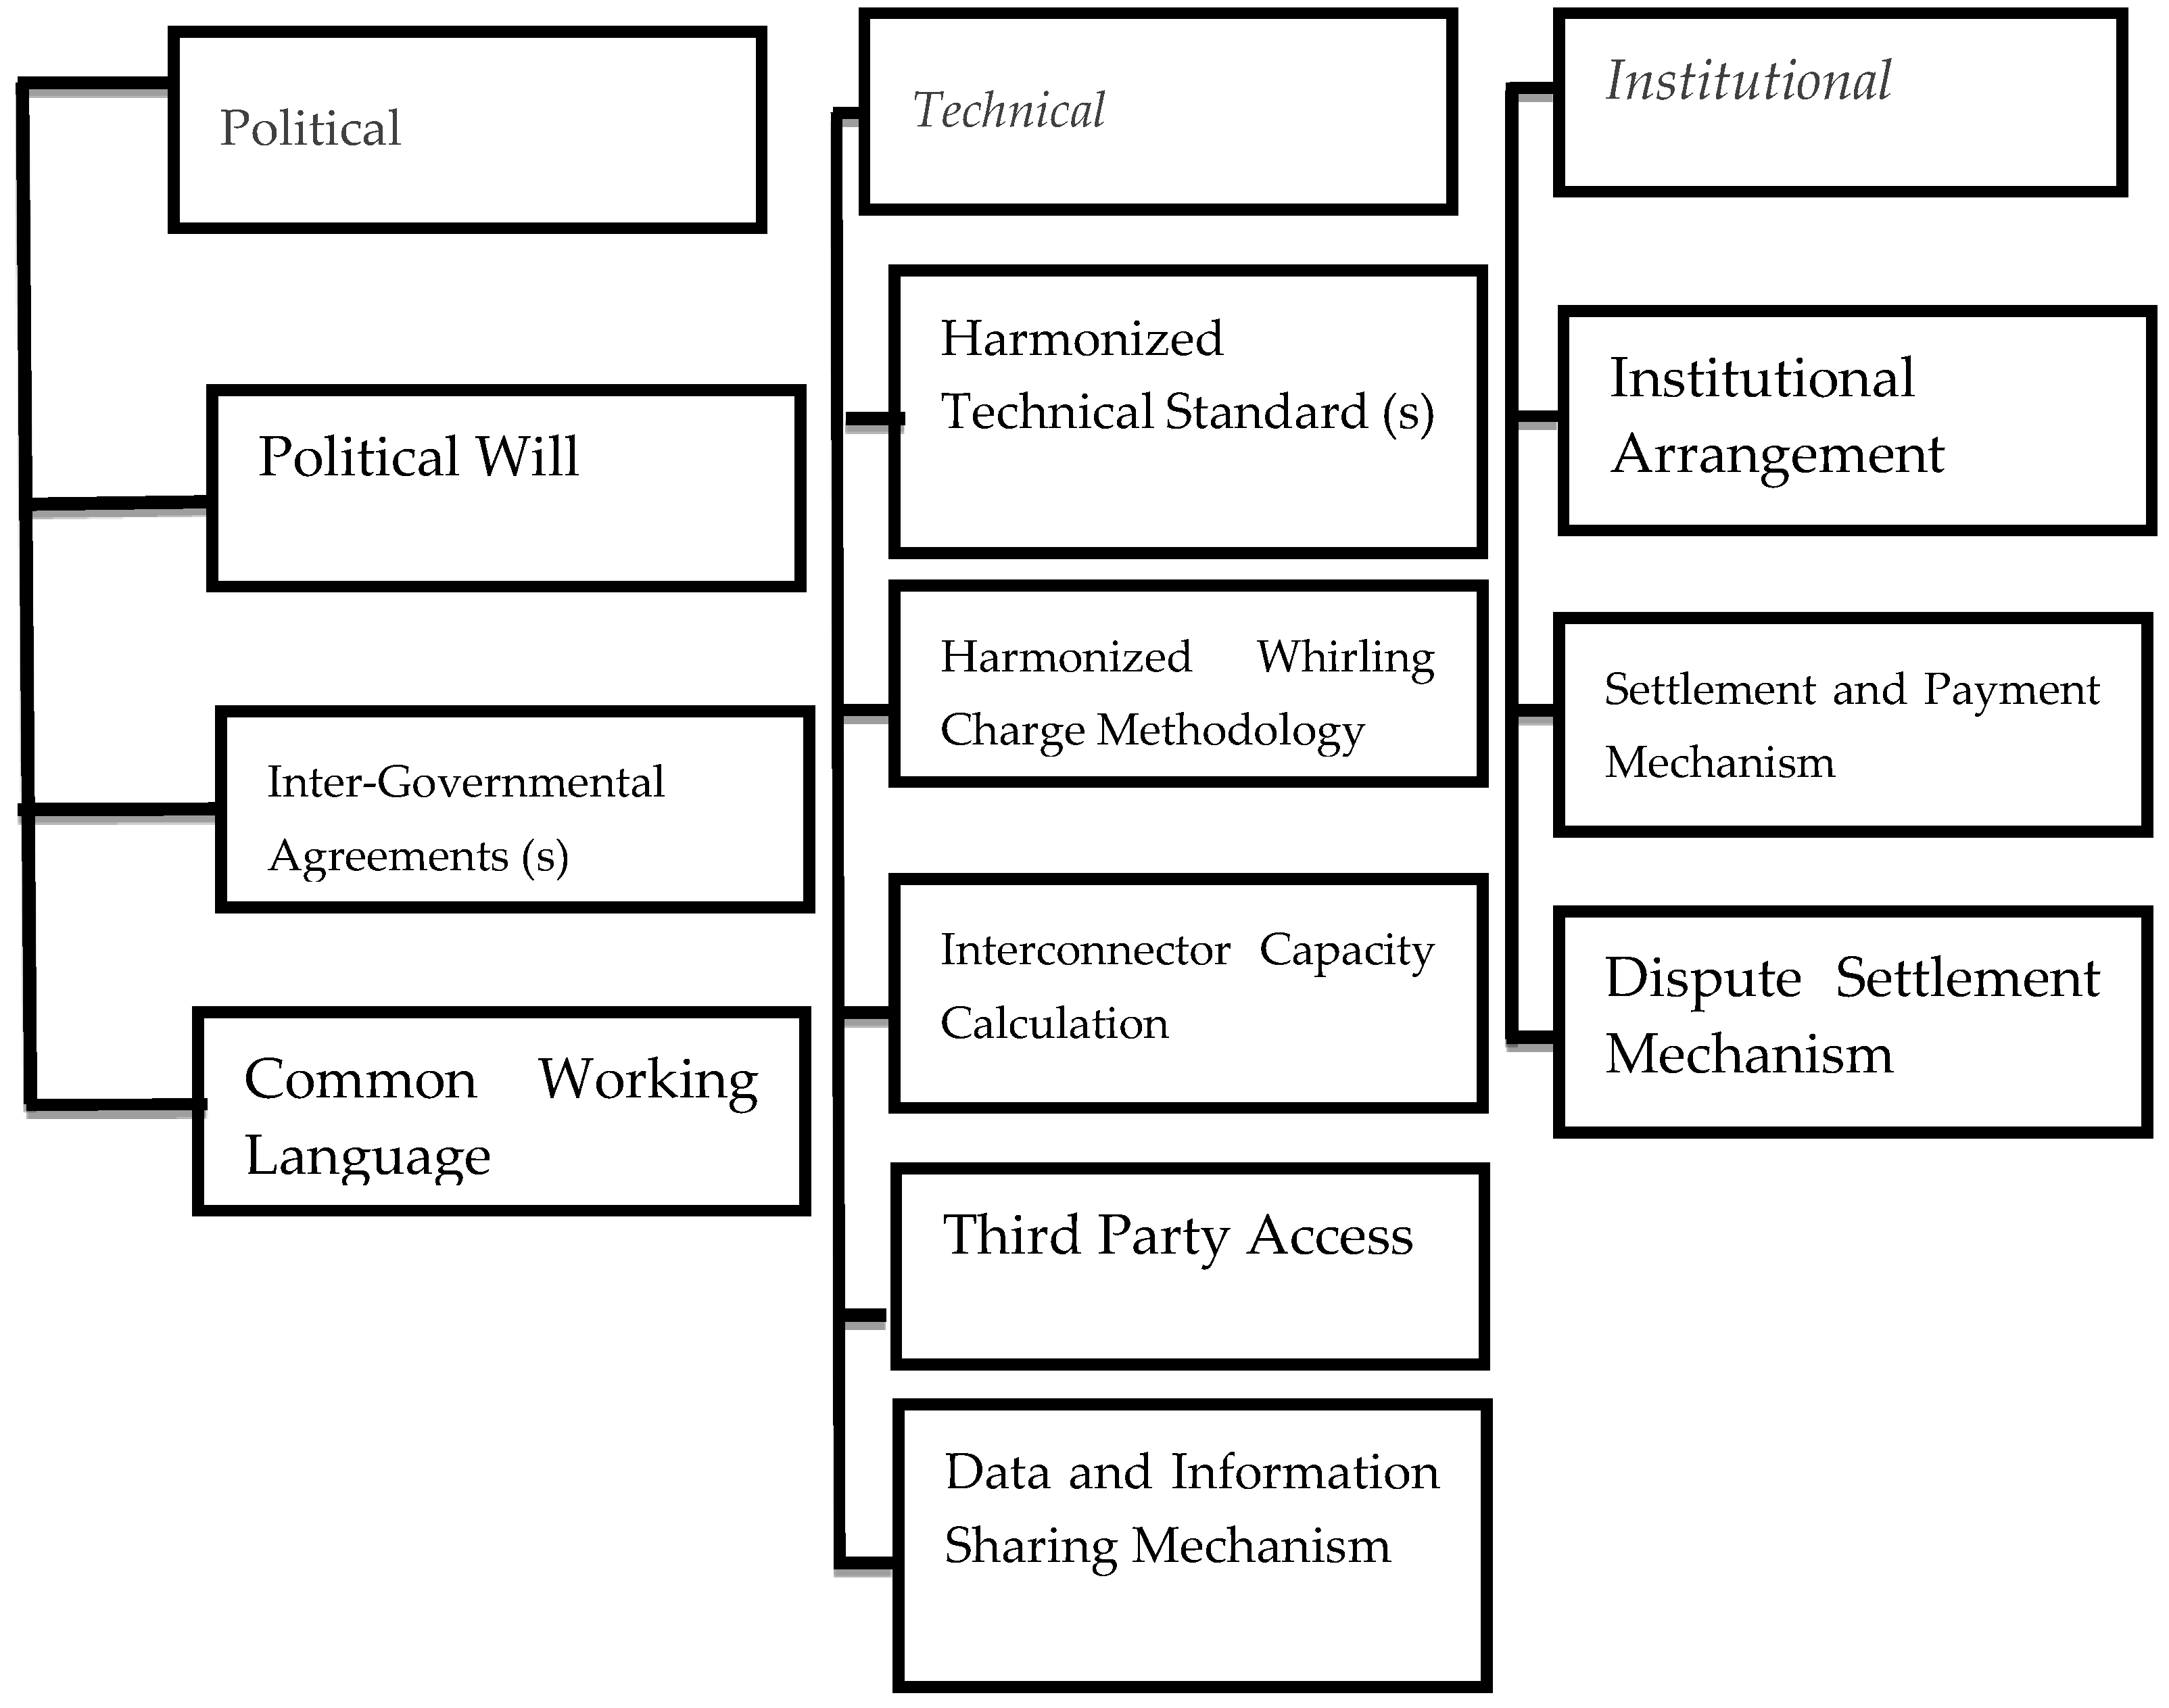
International Energy Agency (IEA) established a minimum standard for multilateral power trade in the Association of Southeast Asian Nations (ASEAN), as described in
Figure 6.
3. Research Methodology
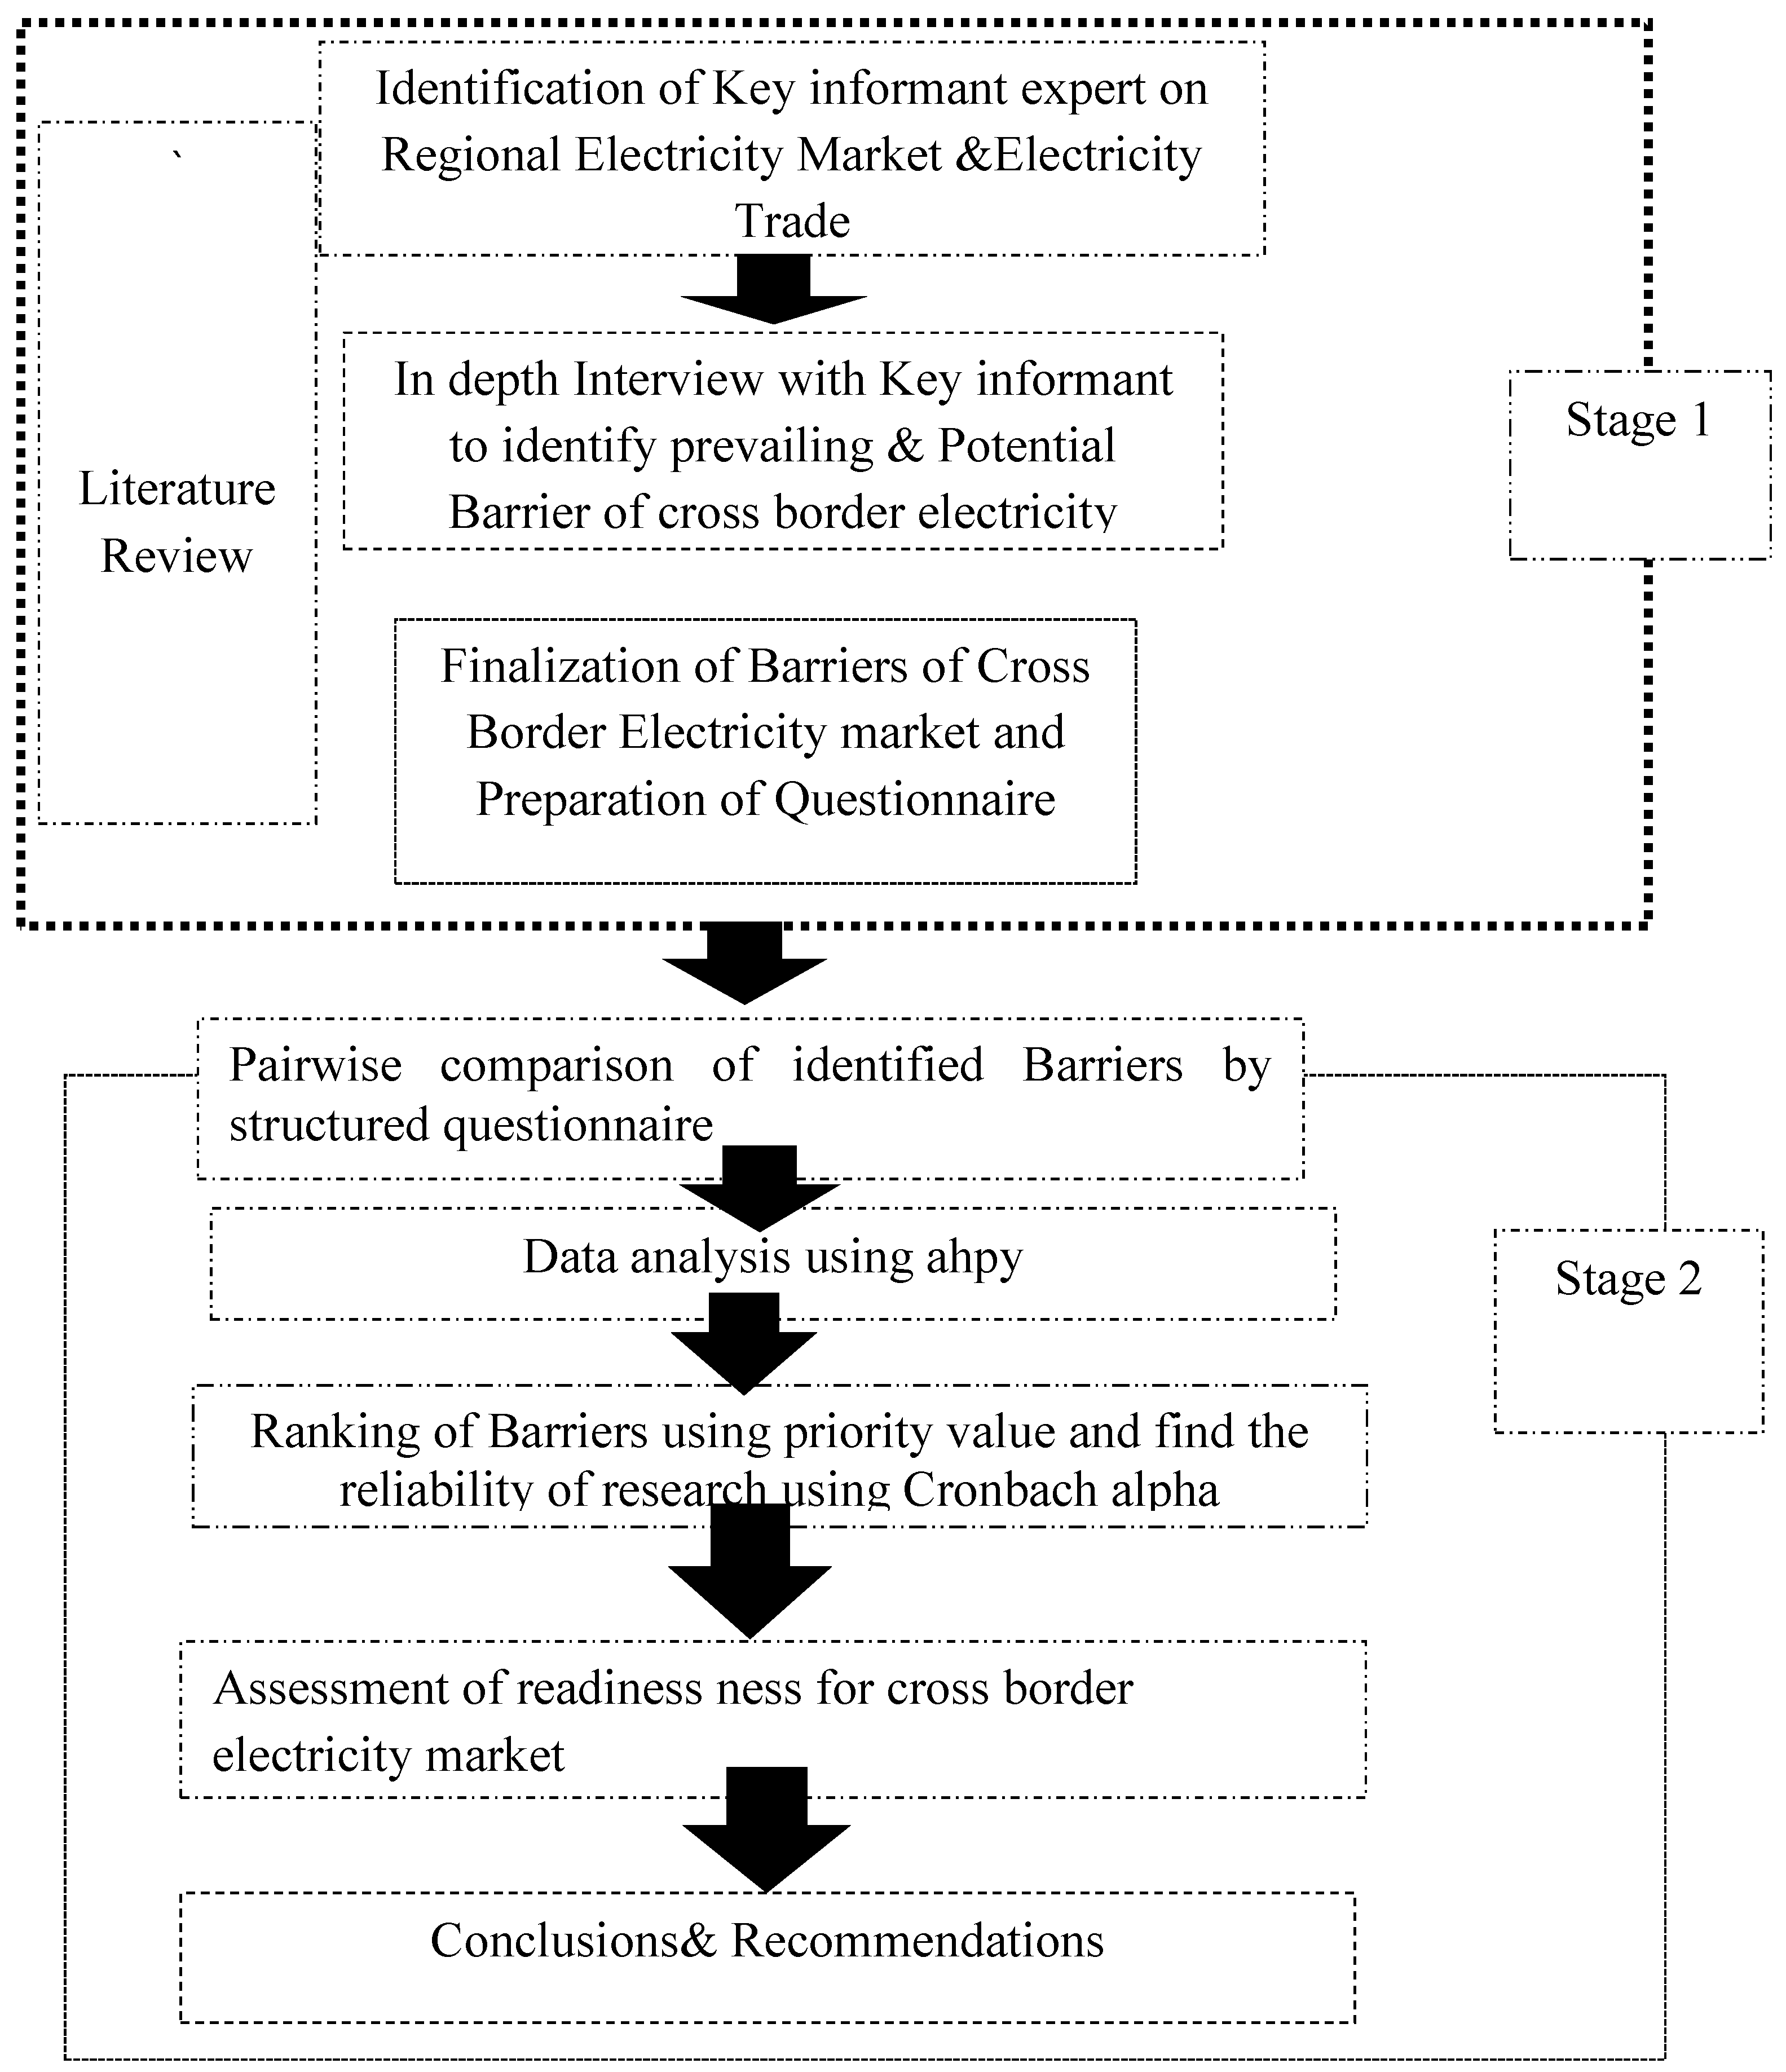
The data collection procedure started with the identification of the respondents. Data were collected in two stages. In the first stage, in-depth interviews with the respondents to find the prevailing barriers to Nepal’s hydropower market beyond the border were performed. Also, a survey questionnaire was prepared based on the information obtained from the expert and the literature review. Regarding the questionnaire, the expert opinion is similar to the findings of literature review.
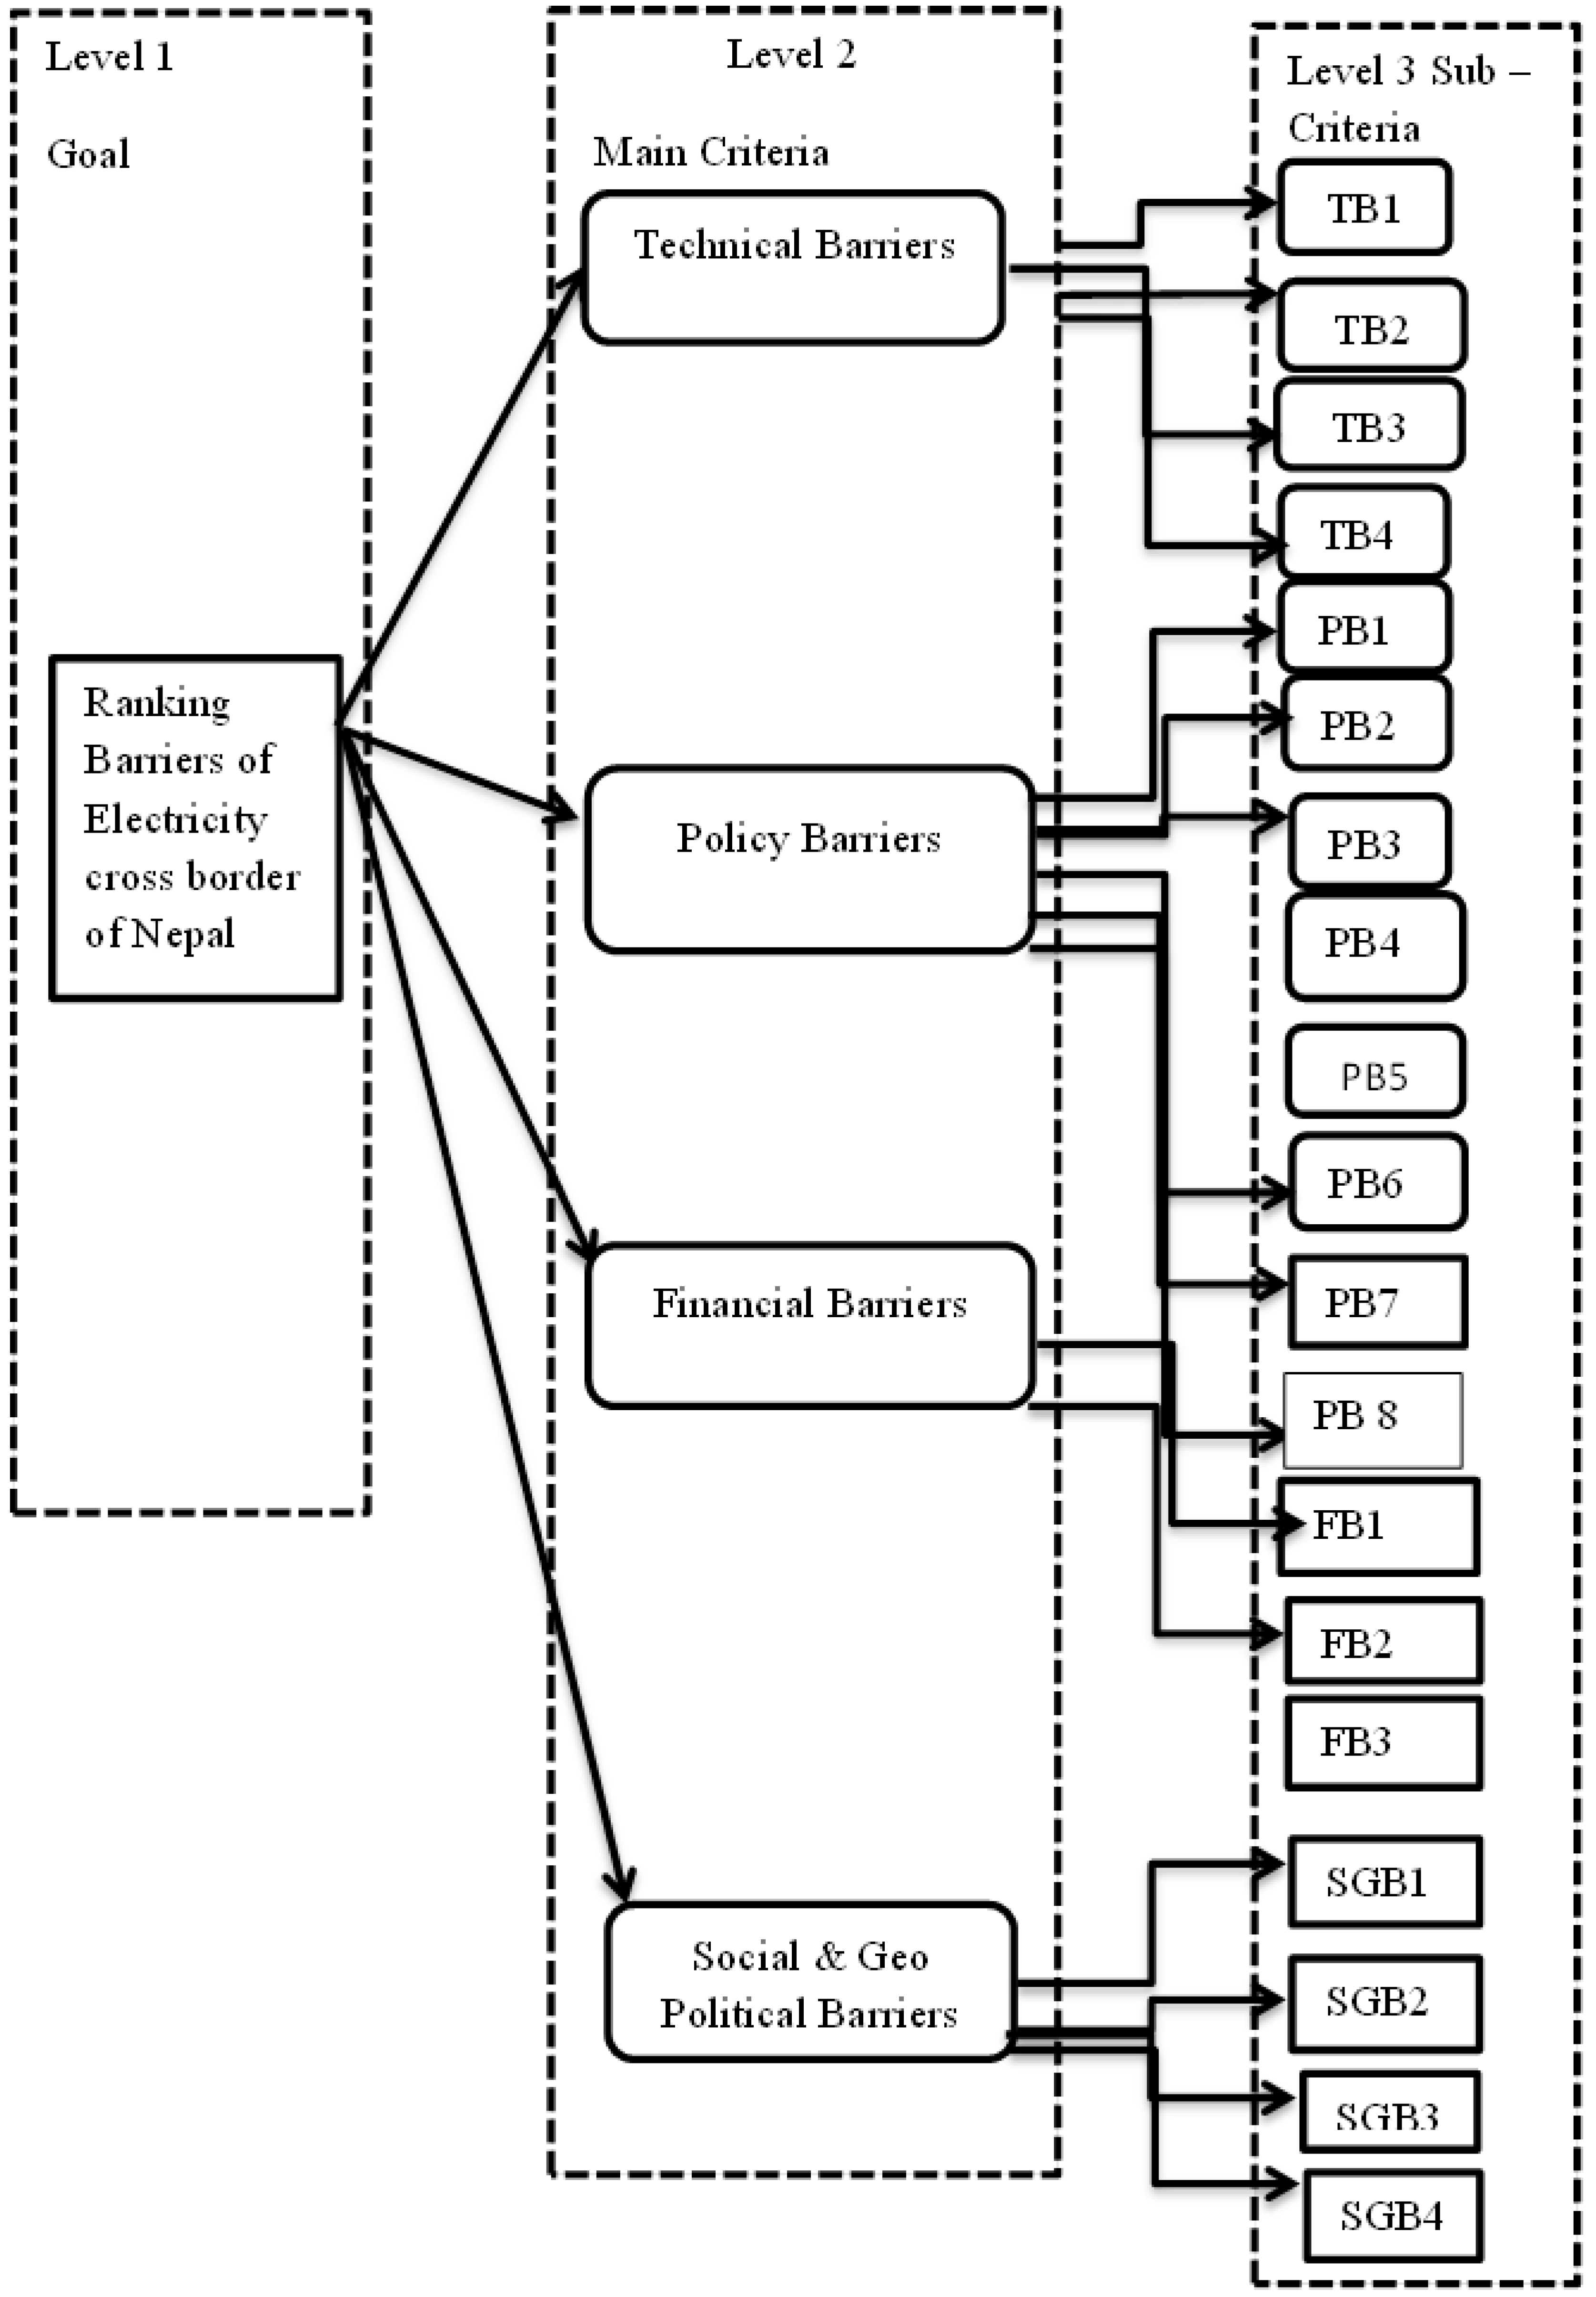
In the second stage, the respondents were asked to perform pairwise comparisons of sub-criteria of the policy, technical, financial, and social and geo-political barriers. This method was also used to perform the pairwise comparison of barriers themselves using the average Geometric Mean. Then the data from the survey conducted in the second stage was compiled and analyzed using Python code and AHPy library.
The entire methodology used in this research is shown in
Figure 7. This study uses Analytic Hierarchy Process (AHP) to rank the barriers that impeding the energy trading with neighbors. In the data collection process, 25 expert respondents prominent in the energy sector and senior academicians who were readily available for all stages of interviews through a non-probabilistic purposive sampling were chosen.
The AHP method's reliability depends on the respondents' selection for the research. The experts were selected through a non-probabilistic method; purposive sampling helped create the sample of experts [
35] with knowledge of the selected domain from the diverse background of government sectors, private, academia, and donors. The 25 experts interviewed knew the Nepalese power system very well and were in decision-making positions. Additionally, the willingness of respondents to participate in the survey was important; only 20 participants answered with a consistency ratio of less than ten percent. Therefore, five of the responses were excluded from the analysis. After compiling the response, we used the Python library AHPy and Python code to calculate the criteria's local weight, global weight, and consistency ratio (C.R), and also calculated the sub-criteria's global measures and local weight ranking. Similarly, we have computed Cronbach’s alpha (α) using Python to ensure the reliability of the research survey.
Table 6.
Key informant interviews and survey/scoring.
Table 6.
Key informant interviews and survey/scoring.
| Experts |
Title |
Affiliations |
| E1 |
Senior Energy Specialist |
Donor |
| E2 |
Commissioner |
Nepal Electricity Regulatory Commission |
| E3 |
Engineer |
Hydropower Company |
| E4 |
Director |
Nepal Electricity Authority |
| E5 |
Assistant Professor |
IOE, TU |
| E6 |
Manager |
Nepal Electricity Authority (NEA) |
| E7 |
Deputy Manager |
Power Trade Department, NEA |
| E8 |
Deputy Manager |
System Planning Department, NEA |
| E9 |
Chief Executive Officer |
Hydropower Company |
| E10 |
Member |
Independent Power Producers of Nepal (IPPAN) |
| E11 |
Member |
System Planning Department, NEA |
| E12 |
Executive Member |
Independent Power Producers of Nepal (IPPAN) |
| E13 |
Joint Secretary |
Ministry of Energy, Water Resource and Irrigation, GoN |
| E14 |
Superintendent Engineer |
Water and Energy Commission Secretariat, GoN |
| E15 |
Senior Divisional Engineer |
Department of Electricity Development, GoN |
| E16 |
Project Officer |
Donor |
| E17 |
Assistant Manager |
Power Trade Department, NEA |
| E18 |
Associate Professor |
IOE, TU |
| E19 |
Associate Professor |
Kathmandu University |
| E20 |
Executive Member |
Independent Power Producers of Nepal (IPPAN) |
The following
Table 7-illustrates the comparison matrices of Sub–Criteria under Technical Criteria. This is the geometric mean of the response of all respondents. The Geometric mean method applied in all comparison matrices is in
Table 7,
Table 8,
Table 9,
Table 10 and
Table 11.
4. Results and Discussions
The results of ranking all barriers, viz. technical, policy, financial and social, and geopolitical barriers, are shown in
Table 10,
Table 11,
Table 12,
Table 13,
Table 14 and
Table 15. Similarly,
Table 16 shows the calculation for the reliability and validity of the research.
Table 11 shows the ranking under the technical barrier criteria. This means that Nepal lacks generation capacity for fulfilling domestic demand in the dry season, which is the most prevailing barrier among others under these criteria. The Consistency Ratio (CR) of the Technical Barriers sub-criteria is = 0.037 < 0.1(O.K)
Table 13 above shows the ranking of policy barrier corresponds to Rank first, which means ambiguous policies related to CBET issued by India to control trading in the region and the threat of similar policies in future. The Consistency Ratio (CR) of the Technical Barriers sub-criteria is = 0.087 < 0.1 (O.K)
Table 14 above illustrates the ranking among financial barriers, indicating the relatively higher cost of hydro energy in the highest rank. The Consistency Ratio (CR) of the Financial Barriers sub-criteria is = 0.09 < 0.1 (O.K)
Table 15 above depicts that the barrier among social and geo-political barriers ranking lack of electricity transit facilities via India’s grid to export power from Nepal to Bangladesh seems the most prevailing barrier among others. The Consistency Ratio (CR) of Financial Barriers sub-criteria is 0.082= 0. < 0.1 (O.K)
The below
Table 16 and
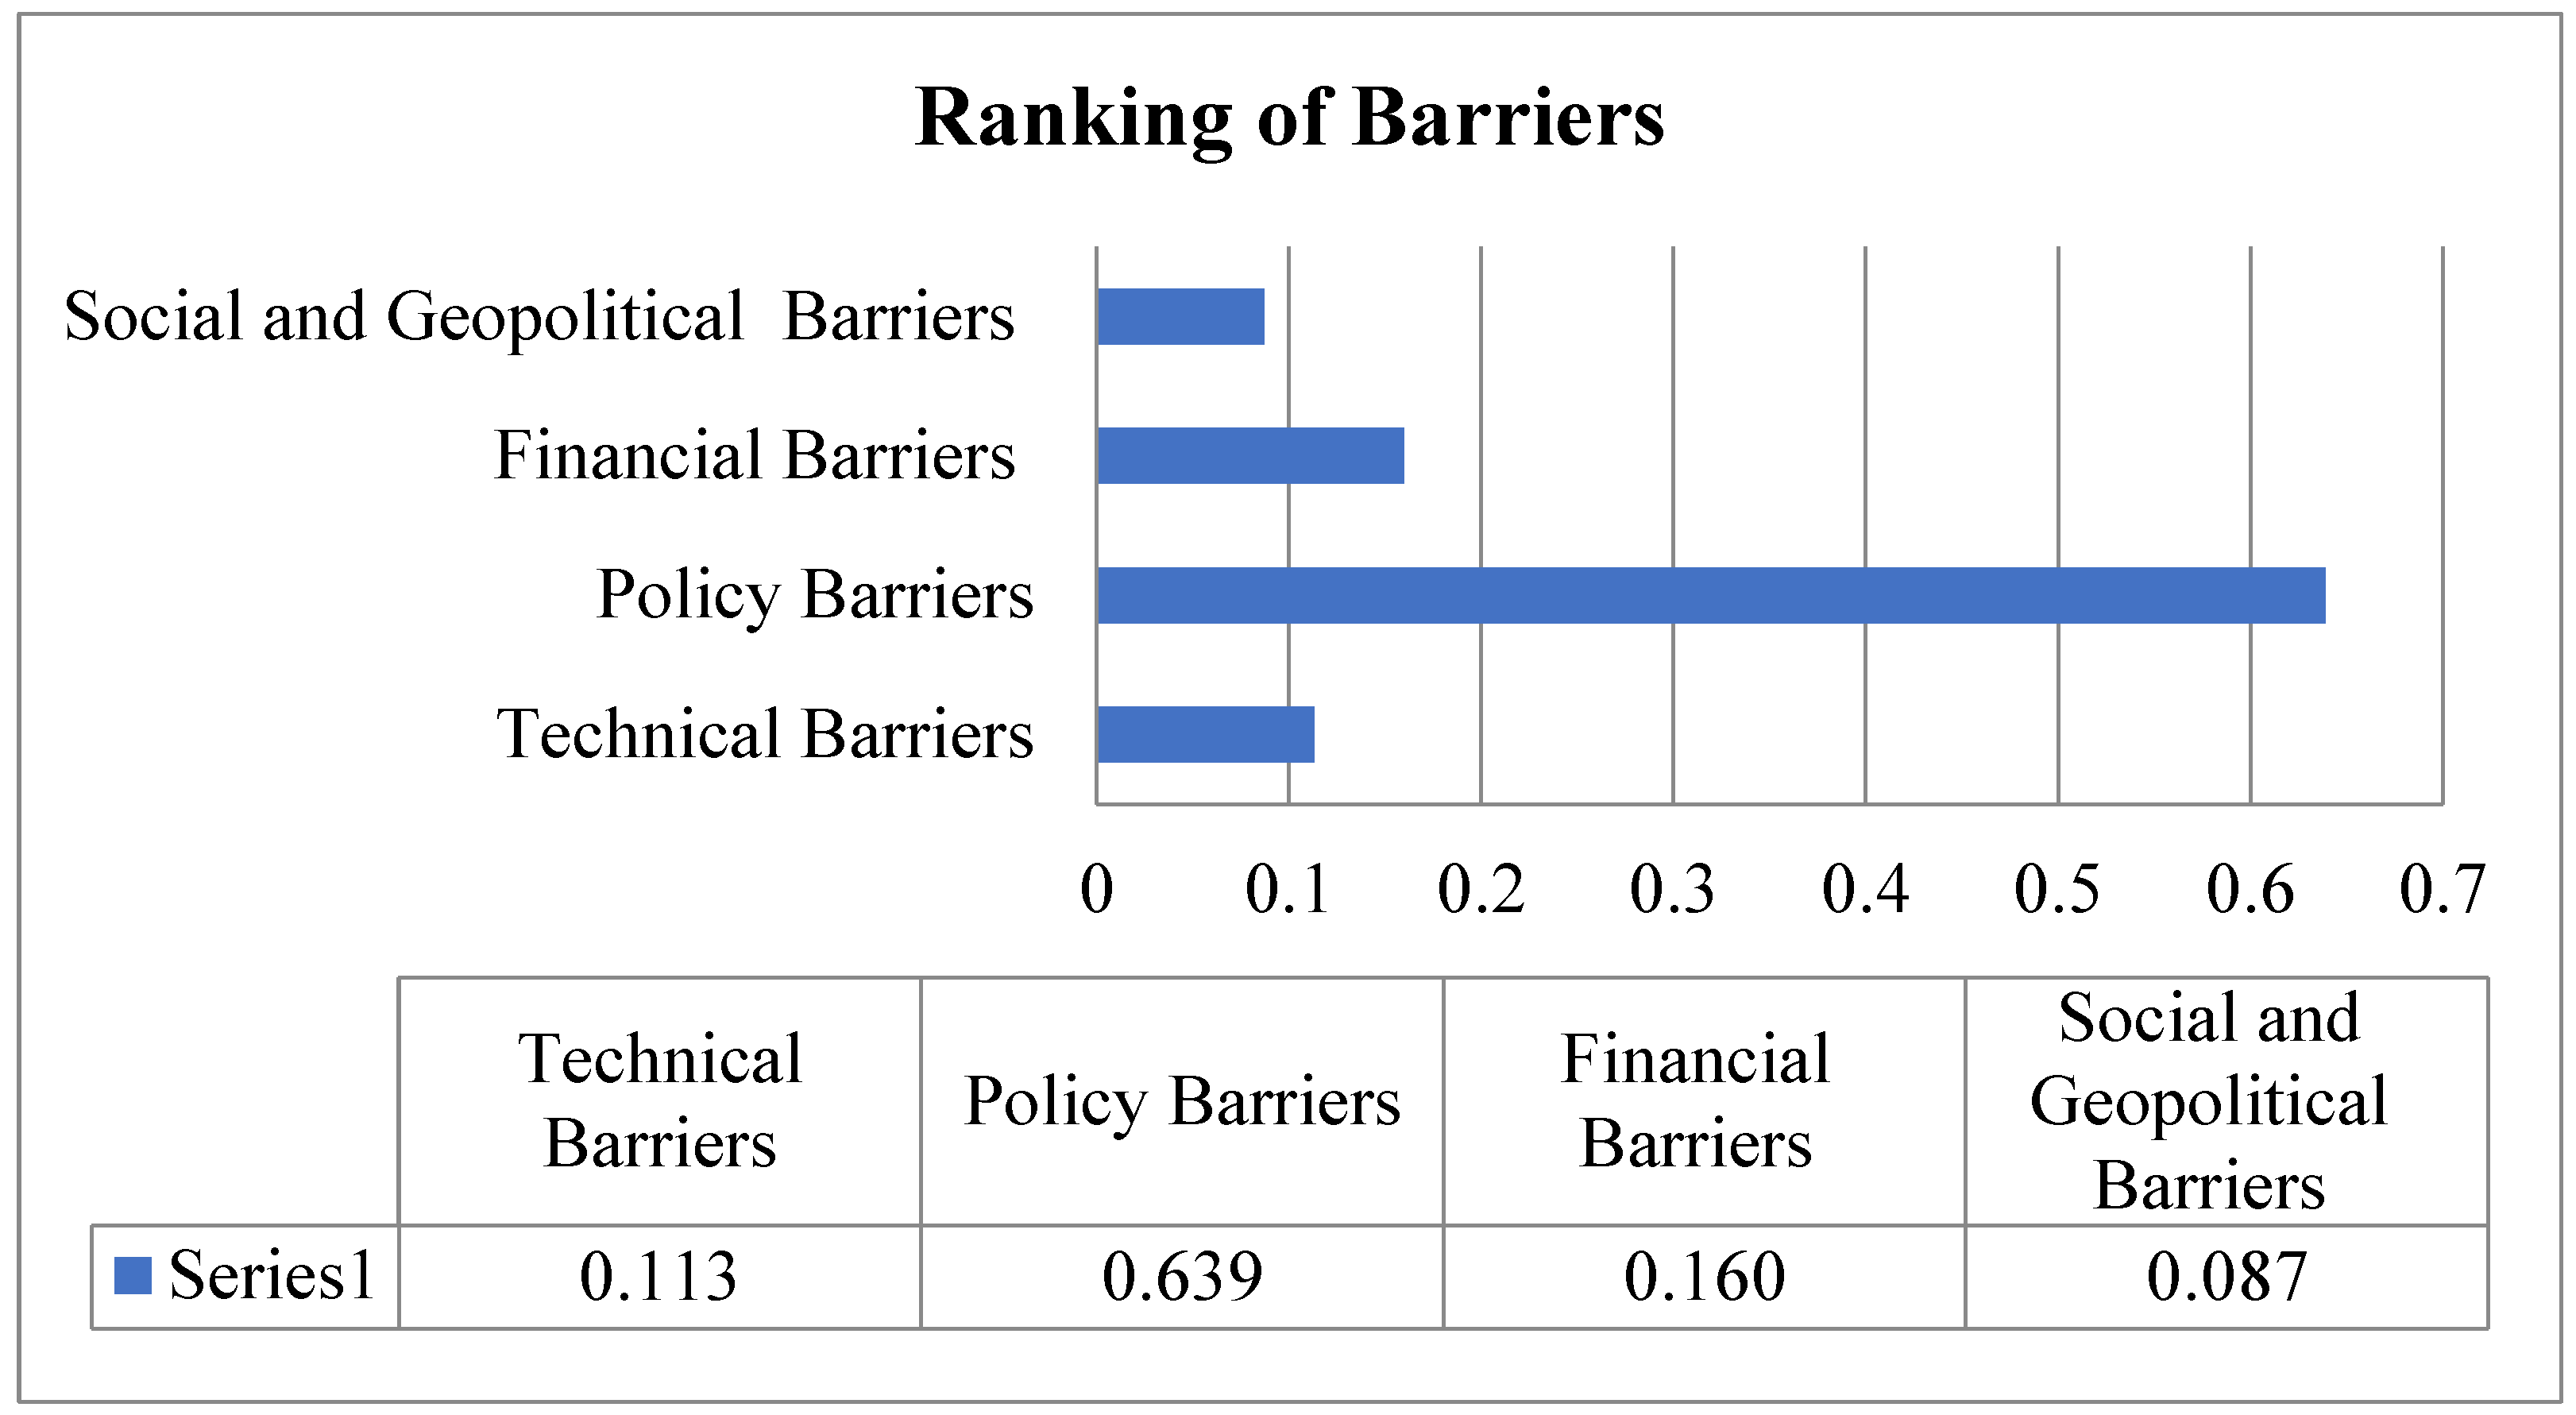
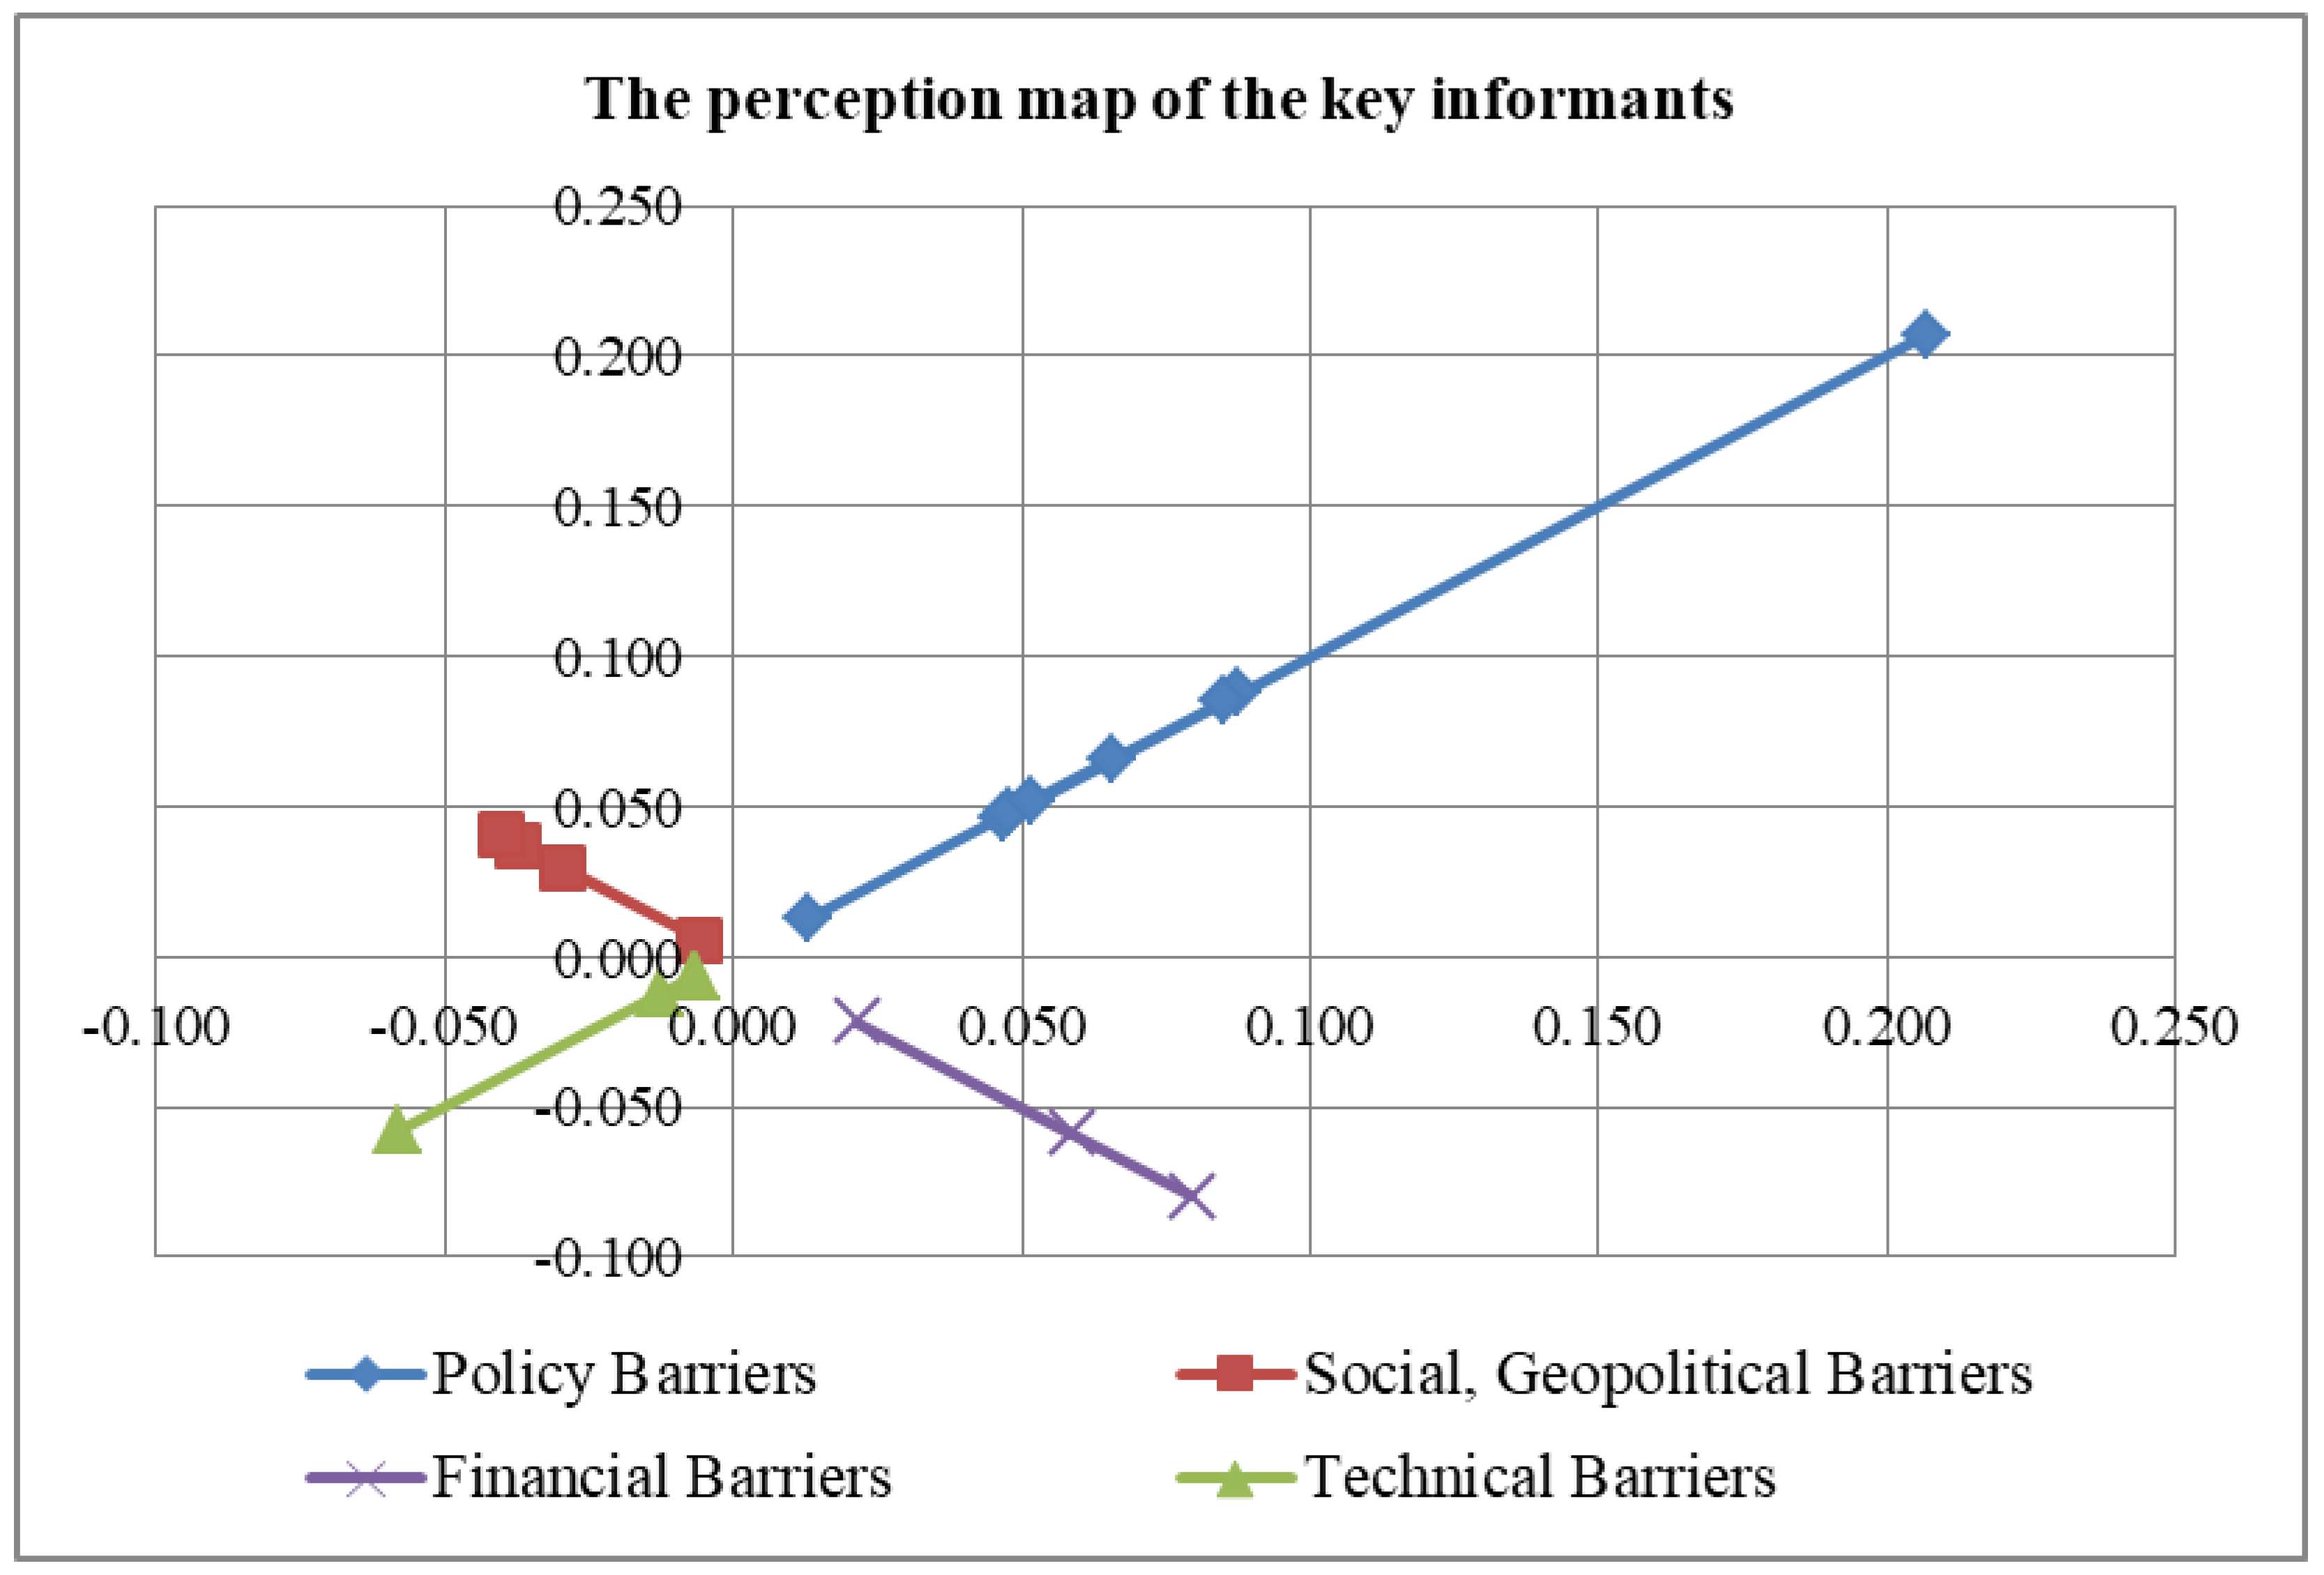
Figure 9 describe the weightage of the Research's main criteria viz. Technical Barriers, Policy Barriers, Financial Barriers and Social and Geo-political Barriers. According to this research, the policy and financial barriers are most prevailing among others in the same group.
The Consistency Ratio (CR) of the barriers criteria is 0.05= 0. < 0.1 O.K
The ranking of the groups, viz. barriers, was based on the weightage of global factors. The overall ranking and group-wise ranking are shown in
Table 17. The study finds at policy barriers prevail more than other sectorial barriers like technical, policy, and financial and social and Geopolitical Barriers. Therefore, the policies of Nepal and India are hindering the CBET for Nepal. Referring to the overall rank of the results, PB6> PB4>PB8 >FB1>PB2> FB3> SGB4 > PB 7 >PB5 >PB3 and so on.
From
Table 17 and
Figure 10, the research analysis suggests that the PB6 is the most critical barrier, with an overall priority value 20.7 % among the 19 barrier factors of the study. Other significant factors in order are PB4 having an overall priority value of 8.8 %, PB 8 having a priority value of 8.5 %, and FB1 with an overall priority value of 8.0 %, etc.
From
Table 17, we can see among all barriers, ambiguous Indian policies related to CBET to control trading in the region and the threat of similar policies in the future are recognized as the most significant barriers by all stakeholders, which received the highest score (PB6=0.207).Similarly, the absence of regional mechanisms for cross-border electricity trade (PB4=0.088), lack of regulatory harmonization (PB8=0.085), higher cost of hydro energy (FB1=0.080), and lack of private sector involvement (0.066) are other prominent barriers to cross border electricity trade between Nepal and India identified in the research.
The Guidelines on Cross Border Electricity Trade (CBET) 2018 [
36] issued by the Government of India considered electricity trade an issue of strategic, national, and economic importance. One of the conditions outlined in CBET guidelines is that only power projects having 51% ownership or finance by Indian entrepreneurs will be eligible for exporting power to India. This precondition not only restricts Nepal’s free access to the Indian market but also discourages foreign direct investment (FDI) in the Nepalese power sector. This is the major policy barrier for Nepal to export hydropower to India. So, the provision listed in the CBET guidelines is against the vision of the Power Trade Agreement 2014 held between Nepal and India.
Moreover, the Government of Nepal has nominated Nepal Electricity Authority as the nodal agency for electricity trade with India. But, due to the vertically integrated nature of NEA, it will be difficult to regulate policies in India’s big, mature, deregulated electricity market. Finally, the cost of solar panels and solar power has drastically decreased due to innovations in solar energy. In comparison with solar energy, hydro energy is expensive. So, the higher costs of hydro energy affect the Nepalese government’s bargaining power in the sale of hydroelectricity to India.
Further, while evaluating the sub-criteria considering both local and global factors, there seems to have differences in the ranking of barriers. However, we should emphasize ranking local sub-criteria’s during the policy formulation.
4.1. Reliability of the Survey
Cronbach alpha verifies the internal consistency of the research surveys or questionnaires [
37]. The reliability of the research was calculated as given in
Table 18.
The overall reliability of the survey (α) is 0.867> 0.7, which is good (0.9>α>0.8). The acceptable lower limit value for the reliability of the survey using Cronbach coefficient alpha (α) is 0.7 and 0.6 can be accepted for the exploratory research [
38].
4.2. The status of readiness for cross-border electricity trade
The assessment of Nepal’s readiness for Cross Border Electricity Trade based on the identified factors by Vaidya et al. [
16] is shown in
Table 19.
USAID-funded Nepal Hydropower Development Project (NHDP) has advised Nepal to focus on some works to utilize India’s CBET policy and regulatory mechanism for CBET. The Key focus areas and status of Nepal are presented in
Table 20.
From
Table 19 and
Table 20, it can be concluded that Nepal is yet to be prepared for the CBET to trade power with its neighboring countries.
5. Conclusion, Policy insights and Future works
This study illuminates the existing and future electricity generation scenarios based on energy simulation by identifying and ranking the barriers to cross-border electricity trade using the AHP method. Nepal’s readiness for electricity trade based on the policy, institutional and regulatory framework, strategic and business framework was also analyzed qualitatively based on the updated and available literature review and experts’ opinions. The same sets of experts were used in both qualitative study and quantitative analysis. The concerns over energy surplus in the Nepalese system have become prominent today because of unbalanced hydropower generation in Nepal.
Moreover, to remove the barriers for CBET exhibits Nepal has to work significantly on the policy, institutional, regulatory, and strategic and business frameworks to make cross-border power trade effective and efficient. From the qualitative survey findings, there are still challenges that remain, like the developing cross-border transmission links and issues related to cross-border transmission policy and access. Therefore, a breakthrough in the power sector was provisioned in the New Electricity Act 2023 which was submitted to the parliament for approval. Unbundling the vertically integrated utility, entry of the private sector into the power trade, provision of cross-border electricity trade (CBET), and all of the recurrent issues were supposed to be addressed through the clauses provisioned in the New Electricity Act 2023.
6. Recommendation
Learning from the successful practice of regional electricity trade around the globe, Nepal should expedite the construction of significant cross–border interconnections with neighboring countries.
Along these lines, Nepal should immediately start the construction of the New Butwal (Nepal) –Gorakhpur (India) 400 KV transmissions Line, which is the planned second 400 KV cross-border line to connect Nepal and India as numerous hydropower projects are going to be developed in Nepal’s Gandaki Basin. The installed capacity is much more than the self-consumption in that region. So, this transmission line could be the major trunk line to send electricity from Nepal to the energy-hungry Uttar Pradesh of India.
Similarly, other high-capacity transmission lines, Dododhara - Bareilly 400 KV, Inaruwa – Purnia 400 KV, and Dhalkebar – Sitarmani 400 KV shall be developed on a Priority Basis.
This study reveals that the provisions mentioned in the CBET guidelines issued by India's Government are the major hurdles for cross-border electricity trade. Nepal should continue lobbying through its diplomatic links with India's present level of cross-border interconnections to market-based trading by establishing regional international regulatory bodies, ensuring free access to the grid, and establishing common protocols of electricity trading to reap the benefits of CBET in the long game.
Nepal’s Government should strongly lobby India to send the power to Bangladesh via the Indian grid. Domestic consumption should be the top priority, but enhancing electricity consumption within a short period is an arduous tasks. However, basic benchmarks, like reliable grid electricity in the major cities promote e- cooking, promotion of e-mobility, electric trains, and metro-rail in the urban area ultimately increase the domestic consumption of energy.
Similarly, NEA is the sole buyer of electricity produced by the private sector. NEA has adopted a take or pay basis Power Purchase contract with a fixed posted energy rate on a first-come, first-serve basis. The cost of solar or other renewable generation is decreasing day by day. Therefore, NEA should adopt competition- based (should give priority Power Purchase Agreements to the lowest bidder) (PPA) with private developers rather than the fixed posted energy rate to the competitive regional market. This will offer to bid competitive energy rates in the regional market. After the emergence of the liberalization policy, the private sector has been a significant stakeholder in Nepal's power sector. Therefore, Nepal should promulgate policies so the private sector can enter Nepal’s cross-border power trading business.
Moreover, the construction of high voltage cross-border transmission link, developing a regulatory framework, enhancing and harmonizing institutional capacity, fostering regional cooperation for the formation of supranational authority for regional power trade, and engaging in skill development are all critical steps for Nepal to increase its readiness for cross-border electricity trade. NEA should immediately plan the new transmission line and substation by identifying the region with potential electricity demand and expediting the construction of transmission and substation projects that have already started.
Furthermore, BBIN member countries should take advantage of abundant water resources by developing environmentally friendly and financially feasible hydropower projects by emphasizing regional integration and regional cooperation in the South Asian Region. Future studies can explore the economic and environmental benefits of CBET for Nepal, India, and Bangladesh. However, this research ranks the barriers to energy trade through the literature review and respondents’ perceptions only.
References
- Poudyal, R.; Loskot, P.; Nepal, R.; Parajuli, R.; Khadka, S.K. Mitigating the Current Energy Crisis in Nepal with Renewable Energy Sources. Renewable and Sustainable Energy Reviews. 2019, 116. [Google Scholar] [CrossRef]
-
Nepal Electricity Authority a Year in Review Fiscal Year 2020/2021; Nepal Electricity Authority: Durbarmarg, Kathmandu, Nepal, 2021; Available online: https://www.nea.org.np/admin/assets/uploads/supportive_docs/38882333.pdf.
- Aryal, S.; Dhakal, S. Medium-Term Assessment of Cross Border Trading Potential of Nepal’s Renewable Energy Using Times Energy System Optimization Platform. Energy Policy. 2022, 168, 1–9. [Google Scholar] [CrossRef]
- Pollitt, M.; McKenna, M. Power Pools: How Cross-Border Trade in Electricity Can Help Meet Development Goals. The Trade Post, World Bank Blogs, Oct 1, 2014. Available online: https://blogs.worldbank.org/trade/power-pools-how-cross-border-trade-electricity-can-help-meet-development-goals.
- Rahman, S.H.; C., W. P. D.; Gunatilake, H.; Fernando, P. N; Energy Trade in South Asia Opportunities and Challenges; Asian Development Bank: Mandaluyong City, Philippines, 2012; Available online: https://www.adb.org/sites/default/files/publication/29703/energy-trade-south-asia.pdf.
-
SAARC Regional Energy Trade Study (SRETS); SAARC Secretariat: Kathmandu, Nepal, 2010; Available online: https://www.sasec.asia/uploads/publications/srets_a.pdf.
- Singh, A.; Jamasb, T.; Nepal, R.; Toman, M. Electricity Cooperation in South Asia: Barriers to Cross-Border Trade. Energy Policy. 2018, 120, 741–748. [Google Scholar] [CrossRef]
- Indian energy Exchange.
- Ul-Haq, A.; Hassan, M. S.; Jalal, M.; Ahmad, S.; Anjum, M. A.; Khalil, I. U.; Waqar, A. Cross-Border Power Trade and Grid Interconnection in SAARC Region: Technical Standardization and Power Pool Model. IEEE Access. 2019, 7, 178977–179001. Available online: https://www.semanticscholar.org/paper/Cross-Border-Power-Trade-and-Grid-Interconnection-Ul-Haq-Hassan/8ce36ef80ace64a7b23b2d1b7ba0e01ee311208a. [CrossRef]
- Ogino, K.; Nakayama, M.; Sasaki, D. Domestic Socioeconomic Barriers to Hydropower Trading: Evidence from Bhutan and Nepal. Sustainability. 2019, 11, 2062. [Google Scholar] [CrossRef]
- Nag, T. Barriers to Cross-Border Energy Cooperation and Implications on Energy Security: An Indian Perspective with Reference to Energy Trade in South Asia. Global Business Review. 2019, 22, 1530–1552. [Google Scholar] [CrossRef]
- Strahorn, E. An Analysis of the Barriers to Cross Border Trade in Hydroelectricity in the Himalayas; The Himalayan Research Papers Archive: Albuquerque, NM, USA, 2016; Available online: https://digitalrepository.unm.edu/hprc/2016/papers/13/.
- Mcbennett, B.; Rose, A.; Hurlbut, D.; Palchak, D.; Cochran, J. Cross-Border Energy Trade between Nepal and India: Assessment of Trading Opportunities; National Renewable Energy Laboratory (NREL): Denver West Parkway Golden, CO, USA, 2019; Available online: https://www.nrel.gov/docs/fy19osti/72066.pdf.
- Dhakal, S.; Karki, P.; Shrestha, S. Cross-Border Electricity Trade for Nepal: A Swot-AHP Analysis of Barriers and Opportunities Based on Stakeholders’ Perception. International Journal of Water Resources Development. 2019, 37, 559–580. [Google Scholar] [CrossRef]
- Pillai, A. V.; Prasai, S. The Political Economy of Electricity Trade and Hydropower Development in Eastern South Asia. International Journal of Water Resources Development. 2019, 37, 1–13. [Google Scholar] [CrossRef]
- Vaidya, R.A.; Yadav, N.; Rai, N.; Neupane, S.; Mukherji, A. Electricity Trade and Cooperation in the BBIN Region: Lessons from Global Experience. International Journal of Water Resources Development. 2019, 37, 439–465. [Google Scholar] [CrossRef]
-
SARI/EI - Harmonization of Grid Codes, Operating Procedures, and Standards to Facilitate/ Promote Cross Border Electricity Trade (CBET) in South Asia; Integrated Research and Action for Development, 2016; Available online: https://irade.org/SAFTU_Final%20Report%20Print%20Version.pdf.
- Timilsina, G.R. Regional Electricity Trade for Hydropower Development in South Asia. International Journal of Water Resources Development. 2018, 37, 1–19. [Google Scholar] [CrossRef]
- Regmi, S.; Kandel, A.; Shiwakoti, S.; Dhital, M.R. Risk Management of High Voltage Transmission Line Project: A Case Study of ADB Funded Projects in Nepal. International Journal of Engineering Applied Sciences and Technology. 2022, 6, 94–105. [Google Scholar] [CrossRef]
- Agreement between the Government of Nepal and the Government of the Republic of India on Electric Power Trade, Cross-border Transmission Interconnection and Grid Connectivity; Ministry of Energy, Water Resources and Irrigation, Government of Nepal: Singh Durbar, Kathmandu, Nepal. Available online: https://www.moewri.gov.np/storage/listies/May2020/pta-english-21-oct-2014.pdf.
- IPPs Power Projects in Different Stages of Development as of December 2022. Nepal Electricity Authority - Vidyut, 2023; 96–105.
-
Electricity Demand Forecast Report (2015-2040); Water and Energy Commission Secretariat, GoN: Kathmandu, Nepal, 2017.
-
Nepal Electricity Authority a Year in Review Fiscal Year 2021/2022; Nepal Electricity Authority: Durbarmarg, Kathmandu, Nepal, 2022. Available online: https://www.nea.org.np/admin/assets/uploads/supportive_docs/NEA_Annual_Report_2023.pdf.
- Kumar, J.C.R.; Majid, M.A. Renewable Energy for Sustainable Development in India: Current Status, Future Prospects, Challenges, Employment, and Investment Opportunities. Energy, Sustainability and Society. 2020, 10, 1–36. [Google Scholar] [CrossRef]
-
India Energy Information; Enerdata. Available online: https://www.enerdata.net/estore/energy-market/india/ (accessed on 29 June 2022).
-
India Energy Outlook 2021 – Analysis; International Energy Agency. Available online: https://www.iea.org/reports/india-energy-outlook-2021.
-
India’s Stand at COP-26; Ministry of Environment, Forest and Climate Change, 2022. Available online: https://pib.gov.in/PressReleasePage.aspx?PRID=1795071.
- Wijayatunga, P.; Chattopadhyay, D.; Fernando, P. Cross Border Power Trading in South Asia: A Techno Economic Rationale; Asian Development Bank: Metro Manila, Philippines, 2015; Available online: https://www.adb.org/sites/default/files/publication/173198/south-asia-wp-038.pdf.
- Haque, H.M.E.; Dhakal, S.; Mostafa, S.M.G. An Assessment of Opportunities and Challenges for Cross-Border Electricity Trade for Bangladesh Using SWOT-AHP Approach. Energy Policy. 2020, 137. [Google Scholar] [CrossRef]
- Gyanwali, K.; Komiyama, R.; Fujii, Y. Representing Hydropower in the Dynamic Power Sector Model and Assessing Clean Energy Deployment in the Power Generation Mix of Nepal. Energy. 2020, 202. [Google Scholar] [CrossRef]
- Regmi, S.; Shiwakoti, S. Strategic Analysis of the Nepal Electricity Authority: A Swot-AHP Analysis Based on Stakeholders’ Perceptions. International Journal of the Analytic Hierarchy Process. 2022, 14. [Google Scholar] [CrossRef]
- Puspitarini, H.D. Indonesia Energy Transition Readiness Assessment 2021. Presented at Launching event of IETO 2022. IESR. 2021. Available online: https://iesr.or.id/wp-content/uploads/2021/12/IETO_2022_TRF.pptx.pdf.
- Rose, A.; Koebrich, S.; Palchak, D.; Chernyakhovskiy, I.; Wayner, C. A Framework for Readiness Assessments of Utility-Scale Energy Storage; National Renewable Energy Laboratory: Denver West Parkway Golden, CO, 2020; Available online: https://www.nrel.gov/docs/fy21osti/78197.pdf.
-
Establishing Multilateral Power Trade in ASEAN; International Energy Agency, 2019. Available online: https://www.iea.org/reports/establishing-multilateral-power-trade-in-asean.
- Palinkas, L.A.; Horwitz, S.M.; Green, C.A.; Wisdom, J.P.; Duan, N.; Hoagwood, K. Purposeful Sampling for Qualitative Data Collection and Analysis in Mixed Method Implementation Research. Administration and Policy in Mental Health and Mental Health Services Research. 2015, 42, 533–544. Available online: https://www.ncbi.nlm.nih.gov/pmc/articles/PMC4012002/. [CrossRef] [PubMed]
-
Guidelines for Import / Export (Cross Border) of Electricity; Ministry of Power, Government of India: India, 2018. Available online: https://powermin.gov.in/sites/default/files/uploads/Guidelines_for_ImportExport_Cross%20Border_of_Electricity_2018.pdf.
- Zach. How to Calculate Cronbach’s Alpha in Python; Statology, 2021. Available online: https://www.statology.org/cronbachs-alpha-in-python/.
- Hair; Anderson; Tatham; Black. Multivariate Data Analysis; Prentice-Hall: Upper Saddle River, Nj, 1998. [Google Scholar]
|
Disclaimer/Publisher’s Note: The statements, opinions and data contained in all publications are solely those of the individual author(s) and contributor(s) and not of MDPI and/or the editor(s). MDPI and/or the editor(s) disclaim responsibility for any injury to people or property resulting from any ideas, methods, instructions or products referred to in the content. |
© 2024 by the authors. Licensee MDPI, Basel, Switzerland. This article is an open access article distributed under the terms and conditions of the Creative Commons Attribution (CC BY) license (http://creativecommons.org/licenses/by/4.0/).
