Submitted:
31 January 2024
Posted:
31 January 2024
You are already at the latest version
Abstract
Keywords:
1. Introduction
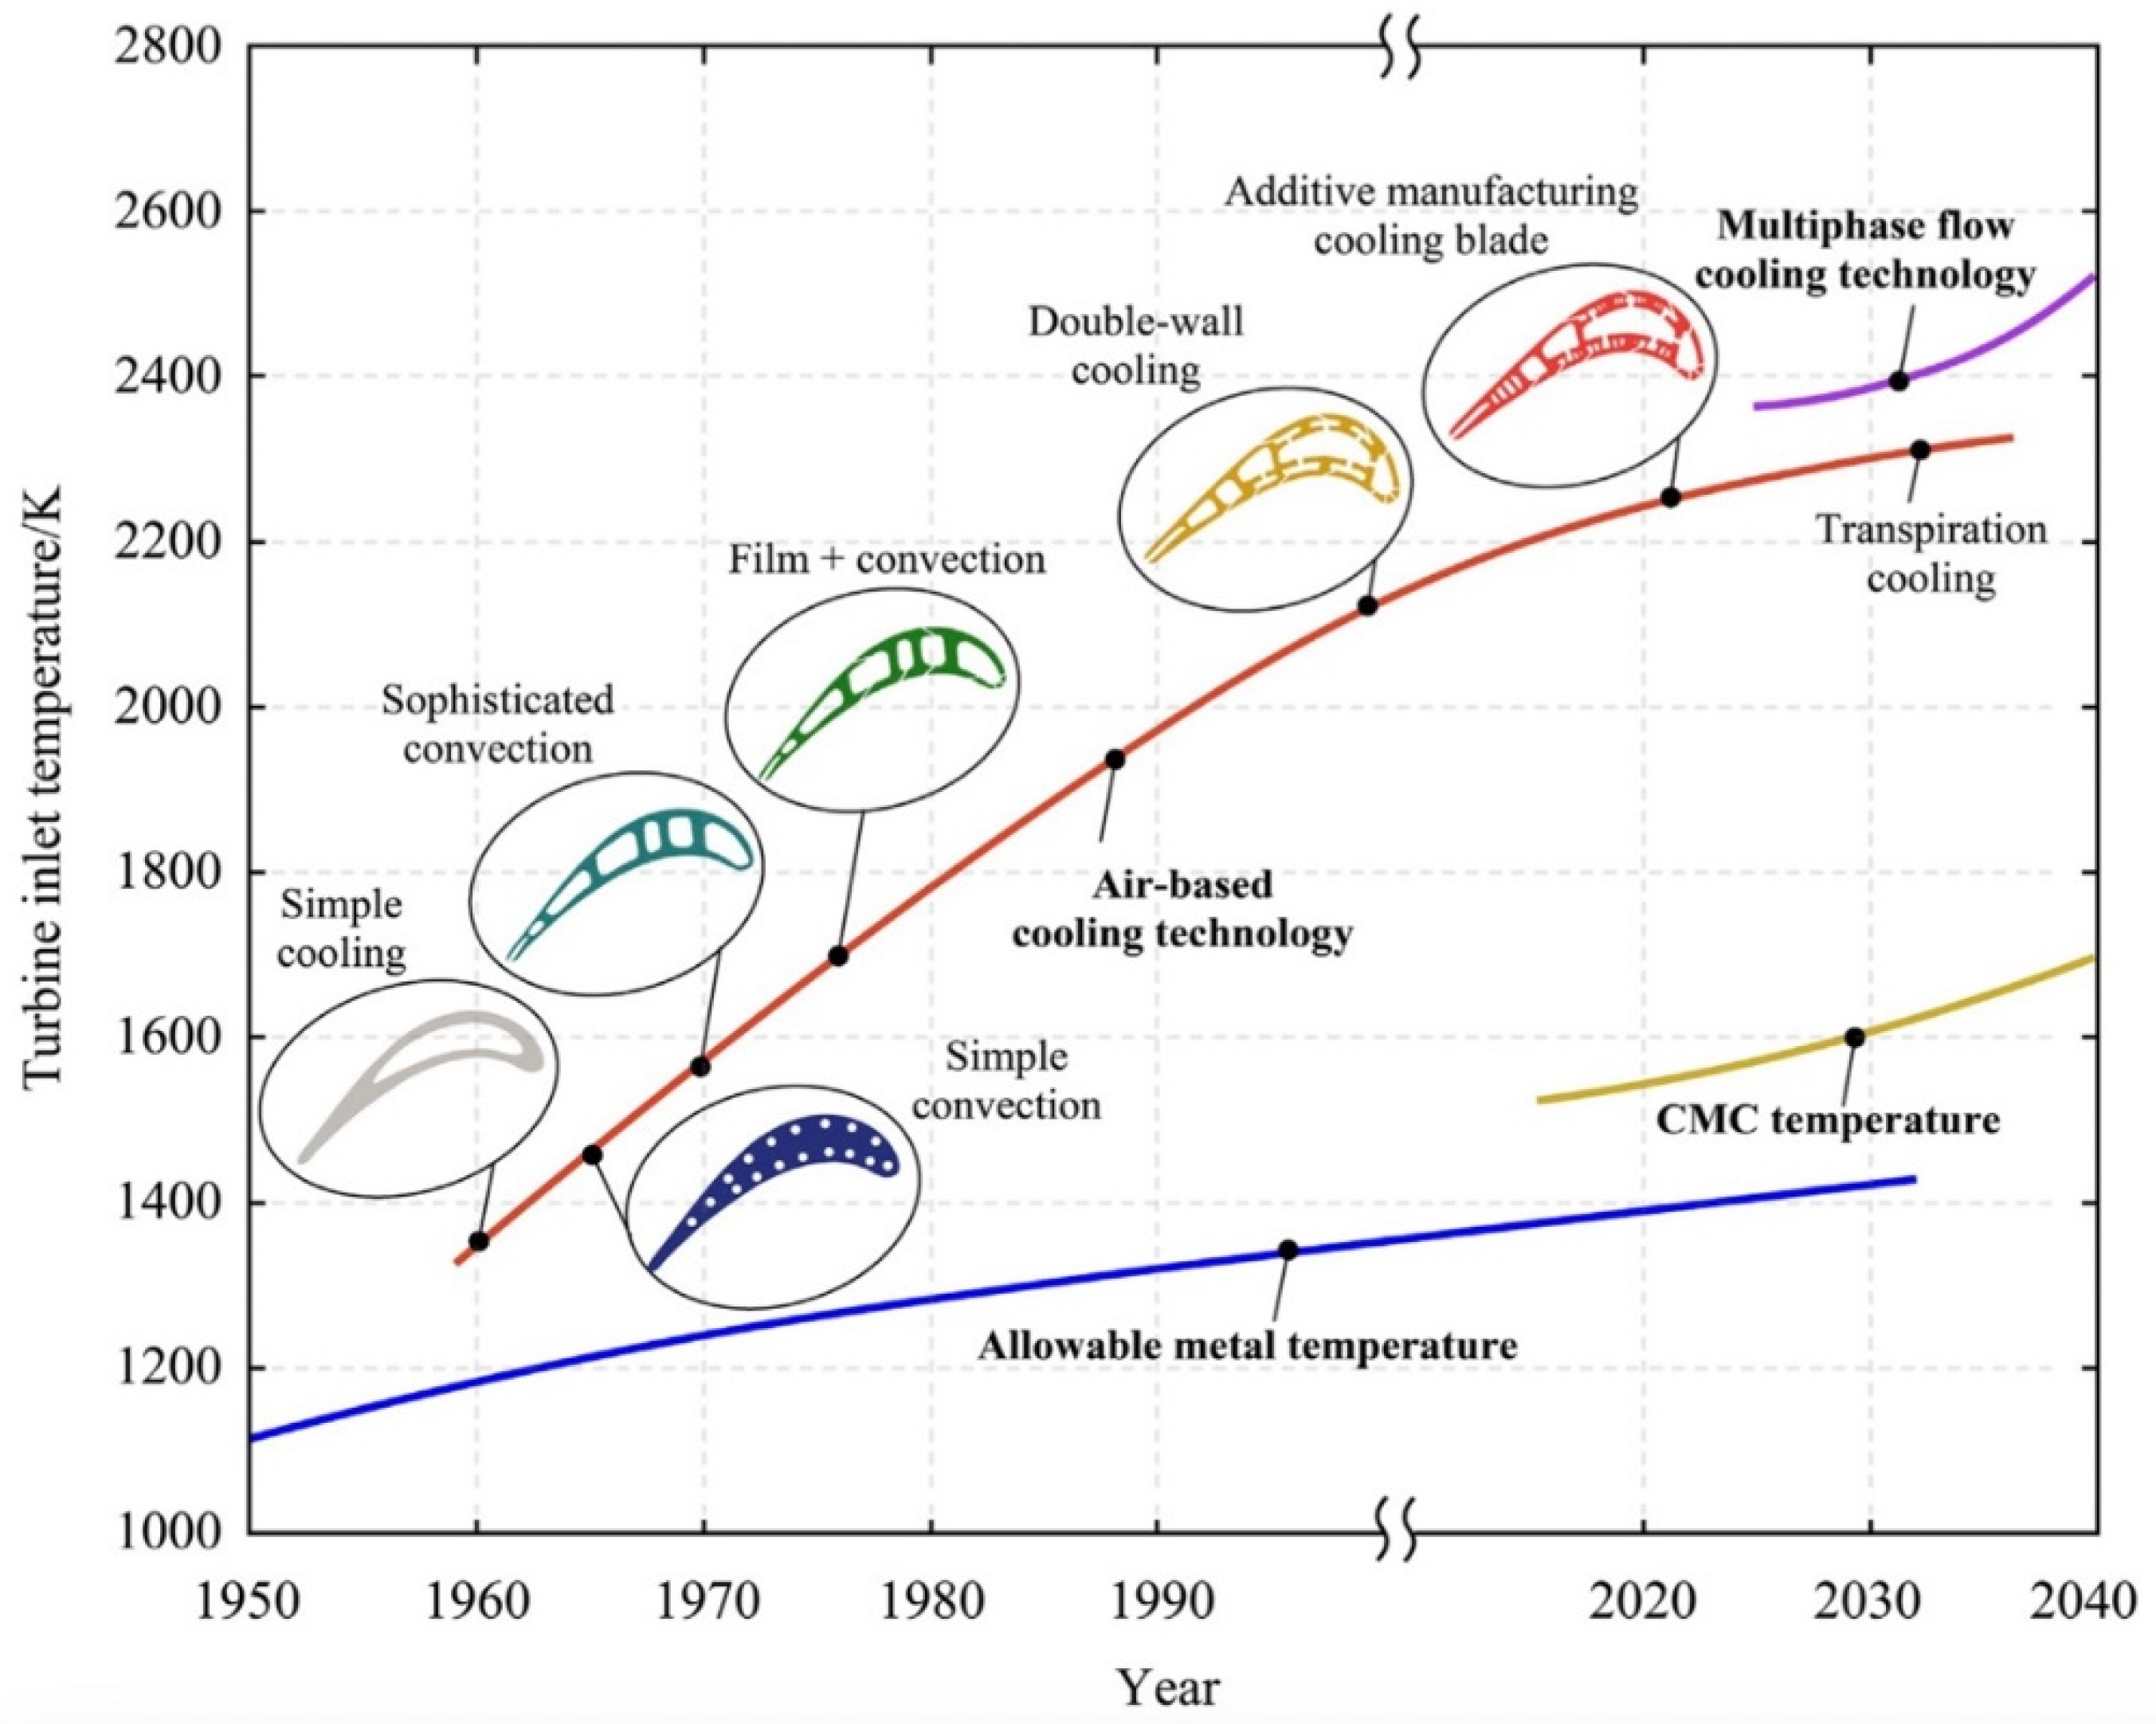
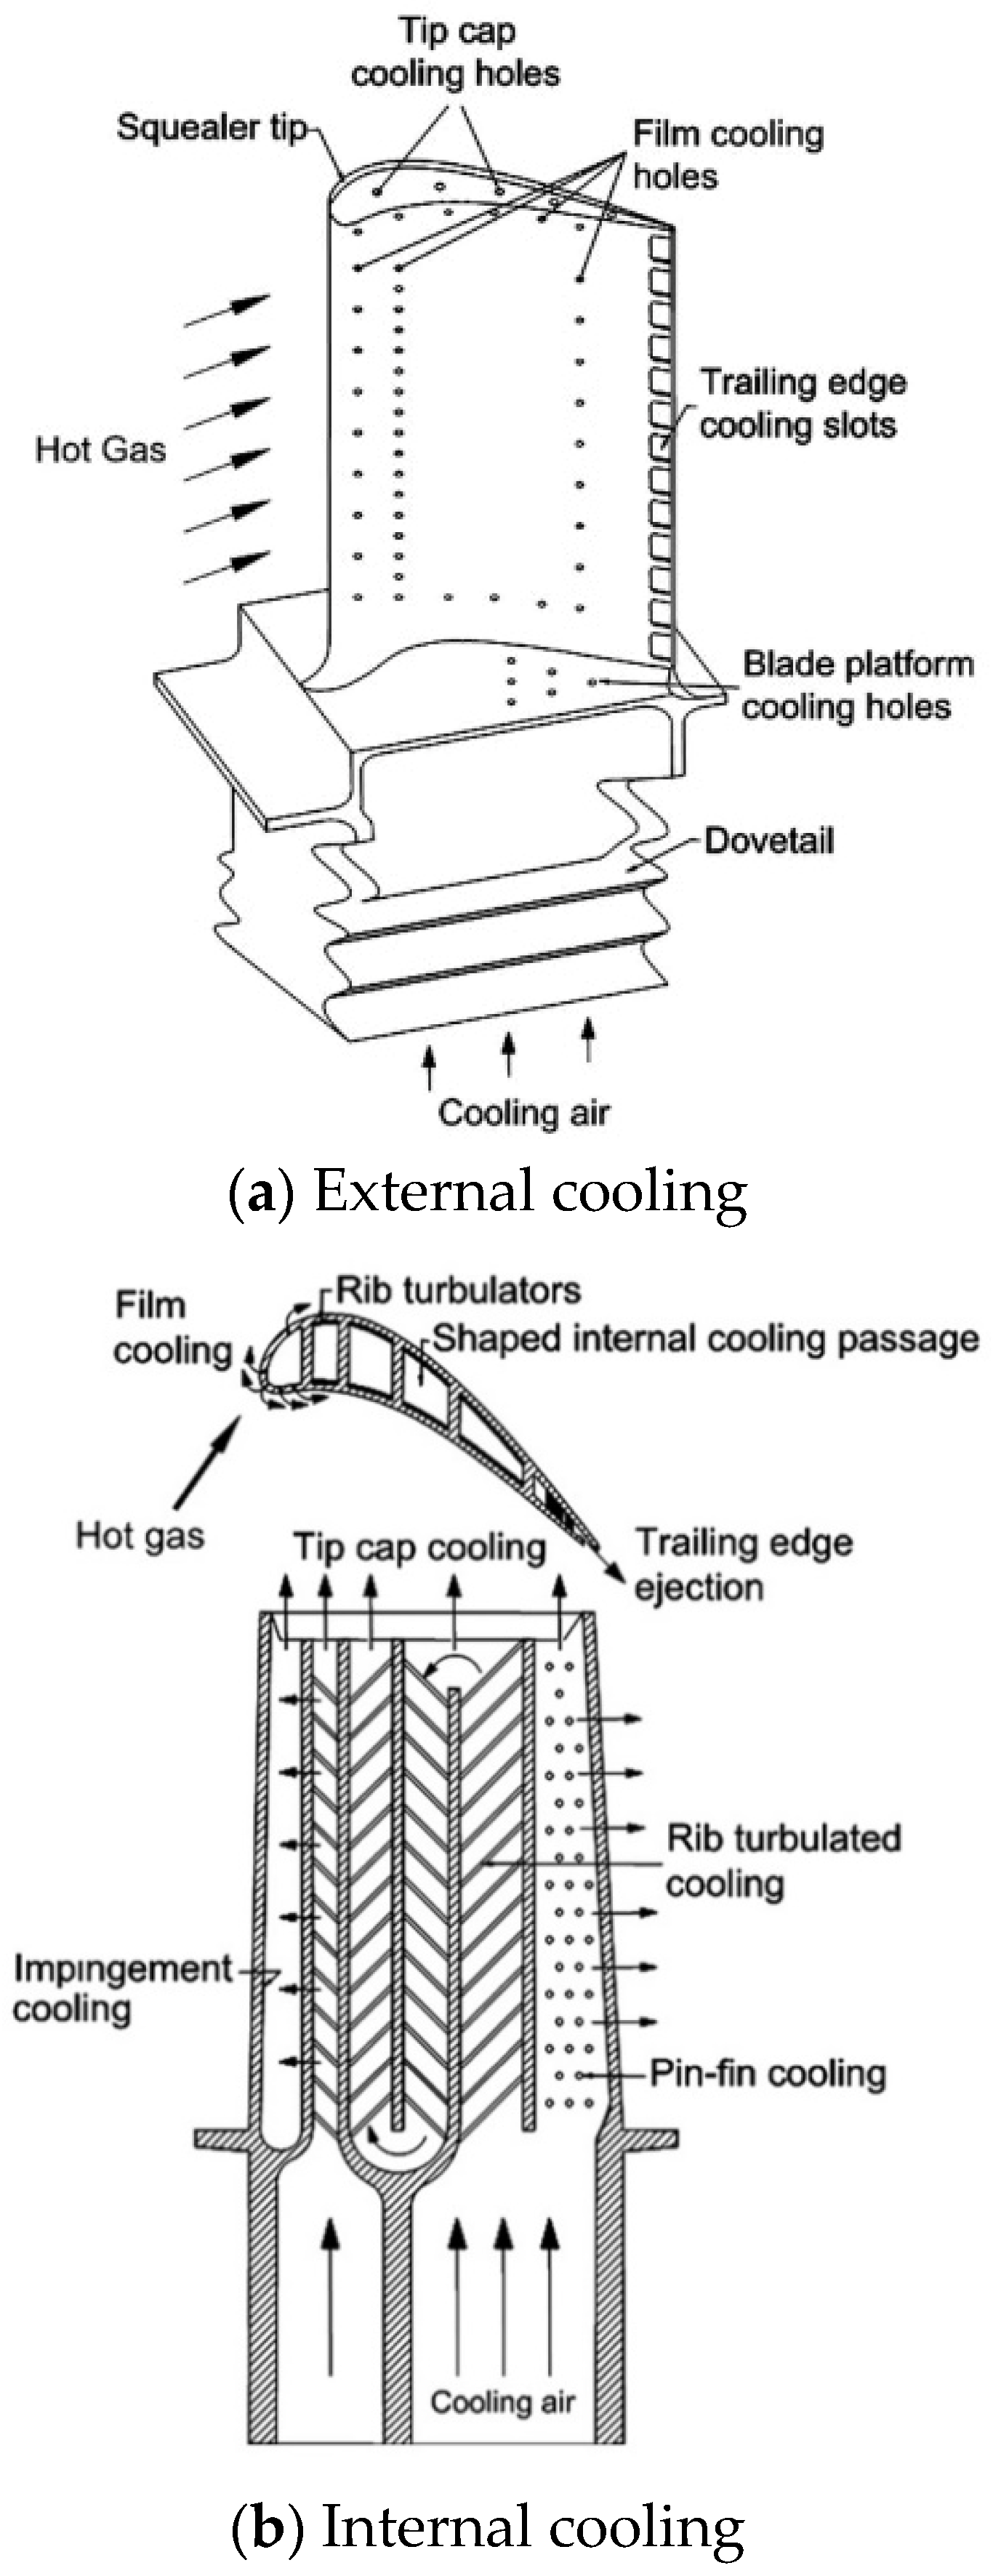
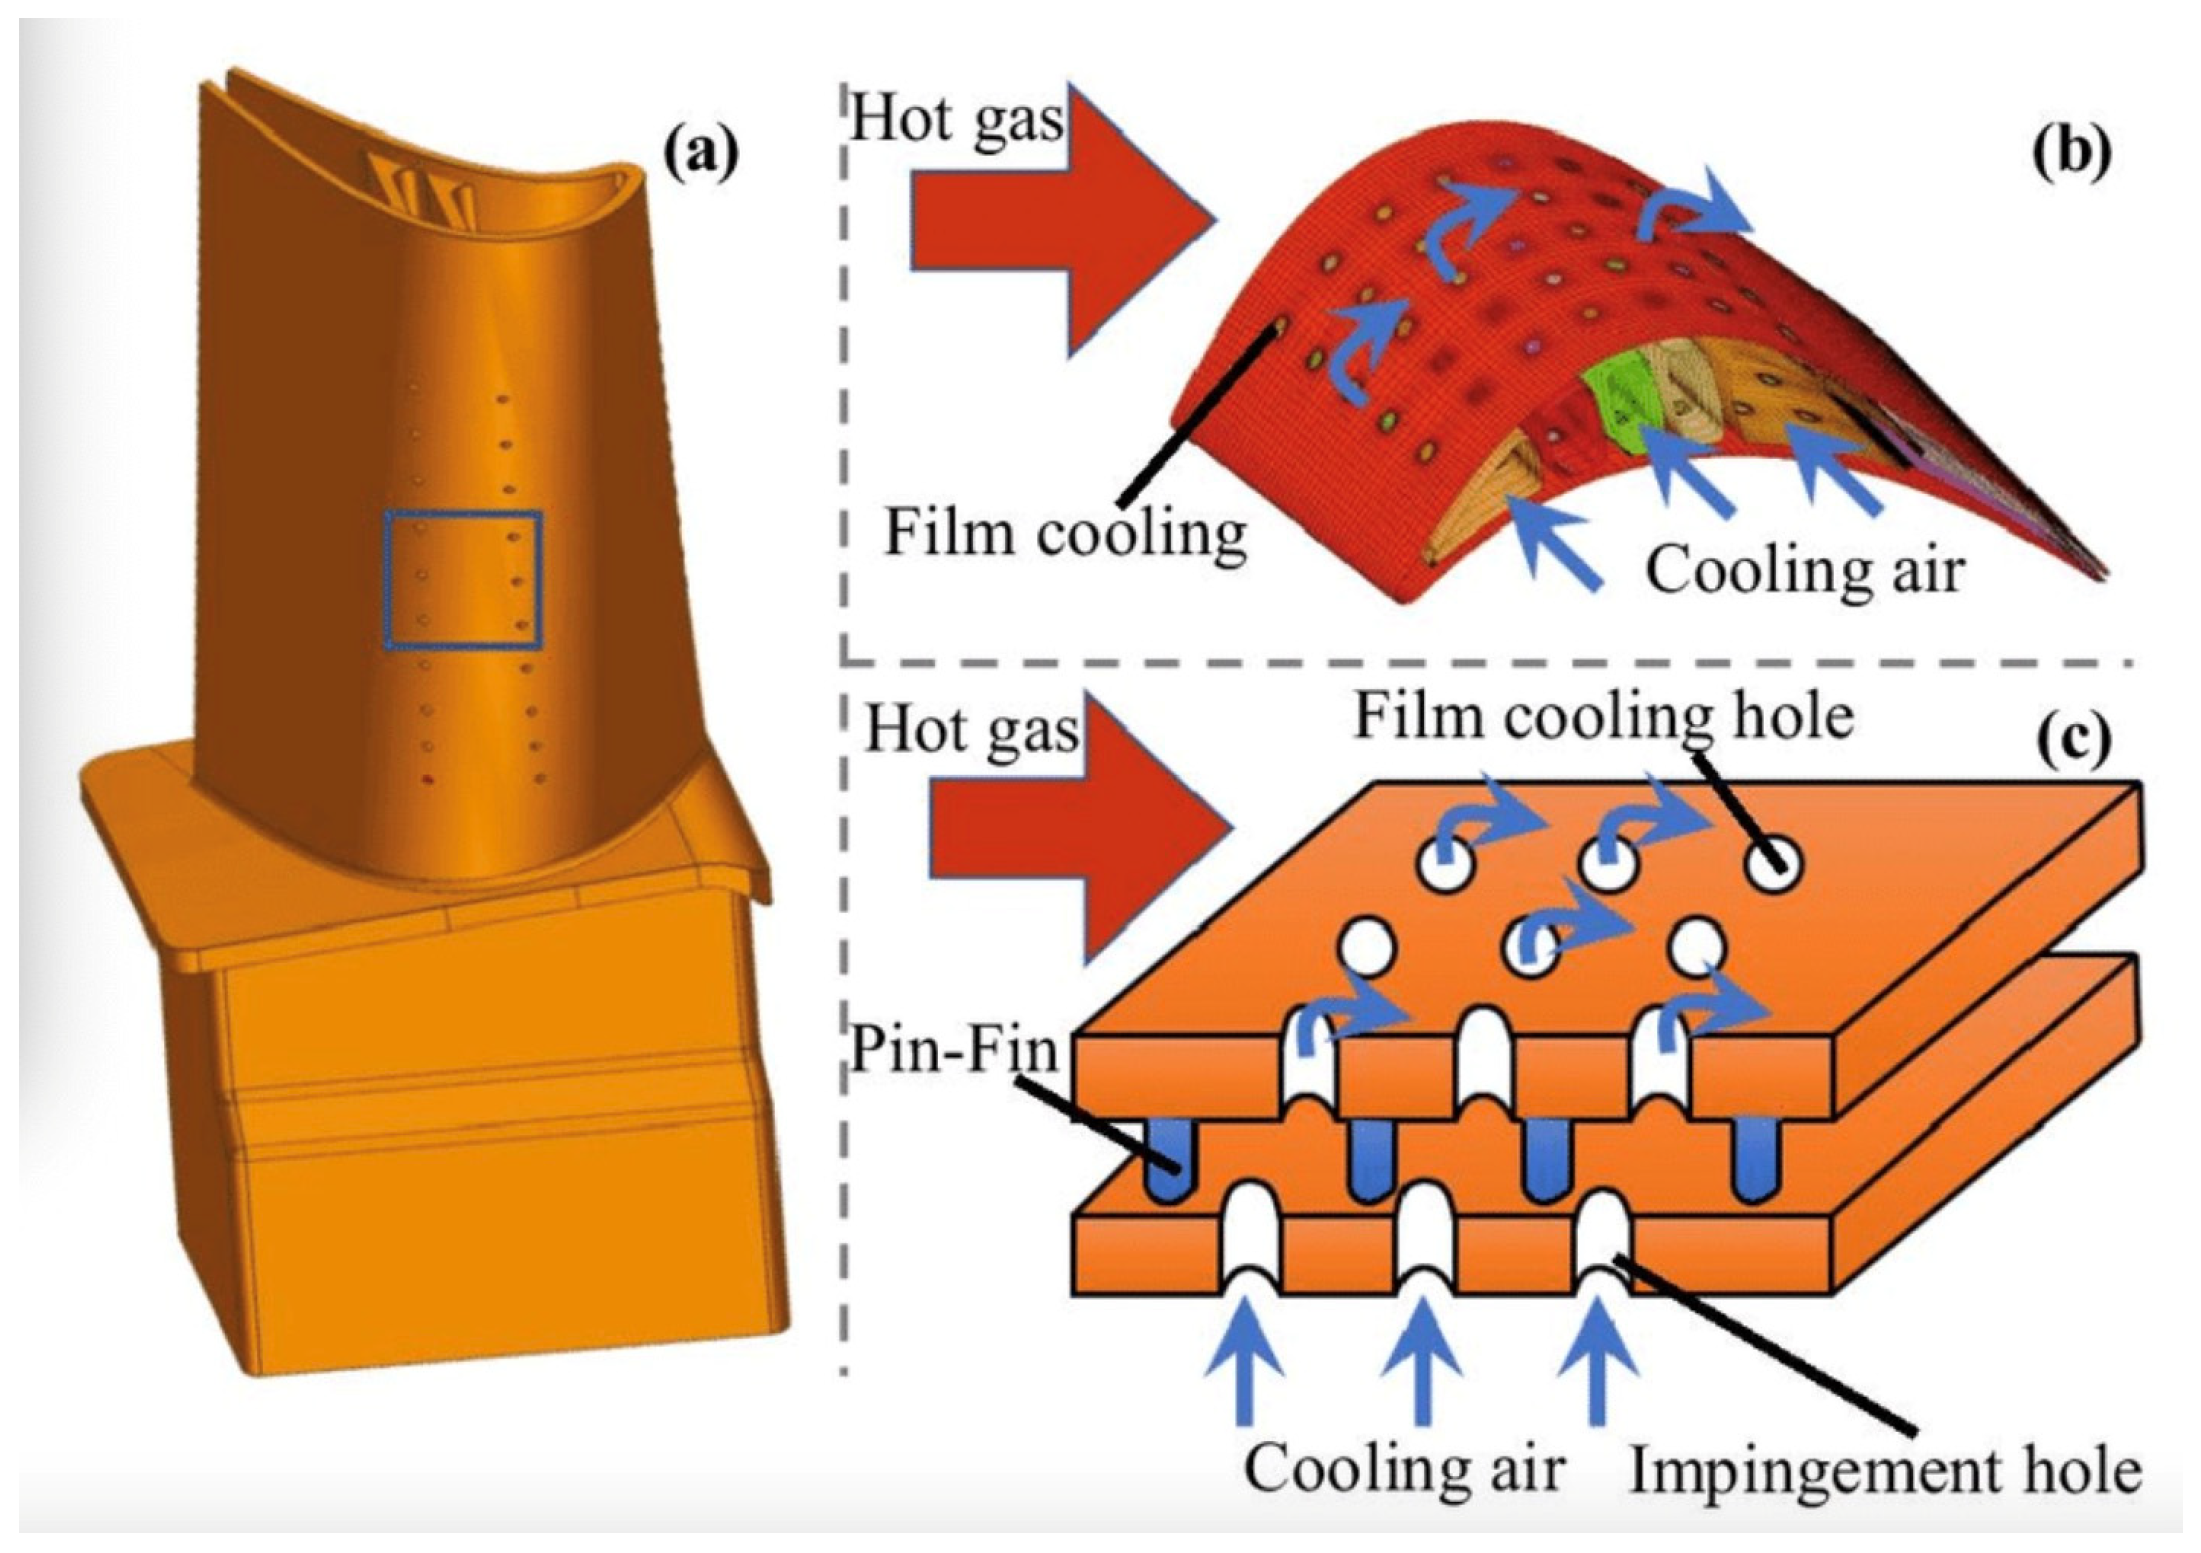
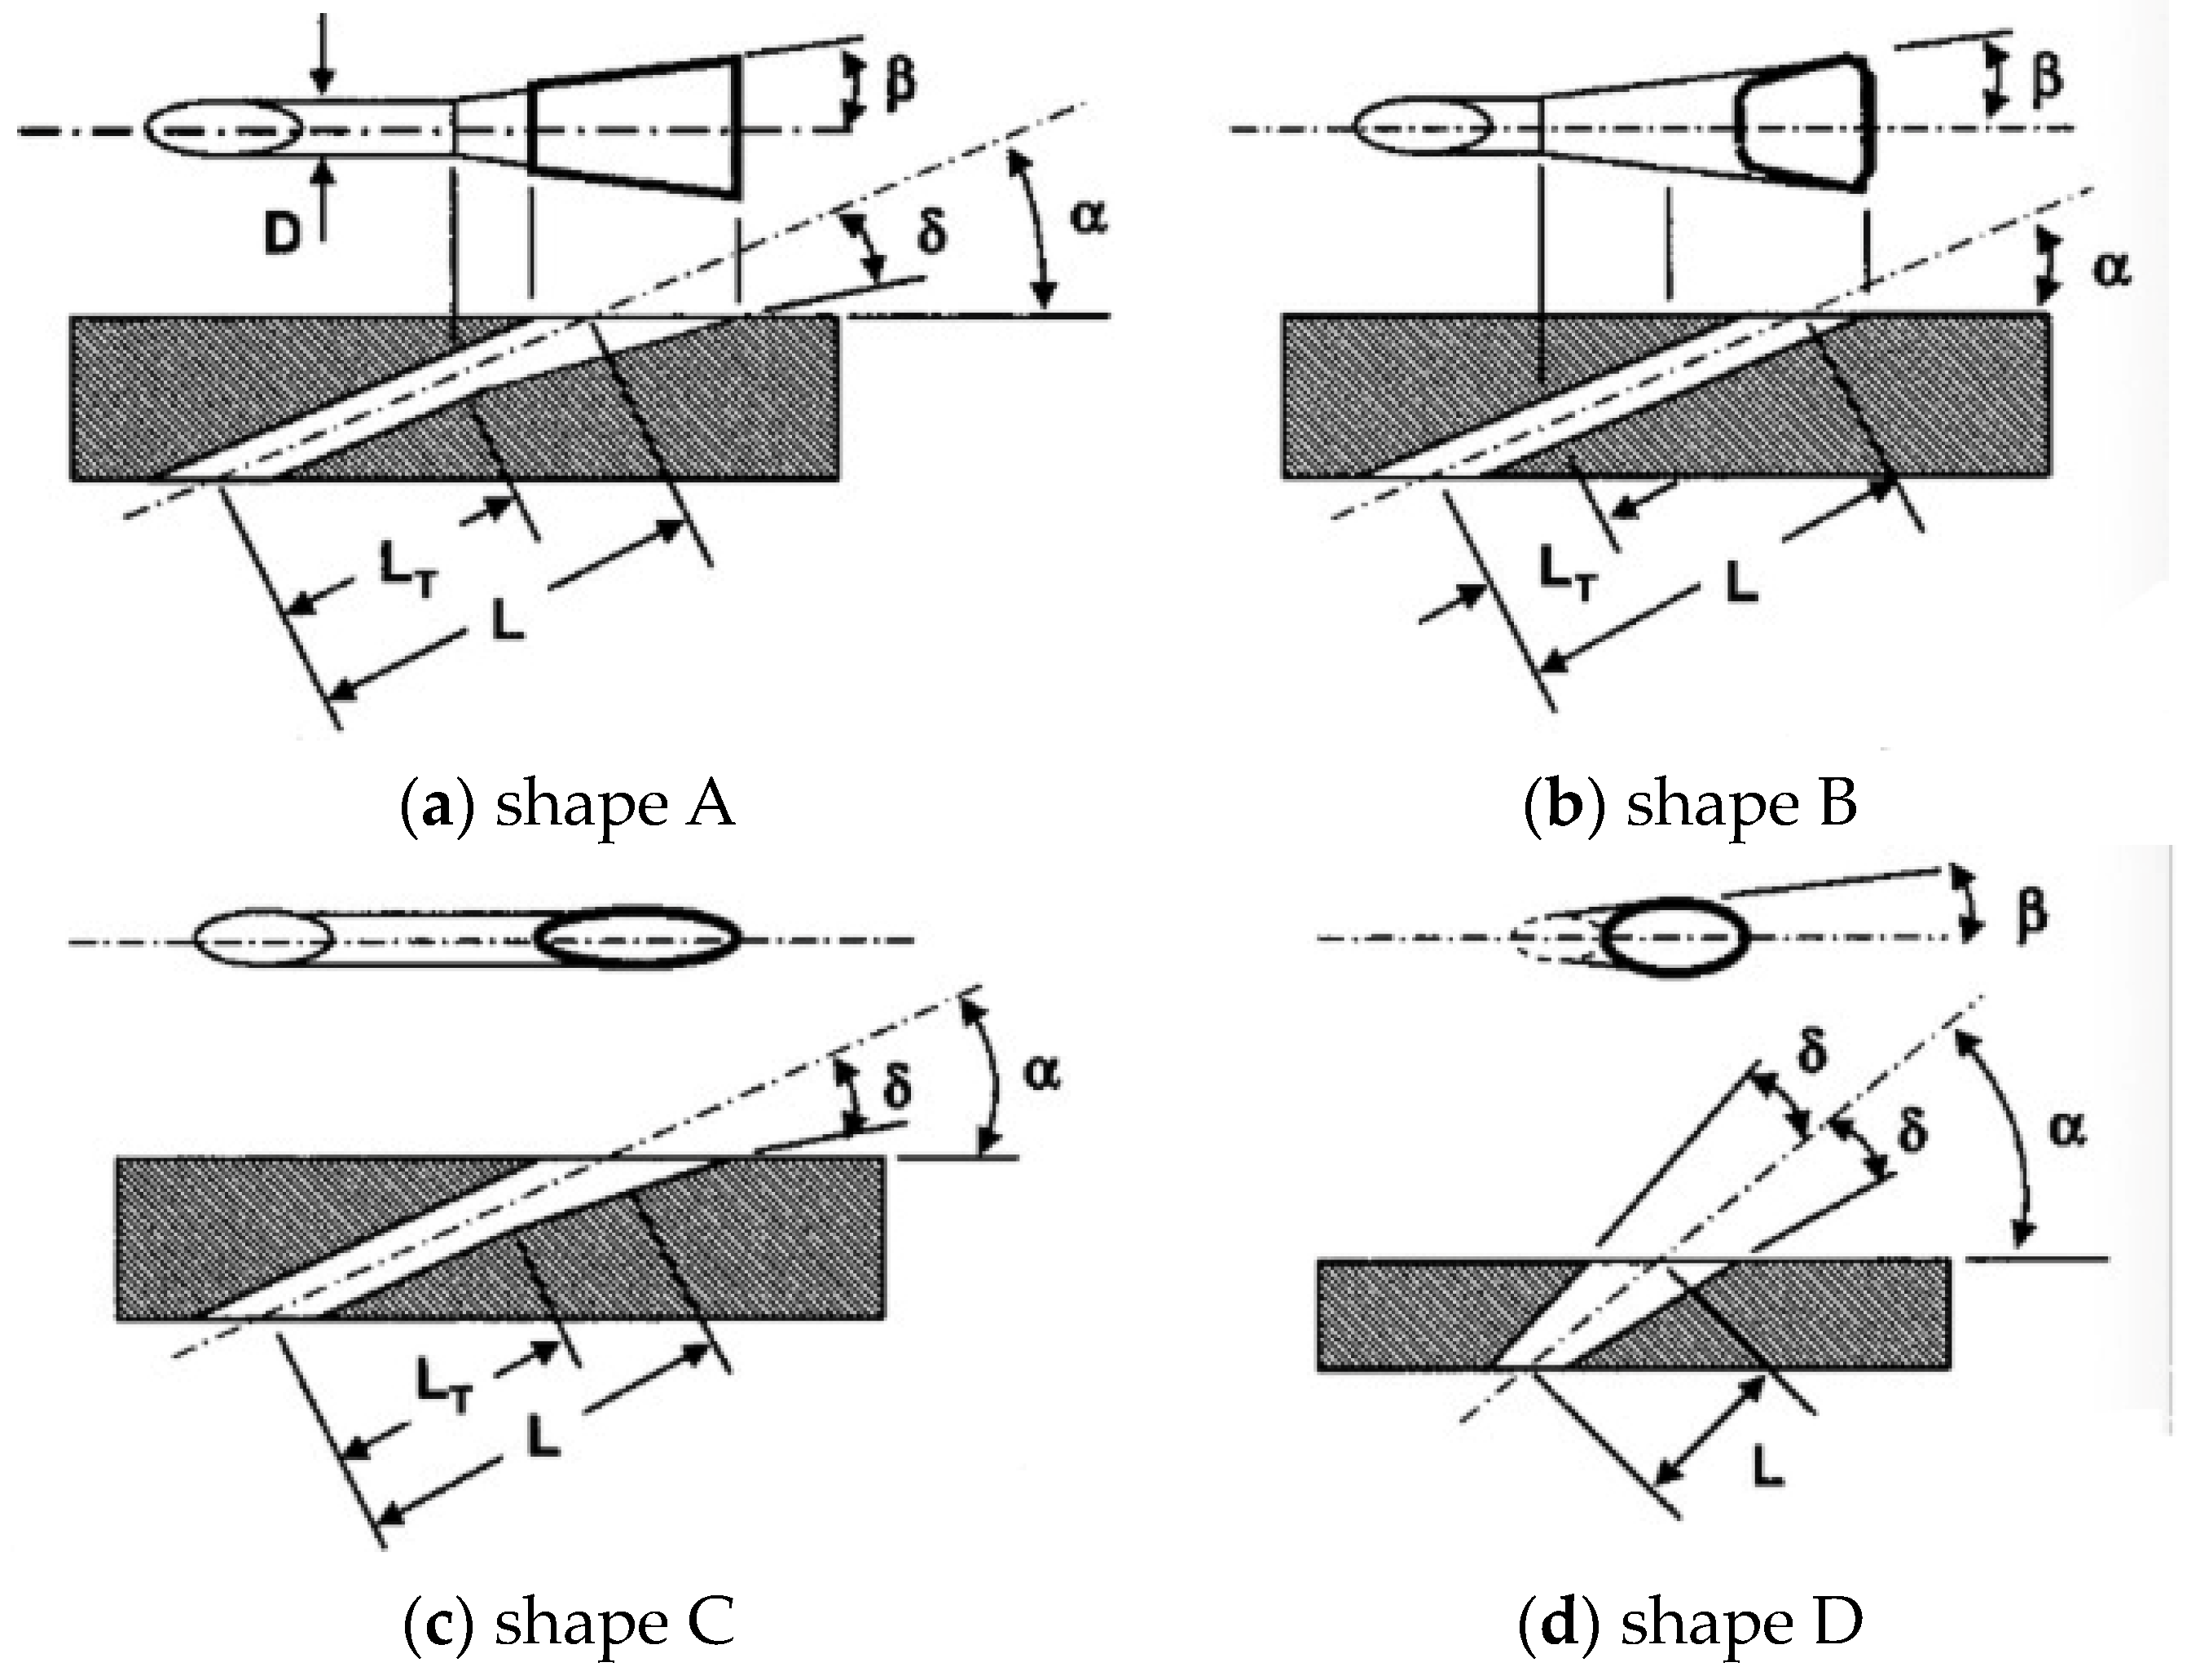
2. Development of Shaped Cooling Hole Geometrical Design
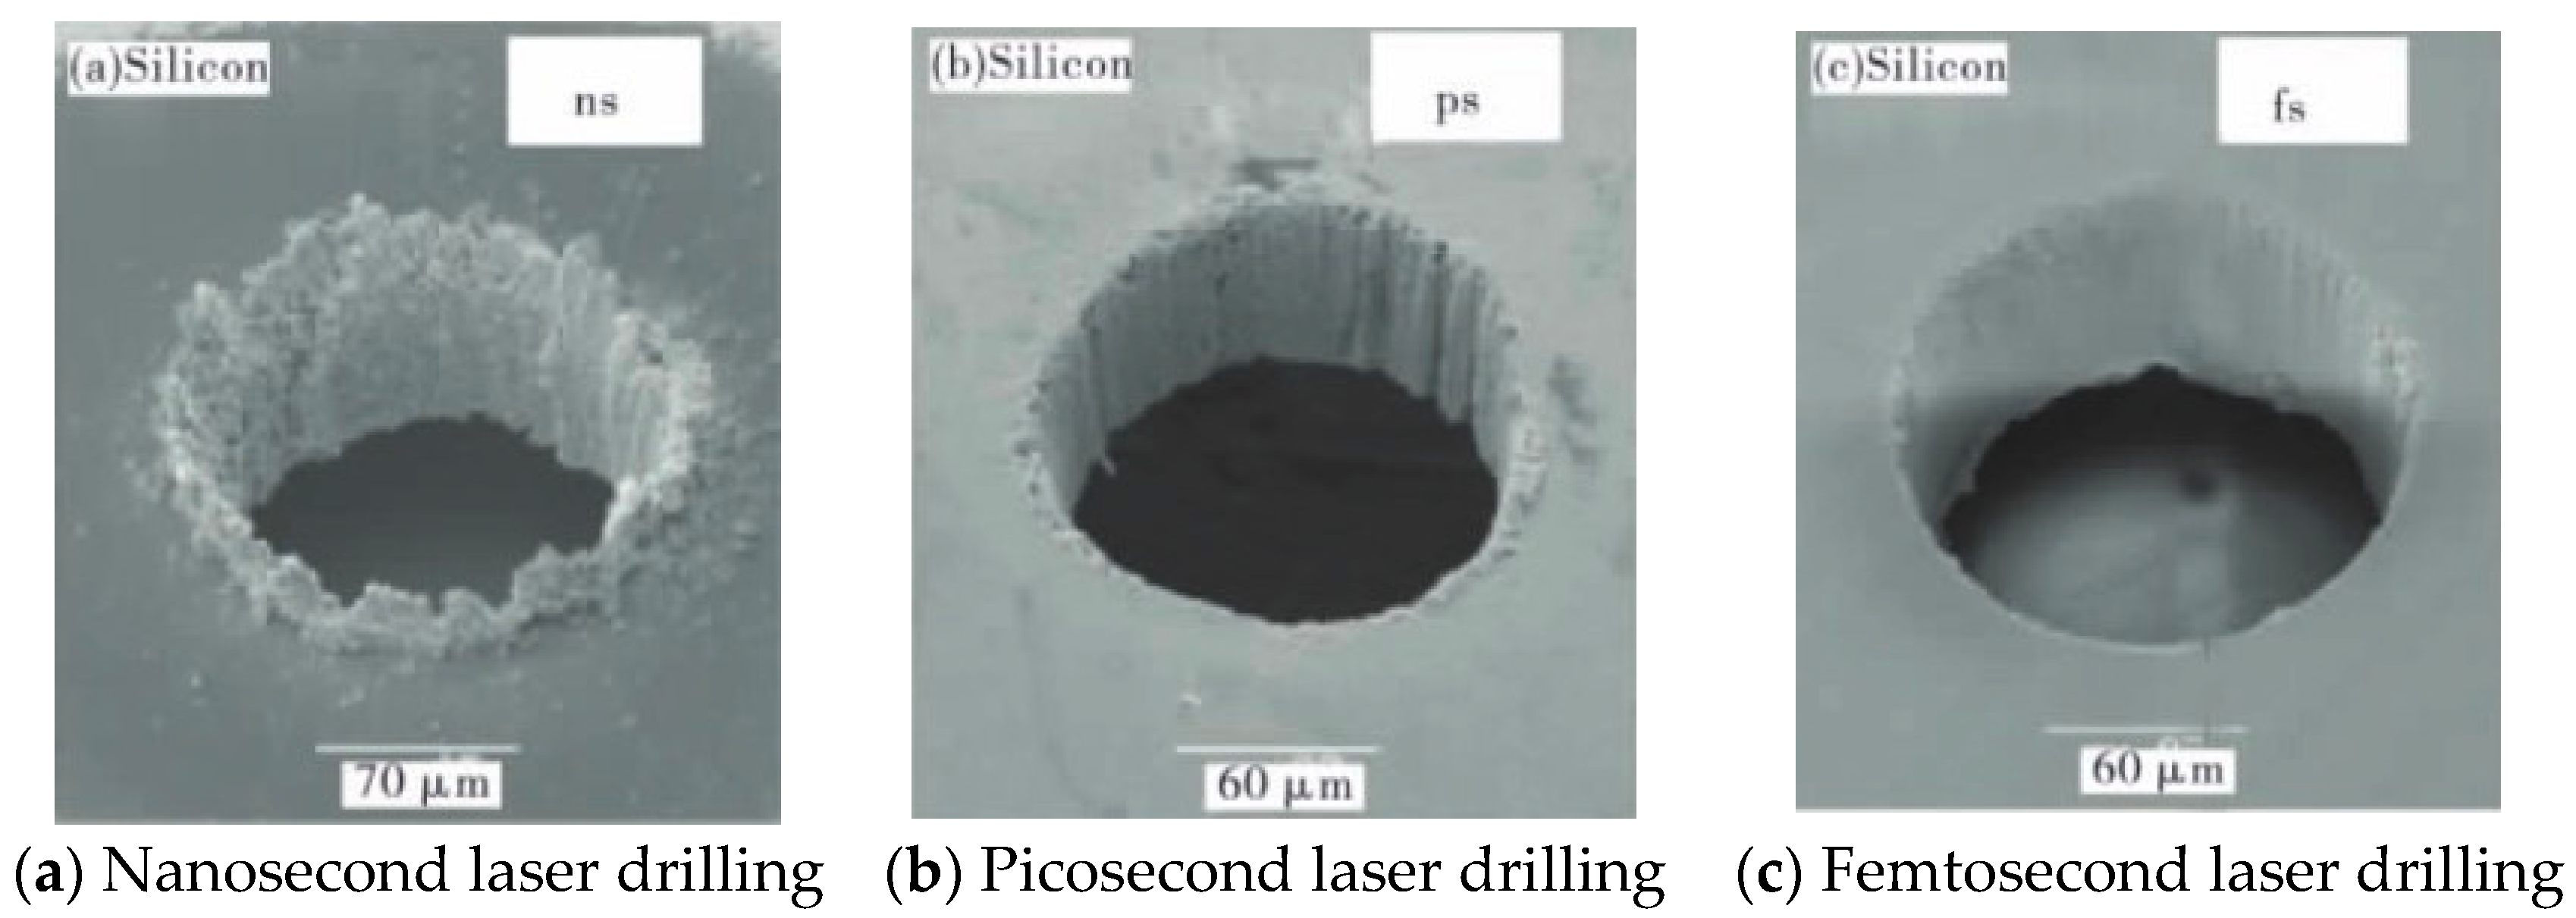
3. Development of Cooling Hole Manufacturing Processes
3.1. Cooling Hole Manufacturing Processes
3.2. Difficulties in Cooling Hole Manufacturing
4. Development of Cooling Hole Measurement Technology
4.1. Key Quality Indicators for Cooling Hole
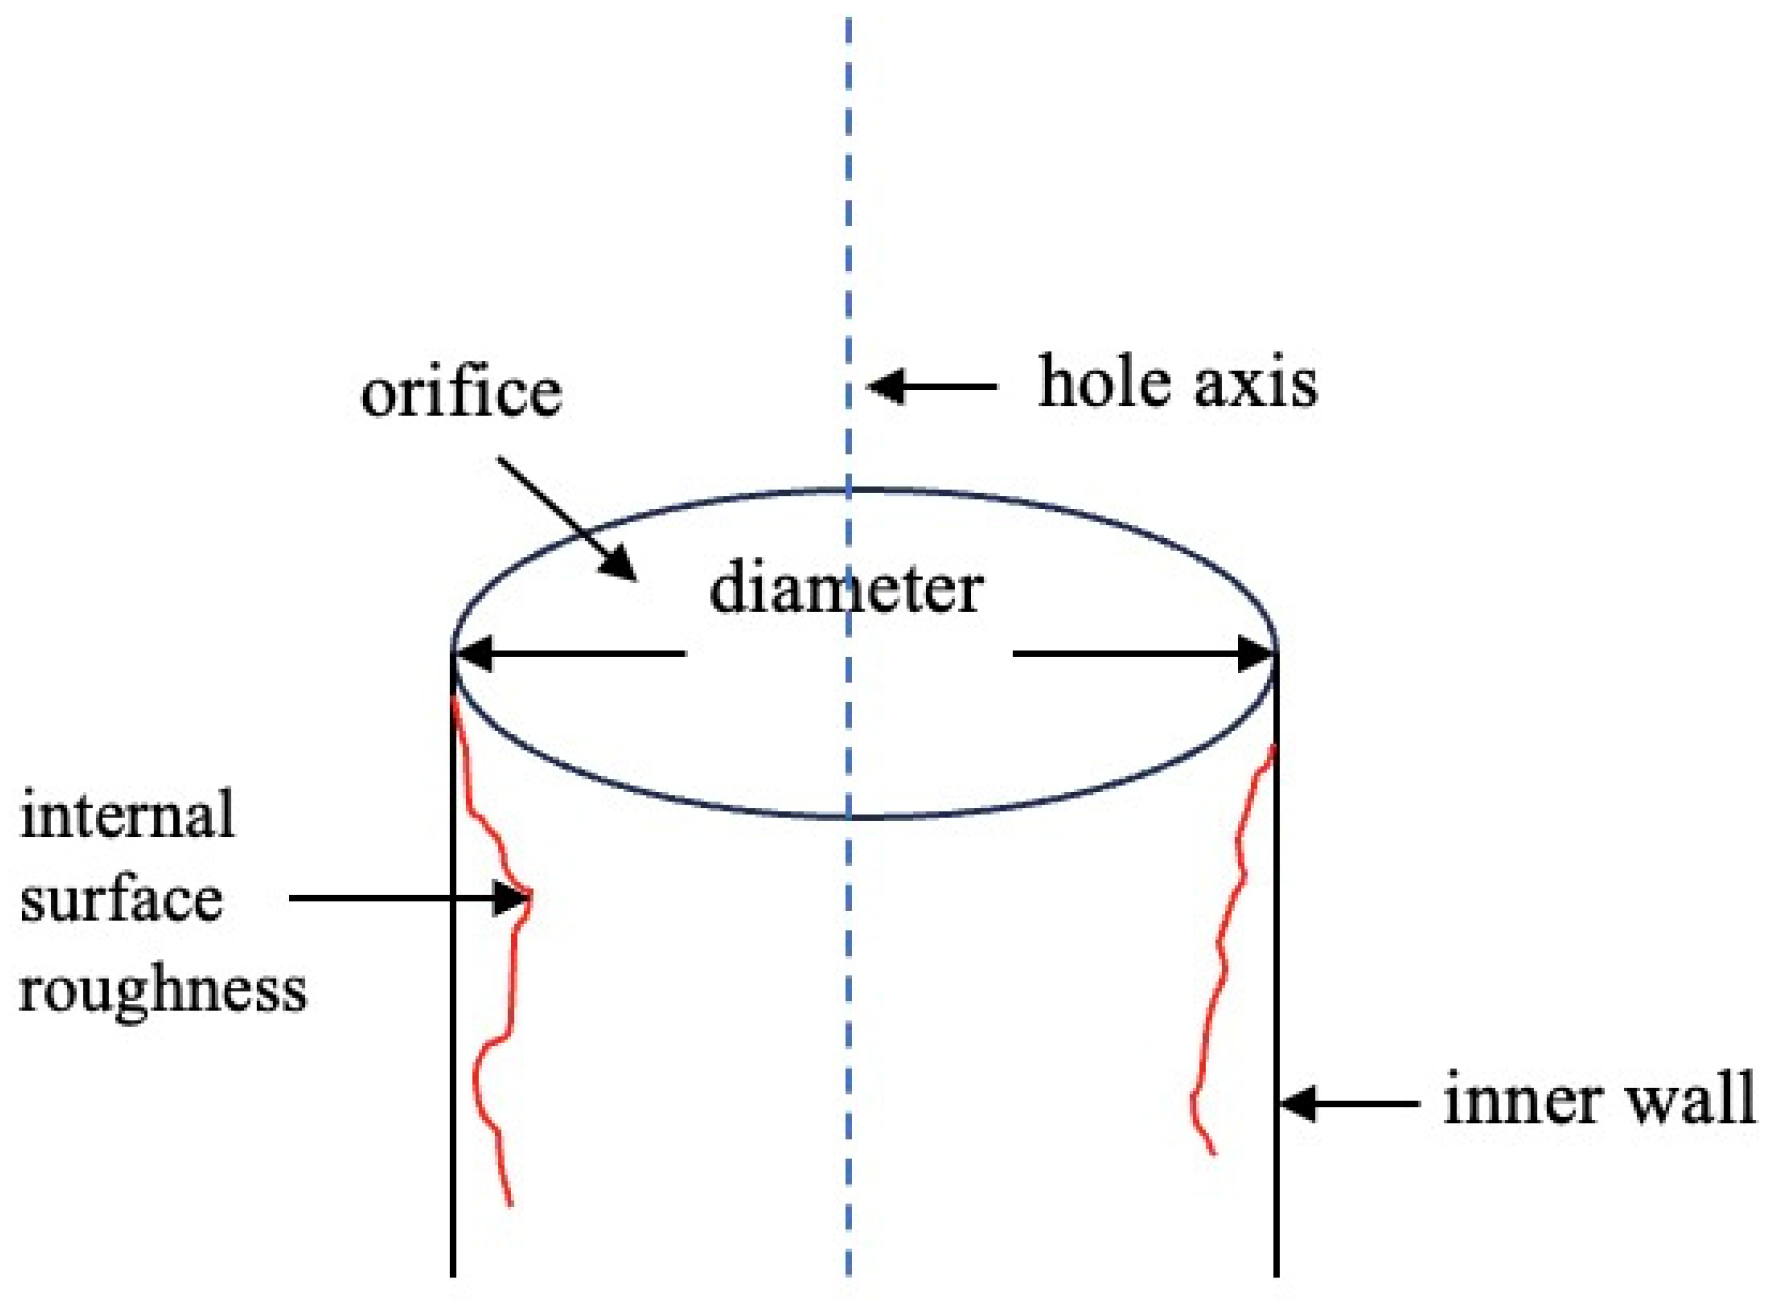
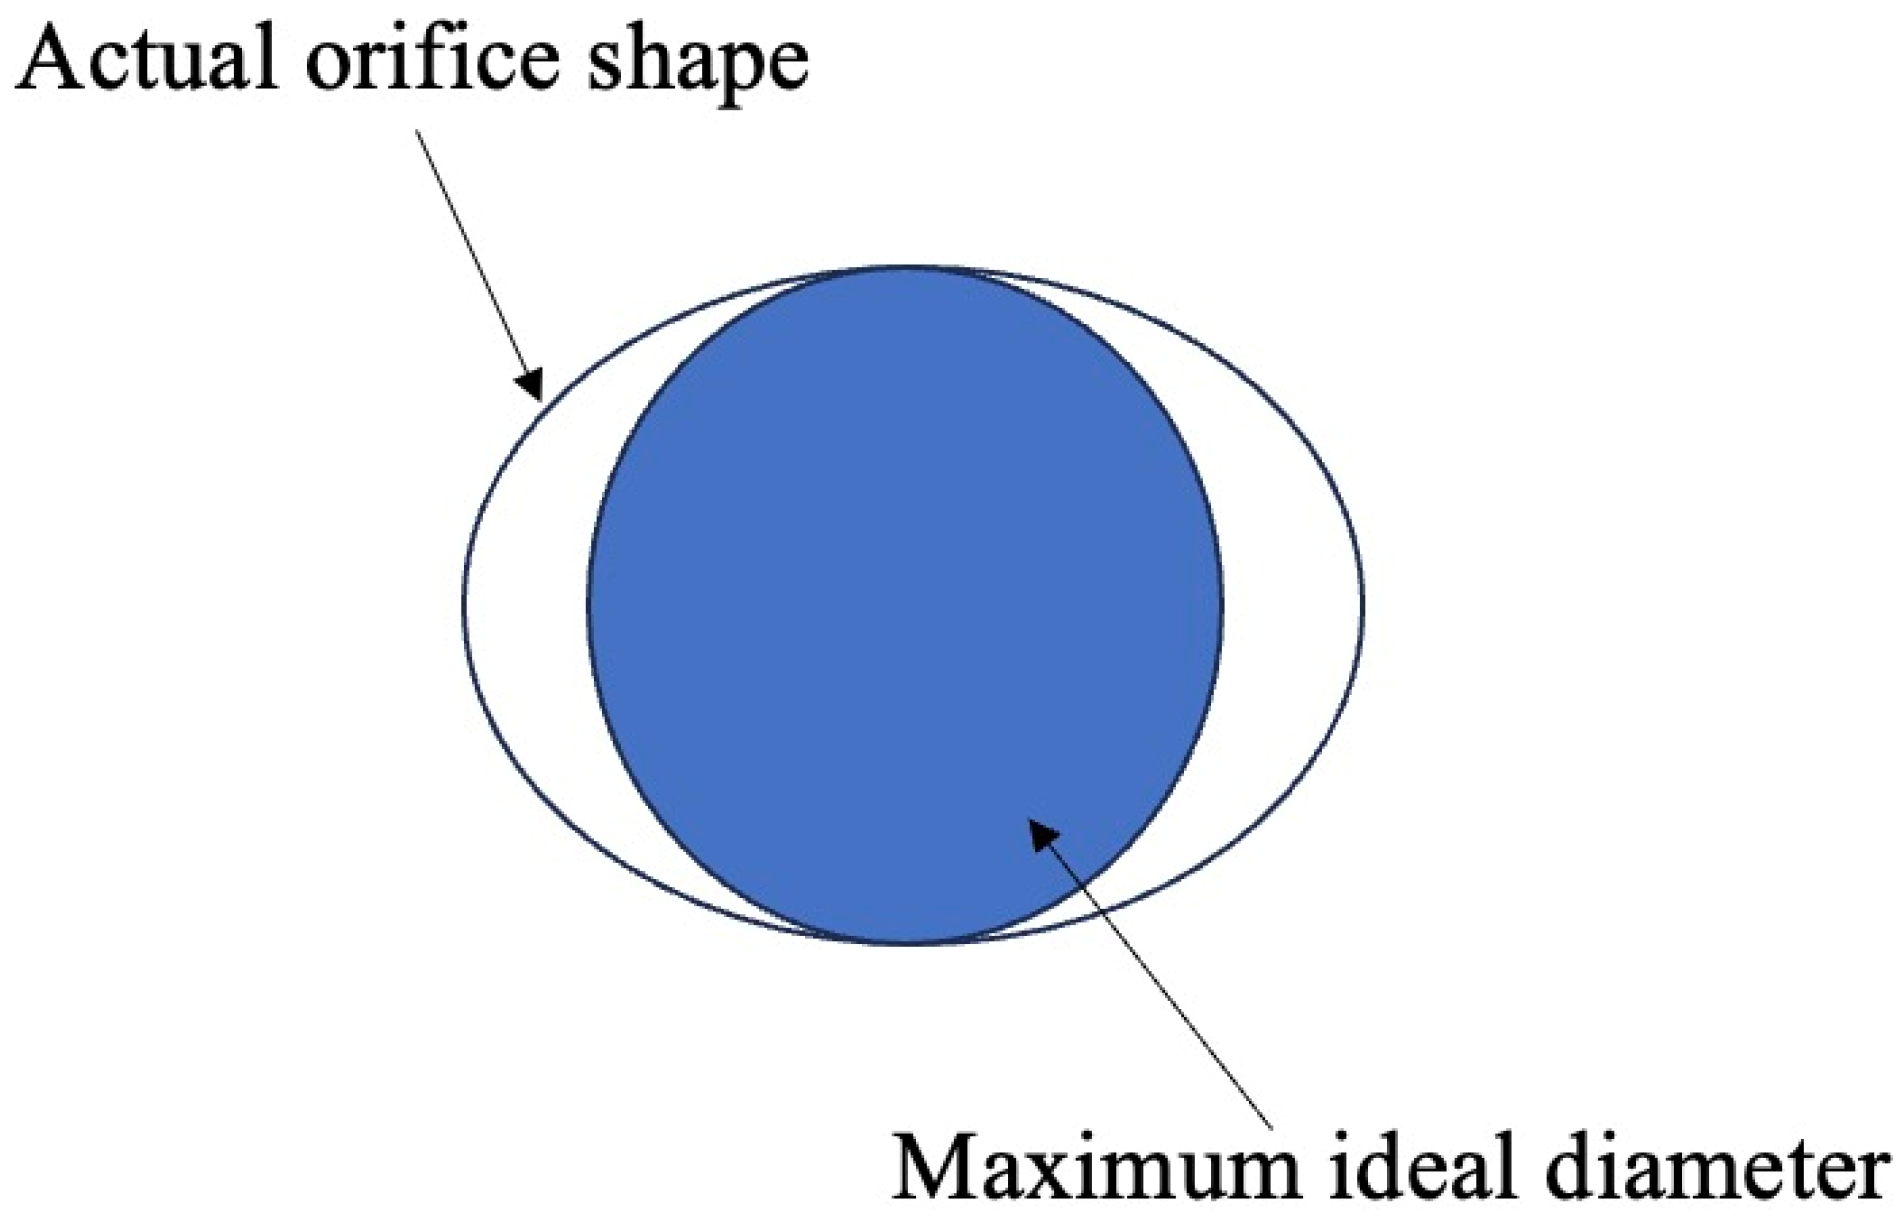
- Hole Diameter: The diameter of hole orifice, with a general tolerance of 0.10 mm.
- Hole Positional Accuracy: the hole geometric position and hole spacing. The geometric position is the coordinate value of the point where the hole's axis intersects the blade profile in the blade coordinate system. The tolerance for position accuracy is generally between 0.10-0.15 mm.
- Orifice Shape: orifice shapes have two main types: circular orifices and shaped orifices.
- Internal Surface Roughness: The surface quality of inner wall is influenced by the manufacturing process. Presently, there are no specific numerical requirements.
- Maximum Thickness of recast layer: thermal manufacturing processes induce thermal effects, forming a recast layer on the hole's inner walls. The thickness of recast layer needs to be controlled. Presently, there are no specific numerical requirements.
- Blind Hole Rate: Design specifications require that the blind hole(blocked hole) rate should be 0%, ensuring that each hole is fully open and functional for proper airflow distribution.
4.2. Cooling Hole Measurement Technology
4.2.1. Traditional Measurement Method
- 8.
- Plug gauge method
- 9.
- Sample Visual Comparison Method
- 10.
- Water Flow Method
4.2.2. Digital Measurement Method
- 11.
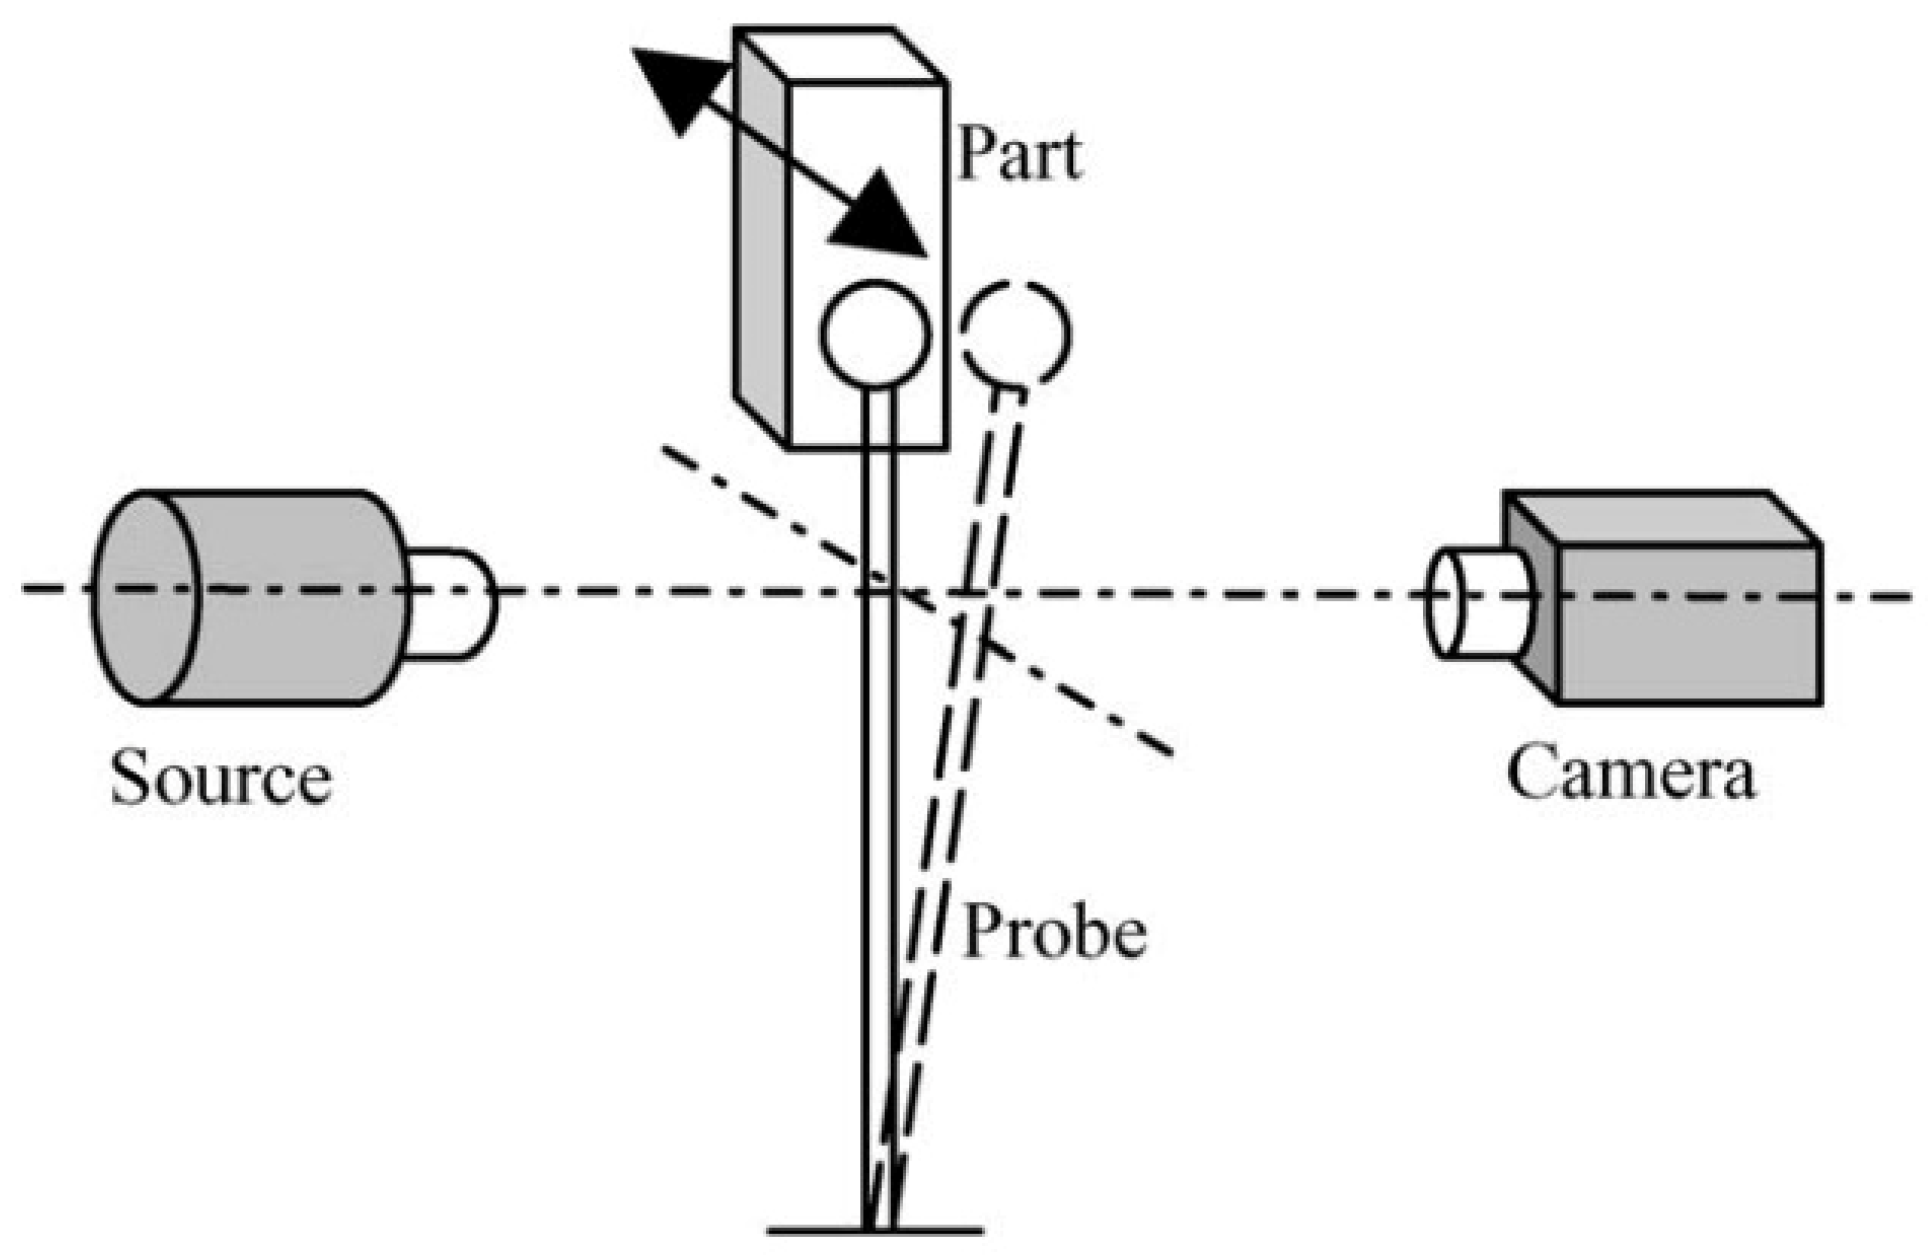
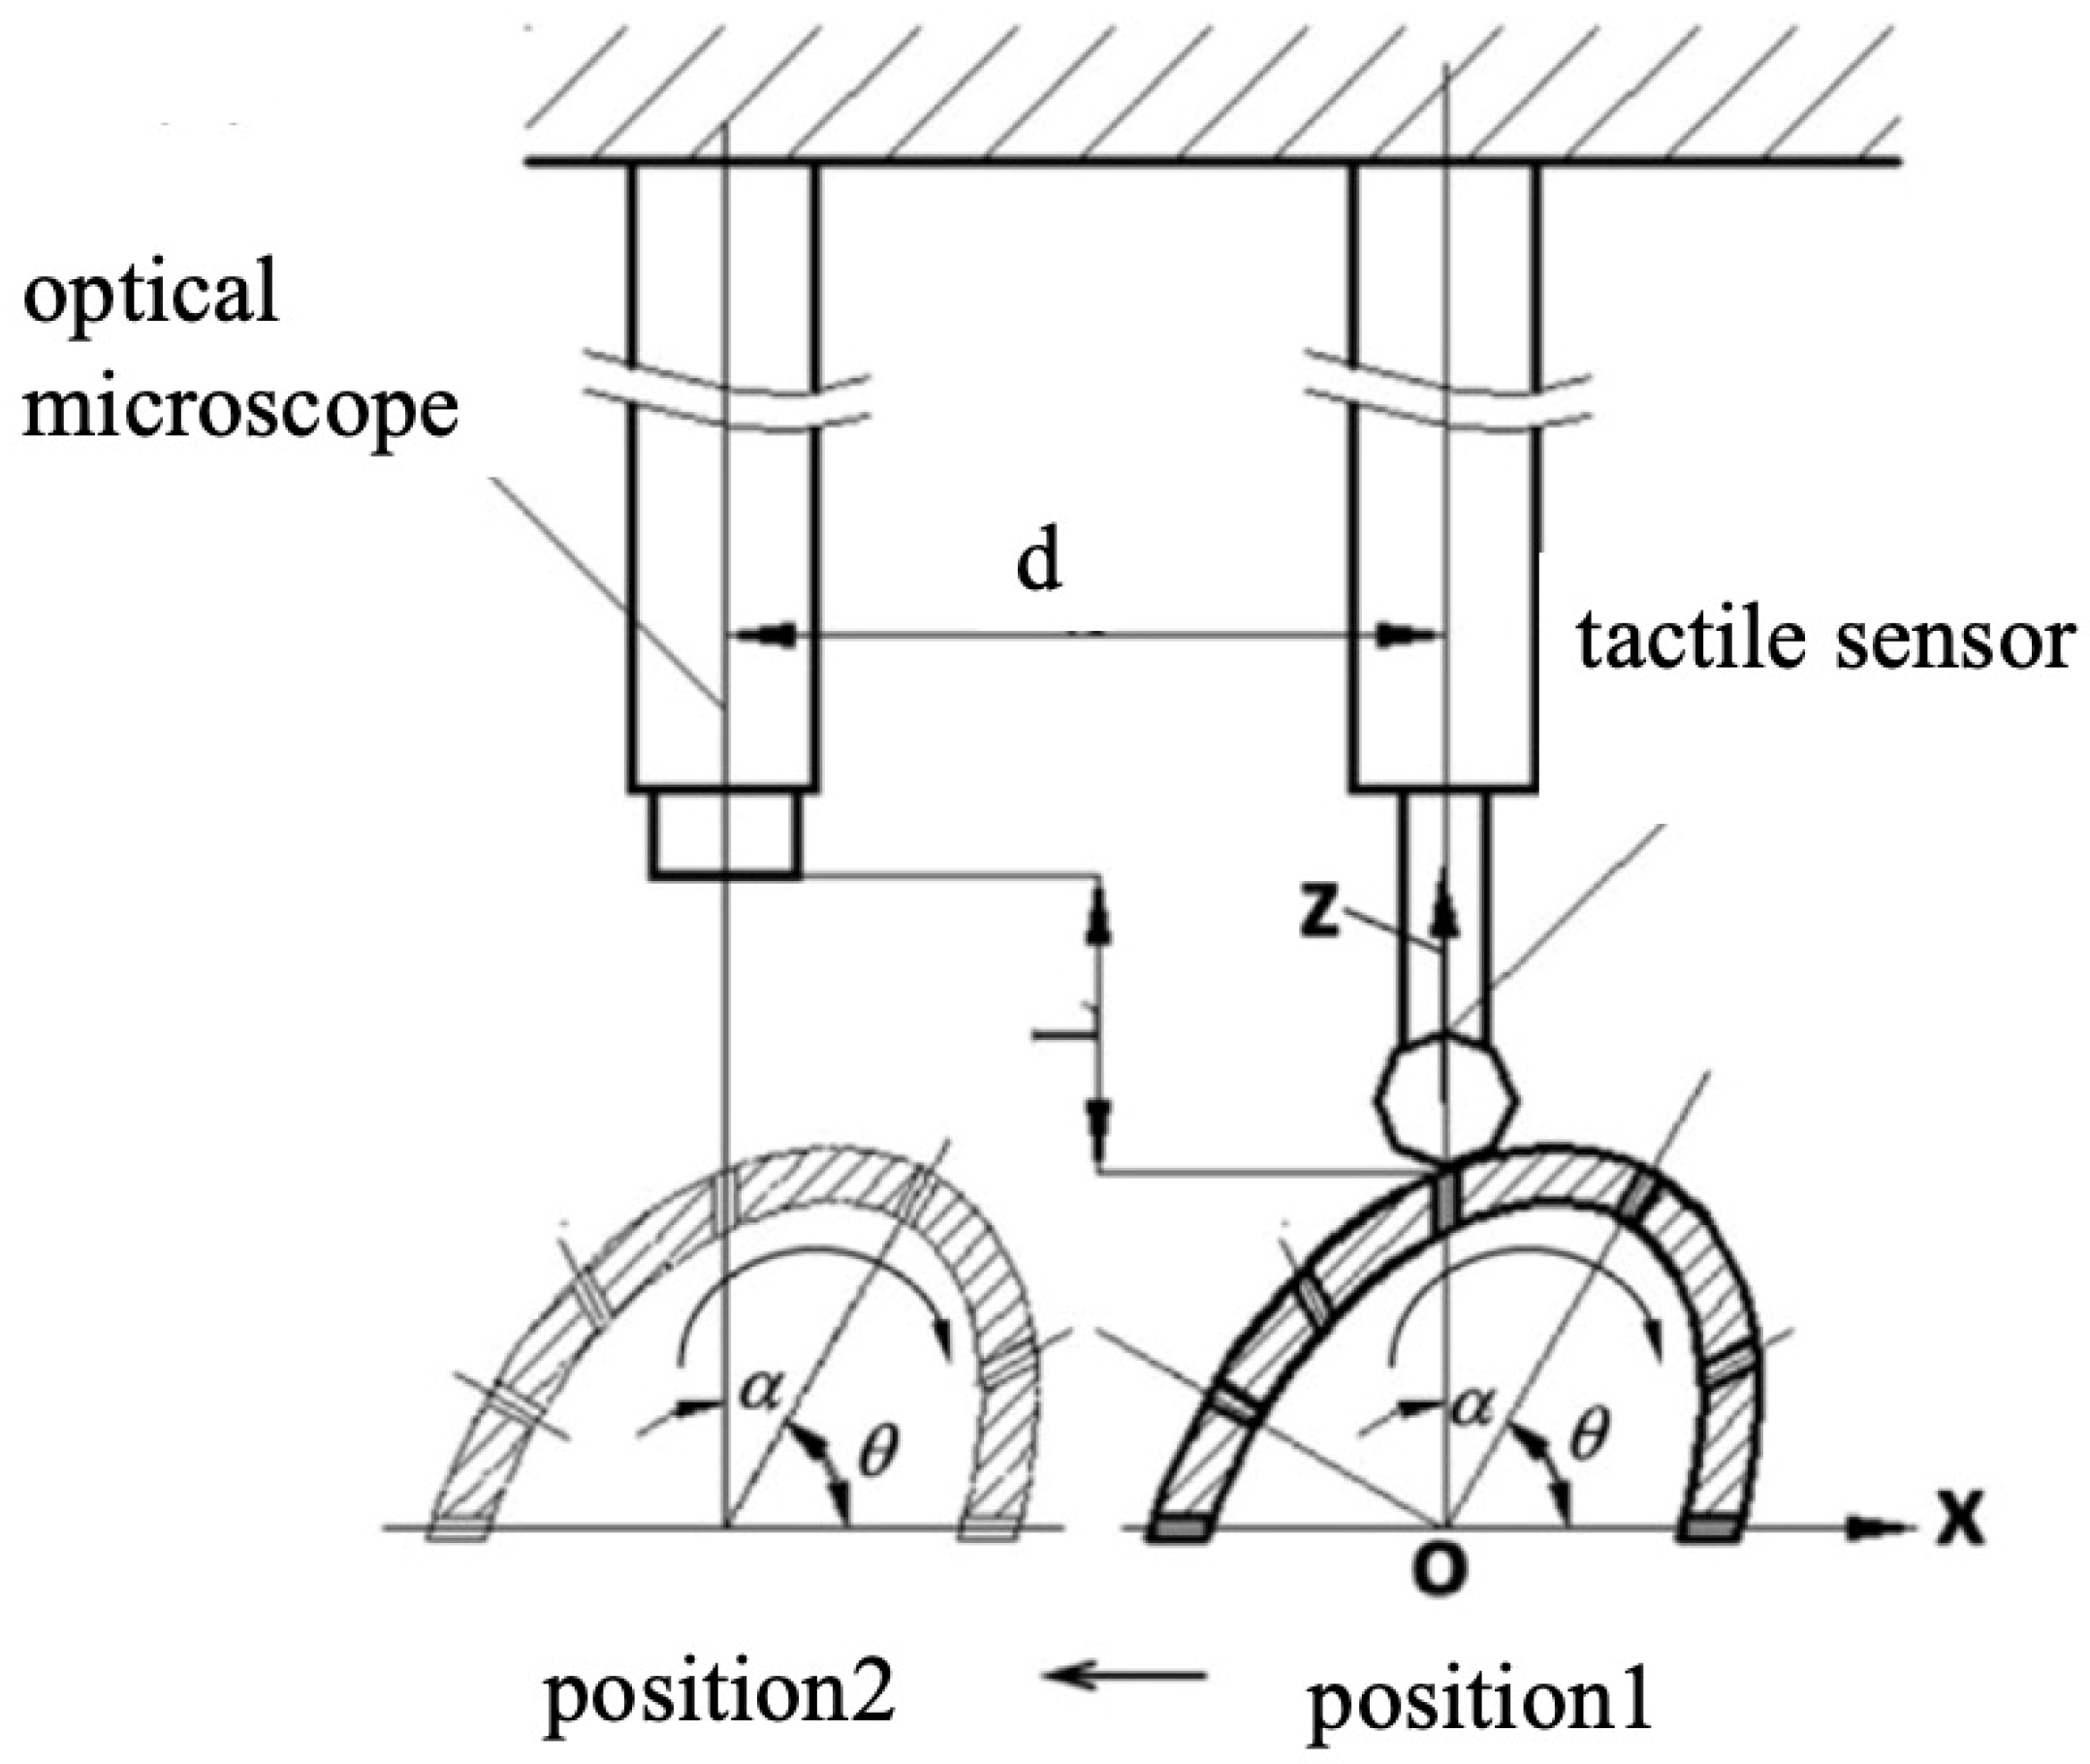
- Probing Measurement Technology
- 12.
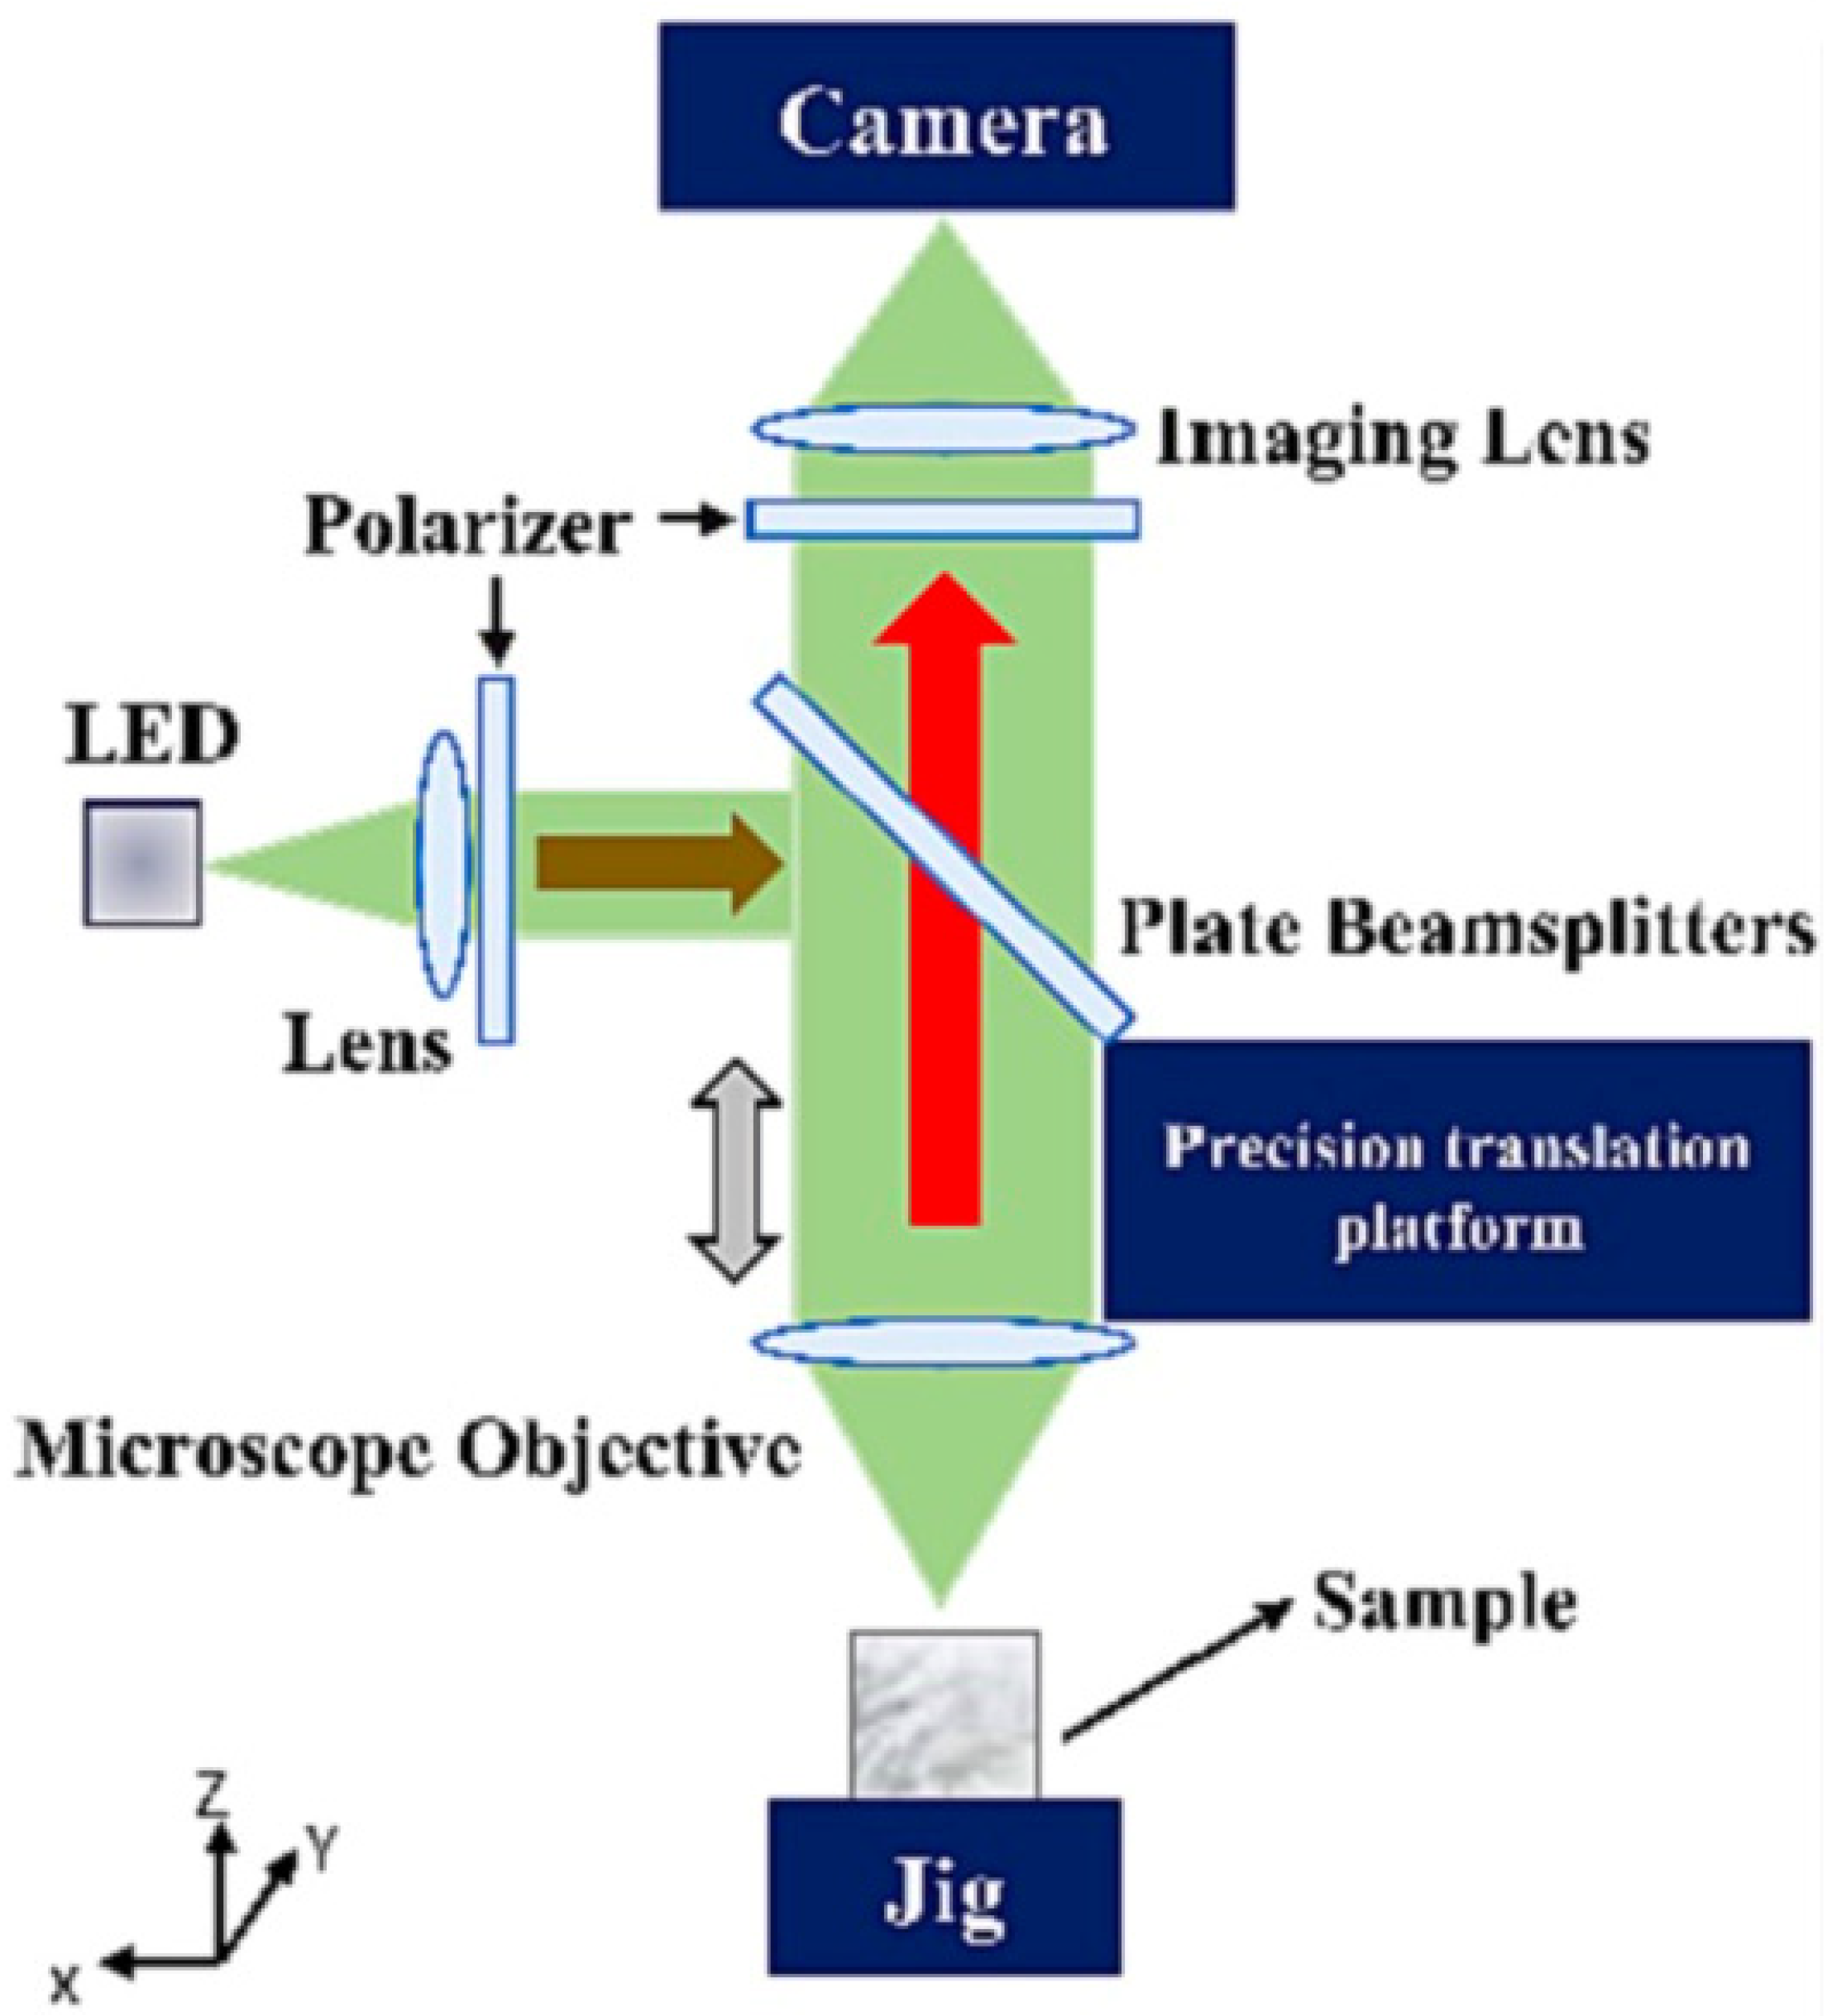
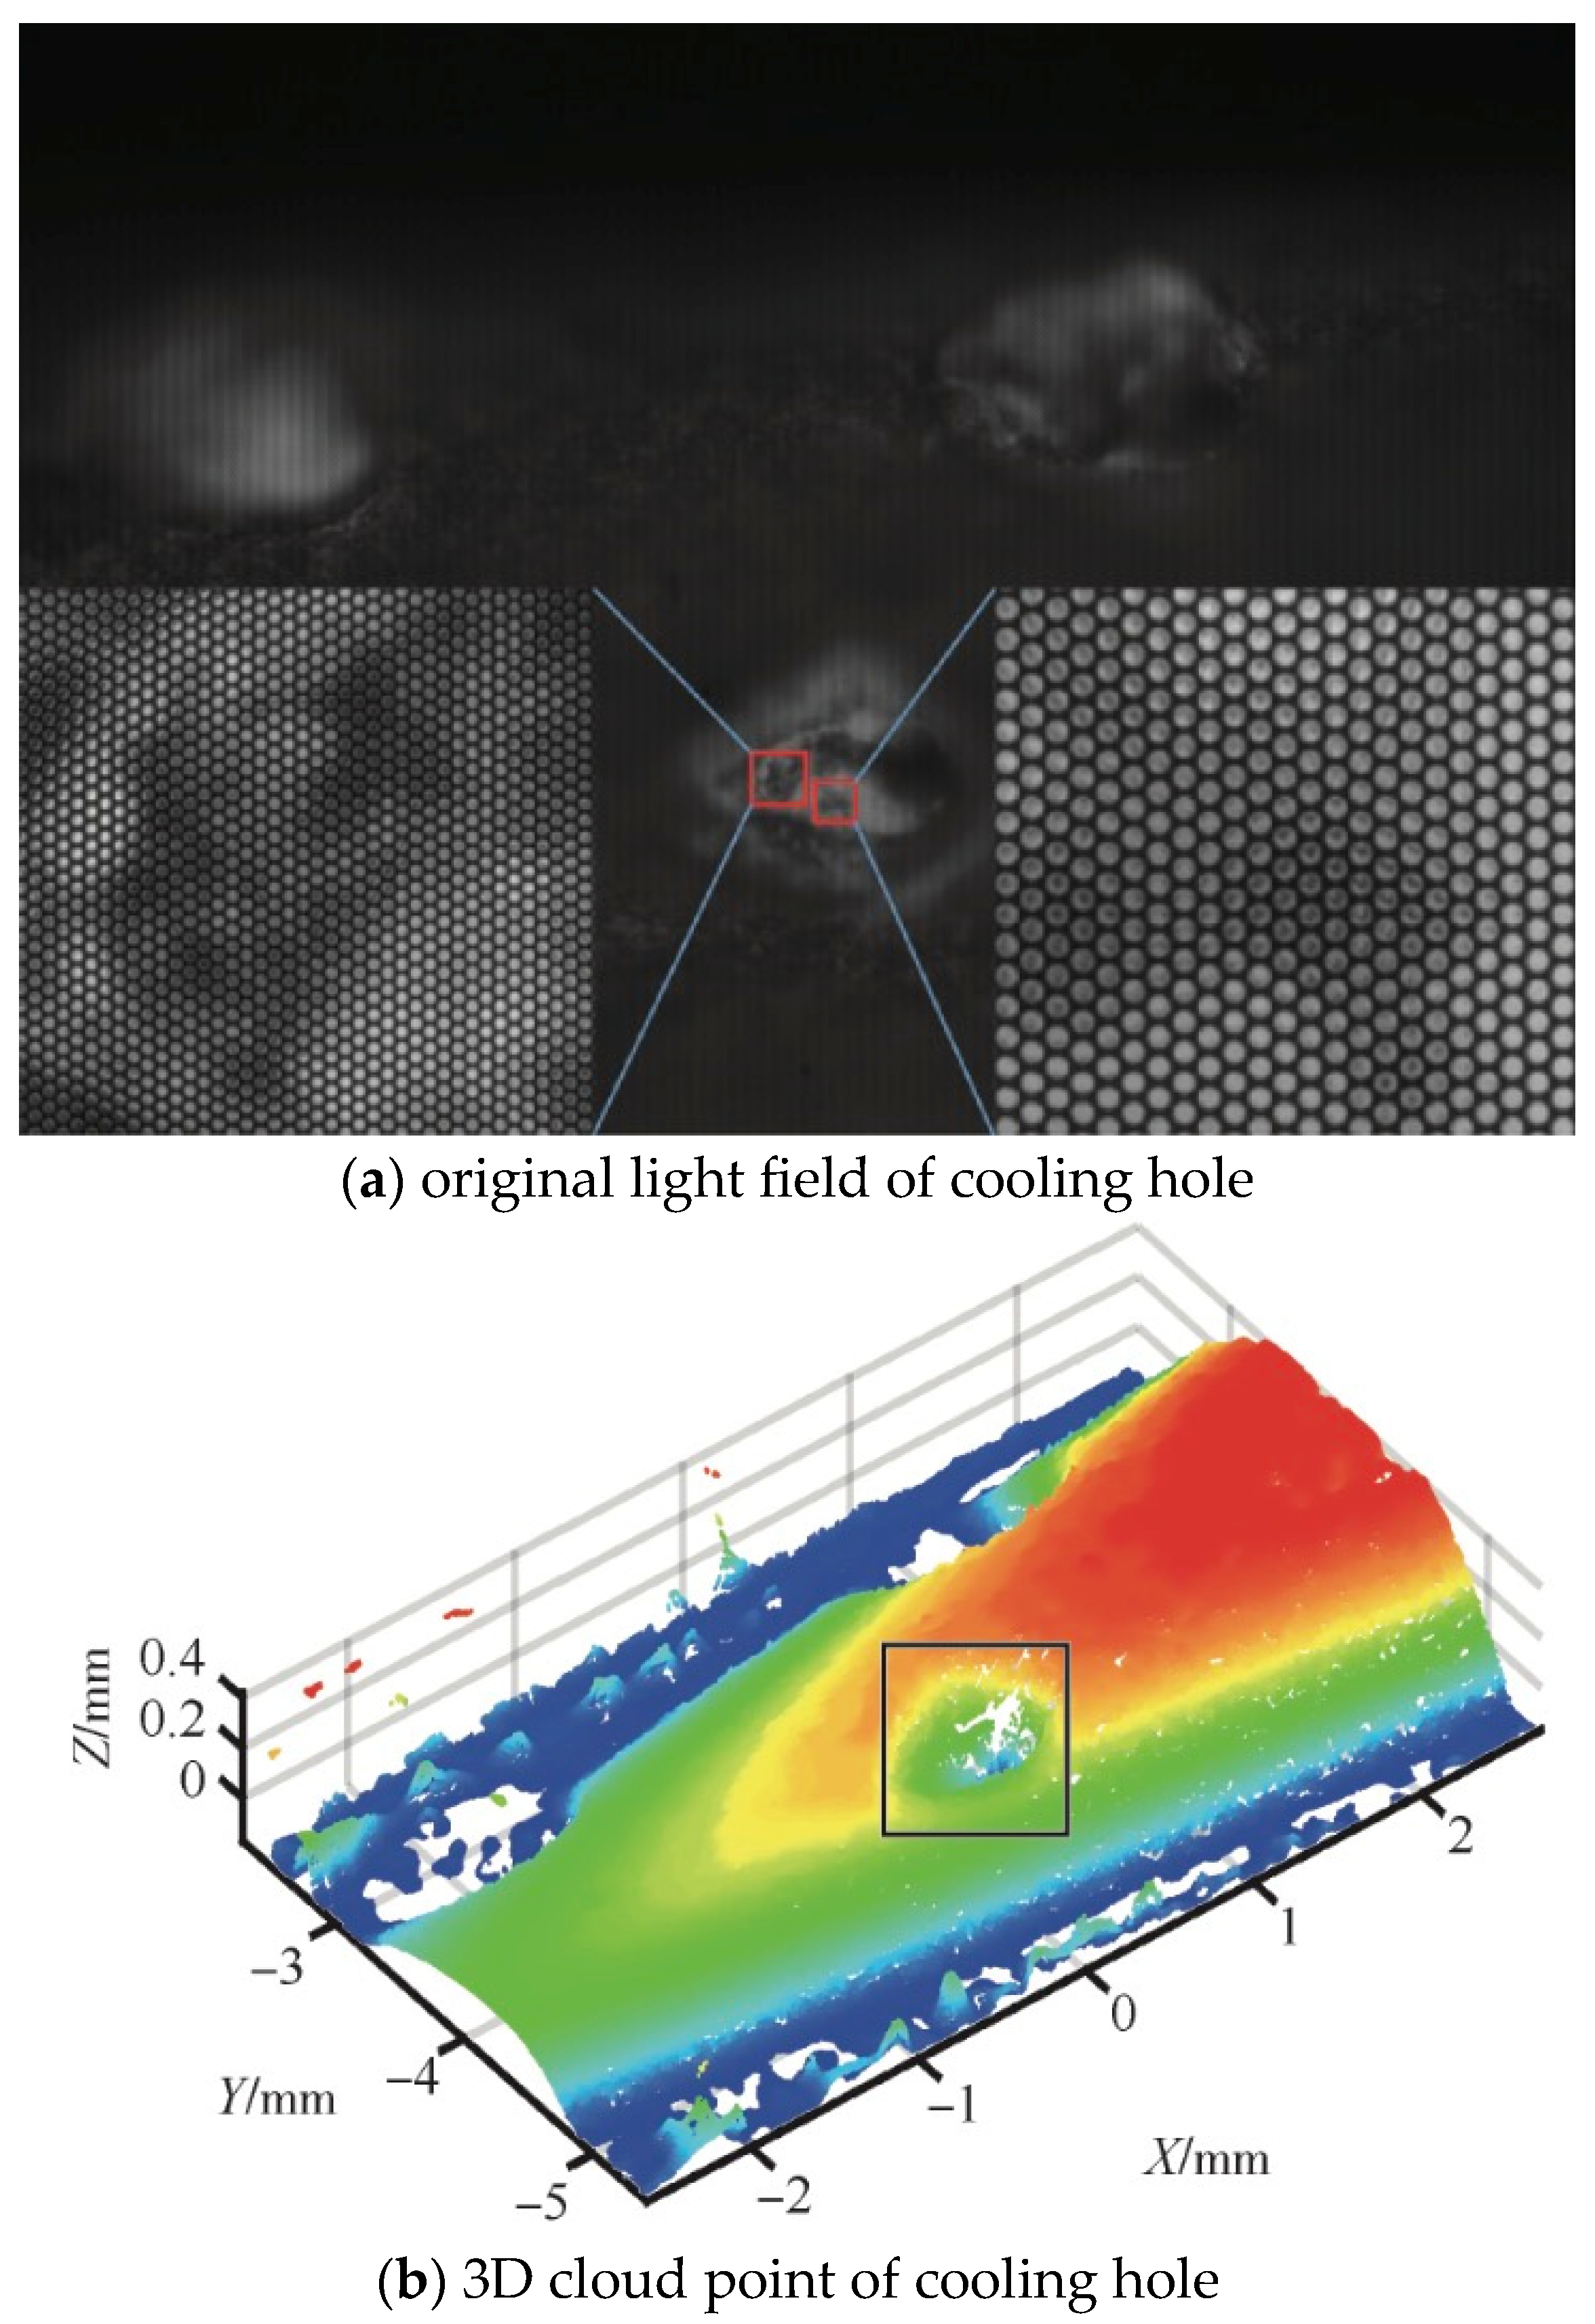
- Optical Measurement Technology
- 13.
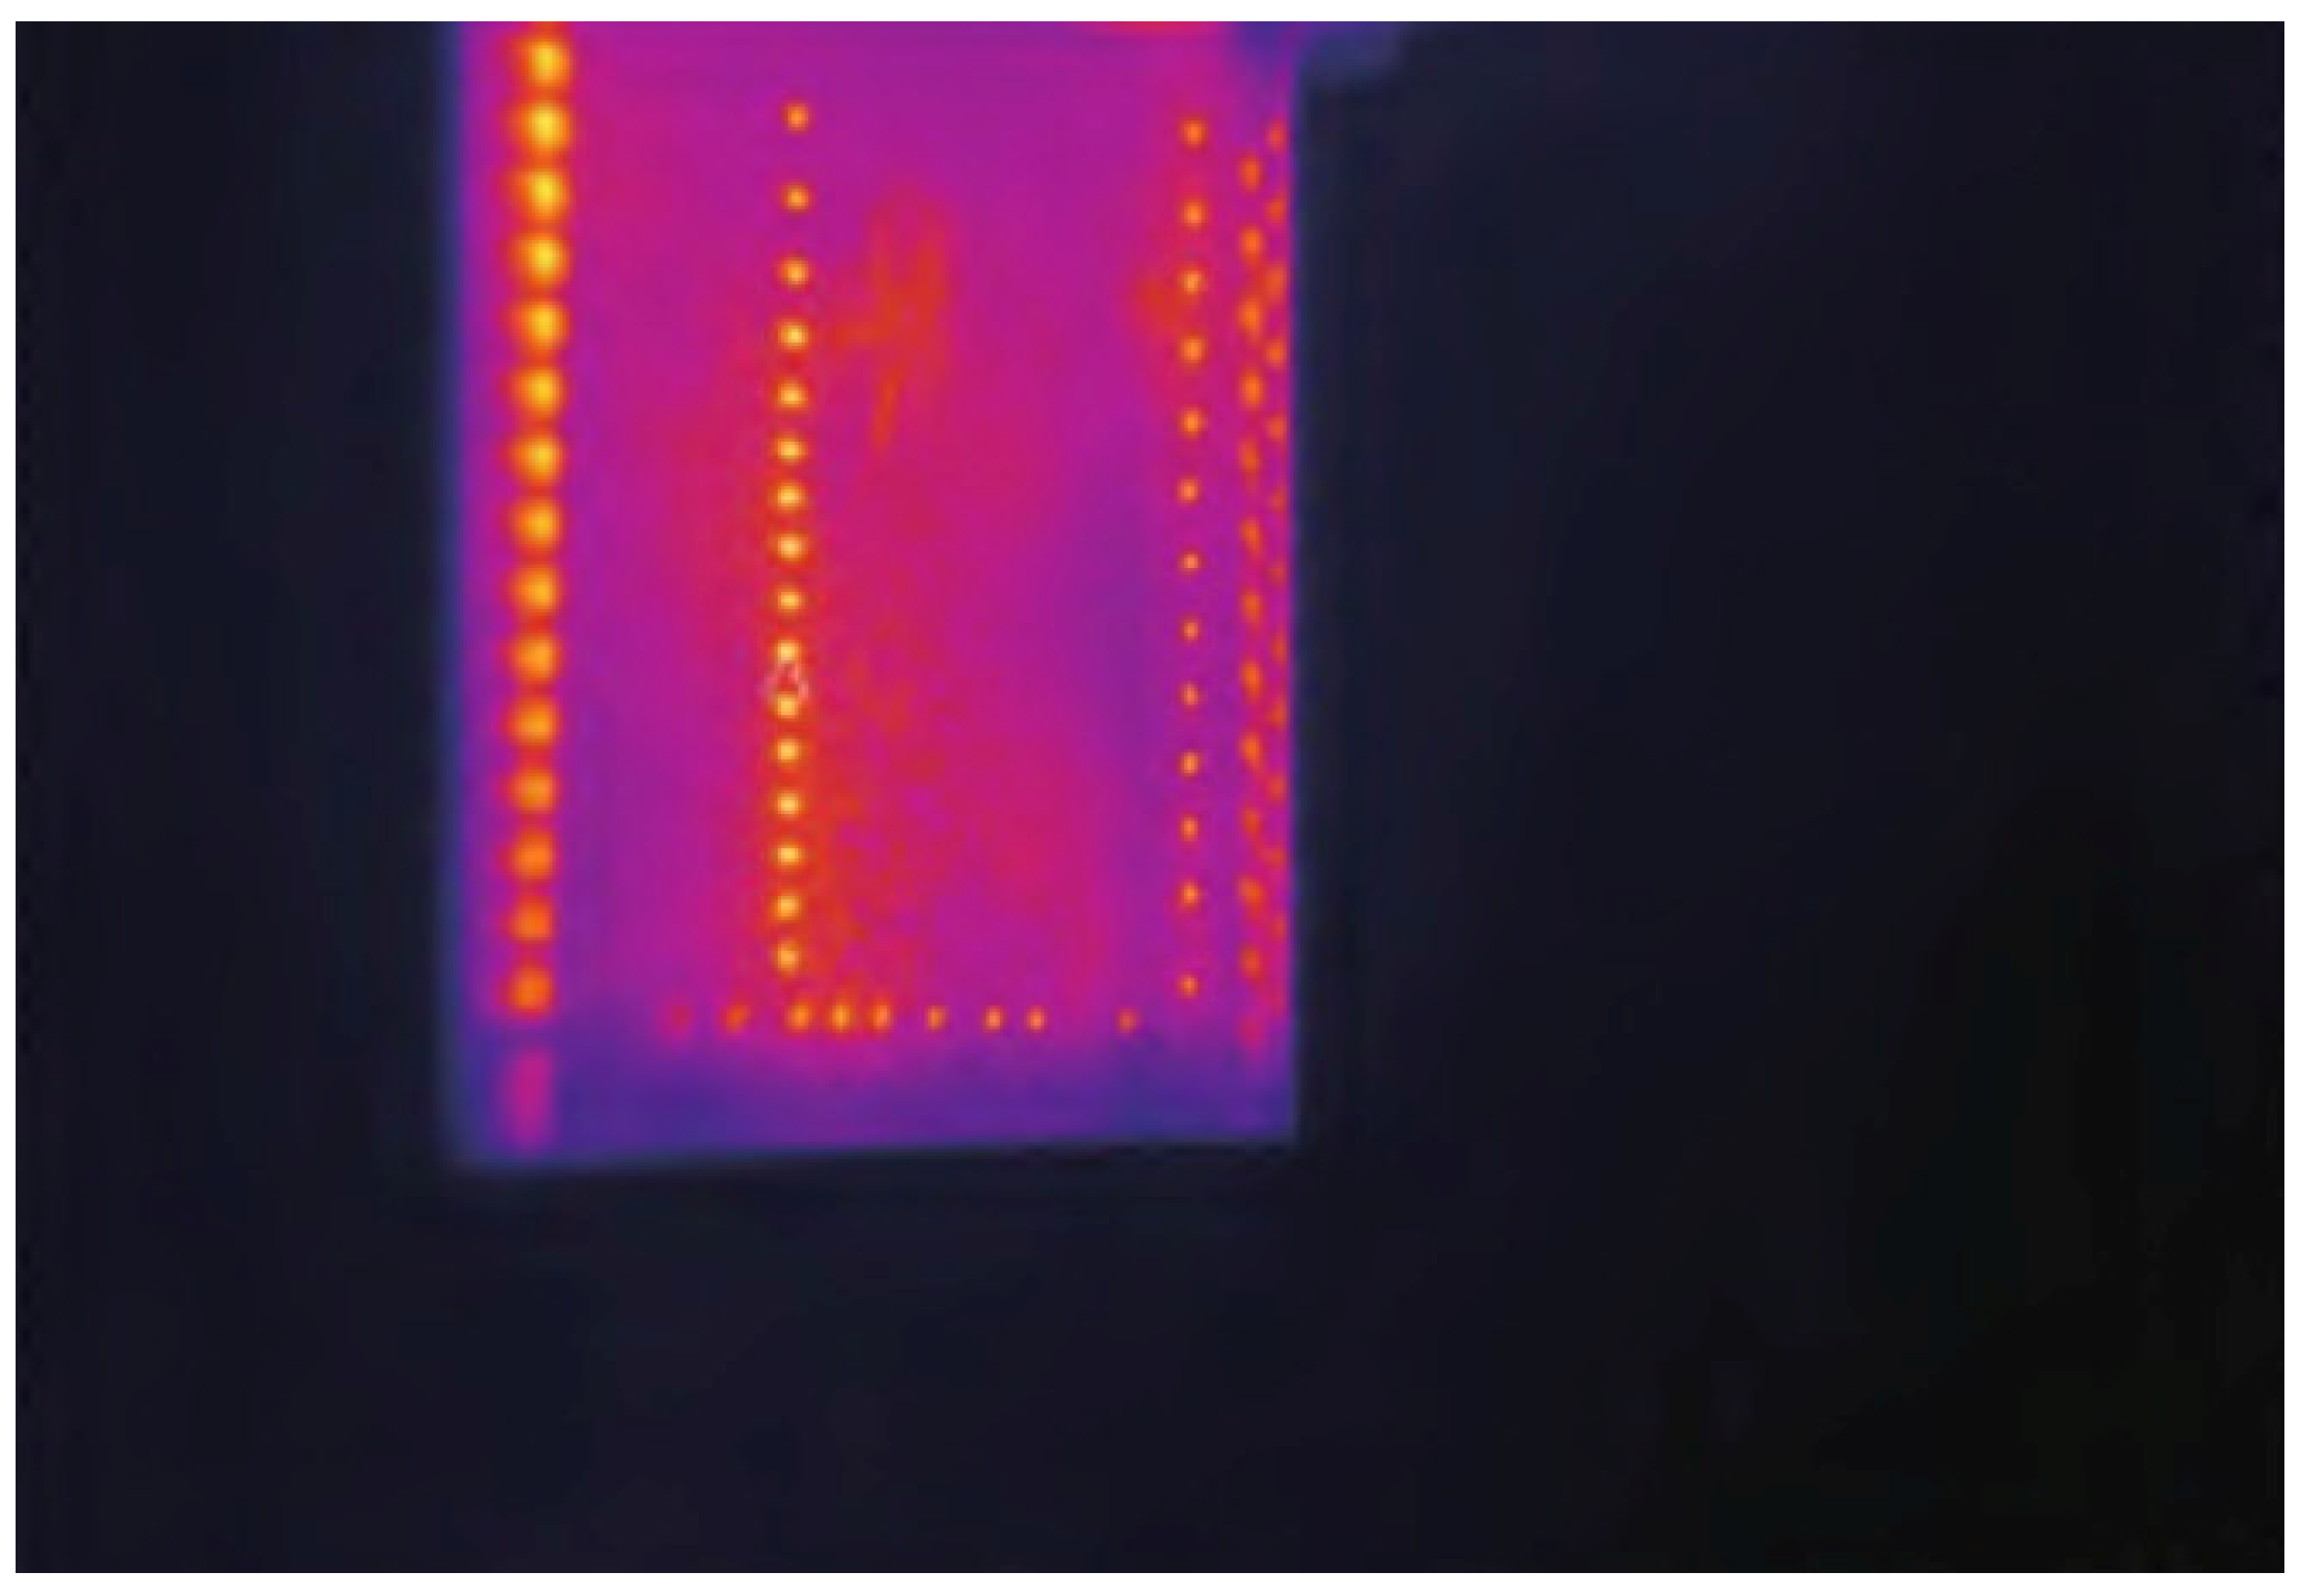
- Infrared Imaging Technology
- 14.
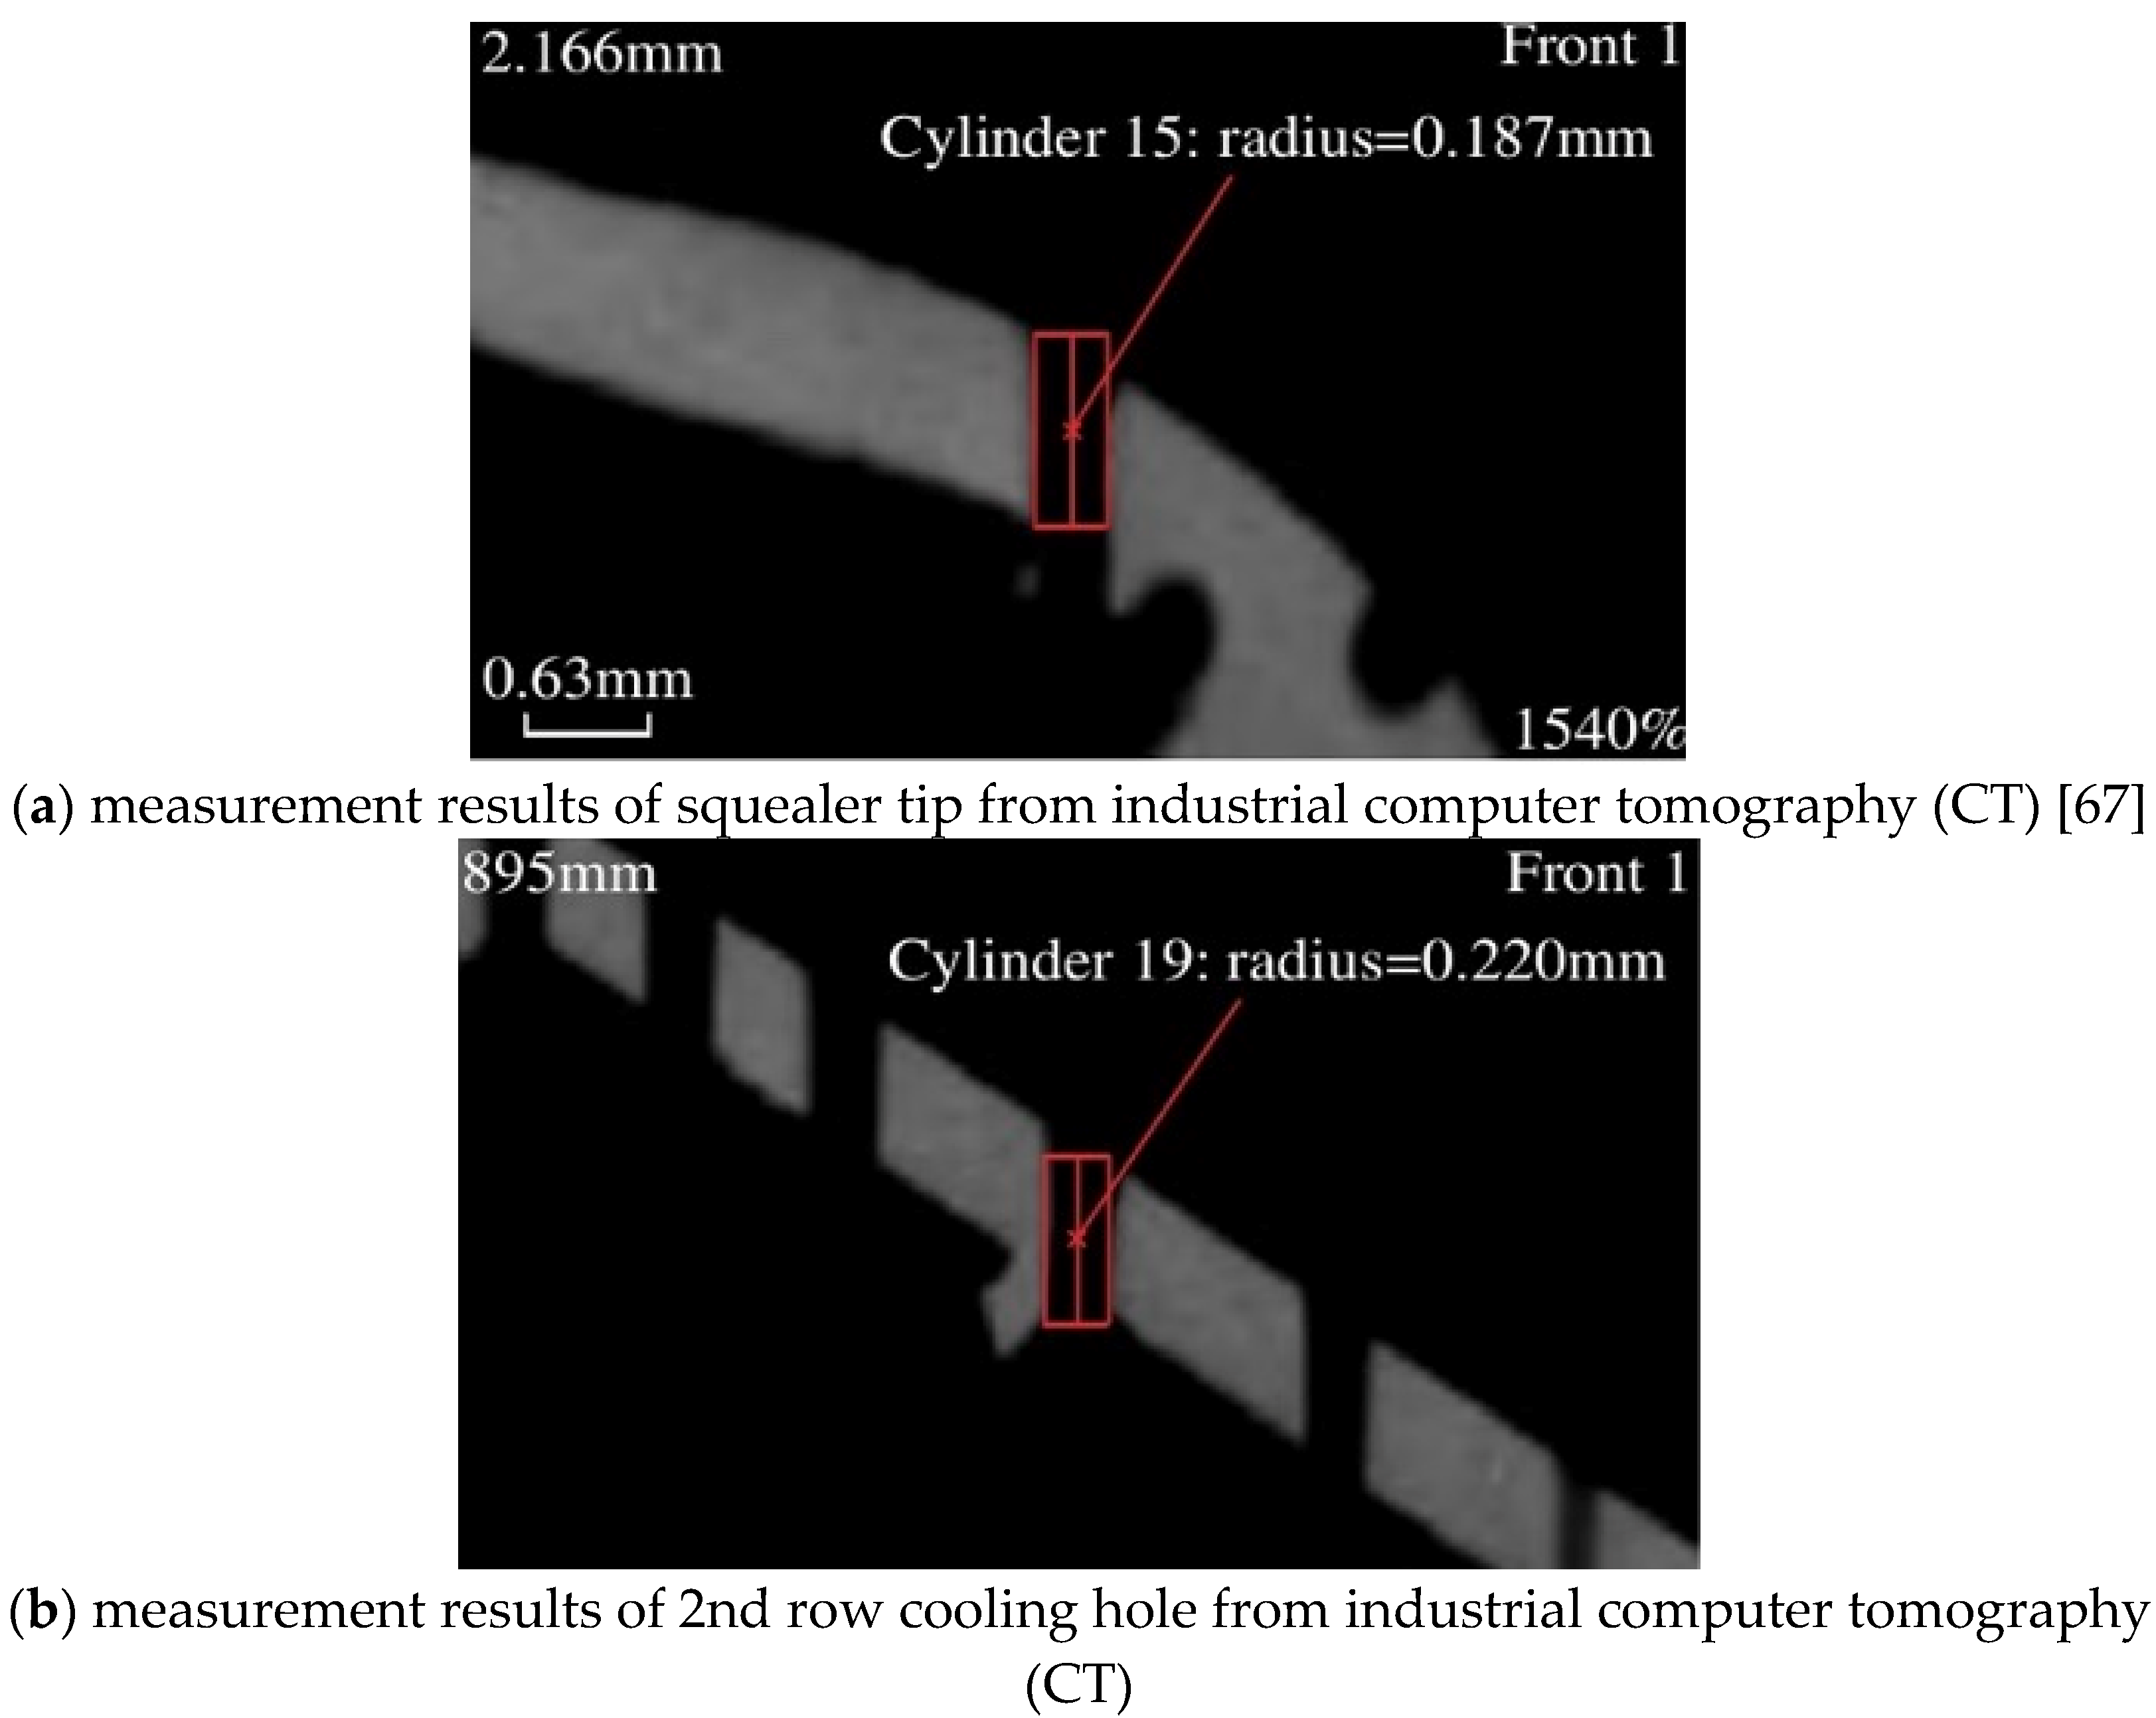
- CT Scanning Technology
- 15.
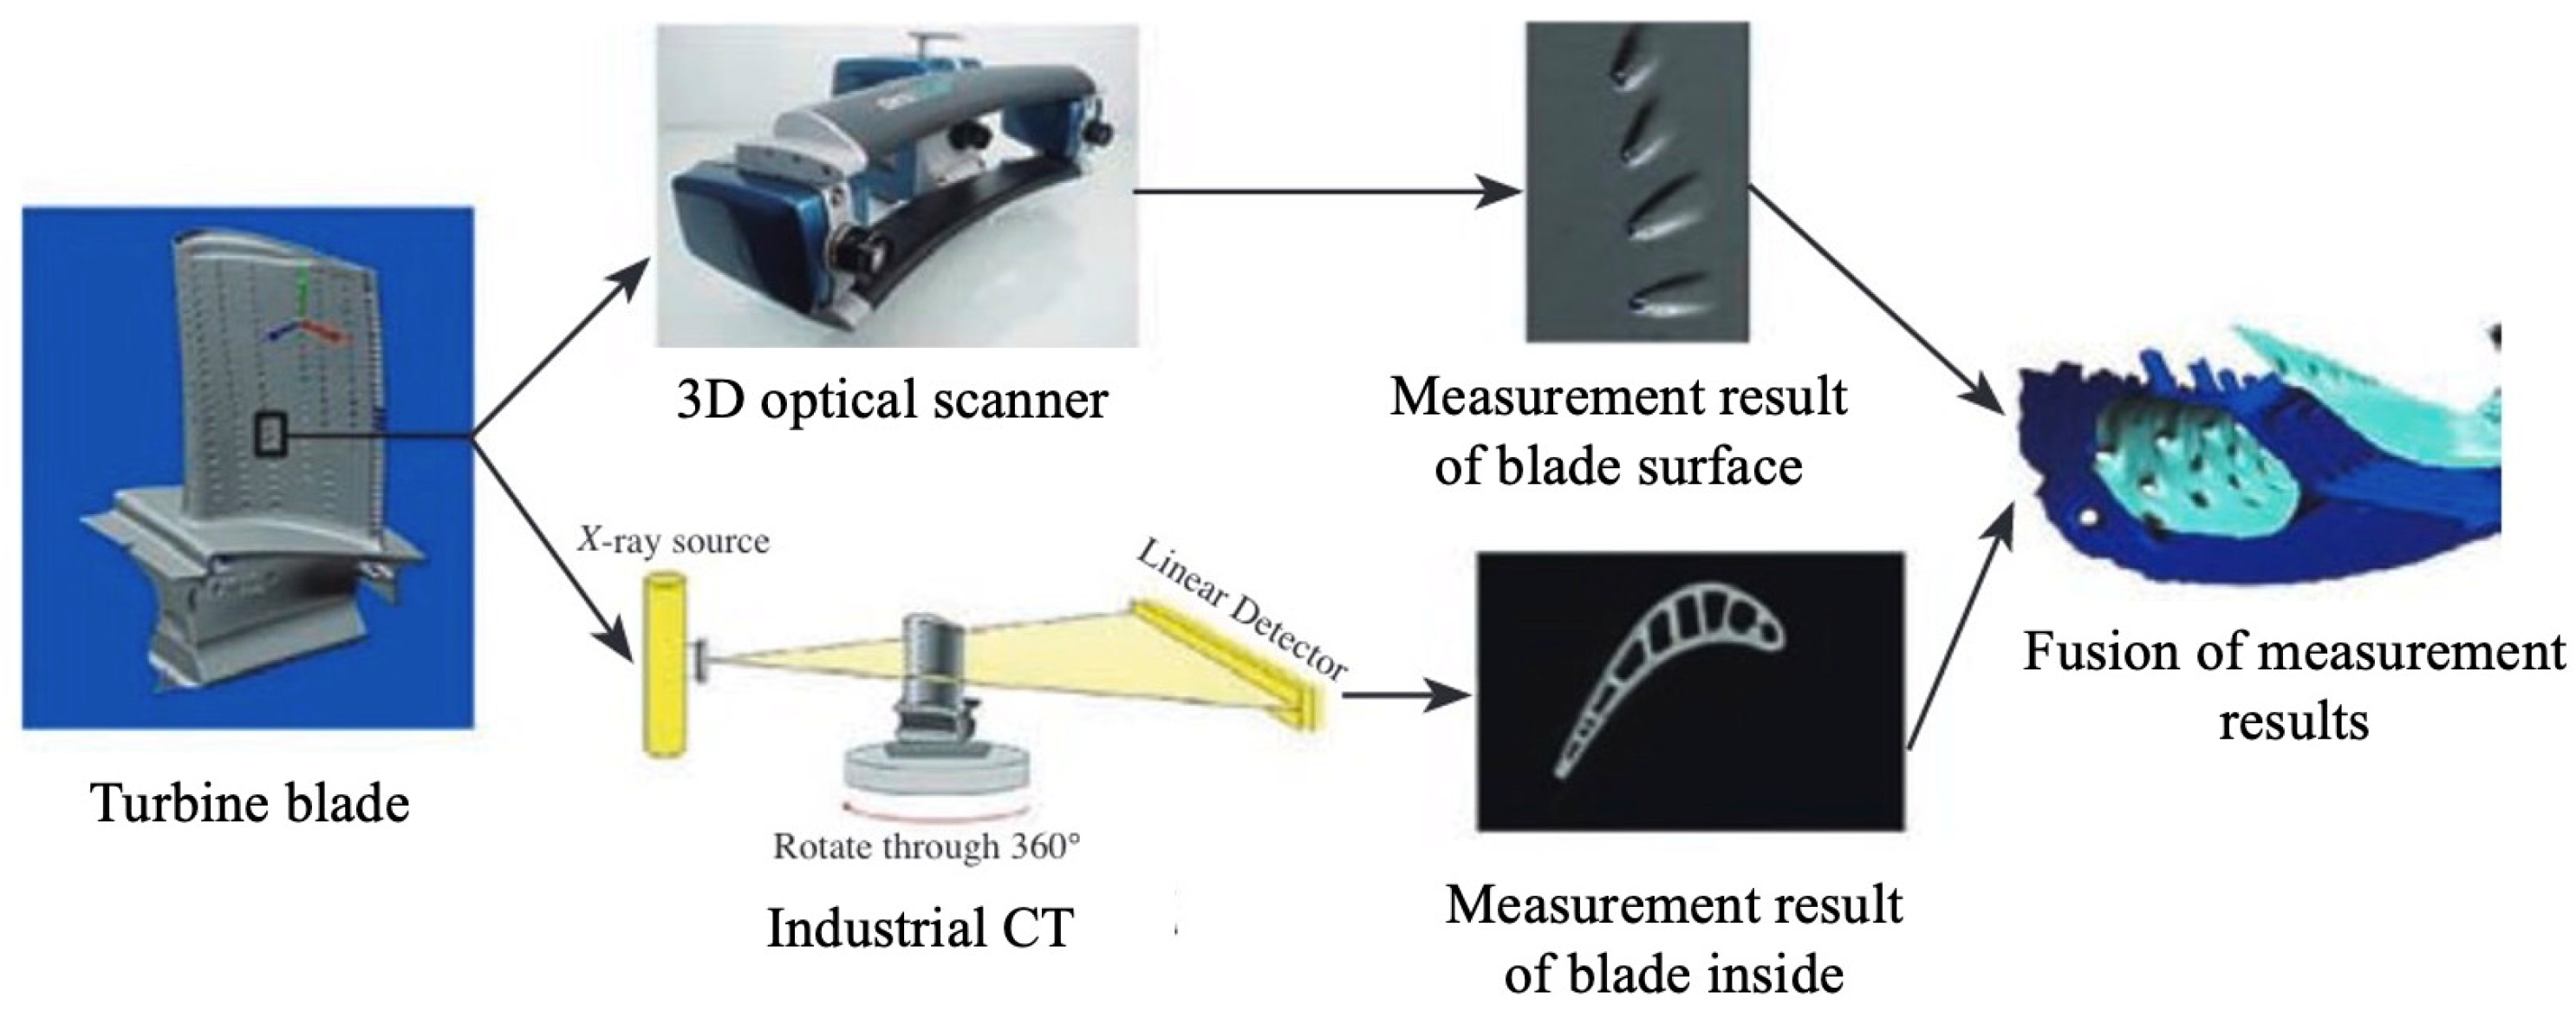
- Composite Measurement Technology
- 16.
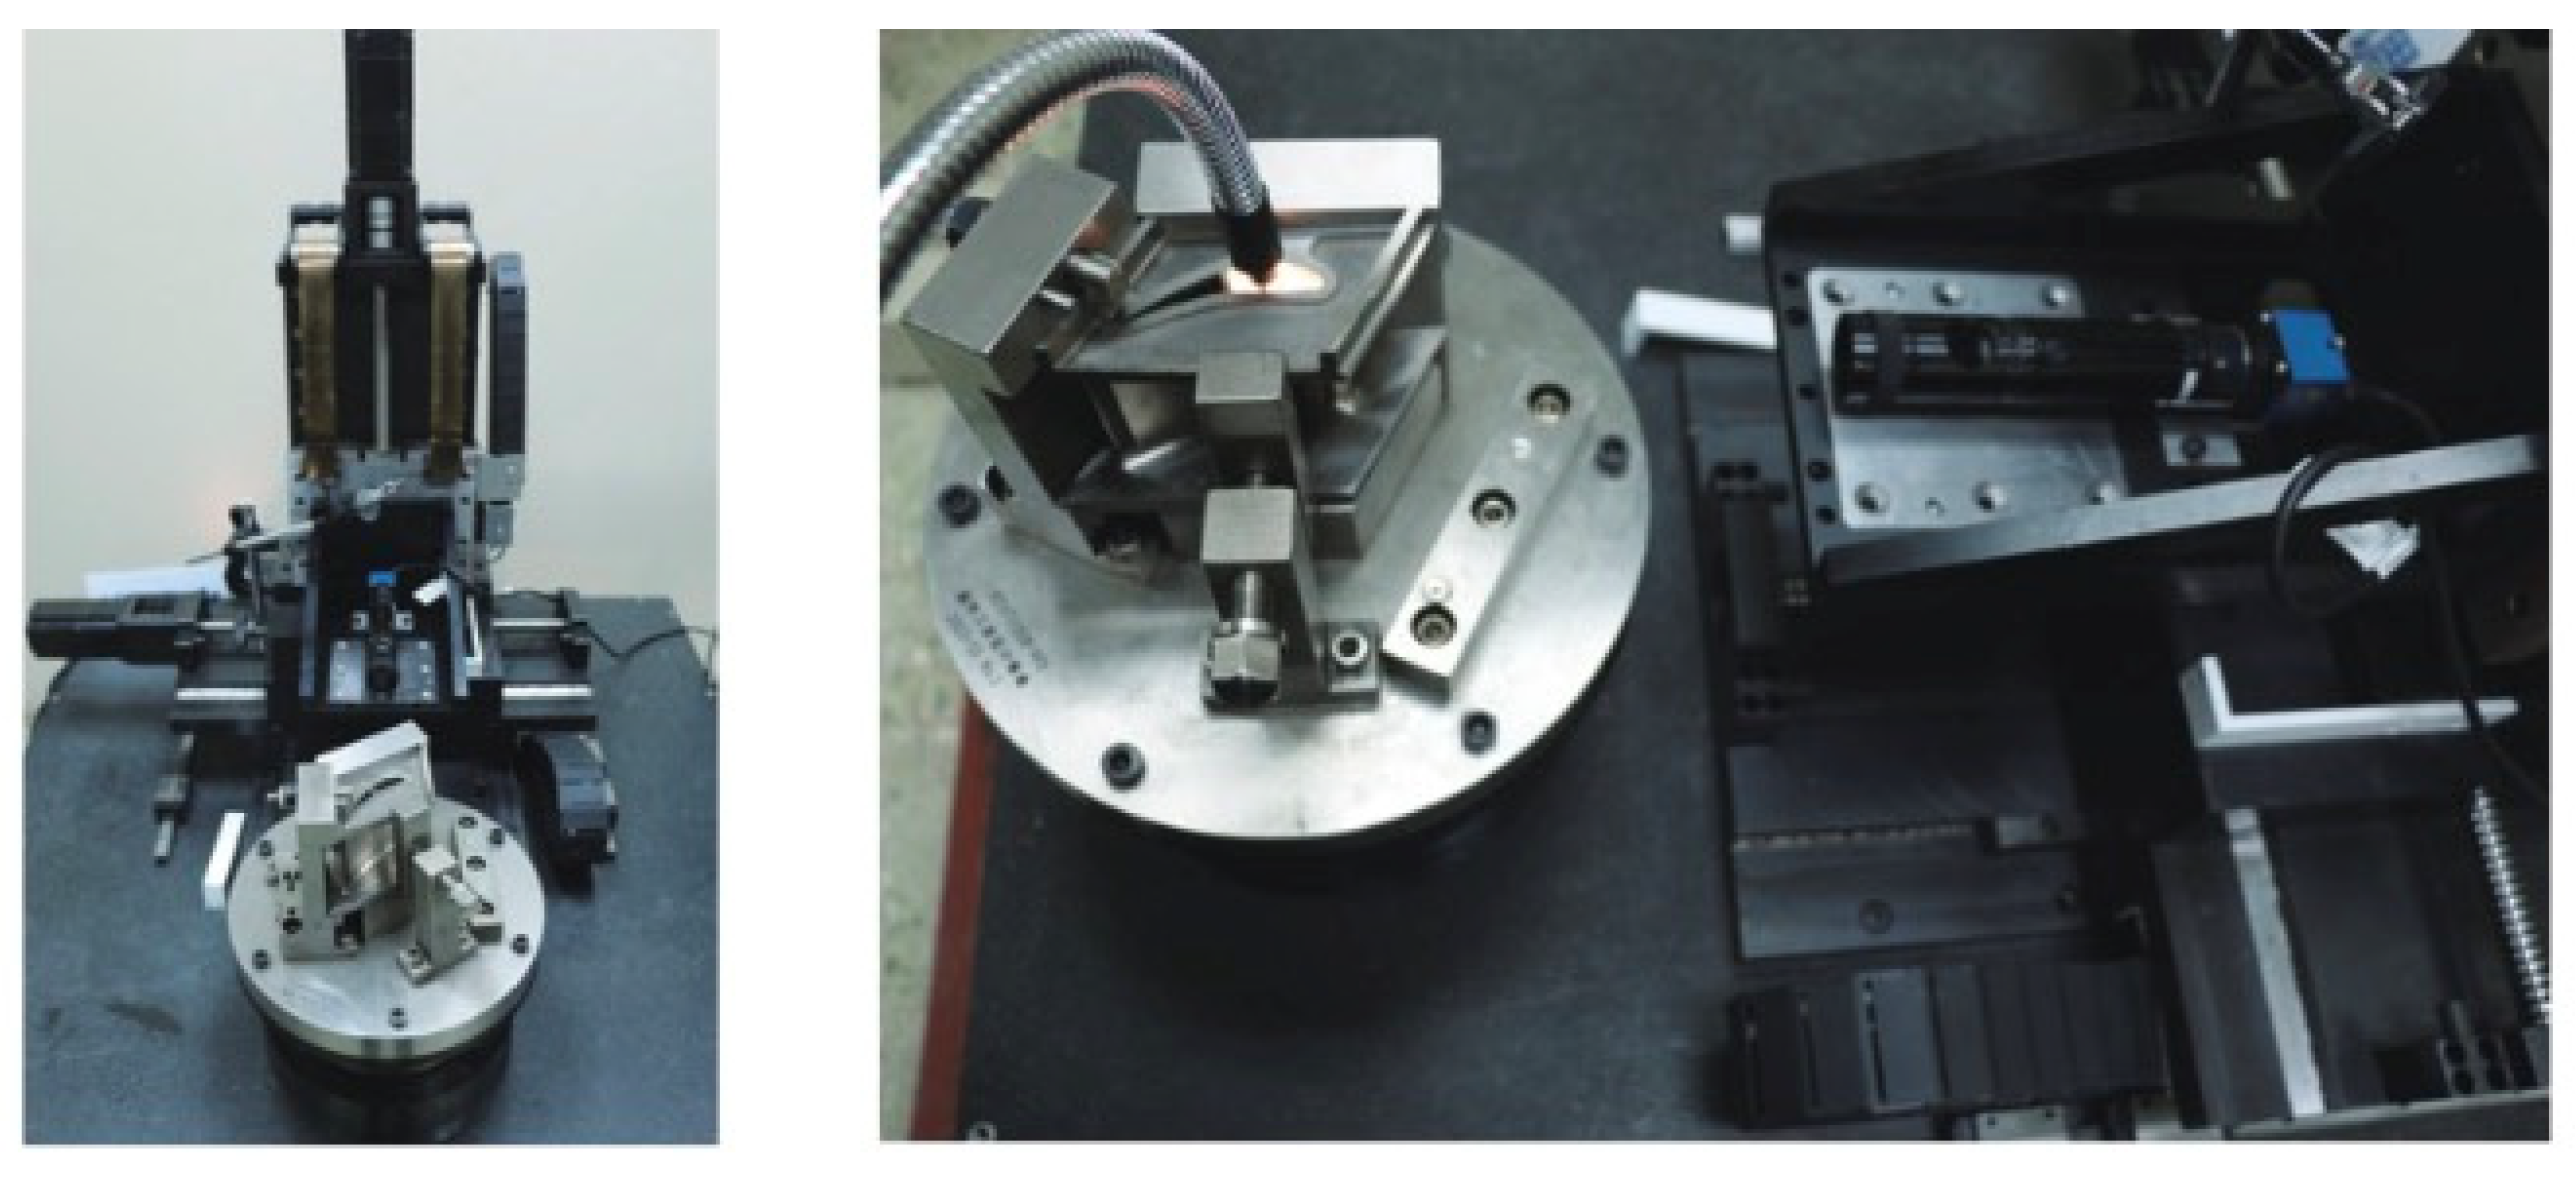
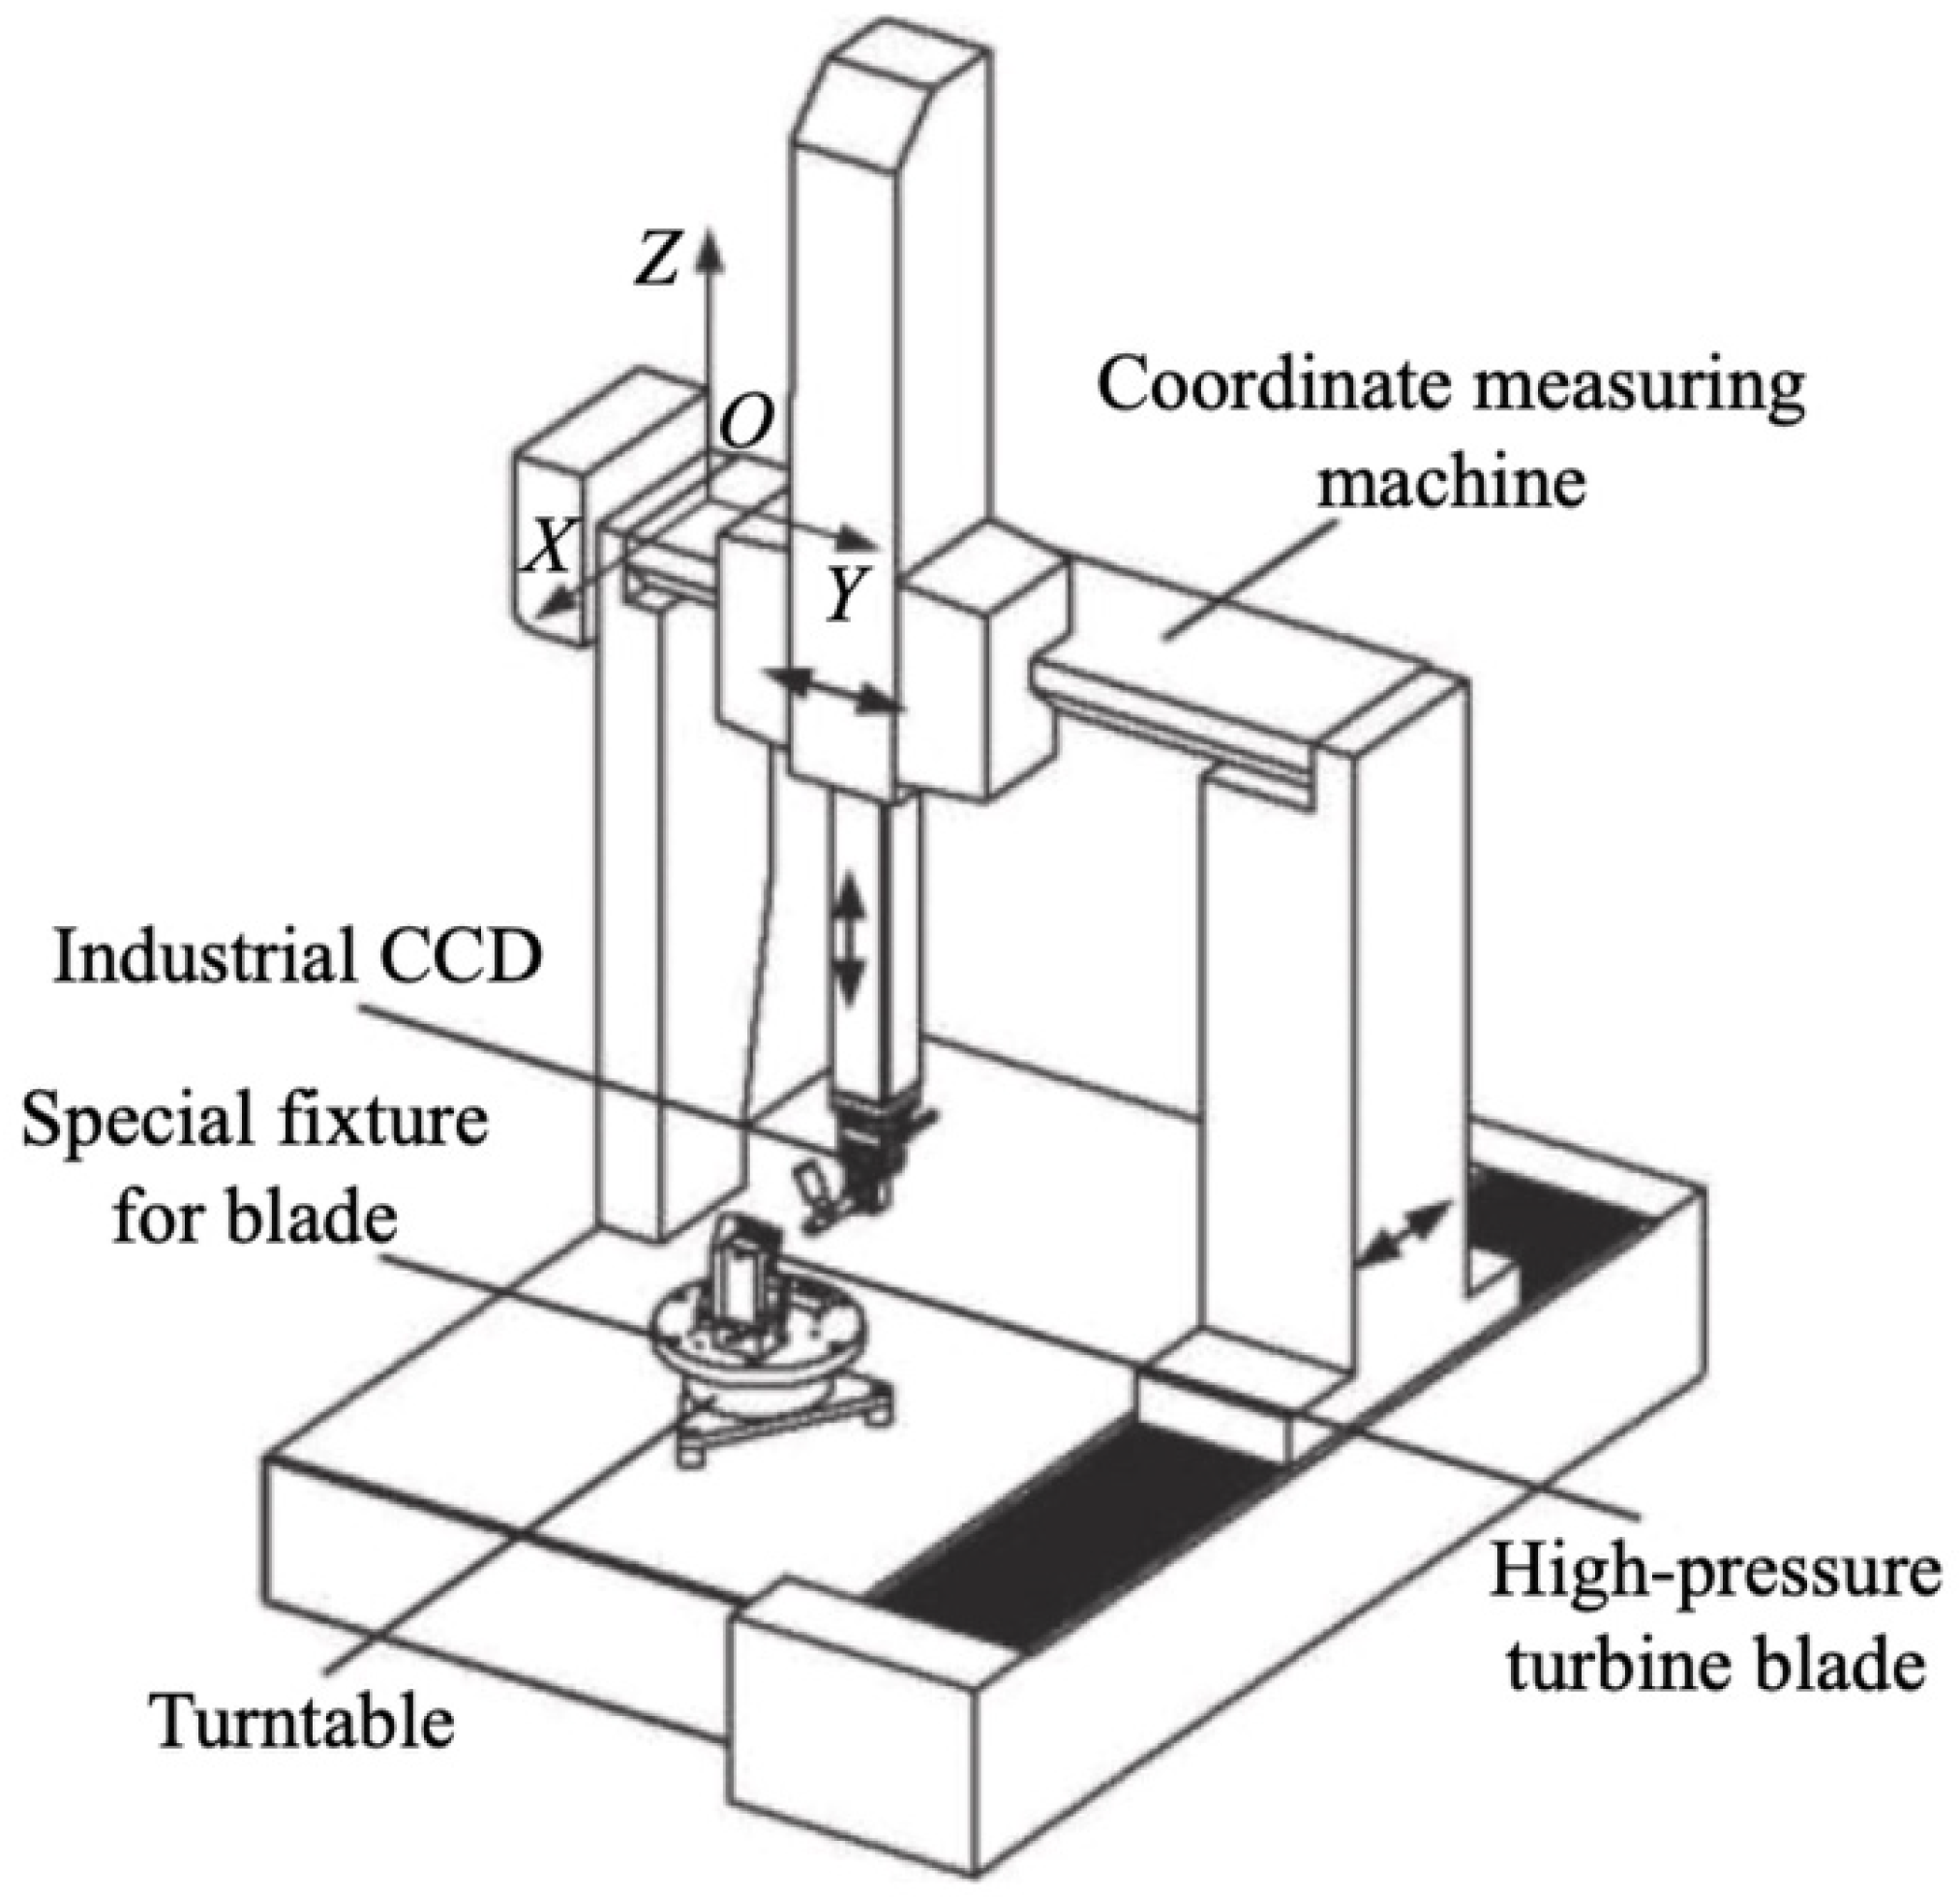
- Automated Measurement Platform
4.3. Difficulties in Application of Digital Measurement Technology for Cooling Hole
- Microscale and Complex Geometries
- Requirements for High Precision and High Resolution
- Standardization and Uniformity
- Time Efficiency
4.4. Shortcoming of Current Measurement Technology for Cooling Hole
- Single Measurement Quality Indicators
- Absence of Digital Measurement Strategy
- Absence of Error Analysis
- Absence of Comprehensive Multi-Hole Measurement
5. Summary and Outlook
- Establishing a Comprehensive Technical Framework for Cooling Hole Measurement
- Optimizing Vision Measurement Methods
- Focusing on Comprehensive Cooling Hole Quality Indicators
- Analyzing and Assessing Errors in Cooling Hole Measurement Systems
Author Contributions
Funding
Institutional Review Board Statement
Informed Consent Statement
Data Availability Statement
Conflicts of Interest
References
- Han, J.C.; Dutta, S.; Ekkad, S. Gas Turbine Heat Transfer and Cooling Technology, 2nd ed.; CRC Press: Boca Raton, FL, USA, 2012; pp. 1–27. [Google Scholar]
- Liu, J.Y.; Quan, Y.K.; Xu, G.Q.; Chai, J.M.; Yin, Q.Y.; Liu, J.S. Research Progress on Phosphor Thermometry Technology for Aero Engine Hot Section Components. J. Aerosp. Power 2023, 38, 2861–2871. [Google Scholar] [CrossRef]
- Ding, S.T.; Liu, C.K.; Qiu, T.; Li, G. A Combined Cycle Method of Primary and Secondary Flows in Turbine Engines. CN111237085B, May 14, 2021.
- Chen, R.Z., Wang, L.B., Li, J.H. Review and Prospect of the Development of Casting Superalloys. J. Aeronaut. Mater 2000, 01, 55–61.
- Cumpsty, N. A. Jet Propulsion: A Simple Guide to the Aerodynamic and Thermodynamic Design and Performance of Jet Engines 1997.
- Unnikrishnan, U.; Yang, V. A Review of Cooling Technologies for High Temperature Rotating Components in Gas Turbine. Propuls. Power Res 2022, 11, 293–310. [Google Scholar] [CrossRef]
- Zhang, J.; Zhang, S.; Wang, C.; Tan, X. Recent Advances in Film Cooling Enhancement: A Review. C. J. Aeronau 2020, 33, 1119–1136. [Google Scholar] [CrossRef]
- Li, Q.; Ma, Y.L.; Zhang, L. Discussion on Blade Film Hole Detection Technology Based on Laser Ranging Principle. Sci. Informatization 2021, 1, 94–96. [Google Scholar]
- Clifford, R.J. Rotating heat transfer investigations on a multi-pass cooling geometry, AGARD Heat Transfer and Cooling in Gas Turbines 1985, N86-29823, 07-21.
- Ni, M.; Zhu, H.R.; Qiu, Y. Overview of Cooling Technology for Aero Engine Turbine Blades. Gas Turbine Technol., 2005, 04, 25–33+38. [Google Scholar]
- Li, S.F.; Huang, K.; Ma, H.S.; Chen, D.Y. Research Progress on Design and Manufacture Technology of Film Cooling Holes for Aeroengine Turbine Blades. J. Therm. Eng Power 2022, 37, 1–11. [Google Scholar]
- Huang, K.N.; Zhang, J.Z.; Guo, W. Effect of Partial Blockage inside Film Hole on Film Cooling Characteristics. J. Aerosp. Power 2014, 29, 1330–1338. [Google Scholar] [CrossRef]
- Li, G.C.; Zhu, H.R.; Bai, J.T.; Xu, D.C.; et al. Experimental Investigation of Film Cooling Effectiveness on Leading Edge with Various Geometries. J. Propuls. Technol 2008, 02, 153–157. [Google Scholar]
- Liu, Z.; Ding, Y.Q.; Xie, Y.H.; Zhang, W.X.; Wei, Z.P. Study on Effects of Film Hole Arrangement on Turbine Endwall Film Cooling Characteristics and Aerodynamic Performance. J. Xi'an Jiaotong Univ 2023, 57, 22–33. [Google Scholar]
- Tang, X.Z.; Li, L.P.; Huang, Z.J.; Liang,Y. C.; Zhong, W.L. Influence of Hole Spacing on the Film Cooling Effectiveness of a Gas Turbine Moving Blade. J. Power Eng 2018, 38, 105–113+131. [Google Scholar]
- Han, J.C. Recent Studies in Turbine Blade Cooling. Int. J. Rotating Mach 2004, 10, 443–457. [Google Scholar] [CrossRef]
- Sun, W.; Yi, J.; Ma, G.; Li, F.; Liu, X.; Gao, F.; Lu, C. A Vision-Based Method for Dimensional in Situ Measurement of Cooling Holes in Aero-Engines during Laser Beam Drilling Process. Int. J. Adv. Manuf. Technol 2022, 119, 3265–3277. [Google Scholar] [CrossRef]
- Goldstein, R.J.; Eckert, E.R.G.; Burggraf, F. Effects of Hole Geometry and Density on Three-Dimensional Film Cooling. Int.J. Heat. Mass. Transf 1974, 17, 595–607. [Google Scholar] [CrossRef]
- Bunker, R. S. A Review of Shaped Hole Turbine Film-Cooling Technology. J. Heat Trans Asme 2005, 127, 441–453. [Google Scholar] [CrossRef]
- Wilson, D. J.; Goldstein, R. J. Effect of Film Cooling Injection on Downstream Heat Transfer Coefficients in High Speed Flow. J. Heat Trans 1973, 95, 505–509. [Google Scholar] [CrossRef]
- Kim, S.; Lee, K.; Kim, K.-Y. A Comparative Analysis of Various Shaped Film-Cooling Holes. Heat. Mass. Trans 2012, 48, 1929–1939. [Google Scholar] [CrossRef]
- Zhai, Y.N.; Liu, C.L. Experimental Study on the Film Cooling Performance of Odd-Shaped Film Holes with Large Inclination Angle under High Turbulence Intensity. J. Xi'an Jiaotong Univ 2017, 51, 16–23. [Google Scholar]
- Liu, J. S.; Malak, M. F.; Tapia, L. A.; Crites, D. C.; Ramachandran, D.; Srinivasan, B.; Muthiah, G.; Venkataramanan, J. Enhanced Film Cooling Effectiveness with New Shaped Holes. Volume 4: Heat Transfer, Parts a and B, 2010. [Google Scholar] [CrossRef]
- Kang, X.L.; Principles and Applications of EDM Composite Machining. Mech. Electr. Prod. Dev. Innov 2007, 4, 175–176. [Google Scholar]
- Shi, W.X.; Zhang, M.Q.; Yin, M. Research and Development of Electro-Stream Machining Technology. Aeronaut. Manuf. Technol 2001, 000, 25–27. [Google Scholar]
- Shirk, M. D.; Molian, P. A Review of Ultrashort Pulsed Laser Ablation of Materials. J. Laser App 1998, 10, 18–28. [Google Scholar] [CrossRef]
- Xia, K.L.; Ge, C.; Wang, Q.T.; He, Q. Research Progress on Detection Technology for Film Cooling Holes and Coating Defects of Turbine Blades. Aeronaut. Manuf. Technol 2022, 65, 13. [Google Scholar]
- Song, J.B.; Yi, H.Y. Technology for Gas Film Hole of Aircraft Engine Turbine Blade. Tool Technol 2020, 54, 82–86. [Google Scholar]
- Zhang, W.W.; Wang, Y.F.; Wang, B.; Zhang, G.Y.; Zhang, TR. A Composite Water-Assisted Laser Processing System and Its Processing Method. CN112824004B, November 22, 2022.
- Li, X.J.; Dong, Y.W.; Yin, C.P.; Zhao, Q.; You, Y.C. Geometric Parameters Evolution experiment of Hole during Femtosecond Laser helical drilling. Chin. J. Lasers 2018, 45, 102–111. [Google Scholar]
- Zhang, X.B.; Sun, R.F. Sequential Laser Drilling Technology. Acta Aeronaut 2014, 35, 894–901. [Google Scholar]
- Dong, Y.W.; Wu, Z.P.; Li, X.J.; Yin, C.P.; You, Y.C. Current Situation and Development Trend of Processing and Measurement Technology for Turbine Blade Film Cooling Hole. Aeronaut. Manuf. Technol 2018, 61, 16–25. [Google Scholar]
- Liu, X.L.; Tao, C. H.; Liu, C.J.; Hu, C.Y.; Chen, X. Investigation of Processing Methods and Development of Gas Holes of Engine Blade. Mater. Rep 2013, 27, 117–120. [Google Scholar]
- Wang, J.Q.; Zhao, W.S. Breakthrough Detection Technology of High-Speed EDM Drilling Based on Support Vector Machine. Electr. Mach. Moulds 2017, 4, 56–59+67. [Google Scholar]
- Tao, J. The Experimental Studies on Laser Drilling and Back Strike Protection. Ningbo: University of Chinese Academy of Sciences, Postgraduate Thesis, Ningbo Institute of Materials Technology and Engineering, Chinese Academy of Sciences, Ningbo, 2017. [Google Scholar]
- Xia, K.L.; He, Q.; Zhang, Y.S. Measurement Method of Turbine Blade Film Aperture Based on Infrared Thermal Imaging and Shrinkage Law. Acta Aeronaut 2022, 43, 594–606. [Google Scholar]
- Gao, C.; Zhuang, L.; Zhao, K.; Guo, C. Abrasive Water Jet Drilling of Ceramic Thermal Barrier Coatings. Procedia CIRP 2018, 68, 517–522. [Google Scholar] [CrossRef]
- Gao, C.; Zhuang, L.; Qiu, Y.; Zhao, K. Feasibility of Drilling Holes on Thermal Barrier Coated Superalloy Using Electrical-Discharge Machining. Procedia CIRP 2020, 95, 522–526. [Google Scholar] [CrossRef]
- Bi, C.; Hao, X.; Liu, M.C.; Fang, J.G. Design and establishment of the machine Vision Measuring System for Film cooling Holes. Acta Metrologica Sinica 2020, 41, 775–780. [Google Scholar]
- Wang, C.; Liu, T.; Mu, X.; Liu, P.; Zhu, L.Z. Research on Aero Engine Blade Film Hole Measuring Technology. Meas. Technol 2012, 32, 27–30. [Google Scholar]
- Elfurjani, S.; Ko, J.; Jun, M. B. G. Micro-Scale Hole Profile Measurement Using Rotating Wire Probe and Acoustic Emission Contact Detection. Measurement 2016, 89, 215–222. [Google Scholar] [CrossRef]
- Cui, J.; Feng, K.; Hu, Y.; Li, J.; Tan, J. A Twin Fiber Bragg Grating Probe for the Dimensional Measurement of Microholes. IEEE Photonics Technology Letters 2014, 26, 1778–1781. [Google Scholar] [CrossRef]
- Chen, C.; Li, D.G. Optical Properties and Applications of Fiber Bragg Gratings. J. Naval Univ. Eng 2000, 4, 11–15+22. [Google Scholar]
- Feng, K.; Cui, J.; Zhao, S.; Li, J.; Tan, J. A Twin FBG Probe and Integration with a Microhole-Measuring Machine for the Measurement of Microholes of High Aspect Ratios. IEEE-ASME Transactions on Mechatronics 2016, 21, 1242–1251. [Google Scholar] [CrossRef]
- Muralikrishnan, B.; Stone, J. A.; Stoup, J. R. Fiber Deflection Probe for Small Hole Metrology. Pre. Eng 2006, 30, 154–164. [Google Scholar] [CrossRef]
- Ma, Y.Z.; Yu, Y.X.; Wang, X.H. Diameter Measuring Technique Based on Capacitive Probe for Deep Hole or Oblique Hole Monitoring. Measurement 2014, 47, 42–44. [Google Scholar] [CrossRef]
- Ma, Y.Z.; Ma, L.; Zheng, Y.Z. The Measurement Techniques for Angular 3-D Pinholes Based on Capacitive Probe. Measurement 2017, 97, 145–148. [Google Scholar] [CrossRef]
- Sun, X.; Ma,Y. Z.; Yu, Y.X.; Zheng, Y.Z. Inner Hole Diameter Measuring Based on Capacitive Sensor. Adv. Mater. Res 2013, 739, 596–601. [Google Scholar] [CrossRef]
- Lee, N. K.-S.; Chow, J.; Chan, A. C. K. Design of Precision Measurement System for Metallic Hole. Int. J. Adv Manuf Technol 2008, 44, 539–547. [Google Scholar] [CrossRef]
- Bian, X.; Cui, J.; Lu, Y.; Tan, J. Ultraprecision Diameter Measurement of Small Holes with Large Depth-To-Diameter Ratios Based on Spherical Scattering Electrical-Field Probing. App Sci 2019, 9, 242. [Google Scholar] [CrossRef]
- Cheng, Y.Q; Li, W.L.; Jiang, C.; Wang, G.; Xu, W.; Peng, Q. Y. A Novel Cooling Hole Inspection Method for Turbine Blade Using 3D Reconstruction of Stereo Vision. Meas. Sci. Tech 2021, 33, 015018. [Google Scholar] [CrossRef]
- Li, L.; Li, B.; Zhang, R.; Xue, Z.; Wei, X.; Chen, L. Geometric Parameters Measurement for the Cooling Holes of Turbine Blade Based on Microscopic Image Sequence Topographical Reconstruction. Measurement 2023, 210, 112562. [Google Scholar] [CrossRef]
- Zhao, Y.Y.; Zeng, F.; Li, Y.; Gan, M.Y.; Shi, S.X. 3D Measurement Technique for Film Cooling Holes Based on Light Field Imaging. Acta Aeronaut 2021, 42, 1–11. [Google Scholar]
- Munkelt, C.; Kühmstedt, P.; Aschermann, L.; Seidel, F. Automatic Complete High-Precision Optical 3D Measurement of Air Cooling-Holes of Gas Turbine Vanes for Repair. Opt. Mea. Sys IX 2015. [Google Scholar]
- Xu, D.J. ; Research on Micro-Aperture Rapid Measuring System Based on Luminous Flux. Postgraduate Thesis, Nanjing University of Aeronautics and Astronautics, Nanjing, 2013. [Google Scholar]
- Xu, D.J; Ye, M.; Ni, Z.Q. The Study of the Micro-Aperture Rapid Measuring Theory Based on Luminous Flux. J. Mech. Eng 2013, 2, 7–9. [Google Scholar]
- Jin, J.; Kim, J. W.; Kang, C.-S.; Kim, J.-A.; Lee, S. Precision Depth Measurement of through Silicon Vias (TSVs) on 3D Semiconductor Packaging Process. Opt.Exp 2012, 20, 5011. [Google Scholar] [CrossRef] [PubMed]
- Wang, M.Y.; Zhang, H.B.; Hu, W.B.; Mei, Y.H. Review on the through Silicon Via Technology in the 3D System in Package (3D-SiP). J. Mech. Eng 2023, 59, 1–16. [Google Scholar]
- Wu, C.X.; Ma, J.Q.; Gao, Z.S.; Guo, Z.Y.; Yuan, Q. Measurement of through Silicon Via by Near-Infrared Micro Interferometry Based on Aberration Compensation. Opt. Precis. Eng 2023, 31, 12. [Google Scholar] [CrossRef]
- Sun, W.; Yi, J.; Ma, G.; Li, F.; Liu, X.; Gao, F.; Lu, C. A Vision-Based Method for Dimensional in Situ Measurement of Cooling Holes in Aero-Engines during Laser Beam Drilling Process. Int. J. Manuf. Technol 2022, 119, 3265–3277. [Google Scholar] [CrossRef]
- Shetty, D.; Eppes, T.; Campana, C.; Filburn, T.; Nazaryan, N. New Approach to the Inspection of Cooling Holes in Aero-Engines. Opt. Laser. Eng 2009, 47, 686–694. [Google Scholar] [CrossRef]
- Ciampa, F.; Mahmoodi, P.; Pinto, F.; Meo, M. Recent Advances in Active Infrared Thermography for Non-Destructive Testing of Aerospace Components. Sensors 2018, 18, 609. [Google Scholar] [CrossRef] [PubMed]
- Rosemau, R. D.; Nawaz, S.; Niu, A.; Wee, W. G. <Title>Aircraft Engine Blade Cooling Holes Detection and Classification from Infrared Images. Proceedings of SPIE 1999. [Google Scholar]
- He, Q.; Ge, C.; Wang, Q.T. Method and Platform for Detecting Cooling Film Holes on Working Blades ofHigh-Pressure Turbines. CN109751972B, February 26, 2021.
- Li,X. Y.; Yang, L.; Sun, C.G.; Li, X.J.; Liu, Y. High-Pressure Turbine Blade Defect Technology Based on Micro-Focus Industrial CT. Foundry 2023, 72, 904–908. [Google Scholar]
- Wang, W.H.; Zhang, Z.F.; Jiang, R.S.; Qin, C.C.; Zhu, X.X.; Huang, B. Method for Detecting and Evaluating the Geometric Structure of Shaped Film Holes Based on Industrial CT Scanning. CN201910970716.7, October 14, 2019.
- Jiang, R.S.; Wang, W.H.; Wang, Z.Q.; Zhang, D.H.; Bu, K. Precision Forming Technology and Its Development Trend of Aero Engine Turbine Blades. Aeronaut. Manuf. Technol 2016, 21, 6. [Google Scholar]
- Jiang, Q.L.; Cao, K.Q.; Chen, L.; Feng, Z.P.; Jia, T.Q.; Sun, Z.R. Process of Turbine Blade Film Cooling Holes by Nanosecond and Femtosecond Laser Pulses. Aeronaut. Manuf. Technol 2021, 64, 53–61. [Google Scholar]
- Yang, Z.N.; Zha, H.Y.; Huang, Z.Y.; Xu, J.J.; Liang, W.; Zhang, Z.; Wang, Z.D.; Huang, H.D. Development and Prospect of the Drilling and Detection of Film Cooling Hole on Turbine Blade and Vanes. Fail. Anal. Prev 2023, 18, 14–20. [Google Scholar]
- Chen, X.; Longstaff, A. P.; Fletcher, S.; Myers, A. Analysing and Evaluating a Dual-Sensor Autofocusing Method for Measuring the Position of Patterns of Small Holes on Complex Curved Surfaces. Sensors and Actuators 2014, 210, 86–94. [Google Scholar] [CrossRef]
- Sui, X.; Xu, X.P.; Sun, J.; Zhang, L. Microhole Geometry Measurement Applying Multi-Sensor Technology. Opt. Optoelectron. Technol, 2009; 07, 79–82. [Google Scholar]
- Sun, Q.S.; Sui, X.; Xu, H.F. Research on an Optoelectronic Detection System for Microhole Shape Measurement. Sci. Technol. Inf 2008, 14, 14. [Google Scholar]
- Stimpson, C. K.; Snyder, J. C.; Thole, K. A.; Mongillo, D. Effectiveness Measurements of Additively Manufactured Film Cooling Holes. J. Turbo 2017, 140. [Google Scholar]
- Cooling Holes Inspection & 3D Metrology – Novacam. Available online: https://www.novacam.com/applications/cooling-holes-inspection/ (27.01.2024).
- Survice_Measurement of Cooling Hole CMSC 2011 Sub. Available online: https://www.cmsc.org/stuff/contentmgr/files/0/2bdcf766d9d5daf6e892c46153c591d3/misc/cmsc2011_wed_gh_0800_survice.pdf (27.01.2024).
- Nigmatulin, T. Turbine Shroud Cooling Hole Diffusers and Related Method. US20030082046A1, Oct 26, 2001.
- Bao, C.X.; Wang, L.; Li, K.; Min, L.X.; Geng, C.K. Research on Rapid Detection Technology of Gas Film Hole Based on CCD. Aviat. Precis. Manuf. Technol 2017, 053, 52–55. [Google Scholar]
- Bi, C.; Hao, X.; Liu, M.C.; LIU, Y. Establishment and Conversion of Coordinate System in Visual Measurement of Film Cooling Holes. J. Sens. Technol 2019, 32, 1515–1521. [Google Scholar]
- Bi, C.; Hao, X.; Liu, M.; Ji, G.B. Design and Establishment of Five-Axis Visual Measuring System for Film cooling Holes. Mach. Tool Hydraul 2021, 49, 123–127. [Google Scholar]
- Bi, C.; Pi, K.S.; Sheng, B.; Long, K.; Hao, X. Measurement Technology of blade-Shaped Holes Based on Machine Vision. Tool Technol 2022, 56, 147–151. [Google Scholar]
- Bi, C.; Zhang, Y.; Zhang, C.; Zhou, P. Study on Automatic Focusing Strategy of Visual Coordinate Measuring System. Tool Technol 2022, 56, 136–141. [Google Scholar]
- Bi, C.; Hao, X.; Liu, M.C.; Fang, J.G. Design and Establish of the machine vision measuring system for Film Cooling Holes. Acta Metro Sinica 2020, 41, 775–780. [Google Scholar]
- Bi, C.; Hao, X.; Liu, M.C.; Fang, J.G. Study on Calibration Method of Rotary Axis Based on Visual Measurement. Infrared Laser Eng 2020, 49, 167–174. [Google Scholar]
- Bi, C.; Zhang, C.; Fan, C.Y.; Fang, J.G. Study on Visual Measuring Technology of Axis Direction of Film Cooling Holes. J. Aerosp. Metro. Meas 2022, 42, 37–42. [Google Scholar]
- Liao, T.; Dong, Y.W.; Zhang, S.T.; Bi, C.; Fang, J.G. Error Analysis Method of Turbine Blade Film Hole Based on Virtual Measurement. Aeronaut. Sci. Technol 2021, 32, 50–59. [Google Scholar]
- Zhang, M.; Yan, X.S.; Xi, X.C.; Zhao, W.S. Measurement of Axial Orientation of Film Cooling Holes of Turbine Blade Based on Laser Sensor. Electr. Mach. Moulds 2022, 004, 000. [Google Scholar]

| Hole shape | % Improvement of cooling performance |
|---|---|
| Fan shape | 10-40 |
| Conical | 15 |
| Console | 20 |
| Sister hole | 15-23 |
| Compound angle | 4-10 |
| Trench shape | 15-20 |
| Main measurement technology | Measured features | Advantage | Disadvantage | |
|---|---|---|---|---|
| Optical measurement | Light field | Geometrical feature of hole inner wall(partial) Orifice shape and diameter |
high efficiency | Limited data; |
| Image recognition | Orifice shape and diameter | high efficiency |
Limited data; | |
| luminous flux | Orifice diameter | high efficiency |
Limited data; | |
| 3D reconstruction | Geometrical feature of hole inner wall(partial) Orifice shape and diameter |
high efficiency |
Limited data; | |
| Industrial CT | Geometrical feature of hole inner wall | Generalized measurement result | High cost; Low efficiency; |
|
| Infrared imaging | Orifice diameter | high efficiency convenient construction of measurement system |
Limited data; | |
| Probing measurement | Capacitive probe | Geometrical feature of hole inner wall | Suitable for High depth to diameter ratio hole | Low efficiency; Low resolution; Limited data; |
| Fiber probe | Geometrical feature of hole inner wall | Suitable for High depth to diameter ratio hole | Low efficiency; Low resolution; Limited data; |
|
| Laser interferometry | Geometrical feature of hole inner wall | Suitable for High depth to diameter ratio hole | Low efficiency; Low resolution; |
|
Disclaimer/Publisher’s Note: The statements, opinions and data contained in all publications are solely those of the individual author(s) and contributor(s) and not of MDPI and/or the editor(s). MDPI and/or the editor(s) disclaim responsibility for any injury to people or property resulting from any ideas, methods, instructions or products referred to in the content. |
© 2024 by the authors. Licensee MDPI, Basel, Switzerland. This article is an open access article distributed under the terms and conditions of the Creative Commons Attribution (CC BY) license (http://creativecommons.org/licenses/by/4.0/).


