
Submitted:
31 January 2024
Posted:
01 February 2024
You are already at the latest version
Abstract
The application of bacterial metagenomic analysis as biomarker for cancer detection is emerging. Our aim was to discover gut microbiota signatures with potential utility in the diagnosis of colorectal cancer (CRC) and non-small cell lung cancer (NSCLC). A prospective study was performed on a total of 77 fecal samples from CRC and NSCLC patients and Controls. DNA from stool was analyzed for bacterial genomic sequencing using the Ion Torrent™ technology. Bioinformatic analysis was performed with QIIME2 pipeline. We applied logistic regression for adjusting differences attributable to sex, age and body mass index and compared diagnostic accuracy of our gut signatures with other previously published.
The feces of patients affected by different tumor types, such as CRC and NSCLC, showed a differential intestinal microbiota profile. After adjusting for confounders, Parvimonas (OR = 53.3), Gemella (OR = 6.01), Eisenbergiella (OR = 5.35), Peptostreptococcus (OR = 9.42), Lactobacillus (OR = 6.72), Salmonella (OR = 5.44) and Fusobacterium (OR = 78.9) remained significantly associated with the risk of CRC. Two genera from the Ruminoccocaeae family, DTU089 (OR = 20.1) and an uncharacterized genus (OR = 160.1) were associated with the risk of NSCLC. Our two panels had better diagnostic capacity for CRC (AUC = 0.840) and NSLC (AUC = 0.747) compared to the application to our population of two other published panels.
Thus, we propose a gut bacteria panel for each cancer type and show its potential application in cancer diagnosis.
Keywords:
Microbiota
; Biomarker
; Colorectal Cancer
; Non-Small Cell Lung Cancer
1. Introduction
Non-small cell lung cancer (NSCLC) and colorectal cancer (CRC) are among the most incident cancers and lead the worldwide cause of death from malignant diseases. In 2020, there were 1.8 million and 0.9 million deaths due to NSCLC and CRC in the world, respectively [1,2]. Due to this high health burden, major efforts have been invested in research on prevention, diagnosis, prognosis and treatment.
Several factors may play a role in the genesis and development of the tumorigenesis process. These are intrinsic factors, which are related to individual characteristics, such as age and random mutations, and extrinsic factors, which depend on environmental features, such as pollutants, diet and lifestyle [3]. The microbiota is one of the environmental factors that most influences the onset of cancer [4]. The devastating amount of microorganisms harbored by humans [5] can interact with host factors through metabolic, immunoinflammatory and toxic pathways driving tumor formation. For example, bile acid synthesis by Clostridium species has shown to promote tumor growth [6] and short chain fatty acids are proved to protect against CRC [7]. In a mouse model of lung adenocarcinoma and in human samples, tumor tissue was enriched with γδ T cells in specific-pathogen-free mice (SPF) but not in germ-free (GF) mice [8]. Fusobacterium nucleatum expresses a bacterial cell surface toxin, FadA, an adhesion molecule which can activate β-catenin signaling by binding to E-cadherin, thereby promoting carcinogenesis [9].
Several experiments have shown that fecal microbiota transplantation from cancer patients to GF mice led to higher number of tumoral lesions and of bigger size than in SPF mice bearing commensal microbiota [10]. However, other studies have concluded the opposite, where reduced commensal microbiota by antibiotics induced fewer tumor lesions [8]. These data support the need to conduct well-characterized studies in order to find generalizable biomarkers [11]. Additionally, some genera have been claimed to be increased in cancer in some studies, but decreased in others, e.g. elevated [12] or reduced Pseudomonas [13] in tumor tissue from lung cancer patients. Therefore, human studies remain relevant to shed light in developing microbial biomarkers for the diagnosis and prognosis of colorectal and lung cancer. Fecal microbiota has attracted the greatest interest for biomarker identification, although local microbiota from tumor and non-tumoral gut mucosa may also be of paramount relevance. Moreover, gut microbiota can influence tumorigenesis, at a distant site, such as lungs. This finding has paved the way for the so-called gut-lung-axis. According to this hypothesis, gut microbiota can affect lung homeostasis leading to increased susceptibility or resistance to lung diseases. Soluble microbial ingredients circulating via the gut-lung axis and interaction with dendritic cells and lung group 2 innate lymphoid cells would stand for the key interconnected manners by which gut microbiota participate in pulmonary diseases [14]. Taken together, these data seem to suggest that gut dysbiosis might contribute to CRC and NSCLC pathogenesis.
Recently, gut microbiome signatures have been developed across several cancer types [15,16]. However, whether there is a specific microbiome signature for each type of cancer, CRC or NSCLC, still remains under investigation. In CRC and NSCLC patients, a central core of pathogenic bacteria has been shown to be enriched, but the reality is that there is a high variable degree of species reported [15,17,18].
The main objective of this work was to compare gut microbiota profiles between different groups of subjects, CRC and NSCLC patients and Control subjects. Furthermore, we intended to provide results to establish the relevance of the gut-lung axis. The analyses were performed on feces, since this type of sample can be obtained non-invasively.
2. Materials and Methods
2.1. Patients and Samples
A total of 77 fecal samples from 38 CRC patients, 19 NSCLC patients and 20 Controls were collected and submitted to metagenomic analysis. Samples were obtained prospectively between 2021 and 2023. All of the cases come from the San Carlos Hospital in Madrid (Spain). Written approval to develop this study was obtained from the Clinical Research Ethics Committee of the San Carlos Hospital in Madrid (C.I. 19/549-E_BC, 27/12/2019). In addition, written informed consent was obtained from subjects prior to investigation. All participants were recruited subsequently and regardless of gender, age or tumor stage. Subject characteristics are depicted in Table 1. Patients were staged according to the American Joint Committee on Cancer classification [19] and all subjects were classified according to their BMI values following the criteria of the World Health Organization (WHO).
Eligible Controls were voluntary subjects without cancer and considering the following exclusion criteria: previous history of inflammatory bowel disease; antibiotic treatment in the month prior to obtaining the stool sample; previous intestinal resection surgery; oncological history, regardless of the time elapsed. In the cancer groups, eligible cases were patients undergoing potentially curative surgery for CRC or NSCLC at San Carlos Hospital in Madrid. Cancer patients who had previously undergone gastrointestinal resection surgery, those affected by inflammatory diseases and those who had undergone antibiotic treatment one month before surgery were excluded. Moreover, chemo- and/or radiotherapy prior to the surgery was also considered an exclusion criterion.
Prior to surgery or any systemic treatment, collected fecal samples were fresh and stored at – 80 ºC.
2.2. DNA Preparation and Sequencing
DNA from feces was extracted using the QIAamp® Fast DNA Stool Mini Kit (Qiagen, Hilden, Germany). The concentration of the DNA extracts was determined with the Invitrogen™ Qubit™ 3 Fluorometer using the dsDNA HS (High Sensitivity) Assay (Thermo Fisher Scientific, Waltham, Massachusetts, USA).
Microbiota analysis was performed by amplification and sequencing of the 16S ribosomal RNA (rRNA) bacterial gene, using the Ion Torrent™ sequencing technology and the reagents from Life Technologies (a part of Thermo Fisher Scientific, Waltham, Massachusetts, USA), as previously described [20]. Briefly, a starting input of 5 ng of DNA per sample were used to run 2 parallel polymerase chain reactions (PCRs) that used two different sets of primers to amplify seven hypervariable regions of the gene (V2, V4, V8 and V3, V6-7, V9, respectively), using the Ion 16S™ Metagenomics Kit. The amplicons obtained from both reactions were then quantified, combined for each sample in equal volumes and purified using the Agencourt AMPure XP reagent beads (Beckman Coulter, Pasadena, California, USA). Next, barcoded libraries were prepared using the Ion Plus Fragment Library Kit and the Ion Xpress™ Barcode Adapters. The libraries were then quantified with the Qubit™ 3 Fluorometer, set to 22pM, and then combined in the same tube. An emulsion PCR was performed using the Ion OneTouch™ 2 System in association with the Ion 520™ & 530™ Kit – OT2. The template-positive Ion Sphere Particles were then collected, washed and enriched using the Ion OneTouch™ ES Instrument OT2, and finally loaded onto an Ion 530™ Chip and sequenced using the Ion S5™ System.
2.3. Statistical Analysis
Bioinformatic analysis was performed using the Quantitative Insight Into Microbial Ecology 2 (QIIME2) pipeline [21]. The obtained sequences were clustered into operational taxonomic units (OTUs) with a 99% of coincidence with the SILVA 138 SSU Ref NR 99 identity database. As quality control, a sampling depth with a minimum number of 100k reads per sample was applied.
Alpha diversity, obtained from a rarefied OTUs profile, was assessed conducting parametric tests, in the case of data normally distributed (t-test) or non-parametric tests, in the case of data with a non-normal distribution (Kruskal-Wallis test). Five metrics were calculated: observed OTUs, Chao1 richness estimate, Shannon diversity index, Pielou’s evenness index and Simpson’s diversity index. For beta diversity analysis, permutation-based multivariate analysis of variance (PERMANOVA), analysis of similarities (ANOSIM) and analysis of multivariate homogeneity of variances (PERMDISP) tests were performed, comparing Jaccard and Bray-Curtis similarity indexes, with distances between groups and samples plotted using principal coordinate analysis (PCoA).
A linear discriminant analysis (LDA) effect size (LEfSe) [22] was used to measure the relative abundances of taxa in the analyzed groups. LEfSe consists of the application of a Kruskal-Wallis test to identify taxa with significantly different relative abundances, followed by a LDA to determine an effect size of each taxon. Taxa with an LDA score (log10) > 2 with a p value < 0.05 were considered statistically significant.
For those taxa featured in the LEfSe analysis, relative abundance values were processed by the Cutoff Finder application [23], which allowed us to establish a threshold of relative abundance to distinguish cancer patients and controls. These thresholds were calculated using the Euclidean distance method, which allows optimal classification. Next, a logistic regression was performed to adjust results considering possible differences in gender, age and BMI. Finally, diagnostic parameters, (AUC) of (ROC) curve, sensitivity and specificity, were calculated and compared between our discovered fecal microbiota signatures and two large cancer microbiome signatures [15,16]. ROC curves were statistically compared by test of equality of ROC areas for independent samples according to the method from DeLong et al. [24]. In any case, the statistical significance was set at p value < 0.05. Statistical analysis was performed with STATA IC16.1 (Stata-Corp LLC, TX, USA) and IBM® SPSS® Statistics software package version 27 (IBM Inc., Armonk, NY, USA).
3. Results
3.1. Comparison of Microbial Diversity between Feces from CRC Patients, NSCLC Patients and Control Group
When comparing the alpha diversity of microbiota between fecal samples from CRC patients and the ones from the Control group, there were no significant differences. However, all metrics were higher in CRC feces (Figure 1). A similar tendency was observed when the comparison was performed between feces from NSCLC patients and Controls, with differences bordering statistical significance for the Observed OTUs and the Chao1 index (Figure 2). Finally, the comparison of feces from CRC patients and NSCLC patients reported no significant differences in alpha diversity nor a particular tendency between both groups (Figure 3).
With respect to beta diversity, we did not detect significant differences between CRC or NSCLC patients and Controls, although in the NSCLC vs. Control comparison differences bordered statistical significance (in PERMDISP test, p value = 0.082 for the Jaccard index). However, when feces from CRC and NSCLC patients were compared, differences in beta diversity became remarkable (in PERMANOVA test, p value = 0.010 for Bray-Curtis and p value = 0.038 for the Jaccard index). Figure 4 shows bidimensional PCoA plots for Jaccard beta diversity index between the study populations.
3.2. Taxonomic Comparison of Microbiota between Feces from CRC Patients, NSCLC Patients and Controls
Regarding phylum composition, all the groups shared Firmicutes, Bacteroidota, Proteobacteria and Actinobacteriota as dominant taxa. However, CRC and NSCLC groups displayed a decrease in phylum Bacteroidota when compared to the Control group (CRC – NSCLC – Controls: 42.3% vs. 42.9% vs. 46.3%).
We next focused on the taxonomic differences between fecal microbiota from patients with CRC, patients with NSCLC and Control subjects at genus level (Figure 5 and Table 2).
As shown in Figure 5a, of the 1205 bacterial genera reported in the CRC vs. Control comparison, 875 were shared by both groups, 271 were only present in the CRC group and 59 only present in the Control group. LEfSe analysis at the bacterial genus level resulted in 17 genera differentially increased in CRC feces, 12 belonging to the Firmicutes phylum (CAG-352, Lactobacillus, Ruminococcaceae, S5-A14a, Peptostreptococcus, Clostridium sensu stricto 1, Eisenbergiella, Gemella, Hydrogenoanaerobacterium, Turicibacter, Parvimonas and Intestinimonas), 3 to the Proteobacteria phylum (Escherichia-Shigella, Eikenella and Salmonella), 1 to the Fusobacteriota phylum (Fusobacterium), and 1 to the Campylobacterota phylum (Campylobacter).
On the other hand, feces from Control subjects were enriched in 5 bacterial genera with respect to CRC patients, 3 from the Firmicutes phylum (Blautia, Lachnoclostridium, and Dielma), 1 from the Proteobacteria phylum (Sutterella), and 1 from the Actinobacteriota phylum (Olsenella).
When fecal samples from NSCLC patients were compared to the ones from the Control group (Figure 5b), Venn diagram reported 1085 genera, 812 in common between both populations, 138 only present in the NSCLC population and 135 only present in the Controls. LEfSe analysis indicated that 13 bacterial genera were significantly increased in feces from NSCLC patients. Five of these genera were common to the CRC group (Turicibacter, Intestinimonas, Eisenbergiella and Lactobacillus, all belonging to the Firmicutes phylum; and Salmonella, from the Proteobacteria phylum), whereas the other 8 genera were new for the NSCLC group (Agathobacter, Ruminococcaceae Incertae Sedis, Granulicatella, Frisingicoccus, DTU089, Clostridium sensu stricto 3, Coprobacillus, and Hungatella, all of them belonging to the Firmicutes phylum). Feces from Controls were enriched in 3 genera with respect to NSCLC patients: genera Lachnoclostridium (phylum Firmicutes) and Olsenella (phylum Actinobacteriota), which were common to the CRC vs. Control comparison, and genus Megasphaera (Firmicutes phylum).
Finally, the comparison of fecal samples from CRC and NSCLC patients (Figure 5c) reported 1017 bacterial genera, 804 of them shared between both cancer groups, 177 only present in CRC and 36 only present in NSCLC. Regarding LEfSe analysis, feces from patients with CRC had 11 increased bacterial genera. Eight of these (Fusobacterium, from phylum Fusobacteriota; CAG-352, Peptostreptococcus, Parvimonas, Hydrogenoanaerobacterium and Ruminococcaceae, all of them from phylum Firmicutes; Eikenella, from the phylum Proteobacteria; and Campylobacter, from phylum Campylobacterota) were already found to be increased in CRC patients with respect to the Control group, whereas other 3 genera (Sarcina, Solobacterium and Sellimonas, all from phylum Firmicutes) were new for this comparison. Feces from NSCLC patients reported an increase in genera Agathobacter and Ruminococcaceae Incertae Sedis (phylum Firmicutes), which were also increased with respect to the Control group, as well as in 7 new bacterial genera (Bifidobacterium, phylum Actinobacteriota; Roseburia, Blautia, Oscillibacter, Ammoniphilus and Pseudobutyrivibrio, all of them from phylum Firmicutes; and CAG-873, from phylum Bacteroidota).
Notably, when performing the taxonomic analysis between fecal samples from CRC patients with respect to tumor location and TNM stage, some of these genera also appeared to be increased in one of the groups. Particularly, genus Campylobacter was more abundant in feces from stage I or stage II CRCs (p value = 0.027 in LEfSe analysis), whereas Ruminococcaceae was associated to stage III-IV CRCs (p value = 0.033 in LEfSe analysis). Regarding primary tumor location, genus Hydrogenoanaerobacterium was increased in feces from rectal cancers with respect to CRCs from other locations (p value = 0.027 in LEfSe analysis), and both Hydrogenoanaerobacterium and Fusobacterium genera were more abundant in left colon cancers with respect to right colon ones (LEfSe p value = 0.021 for Hydrogenoanaerobacterium and p value = 0.048 for Fusobacterium).
3.3. Logistic Regression Analysis of Differentially Increased Bacterial Genera in Patients with CRC or NSCLC
A logistic regression analysis was performed on the bacterial genera that were found to be increased in either CRC or NSCLC patients with respect to the Control group, in order to evaluate their potential as biomarkers for cancer development. First, the relative abundances of each taxon were categorized according to a threshold calculated by the Cutoff Finder application. Next, a logistic regression analysis was performed to identify the significant taxa after adjusting for sex, age and BMI. As shown in Table 3, a higher abundance of genera Parvimonas, Gemella, Eisenbergiella, Peptostreptococcus Lactobacillus, Salmonella and Fusobacterium was significantly associated to the presence of CRC when compared to Controls. Genera Campylobacter, Turicibacter, Clostridium sensu stricto 1, Eikenella and Escherichia_Shigella were also associated with CRC, although their logistic regression bordered the statistical significance. On the other hand, increased levels of genera DTU089 or Ruminococcaceae Incertae Sedis were associated to the presence of NSCLC when compared to Controls (Table 4), as well as genera Hungatella, Clostridium sensu stricto 3, Salmonella and Agathobacter, which bordered statistical significance.
3.4. Comparison of Fecal Microbiota Panels
Based on the results of the LEfSe analysis, we performed a comparison of the diagnostic accuracy of a proposed bacterial panel for each cancer type (CRC or NSCLC), and the signatures from two large, published cancer databases (Table 5 and Figure 6). In both cases, the comparison of ROC curves yielded that our discovered signatures significantly outperformed the diagnostic ability of the previously published panels. The genera used for each panel can be found beneath Table 5. In the case of CRC, the proposed panel, and also the one with best performance, included the 7 bacterial genera increased in CRC feces with respect to Control feces and of which the logistic regression was found to be significant (i.e. Parvimonas, Gemella, Eisenbergiella, Peptostreptococcus, Lactobacillus, Salmonella and Fusobacterium). When applied to our population, this panel yielded an AUC of 0.840, a sensibility of 78.9% and a specificity of 80%. The same criterion was applied for the NSCLC panel, comprised by 2 bacterial genera (DTU089 and Ruminoccocaceae Incertae Sedis). This panel performed with an AUC of 0.747, 73.7% of sensibility and 75% of specificity, when applied to our population.
4. Discussion
In this work, we compared the fecal microbiota from patients affected by CRC or NSCLC with the one from Control subjects. These comparisons were based on the potential utility of fecal samples as a non-invasive way to detect pathologic changes in the gut microbiota and identify useful biomarkers for cancer diagnosis. The difference in age between the control group and the groups of patients affected by cancer could be, at least in part, a consequence of the exclusion criteria applied to subjects from the control group. It is not easy for an elderly patient not to meet any of the exclusion criteria that we have established (young patients meet the necessary characteristics more easily). Also in our case, mainly CRC is a pathology typically found in older patients, which probably explains the age differences.
Some previous studies have reported a decrease in alpha diversity in cancer patients, both at the tissue and the fecal level [25,26]. Controversially, our findings suggested a tendency to higher alpha diversity metrics in both cancer groups with respect to the controls. However, none of the differences observed was statistically significant, which goes in line with other research [27]. Importantly, the observed microbiome differences usually involve relatively quantitative differences in the abundance of specific taxa of bacteria [28].
A healthy gut microbiota is composed by a diverse group of commensal microorganisms, most of them belonging to the bacterial phyla Firmicutes and Bacteroidota, which help to maintain homeostasis by interacting with the host’s metabolism and immune system. In this context, both the pathogen infection and the infectivity of resident pathobionts are limited. Several diseases including different types of cancer have been linked to gut dysbiosis, which involves a shift to a more pathogenic microbiota. Feces from CRC and NSCLC patients included in the present study had a decrease in phylum Bacteroidota, when compared to feces from Controls. Other studies [29] have also highlighted as harmful the decrease of this phylum in mucosal tissue.
At the genus level, our LEfSe analysis comparing feces from patients with CRC, patients with NSCLC and Controls revealed several bacterial genera which were enriched in each of the study groups. Putting the comparisons together, feces from both CRC and NSCLC patients shared 5 increased genera with respect to Controls (Intestinimonas, Turicibacter, Eisenbergiella, Lactobacillus and Salmonella), thus making them potential biomarkers for cancer. Moreover, CRC feces included 8 genera (Campylobacter, Parvimonas, Hydrogenoanaerobacterium, Peptostreptococcus, Ruminococcaceae, Eikenella, CAG-352 and Fusobacterium) which seem to constitute a more specific CRC profile, as they were found to be differentially increased in this group of patients both when compared to Controls and to NSCLC patients. On the other hand, genus Agathobacter and the unidentified genus Ruminococcaceae Incertae Sedis were increased in feces from NSCLC patients with respect to both Controls and CRC patients, thus being more specific for the profile of this type of cancer.
After adjusting the genera reported by LEfSe analysis for variables that could have influenced the composition of the microbiota, 7 genera remained increased in CRC patients (Parvimonas, Gemella, Eisenbergiella, Peptostreptococcus Lactobacillus, Salmonella and Fusobacterium), and 2 in NSCLC patients (DTU089 and Ruminoccocaceae Incertae Sedis), compared to Controls. In CRC an overrepresentation of Fusobacterium, Porphyromonas, Parvimonas, Peptostreptococcus, and Gemella can be found as an indicative of microbial dysbiosis [30]. Similarly, Salmonella [31], and Eisenbergiella [32] have also been linked to the risk of CRC. The role of Lactobacillus in the risk of developing CRC is more controversial, as the core scientific studies explore its benefits as probiotic [33]. Some authors did not find differences in the abundance of Lactobacillus between CRC and controls [34]. The increase of Lactobacillus in our oncological population could be interpreted as reflect a fight against the tumor process, a dysbiosis inherent to the tumor process itself or a reflection of an incipient stage where the abundance of this particular bacterium has not been reduced. In NSCLC, an uncharacterized member from Ruminoccaceae family [35] was also found to be associated with NSCLC, as similarly were the uncharacterized genus Incertae Sedis and genus DTU089 in our study. Other bacteria genera that were close to statistical significance in our regression studies had also already been related to cancer in previous studies. Of the ones increased in CRC feces, Campylobacter spp., Escherichia spp. and Shigella spp., along with already mentioned Salmonella spp., include pathogenic and toxin-producing bacteria that have been related to the progression of cancer [36]. Turicibacter spp. and Clostridium sensu stricto 1 spp. were found to be positively correlated with the expression of several inflammatory cytokines as well as growth factor TGFb and transcription factor STAT3 in a CRC mouse model [37]. Finally, Eikenella spp. was suggested as passenger bacteria in CRC as it increased in tumors from CRC patients with respect to healthy Control mucosa [38]. In the case of the bacteria found in NSCLC feces, overrepresentation of Agathobacter spp. and Clostridium spp. in feces from patients with this type of cancer had been previously reported [39]. Hungatella spp. was increased in feces from NSCLC patients with cachexia [40]. Finally, Salmonella spp. has been related to various types of cancer including CRC, gallbladder cancer and hepatobiliary carcinoma, [41], although its role in lung cancer remains unclear. The mechanism by which the microbial taxa could be involved in cancer development is still subject of thorough investigation. Whether the main actors are specific taxa or the dysbiosis as a whole is unknown; possibly, a combination of mechanisms could provide an explanation to the role of microbiota in carcinogenesis. Both types of imbalance would ultimately trigger epithelial-mesenchymal transition, inflammation with increased reactive oxygen species and DNA damage, and suppression of the immune response [42].
We then proposed two diagnostic bacterial panels for CRC and for NSCLC, based on the logistic regression results. When we compared the diagnostic performance of our augmented differential genera with that of previously published clusters, our panels displayed significantly better accuracy in predicting cancer status. Diagnostic accuracy of our proposed panels was considered acceptable (0.7 < AUC < 0.8) and very good (0.8 < AUC < 0.9) [43]. The relevance of the published bacteria panels for being as less applicable is uncertain for us, as their data come from a larger number of patients. It should be noted that the signature from Yang et al. [16] was developed for cancer prognosis, not with diagnostic purposes. However, both signatures previously published [15,16] showed no discriminatory performance. These results may reflect some lack of external validation. Therefore, the implementation of microbiome features as a diagnostic cancer tool in clinical practice may need further research. Maybe, a signature panel for diagnostic purposes cannot be applied with all the genera but only with few of them. Moreover, considering that there are 3.8 x 10¹³ bacteria [44] in human body and that we harbor over 10000 species [45], this enormous biodiversity may defy the discovery of a universal oncomicrobiome signature. We may have to develop specific signatures for each continent, age range, cancer type or even cancer stage.
As the main limitation of this work, we highlight the modest size of our population.
5. Conclusions
Our results indicate, as the main conclusion of the present study, that the feces of patients affected by different tumor types, such as CRC and NSCLC, show a differential intestinal microbiota profile. We propose a gut bacteria panel for each cancer type and demonstrate its potential application in cancer diagnosis. Furthermore, we report for the first time some bacteria associated with the cancer risk and perform a comparative analysis with bacteria panels coming from previous meta-analysis studies.
Author Contributions
Conceptualization, Sofía Tesolato, Juan Vicente-Valor, Dulcenombre Gómez-Garre, Adriana Ortega-Hernández, Antonio Torres and Pilar Iniesta; Formal analysis, Sofía Tesolato, Juan Vicente-Valor, Mateo Paz-Cabezas, Dulcenombre Gómez-Garre, Adriana Ortega-Hernández, Sofía de la Serna, Inmaculada Domínguez-Serrano, Jana Dziakova, Daniel Rivera, Jose-Ramón Jarabo and Pilar Iniesta; Funding acquisition, Antonio Torres and Pilar Iniesta; Investigation, Sofía Tesolato, Juan Vicente-Valor, Mateo Paz-Cabezas, Dulcenombre Gómez-Garre, Silvia Sánchez-González, Adriana Ortega-Hernández, Sofía de la Serna, Inmaculada Domínguez-Serrano, Jana Dziakova, Daniel Rivera, Jose-Ramón Jarabo and Pilar Iniesta; Methodology, Sofía Tesolato, Juan Vicente-Valor, Mateo Paz-Cabezas, Dulcenombre Gómez-Garre, Adriana Ortega-Hernández, Sofía de la Serna, Inmaculada Domínguez-Serrano, Jana Dziakova, Daniel Rivera, Jose-Ramón Jarabo, Florentino Hernando, Ana-María Gómez-Martínez, Antonio Torres and Pilar Iniesta; Project administration, Antonio Torres and Pilar Iniesta; Supervision, Mateo Paz-Cabezas, Dulcenombre Gómez-Garre, Florentino Hernando, Antonio Torres and Pilar Iniesta; Validation, Sofía Tesolato, Juan Vicente-Valor, Mateo Paz-Cabezas, Dulcenombre Gómez-Garre, Silvia Sánchez-González, Adriana Ortega-Hernández, Sofía de la Serna, Inmaculada Domínguez-Serrano, Jana Dziakova, Daniel Rivera, Jose-Ramón Jarabo, Florentino Hernando, Ana-María Gómez-Martínez, Antonio Torres and Pilar Iniesta; Writing – original draft, Sofía Tesolato, Juan Vicente-Valor and Pilar Iniesta; Writing – review & editing, Sofía Tesolato, Juan Vicente-Valor, Antonio Torres and Pilar Iniesta.
Funding
The present study was supported by grant PI19/00073 from the Carlos III Health Institute (Ministerio de Economía y Competitividad), Spain and co-funded by the European Union through the European Regional Development Fund (ERDF) ‘A way to make Europe’. Funders did not partic ipate in study design, data collection and analysis, decision to publish, nor preparation of the manuscript.
Availability of Data and Materials
We have deposit the raw sequence data in a public repository: Submission ID: SUB14179719. https://submit.ncbi.nlm.nih.gov/subs/sra/SUB14179719.
Competing Interests
Authors declare that there is no conflict of interests.
Ethics Approval and Consent to Participate
Written approval to develop this study was obtained from the Clinical Research Ethics Committee of the San Carlos Hospital (C.I. 19/549-E_BC, 27/12/2019), assuring the confidentiality of data to patients. Also, written informed consents were obtained from patients prior to investigation assuring the confidentiality of their data.
References
- Sharma R. Mapping of global, regional and national incidence, mortality and mortality-to-incidence ratio of lung cancer in 2020 and 2050. Int J Clin Oncol. 2022;27(4):665-75. [CrossRef]
- Xi Y, Xu P. Global colorectal cancer burden in 2020 and projections to 2040. Transl Oncol. 2021;14(10):101174. [CrossRef]
- Wu S, Hannun Y. The importance of extrinsic factors in the development of cancers. Mol Cell Oncol. 2016;3(3):e1143079. [CrossRef]
- El Tekle G, Garrett WS. Bacteria in cancer initiation, promotion and progression. Nat Rev Cancer. 2023;23(9):600-18. [CrossRef]
- Gilbert J, Blaser MJ, Caporaso JG, Jansson J, Lynch SV, Knight R. Current understanding of the human microbiome. Nat Med. 2018;24(4):392-400. [CrossRef]
- Jia W, Xie G, Jia W. Bile acid-microbiota crosstalk in gastrointestinal inflammation and carcinogenesis. Nat Rev Gastroenterol Hepatol. 2018;15(2):111-28. [CrossRef]
- Hou H, Chen D, Zhang K, Zhang W, Liu T, Wang S, et al. Gut microbiota-derived short-chain fatty acids and colorectal cancer: Ready for clinical translation? Cancer Lett. 2022;526:225-35. [CrossRef]
- Jin C, Lagoudas GK, Zhao C, Bullman S, Bhutkar A, Hu B, et al. Commensal Microbiota Promote Lung Cancer Development via γδ T Cells. Cell. 2019;176(5):998-1013.e16. [CrossRef]
- Wang N, Fang JY. Fusobacterium nucleatum, a key pathogenic factor and microbial biomarker for colorectal cancer. Trends Microbiol. 2023;31(2):159-72. [CrossRef]
- Riquelme E, Zhang Y, Zhang L, Montiel M, Zoltan M, Dong W, et al. Tumor Microbiome Diversity and Composition Influence Pancreatic Cancer Outcomes. Cell. 2019;178(4):795-806.e12. [CrossRef]
- Manzoor SS, Doedens A, Burns MB. The promise and challenge of cancer microbiome research. Genome Biol. 2020;21(1):131. [CrossRef]
- Dumont-Leblond N, Veillette M, Racine C, Joubert P, Duchaine C. Non-small cell lung cancer microbiota characterization: Prevalence of enteric and potentially pathogenic bacteria in cancer tissues. PLOS ONE. 2021;16(4):e0249832. [CrossRef]
- Bello S, Vengoechea JJ, Ponce-Alonso M, Figueredo AL, Mincholé E, Rezusta A, et al. Core Microbiota in Central Lung Cancer With Streptococcal Enrichment as a Possible Diagnostic Marker. Arch Bronconeumol. 2021;57(11):681-9. [CrossRef]
- Liu X, Cheng Y, Zang D, Zhang M, Li X, Liu D, et al. The Role of Gut Microbiota in Lung Cancer: From Carcinogenesis to Immunotherapy. Front Oncol. 2021;11:720842. [CrossRef]
- Thomas AM, Fidelle M, Routy B, Kroemer G, Wargo JA, Segata N, et al. Gut OncoMicrobiome Signatures (GOMS) as next-generation biomarkers for cancer immunotherapy. Nat Rev Clin Oncol. 2023;20(9):583-603. [CrossRef]
- Yang X, An H, He Y, Fu G, Jiang Z. Comprehensive analysis of microbiota signature across 32 cancer types. Front Oncol.2023;13:1127225. [CrossRef]
- Wong CC, Yu J. Gut microbiota in colorectal cancer development and therapy. Nat Rev Clin Oncol. 2023;1-24. [CrossRef]
- Birla P, Shaikh FY. De- «bug»-ing the microbiome in lung cancer. Cancer Metastasis Rev. 2022;41(2):335-46. [CrossRef]
- AJCC Cancer Staging Manual [Internet]. [cited 19 December 2023]. Available at: https://link.springer.com/book/9783319406176.
- Tesolato S, Ortega-Hernández A, Gómez-Garre D, Claver P, De Juan C, De la Serna S, et al. Gut microbiota profiles in feces and paired tumor and non-tumor tissues from Colorectal Cancer patients. Relationship to the Body Mass Index. PloS One. 2023;18(10):e0292551. [CrossRef]
- Bolyen E, Rideout JR, Dillon MR, Bokulich NA, Abnet CC, Al-Ghalith GA, et al. Reproducible, interactive, scalable and extensible microbiome data science using QIIME 2. Nat Biotechnol. 2019;37(8):852-7. [CrossRef]
- Segata N, Izard J, Waldron L, Gevers D, Miropolsky L, Garrett WS, et al. Metagenomic biomarker discovery and explanation. Genome Biol. 2011;12(6):R60. [CrossRef]
- Budczies J, Klauschen F, Sinn BV, Győrffy B, Schmitt WD, Darb-Esfahani S, et al. Cutoff Finder: a comprehensive and straightforward Web application enabling rapid biomarker cutoff optimization. PloS One. 2012;7(12):e51862. [CrossRef]
- DeLong ER, DeLong DM, Clarke-Pearson DL. Comparing the areas under two or more correlated receiver operating characteristic curves: a nonparametric approach. Biometrics. 1988;44(3):837-45.
- Ai D, Pan H, Li X, Gao Y, Liu G, Xia LC. Identifying Gut Microbiota Associated With Colorectal Cancer Using a Zero-Inflated Lognormal Model. Front Microbiol. 2019;10:826. [CrossRef]
- Liu W, Zhang R, Shu R, Yu J, Li H, Long H, et al. Study of the Relationship between Microbiome and Colorectal Cancer Susceptibility Using 16SrRNA Sequencing. BioMed Res Int. 2020;2020:7828392. [CrossRef]
- Zhuang H, Cheng L, Wang Y, Zhang YK, Zhao MF, Liang GD, et al. Dysbiosis of the Gut Microbiome in Lung Cancer. Front Cell Infect Microbiol. 2019;9:112. [CrossRef]
- Bhatt AP, Redinbo MR, Bultman SJ. The Role of the Microbiome in Cancer Development and Therapy. CA Cancer J Clin. 2017;67(4):326-44. [CrossRef]
- Zhao L, Grimes SM, Greer SU, Kubit M, Lee H, Nadauld LD, et al. Characterization of the consensus mucosal microbiome of colorectal cancer. NAR Cancer. 2021;3(4):zcab049. [CrossRef]
- Cullin N, Azevedo Antunes C, Straussman R, Stein-Thoeringer CK, Elinav E. Microbiome and cancer. Cancer Cell. 2021;39(10):1317-41. [CrossRef]
- van Elsland DM, Duijster JW, Zhang J, Stévenin V, Zhang Y, Zha L, et al. Repetitive non-typhoidal Salmonella exposure is an environmental risk factor for colon cancer and tumor growth. Cell Rep Med. 2022;3(12):100852. [CrossRef]
- Qi Z, Zhibo Z, Jing Z, Zhanbo Q, Shugao H, Weili J, et al. Prediction model of poorly differentiated colorectal cancer (CRC) based on gut bacteria. BMC Microbiol. 2022;22(1):312. [CrossRef]
- Ghorbani E, Avan A, Ryzhikov M, Ferns G, Khazaei M, Soleimanpour S. Role of lactobacillus strains in the management of colorectal cancer: An overview of recent advances. Nutrition. 2022;103-104:111828. [CrossRef]
- Sobhani I, Tap J, Roudot-Thoraval F, Roperch JP, Letulle S, Langella P, et al. Microbial Dysbiosis in Colorectal Cancer (CRC) Patients. PloS One. 2011;6(1):e16393. [CrossRef]
- Zheng Y, Fang Z, Xue Y, Zhang J, Zhu J, Gao R, et al. Specific gut microbiome signature predicts the early-stage lung cancer. Gut Microbes. 2020;11(4):1030-42. [CrossRef]
- Yusuf K, Sampath V, Umar S. Bacterial Infections and Cancer: Exploring This Association And Its Implications for Cancer Patients. Int J Mol Sci. 2023;24(4):3110. [CrossRef]
- Yu H, Li XX, Han X, Chen BX, Zhang XH, Gao S, et al. Fecal microbiota transplantation inhibits colorectal cancer progression: Reversing intestinal microbial dysbiosis to enhance anti-cancer immune responses. Front Microbiol. 2023;14:1126808. [CrossRef]
- Wang Y, Zhang C, Hou S, Wu X, Liu J, Wan X. Analyses of Potential Driver and Passenger Bacteria in Human Colorectal Cancer. Cancer Manag Res. 2020;12:11553-61. [CrossRef]
- Ni B, Kong X, Yan Y, Fu B, Zhou F, Xu S. Combined analysis of gut microbiome and serum metabolomics reveals novel biomarkers in patients with early-stage non-small cell lung cancer. Front Cell Infect Microbiol. 2023;13:1091825. [CrossRef]
- Hakozaki T, Nolin-Lapalme A, Kogawa M, Okuma Y, Nakamura S, Moreau-Amaru D, et al. Cancer Cachexia among Patients with Advanced Non-Small-Cell Lung Cancer on Immunotherapy: An Observational Study with Exploratory Gut Microbiota Analysis. Cancers. 2022;14(21):5405. [CrossRef]
- Maddi A, Sabharwal A, Violante T, Manuballa S, Genco R, Patnaik S, et al. The microbiome and lung cancer. J Thorac Dis.2019;11(1):280-91. [CrossRef]
- Bagheri Z, Moeinzadeh L, Razmkhah M. Roles of Microbiota in Cancer: From Tumor Development to Treatment. J Oncol. 2022;2022:3845104. [CrossRef]
- Hosmer DW, Lemeshow S. Area under the ROC curve. Appl Logist Regres. 2000;160-4.
- Sender R, Fuchs S, Milo R. Revised Estimates for the Number of Human and Bacteria Cells in the Body. PLoS Biol. 2016;14(8):e1002533. [CrossRef]
- NIH Human Microbiome Project - HMQCP [Internet]. [cited 16 January 2024]. Available at: https://hmpdacc.org/HMQCP/.
Figure 1.
Alpha diversity comparison between feces from Colorectal Cancer (CRC) patients and Controls. (a) Observed OTUs (b) Chao1 index (c) Shannon index (d) Pielou’s evenness index (e) Simpson index. Median values with interquartile range and p values are indicated.
Figure 1.
Alpha diversity comparison between feces from Colorectal Cancer (CRC) patients and Controls. (a) Observed OTUs (b) Chao1 index (c) Shannon index (d) Pielou’s evenness index (e) Simpson index. Median values with interquartile range and p values are indicated.
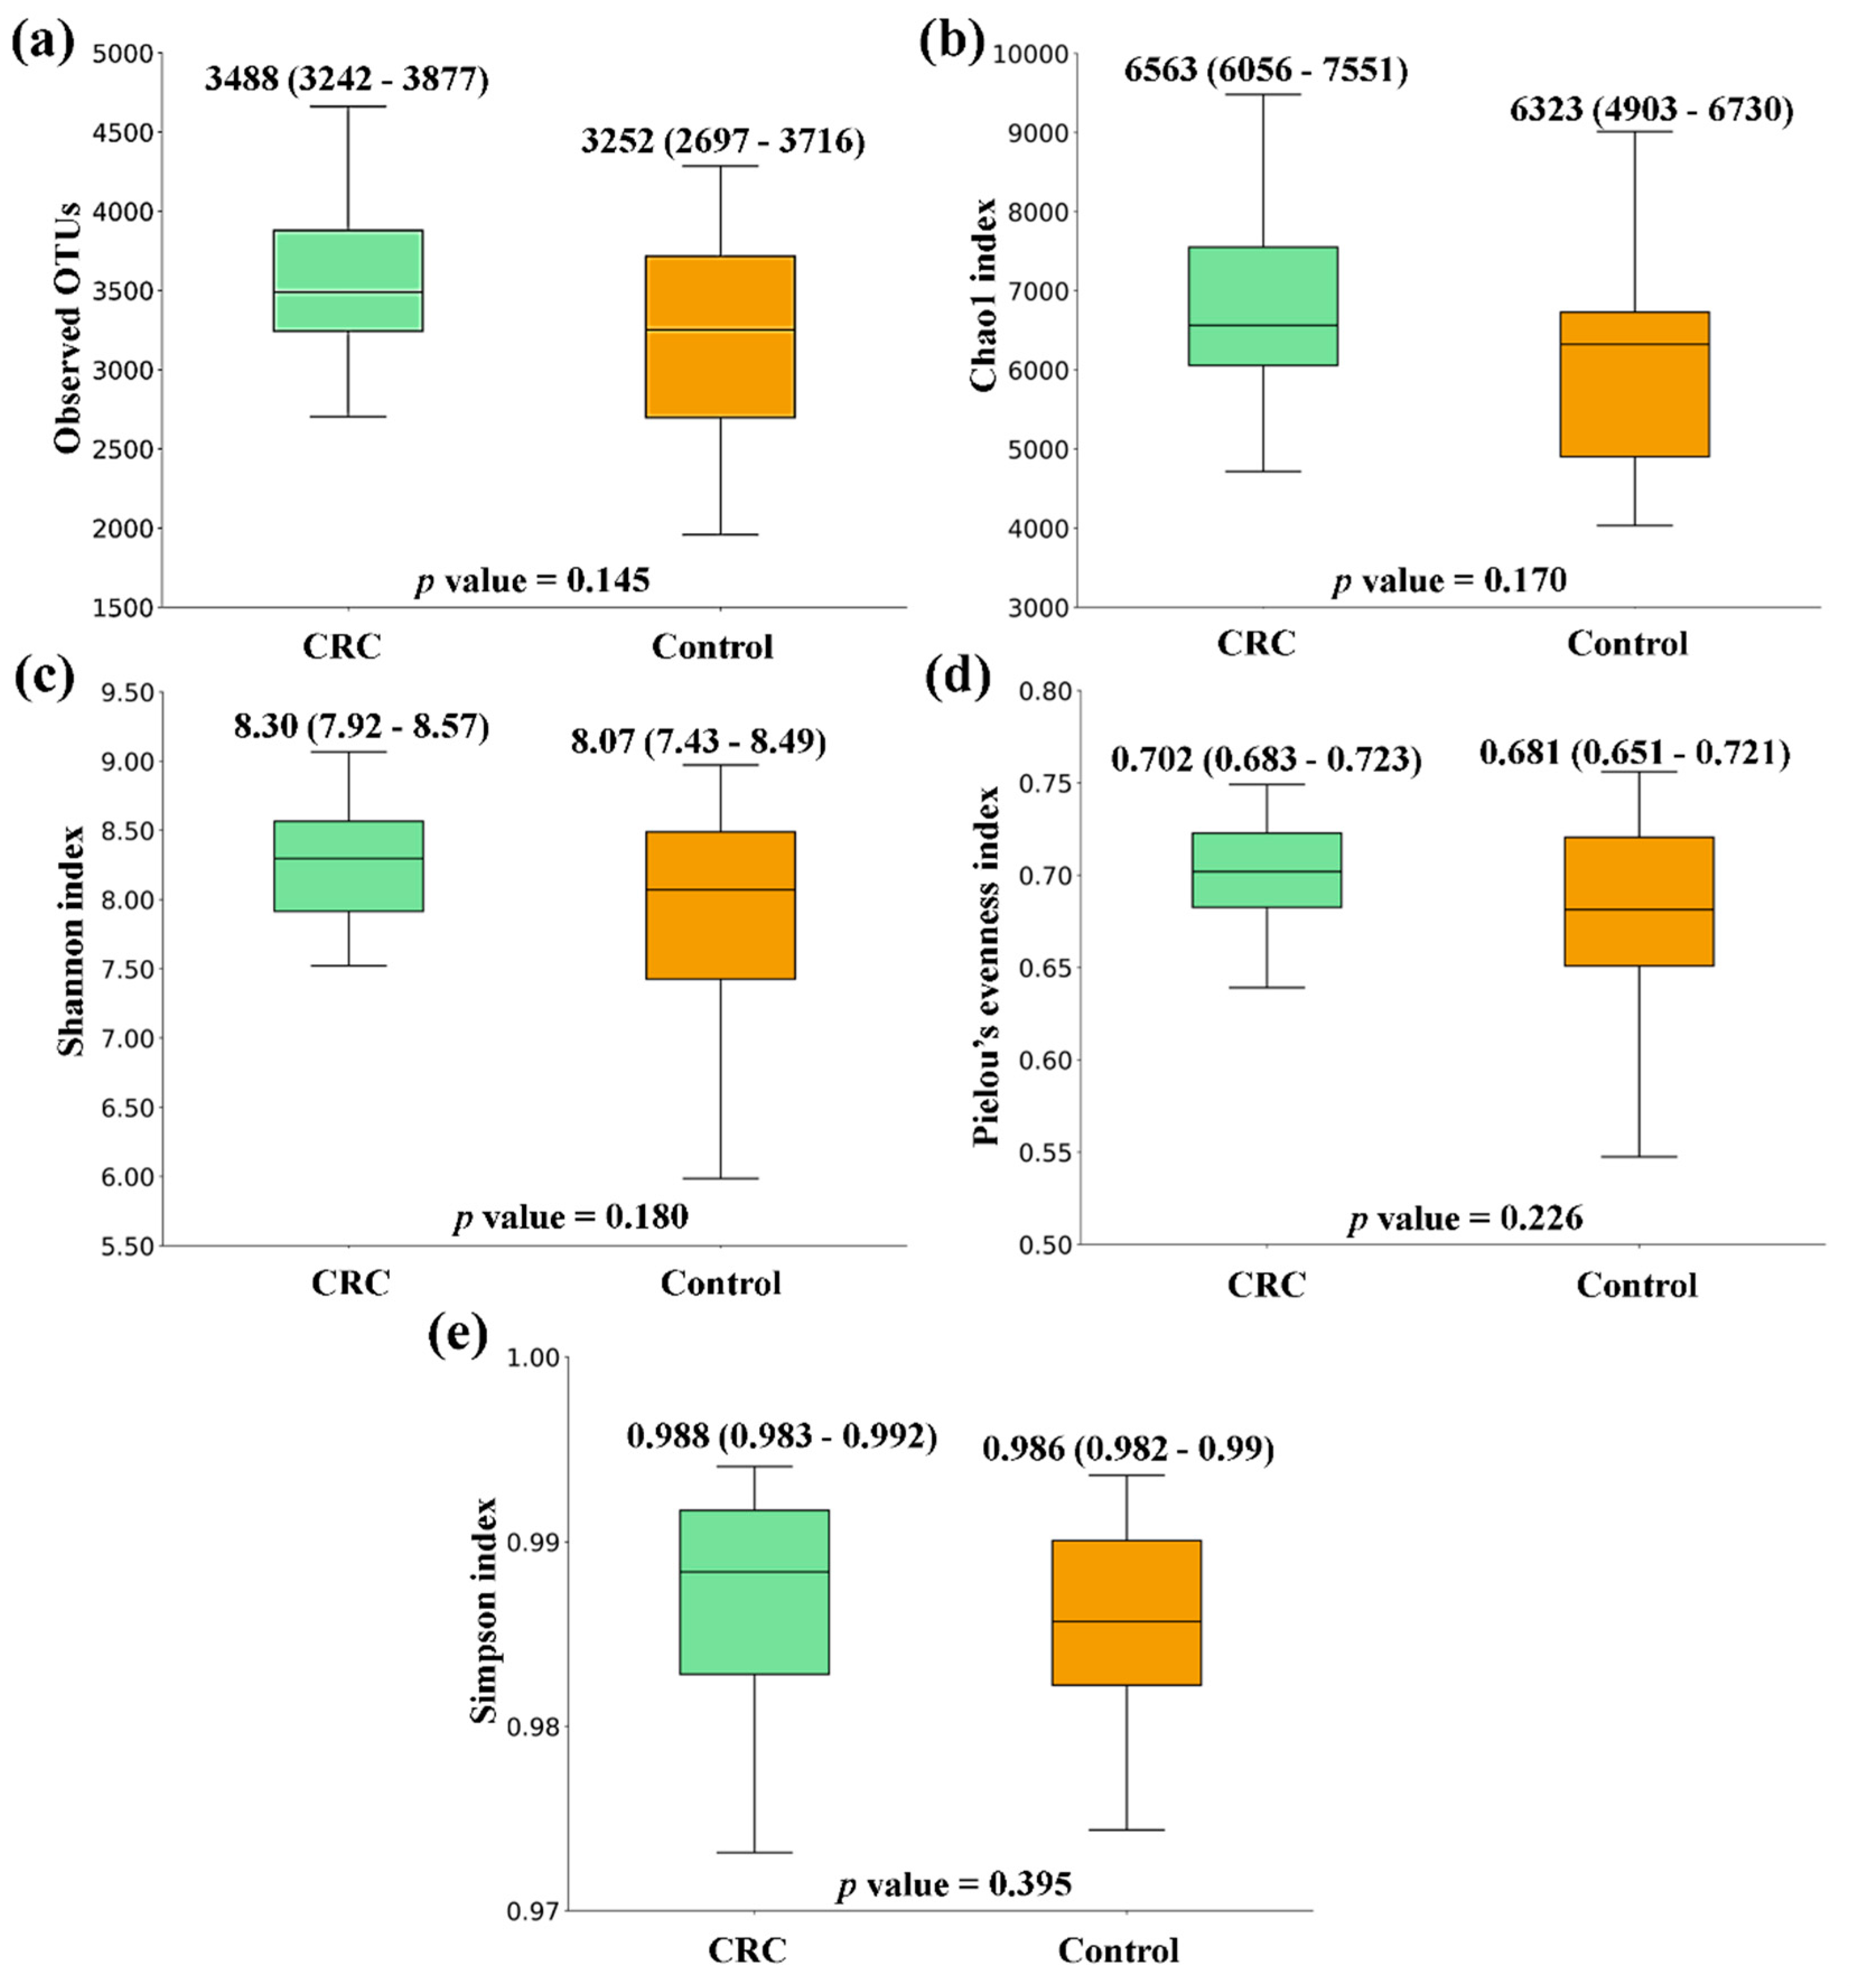
Figure 2.
Alpha diversity comparison between feces from Non-Small Cell Lung Cancer (NSCLC) patients and Controls. (a) Observed OTUs (b) Chao1 index (c) Shannon index (d) Pielou’s evenness index (e) Simpson index. Median values with interquartile range and p values are indicated.
Figure 2.
Alpha diversity comparison between feces from Non-Small Cell Lung Cancer (NSCLC) patients and Controls. (a) Observed OTUs (b) Chao1 index (c) Shannon index (d) Pielou’s evenness index (e) Simpson index. Median values with interquartile range and p values are indicated.
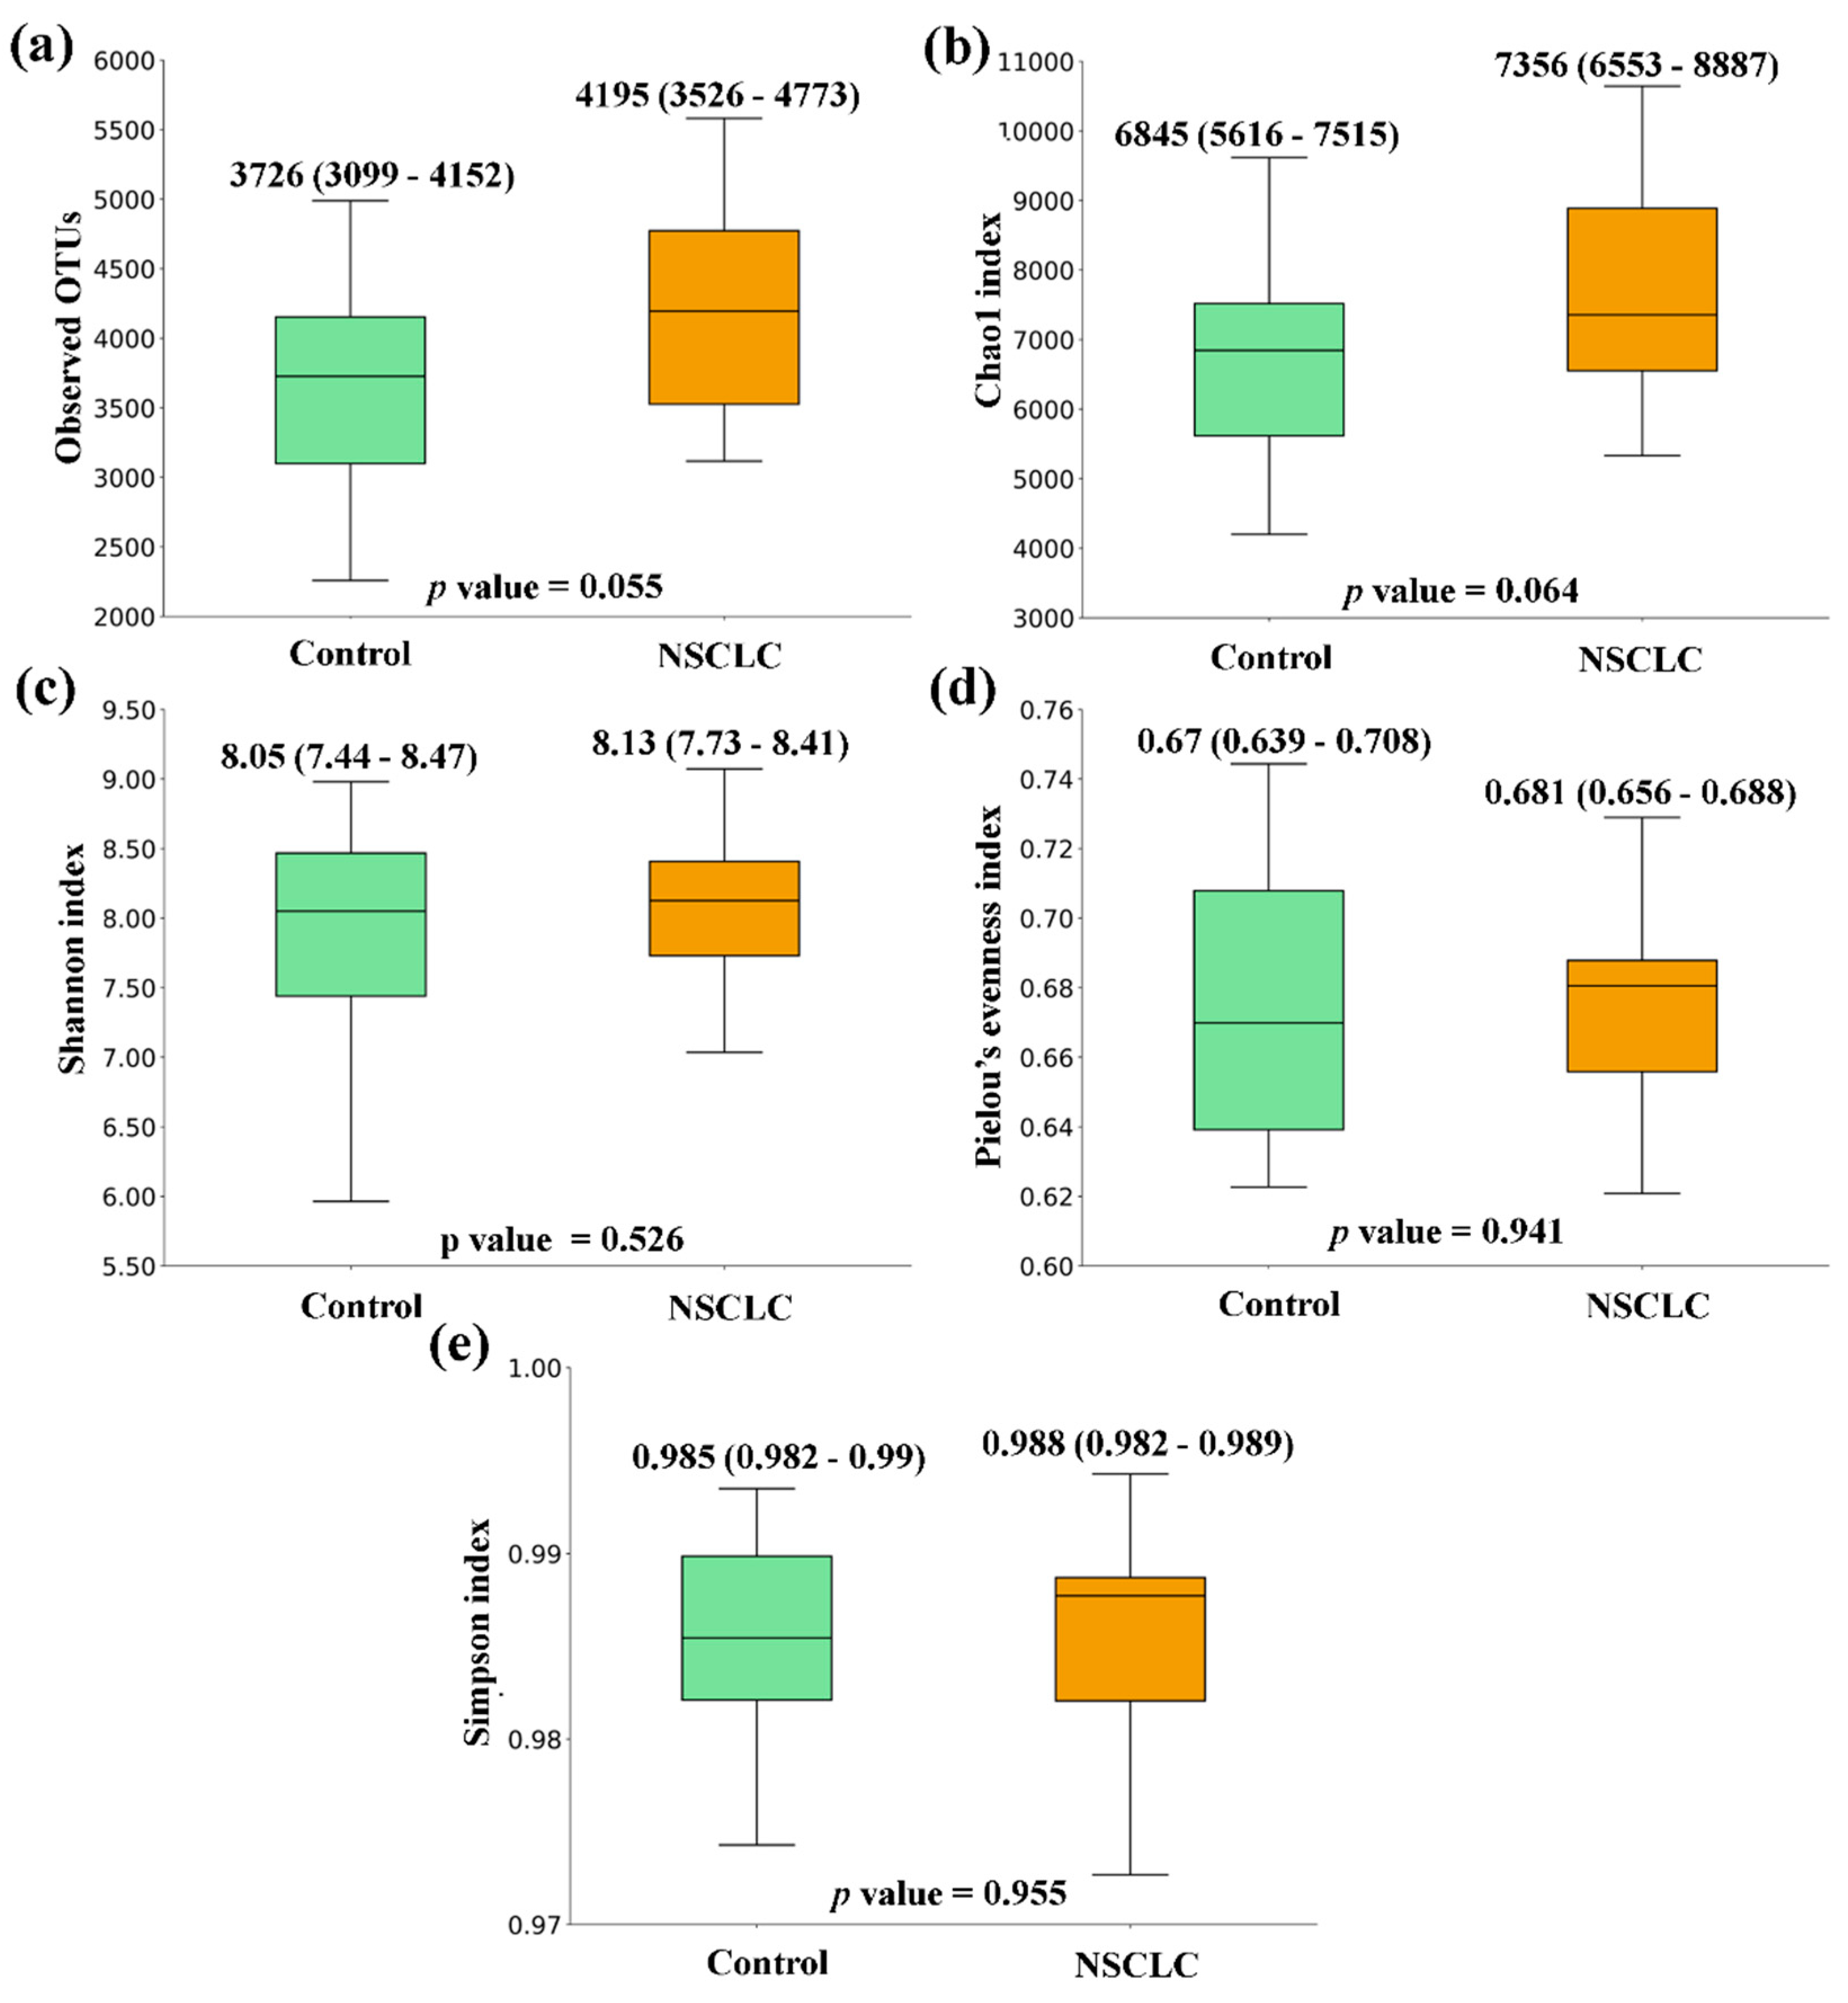
Figure 3.
Alpha diversity comparison between feces from Colorectal Cancer (CRC) and Non-Small Cell Lung Cancer (NSCLC) patients. (a) Observed OTUs (b) Chao1 index (c) Shannon index (d) Pielou’s evenness index (e) Simpson index. Median values with interquartile range and p values are indicated.
Figure 3.
Alpha diversity comparison between feces from Colorectal Cancer (CRC) and Non-Small Cell Lung Cancer (NSCLC) patients. (a) Observed OTUs (b) Chao1 index (c) Shannon index (d) Pielou’s evenness index (e) Simpson index. Median values with interquartile range and p values are indicated.
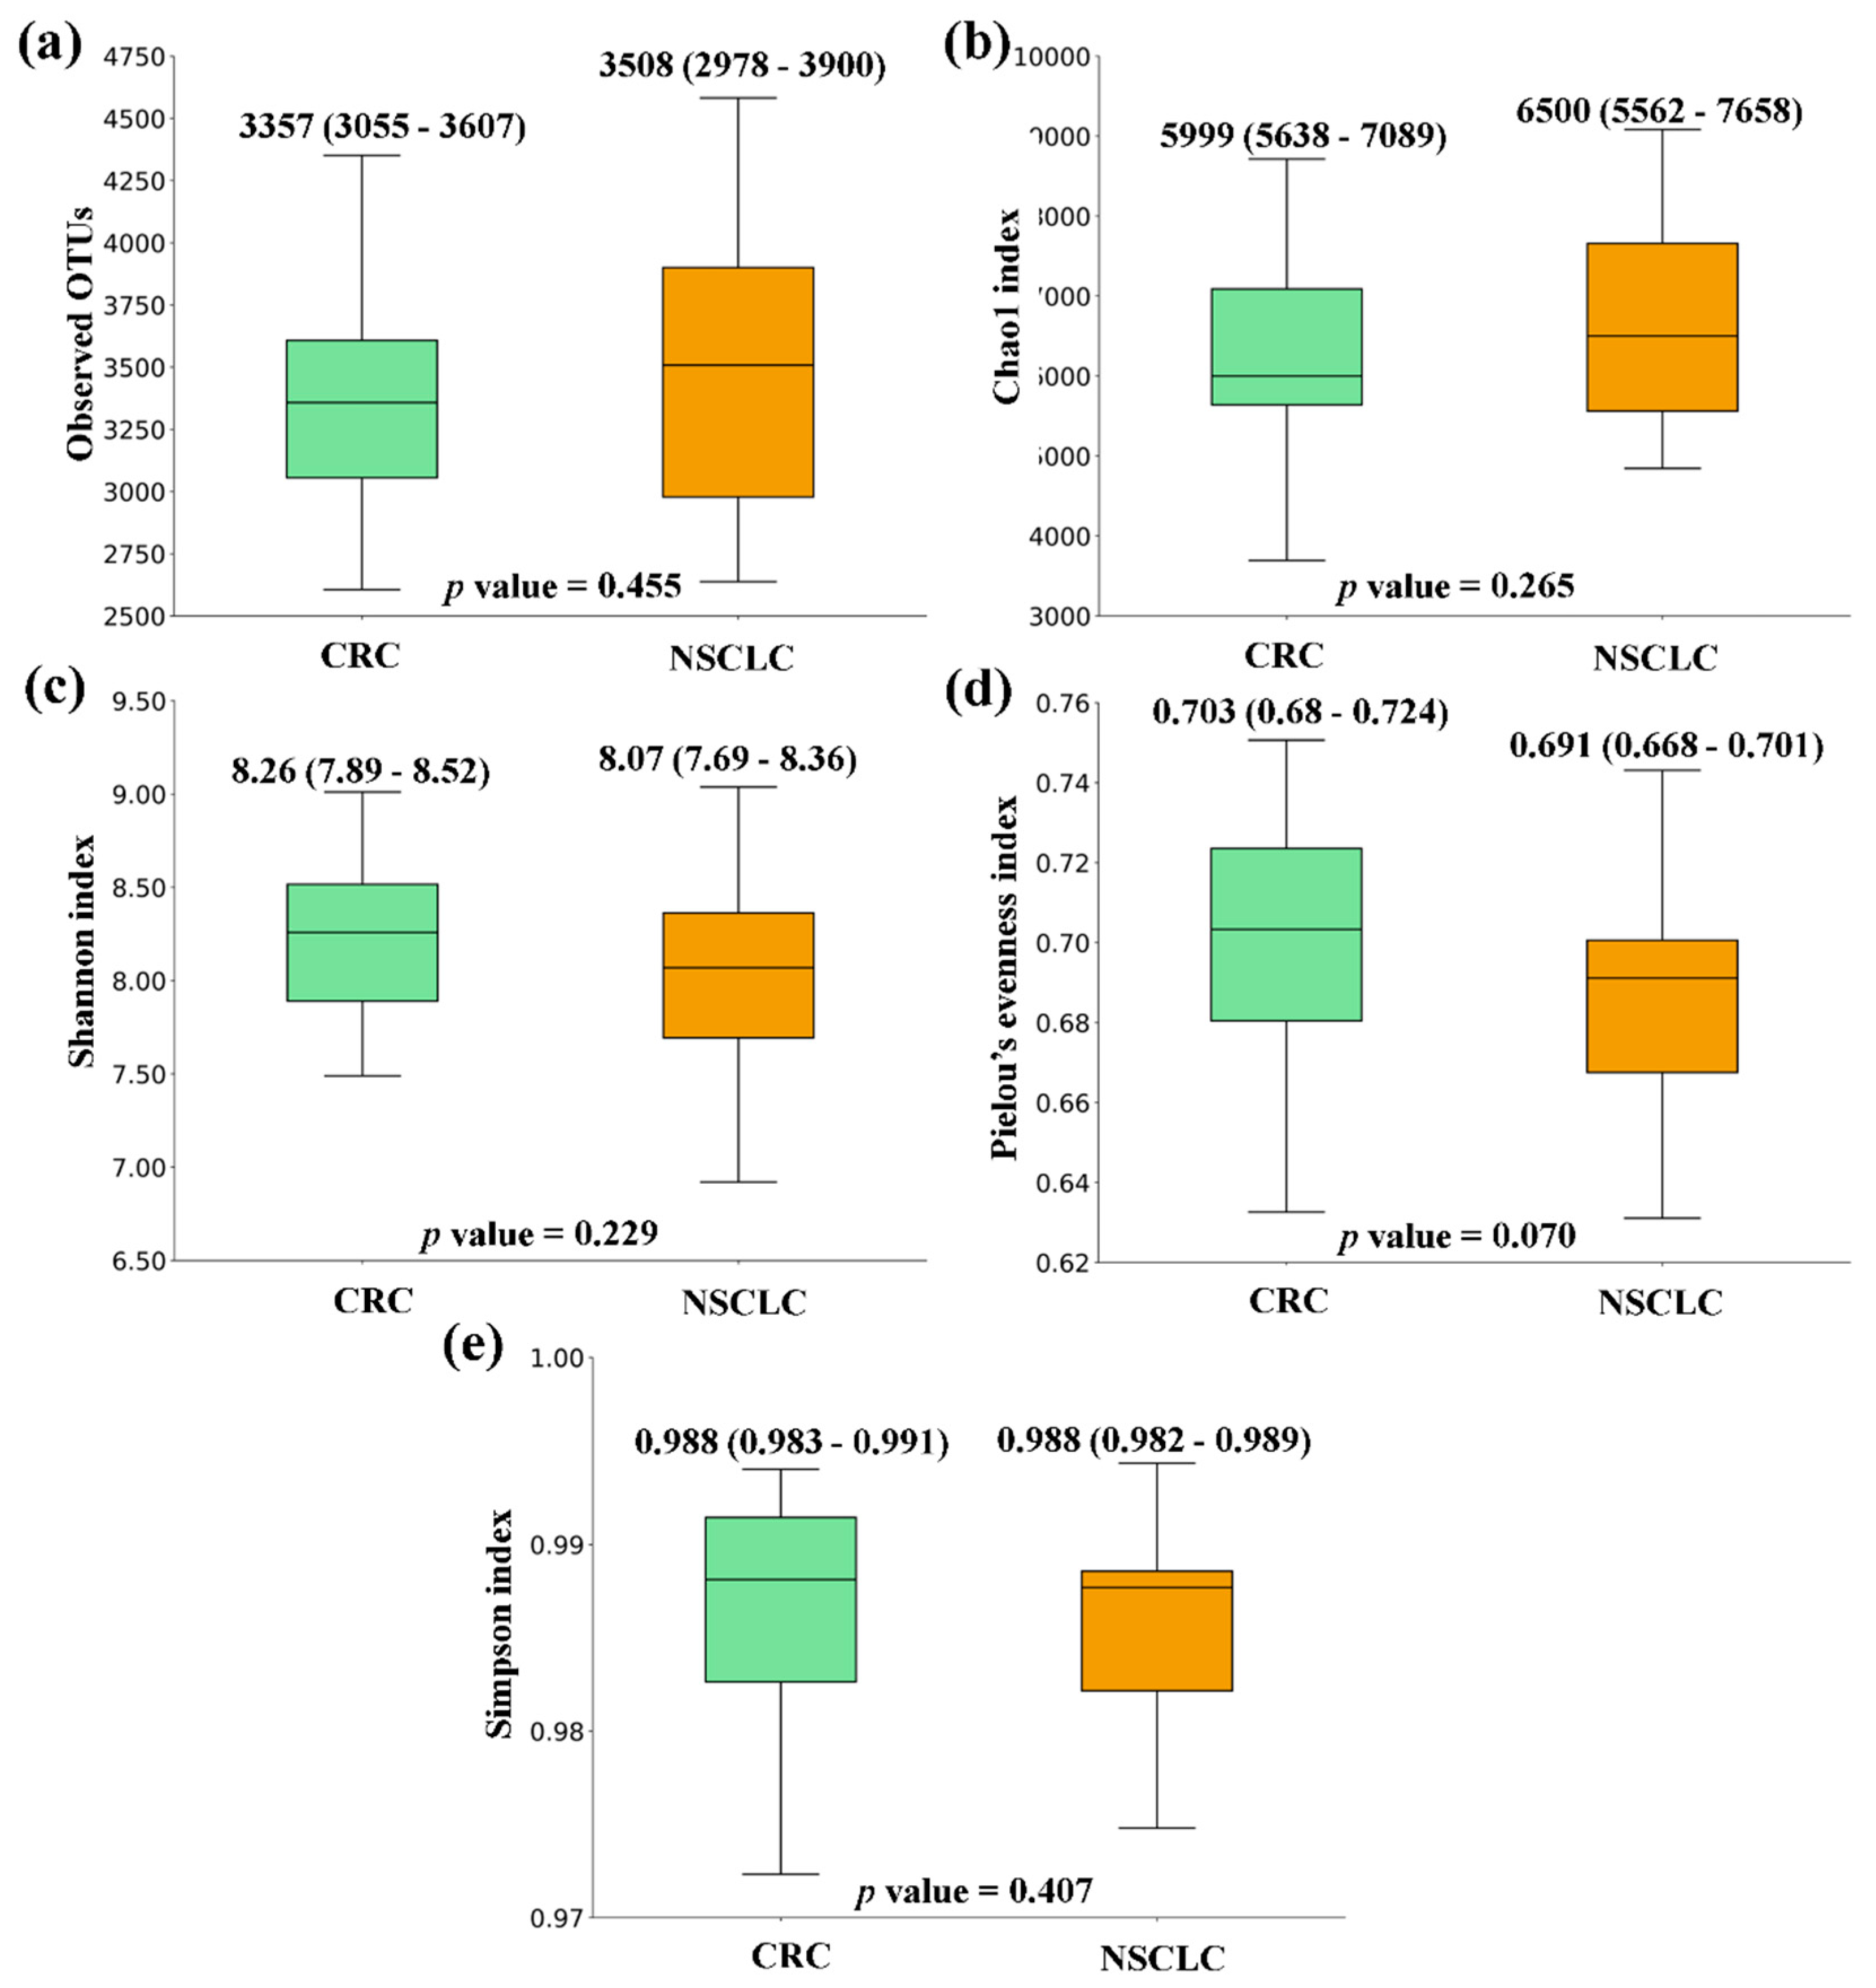
Figure 4.
Principal Coordinates Analysis (PCoA) plots based on Jaccard index for feces from Colorectal Cancer (CRC) patients, Non-Small Cell Lung Cancer (NSCLC) patients and Controls. (a) CRC vs. Controls (b) NSCLC vs. Controls (c) CRC vs. NSCLC.
Figure 4.
Principal Coordinates Analysis (PCoA) plots based on Jaccard index for feces from Colorectal Cancer (CRC) patients, Non-Small Cell Lung Cancer (NSCLC) patients and Controls. (a) CRC vs. Controls (b) NSCLC vs. Controls (c) CRC vs. NSCLC.
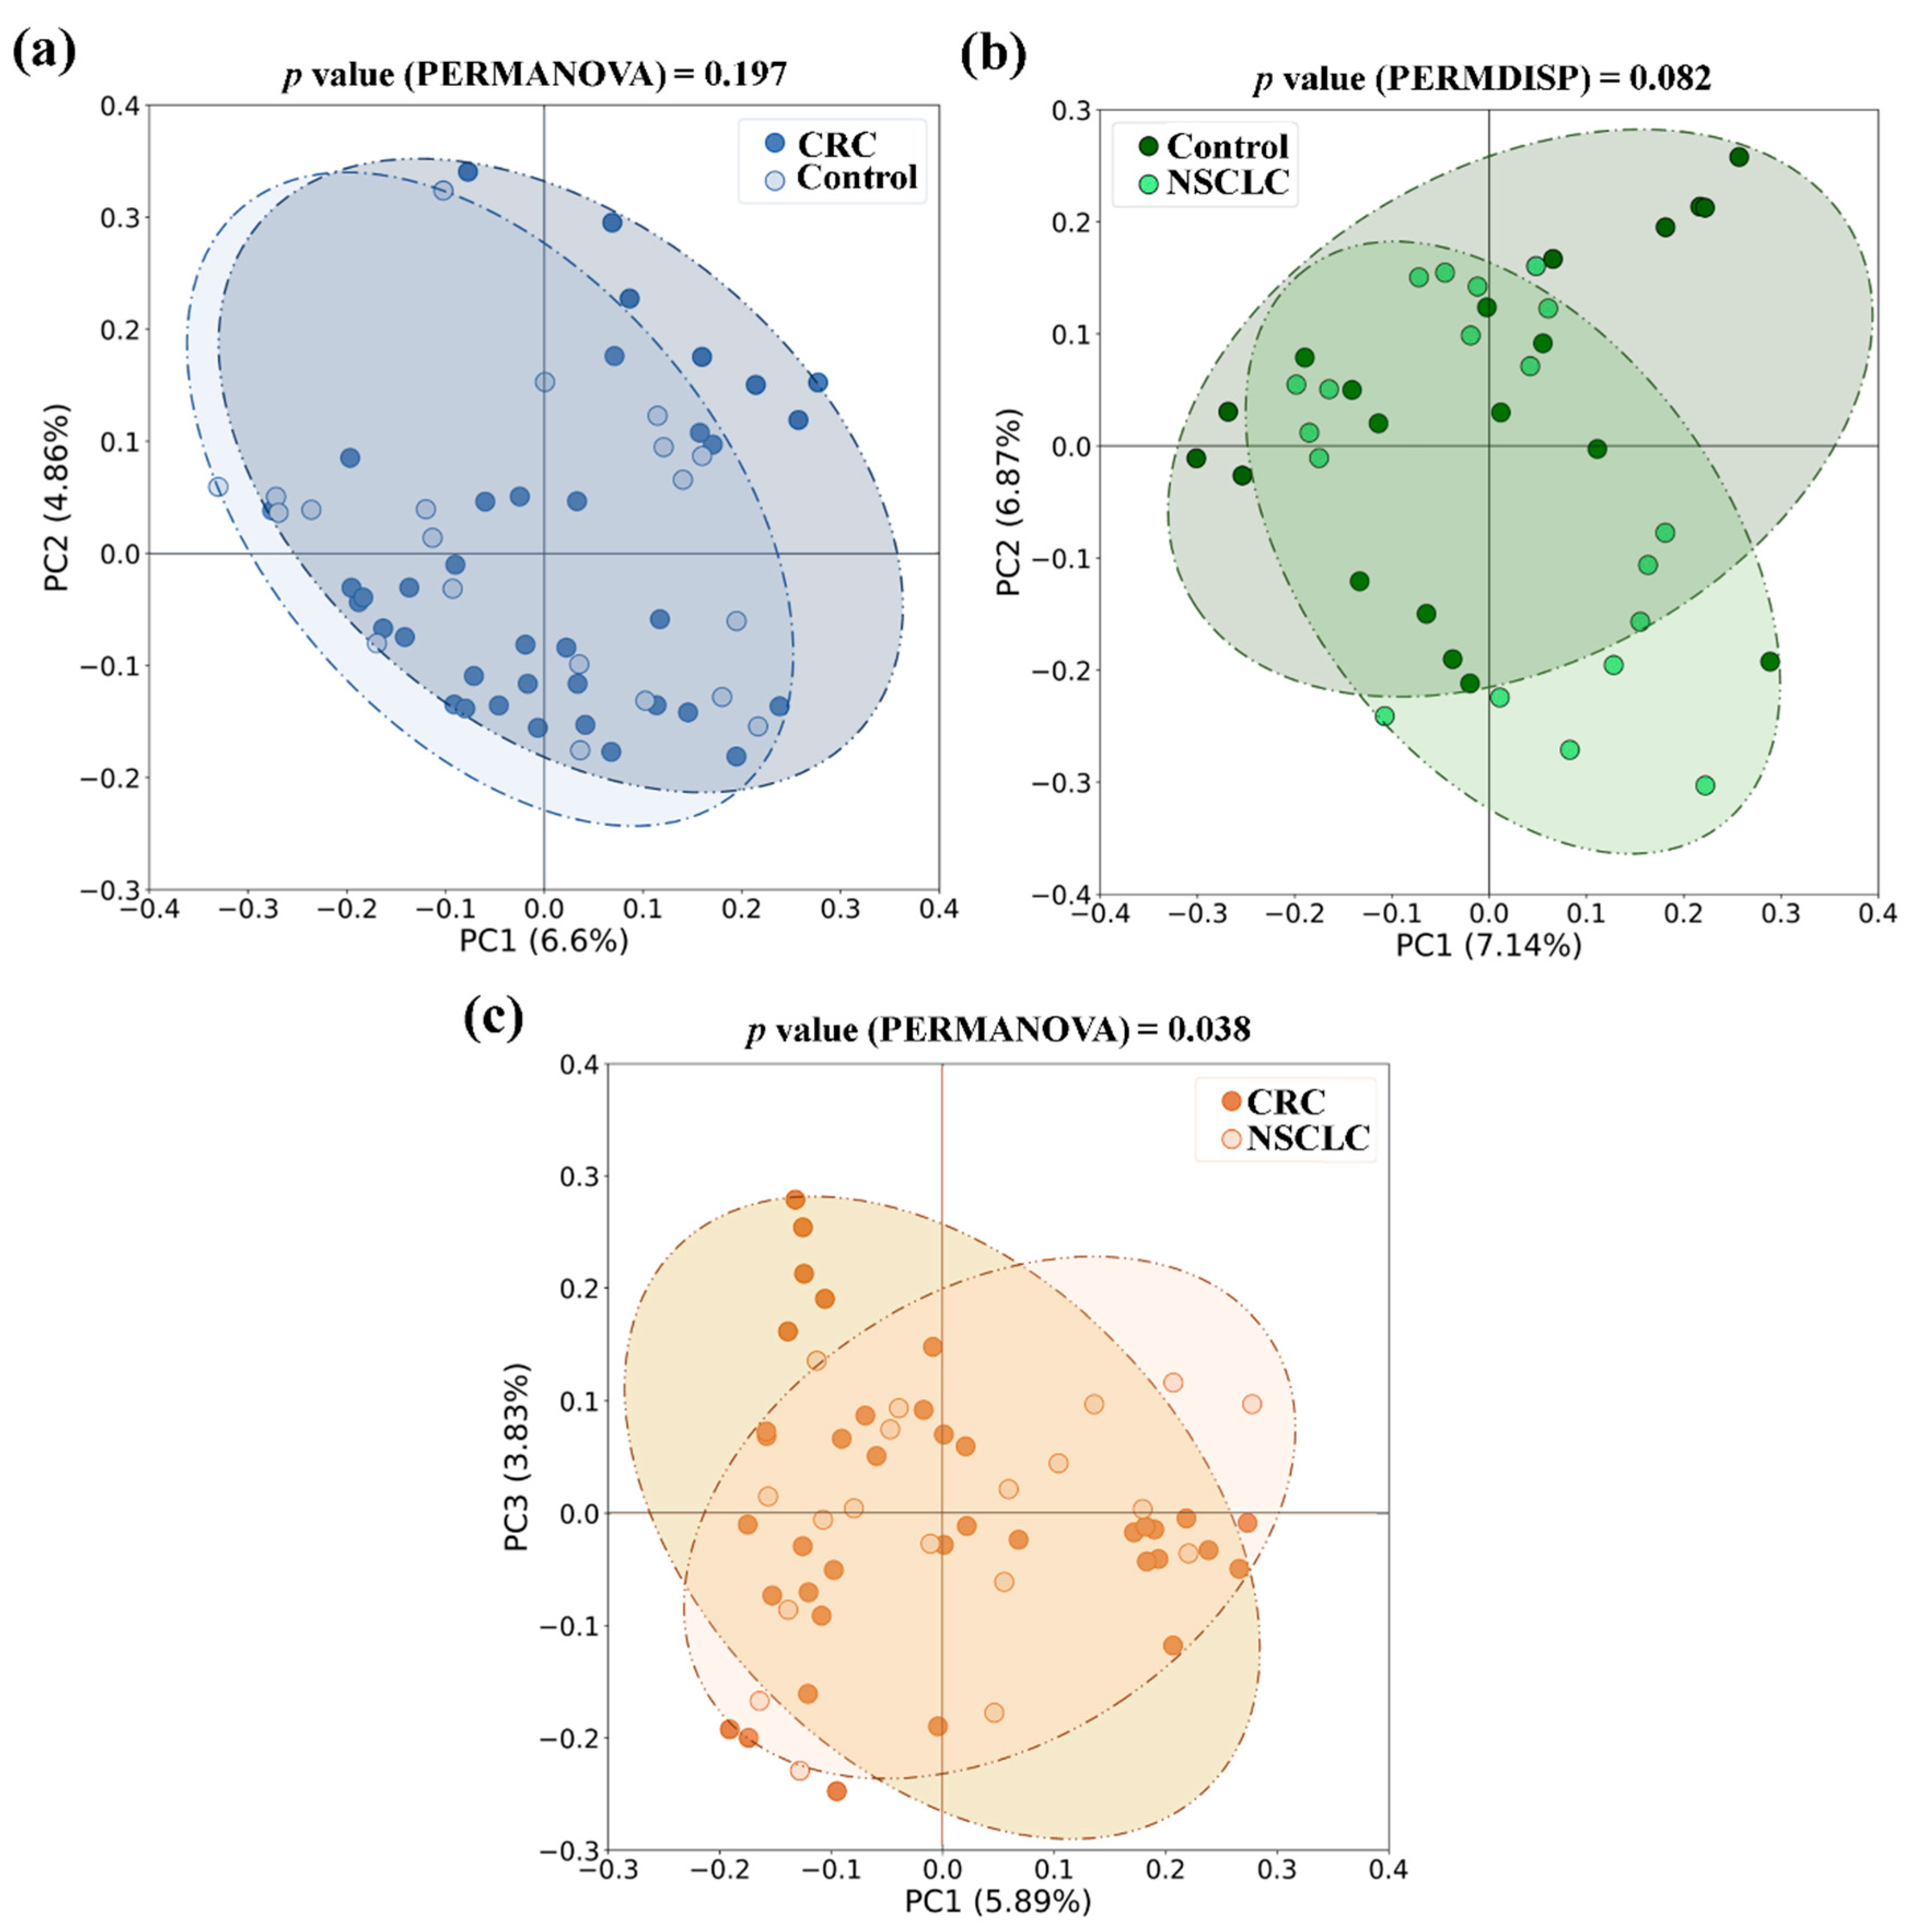
Figure 5.
Taxonomic comparison at bacterial genus level between feces from Colorectal Cancer (CRC) patients, Non-Small Cell Lung Cancer (NSCLC) patients and Controls (Venn diagrams and LEfSe analysis). (a) CRC vs. Controls (b) NSCLC vs. Controls (c) CRC vs. NSCLC.
Figure 5.
Taxonomic comparison at bacterial genus level between feces from Colorectal Cancer (CRC) patients, Non-Small Cell Lung Cancer (NSCLC) patients and Controls (Venn diagrams and LEfSe analysis). (a) CRC vs. Controls (b) NSCLC vs. Controls (c) CRC vs. NSCLC.
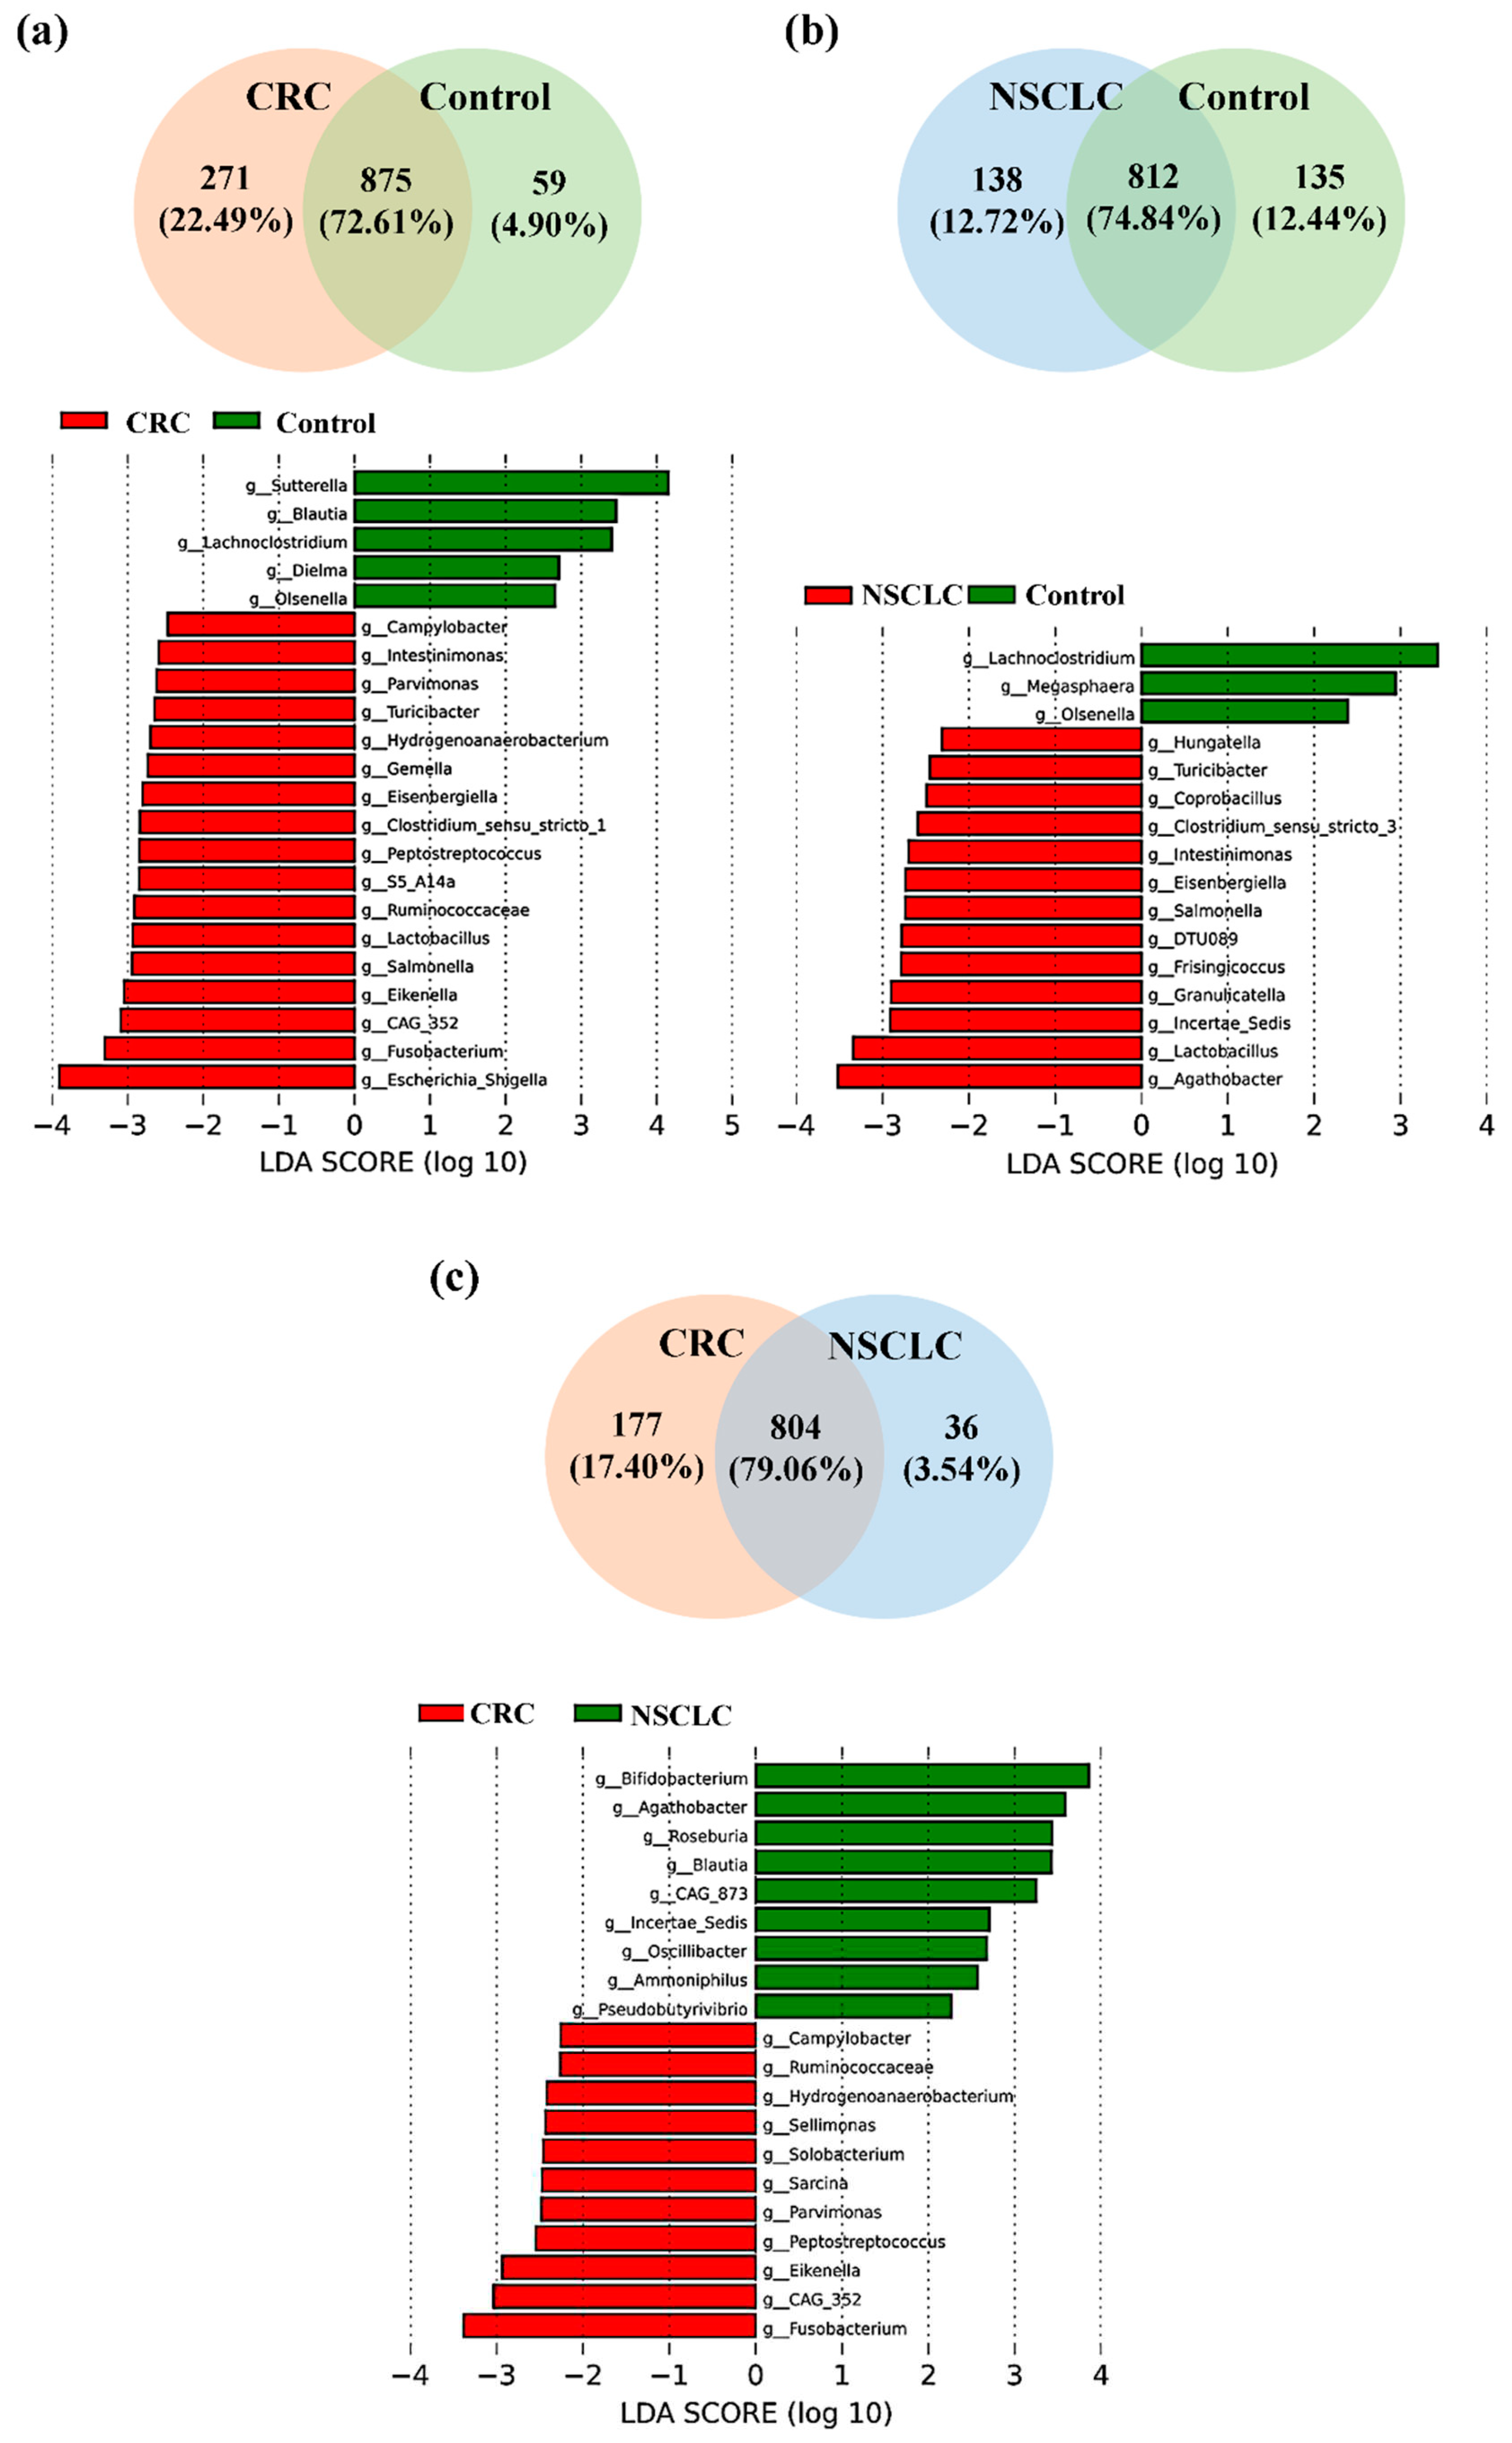
Figure 6.
Receiver Operating Characteristic (ROC) curves of diagnostic accuracy of fecal microbiota signatures applied to our study population. (a) Proposed Colorectal Cancer (CRC) signature (b) Proposed Non-Small Cell Lung Cancer (NSCLC) signature (c, d) Signature proposed by Thomas et al. [15] applied to CRC and NSCLC, respectively (e, f) Signature proposed by Yang et al. [16] applied to CRC and NSCLC, respectively.
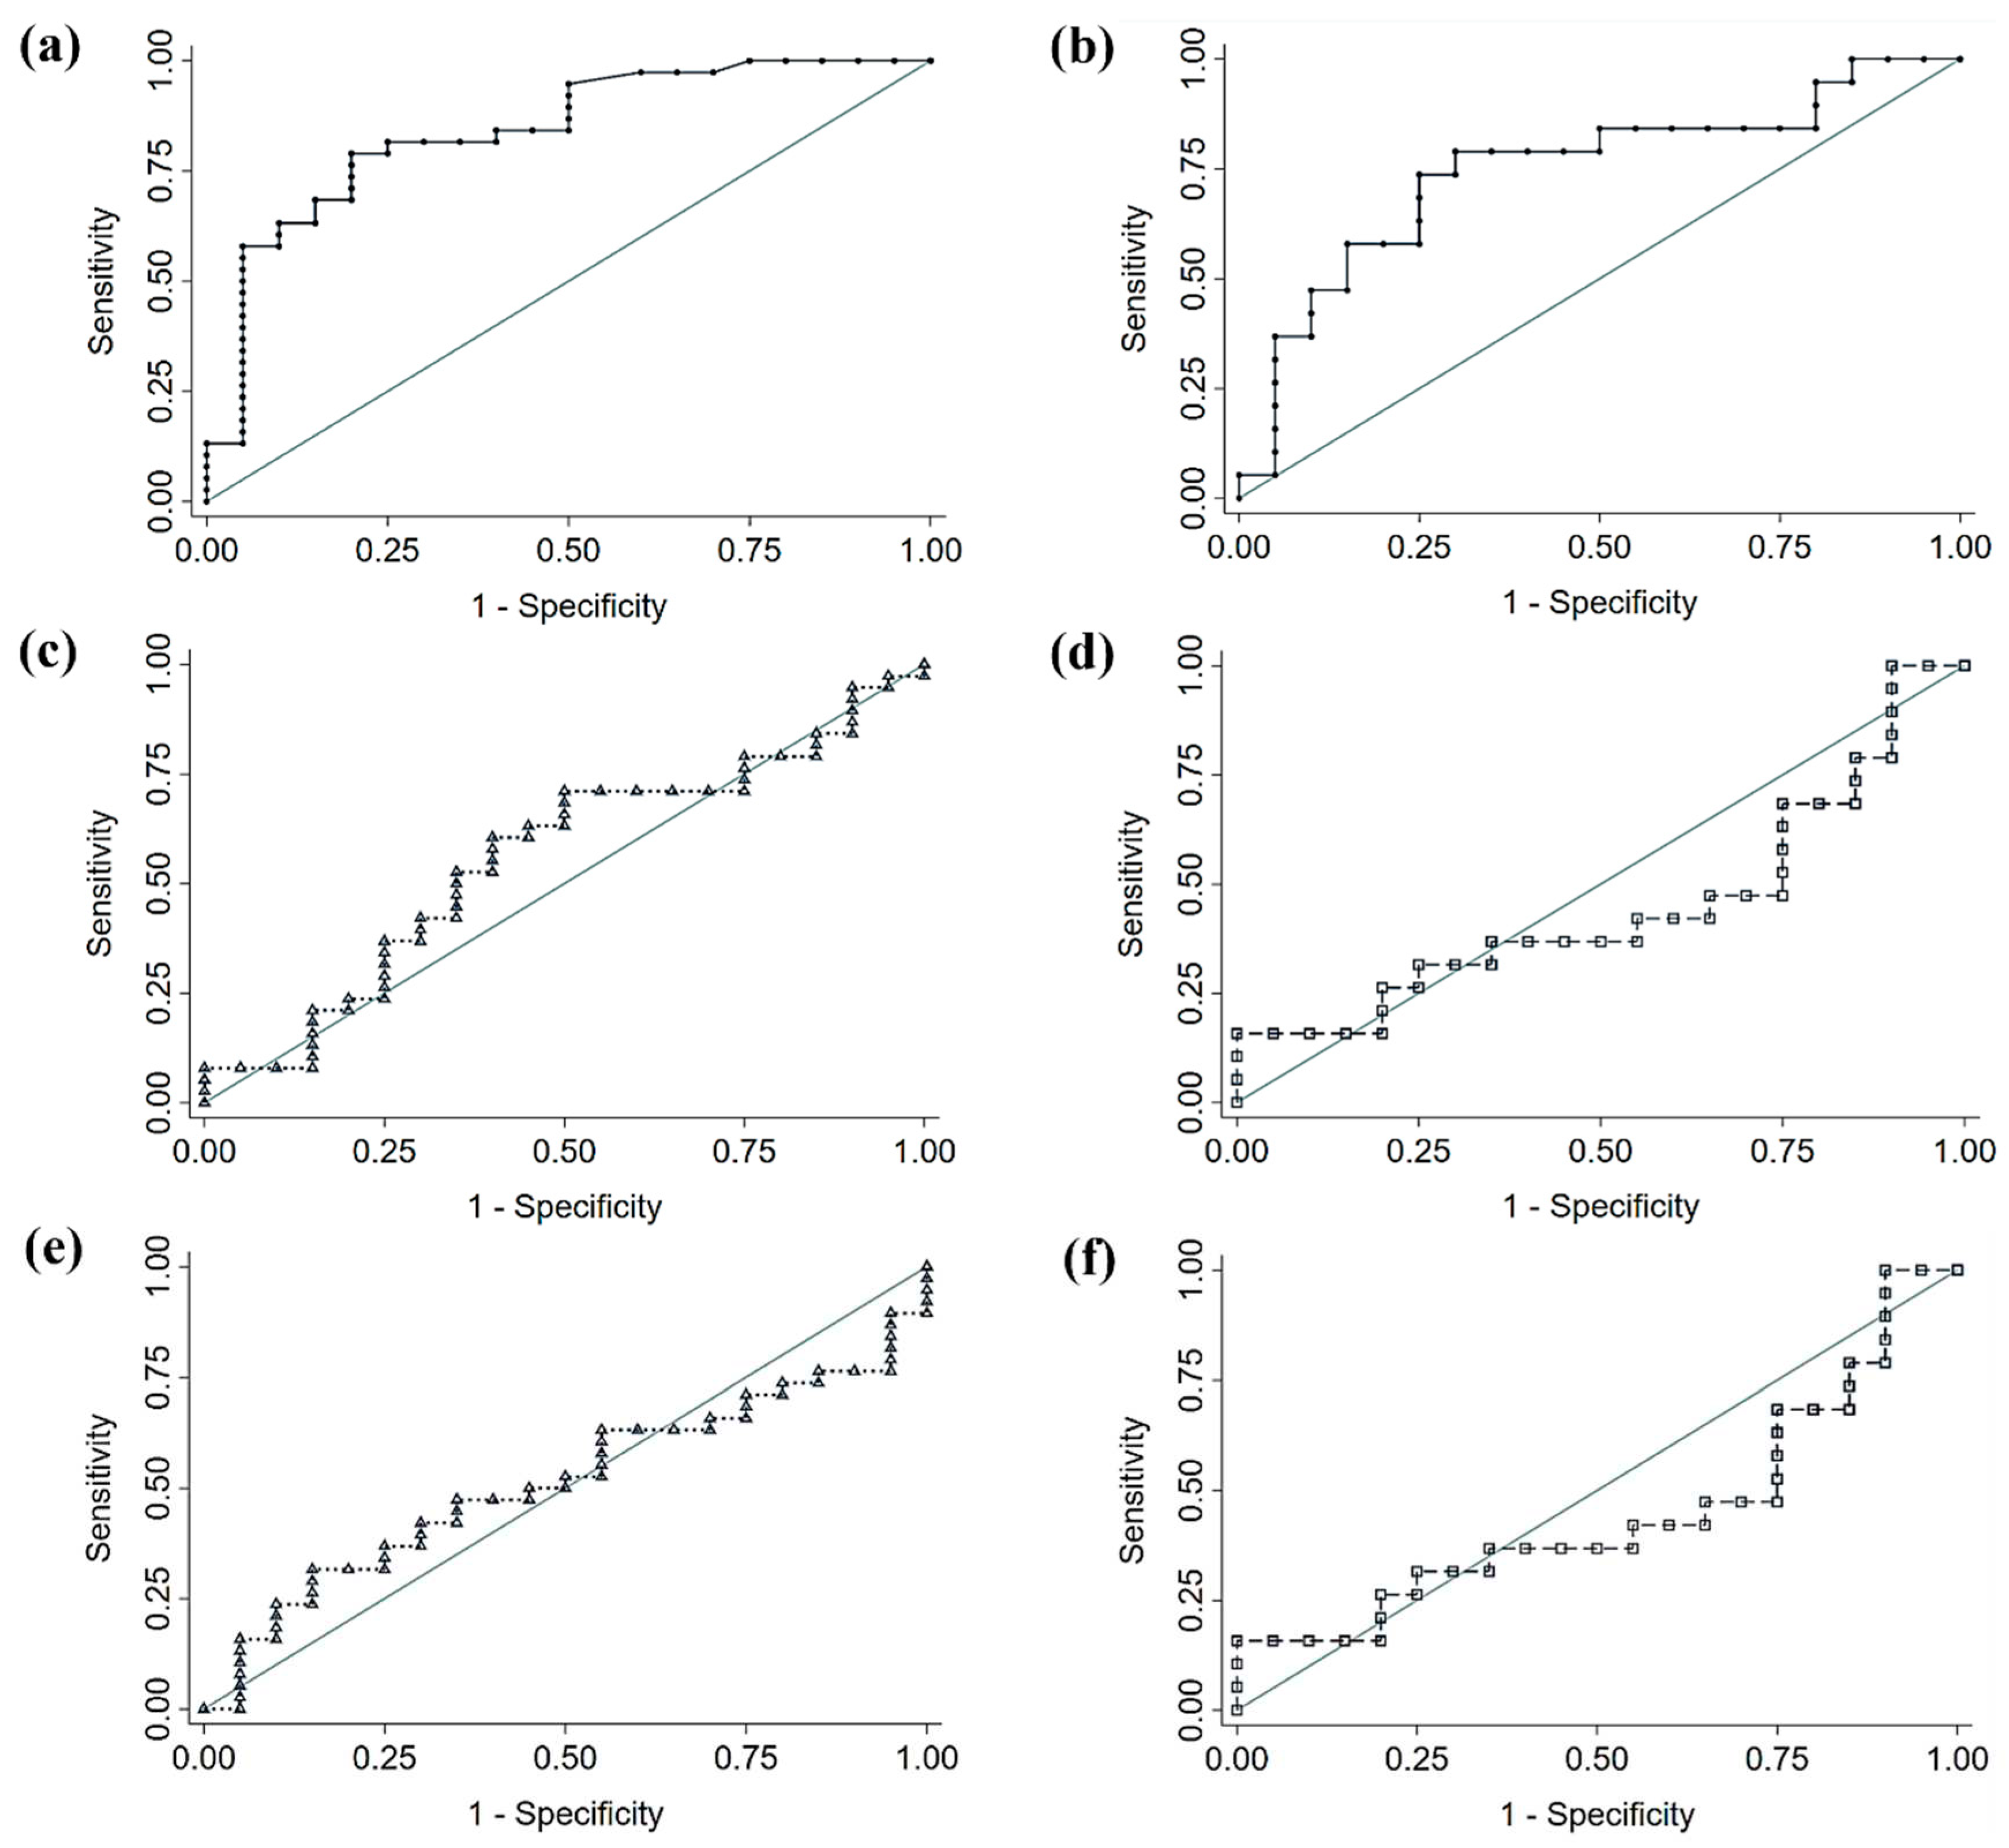

Table 1.
Characteristics of patients with CRC, NSCLC and Controls.
| Variable | CRC group (N = 38) |
NSCLC group (N = 19) |
Control group (N = 20) |
|---|---|---|---|
| Age (Mean ± SD, years) | 71.24 ± 12 | 72.79 ± 7.91 | 54.80 ± 14.97 |
| Gender, N (%) | |||
| Male | 24 (63.2) | 9 (47.4) | 6 (30) |
| Female | 14 (36.8) | 10 (52.6) | 14 (70) |
| BMI group, N (%) | |||
| Normal weight (BMI < 25 kg/m2) | 8 (21.1) | 6 (31.6) | 3 (15.0) |
| Overweight (BMI ≥ 25 kg/m2 and < 30 kg/m2) | 20 (52.6) | 9 (47.4) | 3 (15.0) |
| Obesity (BMI ≥ 30 kg/m2) | 10 (26.3) | 4 (21.1) | 14 (70.0) |
| Tumor location, N (%) | |||
| Right colon | 20 (52.6) | ||
| Left colon | 13 (34.2) | ||
| Rectum | 5 (13.2) | ||
| TNM stage, N (%) | |||
| I-II | 17 (44.7) | 13 (68.4) | |
| III-IV | 21 (55.3) | 6 (31.6) |
CRC: colorectal cancer; NSCLC: non-small cell lung cancer; SD: standard deviation; BMI: body mass index; 1Mann-Whitney U test; 2Student’s T test; 3Chi-squared test; *Statistically significant for the comparison at p value < 0.05.
Table 2.
Differentially increased bacterial genera in feces from Colorectal Cancer (CRC) patients, Non-Small Cell Lung Cancer (NSCLC) patients and Controls. (a) CRC vs. Controls (b) NSCLC vs. Controls (c) CRC vs. NSCLC.
Table 2.
Differentially increased bacterial genera in feces from Colorectal Cancer (CRC) patients, Non-Small Cell Lung Cancer (NSCLC) patients and Controls. (a) CRC vs. Controls (b) NSCLC vs. Controls (c) CRC vs. NSCLC.
| (a) | (b) | ||||||
|---|---|---|---|---|---|---|---|
| Bacterial genus | p values (LEfSe) | Bacterial genus | p values (LEfSe) | ||||
|
Control group g__Sutterella g__Blautia g__Lachnoclostridium g__Dielma g__Olsenella CRC group g__Campylobacter g__Intestinimonas g__Parvimonas g__Turicibacter g__Hydrogenoanaerobacterium g__Gemella g__Eisenbergiella g__Clostridium sensu stricto 1 g__Peptostreptococcus g__S5-A14a g__Ruminococcaceae g__Lactobacillus g__Salmonella g__Eikenella g__CAG-352 g__Fusobacterium g__Escherichia-Shigella |
0.019 0.005 0.044 0.018 0.024 0.004 0.049 0.004 0.006 0.008 0.016 0.008 0.021 0.006 0.023 0.022 0.024 0.011 0.034 0.035 0.003 0.018 |
Control group g__Lachnoclostridium g__Megasphaera g__Olsenella NSCLC group g_Hungatella g_Turicibacter g_Coprobacillus g_Clostridium sensu stricto 3 g_Intestinimonas g_Eisenbergiella g_Salmonella g_DTU089 g_Frisingicoccus g_Granulicatella g_Incertae Sedis g__Lactobacillus g__Agathobacter |
0.031 0.040 0.020 0.009 0.013 0.007 0.015 0.038 0.028 0.015 0.034 0.040 0.035 0.010 0.017 0.038 |
||||
| (c) | |||||||
| Bacterial genus | pvalues (LEfSe) | ||||||
|
NSCLC group g__Bifidobacterium g__Agathobacter g__Roseburia g__Blautia g__CAG-873 g__Incertae Sedis g__Oscillibacter g__Ammoniphilus g__Pseudobutyrivibrio CRC group g__Campylobacter g__Ruminococcaceae g__Hydrogenoanaerobacterium g__Sellimonas g__Solobacterium g__Sarcina g__Parvimonas g__Peptostreptococcus g__Eikenella g__CAG-352 g__Fusobacterium |
0.005 0.004 0.050 0.009 0.029 0.039 0.005 0.023 0.005 0.030 0.042 0.016 0.021 0.002 0.034 0.005 0.003 0.033 0.037 0.004 |
||||||
Table 3.
Logistic regression analysis of bacterial genera remarked as increased in Colorectal Cancer (CRC) by LEfSe analysis, adjusting for sex, age and body mass index (BMI).
Table 3.
Logistic regression analysis of bacterial genera remarked as increased in Colorectal Cancer (CRC) by LEfSe analysis, adjusting for sex, age and body mass index (BMI).
| CRC bacterial genera (abundance threshold) |
Group | Unadjusted OR (95% CI) | Unadjusted p value | Adjusted OR (95% CI) |
Adjusted p value |
|---|---|---|---|---|---|
|
Campylobacter (0.003313) |
Control | reference | - | reference | - |
| Cancer | 6.13 (1.72 – 21.9) | 0.005* | 4.44 (0.88 – 22.4) | 0.071 | |
|
Intestinimonas (0.01827) |
Control | reference | - | reference | - |
| Cancer | 2.35 (0.78 – 7.11) | 0.130 | 1.34 (0.28 – 6.32) | 0.705 | |
|
Parvimonas (0.001859) |
Control | reference | - | reference | - |
| Cancer | 10.9 (2.69 – 44.1) | 0.001* | 53.3 (3.26 – 870.5) | 0.005* | |
|
Turicibacter (0.01017) |
Control | reference | - | reference | - |
| Cancer | 6.13 (1.72 – 21.9) | 0.005* | 3.98 (0.83 – 19.0) | 0.084 | |
|
Hydrogenoanaerobacterium (0.00367) |
Control | reference | - | reference | - |
| Cancer | 4.56 (1.44 – 14.5) | 0.010* | 1.42 (0.295 – 6.82) | 0.662 | |
|
Gemella (0.006006) |
Control | reference | - | reference | - |
| Cancer | 3.68 (1.18 – 11.5) | 0.025* | 6.01 (1.20 – 30.0) | 0.029* | |
|
Eisenbergiella (0.008012) |
Control | reference | - | reference | - |
| Cancer | 4.56 (1.44 – 14.5) | 0.010* | 5.35 (1.08 – 26.5) | 0.040* | |
|
Clostridium sensu stricto 1 (0.08304) |
Control | reference | - | reference | - |
| Cancer | 7.79 (1.95 – 31.2) | 0.004* | 4.98 (0.93 – 26.6) | 0.061 | |
|
Peptostreptococcus (0.0003669) |
Control | reference | - | reference | - |
| Cancer | 4.13 (1.24 – 13.7) | 0.021* | 9.42 (1.38 – 64.2) | 0.022* | |
|
S5-A14a (0.0003232) |
Control | reference | - | reference | - |
| Cancer | 6.55 (1.32 – 32.3) | 0.021* | 2.54 (0.41 – 15.8) | 0.318 | |
|
Ruminococcaceae (0.004992) |
Control | reference | - | reference | - |
| Cancer | 8.5 (2.19 – 33.0) | 0.002* | 3.67 (0.62 – 21.7) | 0.151 | |
|
Lactobacillus (0.04309) |
Control | reference | - | reference | - |
| Cancer | 5.67 (1.42 – 22.6) | 0.014* | 6.72 (1.05 – 43.0) | 0.044* | |
|
Salmonella (0.00081) |
Control | reference | - | reference | - |
| Cancer | 8.22 (2.40 – 28.2) | 0.001* | 5.44 (1.02 – 28.8) | 0.047* | |
|
Eikenella (0.0001615) |
Control | reference | - | reference | - |
| Cancer | 7.74 (0.92 – 65.1) | 0.060 | 8.20 (0.73 – 92.1) | 0.088 | |
|
CAG-352 (0.008875) |
Control | reference | - | reference | - |
| Cancer | 3.42 (1.10 – 10.7) | 0.034* | 2.14 (0.47 – 9.61) | 0.323 | |
|
Fusobacterium (0.01714) |
Control | reference | - | reference | - |
| Cancer | 11.2 (3.02 – 41.6) | 0.000* | 78.9 (4.48 – 1389.0) | 0.003* | |
|
Escherichia_Shigella (0.1569) |
Control | reference | - | reference | - |
| Cancer | 5.2 (1.61 – 16.7) | 0.006* | 3.81 (0.80 – 18.2) | 0.094 |
CI: confidence interval; OR: odds ratio; *Statistically significant for the comparison at p value < 0.05.
Table 4.
Logistic regression analysis of bacterial genera remarked as increased in Non-Small Cell Lung Cancer (NSCLC) by LEfSe analysis, adjusting for sex, age and body mass index (BMI).
Table 4.
Logistic regression analysis of bacterial genera remarked as increased in Non-Small Cell Lung Cancer (NSCLC) by LEfSe analysis, adjusting for sex, age and body mass index (BMI).
| NSCLC bacterial genera (abundance threshold) |
Group | Unadjusted OR (95% CI) | Unadjusted p value | Adjusted OR (95% CI) | Adjusted p value |
|---|---|---|---|---|---|
|
Hungatella (0.002103) |
Control | reference | - | reference | - |
| Cancer | 6.53 (1.61 – 26.5) | 0.009* | 7.17 (0.92 – 56.0) | 0.060 | |
|
Turicibacter (0.006865) |
Control | reference | - | reference | - |
| Cancer | 5.20 (1.32 – 20.5) | 0.019* | 4.61 (0.73 – 29.1) | 0.104 | |
|
Coprobacillus (0.0006056) |
Control | reference | - | reference | - |
| Cancer | 6.86 (1.63 – 28.9) | 0.009* | 7.00 (0.59 – 82.9) | 0.123 | |
| Clostridium sensu stricto 3 (0.0004242) | Control | reference | - | reference | - |
| Cancer | 5.50 (1.32 – 22.9) | 0.019* | 6.11 (0.84 – 44.5) | 0.074 | |
|
Intestinimonas (0.0208) |
Control | reference | - | reference | - |
| Cancer | 5.63 (1.36 – 23.3) | 0.017* | 3.50 (0.45 – 27.3) | 0.232 | |
|
Eisenbergiella (0.007163) |
Control | reference | - | reference | - |
| Cancer | 4.02 (1.06 – 15.3) | 0.041* | 5.49 (0.69 – 43.9) | 0.108 | |
|
Salmonella (0.0008436) |
Control | reference | - | reference | - |
| Cancer | 15.8 (2.80 – 89.0) | 0.002* | 6.06 (0.73 – 50.4) | 0.096 | |
|
DTU089 (0.007431) |
Control | reference | - | reference | - |
| Cancer | 5.50 (1.32 – 22.9) | 0.019* | 20.1 (1.35 – 300.1) | 0.029* | |
|
Frisingicoccus (0.0004159) |
Control | reference | - | reference | - |
| Cancer | 5.06 (1.30 – 19.7) | 0.020* | 2.88 (0.49 – 17.1) | 0.244 | |
|
Granullicatella (0.008393) |
Control | reference | - | reference | - |
| Cancer | 4.02 (1.06 – 15.3) | 0.041* | 4.81 (0.63 – 36.6) | 0.129 | |
|
Incertae Sedis (0.1568) |
Control | reference | - | reference | - |
| Cancer | 8.00 (1.74 – 36.7) | 0.007* | 160.1 (2.44 – 10506.36) | 0.017* | |
|
Lactobacillus (0.03697) |
Control | reference | - | reference | - |
| Cancer | 4.13 (1.06 – 16.1) | 0.041* | 2.07 (0.36 – 11.8) | 0.414 | |
|
Agathobacter (0.5153) |
Control | reference | - | reference | - |
| Cancer | 5.625 (1.36 – 23.3) | 0.017* | 6.94 (0.97 – 49.6) | 0.053 |
CI: confidence interval; OR: odds ratio; *Statistically significant for the comparison at p value < 0.05.
Table 5.
Comparison of the diagnostic performance of new proposed signatures for Colorectal Cancer (CRC) and Non-Small Cell Lung Cancer (NSCLC) and two previously published signatures from large databases by test of equality of ROC areas for independent samples.
Table 5.
Comparison of the diagnostic performance of new proposed signatures for Colorectal Cancer (CRC) and Non-Small Cell Lung Cancer (NSCLC) and two previously published signatures from large databases by test of equality of ROC areas for independent samples.
| Panel | Bacterial taxa included | AUC (95% CI) | Se (95% CI) | Sp (95% CI) | p value |
|---|---|---|---|---|---|
| CRC (proposed) | 7a | 0.840 (0.720 – 0.923) | 78.9 (63.7 – 88.9) | 80.0 (58.4 – 91.9) | - |
| Thomas et al. [15] | 34c | 0.557 (0.420 – 0.687) | 60.5 (44.7 – 74.4) | 60.0 (38.7 – 78.1) | 0.004* |
| Yang et al. [16] | 43d | 0.511 (0.376 – 0.644) | 47.4 (32.5 – 62.7) | 65.0 (43.3 – 81.9) | 0.015* |
| NSCLC (proposed) | 2b | 0.747 (0.583 – 0.872) | 73.7 (51.2 – 88.2) | 75.0 (53.1 – 88.8) | - |
| Thomas et al. [15] | 34c | 0.447 (0.288 – 0.615) | 36.8 (19.1 – 59.0) | 65.0 (43.3 – 81.3) | 0.038* |
| Yang et al. [16] | 43d | 0.413 (0.258 – 0.582) | 47.4 (27.3 – 68.3) | 45.0 (25.8 – 65.8) | 0.002* |
AUC: area under the curve; CI: confidence interval; Se: sensitivity; Sp: specificity; *Statistically significant at p value< 0.05. aProposed CRC panel: genera Eisenbergiella, Fusobacterium, Gemella, Lactobacillus, Parvimonas, Peptostreptococcus and Salmonella. bProposed NSCLC panel: genera DTU089 and Ruminococcaceae Incertae Sedis. cSignature by Thomas et al. [15]: Acidaminococcus, Actinomyces, Anaerotruncus, Bilophila, Butyricimonas, Candidatus Schneewindia (CS. gallinarum), Campylobacter, Cloacibacillus, Dysosmobacter, Eggerthella, Eisenbergiella, Enterocloster, Enterococcus, Erysipelatoclostridium, Escherichia-Shigella, Faecalicatena, Faecalitalea, Flavonifractor, Hafnia-Obesumbacterium, Harryflintia, Holdemania, Hungatella, Hydrogeniiclostridium, Intestinimonas, Lachnoclostridium, Lancefieldela, Lawsonibacter, Merdimonas, Pseudoflavonifractor, Pararuminococcus, Ruthenibacterium, Scardovia, Streptococcus and Veillonella; dSignature by Yang et al. [16]: Acidimicrobium, Acidiphilium, Actinomyces, Aeromonas, Alcaligenes, Anaplasma, Bacteroides, Bifidobacterium, Bradyrhizobium, Campylobacter, Capnocytophaga, Cellulomonas, Chamaesiphon, Eikenella, Flavobacterium, Fusobacterium, Gemella, Haemophilus, Halothiobacillus, Helicobacter, Hyphomicrobium, Leptotrichia, Methylophilus, Mycoplasma, Neisseria, Nostoc, Parvimonas, Pediococcus, Peptostreptococcus, Porphyromonas, Prevotella, Prosthecobacter, Pseudomonas, Roseiflexaceae – uncultured, Roseiflexus, Rothia, Rubrivivax, Selenomonas, Staphylococcus, Streptococcus, Treponema, Variovorax and Veillonella.
Disclaimer/Publisher’s Note: The statements, opinions and data contained in all publications are solely those of the individual author(s) and contributor(s) and not of MDPI and/or the editor(s). MDPI and/or the editor(s) disclaim responsibility for any injury to people or property resulting from any ideas, methods, instructions or products referred to in the content. |
© 2024 by the authors. Licensee MDPI, Basel, Switzerland. This article is an open access article distributed under the terms and conditions of the Creative Commons Attribution (CC BY) license (http://creativecommons.org/licenses/by/4.0/).
Copyright: This open access article is published under a Creative Commons CC BY 4.0 license, which permit the free download, distribution, and reuse, provided that the author and preprint are cited in any reuse.


