Preprint
Article
Fast 50 Hz Updated Static Infrared Positioning System Based on Triangulation Method
Altmetrics
Downloads
80
Views
23
Comments
0
A peer-reviewed article of this preprint also exists.
This version is not peer-reviewed
Submitted:
31 January 2024
Posted:
02 February 2024
You are already at the latest version
Alerts
Abstract
One of the important issues being explored in Industry 4.0 is a collaborative mobile robots. This collaboration requires precise navigation systems, especially indoor navigation systems where GNSS (Global Navigation Satellite System) cannot be used. To enable precise localization of robots, different variations of navigation systems are being developed, mainly based on trilateration and triangulation methods. Triangulation systems are distinguished by the fact that they allow precise determination of an object’s orientation, which is important for mobile robots. An important feature of positioning systems is the frequency of position updates based on measurements. For most systems it is 10-20 Hz. In our work, we propose a high-speed 50 Hz positioning system based on the triangulation method with infrared transmitters and receivers. In addition, our system is completely static, i.e. it has no moving/rotating measurement sensors, which makes it more resistant to disturbances (caused by vibrations, wear and tear of components, etc.). In this paper we describe the principle of the system as well as its design. Finally, we present tests of the built system, which show centimeter positioning accuracy with a position update frequency of 50 Hz.
Keywords:
Subject: Engineering - Electrical and Electronic Engineering
1. Introduction
The use of global positioning systems (GPS) for civilian purposes has had a significant impact on the logistics industry. The ability to accurately locate people or objects has created enormous opportunities. However, GPS signals can be scattered by materials in front of the wave receiver in enclosed environments, making it unsuitable for positioning people or objects indoors. As a result, other technical means and methods have emerged to determine the position of objects in enclosed areas. These methods are based on popular technologies such as Bluetooth, Wi-Fi, and RFID, as well as ultra-wideband (UWB). They use electromagnetic waves to transmit data. The availability of positioning solutions is expected to increase interest in this technology, which can be used for navigation, tracking, marketing, entertainment, safety, and security. Accuracy and speed are crucial in all these areas. Meeting these requirements in a limited space can be challenging due to the multiple surfaces reflecting the usable signal, as well as the saturation of space with electromagnetic waves that may interfere with positioning system signals. Indoor and outdoor positioning differ significantly in terms of the likelihood of encountering obstacles in the signal path. GPS signals are less likely to encounter obstacles due to their steep angle of incidence. However, positioning systems that operate in enclosed areas are more likely to encounter obstacles and require technology that minimises their negative effects. Non-line-of-sight (NLoS) refers to the obstruction of a wave’s path between the source and receiver by an object, while line-of-sight (LoS) indicates an unobstructed path. Current positioning systems use information from reference points to determine the position of an object. The most common technique is distance measurement. This uses a trilateration method similar to GPS. This method requires knowledge of at least three distances. Another method is angle measurement, which uses the triangulation method and requires knowledge of at least three angles. A technique is employed where reference points transmit a signal, either by radio or infrared, and the object’s position is determined by measuring the strength of the received signal.
This paper describes a high-speed positioning system that uses infrared transmitters and receivers to determine position through triangulation. The paper presents the operating principle and design of the system, as well as the results of outdoor tests. The system has a measurement refresh rate of 50 Hz and achieves positioning accuracy in the centimeter range.
1.1. Trilateration positioning method
The trilateration method is a technique used to determine the location of an object based on distance measurements from at least three known points. These points are base stations with known coordinates. Assuming the distances are radii of circles, their intersection determines the common point, which is the location sought. This method is commonly used in surveying, cartography, and navigation. Although the trilateration method is simple to apply, there are various techniques available for determining positions, which are constantly evolving. A variety of wireless techniques are used for different purposes [1]. For instance, Bluetooth technology is used for locating people in office spaces [2], while Wi-Fi technology combined with received signal strength index (RSSI) analysis is used for locating pedestrians [3] or static storage tanks [4]. UWB technology, with some computational simplifications, can be used to calculate the location of robots on the production hall [5]. A two-stage trilateration algorithm using UWB works well in determining the position of drones, particularly in areas where GPS signals are not received [6]. Trilateration can also be used to locate RFID receivers [7]. Linear chirp signals are transmitted to base stations at RF frequencies to estimate the location of a tag. A trilateration system based on UAV assumptions can successfully locate and track flying insects with radio frequency tags [8]. In addition to the classical approach to the trilateration problem, many studies have proposed interesting simplifications [9] and extensions to the simultaneous and delayed algorithm [10], as well as positioning of dynamic objects with imprecisely known base point [11]. Other developments include an optimal trilateration algorithm based on the reptile search algorithm (RSA) for underwater wireless sensor networks [12] and K-Means clustering [13]. The algorithms’ effectiveness has been verified even in unfavorable measurement conditions, such as ambient noise, environmental interference, or uncertainty in base station coordinates.
1.2. Triangulation positioning method
The triangulation method determines the location of a point by measuring angles from known base stations located at the ends of a fixed line. The sought point is the third vertex of a triangle with one known side and two known angles. The unknown angle can be calculated using the knowledge of two known angles, as the sum of the angles of a triangle is 180 degrees. The unknown sides can be calculated algebraically.
The use of Delaunay triangulation algorithms can extend the localization method. These algorithms have been applied to localize mobile robots in forests [14] and to plan routes for mobile robots in logistics warehouses and manufacturing workshops [15]. A dynamic localization method can be one possible approach for measuring the robot’s position [16]. The mobile robot’s navigation node can be determined by measuring the RSSI [17]. Robot self-localization can be achieved by integrating trilateration and triangulation using RF sensor networks and fuzzy inference [18]. A localization model for passive positioning of an unmanned aerial vehicle (UAV) was developed using the sine theorem, the formula for the distance between two points, and the circumferential angle theorem [19]. The triangulation method is effective in determining the distance to clouds for UAVs [20]. Triangulation is a crucial subsystem in a navigation system that reconstructs an observed 3D point using cameras with known internal parameters and positions [21]. To enhance the positioning accuracy of the triangulation method and increase its robustness against inaccuracies in received signal strength measurements, an alternative option is to use a deep neural network based on LoS classification [22]. When utilizing the triangulation method, it may be beneficial to consider using the existing infrastructure of Wi-Fi routers and mobile hotspots. A precise positioning system can be achieved by using a multi-node triangulation algorithm that takes into account the correlation between RSSI values and transmitter-receiver distance, along with a coordinate system model to determine the optimal receiver coordinates [23]. If measurements in a localization system are obtained discontinuously, such as in laser localization, an extended Kalman filter can be used. The state vector consists of angular measurements, which are dynamically estimated based on their changes. This approach eliminates approximation errors in the correction phase [24].
1.3. Mobile robots localization in Industry 4.0 concept
Industry 4.0 and Logistics 4.0 utilize solutions that connect different production phases. Mobile robots are ideal for this purpose, as they can be integrated with an enterprise resource planning (ERP) system, enabling further automation. For instance, when the sales department places an order, the mobile robot receives a list of routes to execute sequentially. The industry employs autonomous mobile robots (AMRs), mobile manipulators (MMs), and automated guided vehicles (AGVs) for various tasks. However, the navigation methods for these vehicles differ significantly [25,26,27]. AGV systems follow predetermined routes and are guided by sensors, magnetic lines, or wires. They require complex and costly building interventions. Fault-free navigation and positioning are crucial for AMR robots to carry out tasks in various locations due to their flexibility compared to AGVs. The literature on mobile robot localization systems for the Industry 4.0 concept (see [28,29,30,31] for example, and quoted there literature) presents standard solutions, such as trilateration and triangulation methods. To solve the navigation problem, a different approach can be taken by using visible light positioning with specially modulated LED lighting [32]. Another option is to use a system based on radio frequency identification (RFID) in the ultra-high frequency (UHF) band to determine the location of pallets carried by forklifts within a warehouse [33]. An effective localization strategy involves processing location measurements to achieve accurate recognition beyond line of sight. This can be done using an enhanced particle filter based on a genetic algorithm [34]. For critical and demanding IoT device applications that require fast and reliable low-latency end-to-end (E2E) communication, the use of programmable intelligent space (PIS) is proposed as an alternative to implement atocells [35].
1.4. Our previous work, motivations and current contributions
Our earlier paper presented a prototype of Static Triangulation System (STS) [36], with the following parameters: angle measurement accuracy of 0.42°, position determination accuracy of 6.97 cm, and measurement frequency of 12.5 Hz. This system is completely static, i.e. there are no moving/rotating measurement sensors, which makes it more resistant to disturbances (caused by vibrations, wear and tear on components, etc.). The design of the system was based on fabricated Discovery series prototype boards with STM32 microcontrollers and had significant geometry. The operational amplifiers, using through-hole mounting technology, were placed outside the main measurement modules. This positioning could, under certain conditions, cause interference in the analogue measurement paths. The beacons were synchronised via a wired path.
This paper presents a positioning system that improves upon the prototype. It describes a fourfold increase in position reading rate, up to 50 Hz, while maintaining angle measurement accuracy. The frequency of position update is an important factor when considering highly dynamic and fast velocity objects. For example, a Vecna AMRs robot moves at a speed of 3 m/s and therefore for a positioning system operating at 10 Hz, it will move 30 cm between position updates. When the frequency of the positioning system is 50 Hz, the displacement of this robot between position readings is only 6 cm. Current laser scanning systems do not provide better measurements despite their high cost. Commercial localisation systems that use laser scanning for measurement frequency do not perform any better. For example, the ROBOSENSE system from Siman Sensors and Intelligent Machines Ltd. offers a measurement frequency of 10...40 Hz. The LaserNav Position Sensor system from Denning Branch International Robotics has a measurement frequency of 10 Hz, while the AMCO LASERNET beacon tracking system allows measurement at 20 Hz [37,38]. The updated version of the NAV2xx sensors offers a measurement frequency of up to 25 Hz [39] compared to 10 Hz in the previous version [38]. To the authors’ knowledge, other non-commercial systems using similar hardware do not achieve the same measurement frequency as the authors. The advantages of the solution in terms of compactness (external dimensions of 120 mm) and wireless synchronisation of the beacons are presented in addition to the points mentioned above. The Beacons have a unique design with a pentagonal shape and integrated infrared emitting diodes, providing an omnidirectional radiation source. The work area can be extended by the addition of one or more beacons. This ensures that two beacons always share each working area. Therefore, a beacon with a beam angle of 360 degrees is required.
The paper is organised as follows: Section 2 (Materials and Methods) describes the basic principles of the STS positioning system, its design and the test rig used in the experimental studies; Section 3 (Results) presents the experimental results obtained under laboratory conditions (outdoor terrace); the final Section 4 (Discussion) contains a discussion of the presented results, as well as the conclusions drawn from these results.
2. Materials and Methods
This chapter provides information on the methodology used in the construction of the IR transmitter-receiver triangulation system. It also describes the experimental methods used to test the positioning STS system.
2.1. Principle of the STS triangulation system
The principle of the STS triangulation positioning system is based on measuring the intensity of infrared light emitted by three transmitters/beacons placed at known positions . The switching of the beacons is synchronised - only one of them is active at any given time. The infrared light from the transmitter is recorded using 32 photodiodes uniformly placed around the perimeter of the circular receiver housing. The idea behind the positioning system is illustrated in Figure 1.
Two microcontrollers with 16 analogue inputs each were used to measure IR light intensity, giving a total of 32 photodiodes for measurement. The intensity of the light recorded by the n-th photodiode of the receiver (the black disk in Figure 1) depends on the angular orientation of the photodiode relative to the transmitting beacon , resulting in the measurement curves shown on the right-hand side of Figure 1. The post-processing of the recorded measurements makes it possible to determine the angles , and which indicate the angular position of the beacons relative to the receiver. Finally, the angles allow the determination of the beacon-receiver-beacon angles (denoted as , and in Figure 1) which are the input arguments to the algorithm that determines the position of the receiver in the plane.
2.2. Angle determination method
When the IR intensities have been recorded on the photodiodes for each of the three beacons, the angles should be determined (see Figure 1). It seems natural to assume that the angle is the angle for which the measured spectrum of a given beacon reaches its maximum. Unfortunately, it cannot be assumed that this angle is equal to the angular position of the j-th measuring photodiode for which the IR intensity is maximum because the measuring system consists of 32 photodiodes, which gives an intensity measurement every 11.25 degrees. In practice, the angle of the maximum value of the beacon spectrum will never be equal to but will be somewhere between and . It can therefore be seen that an analysis of the measured spectrum must be carried out in order to estimate the position of the maximum intensity measured by the receiver. In our research we tested two approaches, the results of which will be presented in this chapter.
In our triangulation system, we used BPV22NF receiver photodiodes [40], for which the normalized radiant sensitivity profile plot can be found in the manufacturer’s documentation. It turns out that this profile can be described by a sixth-order polynomial, as shown in Figure 2.
The obtained polynomial allows to simulate the measurements recorded by the receiver photodiodes and then analyse the selected methods for the angle determination.
2.2.1. Polynomial approximation method
The polynomial approximation method consists of finding a 6th degree polynomial that approximates the intensity spectrum curve for the selected beacon . This method requires first to remove some data from the measured spectrum (about half of the 32 photodiodes will register zero IR intensity) and leave only those corresponding to the approximating function. Numerical approximations, such as the least squares method, can be performed for the selected data. The polynomial describing the IR intensity takes the form:
The purpose of the polynomial approximation method is to find such a coefficients that minimise the cost function :
where is the intensity of infrared light recorded by the j-th receiver photodiode, and denotes the polynomial (1) value for .
2.2.2. Mean of angles method
In the case of circular quantities, the so-called Mean of angles method to determination of the angle can be used [41]. In this method, the measured data are presented in vector form. In the case under consideration, the intensity of the measured IR radiation is the length of the vector and the angular position of the receiver measuring photodiode is the angle of inclination of the vector from the x-axis. In order to find the mean value of the angle (i.e. the angle), it is necessary to determine the sum of all 32 vectors, and then to determine what angle this resultant vector forms with the x-axis. The value of the angle is therefore described by equation (3).
Unlike approximation, this method does not require a pre-modification of the recorded spectrum because the zero IR intensity vector contributes nothing to the vector sum. This method is much less computationally complex than the approximation method and much easier to implement on a microcontroller.
2.2.3. Approximation method vs Mean of angles method
The presented methods for determining the angle give the same results for ideal conditions when the IR intensity measurements are undisturbed. In real-world conditions, however, measurements are always noisy, not least because of the analogue-to-digital conversion process. To test the effect of measurement noise on the results, a simulation experiment was carried out. This consisted of generating an ideal measurement spectrum according to the mathematical model of the measurement photodiode shown in Figure 2, and then introducing noise into these measurements. The generated measurement noise was a random signal with a normal distribution and a preset standard deviation . Twenty values of standard deviation ranging from 0 to 0.004 with a step of 0.0002 were examined. For each value of , 1000 spectrum measurements were generated, for which the angle was determined using both the Approximation method and the Mean of angles method. Finally, the root mean square error (RMSE) of from the 1000 spectrums for each was determined. The results of the simulation experiment are shown in Figure 3.
As can be seen in Figure 3, the RMSE error increases linearly with increasing dispersion of the measurements, but for the Approximation method it increases about five times more than for the Mean of angles method.
If the analog measurement is performed by an STM32 family microcontroller with a resolution of 12 bits, the dispersion of the measurement ranges from 10 to 20 LSB (for normalized measurement: ) , which gives a in the range of 0.0024 - 0.0048 [42]. As can be seen in Figure 3, for such a dispersion range, the value of the angle determined by the Mean of angles method is much more accurate than using the Approximation method. Therefore, the Mean of angles method was implemented in the receiver, which despite its simplicity is more resistant to noise and gives more accurate results than the Approximation method.
2.3. IR beacon transmission system
The infrared beacon consists of an array of five PK2S-3LJE-A high-power diodes placed on the sides of a pentagon-shaped aluminium heat sink. The beacon diodes emit infrared with a wavelength of 850 nm and are characterised by a Lambert radiation pattern, a viewing angle of and a radiometric power for 1 A current of approximately 1560 mW [43]. Based on the manufacturer’s data, the normalized intensity of a single beacon diode can be described by the approximated equation:
The fit of the manufacturer’s data to the polynomial is shown on the left-hand side of Figure 4.
The approximate normalized irradiance distribution of a single transmitting diode can therefore be written using the inverse square law:
where r is the distance from the transmitting diode. For five IR transmitting diodes placed on the sides of the pentagon, the total irradiance distribution for the transmitting beacon is obtained as on the right-hand side of Figure 4.
To avoid interference with each other’s transmitted signal, the beacons operate in a synchronised cycle, so that only one beacon is operating at a time. To ensure this operation, the beacon system is equipped with a microcontroller control system, which is shown on the left side of Figure 5. The control device consists of a current driver, providing a constant current of 900 mA flowing through the transmitting diodes (see ➀ in Figure 5), which is managed by the STM32G030F6 microcontroller (➁ in Figure 5 on the reverse side of the PCB) [44]. The microcontroller is also responsible for controlling the nRF24L01 radio transceiver module marked as ➂ which is used to synchronise the beacons operation [45]. The transmitting diodes (➄ in Figure 5) placed on the heatsink ➃ together with the control device were finally placed on the mast ➅ forming the transmitting beacon, as shown on the right side of Figure 5.
Each of the three beacons in the triangulation system has its own unique number . In the synchronization cycle, the first active beacon is then and then . The first beacon , when it is activated, turns on the IR diodes for 5 ms and sends a radio message using nRF24L01, which contains its ID number. The rest of the beacons, meanwhile, listen radio messages sent by the nRF24L01 modules. When beacon receives a message from beacon , it waits 5 ms and then turns on the IR diodes for 5 ms and sends a message with its own ID number. Beacon responds to the message from beacon in the same way that responds to . When the beacon receives a signal from it waits 5 ms until beacon finishes its work, and then waits another 5 ms. During these next 5 ms, neither of the beacons is working, which allows to record the background IR radiation from sources other than the beacons. Then the whole cycle repeats, and its time is equal to 3x5 ms (beacon activity) + 5 ms (background measurement) = 20 ms. The frequency of the beacon’s synchronization cycle is therefore 50 Hz, which makes it possible to determine the actual position of the receiver at a frequency just equal to 50 Hz.
Figure 6 displays the current waveforms supplied to the diodes of each beacon during their activation sequences. The average current value is approximately 900mA, while the oscillations, with a frequency of 2.5 kHz are a result of the converter operating in a buck configuration. The stations are cycled in the assumed sequence, starting from , and their synchronization frequency is close to the expected value of 50 Hz.
2.4. IR receiver
A simplified block diagram of the analog and digital parts of the 32-channel IR receiver and its implementation is shown in Figure 7 and Figure 8, respectively. The receiver was housed in a compact 3D-printed casing, which contained a two-layer PCB with electronic components. On the top side of the PCB, two microcontrollers ➀ were located, which measured the voltages in the analog channels. The STM32 microcontrollers’ internal ADCs were used. The ADC converter has a maximum clock frequency of 35 MHz, resulting in a minimum conversion time of 400 ns for 12-bit resolution. Circuit measurements are taken at a sampling rate of 1 kHz. The photodiodes ➂ are positioned at 11.25-degree intervals and operate in the photovoltaic mode with MCP6271 transimpedance amplifiers ➃ (,...,) in typical configuration [46]. Each amplifier converts a small current into a corresponding voltage, which is then applied to the ADC input. The advantage of the use of the photovoltaic mode is the reduction of the dark current. In typical diodes, the application of a barrier polarization voltage increases the reverse current. A similar relationship applies to the dark current in photodiodes. The greater the voltage of barrier polarization, the greater the dark current, while without polarization it is eliminated. Furthermore, this mode enables the photodiode to be applied in pulsed circuits, making it ideal for precision applications. The circuit’s gain is determined by the feedback resistor (tol., and the amplifier output voltage is equal to . The operational amplifier is a rail-to-rail type. This means, that its maximum output voltage is equal to its supply voltage of 3.3V. The microcontrollers ➀ communicate with ➁ via the SPI interface, with a clock signal of 1 kHz. The bus transmits measurement results from 32 channels. The microcontroller ➃ communicates with the radio module ➄ through the SPI interface, which is the wireless component of the beacon synchronizing circuit. For diagnostic purposes and in order to read out the calculated coordinates and angles, the UART interface is used by microcontroller ➁.
The IR receiver is equipped with an nRF24L01 radio transceiver module marked ➄ in Figure 8. This radio module operates in listen-only mode so that the receiver has information about the current status of the beacon’s duty cycle. When the module receives information with the number of a particular beacon, after a period of approximately 2.5 ms (half of the beacon’s activity period) from receiving the , it registers the data from the 32 photodiodes as a spectrum of the beacon . When spectrum from all beacons is recorded, the IR receiver determines the angles via the Mean of angles method described in Section 2.2.2 (sec:meanangmet).
To determine the position of the receiver, a method belonging to the family of Geometric Circle Intersection algorithms, the so-called ToTal algorithm was used [47]. It first calculates the parameters of three circles passing through the IR receiver and the three beacons. Next, it calculates the intersection of the three circles using all the parameters of the three circles.
2.5. Laboratory experimental set-up
The measurement experiment of the STS triangulation positioning system was carried out on the terrace of the Faculty of Electrical Engineering of the Bialystok University of Technology. The beacons , and were arranged in an equilateral triangle at positions =(0.0, 0.0) m, =(6.032, 0) m, =(3.016, 5.223) m as shown in Figure 9. The IR receiver of the positioning system ➀ was placed on a tripod. To enable measurements for different orientations of the receiver disk, it was placed on a servo motor (see ➁ in Figure 9). Measurements were therefore taken for a given tripod position and for different orientations of the receiver, which was rotated every 5 degrees. For each given IR receiver position (defined by tripod position and receiver disk orientation) 10 measurements were taken, which gives a total of 10x360/5=720 measurements for the given tripod position. The measurement experiment was performed for the eleven tripod positions marked (from 1 to 11) in Figure 9.
Based on the experimental measurement data, the following statistical parameters were calculated for each tripod position: average position in x-direction ; average position in y-direction ; standard deviation of the position in the x-direction; standard deviation of the position in the y-direction; standard deviation of the position ; root-mean-square error of the position R define as:
where is the real triod position, - measured triod position and n - number of measurements in a given tripod position (); standard deviation of the angles defined as:
and root-mean-square error of the measured angles :
The determined parameters are presented in table form in Section 3 (Results).
3. Results
This section describes and discusses the results of the experimental studies. The measured data for measurements at tripod positions 1 to 11 (see Figure 9) were statistically processed and then presented in Table 1. Figure 10 shows an example of the experimental results: the determined positions and receiver orientations for the tripod in position 3.
Based on the experimental data shown in Table 1, the accuracy of measurement of the angle was 0.51°. This is comparable to the other triangulation systems presented in the papers [48] ( = 0.6°, = 10 Hz), [49] ( = 2.0°, = 10 Hz), [50] ( = 1.5°, = 1 Hz) and [38] ( = 0.24°, = 10 Hz). However, the update frequency in our STS triangulation system, which is = 50 Hz, is several times higher than in the above mentioned systems. In addition, our STS system contains no moving parts, and is therefore simpler to build and more resistant to disturbances.
4. Discussion
In this paper, we presented the concept of a static triangulation positioning system (STS) that operates at a refresh rate of = 50 Hz. We demonstrated the basic principles of the system’s operation, described its main components and carried out a preliminary theoretical-simulation analysis, which confirmed the correctness of the chosen concept and the hardware components used in the designed devices. In the following sections, we described the measurement experiment carried out and based on the recorded data, we determined the accuracy of our positioning triangulation system which was = 0.51°, and translated to an accuracy of = 6.55 cm in position. It turned out that the system we built, despite not containing any moving/rotating sensors (as is commonly used), had comparable measurement accuracy to other positioning triangulation systems and moreover, is a couple of times faster in terms of the refresh rate of the determined position which was = 50 Hz.
However, the system still needs further modification. Based on the measurement data, it was noted that for measurements in a fixed position of the tripod with the receiver, the calculated position is described by a dispersion of up to 5 cm. The likely reason for this non-isotropy due to the angular position of the receiver is differences in the characteristics of the measurement photodiodes mounted on the receiver disk. In our future research, we want to investigate what accuracy and isotropy will be achieved by a receiver composed of photodiodes that do not contain factory-mounted plastic lenses as in the BPV22NF diodes we used. We suspect that the lenses in the diodes may be the source of discrepancies in their characteristics.
Author Contributions
Conceptualization, M.C.; methodology, M.C. and R.K.; software, M.C.; validation, M.C. and R.K.; investigation, M.C. and R.K.; data curation, M.C.; writing—original draft preparation, M.C. and R.K.; writing—review and editing, M.C. and R.K.; visualization, M.C. and R.K. All authors have read and agreed to the published version of the manuscript.
Funding
This research was funded by Bialystok University of Technology grant number WZ/WE-IA/4/2023.
Institutional Review Board Statement
Not applicable.
Informed Consent Statement
Not applicable.
Data Availability Statement
Not applicable.
Conflicts of Interest
The authors declare no conflict of interest.
References
- Alkan, H.; Celebi, H. The implementation of positioning system with trilateration of haversine distance. 2019 IEEE 30th annual international symposium on personal, indoor and mobile radio communications (PIMRC). IEEE, 2019, pp. 1–6.
- Baek, S.H.; Cha, S.H. The trilateration-based BLE Beacon system for analyzing user-identified space usage of New Ways of Working offices. Building and Environment 2019, 149, 264–274. [CrossRef]
- Poulose, A.; Eyobu, O.S.; Han, D.S. A combined PDR and Wi-Fi trilateration algorithm for indoor localization. 2019 International Conference on Artificial Intelligence in Information and Communication (ICAIIC). IEEE, 2019, pp. 072–077.
- Rosli, N.E.; Sophian, A.; Ashraf, A. Localisation of Inspection Probes in A Storage Tank. Journal of Integrated and Advanced Engineering (JIAE) 2021, 1, 101–112. [CrossRef]
- Cotera, P.; Velazquez, M.; Cruz, D.; Medina, L.; Bandala, M. Indoor robot positioning using an enhanced trilateration algorithm. International Journal of Advanced Robotic Systems 2016, 13, 110. [CrossRef]
- Chen, Y.E.; Liew, H.H.; Chao, J.C.; Wu, R.B. Decimeter-Accuracy Positioning for Drones Using Two-Stage Trilateration in a GPS-Denied Environment. IEEE Internet of Things Journal 2022, 10, 8319–8326. [CrossRef]
- Brandl, M.; Posnicek, T.; Kellner, K. Position estimation of RFID-based sensors using SAW compressive receivers. Sensors and Actuators A: Physical 2016, 244, 277–284. [CrossRef]
- Pak, J.; Kim, B.; Ju, C.; You, S.H.; Son, H.I. UAV-Based Trilateration System for Localization and Tracking of Radio-Tagged Flying Insects: Development and Field Evaluation. 2023 IEEE/RSJ International Conference on Intelligent Robots and Systems (IROS). IEEE, 2023, pp. 1–8.
- Wang, Q.; Liu, L.; Zhang, S.; Lau, F.C. Trilateration-based device-free sensing: Two base stations and one passive IRS are sufficient. GLOBECOM 2022-2022 IEEE Global Communications Conference. IEEE, 2022, pp. 5613–5618.
- Riz, F.; Palopoli, L.; Fontanelli, D. Why Three Measurements are not Enough for Trilateration-based Localisation. 2023 IEEE International Instrumentation and Measurement Technology Conference (I2MTC). IEEE, 2023, pp. 01–06.
- Teoman, E.; Ovatman, T. Trilateration in indoor positioning with an uncertain reference point. 2019 IEEE 16th International Conference on Networking, Sensing and Control (ICNSC). IEEE, 2019, pp. 397–402.
- Shenbagharaman, A.; Paramasivan, B. Trilateration Method Based Node Localization and Energy Efficient Routing Using RSA for Under Water Wireless Sensor Network. Sustainable Computing: Informatics and Systems 2023, p. 100952. [CrossRef]
- Luo, Q.; Yang, K.; Yan, X.; Li, J.; Wang, C.; Zhou, Z. An improved trilateration positioning algorithm with anchor node combination and K-Means clustering. Sensors 2022, 22, 6085. [CrossRef]
- Li, Q.; Nevalainen, P.; Peña Queralta, J.; Heikkonen, J.; Westerlund, T. Localization in unstructured environments: Towards autonomous robots in forests with delaunay triangulation. Remote Sensing 2020, 12, 1870. [CrossRef]
- Liu, Z.; Liu, H.; Lu, Z.; Zeng, Q. A dynamic fusion pathfinding algorithm using delaunay triangulation and improved a-star for mobile robots. Ieee Access 2021, 9, 20602–20621. [CrossRef]
- Luo, R.C.; Chen, O.; Lin, P.H. Indoor robot/human localization using dynamic triangulation and wireless Pyroelectric Infrared sensory fusion approaches. 2012 IEEE International Conference on Robotics and Automation. IEEE, 2012, pp. 1359–1364.
- Feng, S.; Wu, C.d.; Zhang, Y.z. Dynamic localization of mobile robot based on triangulation centroid estimation. 2017 29th Chinese Control And Decision Conference (CCDC). IEEE, 2017, pp. 3544–3549.
- Lee, B.; Woo, D.M.; Park, M.K.; Kim, S. Development of self-localizer using collaboration of trilateration and triangulation. 2014 11th International Conference on Fuzzy Systems and Knowledge Discovery (FSKD). IEEE, 2014, pp. 729–733.
- Chen, Y.; Qi, Y. UAV Location Model Based on Triangulation Method. 2023 IEEE 5th International Conference on Power, Intelligent Computing and Systems (ICPICS). IEEE, 2023, pp. 1136–1140.
- Dudek, A.; Stütz, P. Cloud Detection System for UAV Sense and Avoid: Cloud Distance Estimation using Triangulation. 2020 AIAA/IEEE 39th Digital Avionics Systems Conference (DASC). IEEE, 2020, pp. 1–5.
- Botian, Z.; Sha, L.; Shijie, Z. Pre-Weighted Midpoint Algorithm for Efficient Multiple-View Triangulation. IEEE Robotics and Automation Letters 2021, 6, 7839–7845. [CrossRef]
- Eom, C.; Lee, C. A Deep Neural Network-Based LOS Classification for Triangulation Positioning. 2020 International Conference on Artificial Intelligence in Information and Communication (ICAIIC). IEEE, 2020, pp. 598–601.
- Jahagirdar, S.; Ghatak, A.; Kumar, A.A. WiFi based Indoor Positioning System using Machine Learning and Multi-Node Triangulation Algorithms. 2020 11th International Conference on Computing, Communication and Networking Technologies (ICCCNT). IEEE, 2020, pp. 1–6.
- Font-Llagunes, J.M.; Batlle, J.A. Consistent triangulation for mobile robot localization using discontinuous angular measurements. Robotics and Autonomous Systems 2009, 57, 931–942. [CrossRef]
- Ghodsian, N.; Benfriha, K.; Olabi, A.; Gopinath, V.; Arnou, A. Mobile Manipulators in Industry 4.0: A Review of Developments for Industrial Applications. Sensors 2023, 23, 8026. [CrossRef]
- Kovačić, Z.; Vasiljević, G.; Draganjac, I.; Petrović, T.; Oršulić, J.; Bogdan, S.; Miklić, D.; Kokot, M. Autonomous Vehicles and Automated Warehousing Systems for Industry 4.0. Engineering Power: Bulletin of the Croatian Academy of Engineering 2019, 14, 17–23.
- Abdirad, M.; Krishnan, K. Industry 4.0 in logistics and supply chain management: a systematic literature review. Engineering Management Journal 2021, 33, 187–201. [CrossRef]
- Braun, J.; Júnior, A.O.; Berger, G.; Pinto, V.H.; Soares, I.N.; Pereira, A.I.; Lima, J.; Costa, P. A robot localization proposal for the RobotAtFactory 4.0: A novel robotics competition within the Industry 4.0 concept. Frontiers in Robotics and AI 2022, 9, 1023590.
- Hodge, V.J. Sensors and Data in Mobile Robotics for Localisation. Encyclopedia of Data Science and Machine Learning 2023, pp. 2223–2238.
- Kovács, G.; Benotsmane, R.; Dudás, L. The concept of autonomous systems in industry 4.0. Advanced Logistic Systems-Theory and Practice 2018, 12, 77–87. [CrossRef]
- Chouhan, R.S.; Rajawat, A.S.; Goyal, S.; Bedi, P.; Constantin, N.B.; Raboaca, M.S.; Verma, C. Experimental Analysis for Position Estimation using Trilateration and RSSI in Industry 4.0. 2022 11th International Conference on System Modeling & Advancement in Research Trends (SMART). IEEE, 2022, pp. 904–908.
- Danys, L.; Zolotova, I.; Romero, D.; Papcun, P.; Kajati, E.; Jaros, R.; Koudelka, P.; Koziorek, J.; Martinek, R. Visible Light Communication and localization: A study on tracking solutions for Industry 4.0 and the Operator 4.0. Journal of Manufacturing Systems 2022, 64, 535–545.
- Motroni, A.; Buffi, A.; Nepa, P. Forklift tracking: Industry 4.0 implementation in large-scale warehouses through uwb sensor fusion. Applied Sciences 2021, 11, 10607. [CrossRef]
- Bai, X.; Dong, L.; Ge, L.; Xu, H.; Zhang, J.; Yan, J. Robust localization of mobile robot in industrial environments with non-line-of-sight situation. IEEE Access 2020, 8, 22537–22545. [CrossRef]
- do Carmo, A.P.; Vassallo, R.F.; de Queiroz, F.M.; Picoreti, R.; Fernandes, M.R.; Gomes, R.L.; Martinello, M.; Dominicini, C.K.; Guimarães, R.; Garcia, A.S.; others. Programmable intelligent spaces for Industry 4.0: Indoor visual localization driving attocell networks. Transactions on Emerging Telecommunications Technologies 2019, 30, e3610. [CrossRef]
- Ciężkowski, M. A prototype of static IR beacon-receiver positioning system based on triangulation method. Measurement 2018, 128, 149–159.
- Borenstein, J.; Everett, H.; Feng, L. Navigating mobile robots: Systems and techniques; AK Peters, Ltd., 1996.
- Pierlot, V.; Van Droogenbroeck, M. BeAMS: A beacon-based angle measurement sensor for mobile robot positioning. IEEE Transactions on Robotics 2014, 30, 533–549.
- SICK. NAV210-10100 | NAV2xx 2D Lidar sensors, 2023.
- Vishay Semiconductors. Silicon PIN Photodiode BPV22NF, BPV22NFL, 2012.
- Gaile, G.L.; Burt, J.E. Directional statistics; Geo Abstracts, University of East Anglia, 1980.
- STMicroelectronics. How to improve ADC accuracy when using STM32F2xx and STM32F4xx microcontrollers, 2013. Ver.5.0.
- ProLight Opto. ProLight PK2S-3LJE-A 3W Infrared 850 Power LED, 2019. Ver.1.1.
- STMicroelectronics. STM32G030x6/x8, 2022. Ver.4.0.
- Nordic Semiconductor. nRF24L01 Product Specification, 2007. Ver.2.0.
- Pallas-Areny, R.; Webster, J.G. Sensors and signal conditioning; John Wiley & Sons, 2012.
- Pierlot, V.; Van Droogenbroeck, M. A new three object triangulation algorithm for mobile robot positioning. IEEE Transactions on Robotics 2014, 30, 566–577.
- Casanova, E.Z.; Quijada, S.D.; García-Bermejo, J.G.; González, J.R.P. Microcontroller based system for 2D localisation. Mechatronics 2005, 15, 1109–1126. [CrossRef]
- Miodrag, B.; Lukić, M.; Bajić, J.; Dakić, B.; Vukadinović, M. Hardware realization of autonomous robot localization system. 2012 Proceedings of the 35th International Convention MIPRO. IEEE, 2012, pp. 146–150.
- Kemppainen, A.; Haverinen, J.; Röning, J. An infrared location system for relative pose estimation of robots; Springer, 2006.
Figure 1.
Principle of the STS triangulation system.

Figure 2.
Receiver photodiode sensitivity vs. Angular displacement
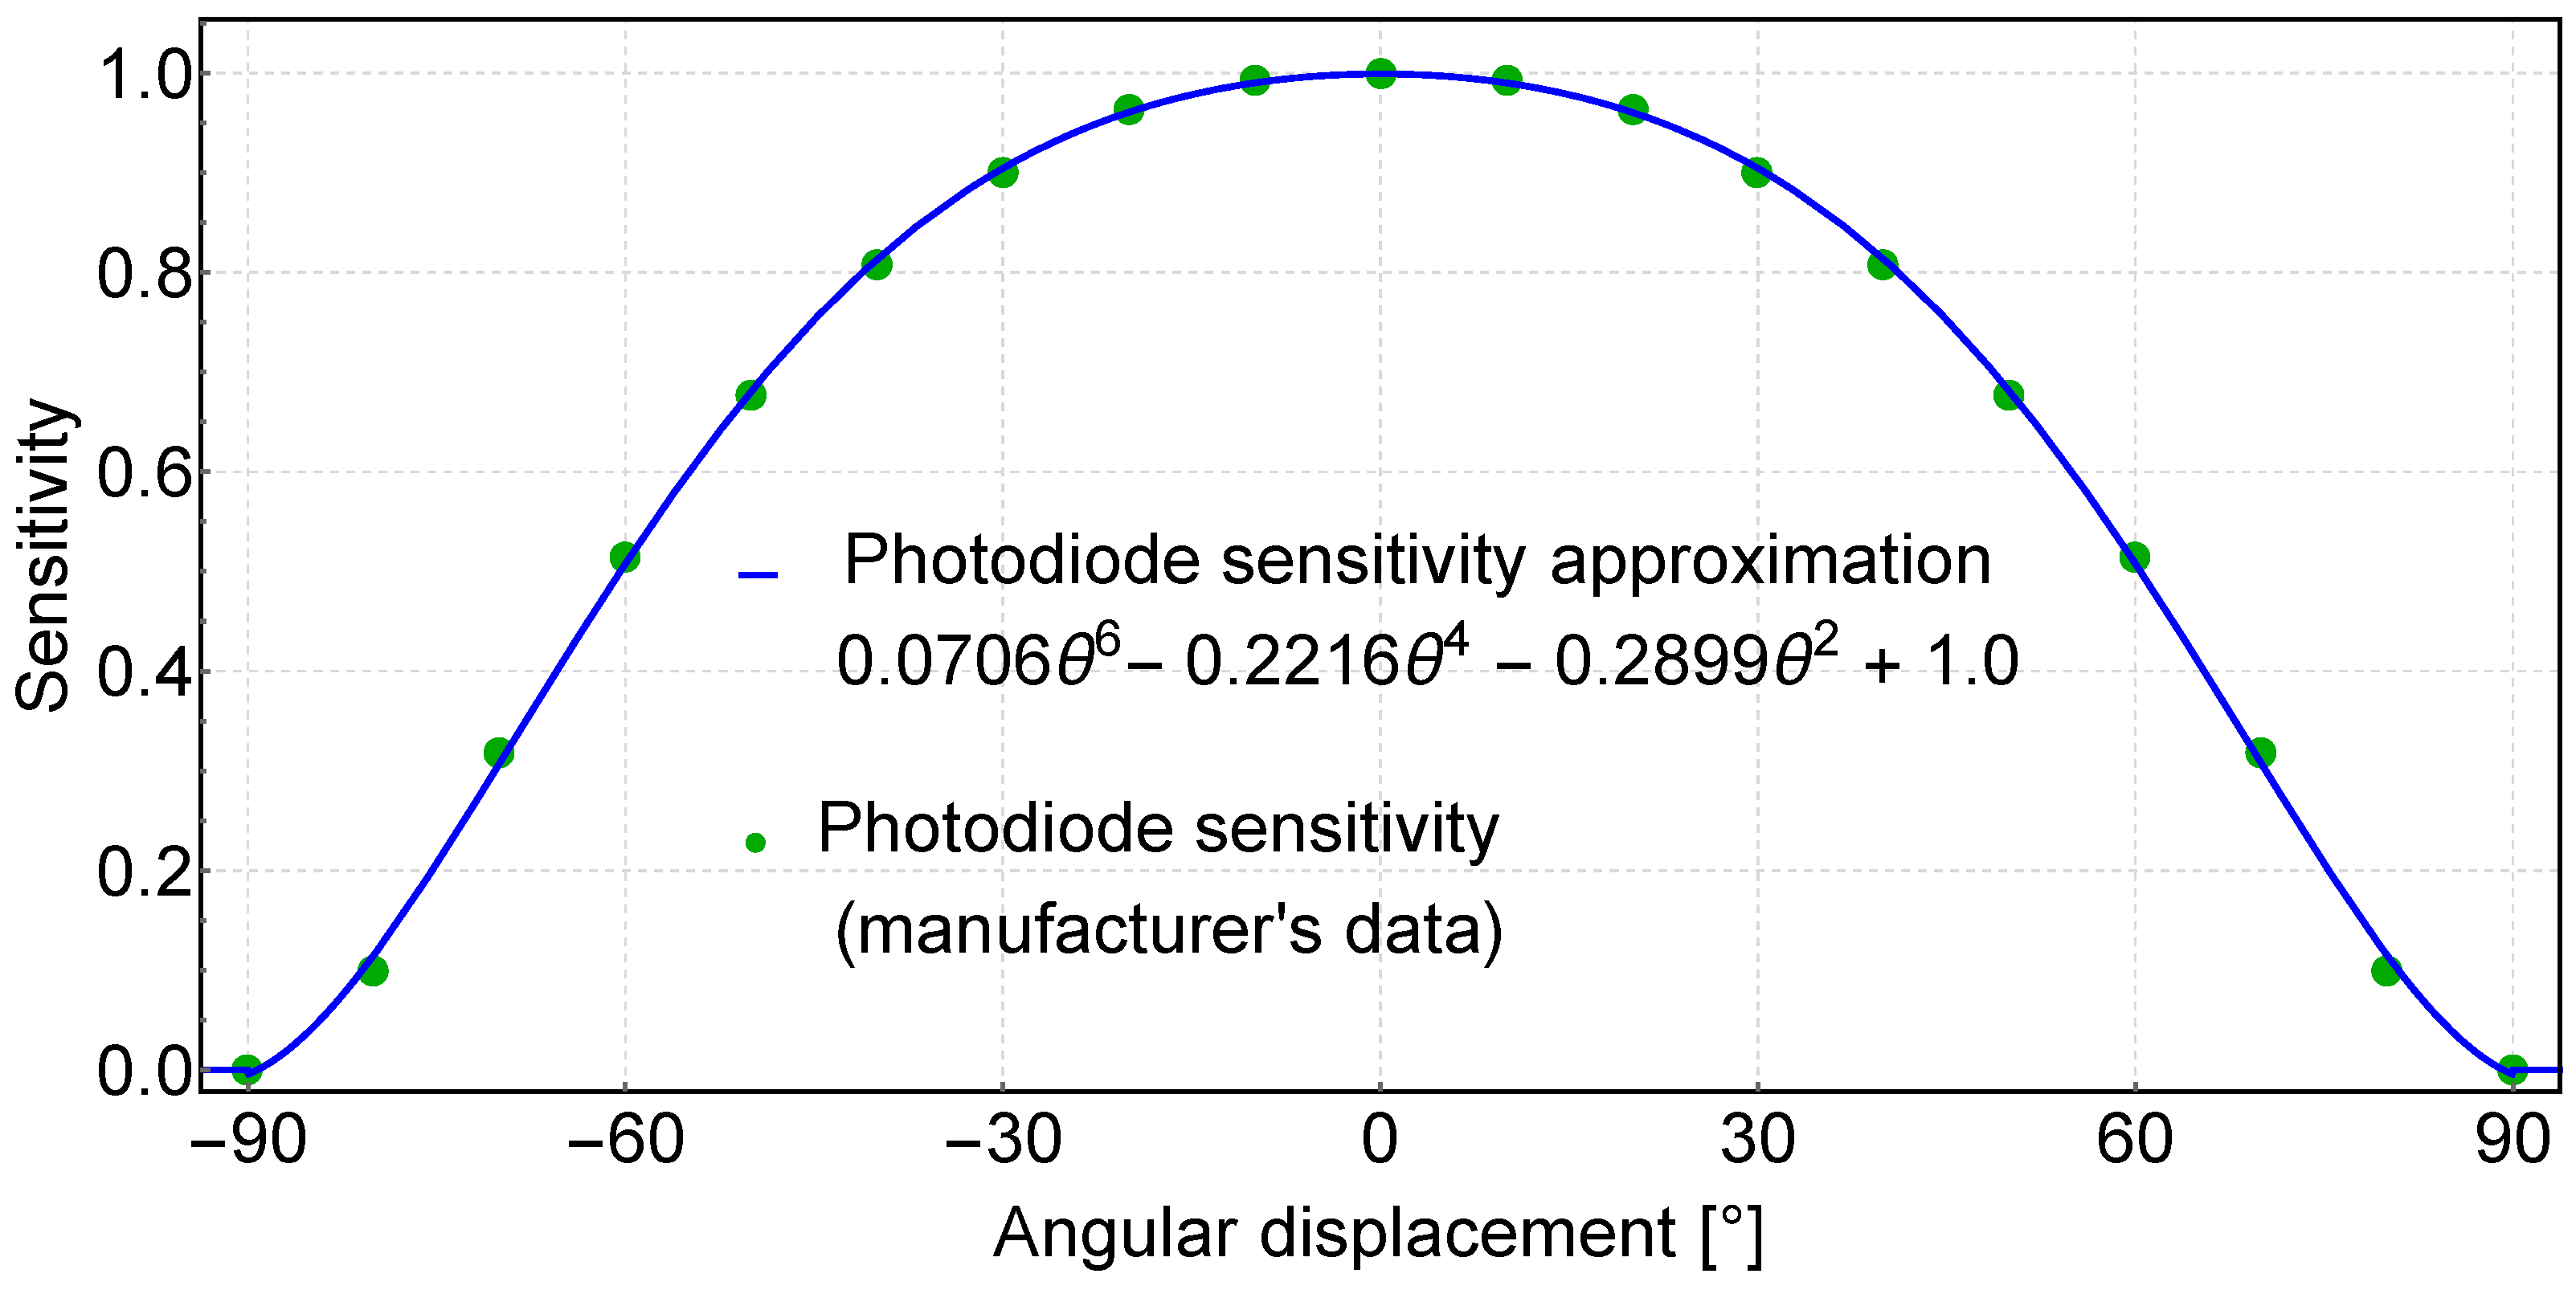
Figure 3.
Mean of angles vs Approximation method comparison
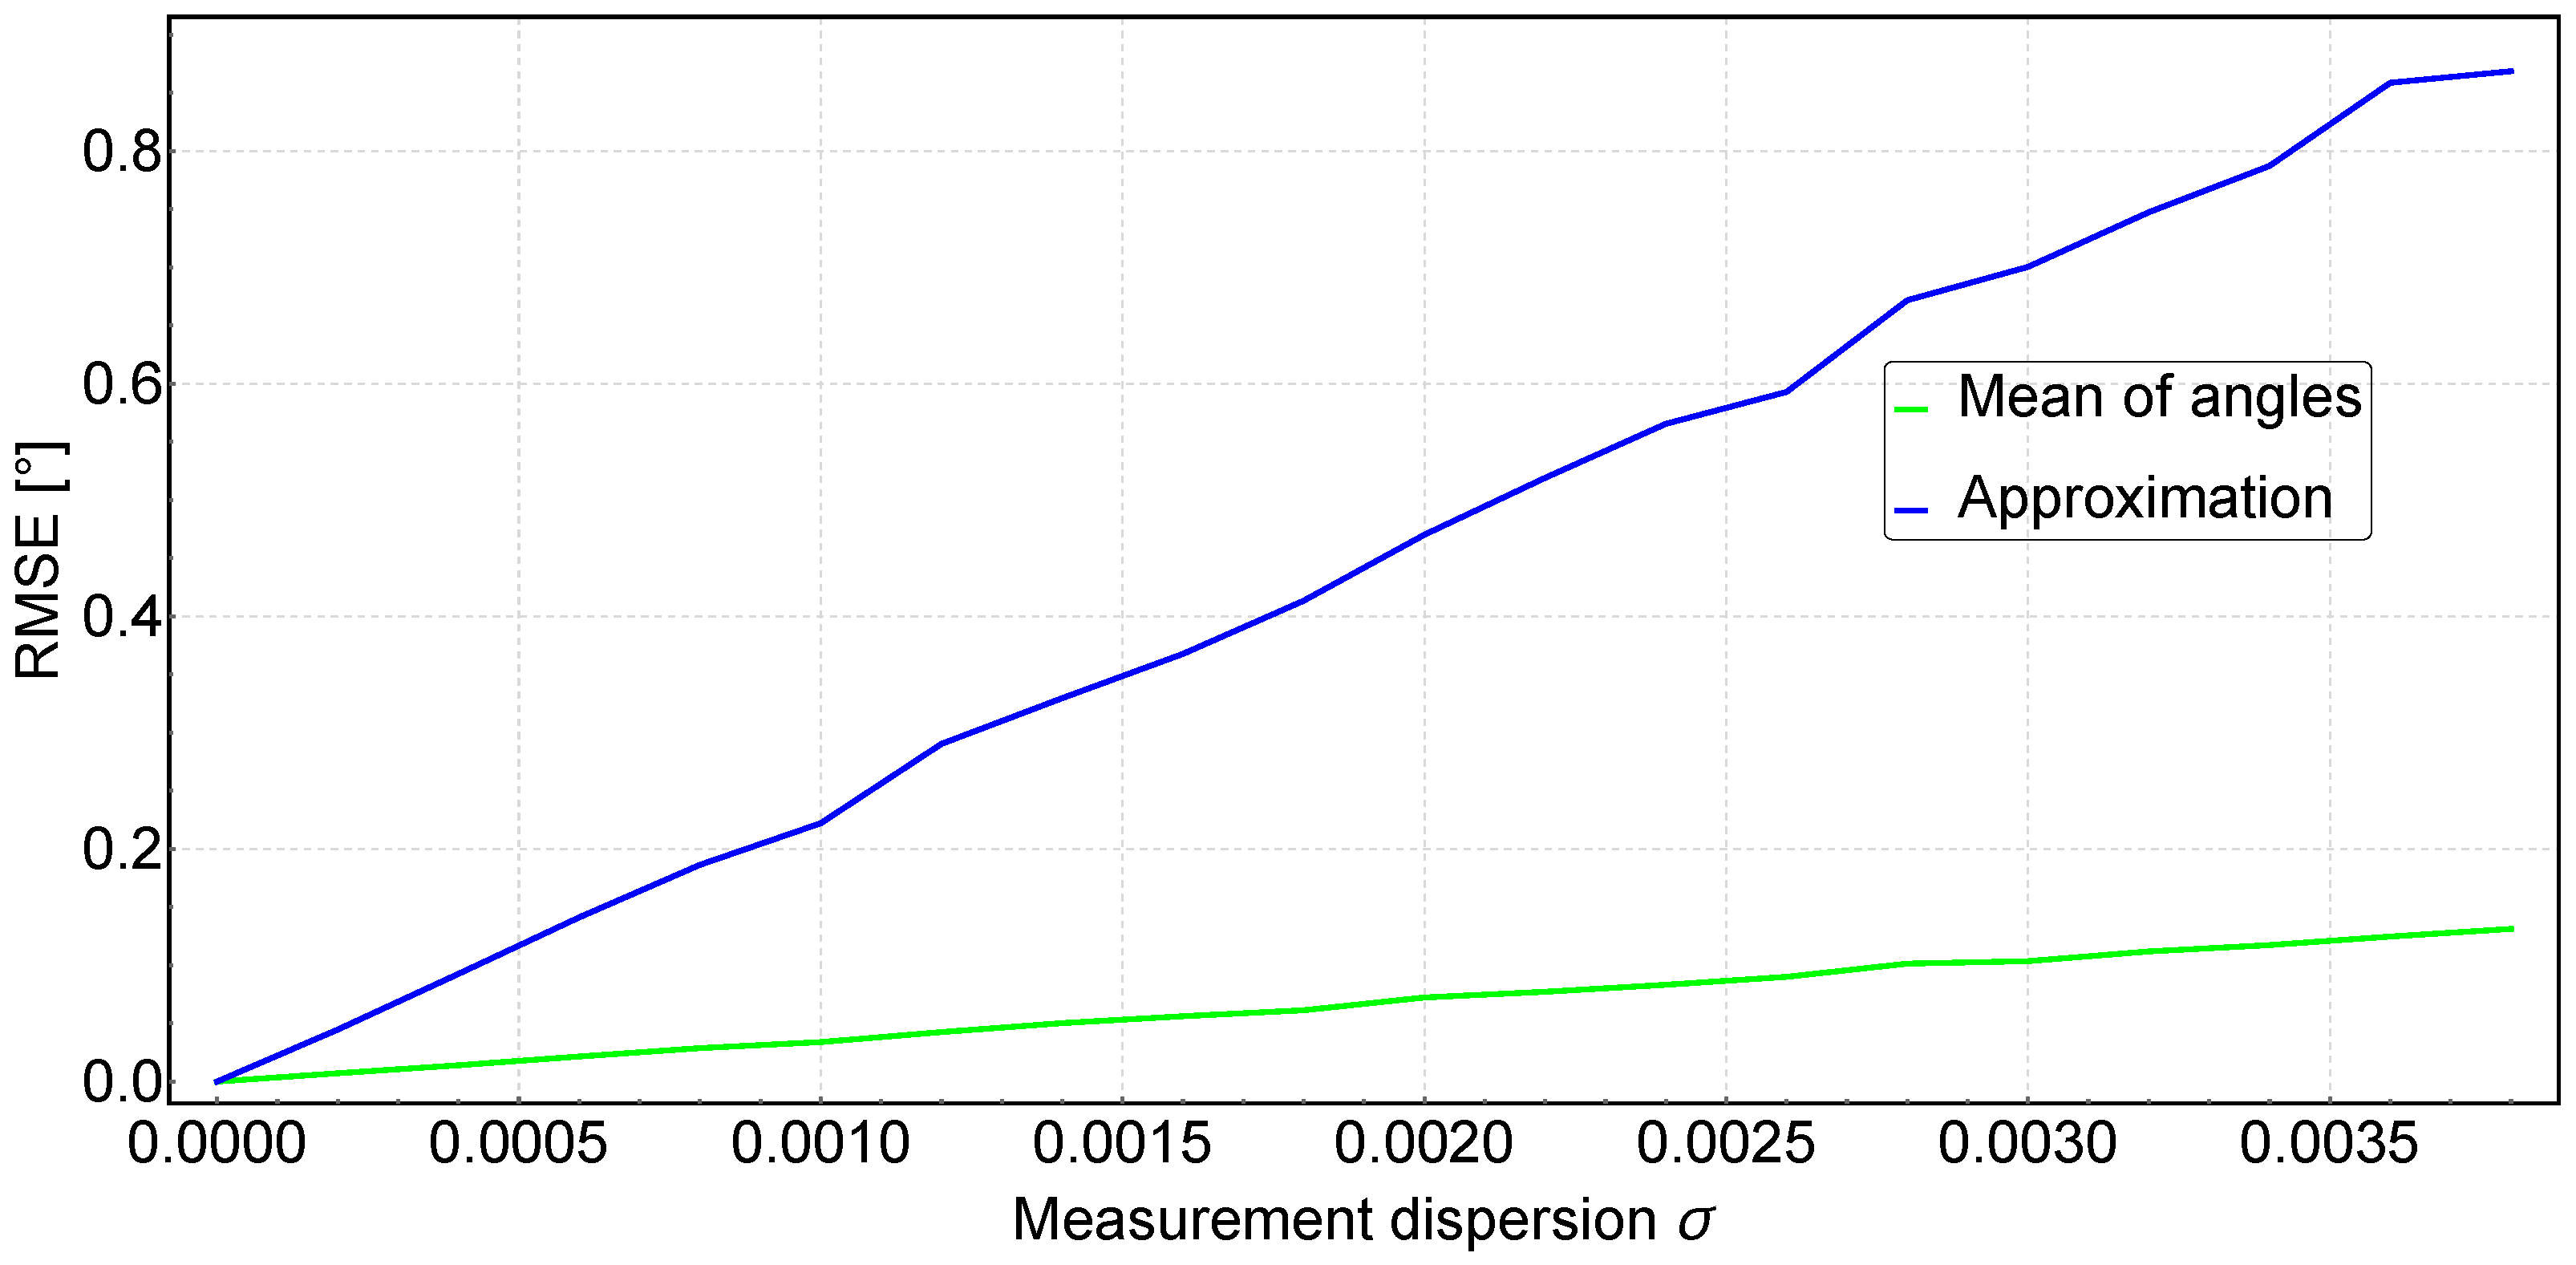
Figure 4.
Beacon radiation pattern.
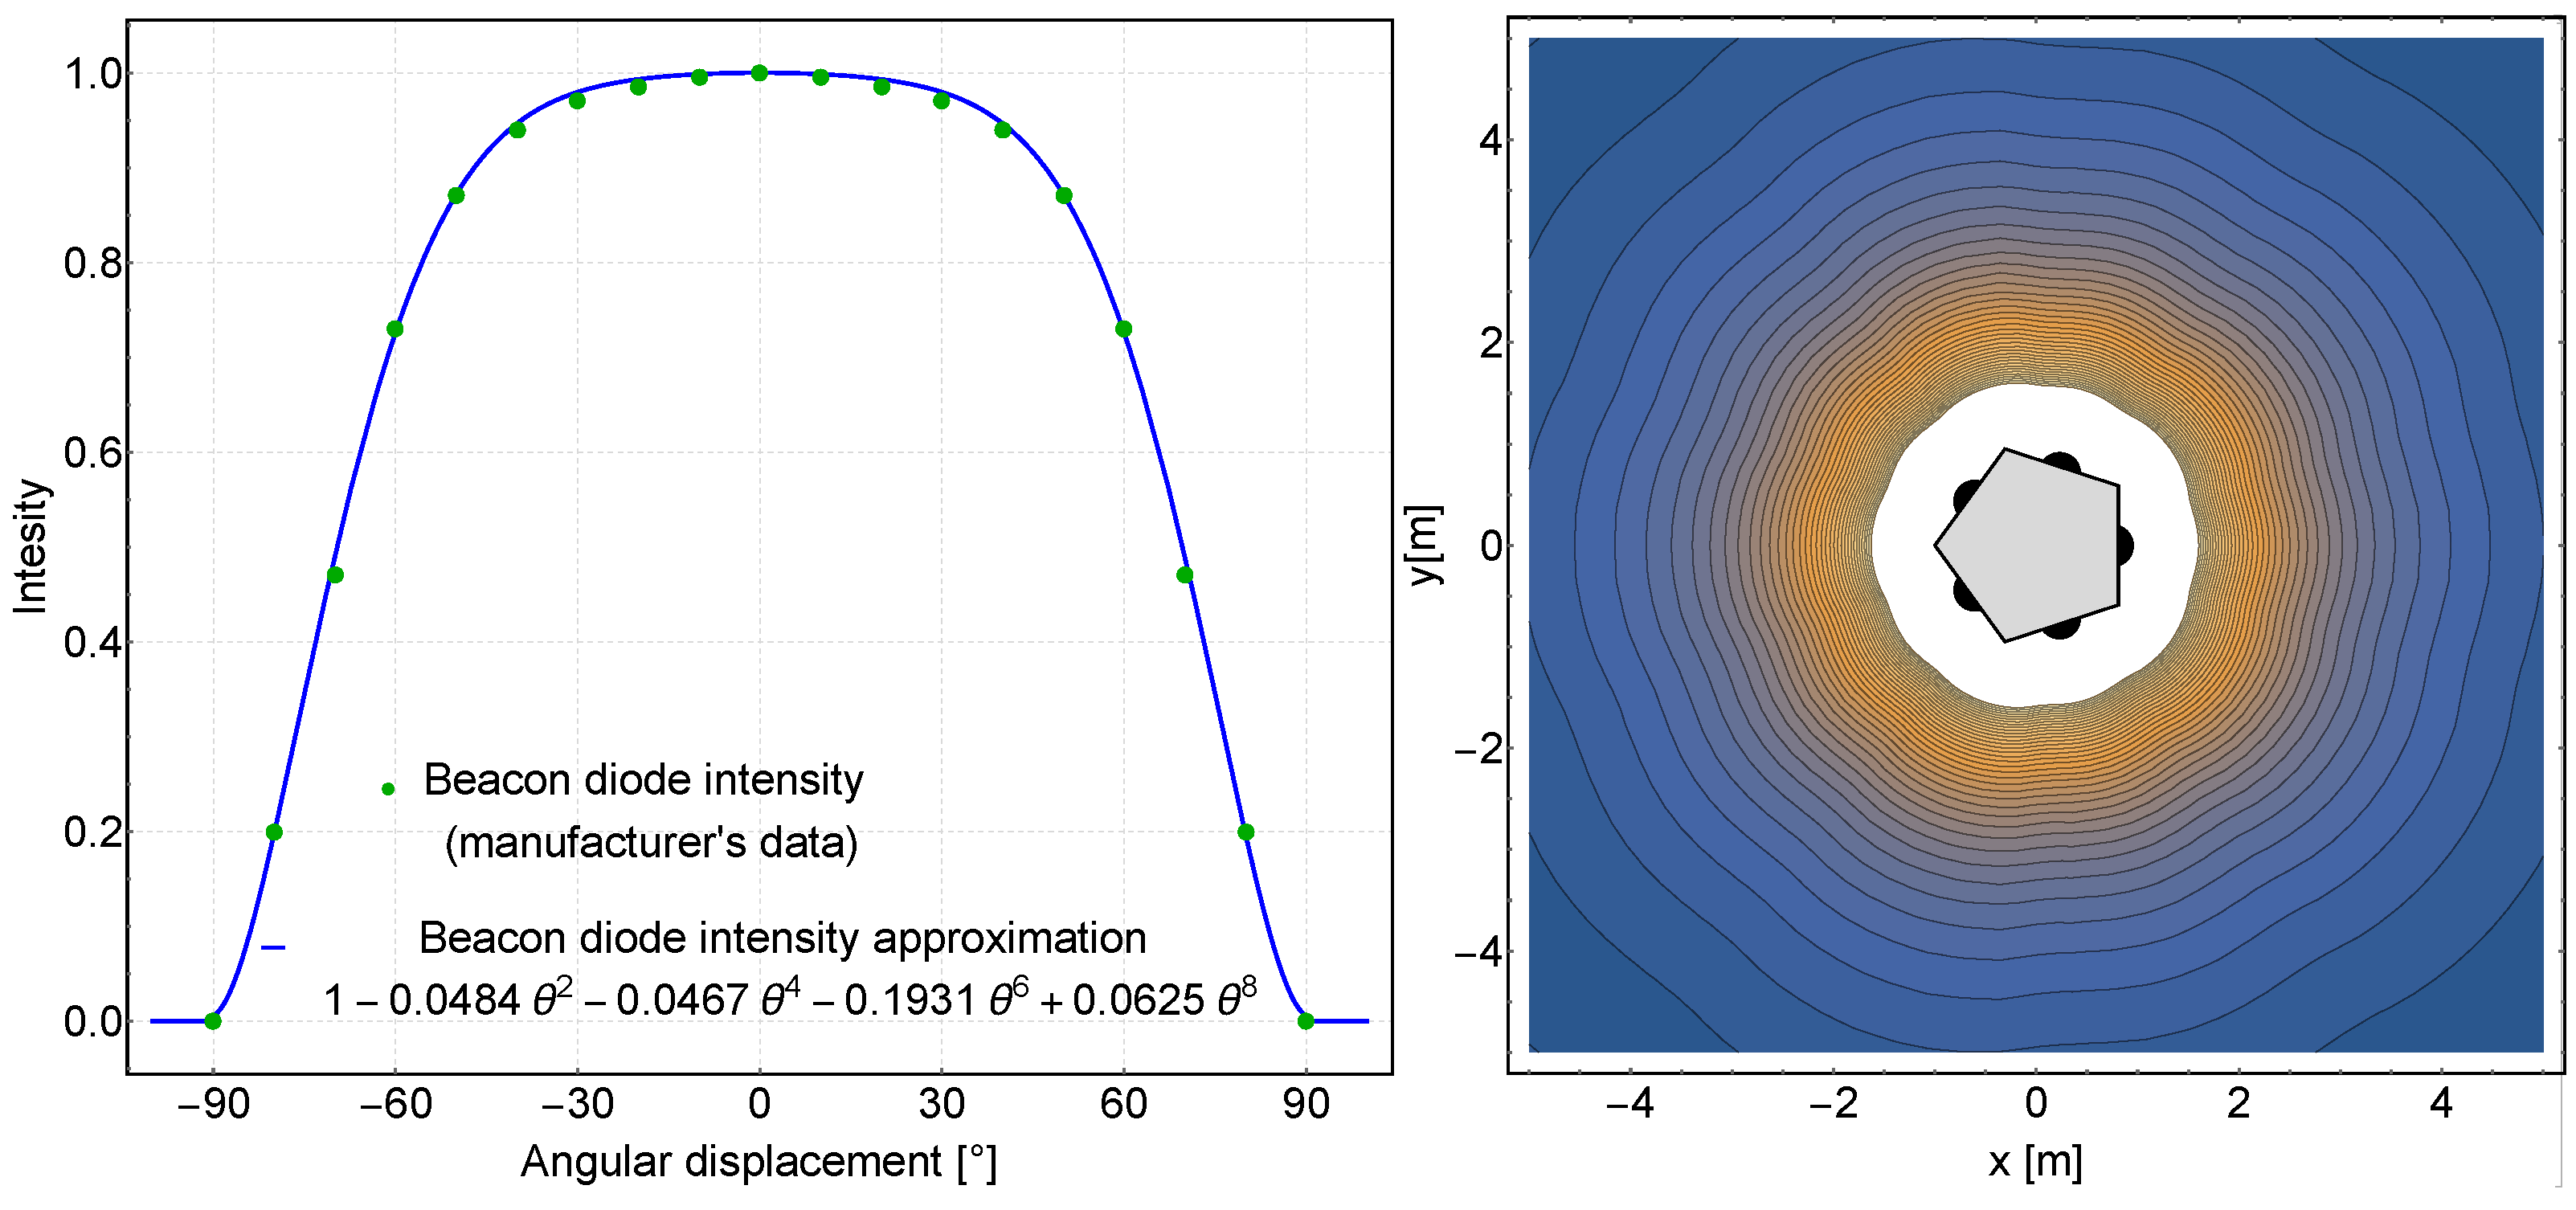
Figure 5.
Hardware configuration of the IR beacon transmission system.
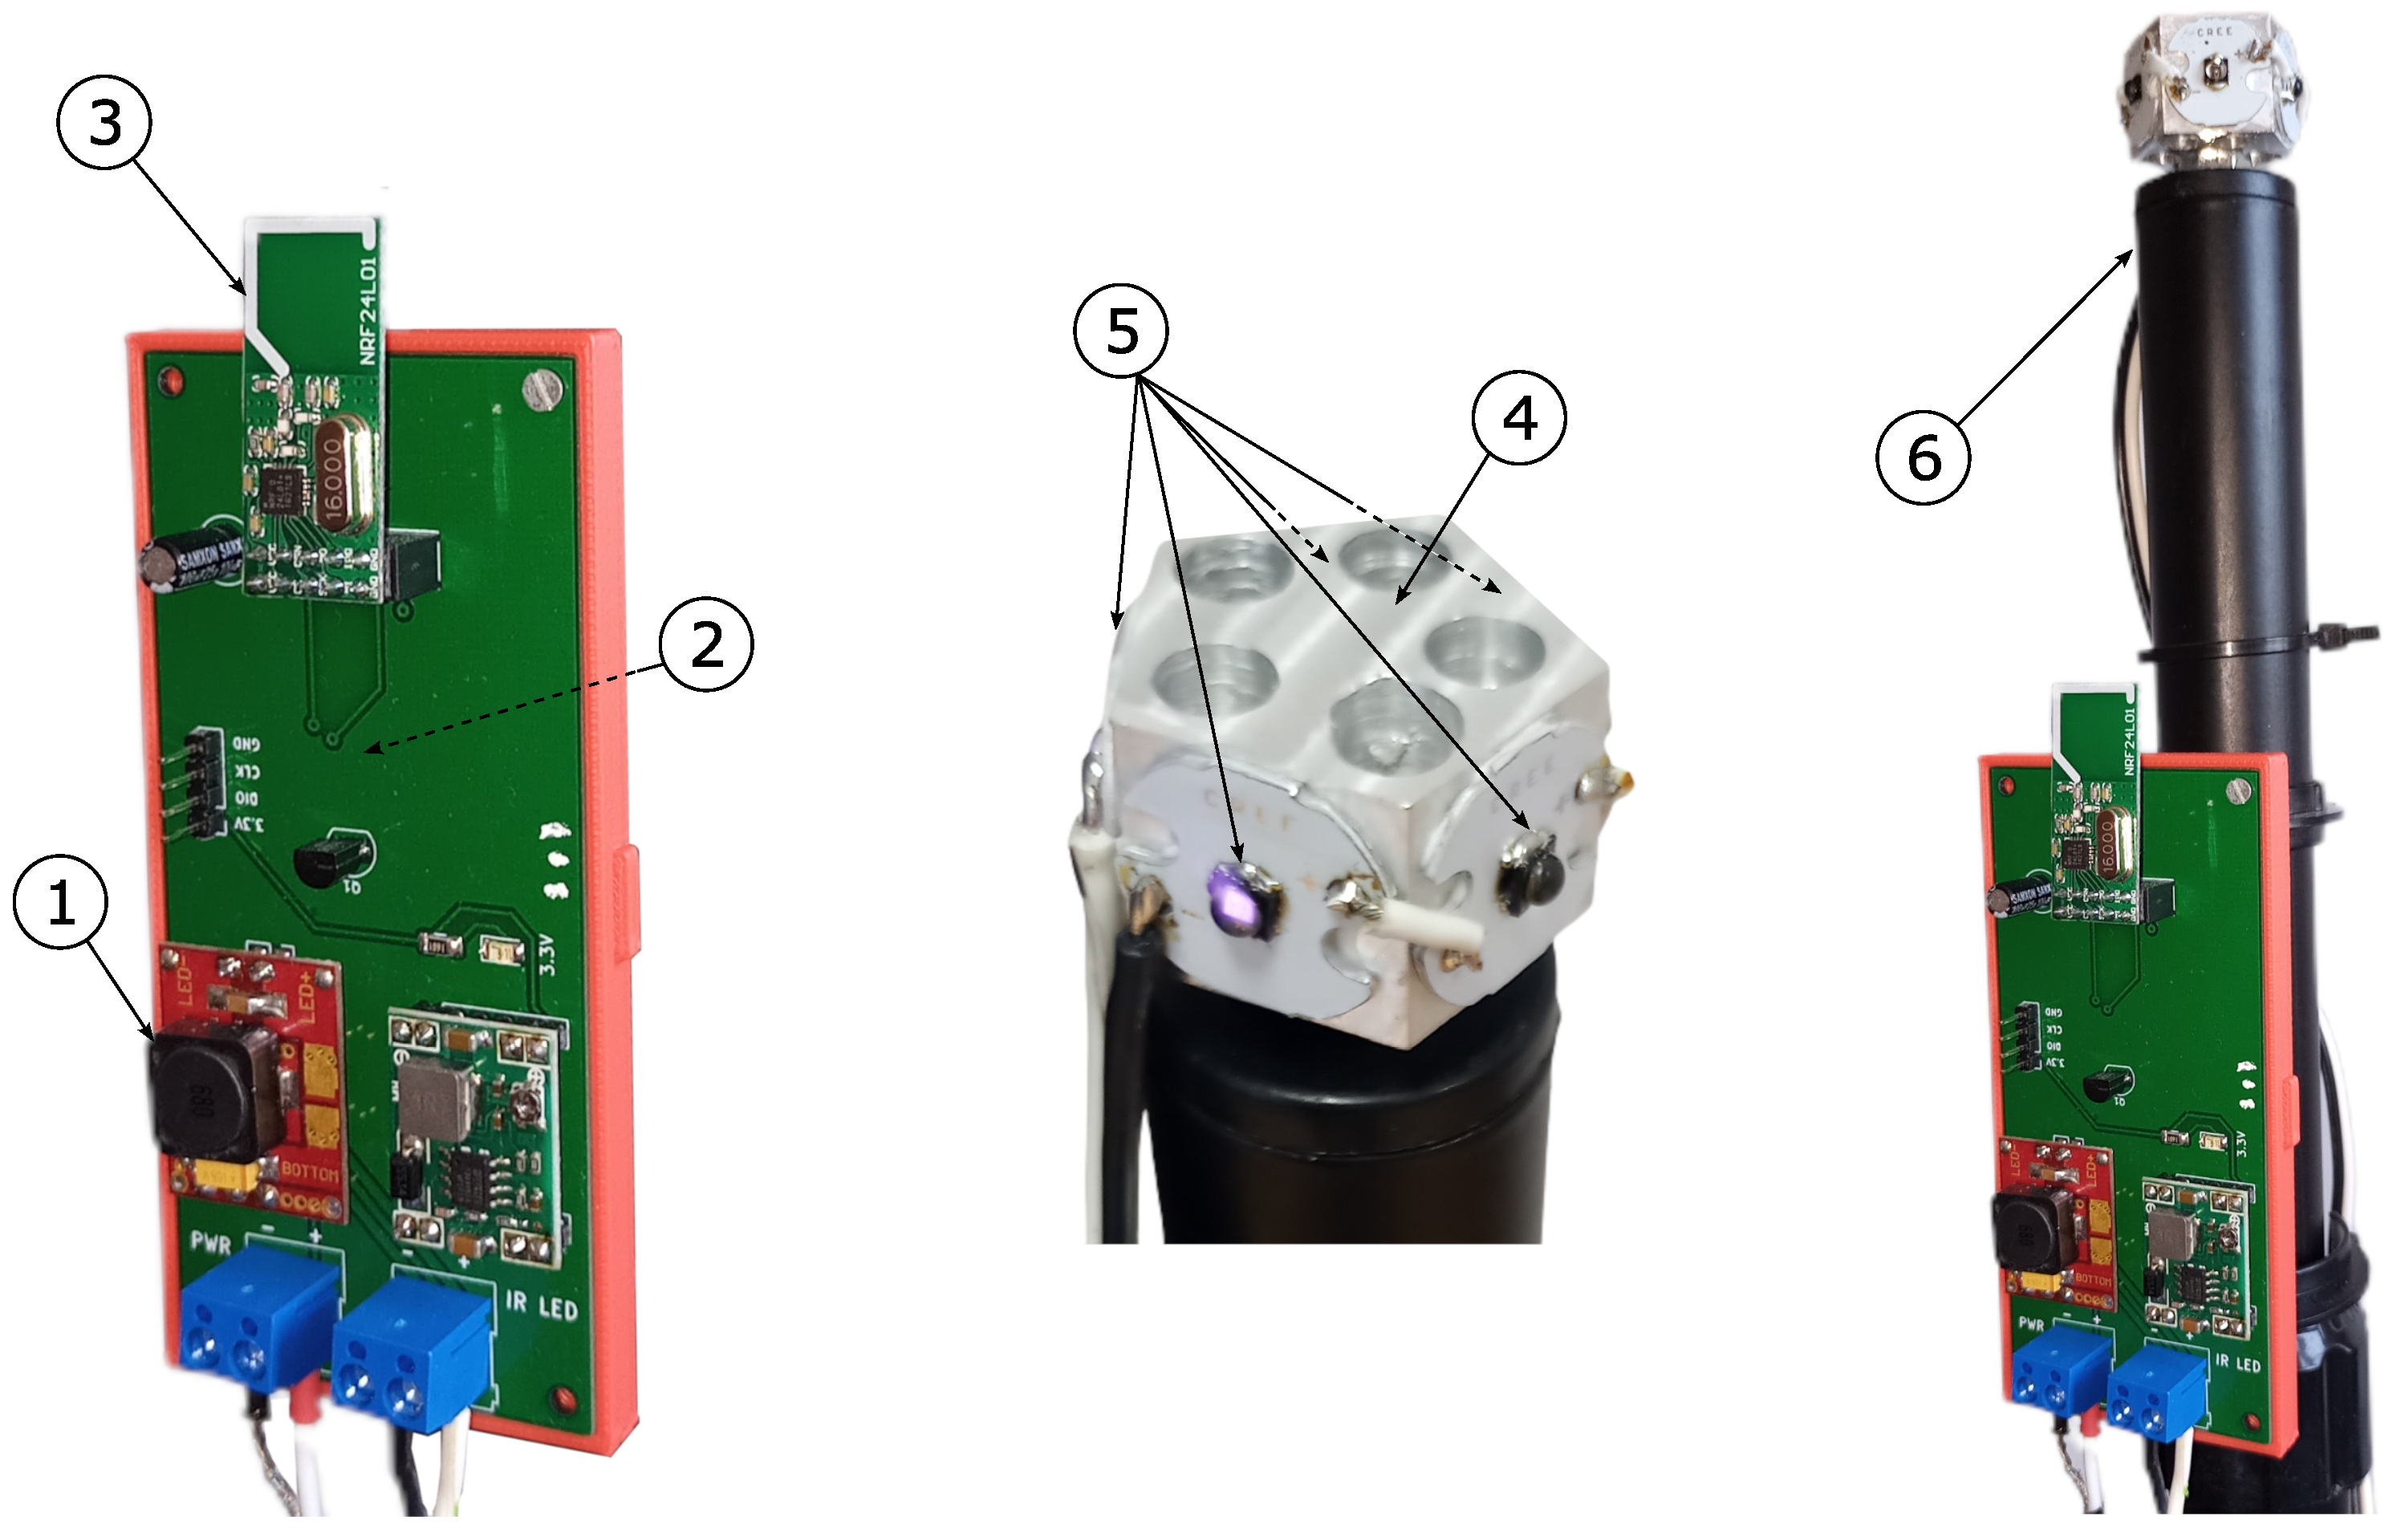
Figure 6.
Oscilloscope diagrams of beacon IR diode currents.
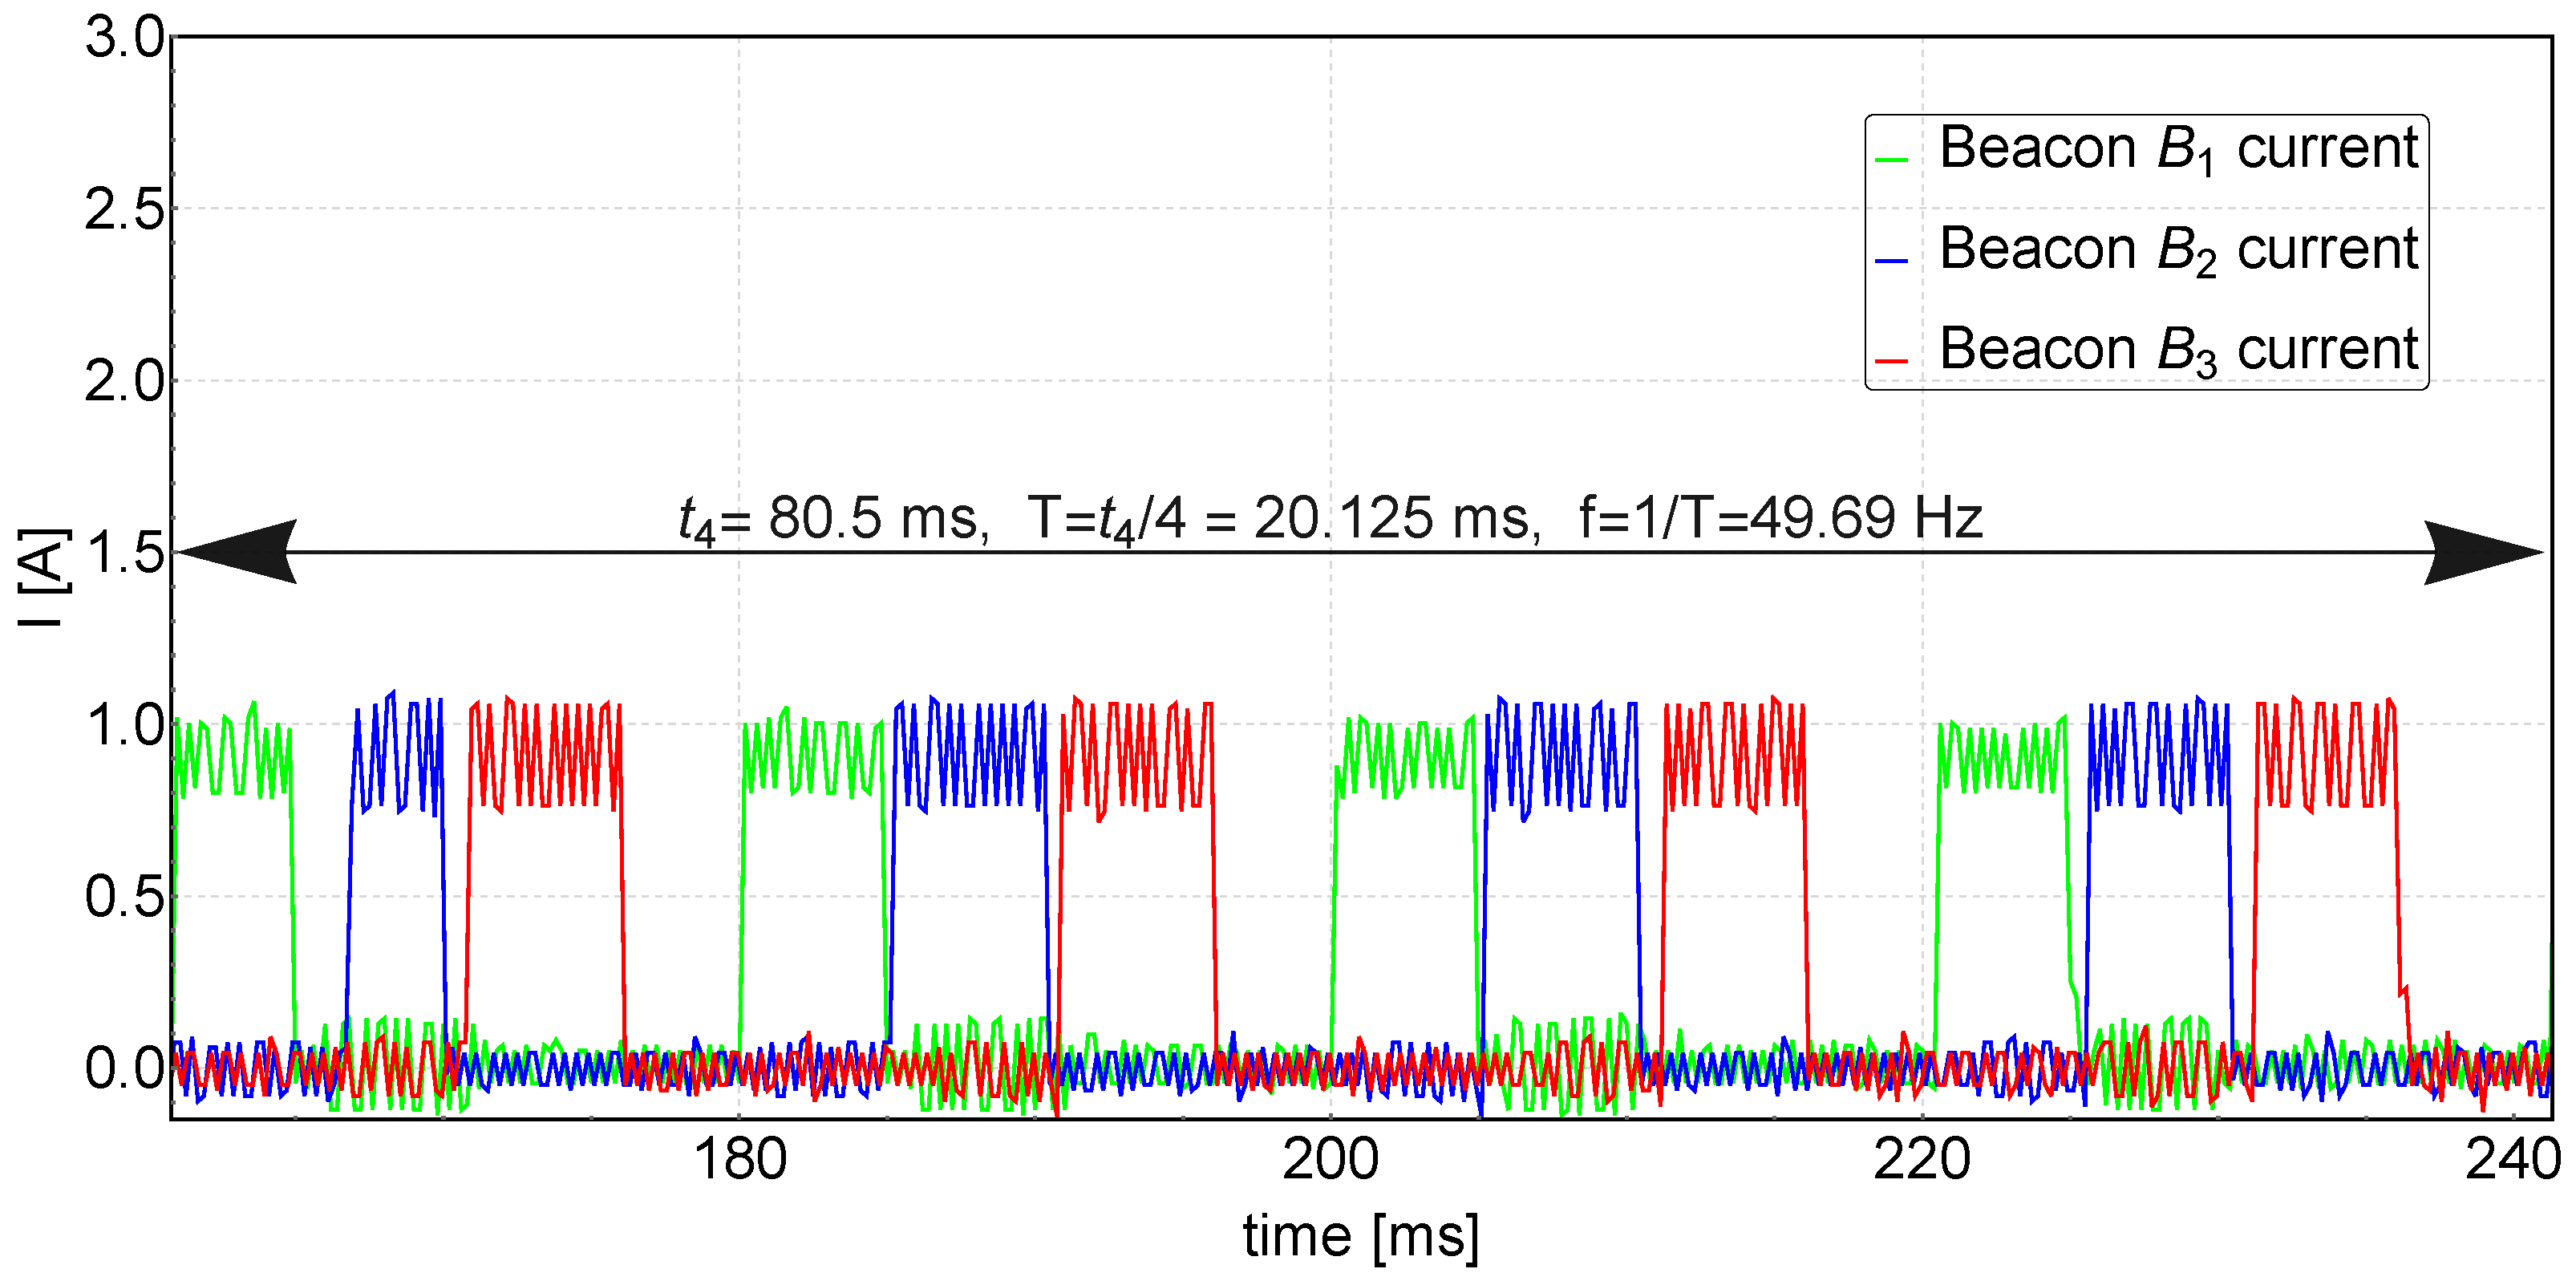
Figure 7.
Analog front-end and digital part of the IR receiver.
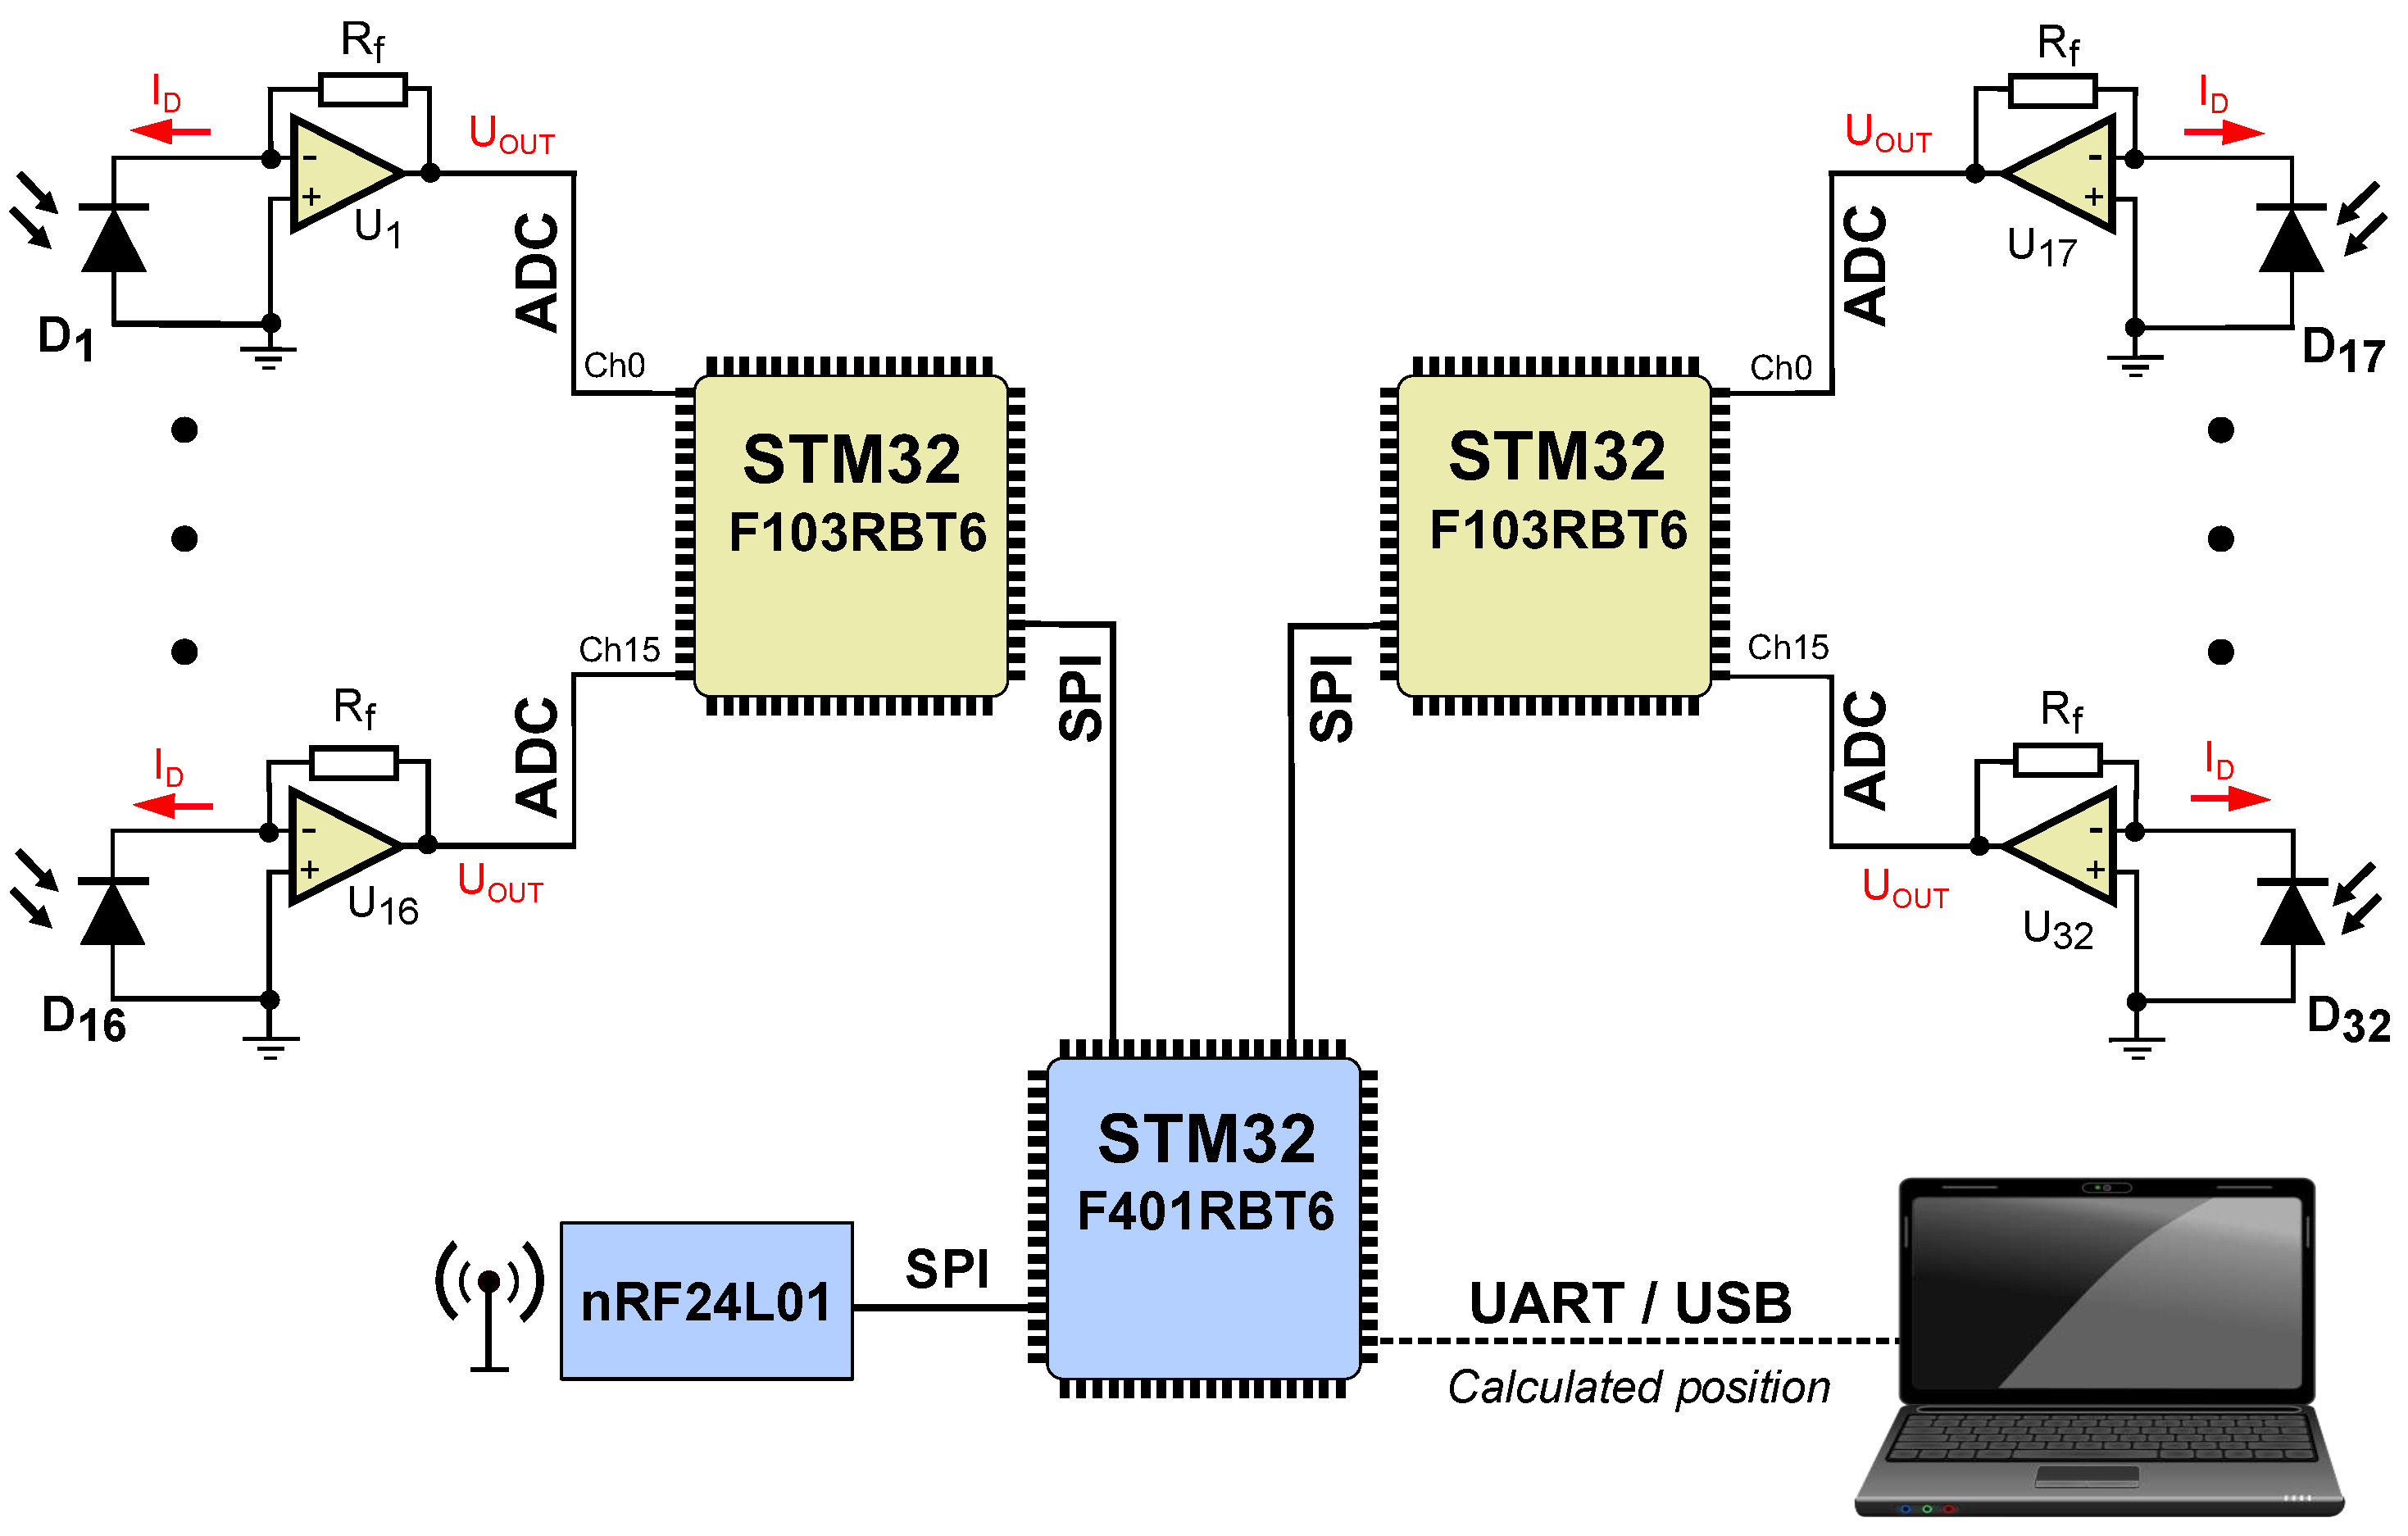
Figure 8.
Hardware configuration of the IR receiver.
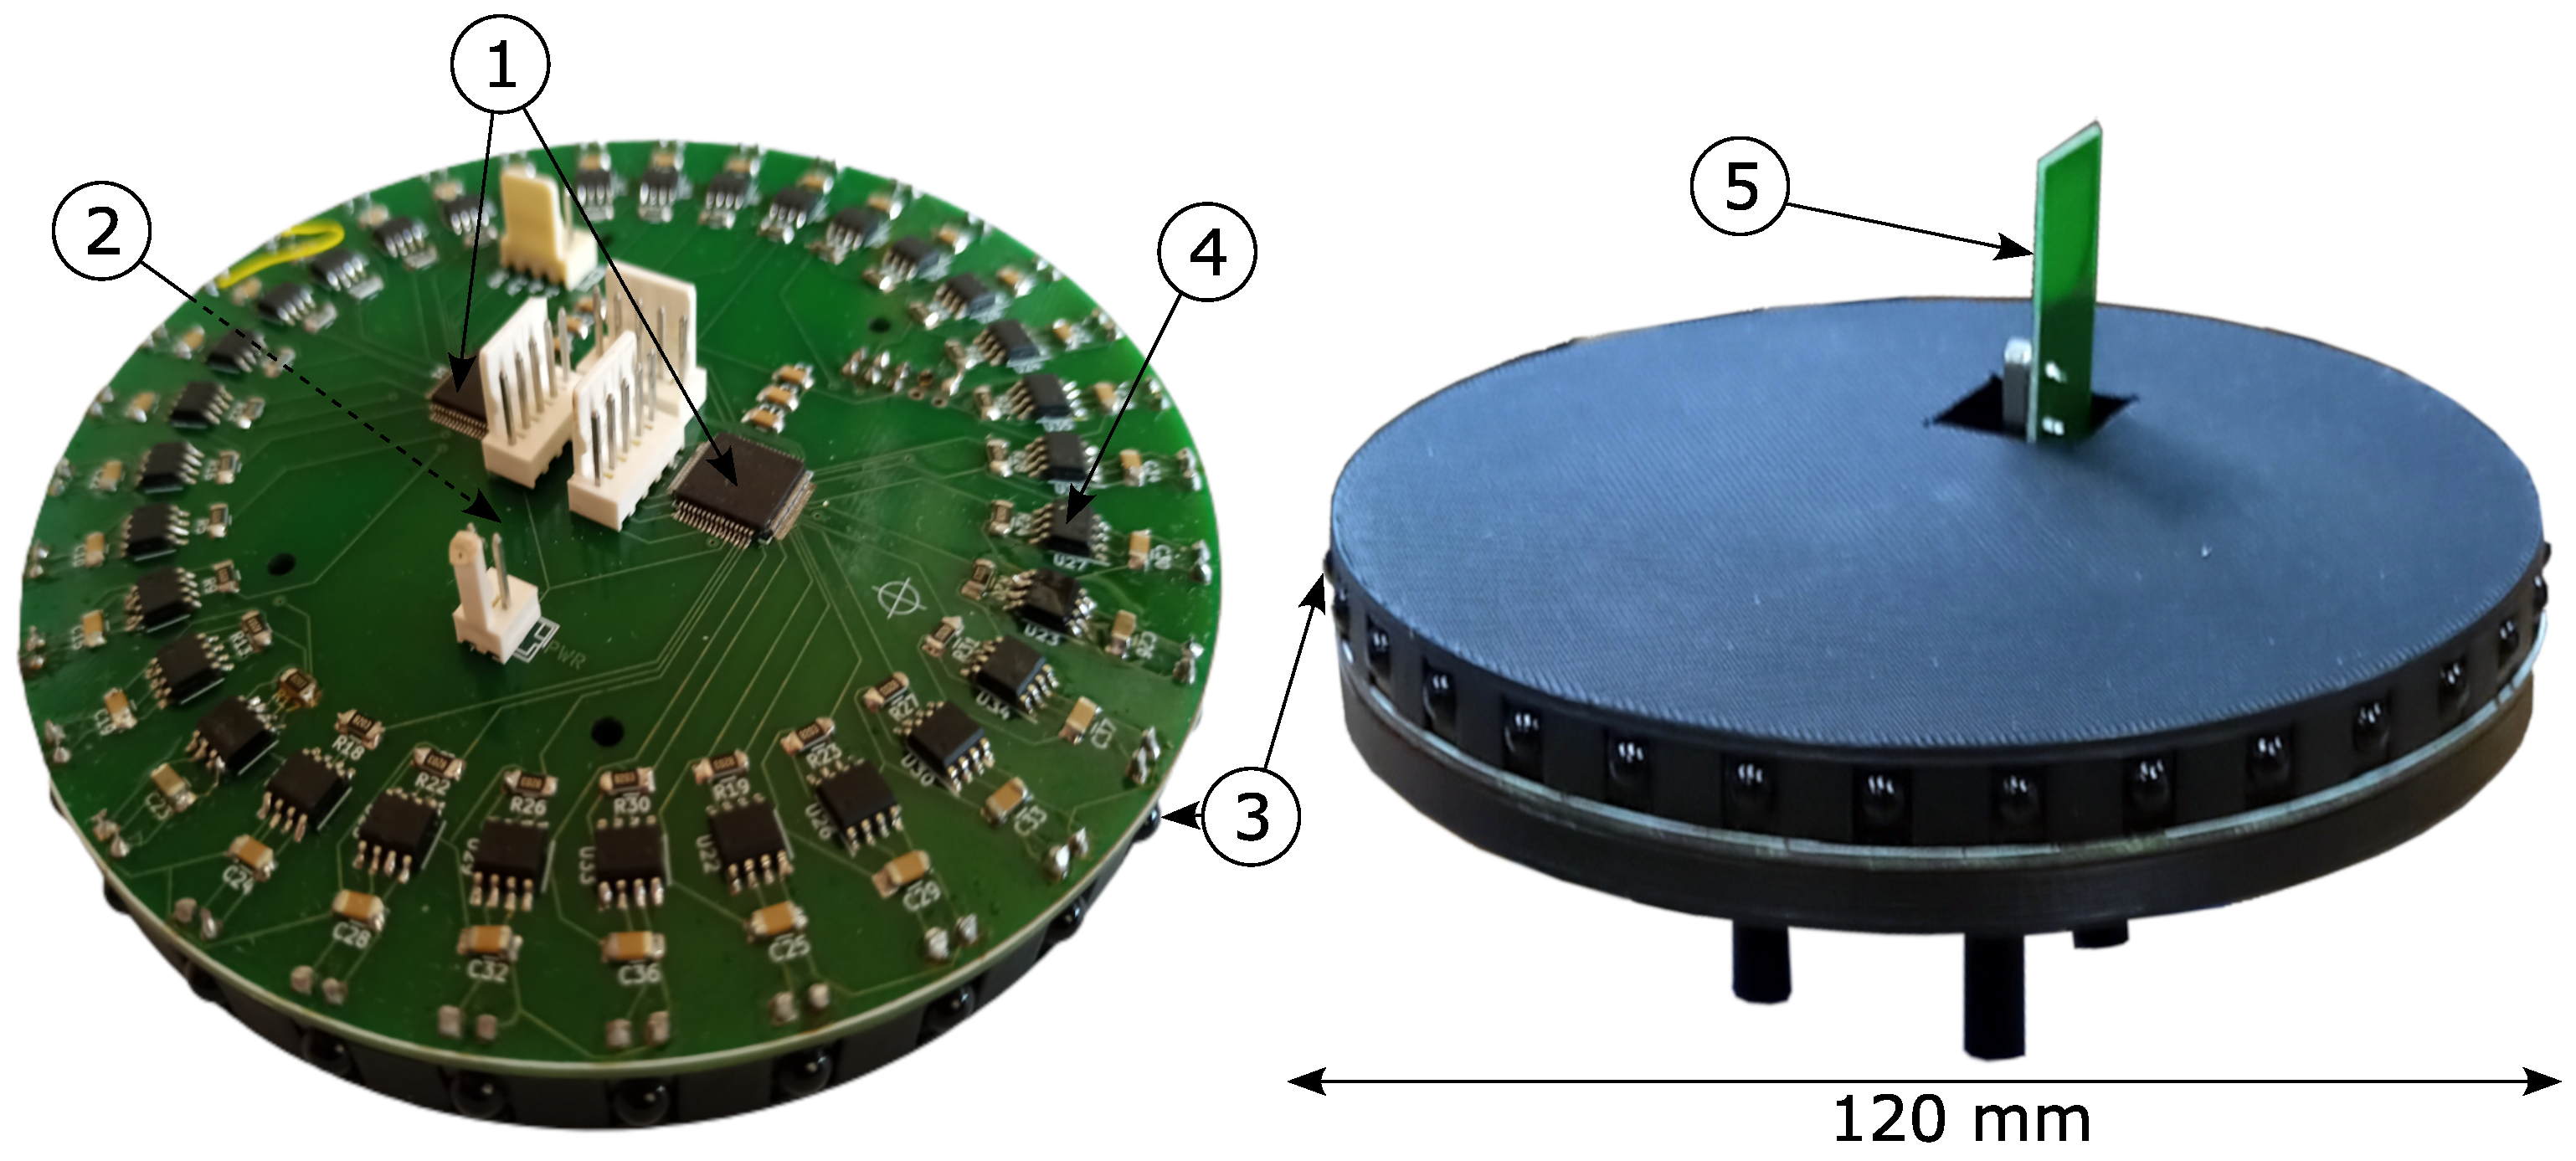
Figure 9.
Laboratory experimental set-up.
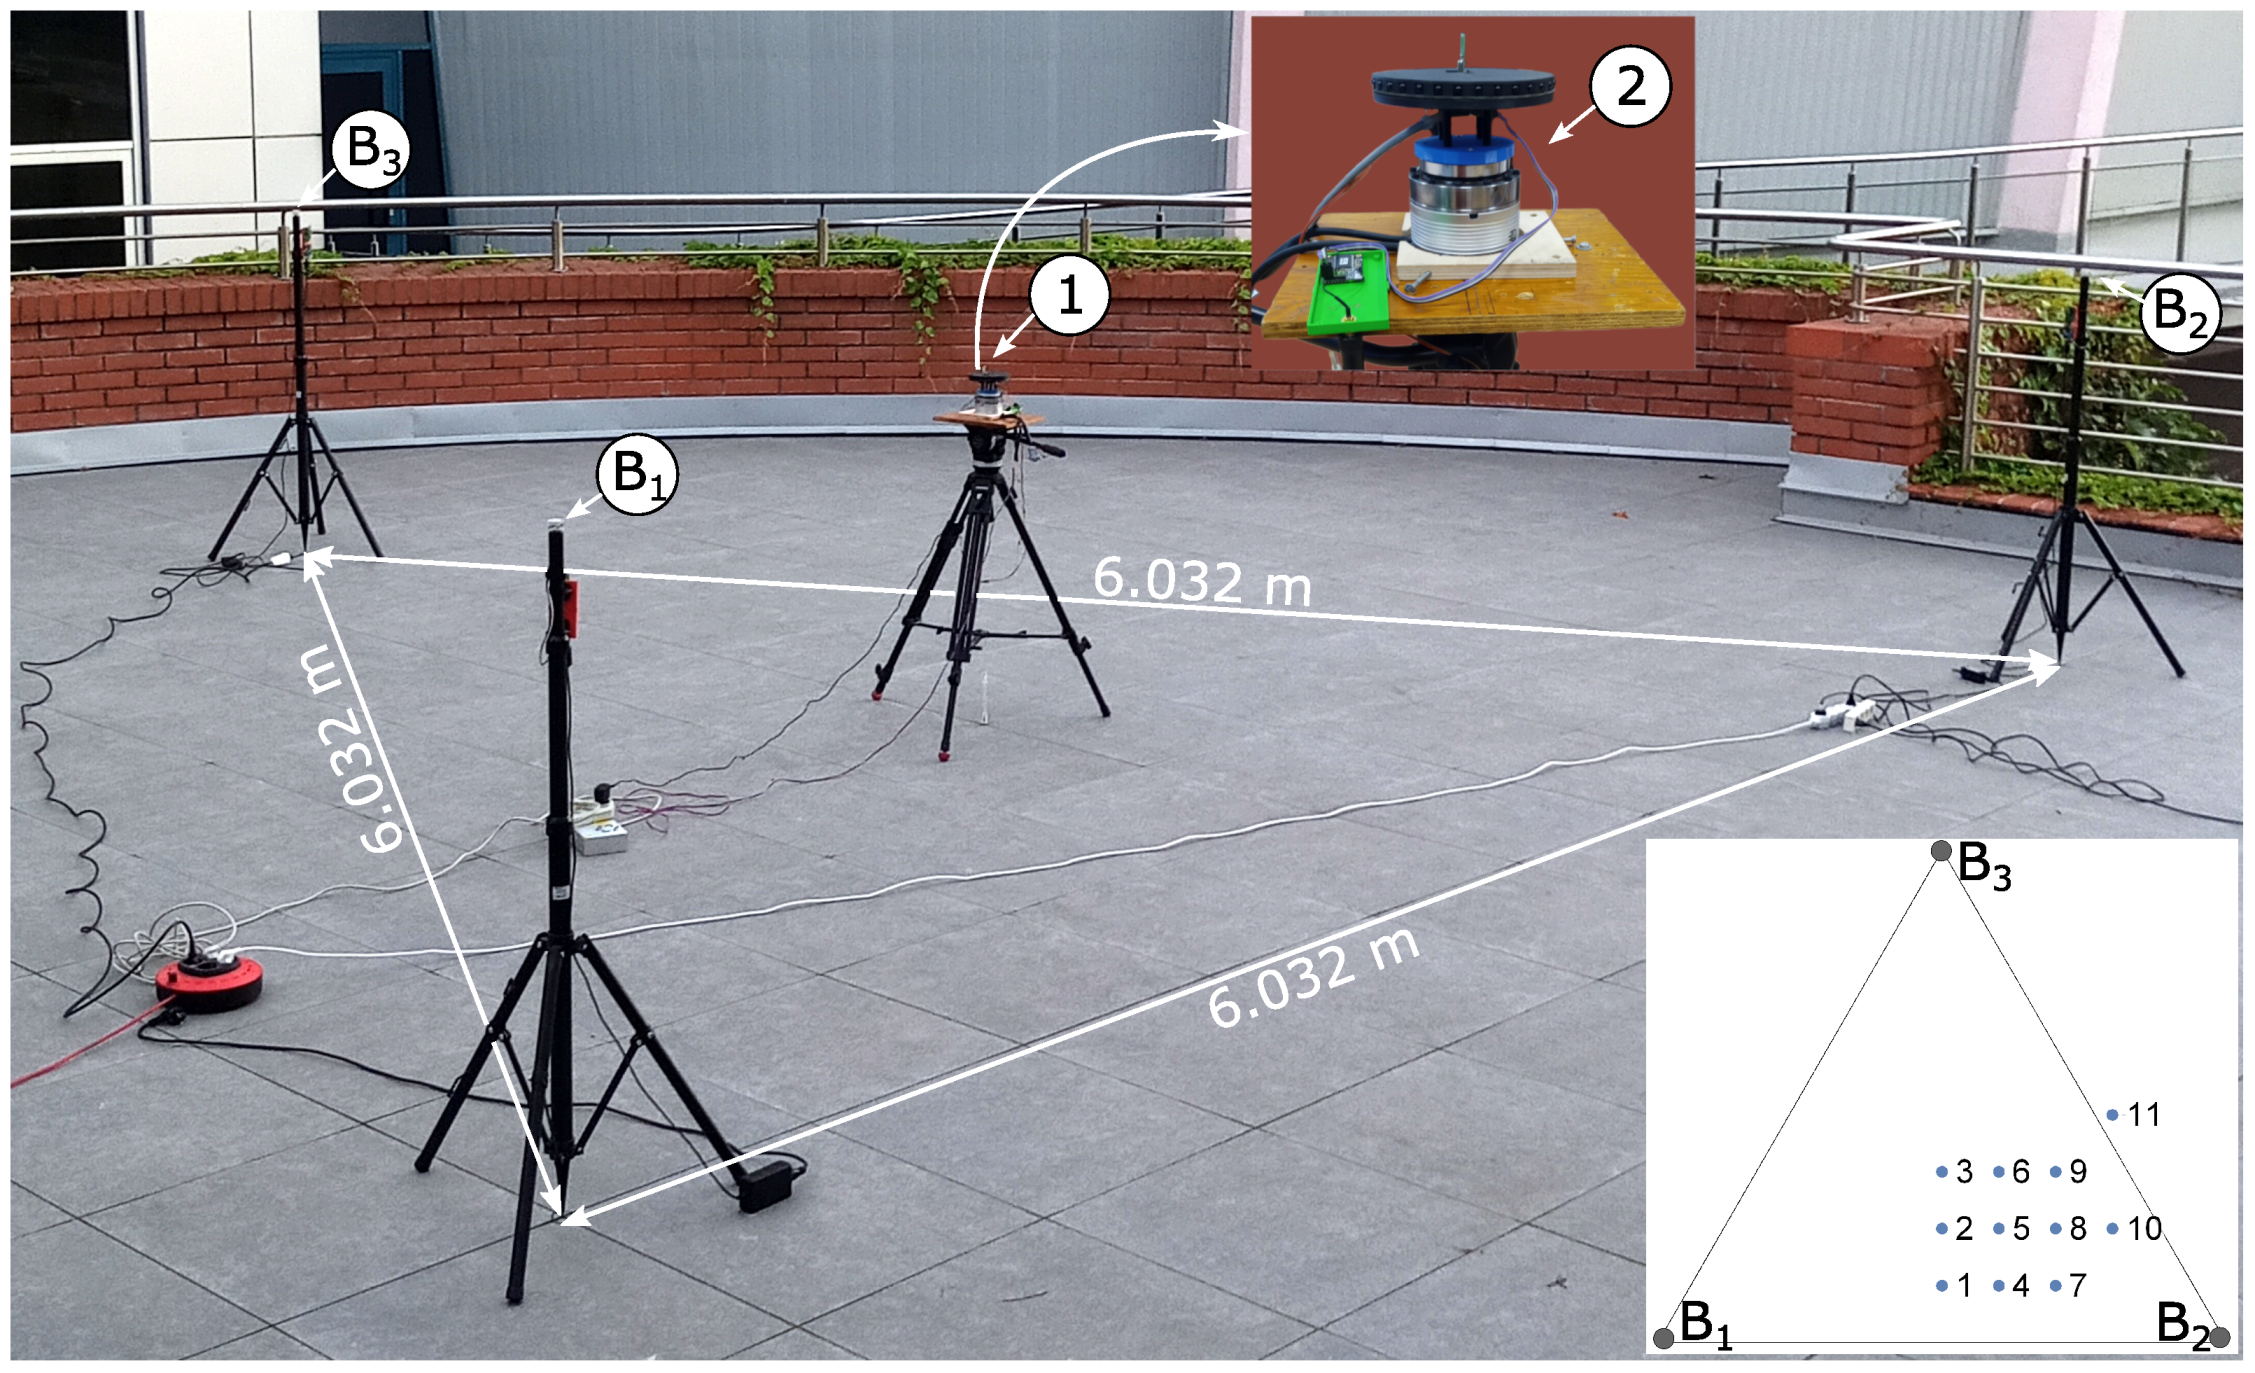
Figure 10.
Experimental results for the tripod in position 3.
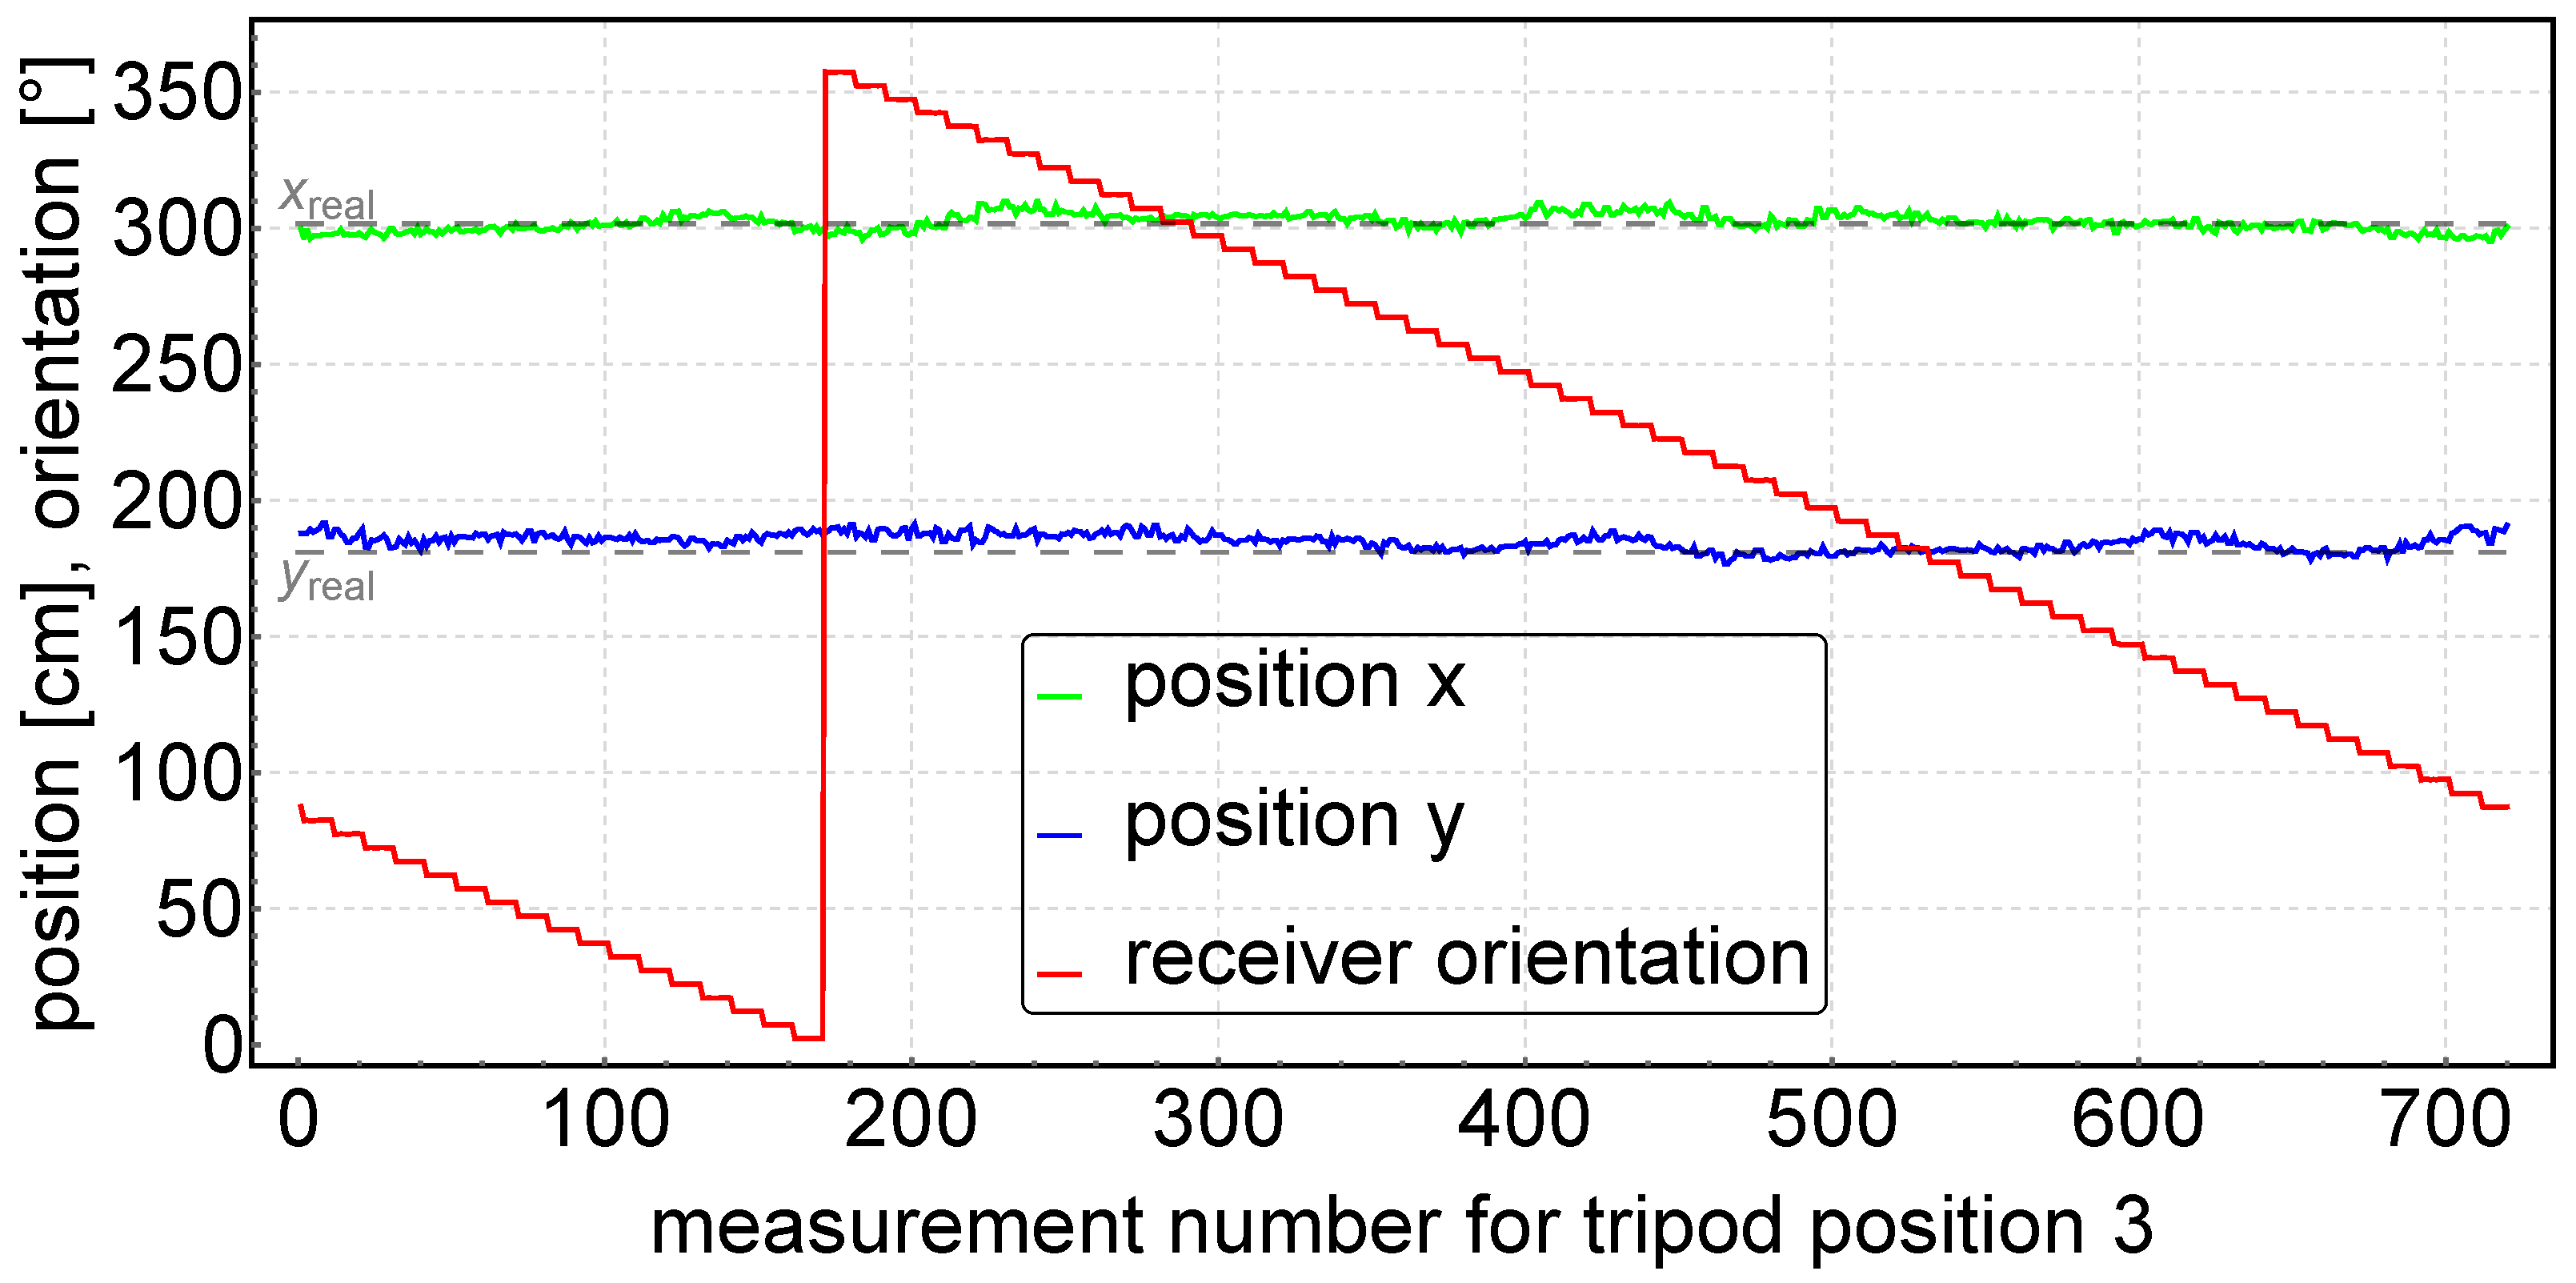
Table 1.
Experiment results.
| Tripod | ||||||||||
|---|---|---|---|---|---|---|---|---|---|---|
| position | [cm] | [cm] | [cm] | [cm] | [cm] | [cm] | [cm] | [cm] | [°] | [°] |
| 1 | 301.6 | 60.32 | 303.53 | 61.59 | 4.62 | 2.35 | 4.47 | 5.67 | 0.36 | 0.48 |
| 2 | 301.6 | 120.64 | 302.75 | 122.91 | 3.36 | 2.35 | 2.99 | 4.83 | 0.4 | 0.49 |
| 3 | 301.6 | 180.96 | 302.26 | 184.03 | 2.39 | 2.63 | 2.31 | 4.74 | 0.43 | 0.48 |
| 4 | 361.92 | 60.32 | 361.91 | 62.32 | 4.24 | 2.13 | 3.99 | 5.14 | 0.46 | 0.46 |
| 5 | 361.92 | 120.64 | 361.62 | 122.83 | 4.09 | 3.13 | 3.32 | 5.61 | 0.37 | 0.53 |
| 6 | 361.92 | 180.96 | 364.01 | 184.64 | 3.06 | 2.46 | 2.13 | 5.77 | 0.35 | 0.61 |
| 7 | 422.24 | 60.32 | 421.93 | 60.84 | 5.72 | 3.02 | 5.32 | 6.49 | 0.45 | 0.46 |
| 8 | 422.24 | 120.64 | 421.94 | 122.67 | 5.16 | 3.74 | 4.21 | 6.69 | 0.5 | 0.55 |
| 9 | 422.24 | 180.96 | 422.2 | 182.99 | 4.06 | 4.85 | 2.45 | 6.64 | 0.47 | 0.51 |
| 10 | 482.56 | 120.64 | 480.69 | 122.96 | 5.24 | 4.9 | 4.01 | 7.76 | 0.42 | 0.47 |
| 11 | 482.56 | 241.28 | 479.56 | 247.7 | 4.62 | 6.36 | 2.34 | 10.57 | 0.44 | 0.51 |
| Pooled: | 4.34 | 3.68 | 3.56 | 6.55 | 0.42 | 0.51 |
Disclaimer/Publisher’s Note: The statements, opinions and data contained in all publications are solely those of the individual author(s) and contributor(s) and not of MDPI and/or the editor(s). MDPI and/or the editor(s) disclaim responsibility for any injury to people or property resulting from any ideas, methods, instructions or products referred to in the content. |
© 2024 by the authors. Licensee MDPI, Basel, Switzerland. This article is an open access article distributed under the terms and conditions of the Creative Commons Attribution (CC BY) license (http://creativecommons.org/licenses/by/4.0/).
Copyright: This open access article is published under a Creative Commons CC BY 4.0 license, which permit the free download, distribution, and reuse, provided that the author and preprint are cited in any reuse.
MDPI Initiatives
Important Links
© 2024 MDPI (Basel, Switzerland) unless otherwise stated


