1. Introduction
Wood is an attractive and frequently used construction raw material, despite the appearance of new synthetic building materials on the market. In developed economies, the costs associated with logging and processing continue to increase along with the costs of labor and raw materials. Therefore, it is important to develop techniques that minimize production costs, including waste raw materials or semi-finished products. Neural networks are a type of machine learning algorithms that imitate how the brain works. Neural networks are used due to their effectiveness in solving problems related to the processing of images, sounds, text and other data. One of the applications of neural networks is the detection of blue stain in sawmill wood. Blue stain is a tree disease that causes the wood to change color to blue or black. Traditional methods of detecting blue stain in sawmill wood are time-consuming and expensive. The use of neural networks allows for faster and more effective detection of blue stain in sawmill wood, which can help prevent the spread of the disease and increase sawmill production efficiency.
Currently, the process of detecting wood defects, i.e. knots, cracks, resins, rings, edges in most small and medium-sized sawmill plants, involves marking the wood in appropriate places by people specially employed for this process. Usually, at least four people take part in this process: two for feeding the wood onto the conveyor and marking (hatching) the boards, and two for receiving and stacking the boards. Cutting out defects involves the employee marking the cutting location with a line on the wood. Then, an "optimizer" machine cuts the board at the marked location and throws the cut elements onto a sorting table, where they are picked up by an employee. Removing the defect involves cutting it out and dividing the board into smaller parts. Accuracy in cutting out a defect involves cutting it out as sparingly as possible (as close to the defect as possible) in order to obtain the most material in a better class. The cut off part is treated as waste. This operation depends on the assessment of the material from four sides and the precision of the meaning of the defects by the employee. As a result of visual inspection of the quality of marking of defects by the operator, it is estimated that for each defect the employee adds on average about 50 mm. During 8 hours of work, the employee marks approximately 5760 defects (4 boards with 5 defects per minute). During the year, the loss may amount to 92160 m. Assuming the cost is 4 PLN/m, the sawmill owner loses up to 92160 m * 4 PLN/m = 368640 PLN in revenue per year due to the work of the incorrectly hatched operator. This example illustrates the problem for sawmill plants of large material losses resulting from the removal of defects in wood. Moreover, an employee marking several boards per minute constantly has to subjectively assess whether a given section should be cut or left whole. At the same time, a solid and reliable calculation (appropriate estimation) for each board is not possible due to the need to maintain production efficiency. During such an assessment of sawn timber, it is necessary not only to analyze the defects in the wood, but also where they occur. Wood defects may only appear on one side and may be of a certain size. The scope of the board’s qualifications is determined by the product specification. On the one hand, frequent human errors mean that pieces with defects enter the final product and eliminate the entire element as the final product, resulting in a loss of material and work. On the other hand, elements that qualify for class 1 are often included in the second class. This reduces the effectiveness of obtaining the best quality material and reduces the profit. Work efficiency in this process is approximately 12 m/min per employee. The second important problem is finding people to accurately mark the wood, who will be able to mark the wood in continuous motion for 8 hours a day. It is hard and tedious work. Due to the lack of suitably qualified people on the market, production efficiency decreases.
The subject of the project implemented by Woodinspector Ltd. from Poland was a compact line for optimization and cross-cutting of sawn timber and automatic sorting. The product is intended for wood processing companies. The basic lines include detection of defects in wood using vision techniques with an average accuracy of up to 10 mm, automatic determination of the type and size of the defect, automatic planning of sawn timber cutting and sorting according to scanning results. The lumber boards are then stacked in layers. This line consists of: - Input material scanning system (scanner), which is responsible for recognizing and classifying the type of defects using vision techniques; - Cutting optimization algorithms depending on the type of defect in order to eliminate selected process stages; - Module for parameterizing the scanner’s operation by the operator; - Sorting module and semi-automatic stacking of the output material; - Integral cutting module with sorting system and - A module for semi-automatic unstacking of the material for feeding to the cutting line. Thanks to the use of such component lines, it is possible to detect defects in wood with a diameter of accuracy of up to 10 mm, automatic determination of the type and size of the defect (e.g. healthy knot 25 mm), automatic planning of sawn timber cutting, sorting according to scanning results, stacking elements into layers to eliminate the cumbersome and non-ergonomic process of manually taking elements from the table and spreading them on pallets, facilitating the unstacking of the material, which will eliminate the cumbersome operation of taking sawn timber from the stack and feeding it to the conveyor.
An important element of the system is the scanning module, which includes a defect detection algorithm based on artificial neural networks. Blue stain is a defect that is difficult to detect based on the color of the wood, because it can be easily confused with wood defects or dirt. There are studies in the literature on the use of vision techniques for wood quality inspection [
1,
2,
3].
In 2005, Van den Bulcke et al. (2005) none proposed a technique for assessing blue stain using image analysis [
4]. The method of quantitative assessment of the presence of blue stain according to the EN 152 standard was found to be insufficient. A scale from 0 to 5 was used for visual assessment, where 0 means no blue stain and 5 means complete coverage of the cross-section with blue-staining fungi to a depth of 5 mm. Neural networks were used as generalizing classifiers to measure surface blue stain, as well as to analyze the distribution of fungal invasion inside the wood. However, even with additional data reduction and clustering techniques, it was difficult to obtain results comparable to subjective visual assessment. Nevertheless, it has been proven that image processing and 3D reconstruction seem to be valuable tools for assessing blue stain [
5,
6,
7].
In the article [
8] a modified wood testing methodology standardized according to the EN 152 standard is presented, intended to test the effectiveness of wood coatings. A method called the EN 152 reverse method was used for computer-aided grading of coated wood to assess discoloration of the coatings and analyze the blue-stained wood inside the samples. Three-dimensional (3D) reconstructions of the samples were obtained, which became a tool for an in-depth analysis of the presence of blue stain [
9,
10,
11]. Similar results were obtained by studies published in [
4] and [
12]. The usefulness of vision methods was confirmed and the development of modern computer-controlled planers with a scanning head that accelerates the process by controlling the presence of blue stain was predicted [
13,
14].
In 2005, a color image segmentation method using neural networks was also proposed for detecting wood surface defects [
15]. The proposed method is called FMMIS (Fuzzy Min-Max Neural Network for Image Segmentation). Automatic visual inspection (AVI) systems includes five processing steps: image acquisition, image enhancement, image segmentation, feature extraction and classification, and the recognized defects cover 10 defect categories: bird’s eye and freckle, pockets of bark and tar, fade, split, stain, blue stain, pith, dead knot, living knot and hole. The FMMIS algorithm was compared with the Seed Region Growing (SRG) algorithm of Adams and Bischof and it was proven that the former is very fast and more effective in detecting defects in the "bird’s eye" and "freckle" categories, “spot”, “blueing” and “split” (TP < 50%) [
1,
16,
17,
18,
19,
20,
21].
The product of the team of authors, including Woodinspector, is a compact line for optimization (cross cutting) of sawn timber. This line consists of: 1. Input material scanning system (scanner), which is responsible for recognizing and classifying the type of defects using vision techniques; 2. Cutting optimization algorithms depending on the type of defect in order to eliminate selected process stages; 3. Module for parameterizing the scanner operation by the operator; 4. Sorting module and semi-automatic stacking of the output material; 5. Integral cutting module with sorting system and 6. A module for semi-automatic unstacking of material for feeding to the cutting line. Thanks to the use of such component lines, it is possible to detect defects in wood with a diameter of accuracy of up to 10 mm, automatic determination of the type and size of the defect (e.g. healthy knot 25 mm), automatic planning of sawn timber cutting, sorting according to scanning results, stacking elements into layers to eliminate the cumbersome and non-ergonomic process of manually taking elements from the table and spreading them on pallets, facilitating the unstacking of the material, which will eliminate the cumbersome operation of taking sawn timber from the stack and feeding it to the conveyor. So far, human-operated optimizers were responsible for identifying and classifying the type of defect in sawmills with lower efficiency. Their task is to cut out defective parts, e.g. knots. As a result, a frieze and semi-finished products for further processing are created. Accuracy in cutting out defects involves cutting out the defect as sparingly as possible to obtain as much material as possible in a better class. This activity depends on the operator’s precision and his assessment of the material from 4 sides. As a result of an inspection of the quality of marking defects by the operator (waste bins were inspected in several sawmills in Poland - the result of the importance of defects by employees), it is estimated that the employee adds approximately 50 mm to each defect. An employee marking several boards per minute constantly has to subjectively assess whether a given section should be cut or left whole. A solid and reliable calculation for each board throughout the entire operator’s work is not possible due to the need to maintain production efficiency. During such an assessment of sawn timber, it is necessary not only to analyze the defects in the wood, but also their location (the customer may indicate in the specification that there is a possibility of knots, but only on one side and of a specific size). Thanks to the use of a material scanning system with cutting optimization algorithms using vision techniques in the lumber optimization line, it is possible to reduce the amount of waste and increase the amount of high-quality output material, eliminate unnecessary cutting out of defects, correct sorting of elements, optimize the cutting of resin around the knot and increase efficiency of the optimization process per number of people and improving the ergonomics of their work. Thanks to the use of simple hardware solutions (low cost of the machine) and high efficiency of defect detection using complex and specialized algorithms, Woodinspector Ltd. is able to achieve a high degree of automation of many processes with low device efficiency.
2. Materials and Methods
The vision system consists of four sets of laser line projectors and cameras exposing and recording four sides of a wooden board (lumber or laminated board). The optical sets are placed in a gate into which the boards are automatically inserted. The system view is shown in
Figure 1.
Figure 2 shows a view of the scanner gate (working space) and the guide rollers and belt feeders. The boards are fed automatically.
Methodology for building and improving defect detection systems.
Training the system involved collecting images of boards and classifying them. Manual classification of boards was carried out. Engineers’ experience shows that this task cannot be accomplished by other methods
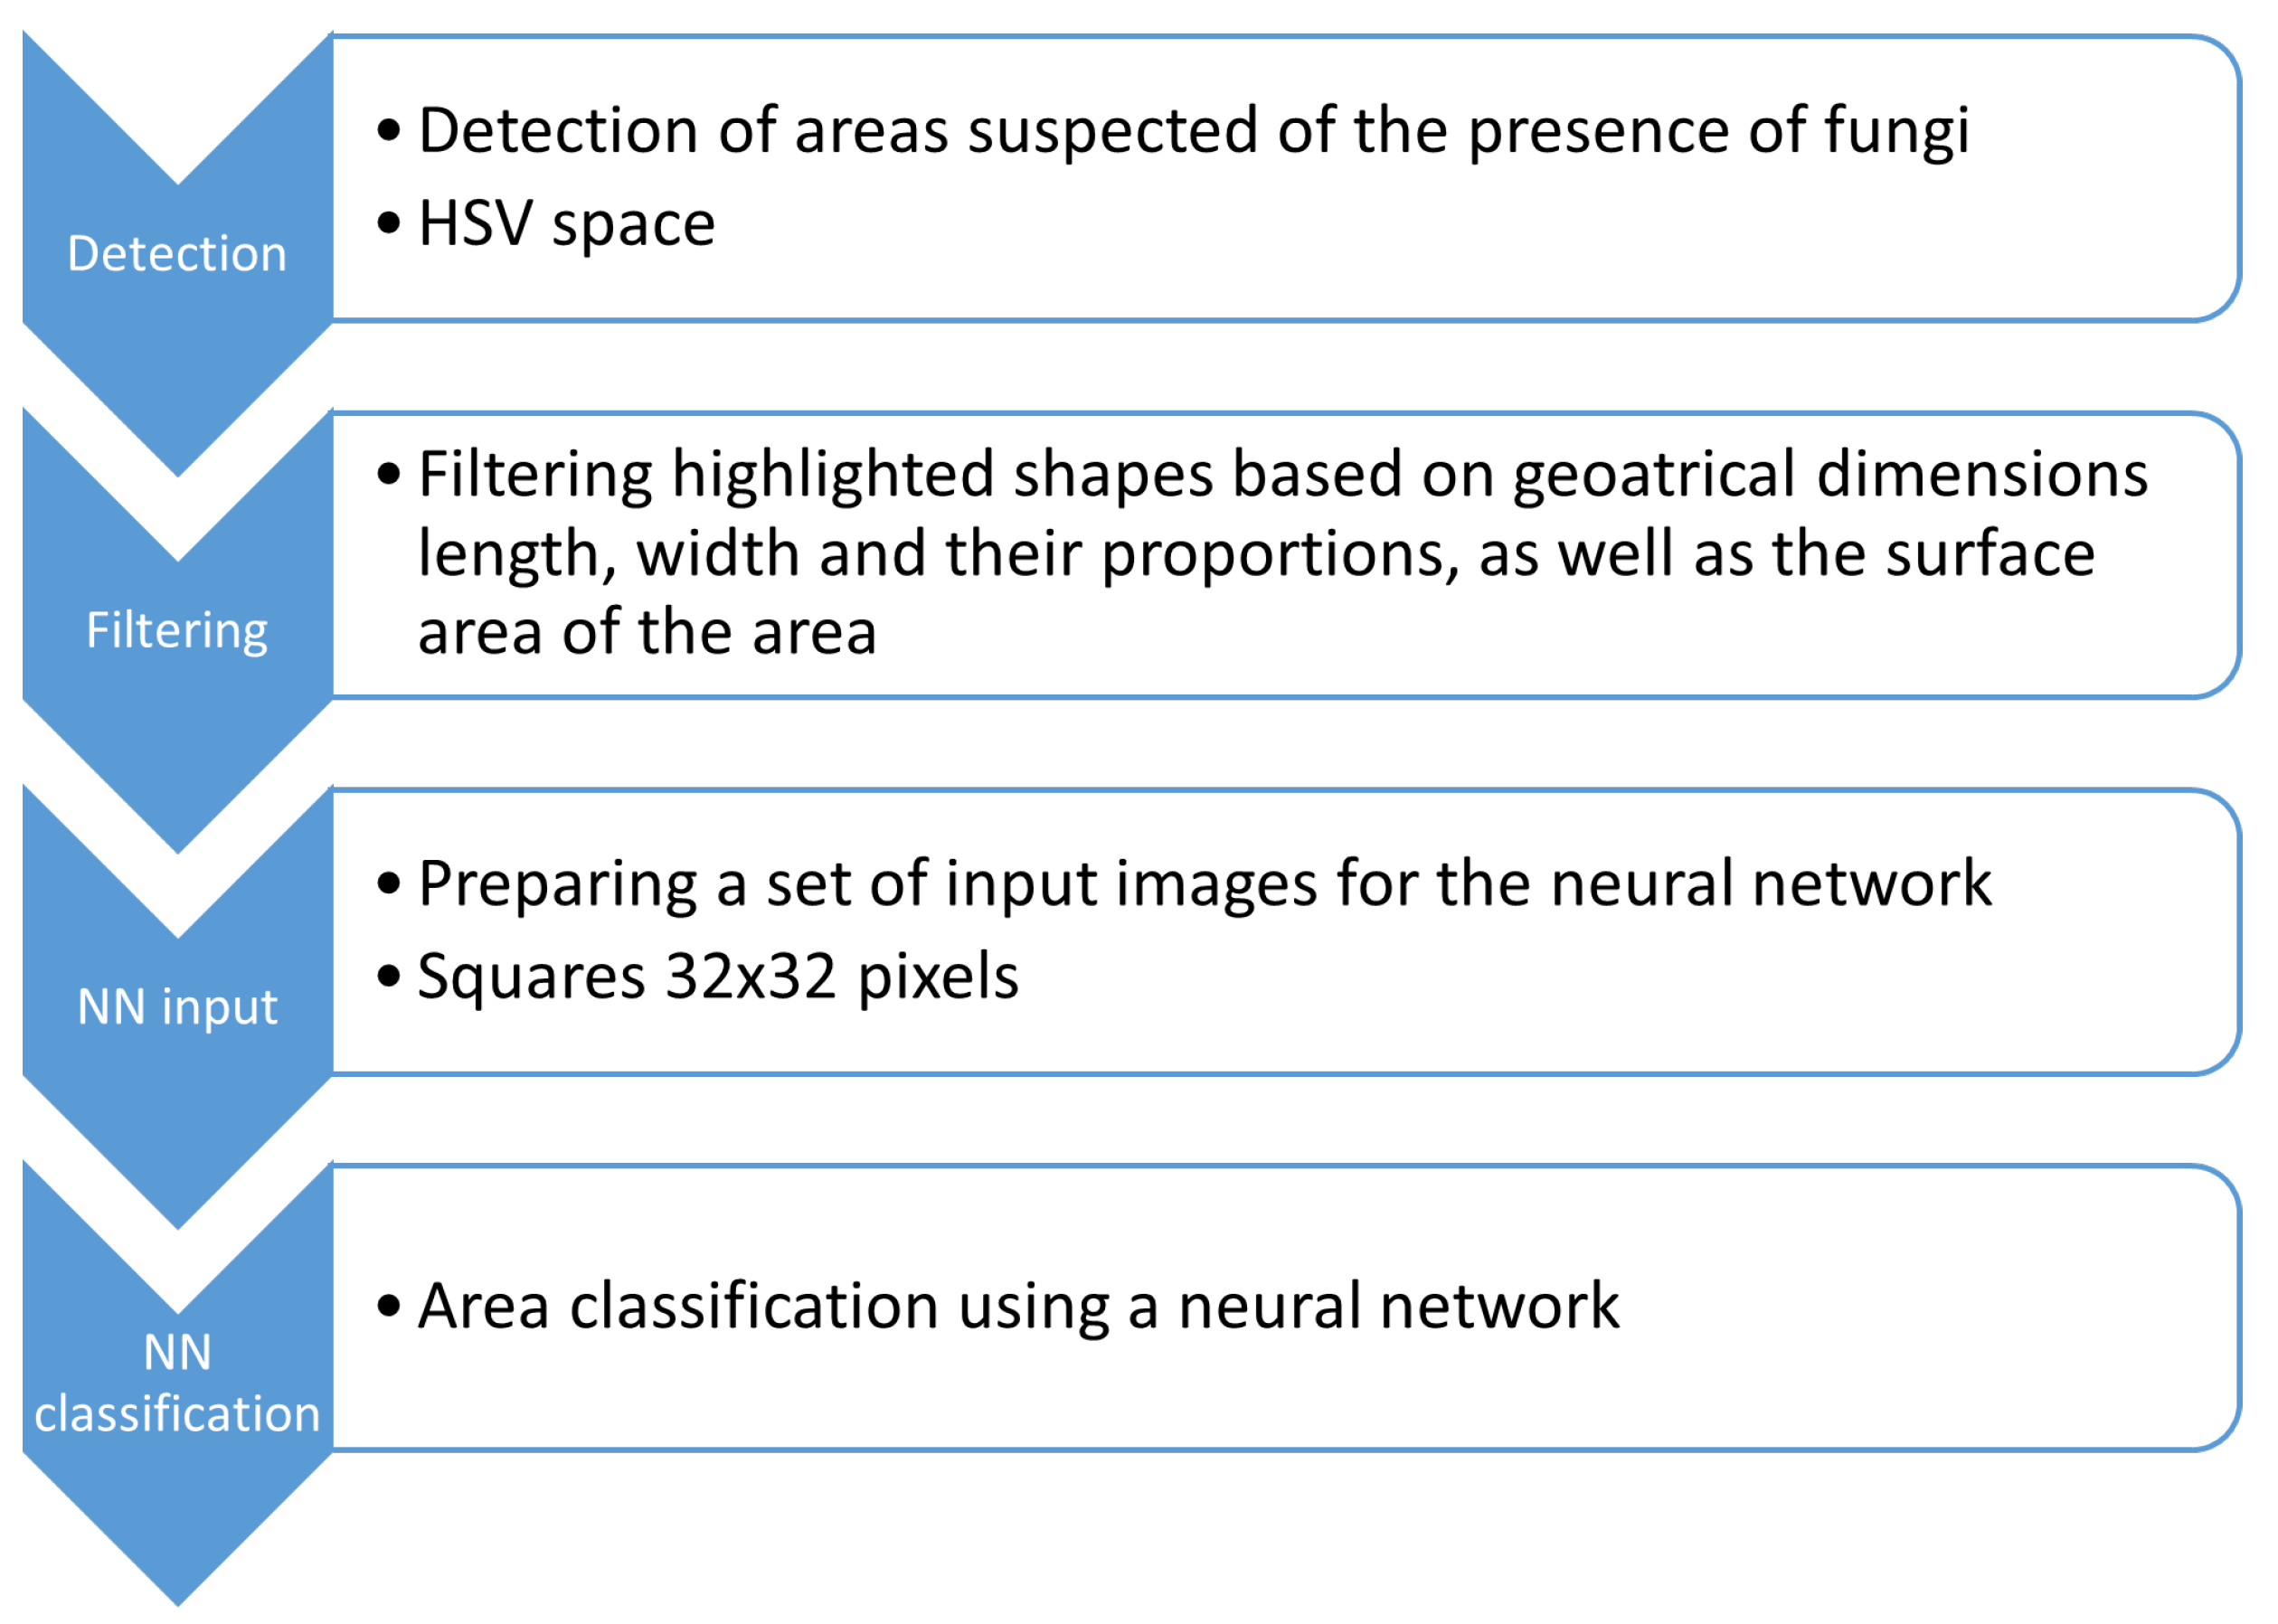
Operation of the inspection system The inspection algorithm includes the following image processing steps. The first stage is carried out on color images in HSV space. Based on the pixel values, areas that may contain blue stain are pre-selected. The second stage is the filtration of the highlighted areas based on their geometric properties such as length, width, their proportions and surface area. The third stage is preparing the set for the neural network. The input images are in the shape of a square with dimensions of 32 x 32 pixels. The images partially overlap. The fourth stage is classification using a neural network. The system operates a set of neural networks dedicated to detecting individual wood defects. The article discusses a neural network designed to detect blue stain; other defects are not cross-detected. The algorithm’s operation diagram is shown in the
Figure 3.
The fifth, equally important stage is training the neural network while the system is operating in production conditions. Training the system involves completing the training set. New images are collected as you work. When replenishing the training set, its original size is preserved. For this purpose, images are randomly removed from the existing set. Then the learning and testing procedure is started. When implemented, the system is adapted to the individual requirements of the customer. In this type of wood, type of wood surface, rough wood, smooth wood, any defects in their quality classification. The neural network connection procedure used in the system speeds up the process of training the network and enriching its knowledge with new cases.
Neural network improvement methodology The stages of university and network improvement are discussed below with examples.
Teaching networks to solve practical problems
Creation of initial defect detection algorithms After collecting wood samples and subjecting them to laboratory tests, programmers developed a number of classic vision algorithms. Each solution was developed thanks to exposures obtained by appropriate arrangement of the scanning head elements. Programmers first developed algorithms for detecting five defects that are crucial for glulam producers. Later, the system was developed to include cases of rough wood and other wood species. The exposure of defects in wood with a rough surface was more difficult than in the case of smooth wood (after planing).
HSV values of areas showing blue stain of the wood were recorded in the collected images of wood samples. This was not sufficient, so a classification of blue stain according to lightness was prepared. The classes prepared included: light, medium, dark and very dark. The minimum and maximum values of the H, S and V parameters were determined separately for these classes. The next step was to optimize these ranges. Distinguished HSV ranges allow for preliminary detection of areas where blue stain may be present.
3. Results
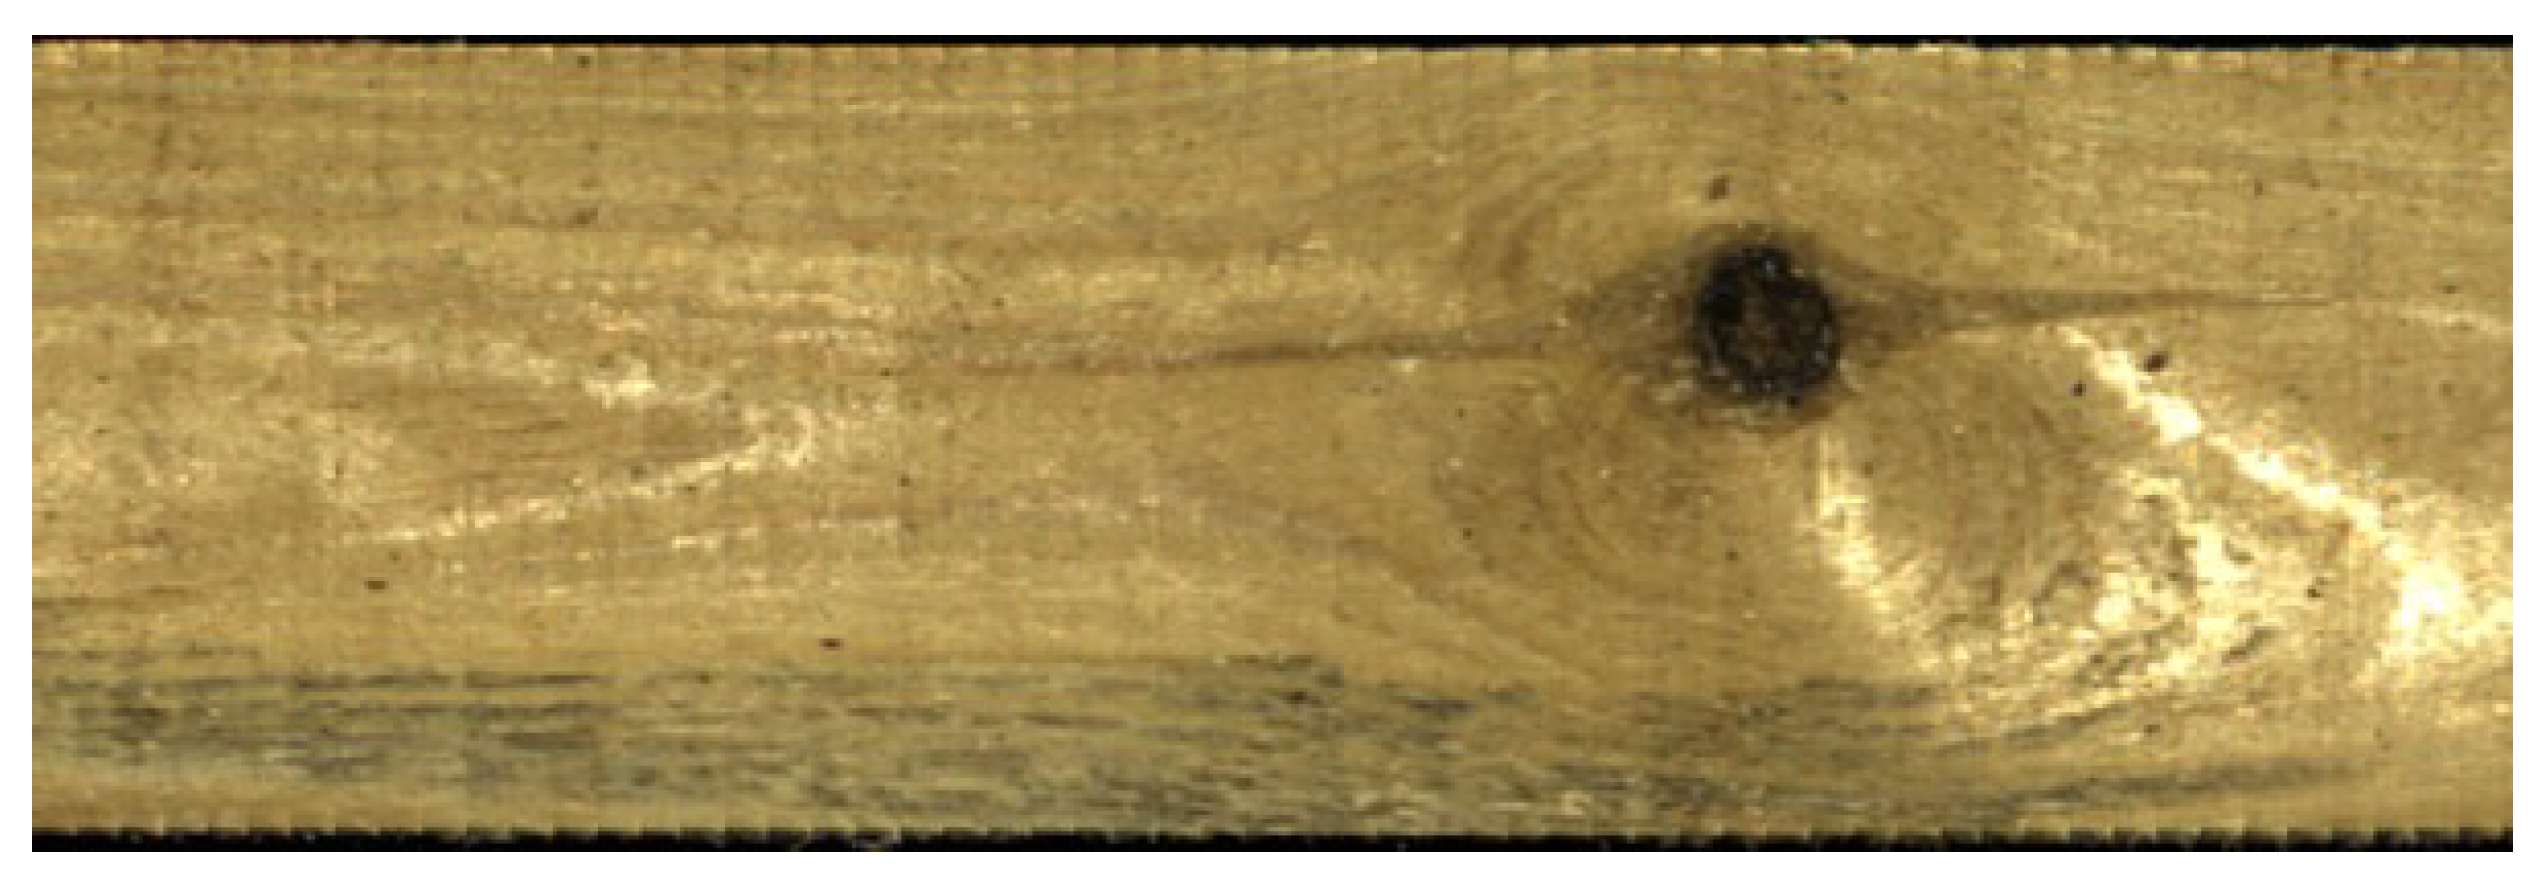
Example 1 – dirt and knot Below is an example of using the HSV space classifier to highlight contours when analyzing an area showing dirt. Additionally, a knot is visible in the image. These two areas should not be classified as blue stain.
Figure 4.
The image of the board is dirty and has a knot. Rough surface.
Figure 4.
The image of the board is dirty and has a knot. Rough surface.
Dirt and blue stain have the same color. When extracting it with the HSV space classifier, suspicious areas are highlighted with a black outline.
Figure 5.
The surface of the board with areas highlighted using the HSV classifier.
Figure 5.
The surface of the board with areas highlighted using the HSV classifier.
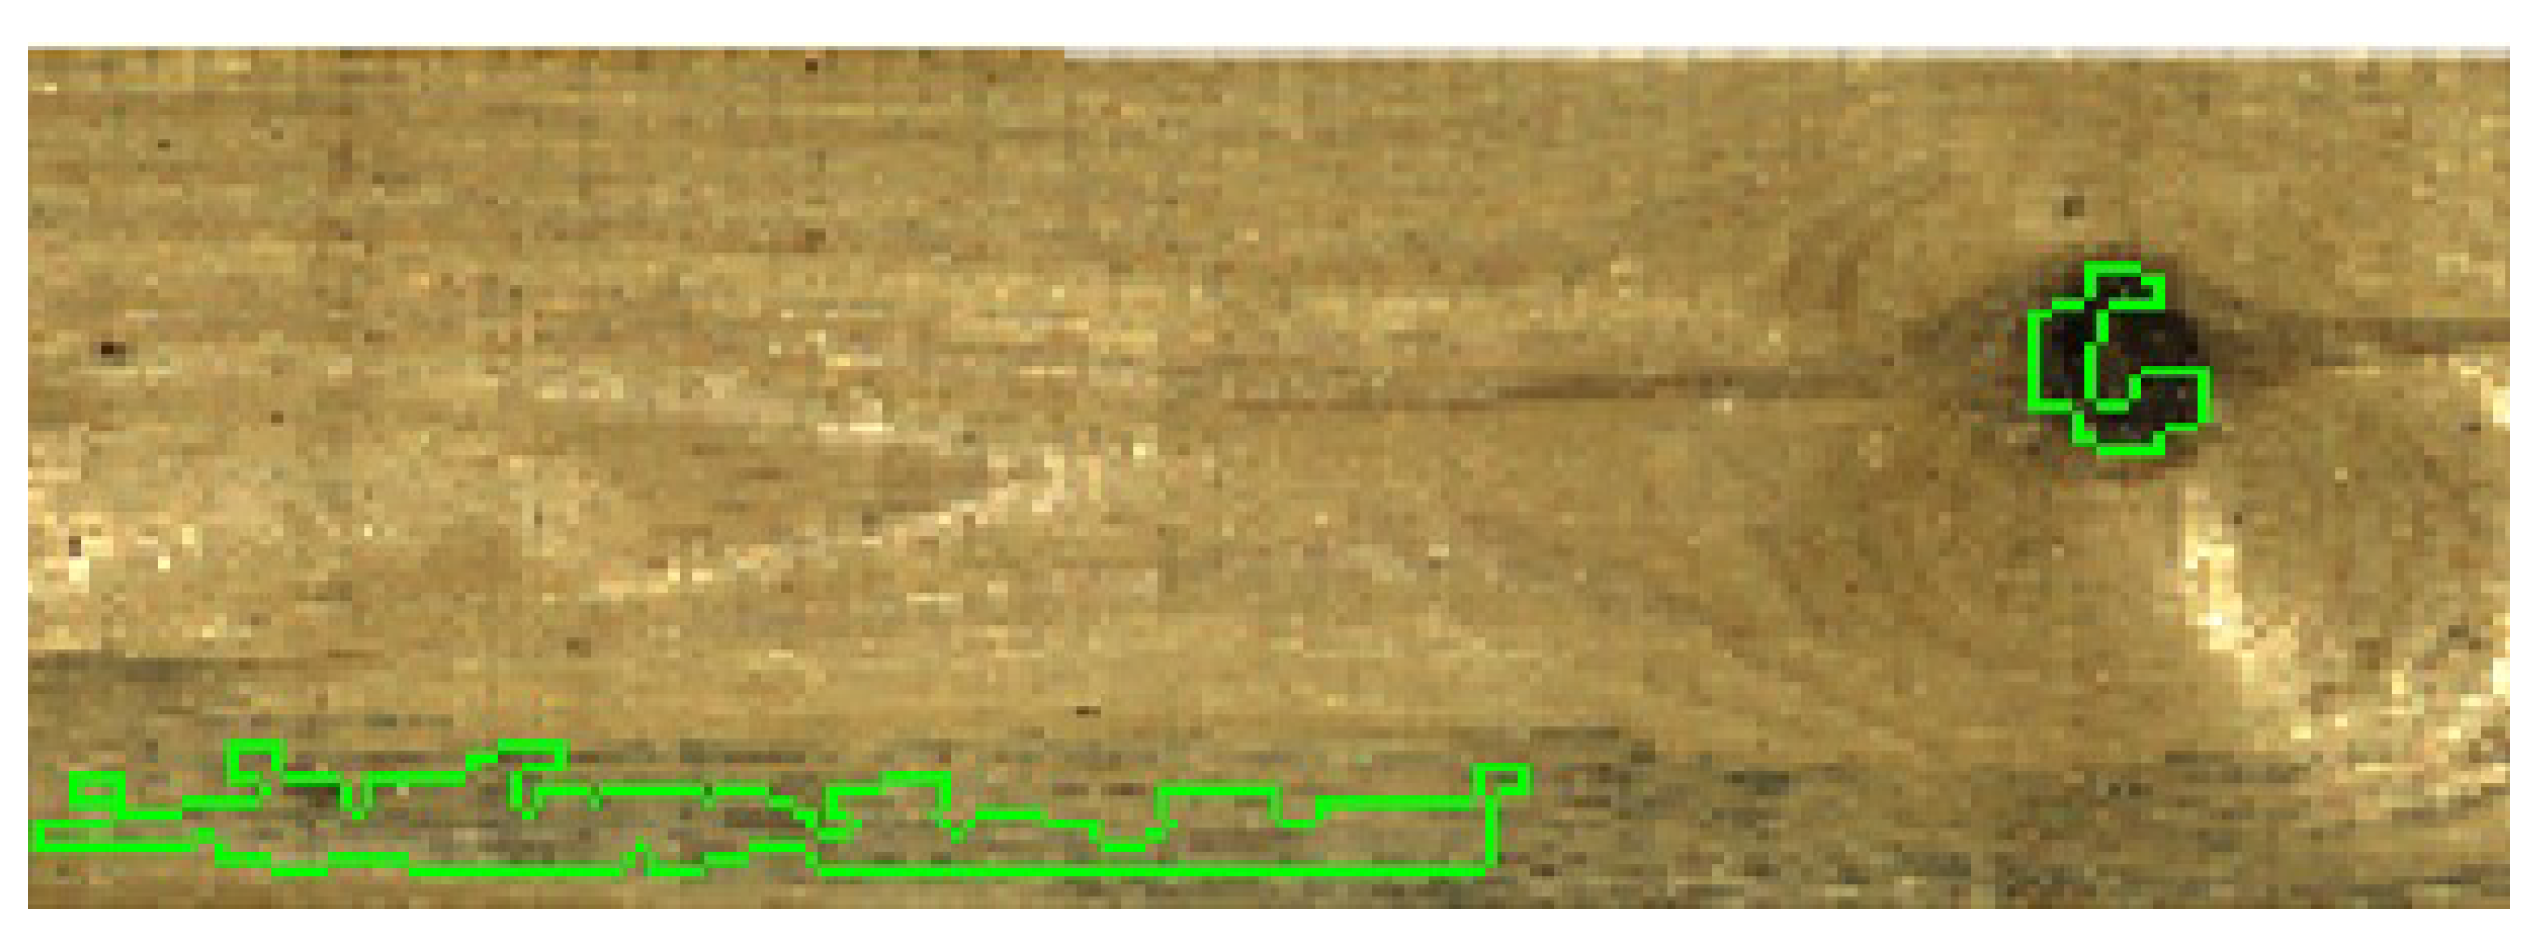
The next step is to filter the highlighted areas based on their geometric properties. The result is a representation of the area suspected of containing blue stain fungi. An example of an outline is shown in the figure below.
Figure 6.
The image of a board with highlighted areas (green outlines) suspected of containing blue stain fungi. The result after filtering the areas highlighted using the HSV classifier.
Figure 6.
The image of a board with highlighted areas (green outlines) suspected of containing blue stain fungi. The result after filtering the areas highlighted using the HSV classifier.
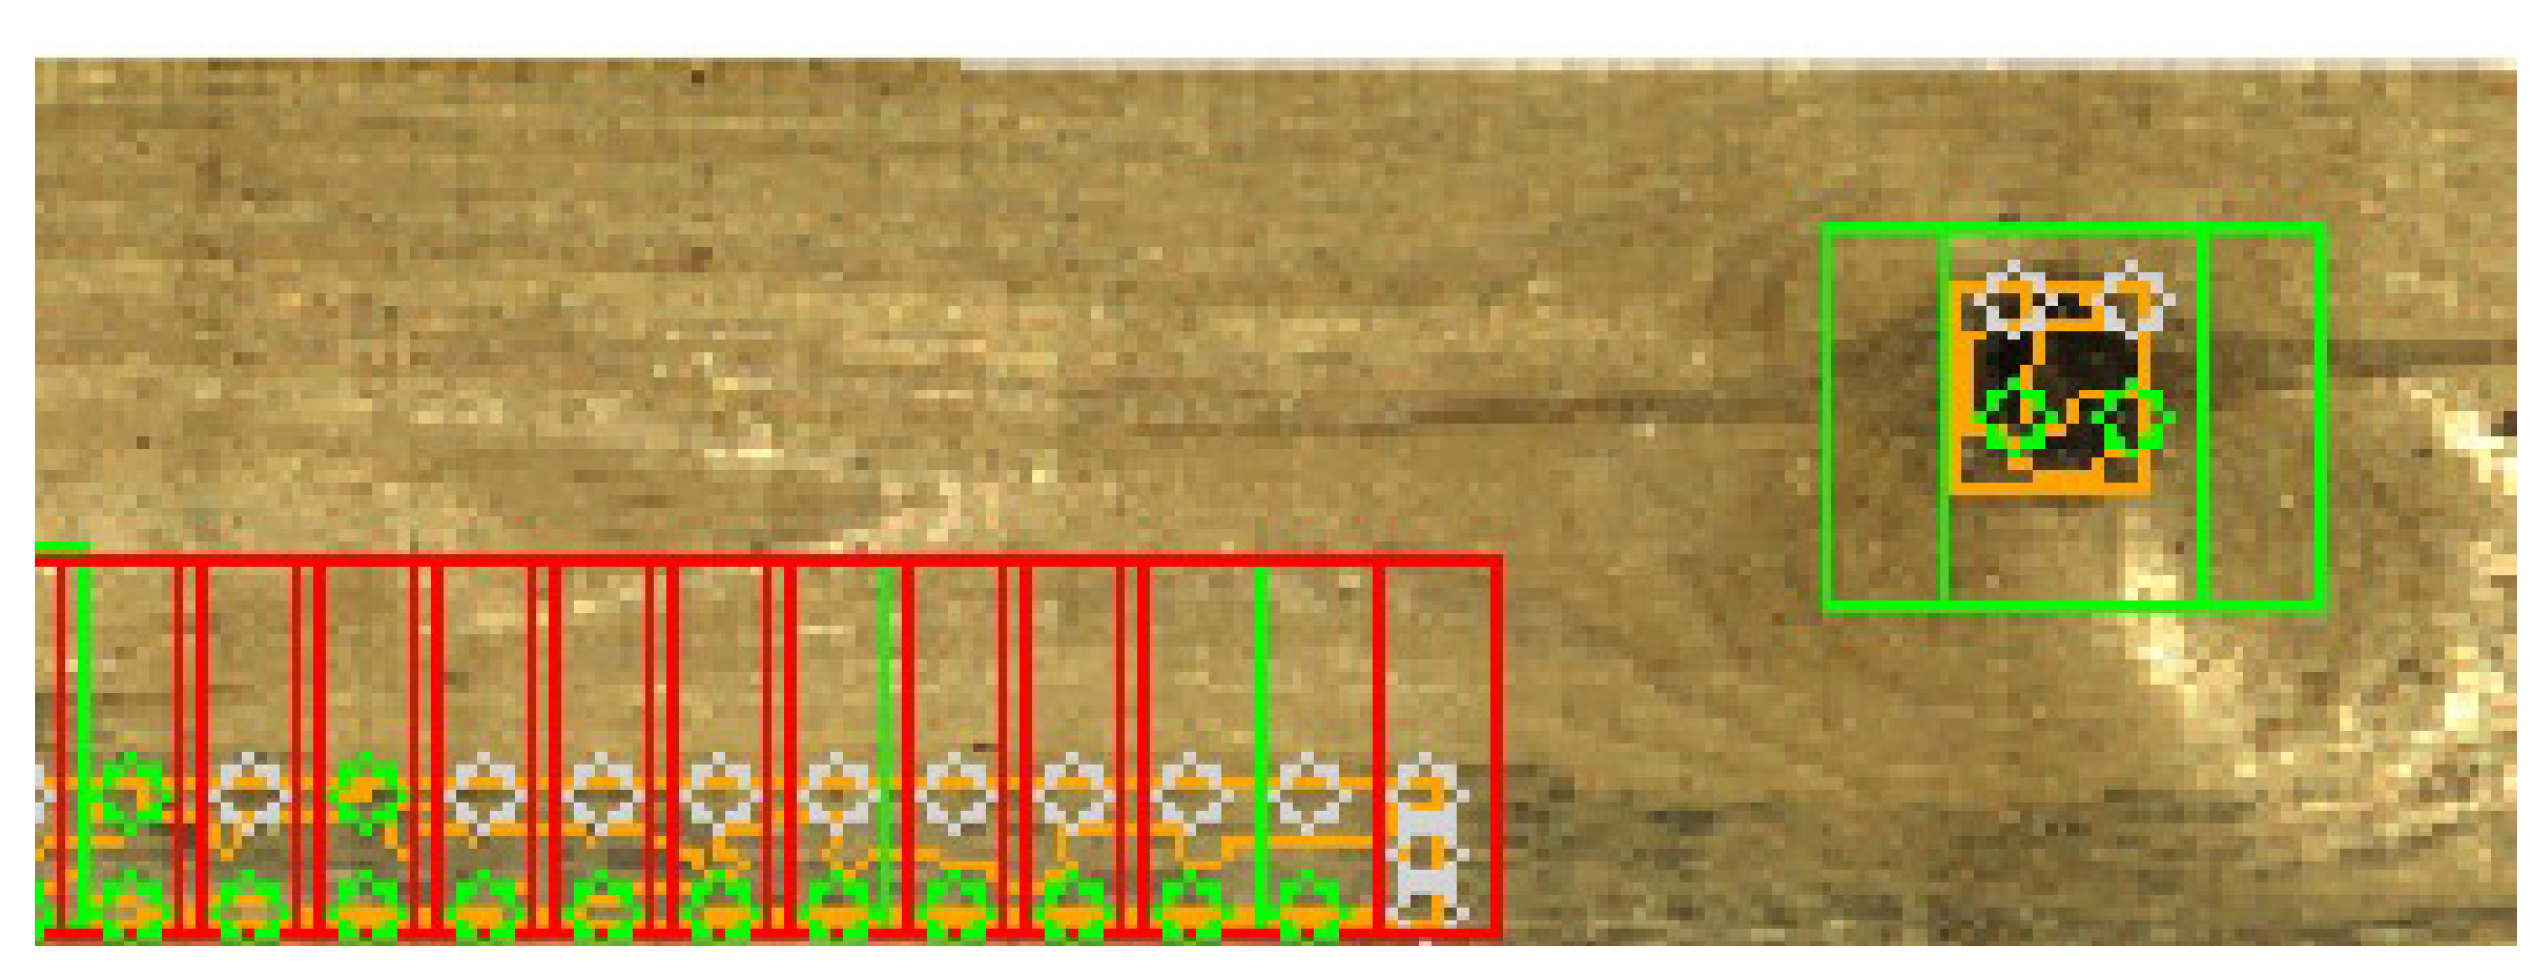
The next stage is the division of the highlighted areas into squares which will constitute the input vector of the neural network. When designing the system, squares of different dimensions and with different densities (overlapping of adjacent squares) were tested.
In this case, green squares mean that the detected object is not blue stain.
Figure 7.
The image of a board showing dirt and a knot marked with squares was classified using a dedicated neural network. The green color of the squares means that no blue stain defect has been recognized.
Figure 7.
The image of a board showing dirt and a knot marked with squares was classified using a dedicated neural network. The green color of the squares means that no blue stain defect has been recognized.
Below are squares arranged at larger intervals (test phase).
Figure 8.
The image from the previous figure, when testing the neural network with input images (squares) spaced at larger intervals.
Figure 8.
The image from the previous figure, when testing the neural network with input images (squares) spaced at larger intervals.
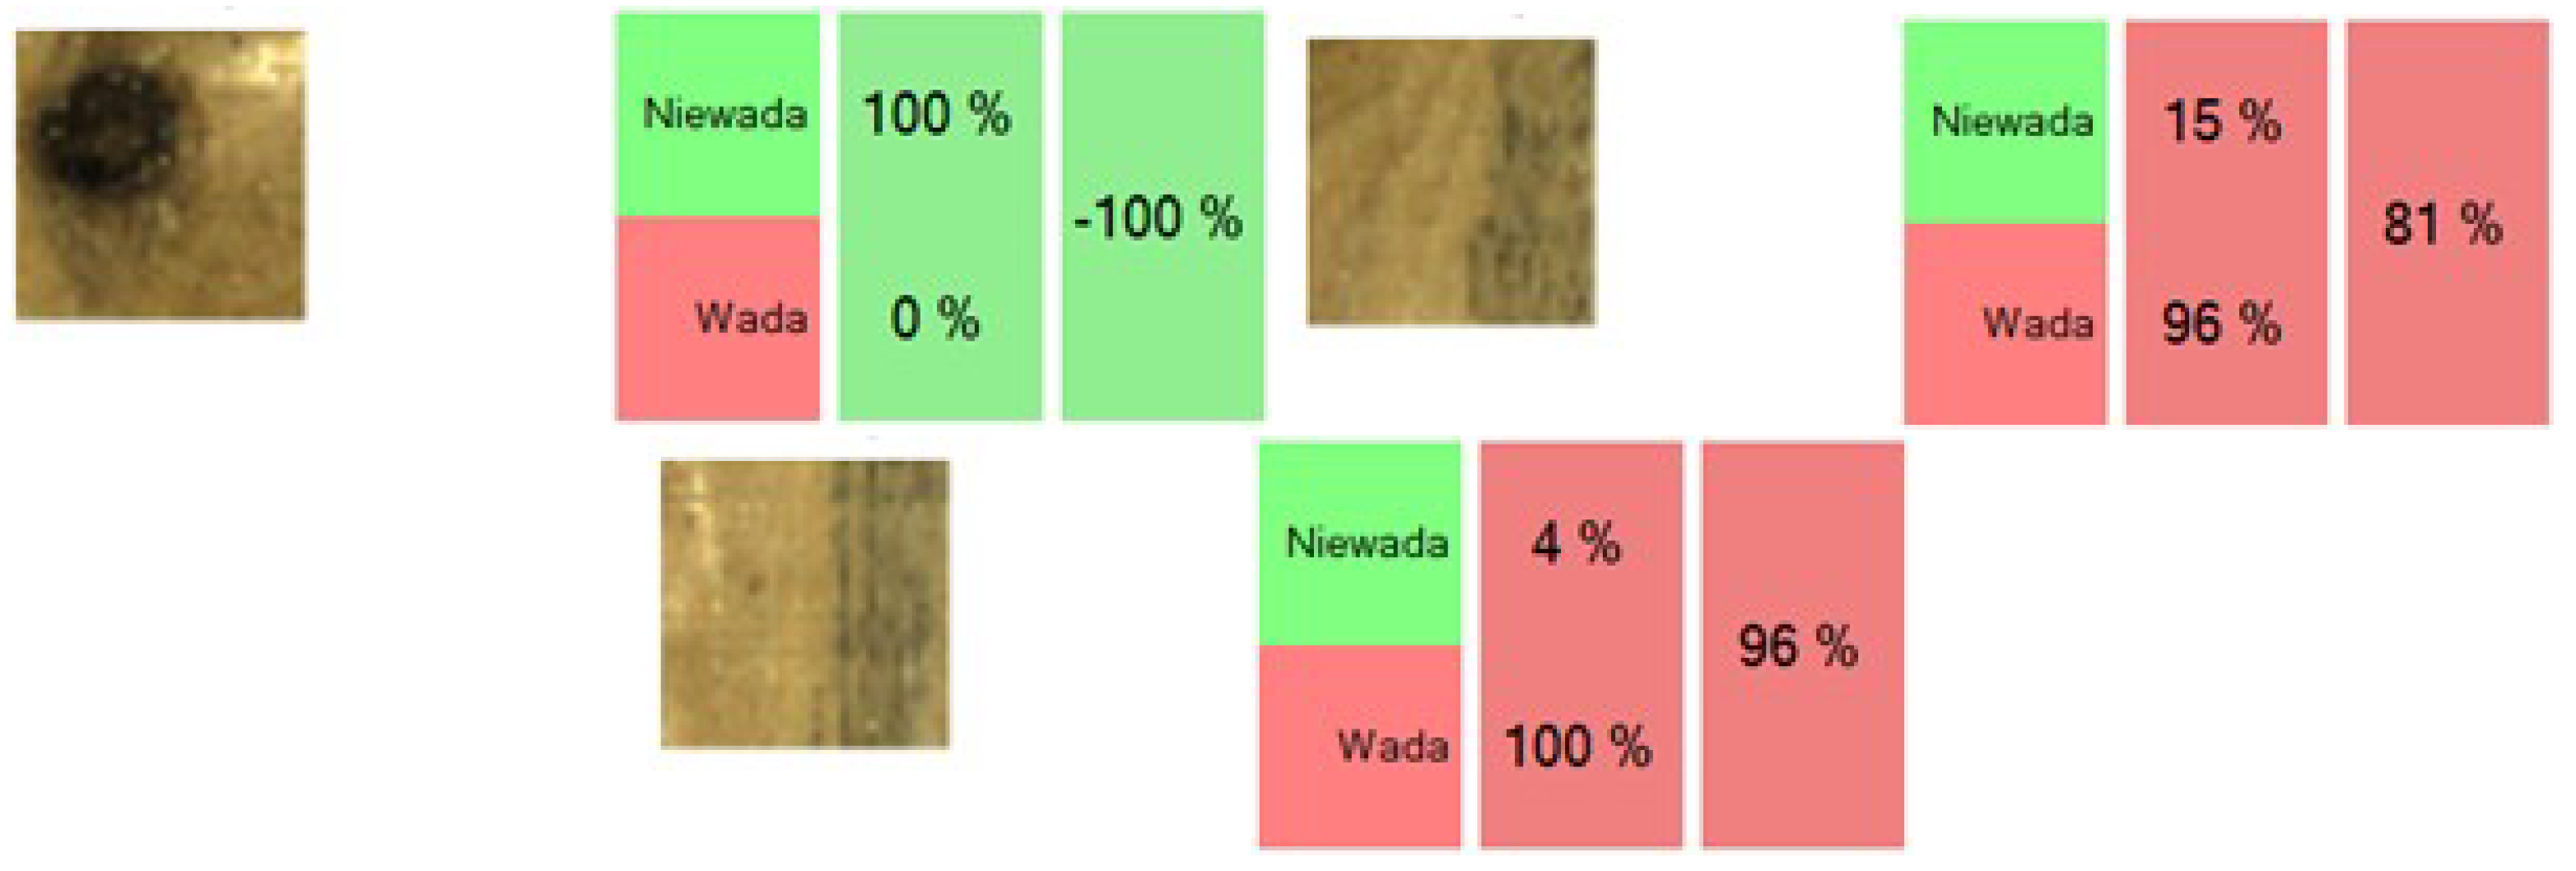
The results of the classification of exemplary fragments of highlighted areas (squares) using a dedicated neural network are presented below. A green field indicates another defect. A red field indicates a blue stain type defect. Then the difference between the determined probabilities is calculated. A minus value not exceeding a certain threshold, for example 70 percent, means no defect.
Figure 9.
Neural network responses for input images showing dirt (left) and a knot (right). The labels "wada" and "niewada" mean "fault" and "no fault", respectively.
Figure 9.
Neural network responses for input images showing dirt (left) and a knot (right). The labels "wada" and "niewada" mean "fault" and "no fault", respectively.
Example 2 – blue stain and knots The image below shows an example of a wood surface with a visible defect in the form of blue stain and a knot.
Figure 10.
The image of a wood surface with a visible defect in the form of blue stain and a knot.
Figure 10.
The image of a wood surface with a visible defect in the form of blue stain and a knot.
The HSV classifier initially distinguishes areas suspected of having blue stain. Highlighted areas are marked with a black outline.
Figure 11.
Areas highlighted using the HSV classifier.
Figure 11.
Areas highlighted using the HSV classifier.
Then, these areas were subjected to geometric filtration, and the result is shown in the figure below.
Figure 12.
An image of a plank with the outlines of defects marked.
Figure 12.
An image of a plank with the outlines of defects marked.
The identified defects are then classified using a neural network. The result of detecting a blue type defect is marked with a red square. Results recognized as another defect in green. The blue stain neural classifier does not recognize other defects. They are classified by other neural networks.
Figure 13.
The result of the distribution of wood defects, the color of red means the detection of blue stain.
Figure 13.
The result of the distribution of wood defects, the color of red means the detection of blue stain.
The classification results of sample input images are shown below.
Figure 14.
Examples of classification of input images a) a knot recognized as not a defect, b-c) cases diagnosed as blue stain.
Figure 14.
Examples of classification of input images a) a knot recognized as not a defect, b-c) cases diagnosed as blue stain.
Figure 15 shows an image of the defect classification results on the operator panel. The green rectangles are the blue stain found. These are areas defined by combining small squares (input images of the neural network). Black cutting lines indicate planned cuts of the board to eliminate defects. The photo shows one side of the board. However, the planned cutting lines take into account the examination carried out on all four sides of the board.
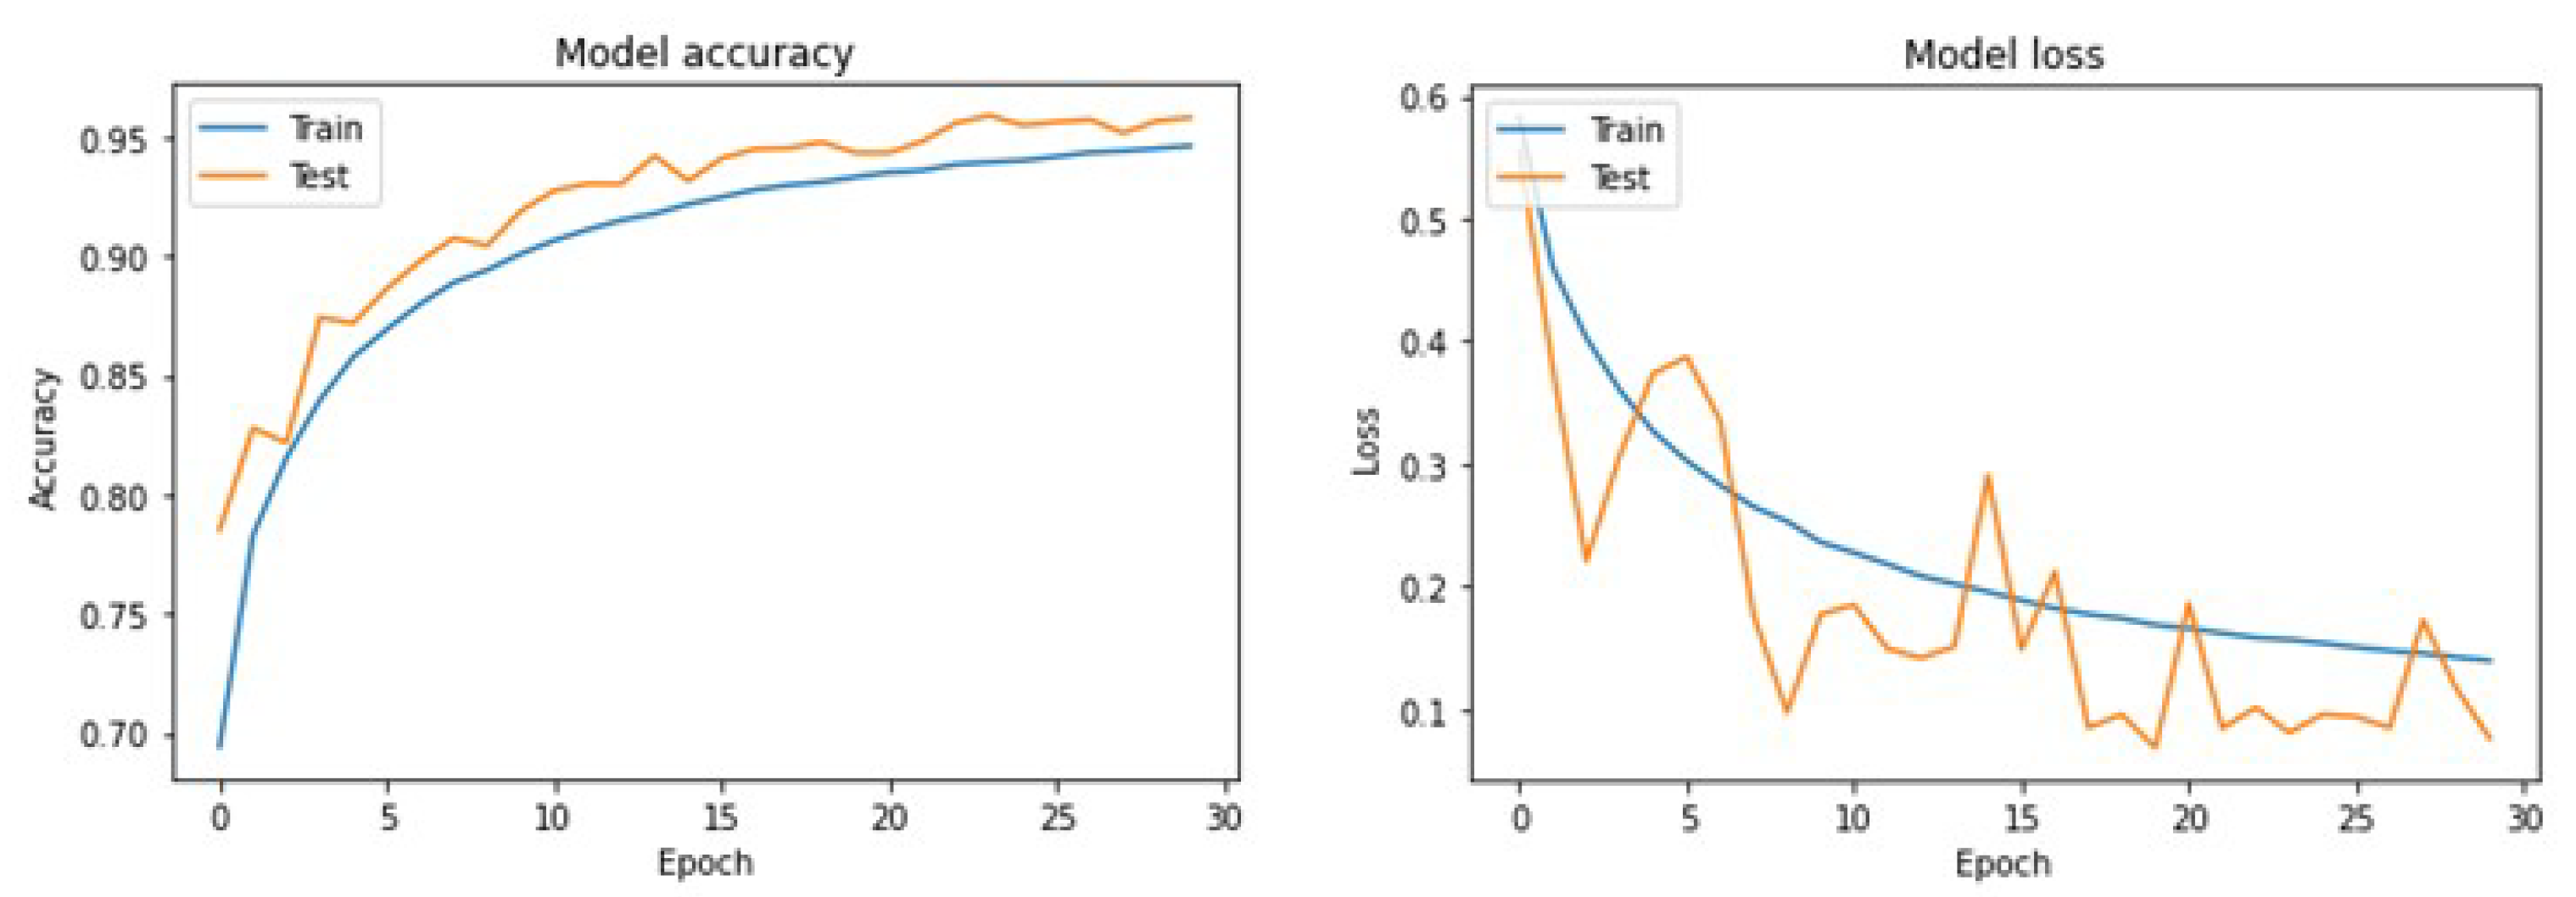
In the case of implementing the system in a line processing a new type of wood, if samples were collected that were not correctly recognized by the system, the system was trained. Training involves replacing parts of the existing training set with new cases. Examples of neural network training and validation curves are shown below.
Figure 16.
Plot training and validation loss values.
Figure 16.
Plot training and validation loss values.
4. Conclusions
So far, human-operated optimizers were responsible for identifying and classifying the type of defect in sawmills with lower efficiency. Their task is to cut out defective parts, e.g. knots. As a result, a frieze and semi-finished products for further processing are created. Accuracy in cutting out defects involves cutting out the defect as sparingly as possible to obtain as much material as possible in a better class. The Q-Scan system by Woodinspector is a pine sawn timber scanner that detects defects, classifies them and optimizes the cutting of sawn timber in terms of the user-defined product 1. The scanner is based on digital image analysis technology, which allows detecting the most common defects in wood with high and repeatable accuracy throughout the entire working time 1. The scanner uses industrial cameras, LED illuminators, line lasers and a high-performance PC computer 1. Optimization algorithms take into account the location of defects and their permissible size depending on the product 1. Elements produced for micro-joining are optimized in three quality classes: 1 class – no defects, 2nd class – resin, blue stain, small knots, 3rd class – fused knots 1.
The components of the developed line are: an input material scanning system (scanner) for recognizing and classifying the type of defects using vision techniques, cutting optimization algorithms depending on the type of defect in order to eliminate selected process stages, a work parameterization module and a cutting module, integral with the sorting system . The main functionalities of the device are: detection of defects in wood with an average accuracy of up to 10 mm, automatic determination of the type and size of the defect (e.g. healthy knot 25 mm), automatic planning of sawn timber cutting, sorting according to scanning results. The scanner’s efficiency in detecting defects is up to 60 m/min. There are devices on the market with a capacity above 300 m/min, which are expensive. Timber production is dispersed on the Polish and foreign markets. The largest group of sawn timber producers are small and medium-sized companies. The line is tailored to their needs.
Woodinspector offers many tools for detecting blue stain in sawmill wood, including Q-Scan 12. Q-Scan is a pine lumber scanner that detects defects, classifies them and optimizes the cutting of sawn timber in terms of the user-defined product. Digital image analysis technology allows for detection the most popular defects in wood with high and repeatable accuracy throughout the entire working time. Optimization algorithms take into account the location of defects and their permissible size depending on the product. Elements produced for micro-jointing are optimized in three quality classes: class 1 - without defects, class 2 - resin, blue stain, small knots, class 3 - fused knots 1. Individual defects are detected using dedicated neural networks. The article presents an approach to detecting blue stain in wood. The neural network allowed us to distinguish blue stain from other defects, including wood staining, which does not impair the strength properties of the wood. The implementation of the Woodinspector system in the company allows for faster and more effective detection of blue stain in sawmill wood, which can help prevent the spread of the disease and increase the sawmill’s production efficiency.
Author Contributions
Conceptualization, P.W. and G.K.; methodology, A.M.; software, G.K.; validation, G.K. and G.L..; writing—original draft preparation, P.W, G. K.; writing—review and editing, G.L. and A. P.
Funding
This research was funded by The National Centre for Research and Development, Poland, agreement number: POIR.01.01.01-00-0923/18-01
Institutional Review Board Statement
Not applicable
Informed Consent Statement
Not applicable
Data Availability Statement
Zenodo link
Conflicts of Interest
The authors declare no conflicts of interest. The funders had no role in the design of the study; in the collection, analyses, or interpretation of data; in the writing of the manuscript; or in the decision to publish the results.
References
- Nitka, A., Sioma, A. Design of an automated rice grain sorting system using a vision system. In Photonics Applications in Astronomy, Communications, Industry, and High-Energy Physics Experiments, Wilga, Poland, 2018.
- Parkot, K., Sioma, A. Development of an automated quality control system of confectionery using a vision system, In Photonics applications in astronomy, communications, industry, and high-energy physics experiments, Wilga, Poland, 2018.
- Lenty, B., Kwiek, P., Sioma, A. Quality control automation of electric cables using machine vision. In Photonics applications in astronomy, communications, industry, and high-energy physics experiments, Wilga, Poland, 2018.
- Van den Bulcke, J., Van Acker J. and Stevens M. Image processing as a tool for assessment and analysis of blue stain discoloration of coated wood. International Biodeterioration & Biodegradation 2005, 56, 178-–187.
- Sioma, A. 3D imaging methods in quality inspection systems. In Photonics applications in astronomy, communications, industry, and high-energy physics experiments, Wilga, Poland, 2019.
- Sioma, A. The estimation of resolution in 3D range image system. In Proceedings of the 14th International Carpathian Control Conference (ICCC), Rytro, Poland, 2013.
- Sioma, A., Karwat, B. The use of 3D imaging in surface flatness control operations. Advances in Science and Technology Research Journal, 17,6, 2023, pp. 335–-344.
- Van den Bulcke, J., Van Acker J. and Stevens M. Assessment of blue-stain resistance according to the EN 152 and a reverse test method using visual and computer-aided techniques. International Biodeterioration & Biodegradation 57, 2006, 229–-238.
- Cinal, M., Sioma, A., Lenty, B. The quality control system of planks using machine vision. Applied Sciences (Basel), 13,16, 2023, pp. 1-–17.
- Sioma, A., Lenty, B. Detection of fungal infections on the wood surface using LTM imaging. Applied Sciences (Basel), 13,490, 2023, pp. 1–-13.
- Schubert, M., Mourad, S., Schwarze, F.W.M.R. Automated image processing for quantification of blue-stain discolouration of Norway spruce wood. Wood Sci Technol, 45, 2011, pp.331–-337.
- Van den Bulcke, J., Van Acker J. and Stevens M. Laboratory testing and computer simulation of blue stain growth on and in wood coatings. International Biodeterioration & Biodegradation, 59, 2007, 137–-147.
- Burud, I., Gobakken, L.R., Flø, A., Kvaal, K., Thiis, T.K. Hyperspectral imaging of blue stain fungi on coated and uncoated wooden surfaces. International Biodeterioration & Biodegradation, 88, 2014, 37e43.
- Hu, J., Song, W., Zhang, W., Zhao, Y., Yilmaz, A. Deep learning for use in lumber classification tasks. Wood Science and Technology, 53, 2019, pp. 505–517.
- Estévez, G.A.; Ruzz, P.A. Image segmentation using fuzzy min-max neural networks for wood defect detection, In Intelligent Production Machines and Systems, Elsevier Ltd., 2005.
- Pham, R.J.; Alcock, D.T. Smart Inspection Systems, London: Academic Press, 2003, pp. 218.
- Ruz, G.A., Estévez P.A., Perez, C.A. A neurofuzzy color image segmentation method for wood surface defect detection. Forest Prod. J. 4,55, 2005, pp. 52–58.
- Estévez, P.A., Flores, R.J., Perez, C.A. Color image segmentation using fuzzy min-max neural networks, In Proceedings of the International Joint Conference on Neural Networks, Montreal, Canada, 2005.
- He, K., Zhang, X., Ren, S., Sun, J. Deep residual learning for image recognition. In: Proceedings of the IEEE Computer Society Conference on Computer Vision and Pattern Recognition. IEEE Computer Society, 2015, pp. 770–778.
- He, T., Liu, Y., Xu, C., Zhou, X., Hu, Z., Fan, J. A fully convolutional neural network for wood defect location and identification. IEEE Access, 7, 2019, pp. 123453–123462.
- He, T., Liu, Y., Yu, Y., Zhao, Q., Hu, Z. Application of deep convolutional neural network on feature extraction and detection of wood defects. Measurement, 152, 2020, 107357.
|
Disclaimer/Publisher’s Note: The statements, opinions and data contained in all publications are solely those of the individual author(s) and contributor(s) and not of MDPI and/or the editor(s). MDPI and/or the editor(s) disclaim responsibility for any injury to people or property resulting from any ideas, methods, instructions or products referred to in the content. |
© 2024 by the authors. Licensee MDPI, Basel, Switzerland. This article is an open access article distributed under the terms and conditions of the Creative Commons Attribution (CC BY) license (http://creativecommons.org/licenses/by/4.0/).


