1. Introduction
In an announcement by the Secretary General of the United Nations, António Guterres in July 2023: “The era of global warming has ended. The era of global boiling has arrived” [
1].
2023 was the hottest year ever recorded in history, CO2 levels are 50% higher than in the pre-industrial era (considered the period from 1850 to 1900), the rate of sea level rise between 2013 and 2022 is more than double the rate of the first decade of the satellite record (1993-2002), we witness more and more intense forest fires, droughts, floods, extreme weather episodes, in general. Biodiversity is jeopardized, people became climate refugees across the globe, severe socioeconomic impacts are imposed [
2].
Despite being indicative of a global effort to mitigate global warming, global agreements failed to achieve their main goals related to the climate crisis.
Data collected until October 2023 shows that this year will end 1.4°C, with a margin of error of ± 0.12°C, above the global average temperature of the pre-industrial era (1855 to 1900) taken as reference, as presented by the world meteorological organization [
3].
The intergovernmental panel on climate change, IPCC, in its summary report on climate change, in addition to presenting data related to emissions, temperature and climate, reaffirms human responsibility for the increase in greenhouse gases emission, describes other damages related to climate change as effects on the biome, putting species at risk of extinction and effects on agriculture, increasing pressure on food security. It also states that the regions that contributed least to the increase in greenhouse gas emissions and benefited least from the progress generated are the regions that suffer most from the consequences of the extreme climate events that ravage the planet [
4].
Not only we failed in complying with the agreements to reduce greenhouse gas emissions, we did the opposite, accelerating the increase in emissions to such an extent that, even if we quit all emissions now, the climate crisis has already set in and will enhance the damage. Given such scenario, even if it is possible to reduce emissions, it is necessary to remove greenhouse gases from the atmosphere, developing carbon capture and storage technologies (CCS) [
5,
6].
The fossil fuels – coal, gas and oil – play the main role in global climate change, responsible for more than 75% of greenhouse gas emissions and approximately 90% if we only evaluate total CO2 emissions. The CCS concept has been technically developed in this sector since 1996. In 2020, 39 Mt of CO2 per year was removed from the atmosphere by CCS technologies, less than 0.1% of the total ~45 Gt of CO2 emitted that year [
4,
7,
8].
Carbon capture and storage technologies have the potential to meet sustainable development goals (SDGs) 9th and 13th, which are, respectively, “Industry, innovation and infrastructure” and “Take urgent action to combat climate change and its impacts” among the 17 SDGs listed by the United Nations in 2015 in its action plan proposal called “Agenda 2030” which launched goals related to combating the climate crisis [
8].
In this work, we prospected key microorganisms with the potential to counter climate change, which consume CO2 from the atmosphere without the presence of light, they are the chemoautotrophic microorganisms [
9], to constitute a platform to develop carbon capture and storage technologies. Chemoautotrophic organisms are more likely to be found in environments with low availability of organic carbon, as prospected here in seabed samples collected surrounding the Brainsfield Strait of the Antarctic continent [
10,
11,
12], we selected the chemoautotrophs by incubation in a medium without the presence of organic carbon (artificial seawater – ASW) and without the presence of light, after isolating strains of interest, we subjected the microorganisms to incubation in the same liquid medium but under more extreme conditions, under 100 bar of pressure and supercritical state carbon dioxide (scCO2) without the presence of light – conditions similar to those found in oil deposits, where this technology is intended to be developed.
We succeeded in finding a microorganism that remained viable under given conditions and observed that its colonies presented a polymeric structure after being recovered from reactors under high pressure. The structure was subjected to Raman spectroscopy to identify candidate molecules.
2. Materials and Methods
2.1. Sampling
44 marine sediment samples were received from three sampling points from the marine area of Bransfield Strait, Antarctica, collected on the Antarctic expeditions OPERANTAR XXXIV and OPERANTAR XXXV during the summers of 2015 and 2016, respectively [
13], as shown in
Table 1.
Each set of samples was sliced horizontally into 17 sub samples for point GC06A, 22 sub samples for point GC12, and 5 sub samples for point AM10 and lyophilized prior to shipping. The samples were then stored at – 20ºC prior to processing.
2.2. Activation
An aliquot of each sample was taken into a sterile microtube, recovering approximately volume of 200 µl, weighing each sample.
The samples were suspended in 30 ml of “artificial sea water” medium (ASW) devoid of any organic or inorganic carbon source and incubated under atmosphere of 20% CO2, at 36ºC, without agitation, without light for 15 days.
After 15 days, the samples were centrifuged at 8 krpm for 5 min, supernatant discarded, the precipitate was resuspended in 30 ml of artificial seawater (ASW) and subjected to the aforementioned conditions for a 7-day incubation period.
2.3. Selection
An aliquot (100 µl) of each suspension was plated in Tryptic Soy Agar (TSA) medium supplemented with 2% NaCl (with organic carbon source and osmotic pressure set to marine) and incubated at the same conditions as above for 7 days.
The different colonies were collected and seeded on 2 plates, with TSA supplemented with 2% NaCl and ASW agar (ASW medium agar solidifyed) and incubated for 7 days.
Using 50 times magnifying microscope lens, 6 samples groups were showed the same colony morphology, and these were called G1, G2, G3, G4, G5 and G6. G1 to G5 were identified as bacteria and G6 was identified as a fungus and its manipulation ended.
2.4. High-pressure, scCO2 incubation
Colonies G1, G2, G3, G4 and G5 were inoculated in 30 ml of ASW and incubated under atmosphere of 20% CO2, at 36ºC, without shaking, without light for 7 days.
Afterwards, they were centrifuged at 8 krpm for 5 min, the supernatant was discarded, and precipitate resuspended in a new 15 ml of ASW. 3 aliquots were separated:
One of 3 ml was transferred to the high-pressure stainless-steel reactor and incubated for 8 days under 100 bar pressure, 100% CO2 atmosphere in supercritical state (scCO2), 36ºC, without light, without agitation;
One of 100 µL for counting colony forming units (CFU) in TSA supplemented by 2% NaCl, these pre-inoculation samples in extreme conditions were called time 0 (T0) samples; and
One of 1.5 ml for subsequent comparative analysis - stored at -80ºC.
The aliquot for UFC counting was serially diluted in 100, 10-1 and 10-2 and 100 µl of each dilution was inoculated in its respective plate and incubated in an oven with an atmosphere of 20% CO2, 36ºC, without agitation, without light. 7 days. After 7 days, the CFU were counted.
After incubation, samples called final time (TF) were retrieved: (i) 100 µL for counting colony forming units (CFU) in TSA supplemented by 2% NaCl; and (ii) 1.5 ml for subsequent comparative analysis - stored at -80ºC.
The aliquot for UFC counting was serially diluted in 100, 10-1 and 10-2 and 10 µl of each dilution was inoculated in its respective plate and under atmosphere of 20% CO2, at 36ºC, without agitation, without light. 7 days. After 7 days, the number of CFU were counted.
The sample G5 displaying growth colony after extreme conditions incubation was incubated under the same conditions and time (in triplicate), similarly removing the samples at T0 and TF for storage and CFU counting. We also incubated in triplicate, 3 ml of the control under 1 bar pressure, 20% CO2 atmosphere, at 36ºC, without light, without agitation.
2.5. MALDI – TOF
G5 was inoculated in 30 ml of ASW liquid medium and in solid ASW agar medium, both incubated at 20% CO2, 36ºC, without light.
The liquid medium was centrifuged at 10 krpm for 10 min, the supernatant was discarded, washed 3 times with 80% ethanol in cycles of adding ethanol, shaking, centrifuging, and discarding the supernatant, after washing, drying was carried out by centrifugation. under vacuum for 3 h, the proteins were extracted with 70% formic acid, sonicated for 1 h, derived by reaction with acetronitrile and centrifuged at 10 krpm for 1 min.
The matrix and supernatant were pipetted onto the equipment's reading plate and allowed to dry under laminar flow.
The colony sample from ASW agar was collected using a sterile toothpick and passed onto the equipment's reading plate. The matrix was pipetted on top and allowed to dry under laminar flow.
The reading card was inserted into the equipment and read.
Equipment brand “Bruker Daltonics”, model “UltrafleXtreme” and software “Biotyper” was used.
2.6. Raman spectroscopy
Samples from T0 and TF triplicate stored at -80ºC were retrieved and subjected to dry under vacuum centrifugation for 6 h.
Fragments from the resulting dry material and from fresh colonies in ASW agar were subjected to analysis by laser Raman spectroscopy at wavelengths from 101 to 4002 nm, generating files with data for each spectrum.
Equipment brand “Renishaw”, model “INVIA” and software “WIRE” was used.
2.7. Statistical analysis
The generated files were grouped into a file and prepared by the R Project software.12 Packages corrr, ggcorrplot, FactoMineR and RamanMP13 were loaded in the R Project software. The spectra were normalized by the min-max method and the main components were calculated.
The sample presenting different colony morphology was confirmed to be an outlier in PCA and its spectrum was compared against “KnowItAll” software database [
14].
3. Results
3.1. Activation and selection
The samples weight showed variation among the sampling points and within the sampling points as shown in
Table 2.
The variation in the samples average weight among sampling collection points is due to the variation in the composition of the sediment among the points. The standard deviation indicates variation in composition within the same collection point and reflects the pattern of temporal sedimentation as studied by Martins [
13].
From the 44 samples, 15 of them presented viable cells. Although the medium was devoid of carbon source, the result does not imply that the microorganisms activated are chemioautotrophics at this step since the sample material may have carried some source of carbon along, but it implies that they are not photosynthetic.
3.2. Selection
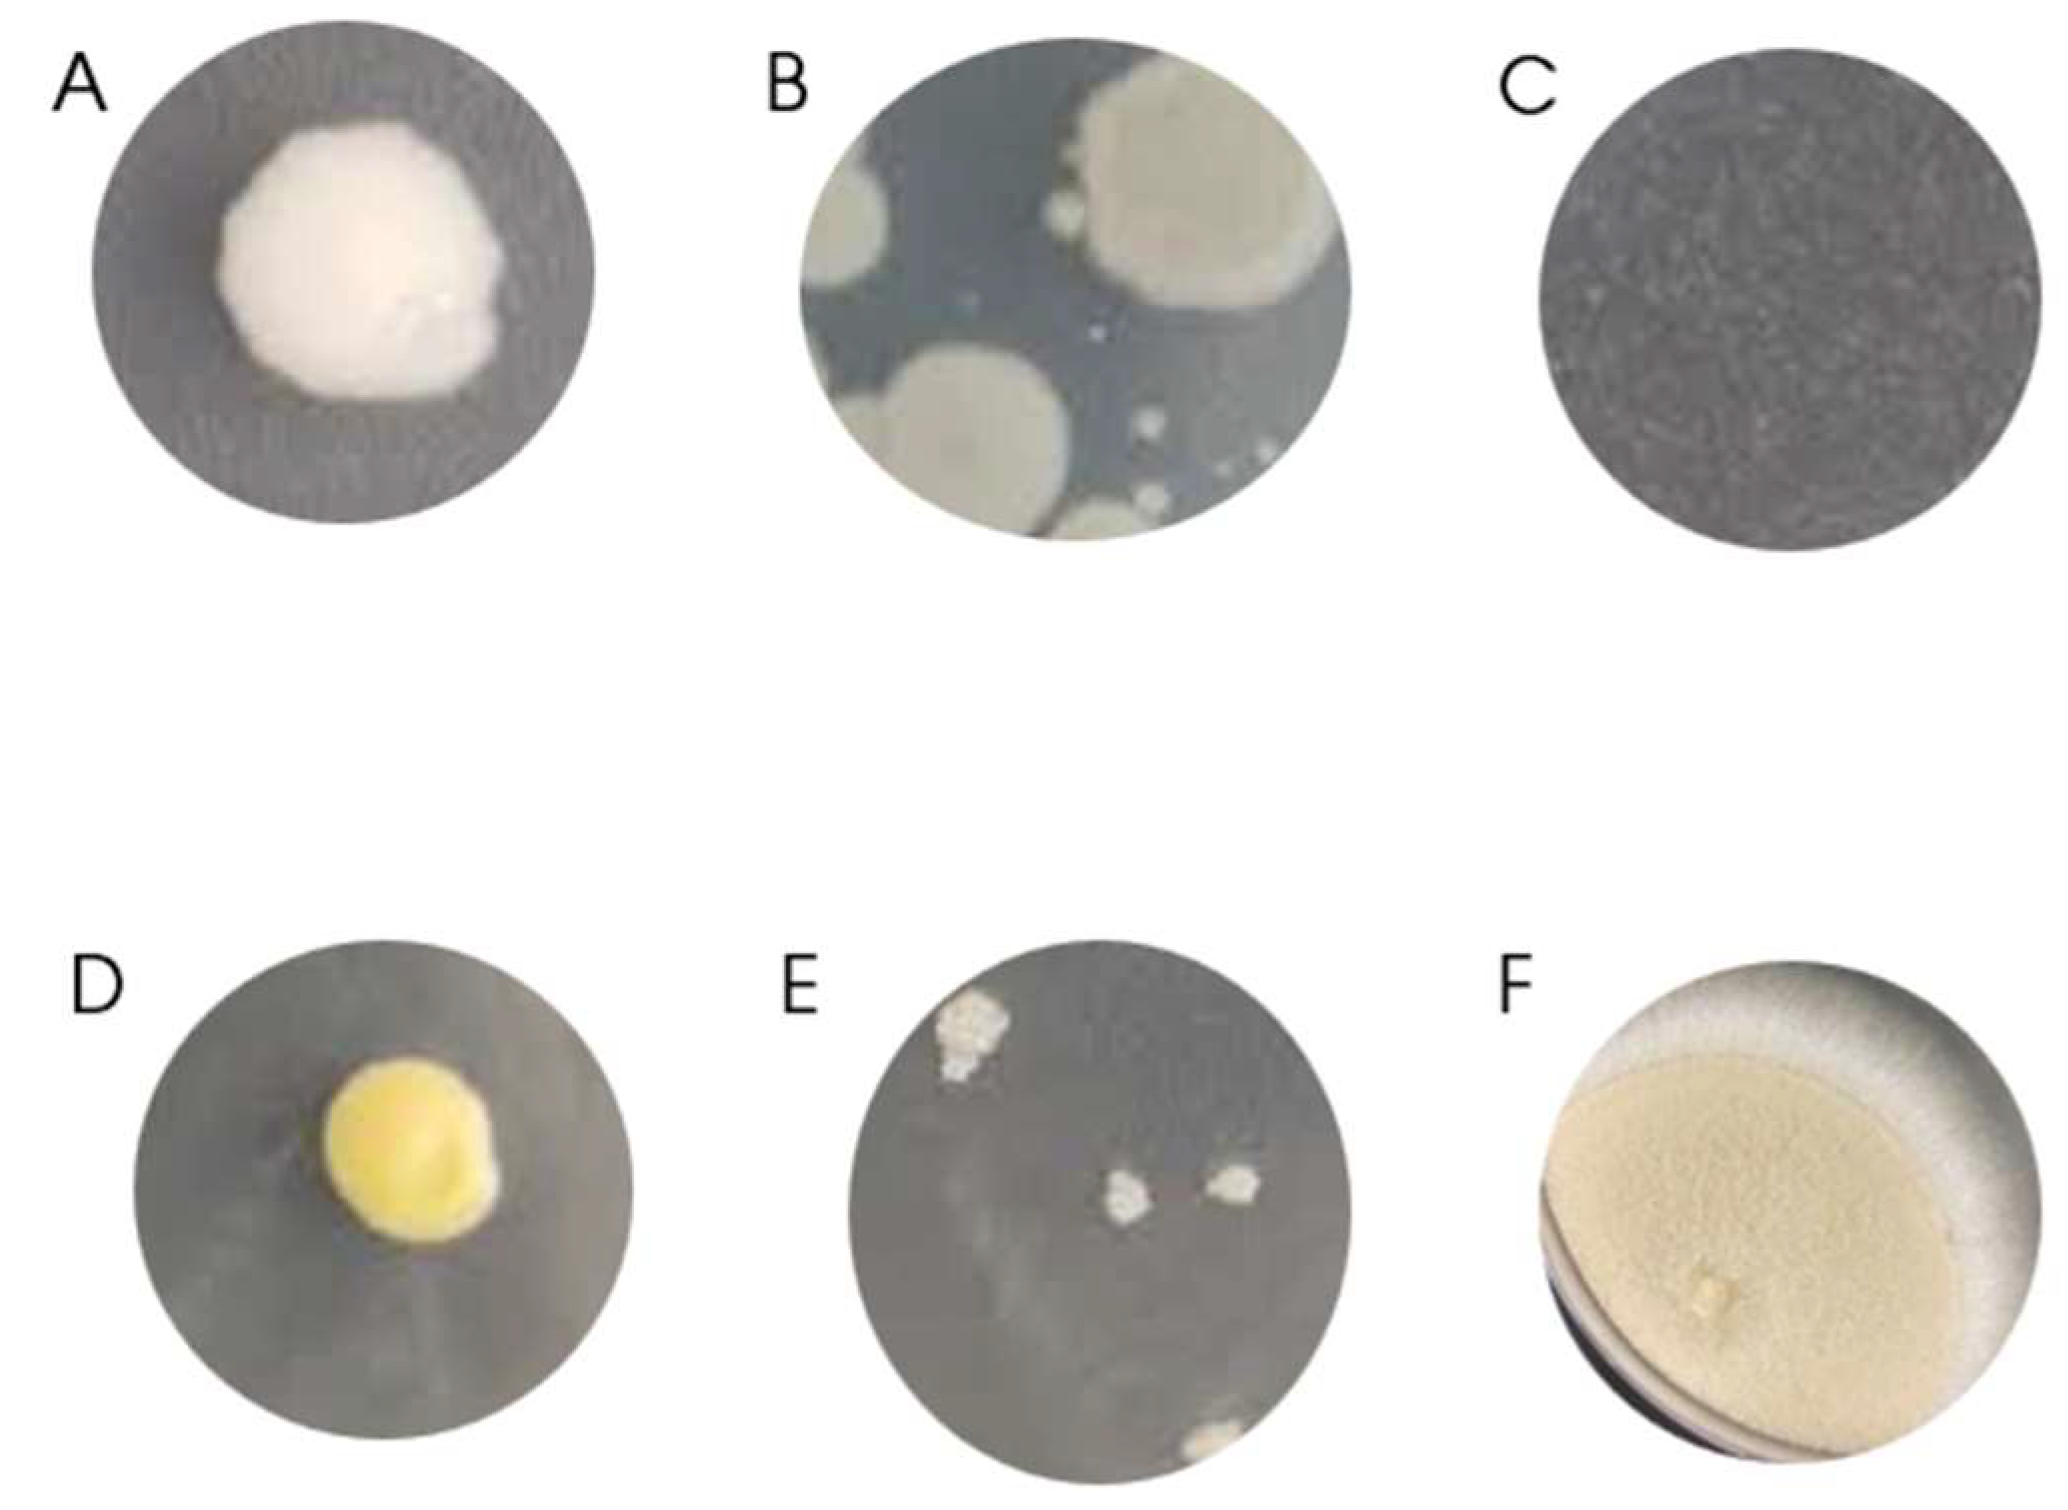
The colony morphology presented in the 15 samples could be divided into 6 groups (
Figure 1):
G1: smooth aspect, white, uniform. Isolated from AM10 and GC06A sampling points;
G2: rough aspect, cream in color, irregular boundaries. Isolated from AM10, GC06A, and GC12 sampling points;
G3: tiny colonies, transparent. Isolated from GC06A sampling point;
G4: smooth aspect, yellow, uniform. Isolated from GC06A and GC12 sampling points;
G5: lumpy, white, multinucleated colonies. Isolated from GC12 sampling point; and
G6: cotton like filamentous aspect. Isolated from GC06A and GC12 sampling points.
Figure 1.
Colonies aspect. A: G1; B: G2; C: G3; D: G4; E: G5; F: G6.
Figure 1.
Colonies aspect. A: G1; B: G2; C: G3; D: G4; E: G5; F: G6.
G6 was identified as fungus and retrieved from next experiments since fungus can not fix carbon dioxide.
3.3. High-pressure, scCO2 incubation
During the pre-inoculation step in ASW, its control did not present growth at T0 CFU counting, thus indicating that this microorganism needs organic carbon for its metabolism. Its growth in previous stages may indicate the presence of organic carbon carried along from the initial sample. With the exception of G4, all showed growth at T0, indicating that the reactor was inoculated with viable microorganisms. G3 presented the highest concentration of UFC at this stage (
Figure 2).
CFU counting I showed that 1. G4 did not grow in ASW; 2. G1 and G3 did not cope with the extreme conditions; and 3. G2 and G5 presented viable cells after incubation, keeping their concentration on the same order of magnitude, neither really thriving nor dying (
Table 3).
This section may be divided by subheadings. It should provide a concise and precise description of the experimental results, their interpretation, as well as the experimental conclusions that can be drawn.
Upon verification that G2 and G5 remained viable at this stage, the experiment was carried out in triplicate with their respective controls. After the experiment, CFU counting II showed that G2 controls (G2CI, G2CII, and G2CIII) remained stable at a cell concentration of 103 per ml, however it was observed that the microorganism did not resist a second incubation in the reactor under 100 bar and scCO2. G5 controls (G5CI, G5CII, and G5CIII) throve rising by one order of magnitude their initial cells concentration, whilst their counterparts incubated under extreme conditions, displayed the cells concentration slight lower, but at the same order of magnitude as the initial cells concentration (T0) (
table 4).
Only G5 remained active after the experiment. G5 bacteria were isolated from samples collected from the Platform (GC12 collection point), 760 m depth, low biogenic content, characterized as diamicton formation [
13,
15].
Most remarkably, after the high pressure, high CO2 atmospheric experiment, G5 presented a change in colony morphology, the colonies had a crystalline appearance (
Figure 3), while the control and T0 colonies maintained their original dewdrop appearance.
3.4. MALDI - TOF
While the spectrum was observed, no identification could be considered since there was no corresponding profile in Biotyper database. The result is coherent to the nature of the environmental microorganism isolated that might be way different from the database profiles.
3.5. RAMAN spectroscopy
With the sample positioned under the microscope coupled to the Raman spectroscopy equipment, we took some illustrative photos (
Figure 4).
Spectra were collected and stored in a file for statistical analysis.
3.6. Statistical analysis
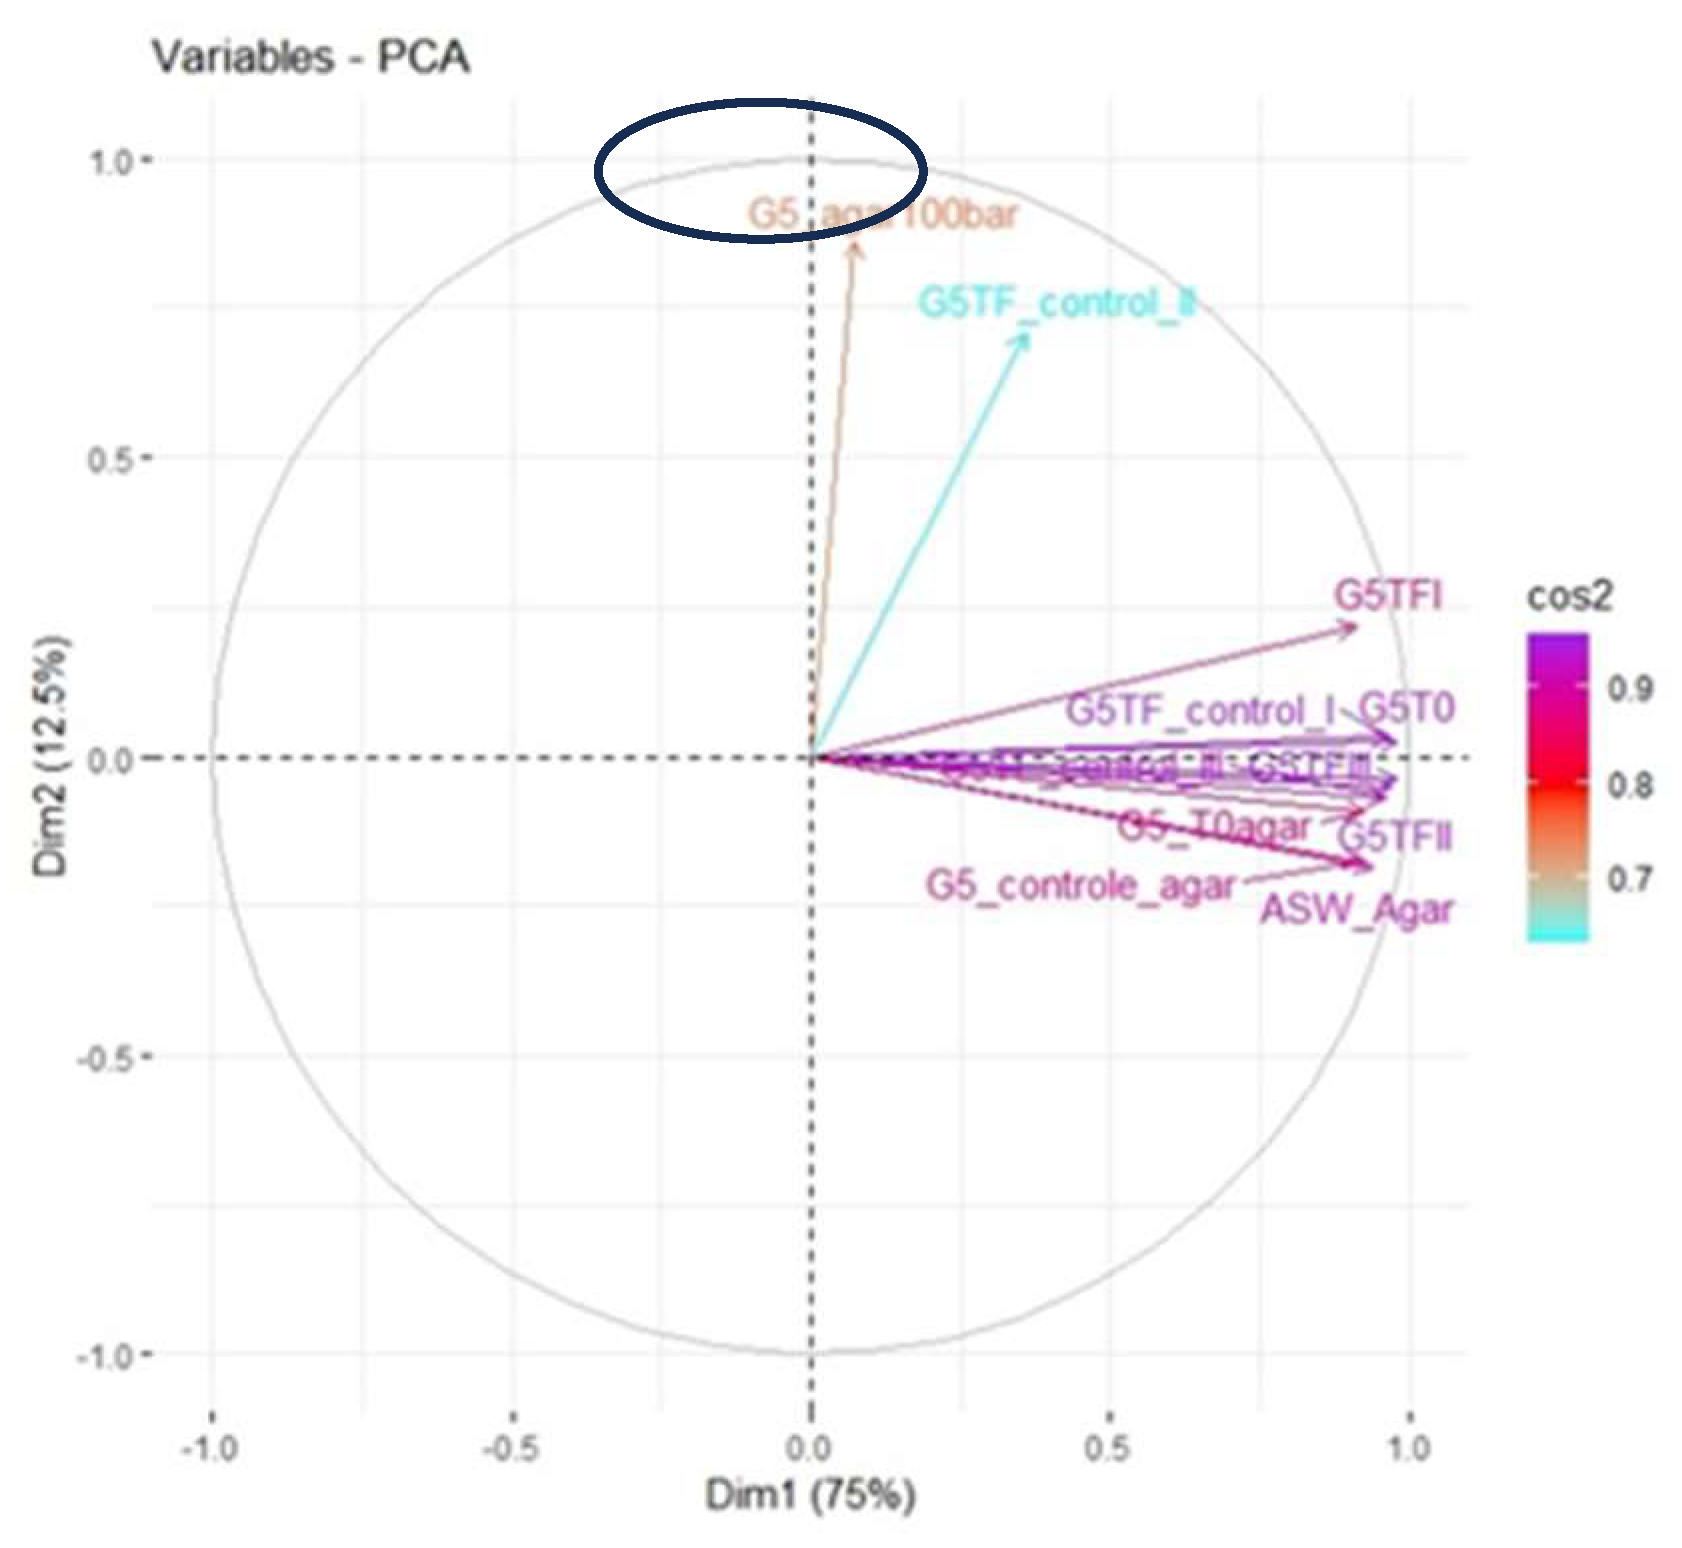
We verified that not only its colony morphology differs from samples that were not subjected to incubation under extreme conditions, but also its composition, as indicated in the PCA analysis for the spectra profiles (
Figure 5).
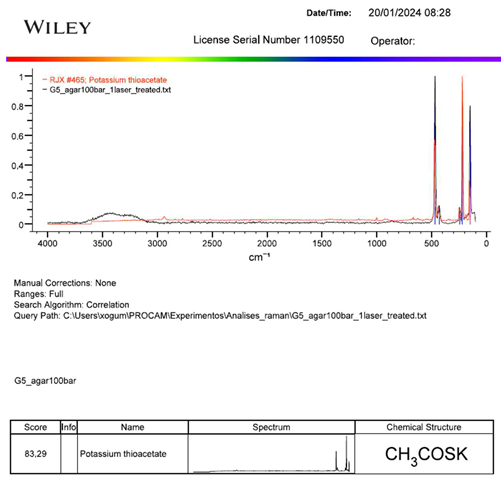
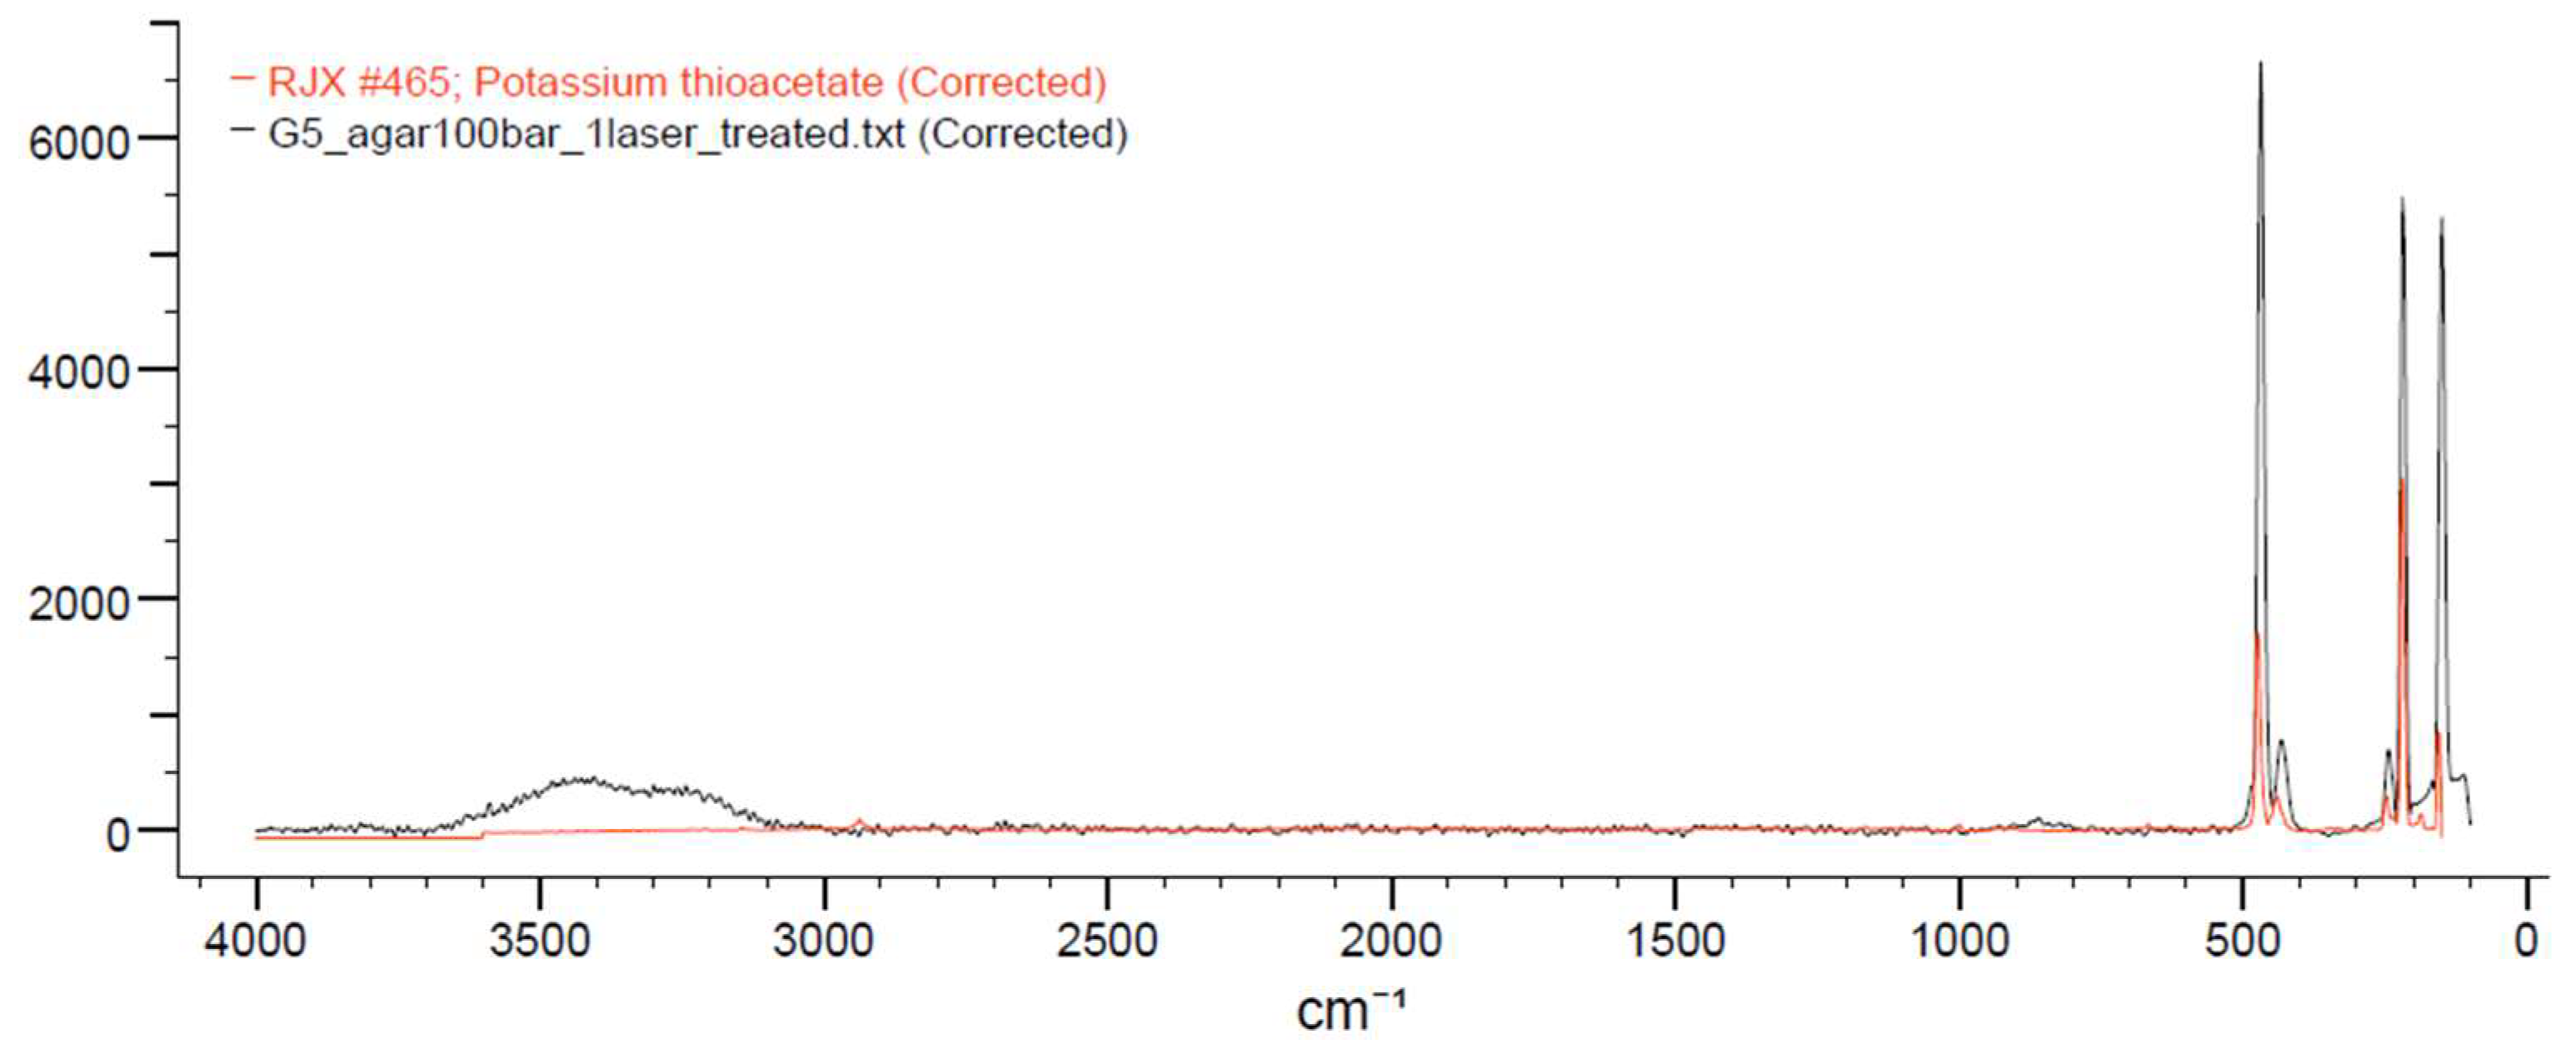
Once PCA supporting that the chemical profile from the sample grown on ASW agar was substantially different from the other samples, it was analysed by “KnowItAll” software and the match with higher score possible in the sample was potassium thioacetate (
Figure 6).
The program pointed to potassium thioacetate as the closest possible match to the sample profile with a correlation of 83.29% between the spectra.
The incubation high-pressure system was preliminarily evaluated for its sterility and functionality prior to the beginning of the experiments. The incubation proceeded with the ASW medium, temperature and pressure identical to the experiment, without the inoculation of any sample. The system was verified to be sterile and functional. No artifact formation was observed in the afterwards sample, nor was observed any growth either appearance of crystals on the ASW agar plates where sterility was assessed.
Therefore, thioacetate is necessarily related to sample G5 after its incubation at 100 bar and 100% scCO2 atmosphere.
The accumulation of thioacetate after extreme incubation conditions may indicate the activation of an alternative metabolic route, viable in anaerobiosis, derived from the organisms that inhabited the planet before the great oxygenation event [
16], with binding energy enough to promote biosynthesis, fixing CO2 [
17,
18,
19]. The accumulation of thioacetate after extreme conditions incubation may surge from the thioester reactive group cleavage from acetyl-SCoA [
20] or an alternatively ancient intermediate form CO2 fixation [
17,
18,
19], either way, it seems to play a major rule in carbon fixation in the experiment, indicating an active biosynthesis under extreme conditions.
4. Conclusion
The solution to the climate crisis, triggered by global warming, necessarily involves national and transnational environmental policies to implement GHG emission limits. However, even if a complete balance of GHG emissions and fixation is achieved, global warming is already at alarming levels and will only decline with the development of CCS.
We corroborate to the studies indicating Antarctica as a source of microorganisms with unique metabolisms and characteristics that can help both in elucidating questions about life and evolution as well as developing new technologies.
In this work, we were successful in prospecting for an Antarctic marine microorganism adapted to marine osmotic pressure, a chemoautotroph capable of fixing CO2 under conditions of high pressure and an harsh solvent scCO2 atmosphere.
The bacteria isolated here has the potential to be used in active or deactivated oil and gas deposits, consuming CO2 from tertiary recovery or even serving as a platform for genetic improvement or a source of genes of interest for the development of a (bio)technology that adds forces to combat the climate crisis through carbon sequestration (CCS).
Author Contributions
Diogo Ogawa: Experimental design and operation, writing; Enrique Rozas: Experimental design, supervision and edition; Rita Alves: Raman analysis; Cláudio Nascimento: Validation, edition, funding acquisition.
Funding
This research was funded by Coordenação de Aperfeiçoamento de Pessoal de Nível Superior, grant number 88887.467913/2019-00.
Acknowledgments
The authors acknowledge Dr. Arthur Ayres by providing the samples.
Conflicts of Interest
The authors declare no conflits of interest.
References
- “Hottest July ever signals ‘era of global boiling has arrived’ says UN chief _ UN News”.
- M. M. WMO, “2023 shatters climate records, with major impacts,”. https://wmo.int/news/media-centre/2023-shatters-climate-records-major-impacts#:~:text=The%20WMO%20provisional%20State%20of,%2Dindustrial%201850%2D1900%20baseline.
- M. M. WMO, “IPCC_AR6_WGIII_PressRelease_English_CCS,” 2022.
- K. Calvin et al., “IPCC, 2023: Climate Change 2023: Synthesis Report. Contribution of Working Groups I, II and III to the Sixth Assessment Report of the Intergovernmental Panel on Climate Change [Core Writing Team, H. Lee and J. Romero (eds.)]. IPCC, Geneva, Switzerland.,” Jul. 2023. [CrossRef]
- M. Bui et al., “Carbon capture and storage (CCS): The way forward,” Energy and Environmental Science, vol. 11, no. 5. Royal Society of Chemistry, pp. 1062–1176, May 01, 2018. [CrossRef]
- J. Gibbins and H. Chalmers, “Carbon capture and storage,” Energy Policy, vol. 36, no. 12, pp. 4317–4322, Dec. 2008. [CrossRef]
- U. Nations, “Causes and Effects of Climate Change | United Nations.” Accessed: Jan. 10, 2024. [Online]. Available: https://www.un.org/en/climatechange/science/causes-effects-climate-change.
- United Nations, “Transformando Nosso Mundo: A Agenda 2030 para o Desenvolvimento Sustentável,” 2015. [CrossRef]
- I. S. Thakur, M. Kumar, S. J. Varjani, Y. Wu, E. Gnansounou, and S. Ravindran, “Sequestration and utilization of carbon dioxide by chemical and biological methods for biofuels and biomaterials by chemoautotrophs: Opportunities and challenges,” Bioresource Technology, vol. 256. Elsevier Ltd, pp. 478–490, May 01, 2018. [CrossRef]
- D. J. DeMaster, T. M. Nelson, S. L. Harden, and C. A. Nittrouer, “The cycling and accumulation of biogenic silica and organic carbon in Antarctic deep-sea and continental margin environments,” Mar Chem, vol. 35, no. 1–4, pp. 489–502, Nov. 1991. [CrossRef]
- D. P. Kelly, “Introduction to the Chemolithotrophic Bacteria,” 1981, pp. 997–998. Accessed: Jan. 02, 2024. [Online]. [CrossRef]
- H. Pletsch, “Helena_tese,” 2021.
- M. D. S. Martins, F. Ferreira, A. A. Neto, and R. Vieira, “Geophysical investigation in sediment cores and its relationship with the governing sedimentary processes at Bransfield Basin, Antarctica,” An Acad Bras Cienc, vol. 94, 2022,. [CrossRef]
- B.-R. Laboratories and I. Division, “KnowItAll ® Vibrational Spectroscopy Edition KnowItAll ® Informatics System,” 2024. [Online]. Available: www.training.knowitall.com.
- J. Knight, “Uses and limitations of field mapping of lowland glaciated landscapes,” in Developments in Earth Surface Processes, vol. 15, Elsevier B.V., 2011, pp. 533–550. [CrossRef]
- D. E. Canfield, M. T. Rosing, and C. Bjerrum, “Early anaerobic metabolisms,” in Philosophical Transactions of the Royal Society B: Biological Sciences, Royal Society, Oct. 2006, pp. 1819–1836. [CrossRef]
- C. DE Duve, “A RESEARCH PROPOSAL ON THE ORIGIN OF LIFE Closing Lecture given at the ISSOL Congress in,” 2002. [CrossRef]
- R. T. Stubbs, M. Yadav, R. Krishnamurthy, and G. Springsteen, “A plausible metal-free ancestral analogue of the Krebs cycle composed entirely of α-ketoacids,” Nat Chem, vol. 12, no. 11, pp. 1016–1022, Nov. 2020. [CrossRef]
- A. Whicher, E. Camprubi, S. Pinna, B. Herschy, and N. Lane, “Acetyl Phosphate as a Primordial Energy Currency at the Origin of Life,” Origins of Life and Evolution of Biospheres, vol. 48, no. 2, pp. 159–179, Jun. 2018. [CrossRef]
- B. H. Kim and G. M. Gadd, Bacterial Physiology and Metabolism. Cambridge University Press, 2008. [CrossRef]
|
Disclaimer/Publisher’s Note: The statements, opinions and data contained in all publications are solely those of the individual author(s) and contributor(s) and not of MDPI and/or the editor(s). MDPI and/or the editor(s) disclaim responsibility for any injury to people or property resulting from any ideas, methods, instructions or products referred to in the content. |
© 2024 by the authors. Licensee MDPI, Basel, Switzerland. This article is an open access article distributed under the terms and conditions of the Creative Commons Attribution (CC BY) license (http://creativecommons.org/licenses/by/4.0/).


