Preprint
Article

Development and Evaluation of a Dry Emulsion of Ostrich Oil as a Dietary Supplement

Altmetrics

Downloads

162

Views

72

Comments

0

Submitted:

31 January 2024

Posted:

01 February 2024

You are already at the latest version

Alerts
Abstract
This study aimed to develop a high-quality dry emulsion incorporating omega-3, 6, and 9 fatty acid-rich ostrich oil for use as a dietary supplement. Extracted from abdominal adipose tissues using a low-temperature wet rendering method, the ostrich oil exhibited antioxidant properties, favorable physicochemical properties, microbial counts, heavy metal levels, and fatty acid compositions, positioning it as a suitable candidate for an oil-in-water emulsion and subsequent formulation as a dry emulsion. Lecithin was employed as the emulsifier due to its safety and health benefits. The resulting emulsion, comprising 10% w/w lecithin and 10% w/w ostrich oil, was stable, with a droplet size of 3.93 ± 0.11 μm. This liquid emulsion underwent transformation into a dry emulsion to preserve the physicochemical stability of ostrich oil, utilizing Avicel® PH-101 or Aerosil® 200 through a granulation process. Although Aerosil® 200 exhibited superior adsorption, Avicel® PH-101 granules surpassed it in releasing the ostrich oil emulsion. Consequently, Avicel® PH-101 was selected as the preferred adsorbent for formulating the ostrich oil dry emulsion. The dry emulsion, encapsulated with a disintegration time of 3.11 ± 0.14 min for ease of swallowing, maintained microbial loads and heavy metal contents within acceptable limits. Presented as granules containing butylated hydroxytoluene, the dry emulsion showcased robust temperature stability, suggesting the potential incorporation of animal fat into dry emulsions as a promising dietary supplement.
Keywords: 
Subject: Medicine and Pharmacology  -   Medicine and Pharmacology

1. Introduction

Ostrich (Struthio camelus), a member of the ratite family, holds the distinction of being the largest flightless bird native to Africa and is renowned for laying the largest eggs. It possesses a small head, long neck, and large legs (Figure 1). Consequently, it is unable to fly but is an adept runner. Generally found in arid countries, ostriches sustain themselves on a diet of fruits, juicy plants, and tiny insects [1]. Currently, there are more than 5,000 ostrich farms worldwide, including those in Australia, Argentina, Botswana, Brazil, France, Israel, Namibia, Spain, England, the United States of America, and Thailand [2]. All parts of ostriches find extensive use in various products, such as clothing, gloves, shoes, and handbags. Ostrich meat, known for its high protein content and low fat, is ideal for preparing healthy steaks and sausages. Additionally, ostrich oil is derived from the adipose tissues of the abdominal cavities and subcutaneous areas of the breasts and backs of ostriches. This oil, rich in potential, can be used as active ingredients in cosmetics [1].
The common methods employed for preparing ostrich oil include dry rendering and wet rendering [3]. Dry rendering is the most frequently used process in households, involving the direct heating of raw adipose tissues. The resulting oil product carries a distinctive scent from protein denaturation, and the intensity of its color depends on the temperature. In the wet rendering process, adipose tissues are melted through indirect heating using a double boiler or steaming cooker. The oil produced from wet rendering generally exhibits higher quality compared to that from dry rendering [4]. Low-temperature rendering is a specialized process utilized to extract oil from ostrich adipose tissues at lower temperatures compared to traditional rendering methods. The aim is to minimize heat exposure, preserving the quality of the oil, especially when dealing with oils sensitive to high temperatures. In the case of ostrich oil, low-temperature rendering may involve gently heating the ostrich adipose tissues to extract the oil without reaching temperatures that could cause degradation or alteration of the oil’s beneficial properties. The specific temperature range can vary, but generally, it is kept below the typical temperatures used in conventional rendering methods [5]. Low-temperature rendering is often preferred for oils containing heat-sensitive compounds, such as essential fatty acids and other bioactive components (carotenoids, tocopherol, and flavones) [6]. This method helps retain the nutritional and cosmetic properties of the oil, making it suitable for various applications, including cosmetic and skincare products.
The stability of fats and oils is primarily compromised by rancidity, making it the most critical quality parameter. Rancidity results from chemical changes in oils, where the structures of oil components are degraded through chemical reactions or lipase activities, giving rise to undesirable odors and flavors [7]. There are two major pathways for rancidification: hydrolysis and oxidation. Hydrolytic rancidity stems from hydrolysis reactions, wherein triacylglycerols undergo hydrolysis with lipase and water, leading to the formation of free fatty acids and glycerols. Triacylglycerols with short-chain fatty acids (6-12 carbon atoms) typically produce off-flavors [8]. On the other hand, oxidative rancidity involves the degradation of double bonds in unsaturated fatty acids by oxygen in the air. Lipid oxidation follows a free radical reaction with three major steps: initiation, propagation, and termination. The resulting products of oxidative rancidity include hydrocarbons, aldehydes, alcohols, and volatile ketones [9]. The oxidation of oils is influenced by various factors such as heat, light, fatty acid composition, and metals. Adding antioxidants can effectively decrease the rate of lipid oxidation. Oxygen plays a crucial role in causing lipid oxidation and subsequent rancidity. Light acts as a catalyst for lipid oxidation, and an increase in temperature accelerates the rate of this process. Therefore, it is recommended to pack oil under vacuum or displace oxygen with inert gases such as nitrogen or carbon dioxide, store it in a cool place, and protect it from light. In addition, certain heavy metals like copper (Cu), iron (Fe), manganese (Mn), and chromium (Cr) can increase the rate of lipid oxidation. As a result, it is advisable to prepare and store oil in containers made of stainless steel or nonmetallic materials, such as plastic, glass, and ceramic [10].
The physicochemical properties of ostrich oil, including the peroxide value (PV), acid value (AV), iodine value (IV), saponification value (SV), and refractive index (RI), serve as crucial metrics for assessing oil quality. Monitoring these properties is essential to prevent the consumption of deteriorated oil. PV is employed to gauge the rate of lipid oxidation reactions. Oils with a high degree of unsaturation are particularly prone to oxidative rancidity, making PV a key indicator. A lower PV signifies better oil quality. The AV measures the concentration of free fatty acids in the oil, derived from the hydrolysis of triacylglycerols. A high AV suggests that the oil is prone to becoming rancid [11]. IV is utilized to ascertain the unsaturation level in fatty acids by adding iodine atoms to double bonds. A higher IV indicates a greater presence of double bonds in unsaturated fatty acids. SV reflects the average molecular weight of all fatty acids in the oil. Oils with long-chain fatty acids exhibit a lower SV due to fewer carboxylic groups per unit mass of oil. RI reflects oil purity and is related to the change in the angle of a light ray passing through the oil. This index is influenced by temperature and the structures of the oil components. Each oil has a distinct refractive index [12]. The heavy metal content in oils, particularly arsenic (As) and lead (Pb), is critical for assessing toxicity to human health. Copper (Cu) and iron (Fe) can enhance oil oxidation. Heavy metal content is determined using inductively coupled plasma-mass spectrometry (ICP-MS), wherein the sample is ionized by inductively coupled plasma, and the separated metal ions are quantified individually using a mass spectrometer [13].
Ostrich oil is predominantly composed of triacylglycerols and essential fatty acids, with a notable presence of oleic acid (omega-9), linoleic acid (omega-6), and linolenic acid (omega-3). The quantity of unsaturated fatty acids in ostrich oil is contingent upon the type and content of fatty acids present in the feedstuff [14,15]. Numerous studies affirm the elevated levels of essential fatty acids, encompassing omega-3, omega-6, and omega-9, in ostrich oil. Omega-3 fatty acids, constituting long-chain polyunsaturated fatty acids with chain lengths of 18 to 22 carbons and a double bond at the third carbon from the chain’s end, are a distinctive component. As the human body cannot synthesize omega-3 fatty acids autonomously, their inclusion in the diet is imperative for maintaining good health. These fatty acids confer various health benefits, such as regulating normal metabolism, enhancing heart health, preventing cardiovascular diseases, and influencing brain function and the nervous system. Furthermore, omega-3 fatty acids can undergo conversion into docosahexaenoic acid (DHA) and eicosapentaenoic acid (EPA), essential for the normal development and function of the brain, particularly in infants. Beyond this, omega-3 fatty acids contribute to improving skin health by reducing UV-induced photo damage, preventing premature skin aging, and mitigating skin inflammation [15,16,17]. Omega-6 fatty acids are polyunsaturated fatty acids distinguished by the positioning of the first double bond at the sixth carbon from the end of the omega chain. These acids have the capacity to undergo conversion into gamma-linolenic acid (GLA) and arachidonic acid (ARA). A noteworthy finding in the report indicates that the intake of a high dose of GLA supplements significantly alleviates symptoms associated with rheumatoid arthritis. ARA plays a crucial role in producing pro-inflammatory eicosanoids, contributing to the immune system’s inflammatory response. Moreover, when omega-6 is combined with omega-3, a synergistic effect emerges, offering various health advantages. This includes the reduction of symptoms associated with attention deficit hyperactivity disorder (ADHD), the lowering of blood pressure, a decreased risk of heart disease, and support for bone health. Maintaining an appropriate ratio of consumed omega-6 to omega-3 is pivotal for optimizing health benefits, and it is recommended to keep this ratio below 5:1. Specifically concerning skin health, this combination can restore the skin barrier function and effectively diminish scaling on the skin [18,19]. Oleic acid, a monounsaturated omega-9 fatty acid, is present in ostrich oil, with a double bond located at the ninth carbon atom from the omega end of the fatty acid molecule. Unlike essential fatty acids, oleic acid is not considered essential because the human body can synthesize it in the presence of sufficient omega-3 or omega-6 fatty acids. Omega-9 fatty acids, including oleic acid, offer numerous health benefits, such as promoting heart health, maintaining balanced cholesterol levels, enhancing immune function, and improving skin health [14,17,20]. Several studies have demonstrated that ostrich oil, comprising omega-3, omega-6, and omega-9 fatty acids, exhibits potential in reducing nerve pain, suppressing inflammation, treating conditions like rheumatoid arthritis and asthma, lowering blood pressure, decreasing the risk of heart disease, and protecting aging skin [2,6,14,15,17,19].
An emulsion is a biphasic system comprising two immiscible liquid phases. The dispersed phase, also known as the internal or discontinuous phase, is uniformly distributed as small globules throughout the continuous phase, referred to as the external or dispersion medium. The emulsion also includes an emulsifier, acting as the emulsifying agent. The emulsifier plays a crucial role in stabilizing the system and ensuring the acceptable shelf-life of the product by forming a thin film around the globules of the dispersed phase. This film decreases the interfacial tension between both phases and contributes to stabilizing the dispersed droplets through electrostatic or steric-hindrance effects [21]. The molecular structure of an emulsifier consists of hydrophobic and hydrophilic parts. The emulsification efficiency of an emulsifier correlates with its chemical structure, physical properties, and solubility. The selection of emulsifiers depends on the characteristics of the final products, the chemical and physical attributes of each phase, the emulsion preparation methodology, the amount of emulsifier added, and the presence of other functional components in the emulsions [22]. Emulsions can be classified based on the nature of the emulsion systems, including simple and multiple emulsions. Simple emulsions are divided into two types: 1) oil-in-water emulsion (O/W emulsion), where oil droplets disperse throughout the aqueous phase [23]. This type is non-greasy, easy to remove from the skin, provides a cooling effect, and masks the unpleasant taste of oil. 2) Water-in-oil emulsion (W/O emulsion) involves the distribution of water globules in the continuous oil phase. It is greasy, not water-washable, and is suitable for external-use formulations. This type reduces moisture evaporation from the skin surface and has an occlusive effect by moistening the stratum corneum of the skin.
Edible oils are commonly formulated as O/W emulsions, where oil droplets disperse in an aqueous phase, offering several advantages in the formulation of edible oils. For decreasing greasy appearance, O/W emulsions effectively reduce the greasy appearance of oils, enhancing palatability and acceptability for consumption. This is particularly beneficial in food products where a less greasy texture is desired [24]. For masking rancid taste, O/W emulsions can effectively conceal the rancid taste of oil, improving the overall sensory profile of the product. This is crucial for maintaining the flavor and quality of food items containing edible oils [25]. For preventing oil rancidification, emulsifiers play a crucial role in forming a protective film around the oil droplets, acting as a barrier that shields the oil from exposure to oxygen and light. This protective mechanism significantly extends the shelf life of products containing edible oils [26].
Emulsifiers, which play a vital role in stabilizing emulsions, undergo adsorption at the oil-water interface during the homogenization process. This adsorption actively reduces the surface tension between oil and water. The underlying mechanism involves emulsifiers forming a protective film around the oil droplets, offering defense against both oxygen and light [27]. Moreover, emulsifiers play a crucial role in mitigating the flocculation (clumping together) and coalescence (merging) of oil droplets by inducing steric or electrostatic repulsions. This intricate process significantly contributes to maintaining the stability of the emulsion [28]. Emulsifiers intended for use in oral preparations must meet specific criteria, being edible, odorless, tasteless, and compatible with the physicochemical characteristics of both phases. An example of a natural emulsifier suitable for such applications is soy lecithin, derived from soybeans, encompassing phospholipids, triglycerides, and various other substances. The primary phospholipids present include phosphatidylserine, phosphatidylcholine, phosphatidylethanolamine, phosphatidylinositol, and phosphatidic acid [29]. Additionally, soy lecithin contains carbohydrates, pigments, sterols, and sterol glycosides. Lecithin, designated as INS 322 and E-number 322, serves as a food additive due to its emulsifying and lubricant properties. Beyond its functional role, soy lecithin also offers health benefits, such as cholesterol level and blood pressure control, support for brain and nervous system health, repair of damaged cell membranes, and promotion of overall cell function [30].
To address physicochemical and compliance challenges associated with liquid emulsions, the development of dry emulsions is pursued for several compelling reasons. Dry emulsions, offering enhanced stability compared to their liquid counterparts, achieve this by removing water, thus minimizing the potential for chemical reactions and physical instability, such as phase separation or creaming, commonly observed in liquid emulsions over time. This absence of water also serves to create a protective environment for active ingredients sensitive to factors like light, heat, or oxygen, thereby mitigating the risk of degradation and ensuring a prolonged shelf life. Consequently, dry emulsions stand out for their ability to effectively preserve active ingredients [31]. Moreover, dry emulsions prove advantageous in drug delivery systems, particularly for lipophilic or slightly-soluble drugs. The incorporation of a solid carrier facilitates the controlled and efficient delivery of these drugs. Being in a powdered or granulated form, dry emulsions are more manageable in terms of handling, transportation, and storage compared to their liquid counterparts. This attribute is particularly valuable in industries such as pharmaceuticals and cosmetics, where product logistics play a crucial role [32]. Additionally, the convenience for consumers is enhanced with dry emulsions, as they eliminate the need for measuring and handling liquid formulations. This not only provides a more user-friendly option but also ensures compliance [33]. Furthermore, the reduction or elimination of water in dry emulsions diminishes the necessity for preservatives, which are often required in liquid emulsions to prevent microbial growth in the water phase. These addresses concern related to potential side effects associated with preservatives, emphasizing the capacity of dry emulsions to reduce dependency on such additives [34]. In summary, the development of dry emulsions aims to optimize the stability, efficacy, and overall user experience of emulsion-based products, particularly in the pharmaceutical industry, where these advantages play a pivotal role.
To tackle the challenges associated with the physicochemical properties and compliance commonly linked to liquid emulsions, the development of dry emulsions has been undertaken. Typically, these emulsions are formulated from O/W emulsions that incorporate a solid carrier within an aqueous phase, utilizing various methods such as rotary evaporation, freeze-drying, spray drying, and lyophilization [35]. Dry emulsions present as lipid-based granules, facilitating the reconstitution of an O/W emulsion when introduced to an aqueous solution. They are particularly advantageous for lipophilic and slightly-soluble drugs or those prone to oxidation and light sensitivity [36]. The simple preparation of dry emulsions is achieved by converting liquid O/W emulsions into dry powders through techniques that involve adsorption on solid carriers or adsorbents. However, a drawback arises when producing dry emulsions with high water content, as they require substantial amounts of adsorbents [37,38].
The careful selection of edible adsorbents for an oral administration system is critically important in the preparation of dry emulsions. Effective solid adsorbents typically require high physicochemical stability, a proper porous structure, high adsorption capacity, sustained/controlled-release properties, and a pleasant taste. Avicel® PH-101, a microcrystalline cellulose (MCC) derived from the depolymerization of cellulose, is a tasteless, odorless crystalline powder with a particle size of around 50 µm. Widely employed as an adsorbent, excipient, anti-caking agent, disintegrating agent, and bulking agent in the food, pharmaceutical, cosmetic, and other industries [39], MCC exhibits favorable adsorbent properties for oral administration systems, including high water absorption, rapid disintegration, and chemical inertness. The advantages of Avicel® PH-101 for wet granulation formulations [40,41] encompass rapid water adsorption and distribution throughout the mixture, reduced sensitivity to water content, high adsorptive capacity, increased drying efficiency, decreased color mottling, improved drug content uniformity, and enhanced tablet hardness at the same compression force with less friability. Aerosil® 200, a hydrophilic fumed silica with a specific surface of 200 m2/g [42], is widely recognized for its versatile functionality as an effective adsorbent, thickening agent, and anti-caking agent in various applications. Its incorporation as an additive in food and pharmaceutical products is prevalent, aiming to enhance powder flowability, diminish caking tendencies, boost productivity, and prolong storage stability. In the specific domain of dry emulsions, Aerosil® 200 serves as a valuable adsorbent, facilitating the conversion of liquid emulsions into dry or powder forms. Leveraging its high surface area and porous structure, it adeptly adsorbs liquids and stabilizes emulsion components during the drying process. Noteworthy characteristics and applications include its substantial surface area, providing ample sites for adsorption of liquids and other substances, efficient liquid adsorption for the creation of a dry, stable emulsion, anti-agglomeration properties that prevent caking of powders, thereby enhancing flowability and stability. Furthermore, Aerosil® 200 exhibits the capability to function as a thickening or rheology control agent in formulations [42,43,44,45,46]. In terms of potential applications, dry emulsions containing various edible oils find widespread use in dietary supplement products [47].
In the pharmaceutical and food industries, emulsions are commonly utilized to improve the palatability of edible oils and enhance their effectiveness by facilitating controlled dosage [48]. Numerous studies have demonstrated that incorporating edible oils in O/W emulsions administered orally can enhance the absorption and bioavailability of poorly water-soluble oils [49,50]. Dry emulsions represent a novel oral drug delivery system for sustained release, known for their simplicity in preparation and ease of transport. Typically, Avicel® PH-101 and Aerosil® 200 serve as solid adsorptive materials or adsorbents for liquid active pharmaceutical ingredients, particularly emulsions containing edible oils. The crucial property of the adsorbent lies in its oil absorption capacity and cumulative percent of oil released [42]. The dry powder is prepared through a straightforward mixing process and can be easily redispersed to form reconstituted emulsions. Solid oral dosage forms like tablets and capsules, known for their ease of swallowing, are preferred. Therefore, the resulting powders or granules of dry emulsions should be compressed into tablets or filled into hard gelatin capsules [46,51]. Currently, dry adsorbed emulsions containing edible oils have been developed and evaluated for percent weight loss after oil release and stability, suggesting that dry emulsions offer a viable oral drug delivery method for edible oils.
This study involved extracting ostrich oil from the adipose tissues of the ostrich bird using a low-temperature wet rendering process, specifically designed to preserve omega fatty acids. The lipid profile of the resulting ostrich oil underwent thorough analysis through gas chromatography with a flame ionization detector (GC-FID). Furthermore, the antioxidant activity of the ostrich oil was evaluated. A significant challenge associated with ostrich oil is its susceptibility to oxidative and hydrolytic rancidity, leading to undesirable odors and flavors [52]. To address this issue, O/W emulsions containing ostrich oil were developed, with emulsifiers playing a crucial role in forming a protective film around oil droplets, shielding them from the detrimental effects of oxygen and light exposure [53]. Lecithin, a renowned emulsifier, was carefully selected for its capacity to create extremely stable emulsions, aiming to produce stable, high-quality emulsions suitable for the production of dry emulsion [54]. Dry emulsions, derived from liquid O/W emulsions, emerged as a promising strategy for delivering lipophilic and slightly soluble substances, as well as compounds sensitive to oxidation and light, effectively addressing concerns related to physicochemical and microbial instability. The efficacy of this formulation was demonstrated by its ability to enhance oil stability, preserving vulnerable double bonds from oxidative decomposition [55,56,57,58]. Creating a dry emulsion involved adsorbing a liquid emulsion onto adsorbents, allowing for the formation of a dry emulsion. The pattern of drug release from the system was influenced by variables such as the type of liquid emulsion and the polarity of the carrier. The easiest and most practical method involved swiftly combining a hydrophilic adsorbent with a liquid emulsion, followed by drying the resulting wet mass [59]. The process of obtaining uniform dry emulsions from an O/W emulsion containing ostrich oil involved the use of adsorbents such as Avicel® PH-101 and Aerosil® 200. The resulting dry emulsions manifested as lipid-based granules that could be easily reconstituted into the O/W emulsion using aqueous solutions. The obtained dry emulsion granules were then filled into hard gelatin capsules. Upon oral administration, the formulation disintegrated, releasing the emulsion powder. The adsorbed emulsion subsequently returned to its liquid state [51]. The careful selection of edible adsorbents for oral administration systems played a pivotal role in the preparation of dry emulsions. The overarching objectives of this research were to assess the feasibility of manufacturing dietary supplements encapsulated with dry emulsions that incorporate ostrich oil.

2. Materials and Methods

2.1. Materials

All reagents utilized in the experiments were of analytical reagent (AR) and American Chemical Society (ACS) grade. Methyl heptadecanoate and all fatty acid GC standards were procured from Nu-Chek Prep, Inc., Minnesota, USA. The ICP multi-element standard solution XIII was acquired from Agilent Technologies, Santa Clara, USA. Purchased from Sigma-Aldrich, Missouri, USA: 2,2-diphenyl-1-picrylhydrazyl (DPPH), 6-hydroxy-2,5,7,8-tetramethylchroman-2-carboxylic acid (Trolox), ethylenediaminetetraacetic acid (EDTA), and Wijs solution. Avicel® PH-101 and Aerosil® 200 were bought from FMC BioPolymer, Pennsylvania, USA and Evonik Resource Efficiency GmbH, Hanau-Wolfgang, Germany, respectively.

2.2. Preparation and evaluation of ostrich oil

2.2.1. Preparation of ostrich oil

Frozen ostrich fat was bought from Siam Ostrich Co. Ltd., situated in Bosuphan, Song Phi Nong district, Suphan Buri 72110. Following thawing, the fat was meticulously dried with tissue paper, cut into small pieces, and finely chopped into a smooth paste. In line with a previous report [60], the rendering method for the ostrich paste was conducted at a low temperature of 45-50 °C, with continuous stirring until complete melting was achieved. Subsequently, liquid ostrich oil was carefully separated from any unmelted residues. To eliminate residual moisture, anhydrous sodium sulfate was introduced to the oil and vigorously mixed to absorb water from its surroundings. The resulting ostrich oil was then securely stored in nitrogen-filled amber glass vials at 4 °C, shielded from light, until it underwent analysis and was ready for formulation. This precautionary measure was implemented to safeguard the oil from oxidation and photodegradation during the interim period.

2.2.2. Fatty acid composition

The synthesis of fatty acid methyl esters (FAMEs) and the GC-FID method are detailed in a previous report [60]. FAMEs were produced through a one-step extraction and direct transesterification process involving ostrich oil containing fatty acids and a mixture of methanol: sulfuric acid: chloroform (17: 3: 20, v/v/v). This reaction occurred at 90 °C for 30 min in a heat block (AccuBlockTM Digital Dry Bath, Labnet International, Inc., New Jersey, USA). Analysis of FAMEs was conducted using GC-FID with an automated liquid sampler (Model 6890N Network GC System, Agilent Technologies, Santa Clara, California, USA), and a capillary fused silica column HP-INNOWax 19091N-113 (30m×0.32mm×0.25 μm film of polyethylene glycol) from Agilent Technologies, Santa Clara, California, USA. Methyl heptadecanoate served as the internal standard. The GC oven program included an initial temperature of 180 °C, a hold time of 20 min, a rate of 10 °C/min to 240 °C, and a hold time of 4 min. The split ratio was 80:1, with an injection volume of 1 µL. The column flow (He) was 1.5 mL/min in a constant flow mode. For FID, the heater temperature was 300 °C, H2 flow was 30 mL/min, air flow was 300 mL/min, and makeup flow (N2) was 30 mL/min. Peak identification and quantification of fatty acids were achieved by directly comparing peak areas and retention times of FAMEs in oil samples with those obtained from FAME mix standards.

2.2.3. Antioxidant activity

DPPH radical scavenging

The assessment of a sample’s DPPH radical scavenging capacity, reflecting its ability to neutralize DPPH radicals by donating hydrogen atoms or electrons, followed the procedures outlined in our previous studies [61,62]. DPPH radicals, characterized by a deep violet color, display a prominent absorption band at 517 nm. The reduction of DPPH radicals (violet color) to the diamagnetic DPPH (yellow color) in the presence of antioxidants leads to a decrease in absorbance. For the analysis, samples were individually dissolved in ethyl acetate to achieve various test concentrations. Subsequently, 1.0 mL of the sample solution was mixed with 3.0 mL of 0.1 mmol/L freshly prepared DPPH solution and left at room temperature for 90 min in the dark. The absorbance was promptly determined against a blank using a UV-Vis spectrophotometer (Hitachi U-2900, Hitachi High-Technologies Corporation, Tokyo, Japan). Trolox served as the standard antioxidant. The 50 percent inhibitory concentration (IC50) was determined through linear regression.

Copper-chelating activity

The capacity of the oil samples to chelate pro-oxidative Cu2+ ions was investigated following a previously established protocol [63]. In the experimental procedure, 1 mL of 2 mmol/L CuSO4 was combined with 1 mL of pyridine (pH 7.0) and 20 µL of 0.1% w/v pyrocatechol violet. Subsequently, upon adding 1 mL of the sample solution, the fading of the blue color, indicative of Cu2+ dissociation, was monitored by measuring the absorbance at 632 nm over 5 min. A blank was prepared using an equivalent volume of distilled water instead of the sample. EDTA served as a positive control, and the Cu2+ chelating activity was subsequently calculated.

2.2.4. Acid value (AV), Peroxide value (PV), iodine value (IV), saponification value (SV), and refractive index (RI)

The assessment of AV, PV, IV, and SV involved the use of standard solutions. Potassium hydroxide was employed to neutralize free acids in the sample for AV. Sodium thiosulfate was used to titrate liberated iodine from potassium iodide for PV and to titrate iodine present in the sample, which had reacted with Wijs solution and potassium iodide, for IV. Hydrochloric acid was utilized to back-titrate the excess potassium hydroxide for SV. These standard solutions underwent titration using a potentiometric autotitrator, Titrino Plus 848 (Metrohm, Herisau, Switzerland), following the official procedures outlined by the American Oil Chemists’ Society (AOCS) in Cd 3d-63 [64], Cd 8b-90 [65], Cd 1d-92 [66], and Cd 3-25 [67].
The RI of ostrich oil was measured at 30 ± 0.1 °C using a digital refractometer, NAR-1T Liquid (Atago Co. Ltd., Tokyo, Japan). Prior to obtaining measurements, the instrument was calibrated by adjusting the compensator dial.

2.2.5. Heavy metal contents

The concentrations of heavy metals were determined through inductively coupled plasma-mass spectrometry (ICP-MS) using a 7500 ce instrument (Agilent Technologies, California, USA), following the methodology outlined in our prior report with some modifications [68]. Each sample, weighing approximately 0.3 g, underwent digestion by adding 7.0 mL of a 60% v/v nitric acid solution for 45 min using a microwave digester (Model ETHOS ONE, Milestone Corporation, Sorisole, Italy). The resulting digestate was then diluted with ultrapure water (ASTM type I, 18.3 MΩ x cm resistivity) before analysis by ICP-MS.

2.2.6. Microbial contamination

The assessment of microbial contamination included analyzing the total aerobic microbial count (TAMC), the total combined yeasts and molds count (TYMC), and the specific presence of Staphylococcus aureus, Pseudomonas aeruginosa, Clostridium spp., and Candida albicans in the samples. Enumeration tests for all samples followed the guidelines outlined in 〈61〉 Microbiological examination of nonsterile products: Microbial enumeration tests, as per the United States Pharmacopoeia 43 and National Formulary 38 (USP 43-NF 38) [69].

2.3. Formulation and evaluation of emulsion containing ostrich oil

2.3.1. Formulation of emulsion

For the preparation of O/W emulsions, the conventional method involves introducing the oil phase to the aqueous phase. In this study, we chose to employ the phase inversion technique, wherein the aqueous phase is added to the oil phase. This choice was motivated by reports indicating that emulsions formed using this technique contain a finely dispersed internal phase, contributing to their stability [70]. The research aimed to investigate the effects of ostrich oil and lecithin concentrations on the physicochemical properties of emulsions. Consequently, we examined the impact of ostrich oil concentrations ranging from 5% w/w to 30% w/w and lecithin concentrations ranging from 1% w/w to 15% w/w to determine the stable O/W emulsion with the maximum ostrich oil concentration. Table 1 presents formulations of 10% w/w ostrich oil emulsions stabilized with lecithin concentrations ranging from 1% w/w to 15% w/w, while Table 2 showcases formulations of 5% w/w to 30% w/w ostrich oil emulsions stabilized with 10% w/w lecithin.
Using lecithin as an emulsifier, the phase inversion process resulted in the dispersion of ostrich oil droplets within a continuous aqueous phase. The ostrich oil was blended with lecithin at 50 °C using a magnetic hotplate stirrer (C-MAG HS 4 IKA, IKA-Werke GmbH & CO. KG, Staufen, Germany). Distilled water, heated to 50 °C, was consistently added to the oil phase. Subsequently, the emulsion was homogenized by stirring with a magnetic hotplate stirrer at 50 °C. The determination of the emulsion type was accomplished through a dye solubility test. Finally, the physicochemical properties of all prepared emulsions were evaluated.

2.3.2. Evaluation of emulsion

Microscopic examination

The morphology of oil droplets was examined using an Olympus optical microscope (CX41RF, Olympus Corporation, Tokyo, Japan). To achieve an optimal concentration, the emulsion was appropriately diluted with distilled water. The diluted sample was then placed on a glass slide and covered with a cover slip for observation of the oil droplet morphology.
For the dye solubility test, the emulsion was mixed with a water-soluble dye (amaranth) and observed under the microscope to determine whether the dye dissolved in the aqueous phase or remained in the oil phase.

Physical characteristics

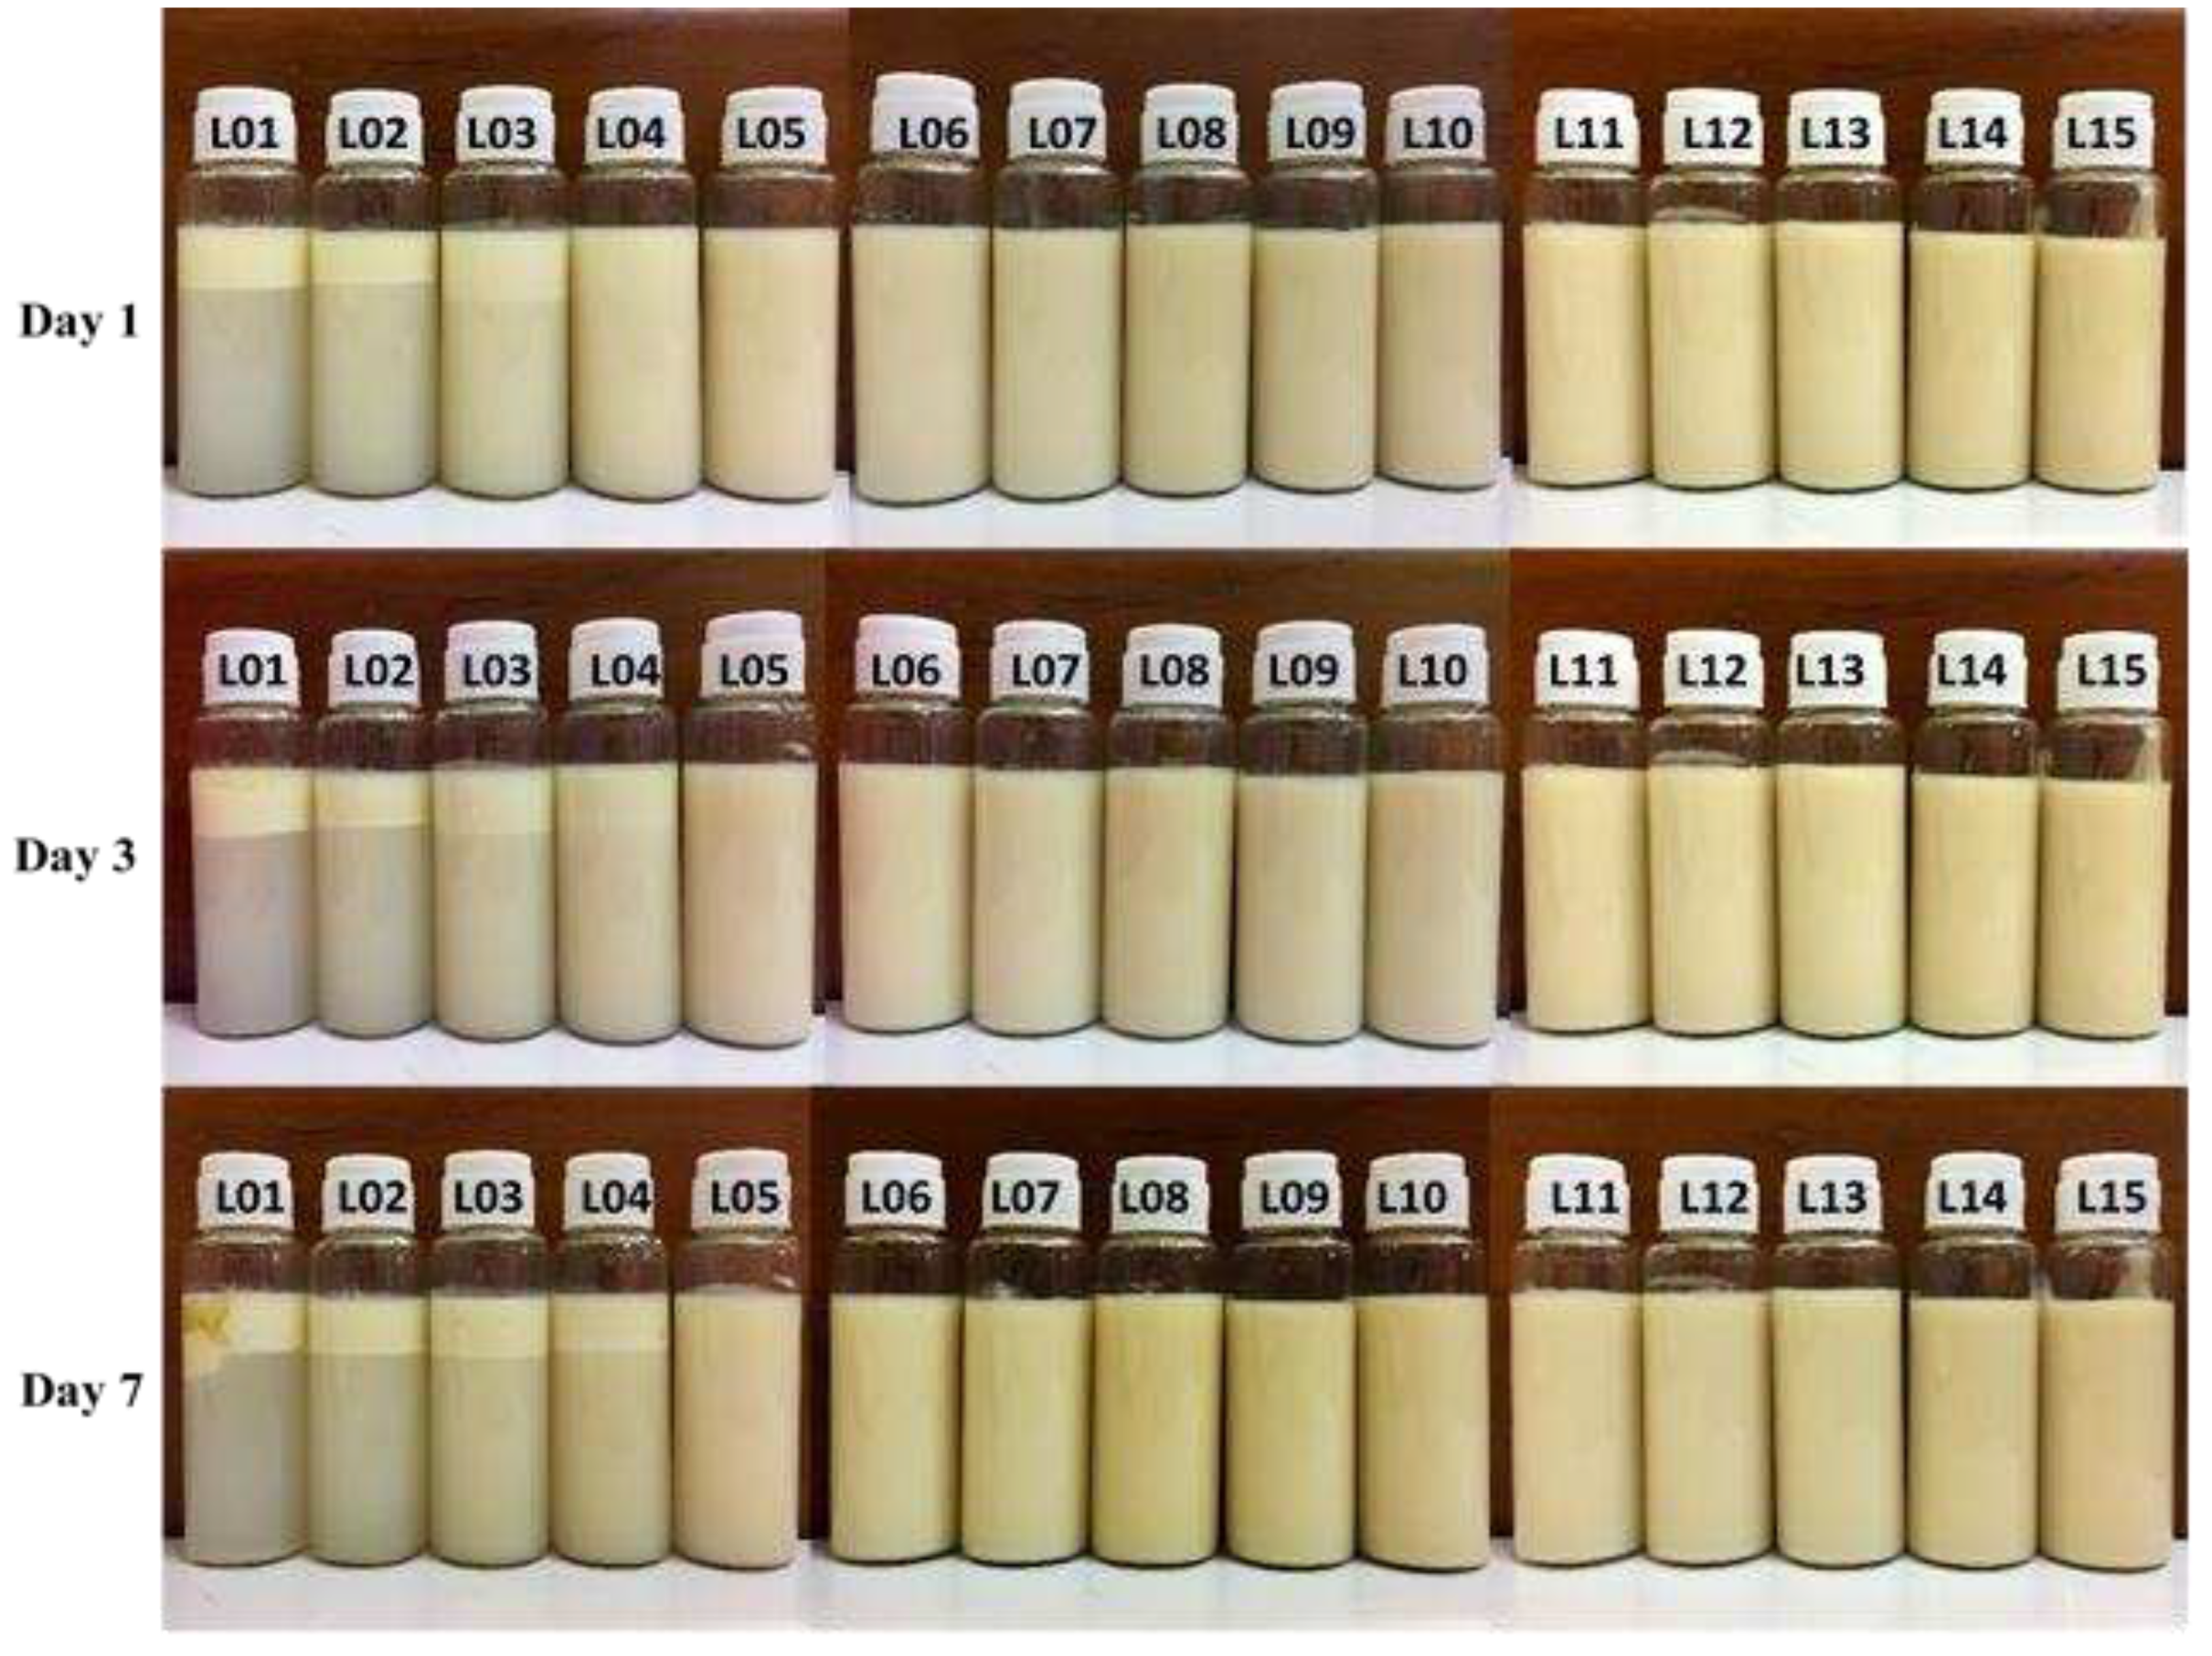
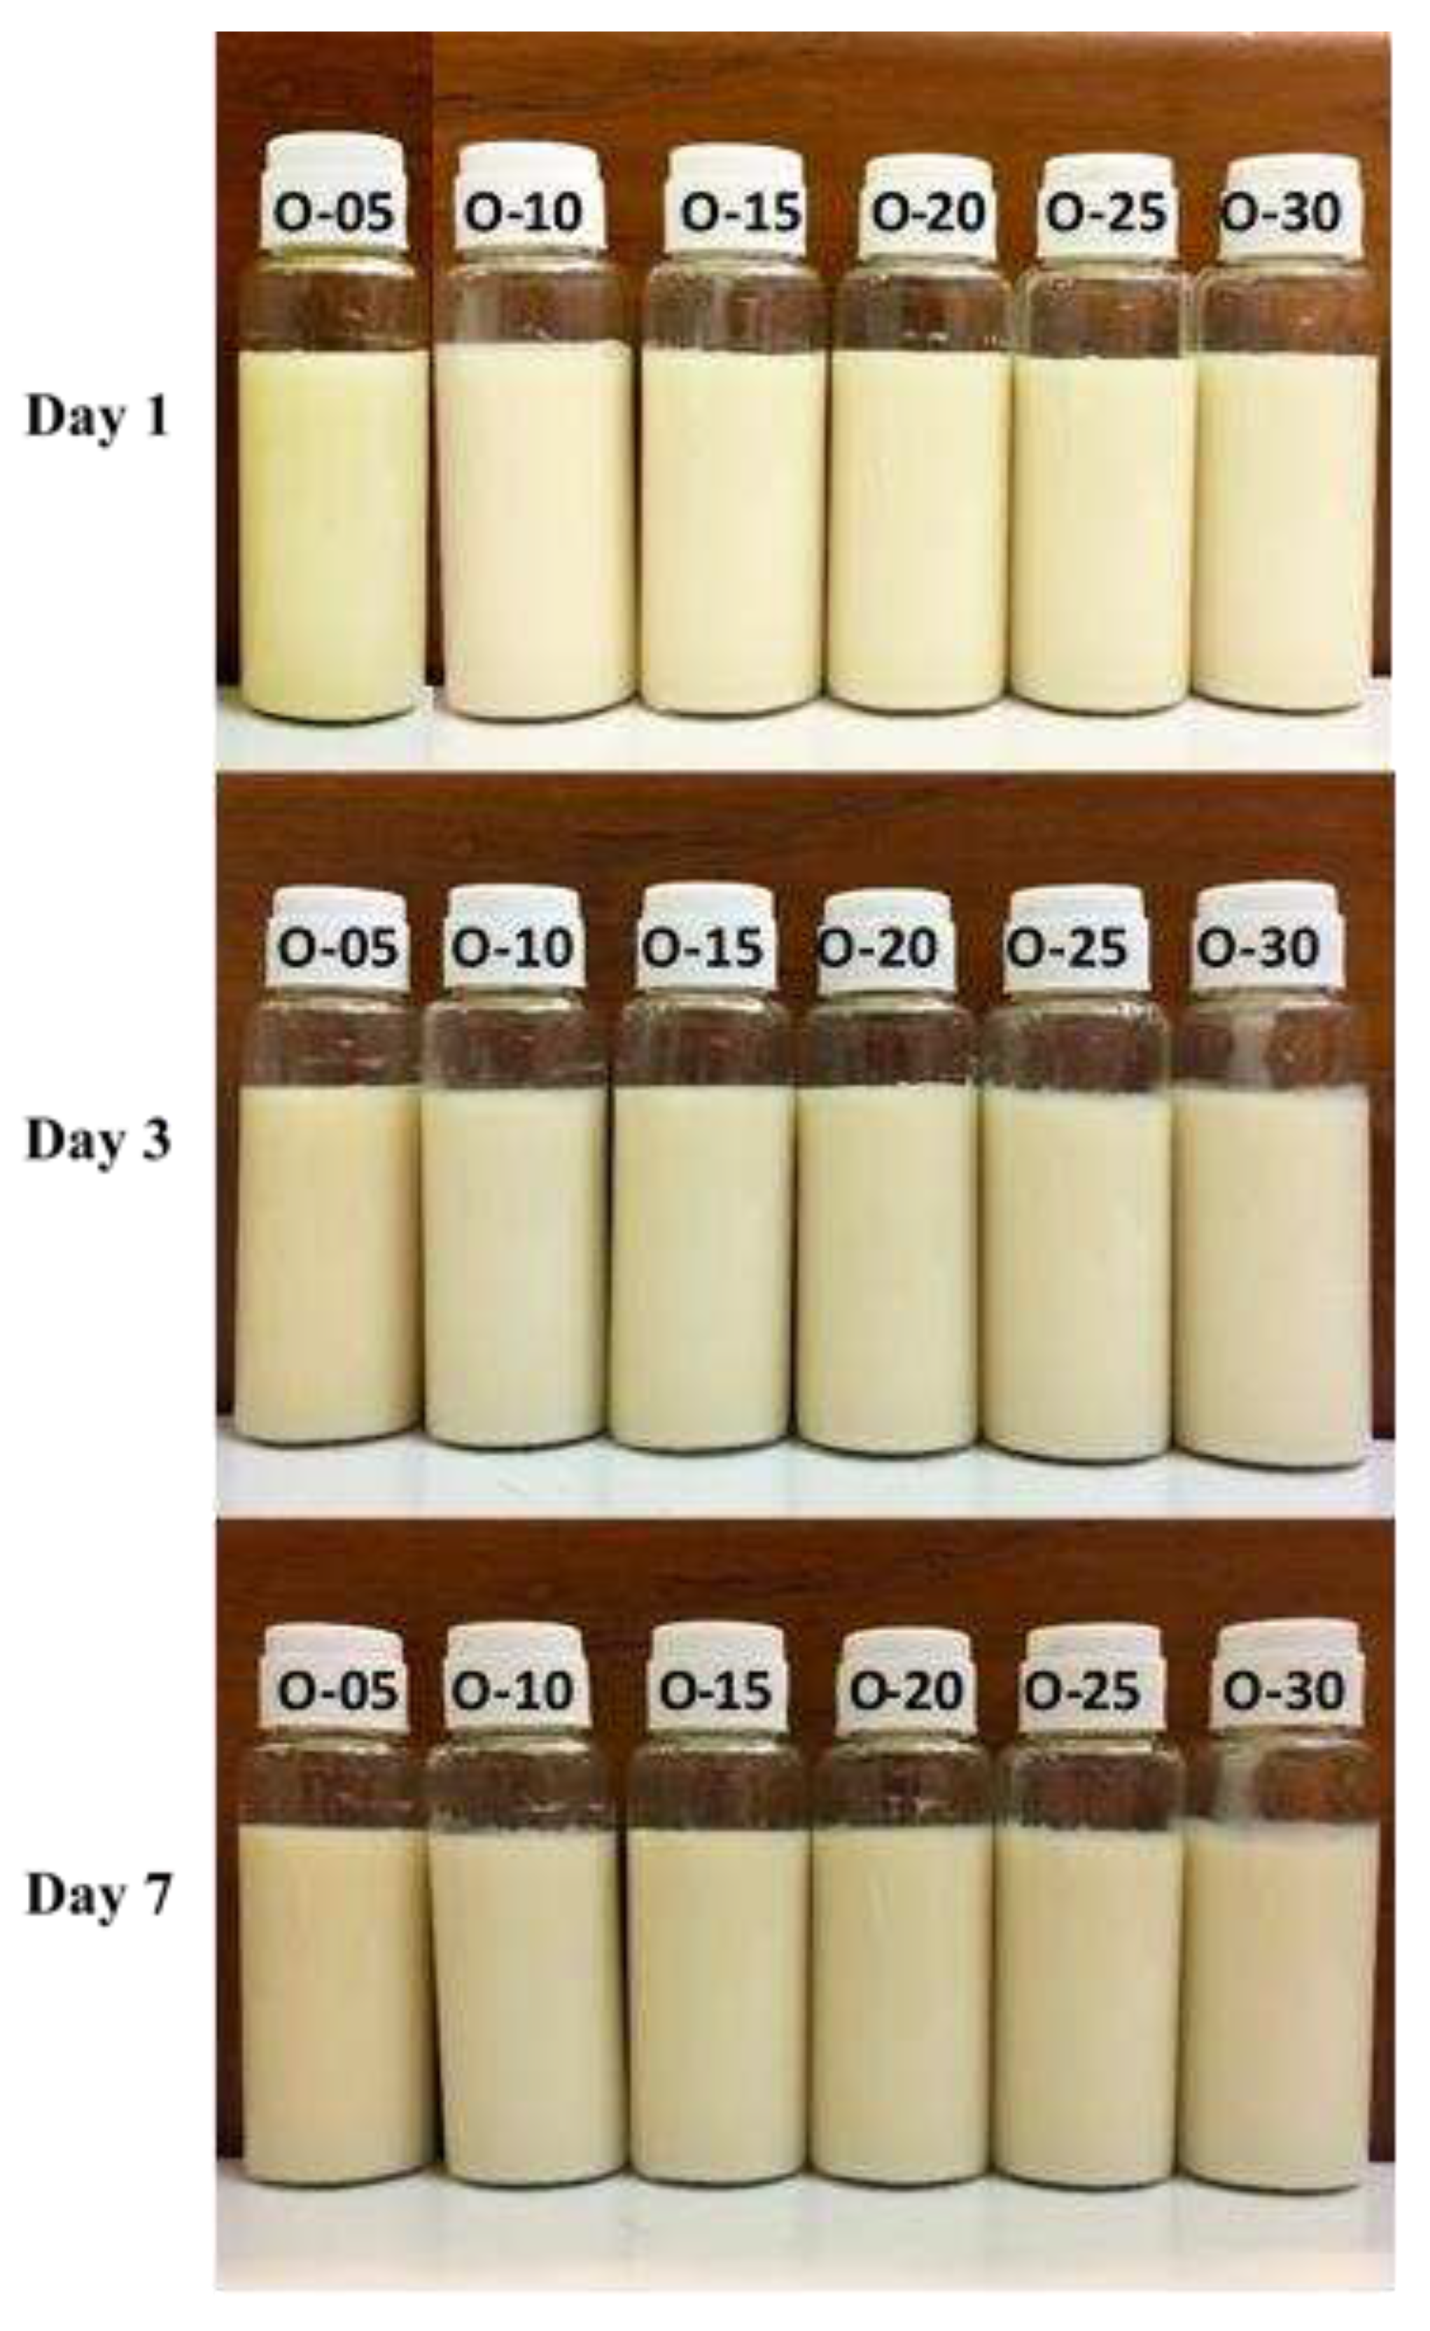
The physical characteristics, including color and appearance, as well as the creaming indices of the emulsions, were assessed through visual observation on days 1, 3, and 7 after preparation. The creaming index (CI) was calculated using Equation (1), where "S" represents the height of the serum layer, and "T" denotes the total height of the emulsion.
%   Creaming   index   = S T   x   100

Droplet size

The size of oil droplets in the emulsion was determined using a laser scattering particle size distribution analyzer (LA950, Horiba Ltd., Kyoto, Japan). The sample was appropriately diluted with distilled water to achieve an optimal concentration. The median diameter, representing the cumulative particle diameter equivalent to 50%, was recorded for each sample. All measurements were conducted in triplicate.

Zeta potential value

The zeta potential of the emulsion droplets was measured with a zeta potential analyzer (ZetaPlus, Brookhaven Instruments Corporation, New York, USA). Prior to analysis, the emulsion was diluted to an optimal concentration with distilled water. The average and standard deviation of measurements were recorded in triplicate for each sample.

Viscosity

The viscosity of each emulsion was tracked using a Brookfield DV-III Ultra Programmable Rheometer (RVDV-III Ultra, Brookfield Engineering Laboratories, Inc., Massachusetts, USA) equipped with a spindle CPE-51 or CPE-40. All measurements were conducted at 25 °C and performed in triplicate.

2.4. Fabrication and evaluation of dry emulsions containing ostrich oil

2.4.1. Fabrication of dry emulsions

For the formulation of dry emulsions, we specifically chose a liquid O/W emulsion that includes ostrich oil and possesses the most suitable properties. Employing the modified adsorption technique [37], dry emulsions were meticulously prepared. The influence of different adsorbent types, such as Avicel® PH-101 and Aerosil® 200, on the properties of the dry emulsions was systematically evaluated. Each liquid O/W emulsion, containing ostrich oil, was individually mixed with every adsorbent using a planetary mixer until it reached an almost dry state. The resulting adsorbed emulsion was then sieved through a number 18 sieve and dried using a hot air oven at 50 °C for 6 h. Following the drying process, each obtained dry emulsion underwent another sieving stage through a number 20 sieve, and their respective properties were thoroughly assessed. Ultimately, the optimal dry emulsion was loaded into hard shell capsules (capsule number 0) using a capsule filling machine (Yeo Heng Co. Ltd., Pathum Thani, Thailand).

2.4.2. Evaluation of dry emulsions

Physical characteristics

The physical characteristics, such as appearance and color, of the dry emulsions were assessed in triplicate through visual observation and measured using a colorimeter (FRU WF32, SciLution, Shenzhen, China).

Percentage of moisture

Each dry emulsion was precisely weighed to approximately 1.0 g and then analyzed using a Sartorius moisture analyzer (Mettler-Toledo International, Inc., Göttingen, Germany). All measurements were carried out in triplicate for accuracy.

Percentage of weight loss after oil release

The dry emulsion, precisely weighed at 5.0 g, was introduced into a test tube. Subsequently, the dry emulsion was reconstituted with distilled water to the same volume as the initial liquid emulsion, followed by vortexing at a consistent time and speed. The resulting mixture underwent centrifugation using a Universal 320R centrifuge machine (Hettich, North Rhine-Westphalia, Germany) at 6,000 rpm for 5 min to separate the sediment from the supernatant. The sediment was subsequently oven-dried at 50 °C overnight until a constant weight was achieved. The percentage of weight loss was determined using Equation (2):
%   weight   loss = ( Initial   weight   Remaining   weight ) Initial   weight   × 100
This method provides insight into the dry emulsion’s oil release characteristics, and the calculated percentage reflects the extent of weight loss due to the separation of oil from the dry emulsion.

Microbial contamination

The investigation focused on microbial contamination, encompassing TAMC, TYMC, as well as the specific presence of Salmonella spp. and Escherichia coli in a 10 g dry emulsion sample. The determination of these contaminants was conducted using the spread plate technique, following the guidelines outlined in USP 43-NF 38 [69].

Heavy metal contamination

The concentrations of heavy metals in dry emulsions were assessed using ICP-MS, as detailed in Section 2.2.5. Heavy metal contents.

Particle size analysis

The particle sizes of dry emulsion granules were measured (n=3) using an analytical sieve shaker (US standard sieve set, Retsch, West Germany). A granule sample (50 g) was placed on top of the sieve machine and shaken for 5 min. The granules remaining on each sieve in the stack were weighed, and the average particle size was calculated.
Additionally, dry emulsions were individually redispersed in distilled water. The size of oil droplets in the liquid emulsion was determined using a laser scattering particle size distribution analyzer (LA950, Horiba Ltd., Kyoto, Japan).

Compressibility index

Based on 〈616〉 Bulk density and tapped density of powders, USP 43-NF 38 [71], a compressibility test was employed to anticipate granule flow characteristics. A granule sample (30 g) was deposited into a 100-mL cylinder and manually tapped 50 times from a height of 10 cm. The compressibility index was then calculated using Equation (3).
%   compressibility   = ( Tapped   density   Bulk   density ) Tapped   density   × 100
The tapped density represents the unsettled apparent volume, and bulk density is the final tapped volume. Bulk density and tapped density were determined by dividing the mass (g) by the respective volumes (mL) of granules in the cylinder before and after tapping.

Particle morphology

The particle morphology of dry emulsions was assessed using a scanning electron microscopy-energy dispersive X-ray spectrometer (SEM-EDS Mira3, TESCAN Brno s. r. o., Brno, Czech Republic). The granule sample was affixed to a metallic specimen (stub) and subsequently metallized (sputtered) with a thin layer of gold/palladium using a coater. Following metallization, the sample was then examined.

Disintegration

After loading dry emulsions into hard shell capsules (capsule number 0) with a capsule filling machine (Yeo Heng Co. Ltd., Pathum Thani, Thailand), the disintegration of the capsules was determined using a disintegration testing apparatus (Apparatus B basket-rack assembly, Erweka GmbH, Heusenstamm, Germany) following the test method outlined in 〈701〉 Disintegration, USP 43-NF 38 [72]. The capsule samples were placed in the baskets and immersed in chambers containing 0.05 M acetate buffer as the immersion fluid. The temperature was maintained at 37 ± 2 °C, and a device raised and lowered the basket in the immersion fluid at a rate of 29-32 cycles/min. The disintegration time of each capsule was recorded when visually observed to be completely disintegrated. All experiments were conducted (n = 6), and the mean and standard deviation were calculated.

2.5. Stability

2.5.1. Stability under temperature cycling

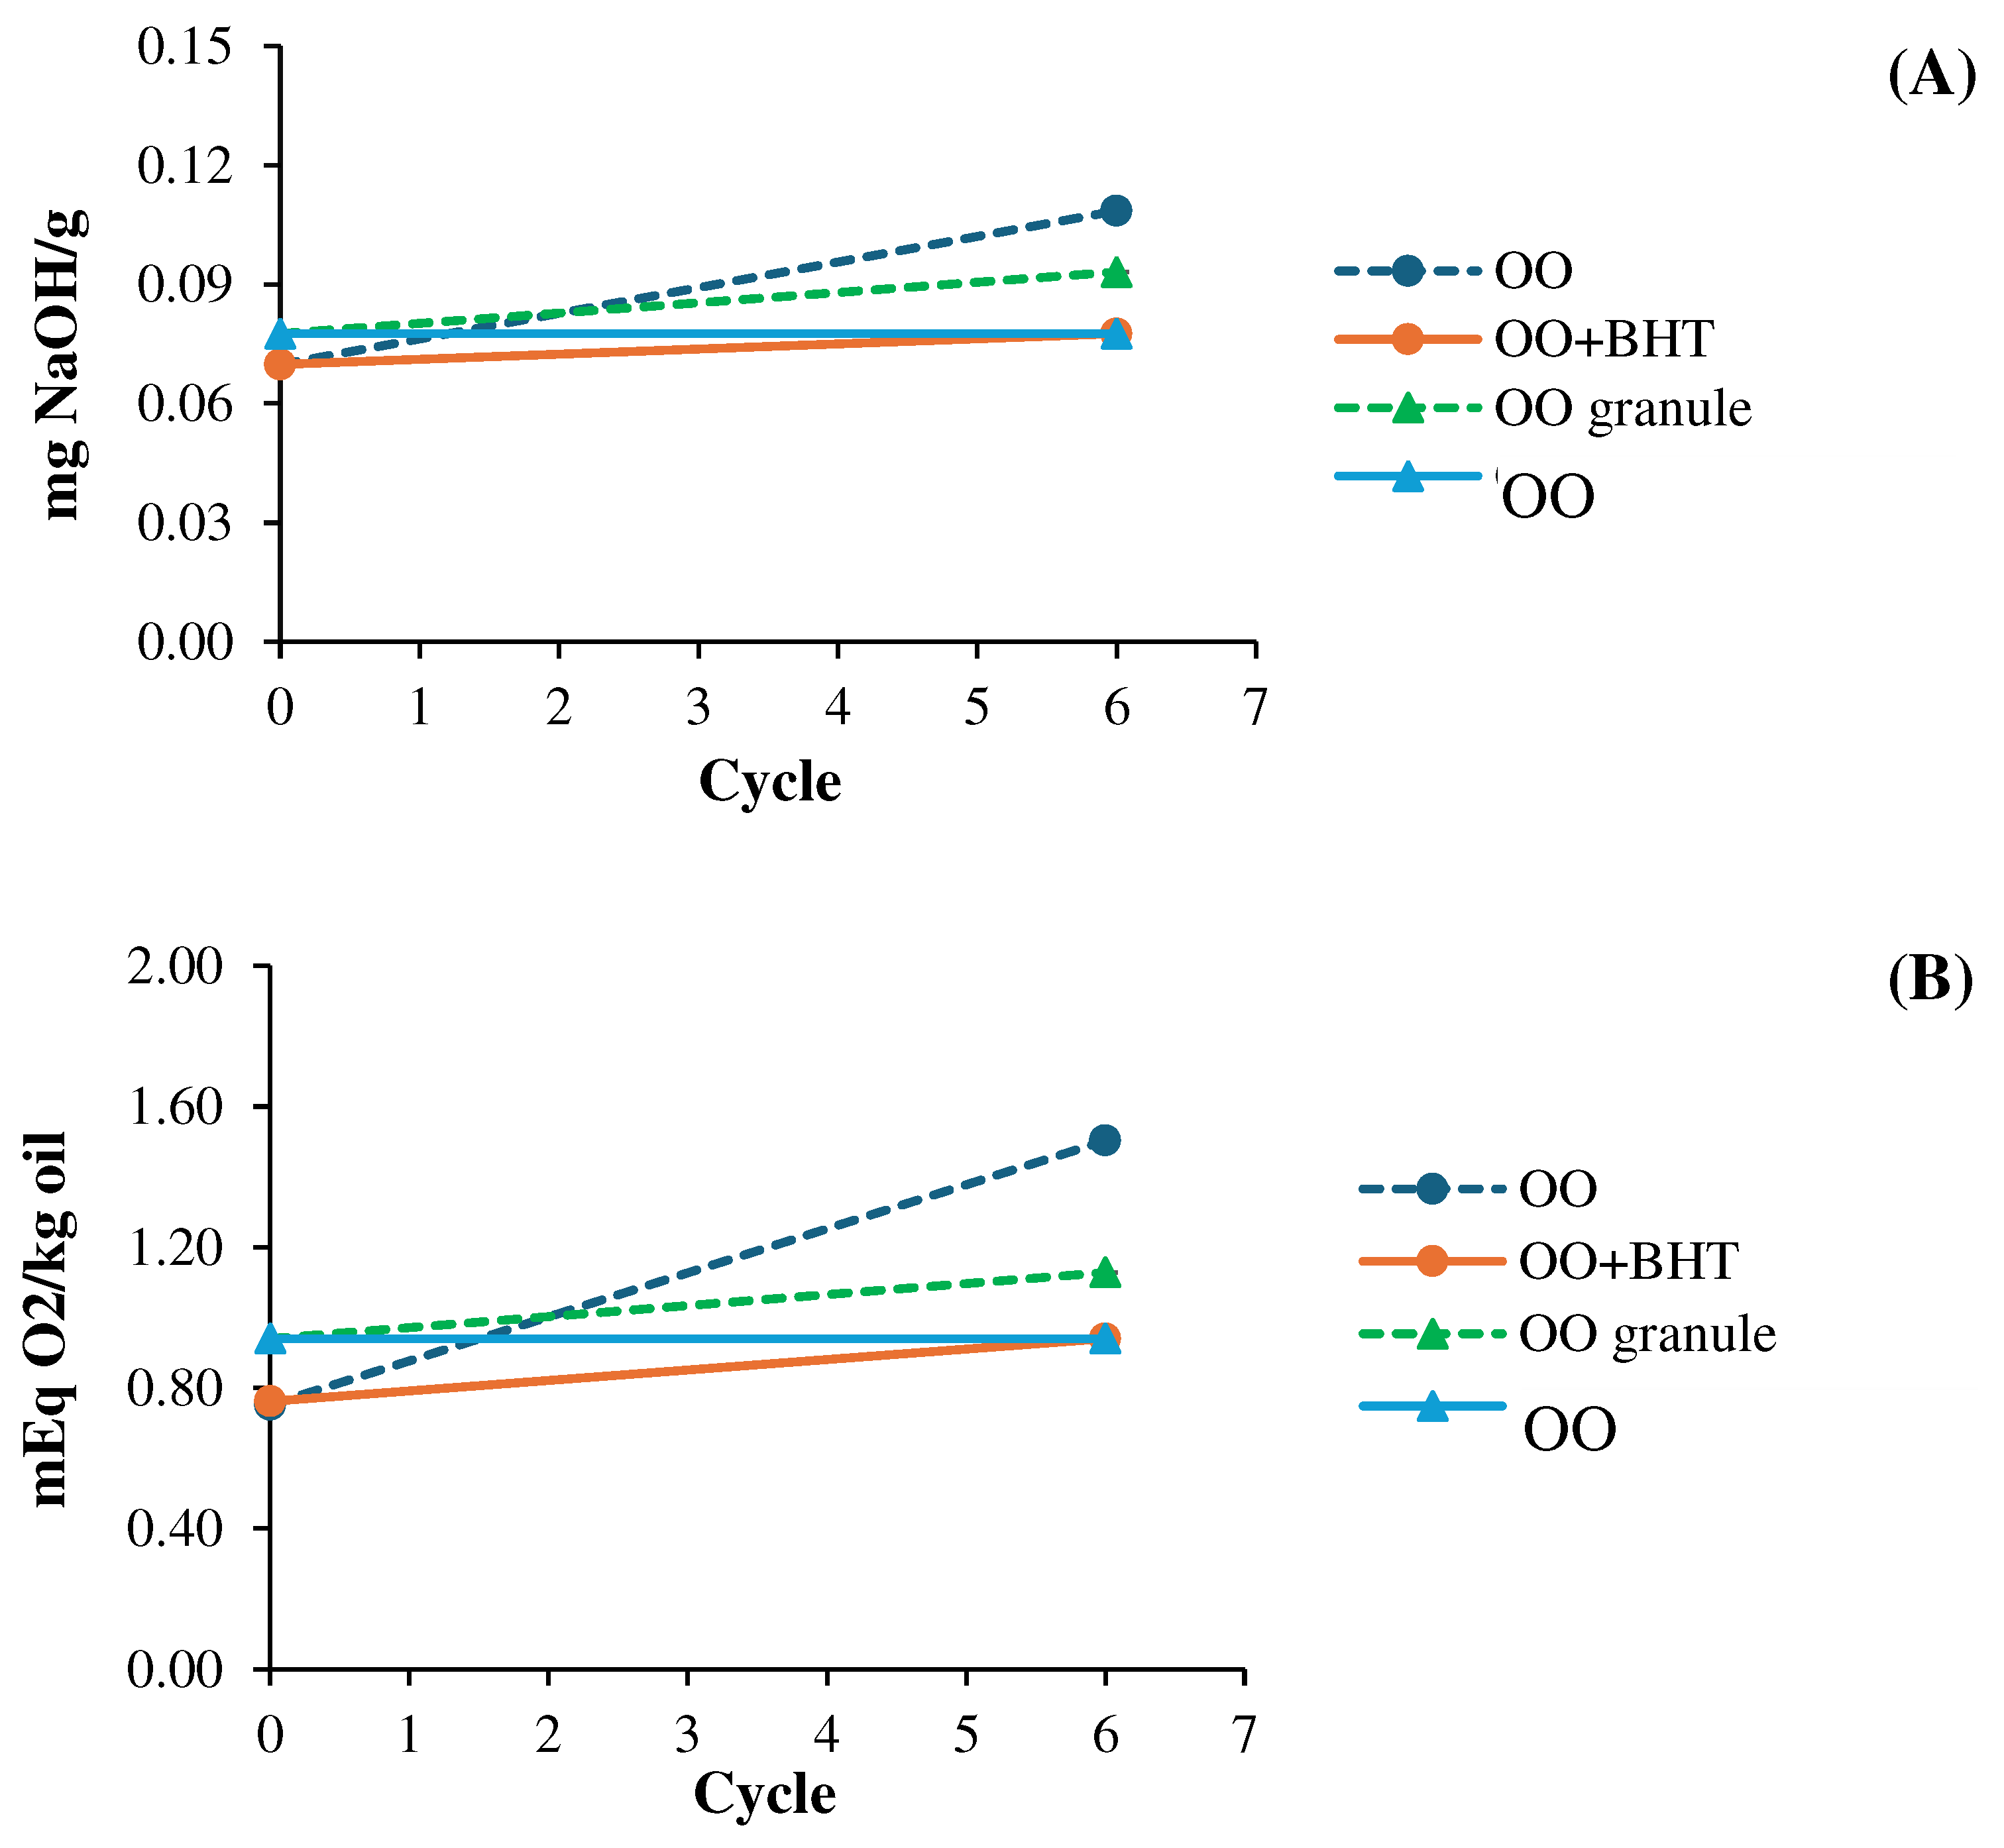
Amber bottles, each containing samples and sealed hermetically, underwent a stability assessment with a cycle of 24 h in a freezer at 4 ± 0.1 °C, followed by 24 h at 45 ± 0.1 °C and 75 ± 2% relative humidity (RH). The physicochemical properties were evaluated after six cycles of temperature cycling.

2.5.2. Stability under storage at various temperatures

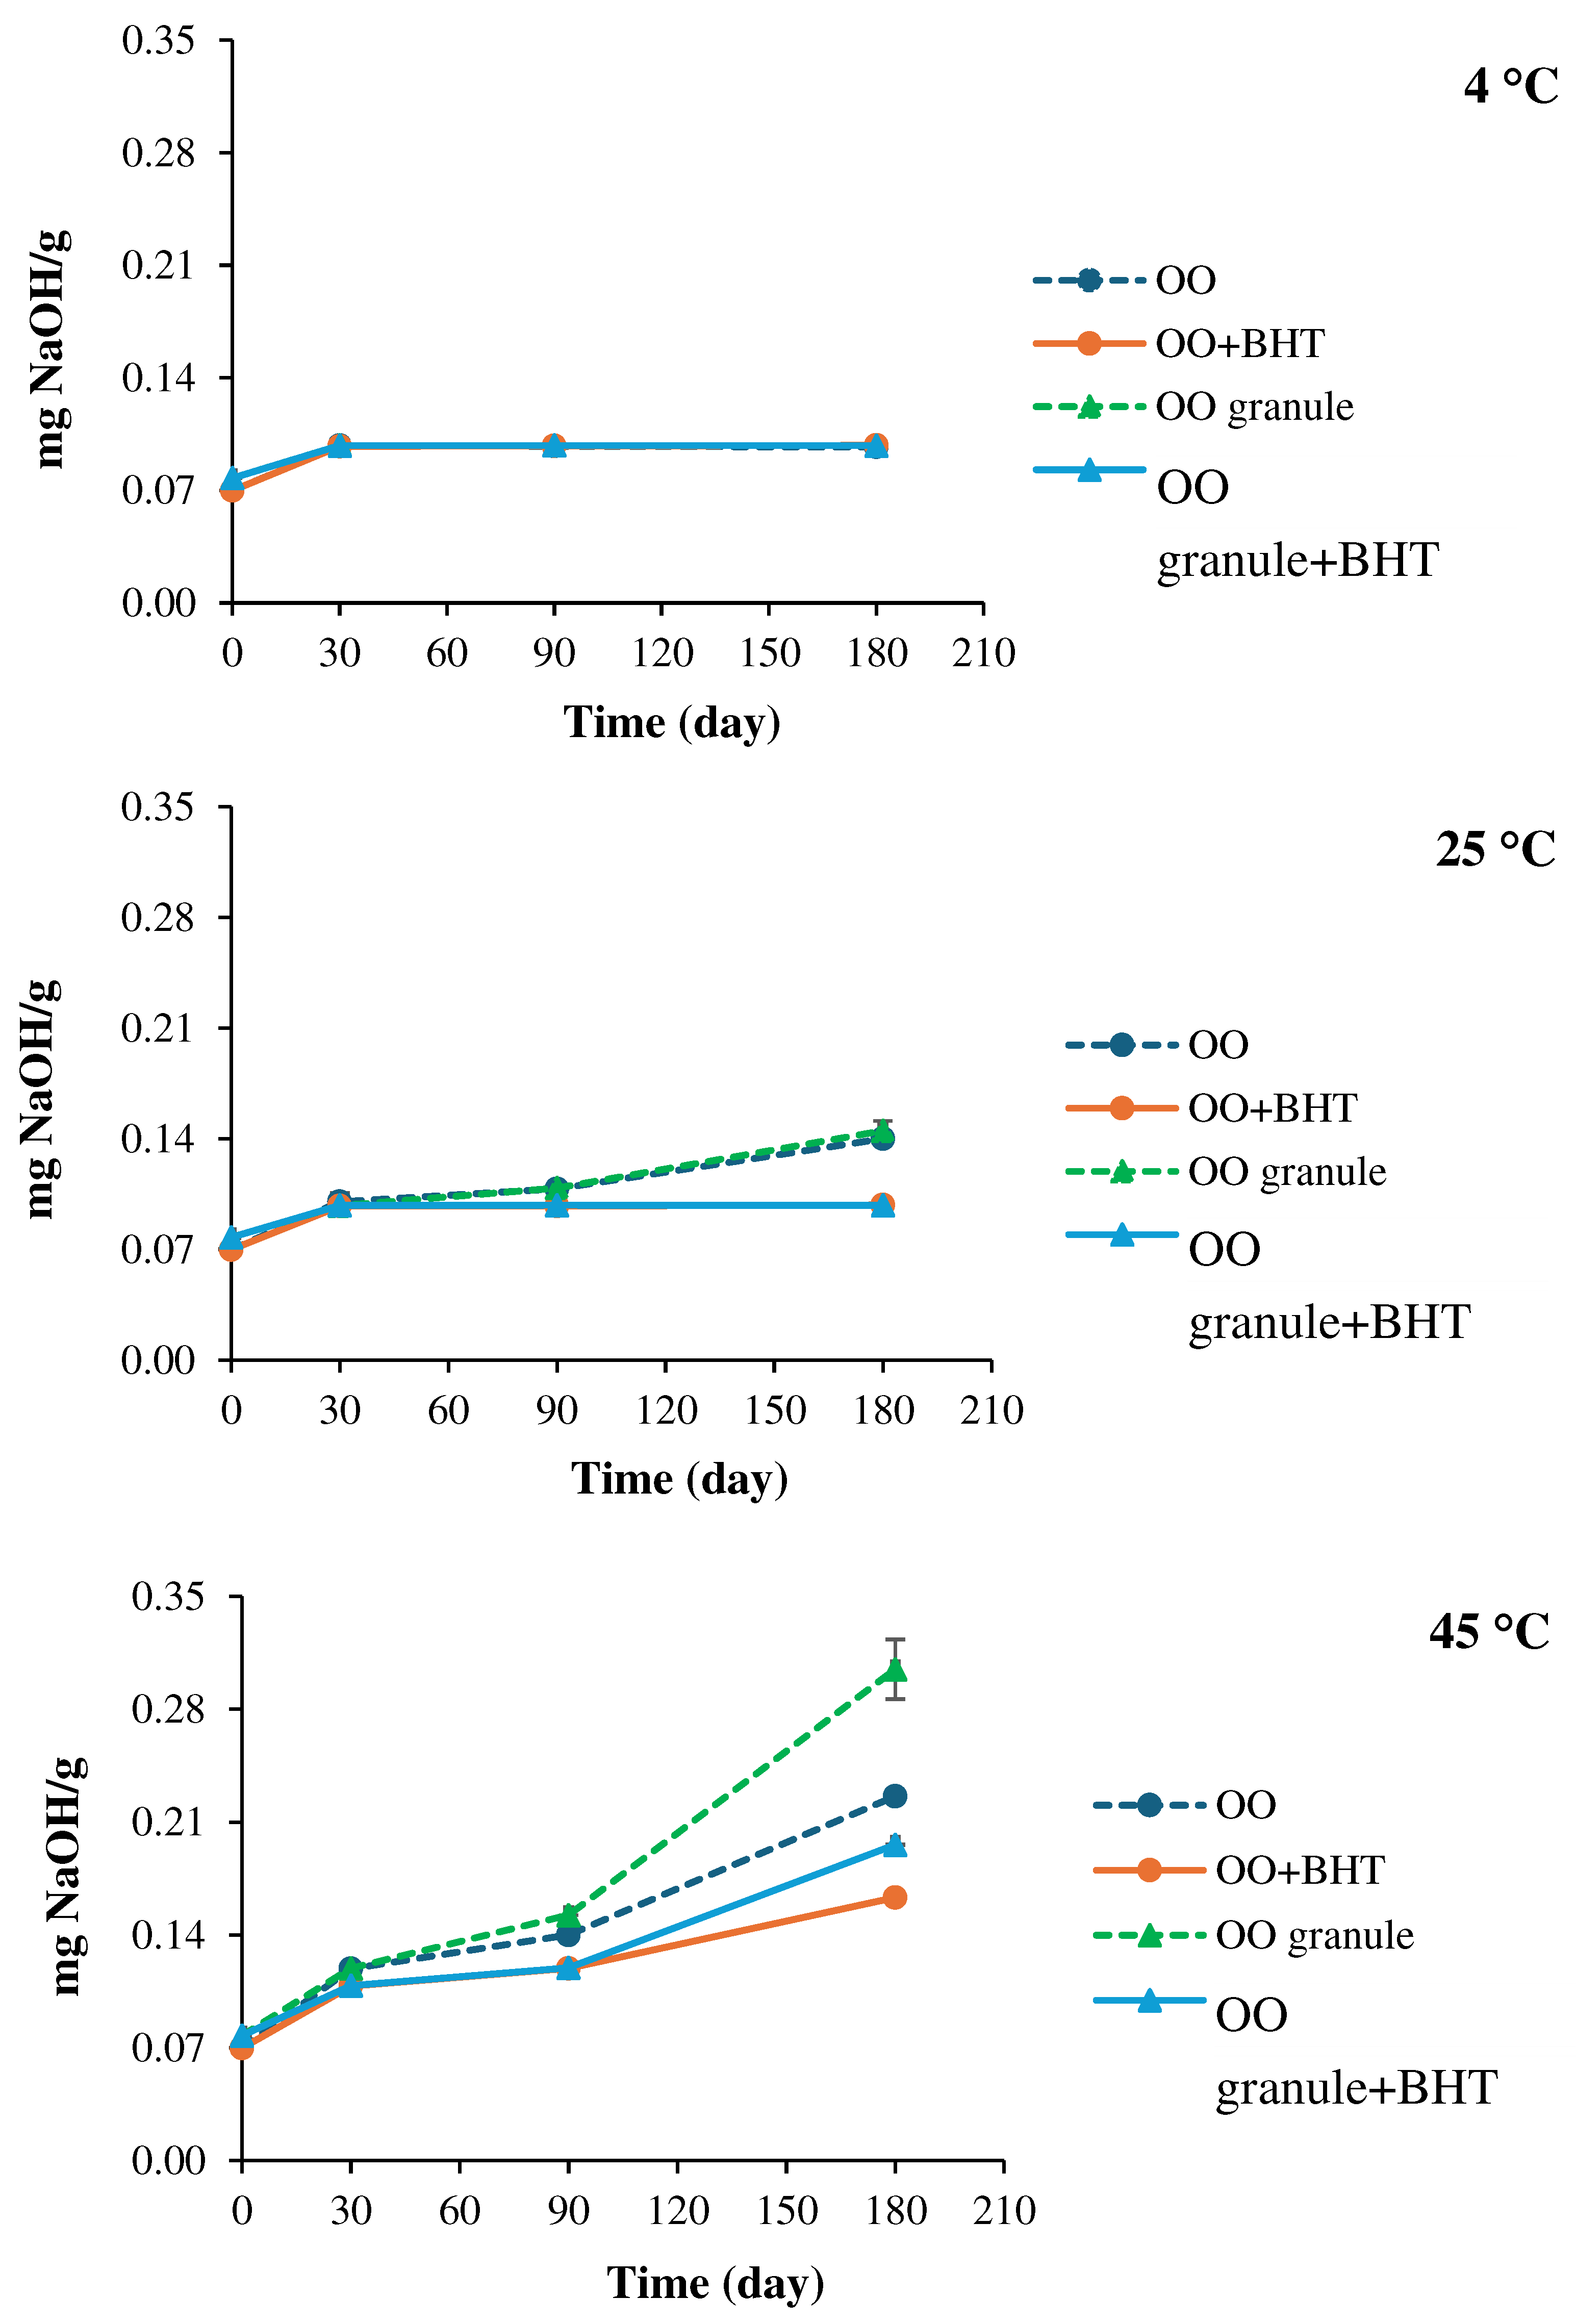
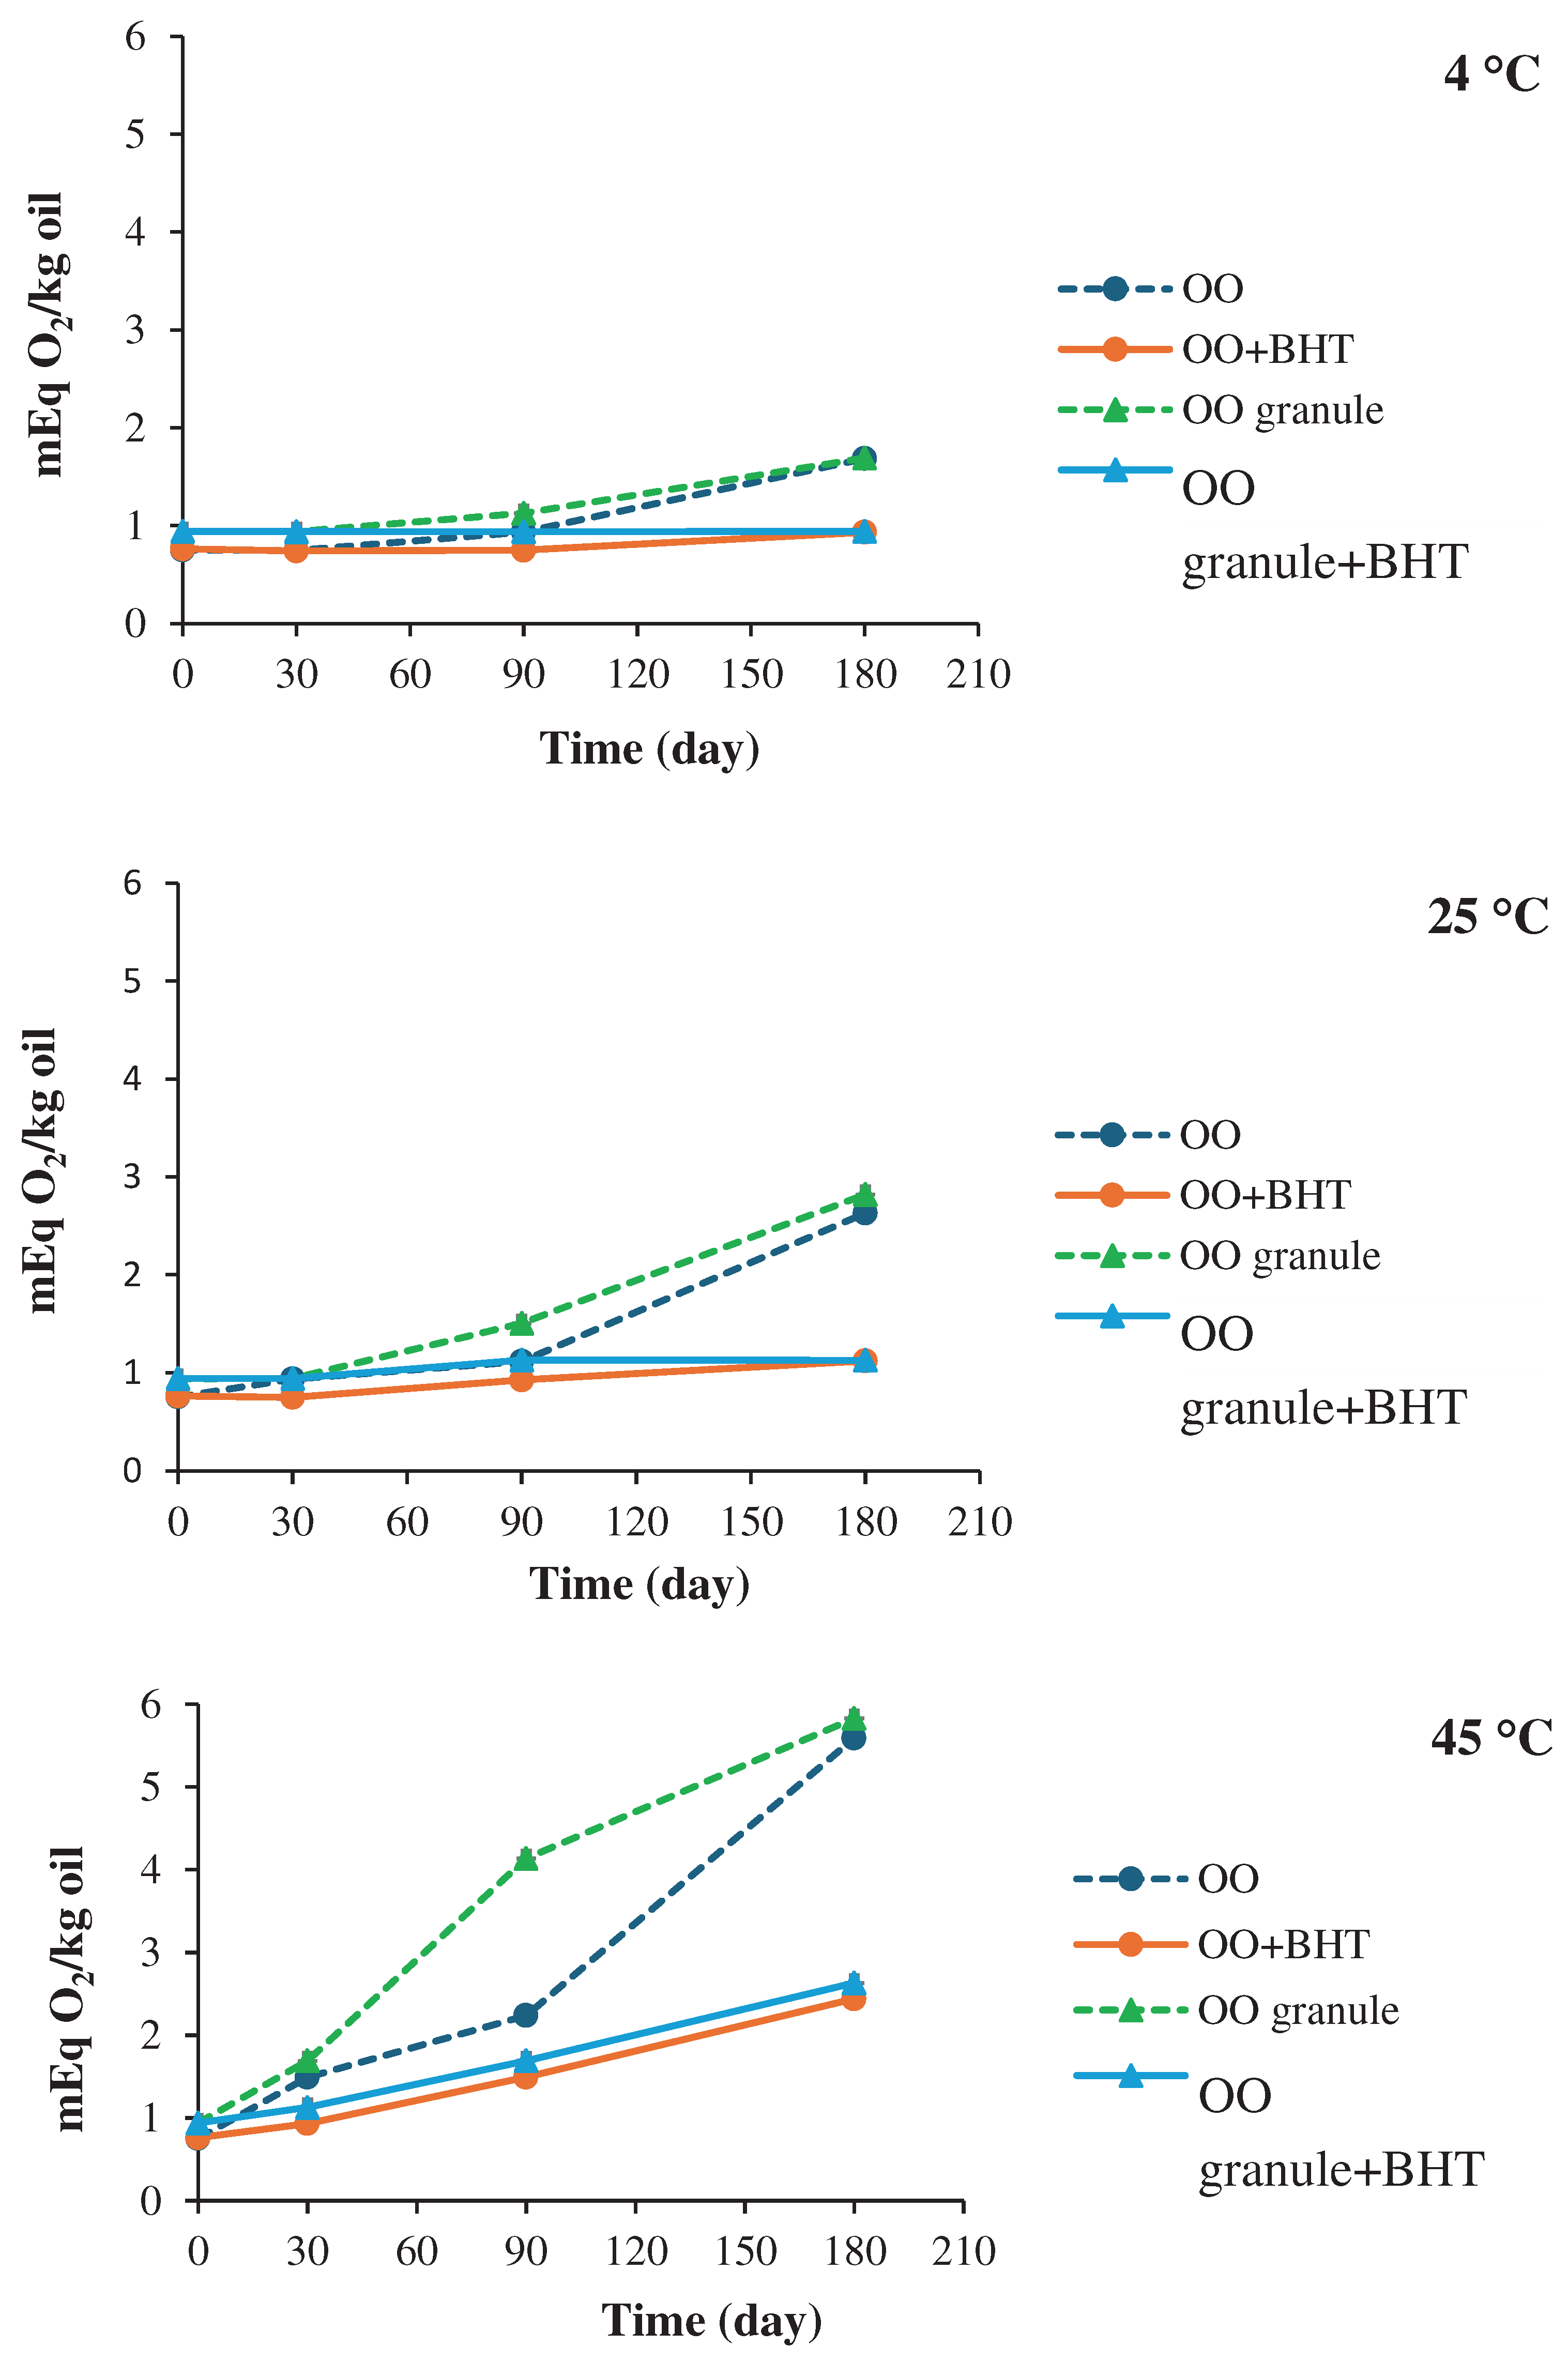
The sample was divided into three portions, each placed in amber bottles and sealed hermetically. These bottles were then stored at different temperatures: 4 ± 0.1 °C, 25 ± 0.1 °C, and 45 ± 0.1 °C at 75 ± 2% RH. Physicochemical properties were assessed through triplicate measurements after 1, 3, and 6 months of storage.

2.6. Statistical analysis

The data underwent statistical analysis employing the t-test and one-way analysis of variance (ANOVA) within version 16 of the SPSS program, based on triplicate measurements. Statistically significant results were considered for p-values less than 0.05.

3. Results

3.1. Preparation and evaluation of ostrich oil

The yield of ostrich oil obtained from the low-temperature rendering method was 66.7%. The AV, PV, IV, and SV values were 0.1 ± 0.0 mg KOH/g of oil, 2.5 ± 0.1 mEq O2/kg of oil, 30.9 ± 1.0 g I2/100 g of oil, and 195.8 ± 3.9 mg KOH/g of oil, respectively. These values fall within the permissible limits set by the Codex Standard for Named Animal Fats (CODEX-STAN 211-1999), the Food and Agriculture Organization of the United Nations and the World Health Organization (FAO/WHO) [73], which are 2.0 mg KOH/g of oil, 10 mEq O2/kg of oil, 36-47 g I2/100 g of oil, and 190-200 mg KOH/g of oil. The RI of the resulting ostrich oil was 1.4560 ± 0.0000 at 30 °C, closely aligning with the permissible limit (1.448-1.460). This similarity underscores the purity and authenticity of the ostrich oil sample.
The results of ICP-MS revealed that the contents of arsenic (As) and iron (Fe) in the ostrich oil sample were 0.002 ± 0.001 mg/kg and 0.803 ± 0.148 mg/kg, respectively, falling within the permissible limits of 0.1 mg/kg and 1.5 mg/kg. Additionally, levels of copper (Cu) and lead (Pb) were undetected, meeting the allowable limits of 0.4 mg/kg and 0.1 mg/kg, as specified by the CODEX-STAN 211-1999, FAO/WHO [73]. The microbial limit test showed the absence of both TAMC and TYMC in the oil sample. Investigation into pathogens, including S. aureus, P. aeruginosa, Clostridium spp., and C. albicans, did not detect contamination in 1 g of any sample. These results signify that the prepared ostrich oil was of exceptional quality and deemed safe for human consumption.
The fatty acid composition of ostrich oil was analyzed using the GC-FID technique. The results indicated that the three most abundant fatty acids in ostrich oil were omega-9 (34.60 ± 0.01%), palmitic acid (28.42 ± 0.05%), and omega-6 (27.73 ± 0.01%), followed by stearic acid (5.07 ± 0.05%), omega-3 (3.02 ± 0.00%), myristic acid (0.93 ± 0.01%), and lauric acid (0.23 ± 0.01%). Evaluating the nutritional value of fats for human consumption commonly involves assessing the ratio of polyunsaturated fatty acids (PUFAs) to saturated fatty acids (SFAs). As per nutritional guidelines, the recommended PUFA/SFA ratio in the human diet should exceed 0.45 [74]. The oil sample’s PUFA/SFA ratio of 0.89 adheres to this nutritional recommendation.
The IC50 values, representing the efficiency of DPPH radical scavenging and copper-chelating activity of ostrich oil, were determined to be 39.92 ± 1.51 mg/mL and 23.15 ± 0.12 mg/mL, respectively. In comparison, Trolox demonstrated significantly lower IC50 values of 0.0043 ± 0.0001 mg/mL for DPPH radical scavenging, highlighting its superior antioxidant activity. Similarly, EDTA exhibited a markedly lower IC50 value of 1.0801 ± 0.0002 mg/mL for copper-chelating activity. These findings underscore the notable antioxidant and metal-chelating potential of ostrich oil, positioning it as a promising natural source for health-promoting compounds.
The thorough examination of the prepared ostrich oil, encompassing assessments of physicochemical properties, heavy metal contents, microbial contamination, antioxidant activities, and fatty acid composition, in conjunction with its favorable PUFA/SFA ratio of 0.89, affirms its appropriateness for inclusion in dietary supplement formulations.

3.2. Formulation and evaluation of emulsion containing ostrich oil

3.2.1. Formulation of emulsion

The phase inversion technique, a method employed in the preparation of emulsions, particularly O/W and W/O emulsions, was implemented. In the context of O/W emulsions, this technique involves a reversal in the order of addition of the oil and water phases during emulsion formation. Conventionally, the oil phase is introduced into the aqueous phase, but with the phase inversion technique, the order is reversed: the aqueous phase is added to the oil phase. This inversion leads to the formation of stable O/W emulsions with smaller droplet sizes and enhanced stability. The technique involves creating a fine dispersion of the oil phase in the aqueous phase, resulting in emulsions characterized by a finely dispersed internal phase and improved stability. The phase inversion technique is particularly useful when fine emulsions are desired or specific characteristics, such as stability, are critical for the application or formulation [70]. It can be influenced by various factors, including the choice of emulsifiers, the composition of the oil and water phases, and the specific methods employed during the emulsification process. This technique is often associated with emulsions having a low hydrophilic-lipophilic balance (HLB) value. Emulsifiers with low HLB values, being more lipophilic, have a greater affinity for oil. In the context of O/W emulsions, low HLB emulsifiers are chosen to stabilize oil droplets in the water phase [75]. For such emulsions, the phase inversion technique involves adding the water phase to the oil phase, allowing the emulsifier to efficiently surround the oil droplets and form a stable emulsion [70].
Soy lecithin, derived from soybean oil, is widely employed as an emulsifier in formulating O/W emulsions for various compelling reasons. Its molecular structure, encompassing both hydrophilic and lipophilic components, allows effective interaction with both oil and water phases, facilitating the formation and stabilization of emulsions. Particularly noteworthy in the context of O/W emulsions is the preference for emulsifiers with lower HLB values, indicating increased lipophilicity and a greater affinity for the oil phase. Soy lecithin, characterized by a suitable low HLB, effectively stabilizes oil droplets within the water phase [75]. Furthermore, the readily accessible and versatile nature of soy lecithin makes it suitable for diverse applications in the food, pharmaceutical, and cosmetic industries. In food applications, soy lecithin contributes to improved texture, mouthfeel, and overall sensory qualities of the final product [76]. The safety profile of lecithin, with an acceptable daily intake (ADI) ranging from 4 to 71 mg/kg of body weight across all age groups [77], reinforces its position as a secure and health-promoting choice as an emulsifier
Therefore, in this study, a strategy was employed that combined soy lecithin with the phase inversion technique to achieve stable O/W emulsions with a finely dispersed internal phase. This approach capitalizes on the benefits of lecithin and the phase inversion technique, aiming for optimal stability and droplet size in the final emulsion.
The research aimed to investigate the impact of ostrich oil and lecithin concentrations on emulsion properties. Initially, 10% w/w ostrich oil emulsions were formulated with lecithin concentrations ranging from 1% w/w to 15% w/w (Table 1). Subsequently, formulations were developed using 5% w/w to 30% w/w ostrich oil stabilized with 10% w/w lecithin (Table 2). Finally, assessments were conducted on emulsion appearance, % CI, viscosity, droplet size, and zeta potential. The results revealed that the O/W emulsion containing 10% w/w ostrich oil and 10% w/w lecithin exhibited the most homogeneous emulsion (0.00% CI over a 7-day period, as shown in Table 1 and Table 2) with the smallest particle size (3.93 ± 0.11 µm). A lower % CI indicates a more stable emulsion [78].

3.2.2. Evaluation of emulsion

Visual observation and creaming indices

The emulsions, stabilized with lecithin, experienced a phase inversion from W/O to O/W by manipulating the volume ratio of the aqueous phase during the emulsion formulation [79]. In this investigation, amaranth, a water-soluble red dye, was used in a dye solubility test. Microscopic observation during this test revealed the dye’s dissolution in the aqueous phase, indicated by a distinct red appearance in the continuous phase, strongly suggesting the formation of O/W emulsions. The emulsification process utilized concentrations ranging from 1% w/w to 15% w/w lecithin and 5% w/w to 30% w/w ostrich oil (Table 1 and Table 2). Figure 2 and Figure 3 visually presented the physical characteristics of all emulsions, while Table 1 and Table 2 provided the % CI on days 1, 3, and 7.
The results demonstrated that 10% w/w ostrich oil emulsions remained stable with no phase separation when the concentration of lecithin was increased from 5% w/w to 15% w/w, as illustrated in Figure 2. Notably, all these emulsions consistently exhibited CI of 0.00% over the 7-day period, as detailed in Table 1. Additionally, emulsions consisting of 10% w/w lecithin and varying concentrations of ostrich oil (ranging from 5% w/w to 30% w/w) were also found to be stable with no phase separation, as indicated by Figure 3. These emulsions maintained a steady 0.00% CI over the 7-day observation period, as presented in Table 2. The findings underscore the importance of lecithin concentration in influencing the stability of ostrich oil emulsions, providing valuable insights into the formulation’s impact on emulsion behavior over time.

Viscosity

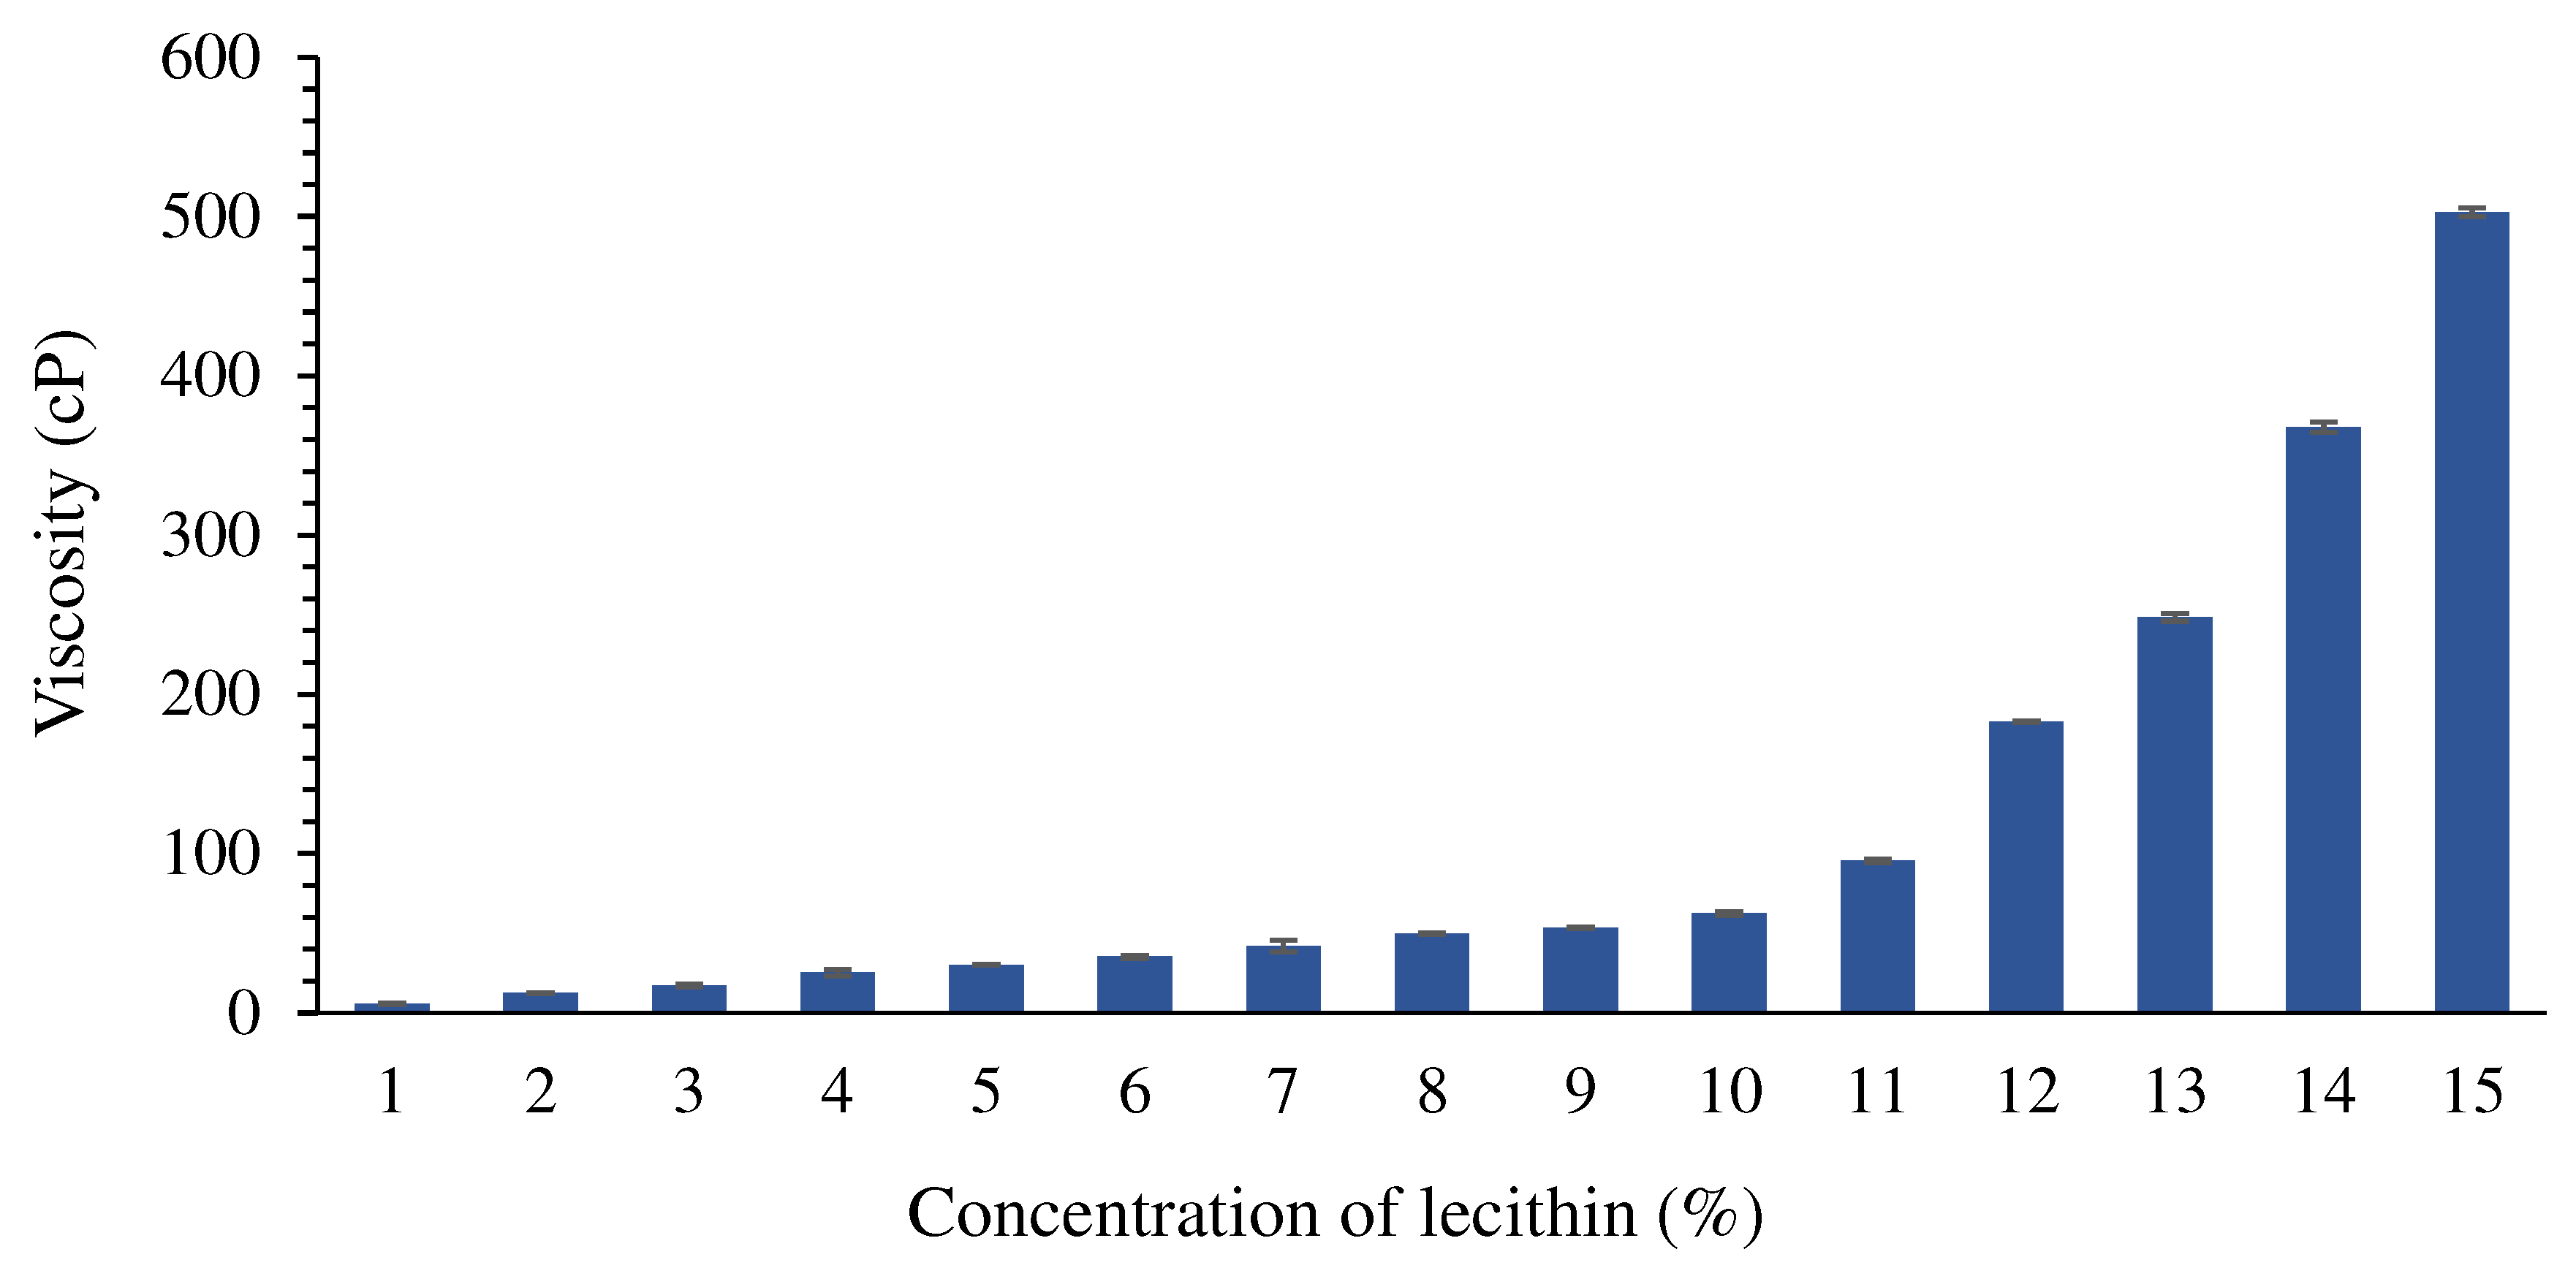
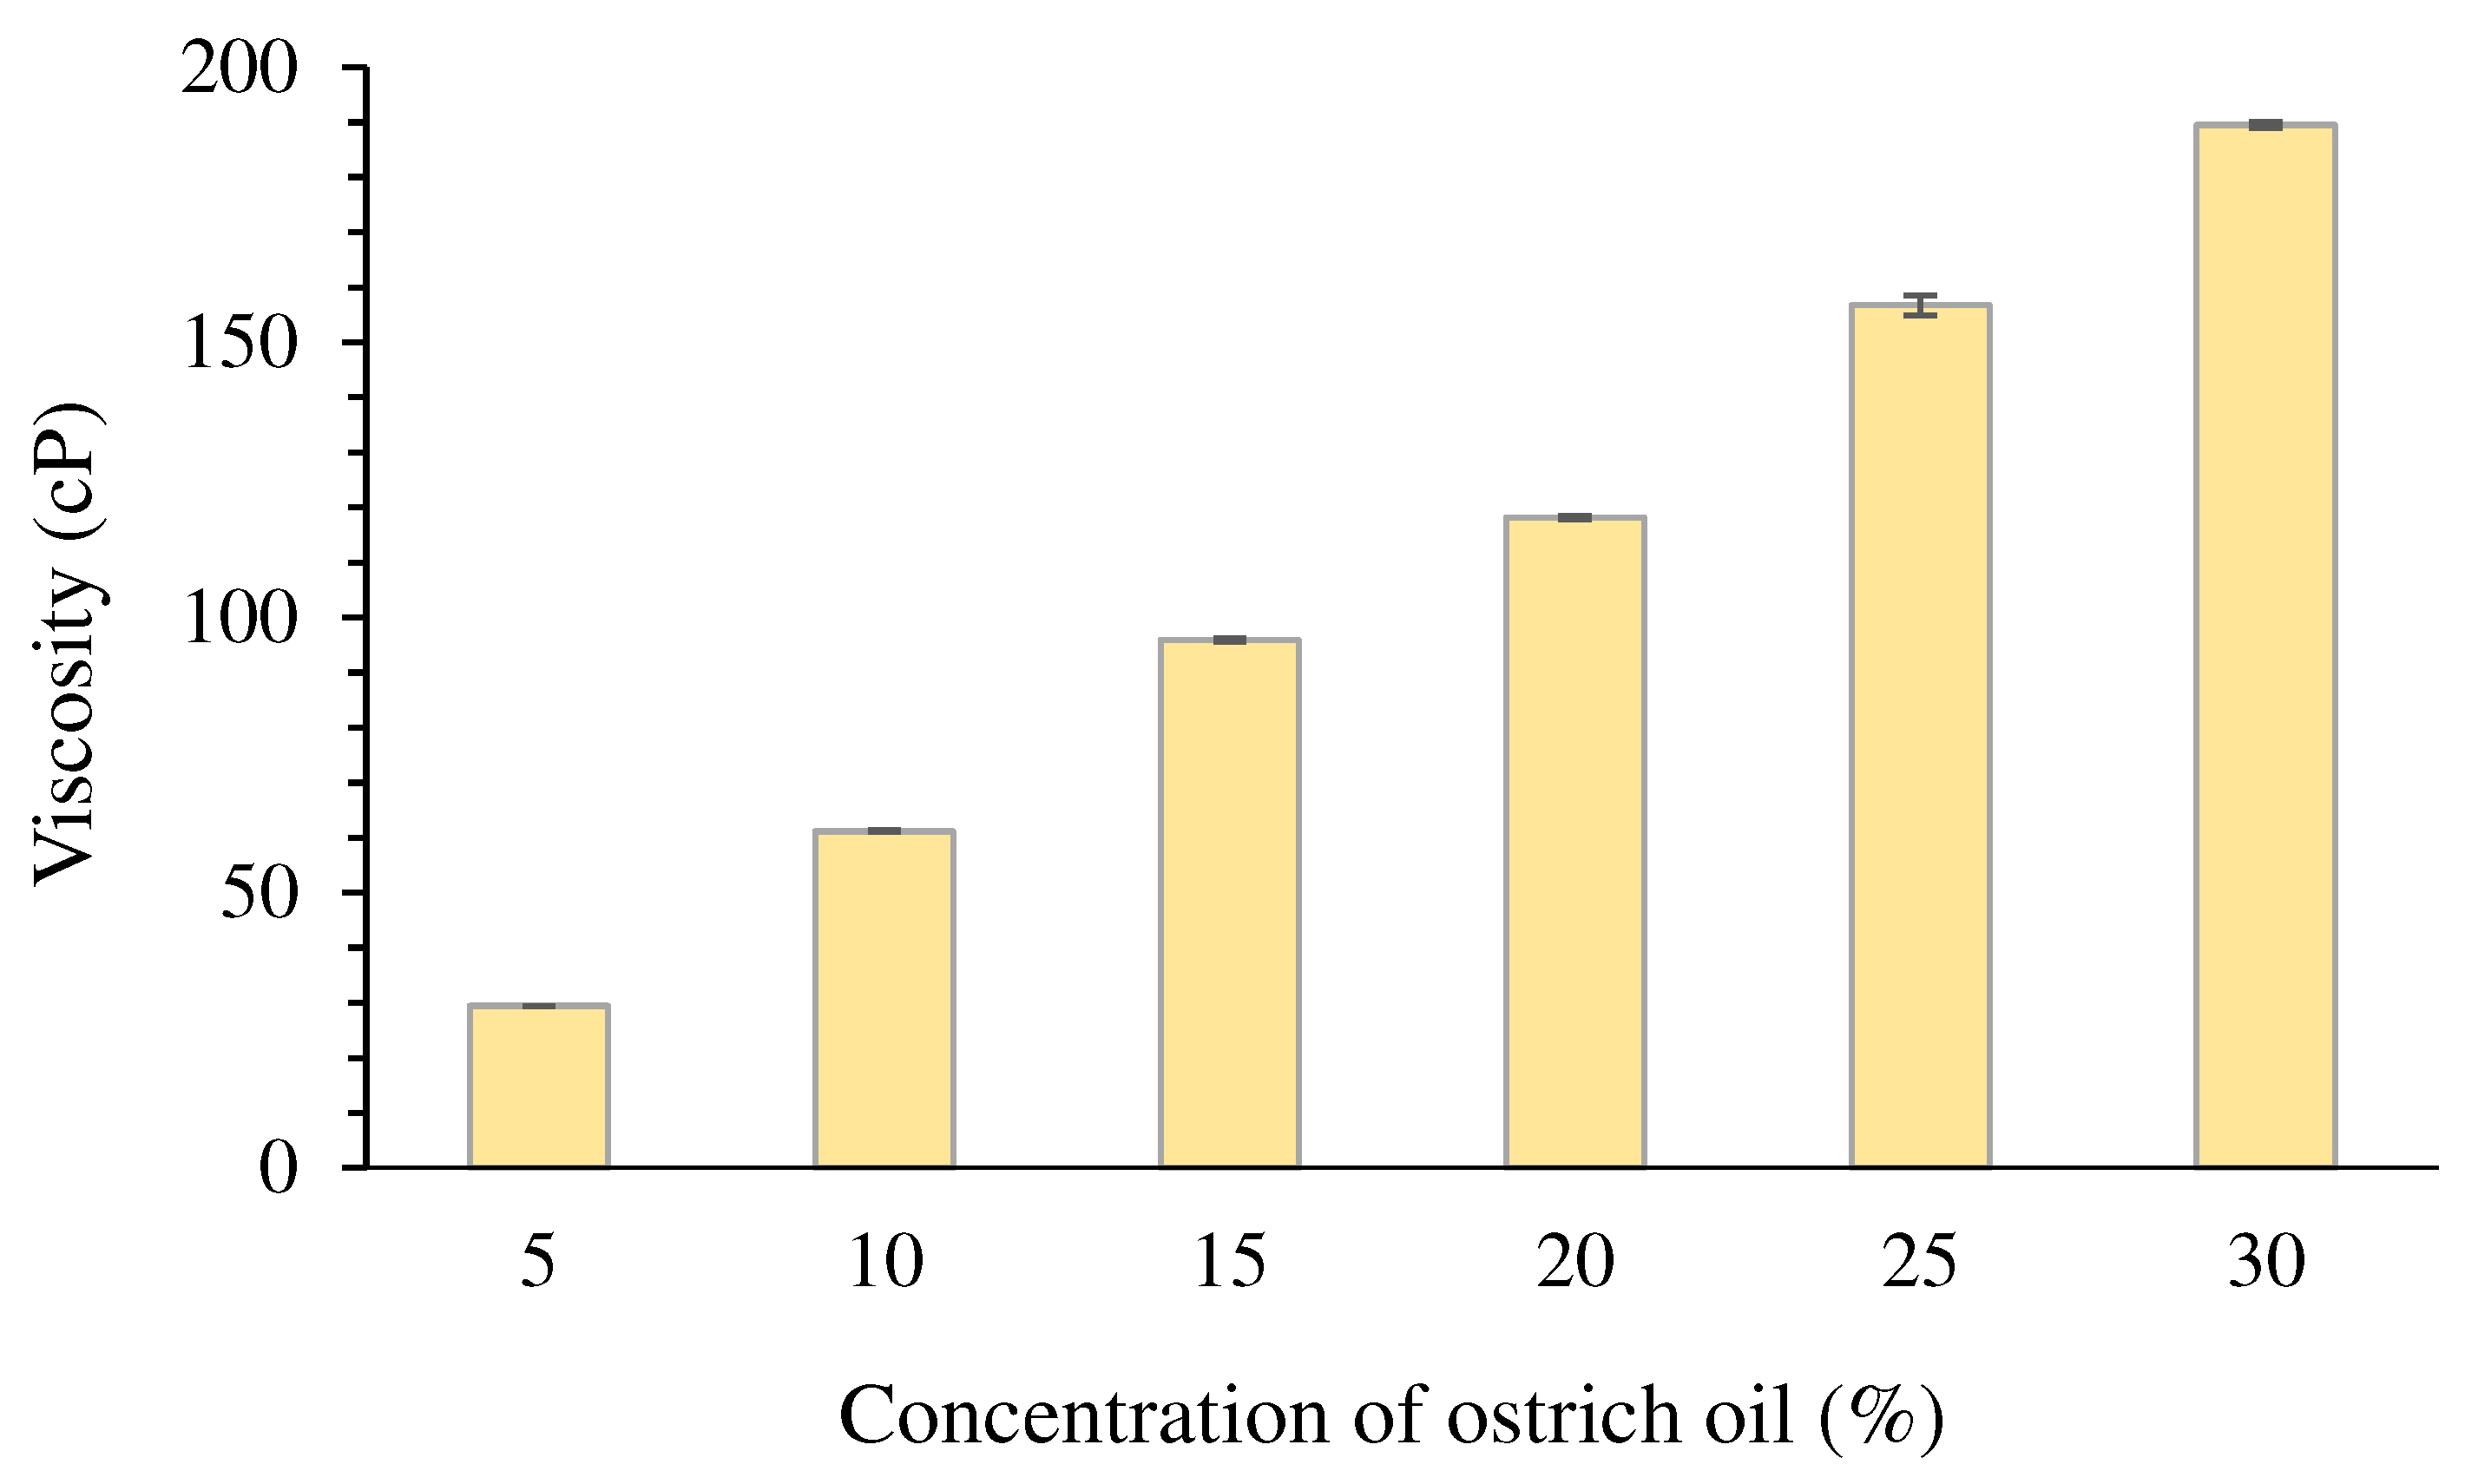
The study delved into the viscosity characteristics of emulsions, investigating how varying concentrations of ostrich oil and lecithin influenced this property, as illustrated in Figure 4 and Figure 5. As the concentration of either ostrich oil or lecithin increased, there was a corresponding elevation in the viscosity of the emulsions. Notably, the viscosity of ostrich oil emulsions demonstrated a clear dependency on the concentrations of emulsifiers. A discernible pattern emerged, indicating that higher emulsifier concentrations correlated with an increase in emulsion viscosity [80]. This trend is attributed to the significant influence of emulsifier concentration on the stability of emulsions. Furthermore, the heightened viscosity of the continuous phase emerged as a crucial factor impacting droplet dynamics. The increased viscosity plays a pivotal role in impeding droplet mobility and discouraging droplet coalescence, thereby contributing significantly to the overall stability of the emulsion [27]. This observation highlights the intricate relationship between emulsifier concentration, emulsion viscosity, and the resultant stability, providing valuable insights for optimizing emulsion formulations in future applications.

Droplet size

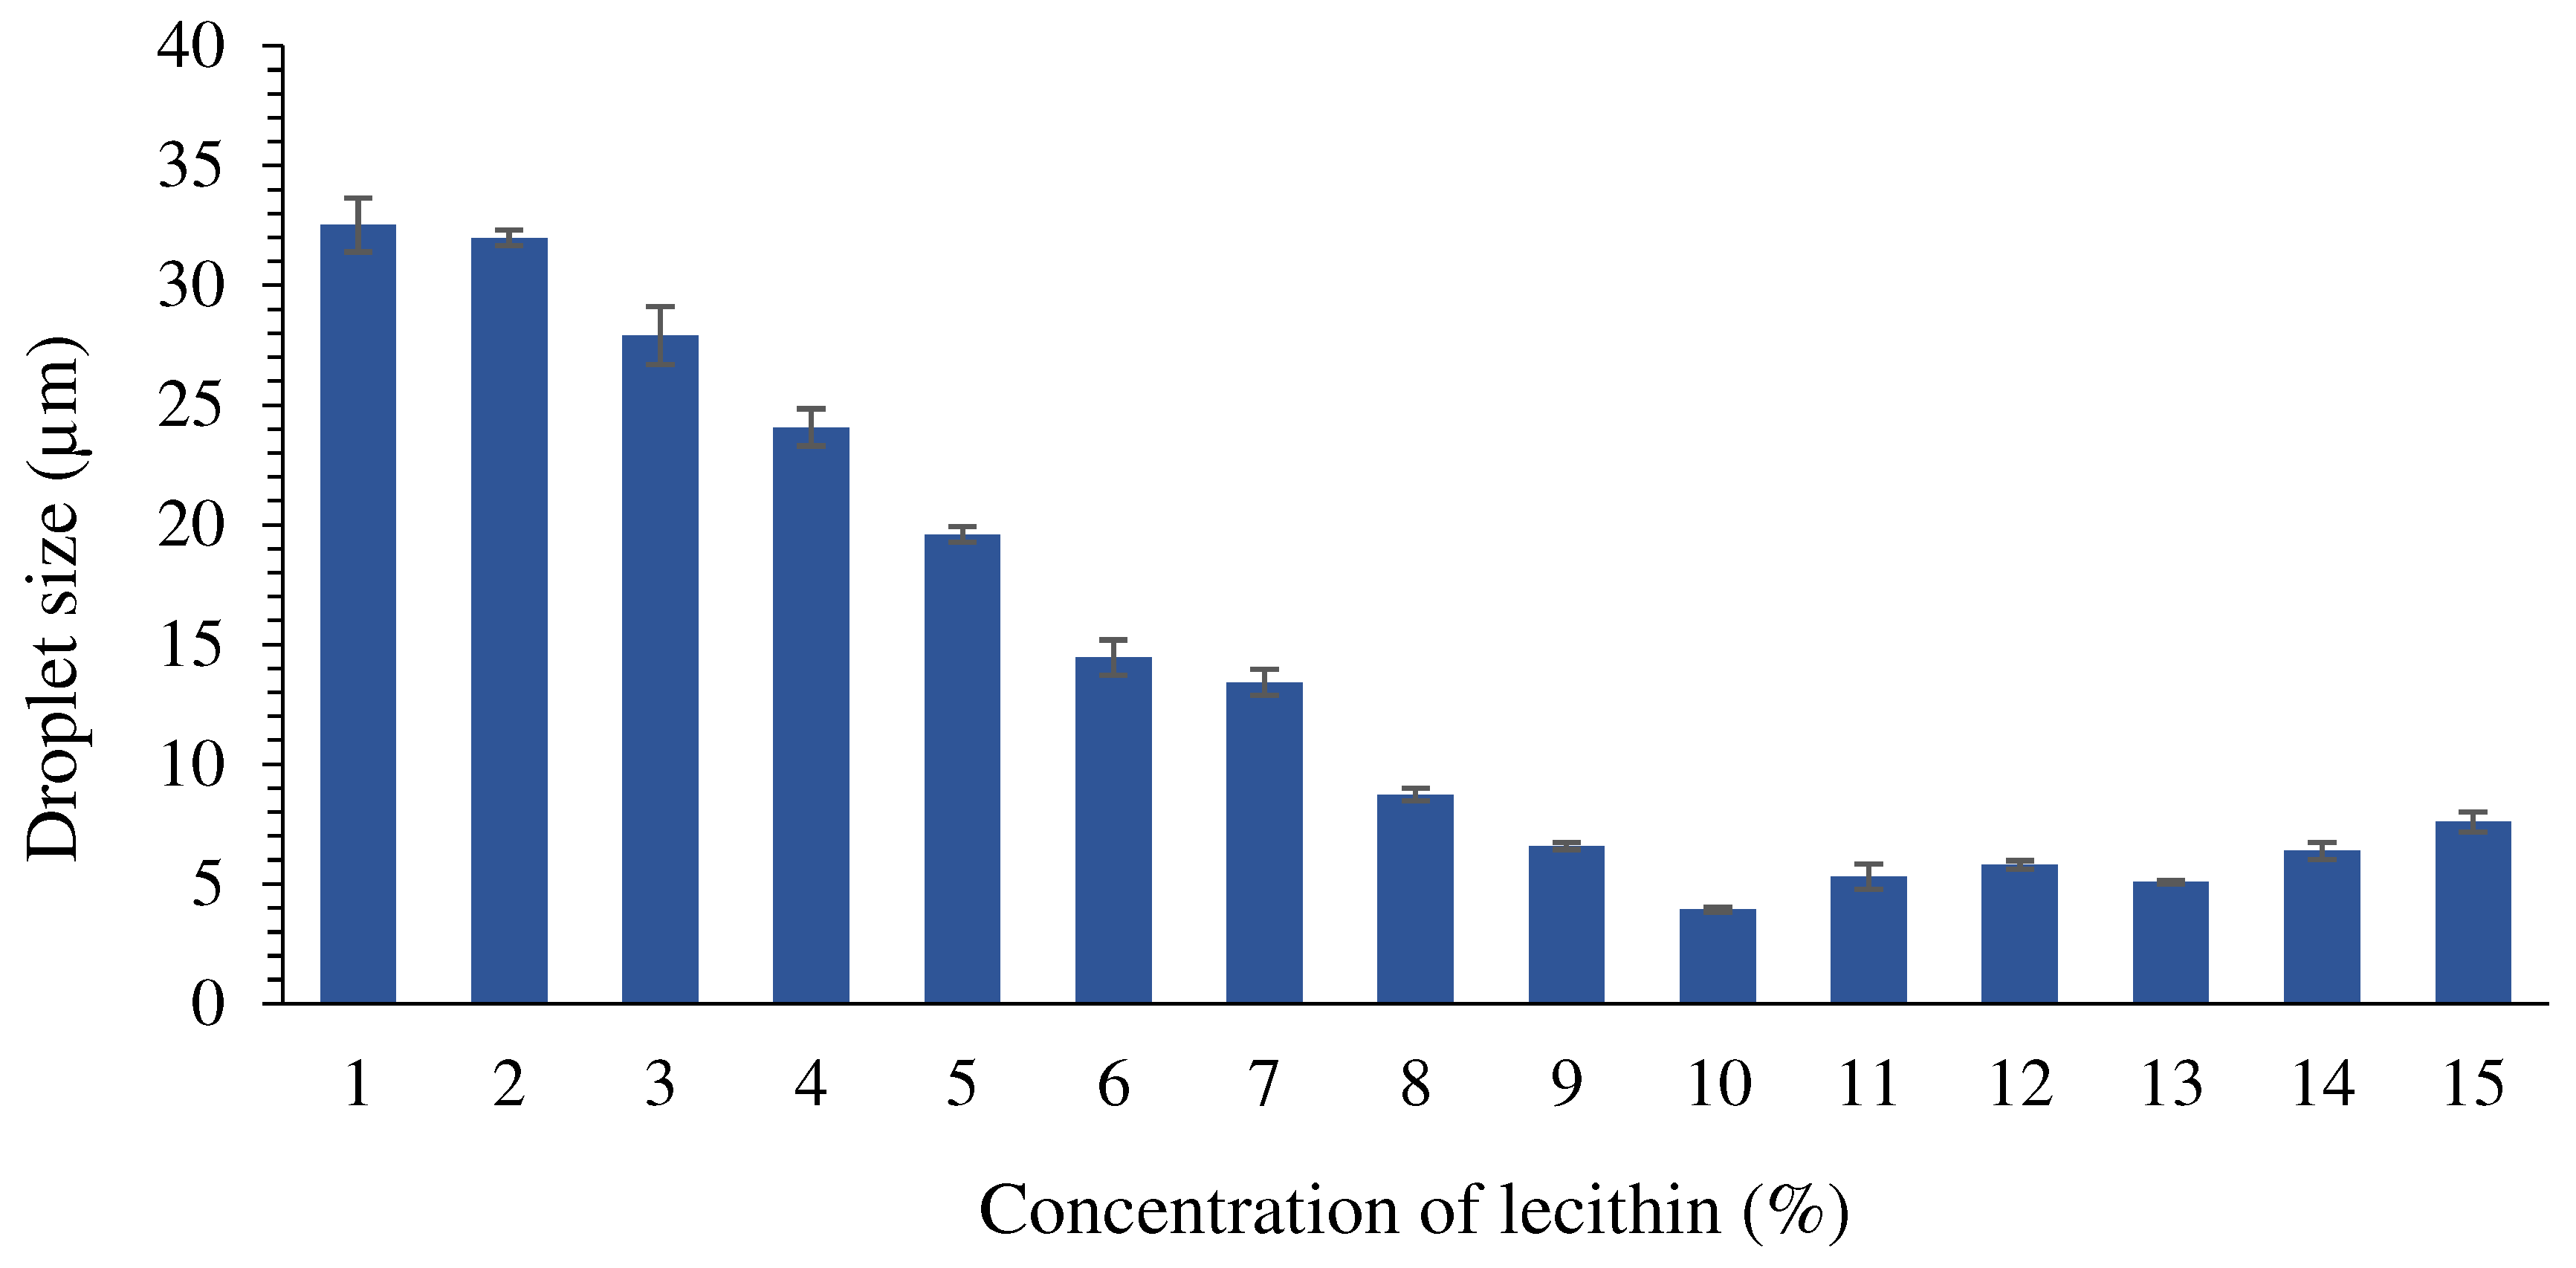
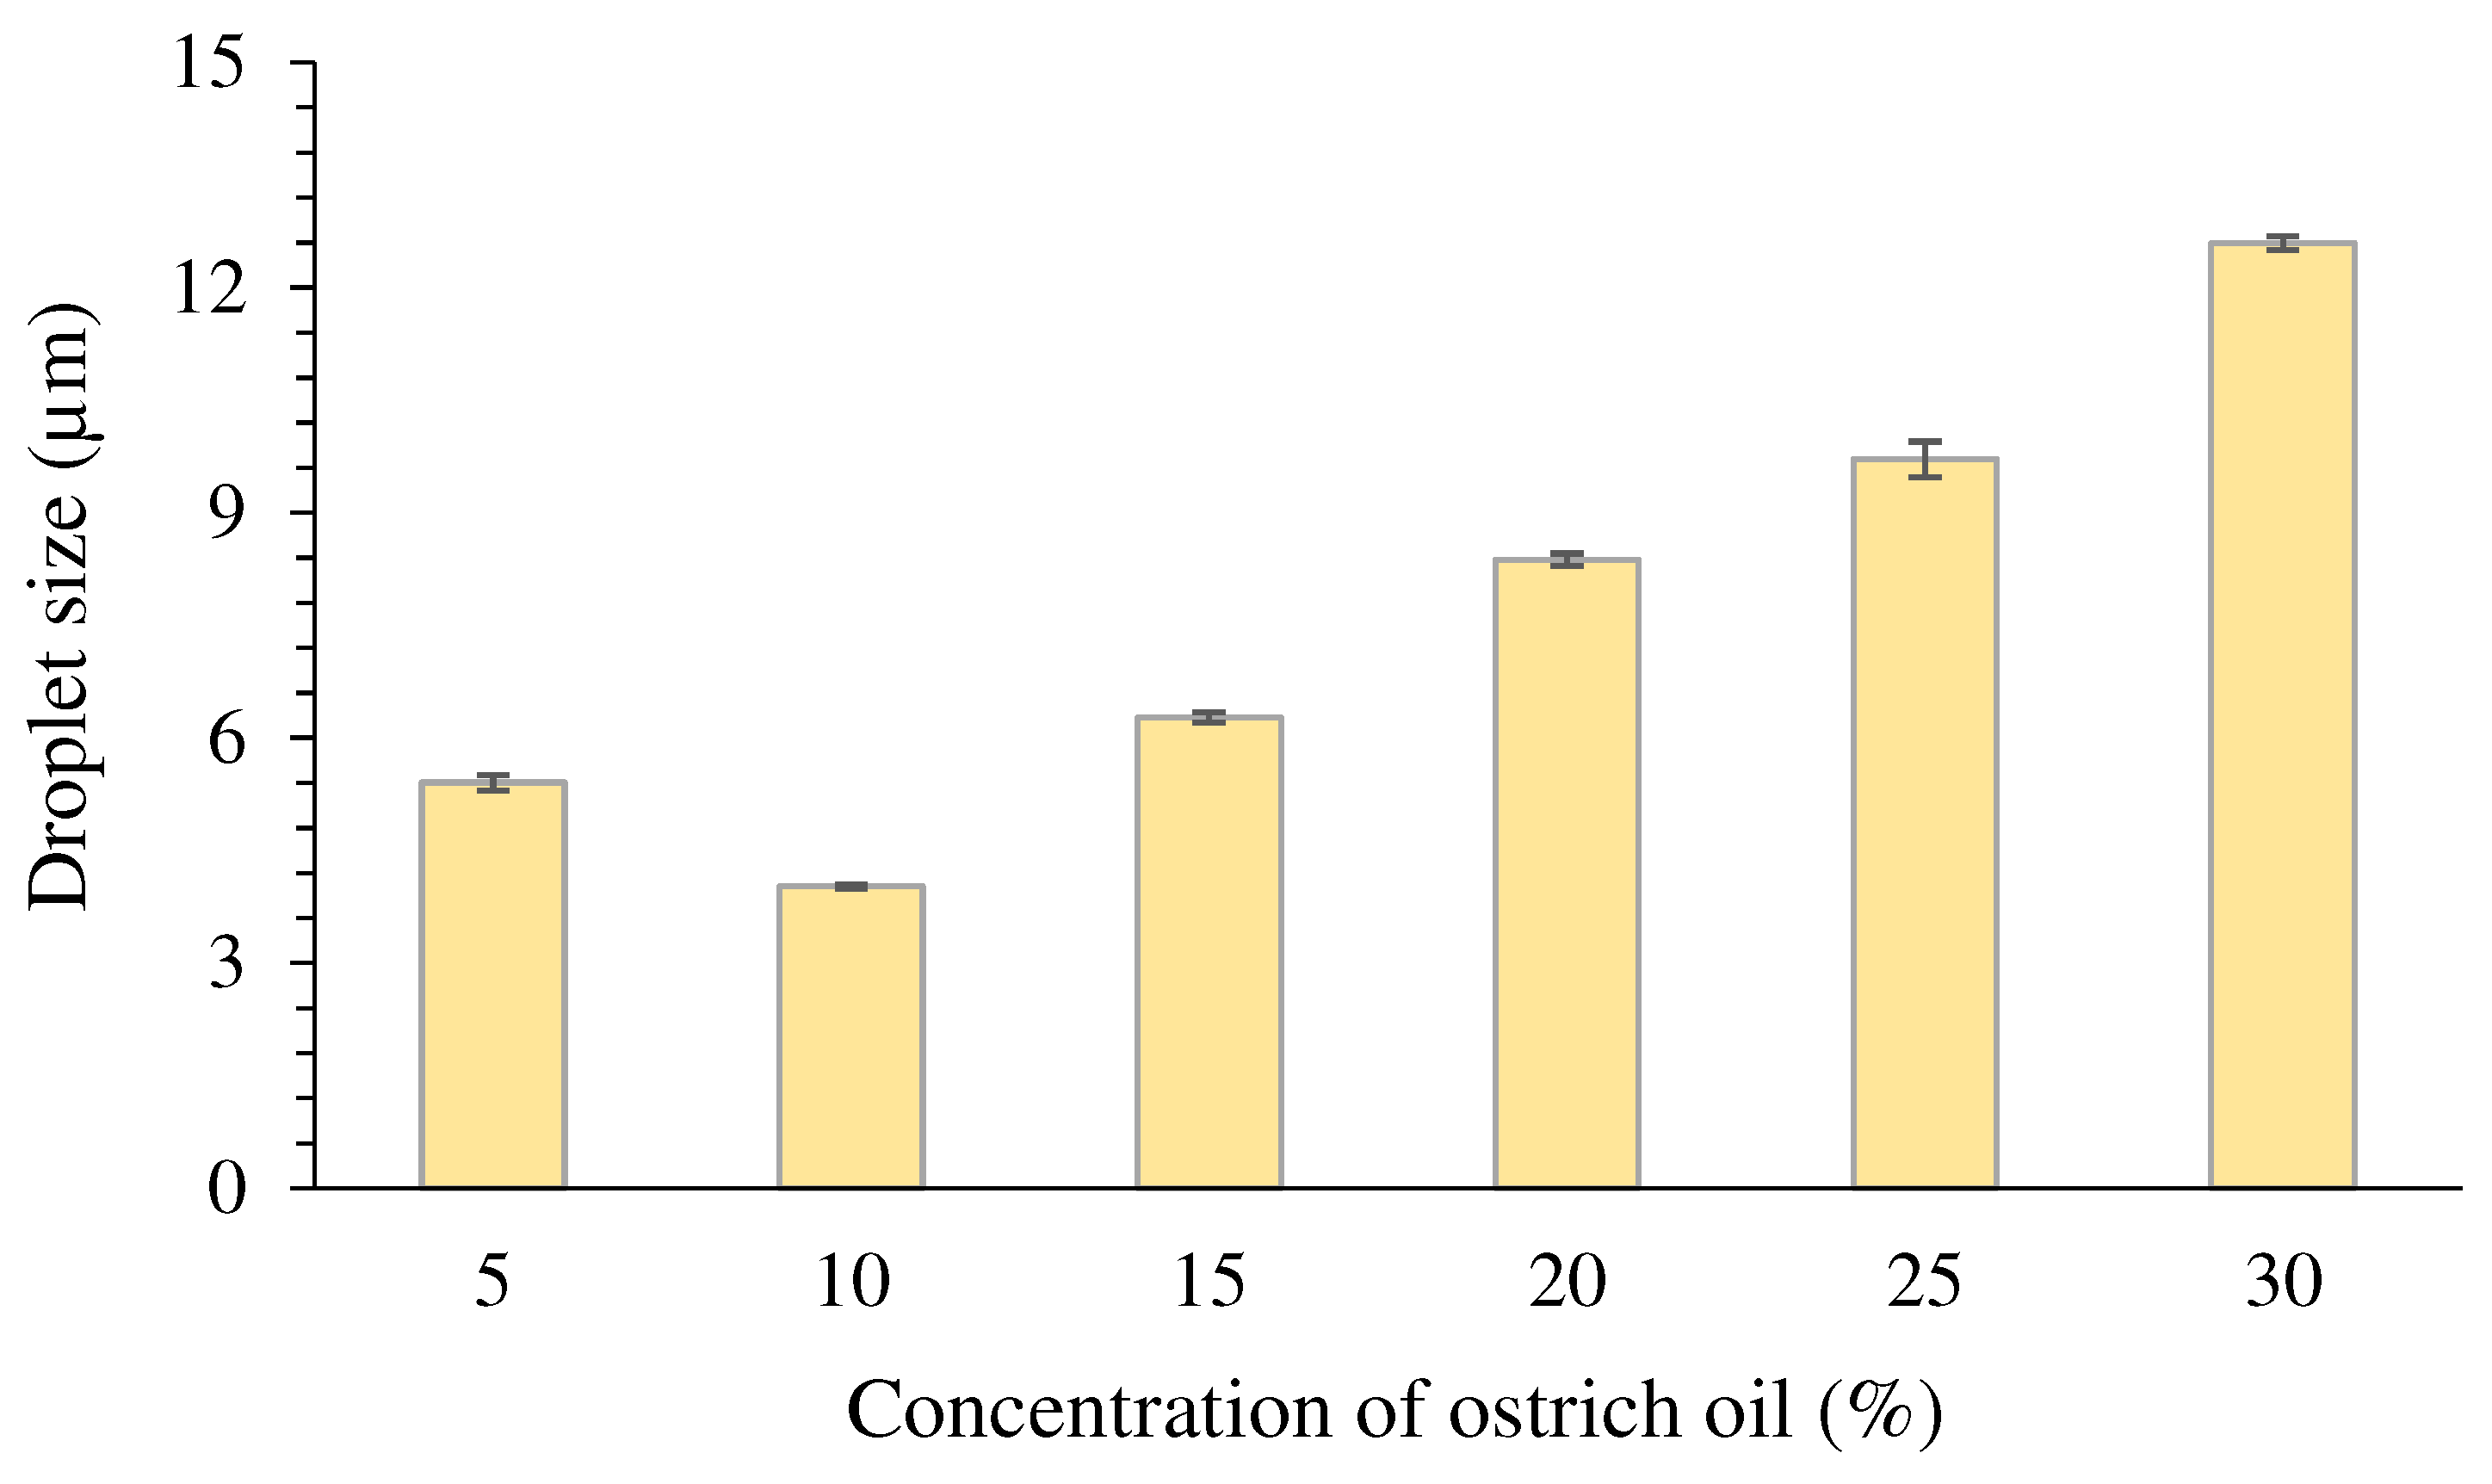
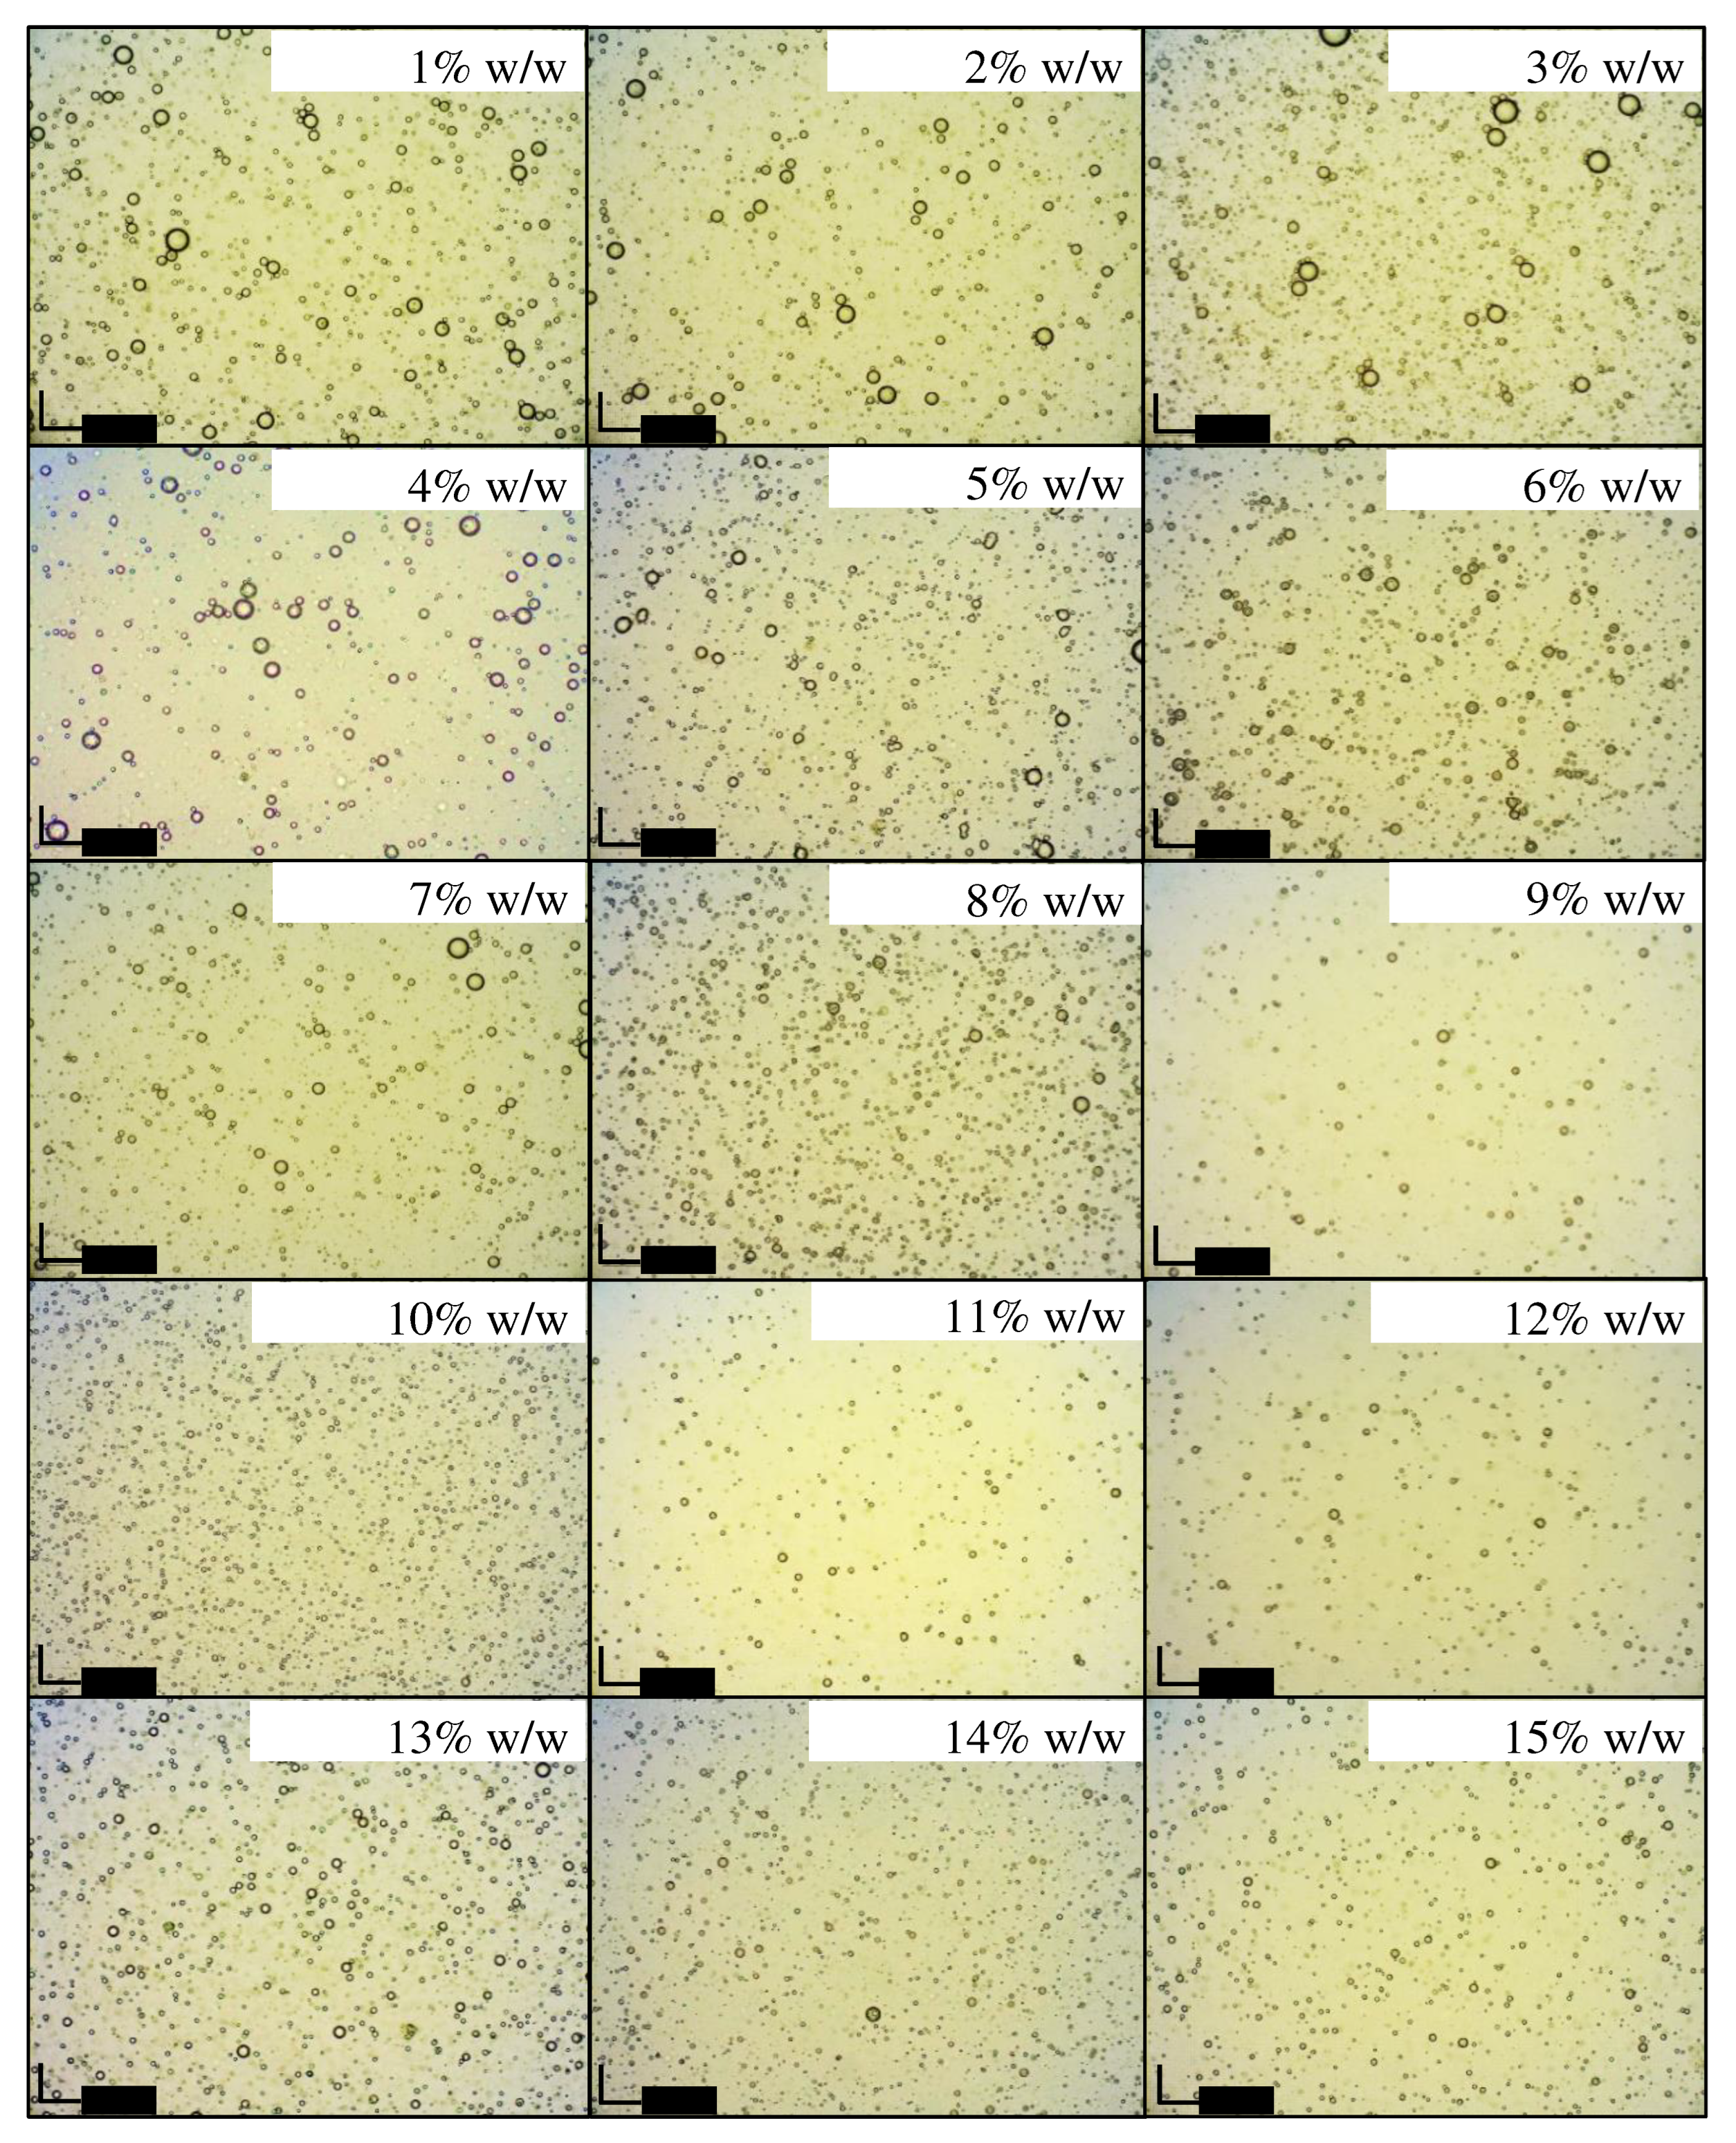
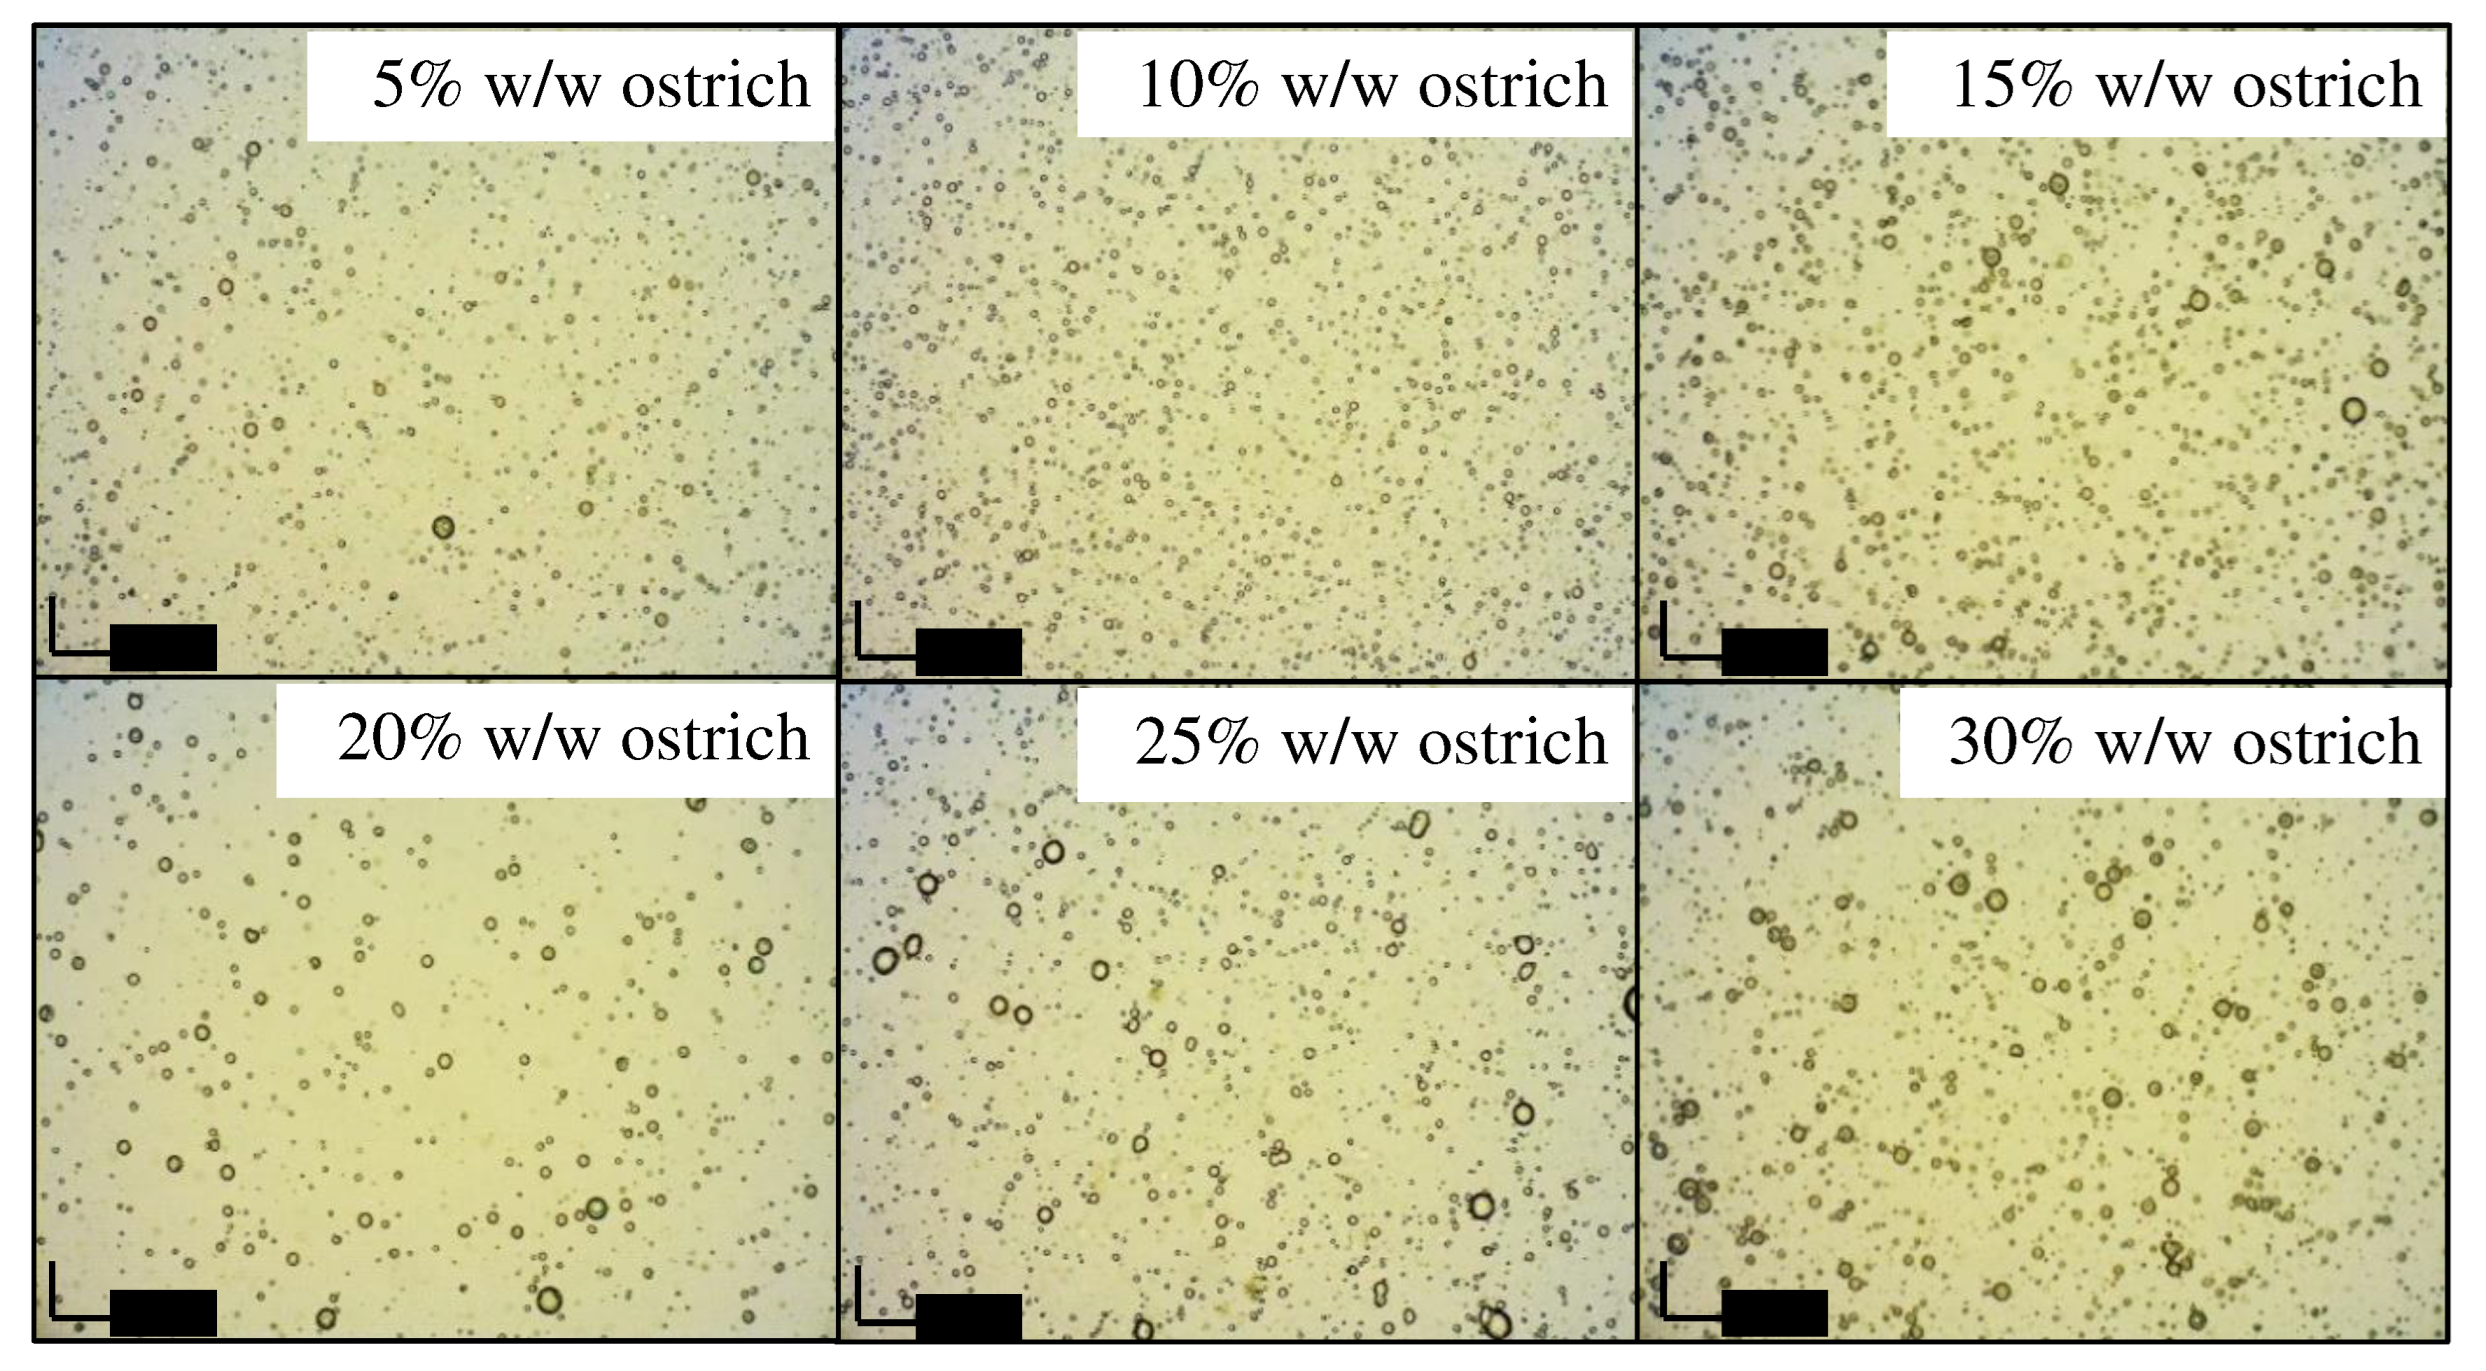
Figure 6 illustrates the droplet size characteristics of emulsions composed of 10% w/w ostrich oil and lecithin concentrations ranging from 1% w/w to 15% w/w. An incremental increase in lecithin concentration, from 1% w/w to 10% w/w, resulted in a proportional reduction in the droplet size of the oil dispersion within the emulsions. This phenomenon is attributed to the heightened concentration of emulsifier effectively enveloping the oil droplets, leading to a decrease in interfacial tension among them [81]. In relation to emulsions containing 10% w/w lecithin and 5% w/w to 30% w/w ostrich oil, Figure 7 illustrates the variation in droplet size. An increase in ostrich oil concentration from 10% w/w to 30% w/w correspondingly led to an enlargement in emulsion droplet size. This shift is attributed to the fact that, as the ostrich oil phase concentration increases, it requires a higher concentration of emulsifier to surround the oil droplets [81]. Notably, the smallest droplet size (3.93 ± 0.11 μm) was observed in the emulsion containing 10% w/w ostrich oil, effectively stabilized with 10% w/w lecithin, aligning with photomicrographs of emulsions containing 10% w/w ostrich oil and 1-15% w/w lecithin (Figure 8 and Figure 9). The results indicated that the emulsion containing 10% w/w ostrich oil and 10% w/w lecithin had the smallest droplet size. Generally, the smallest droplet size signifies the most stable emulsions. These findings collectively suggest that emulsion formulations with 10% w/w concentrations of both ostrich oil and lecithin are optimal for achieving stable O/W emulsions, providing valuable insights for the formulation of dry emulsions.

Zeta potential value

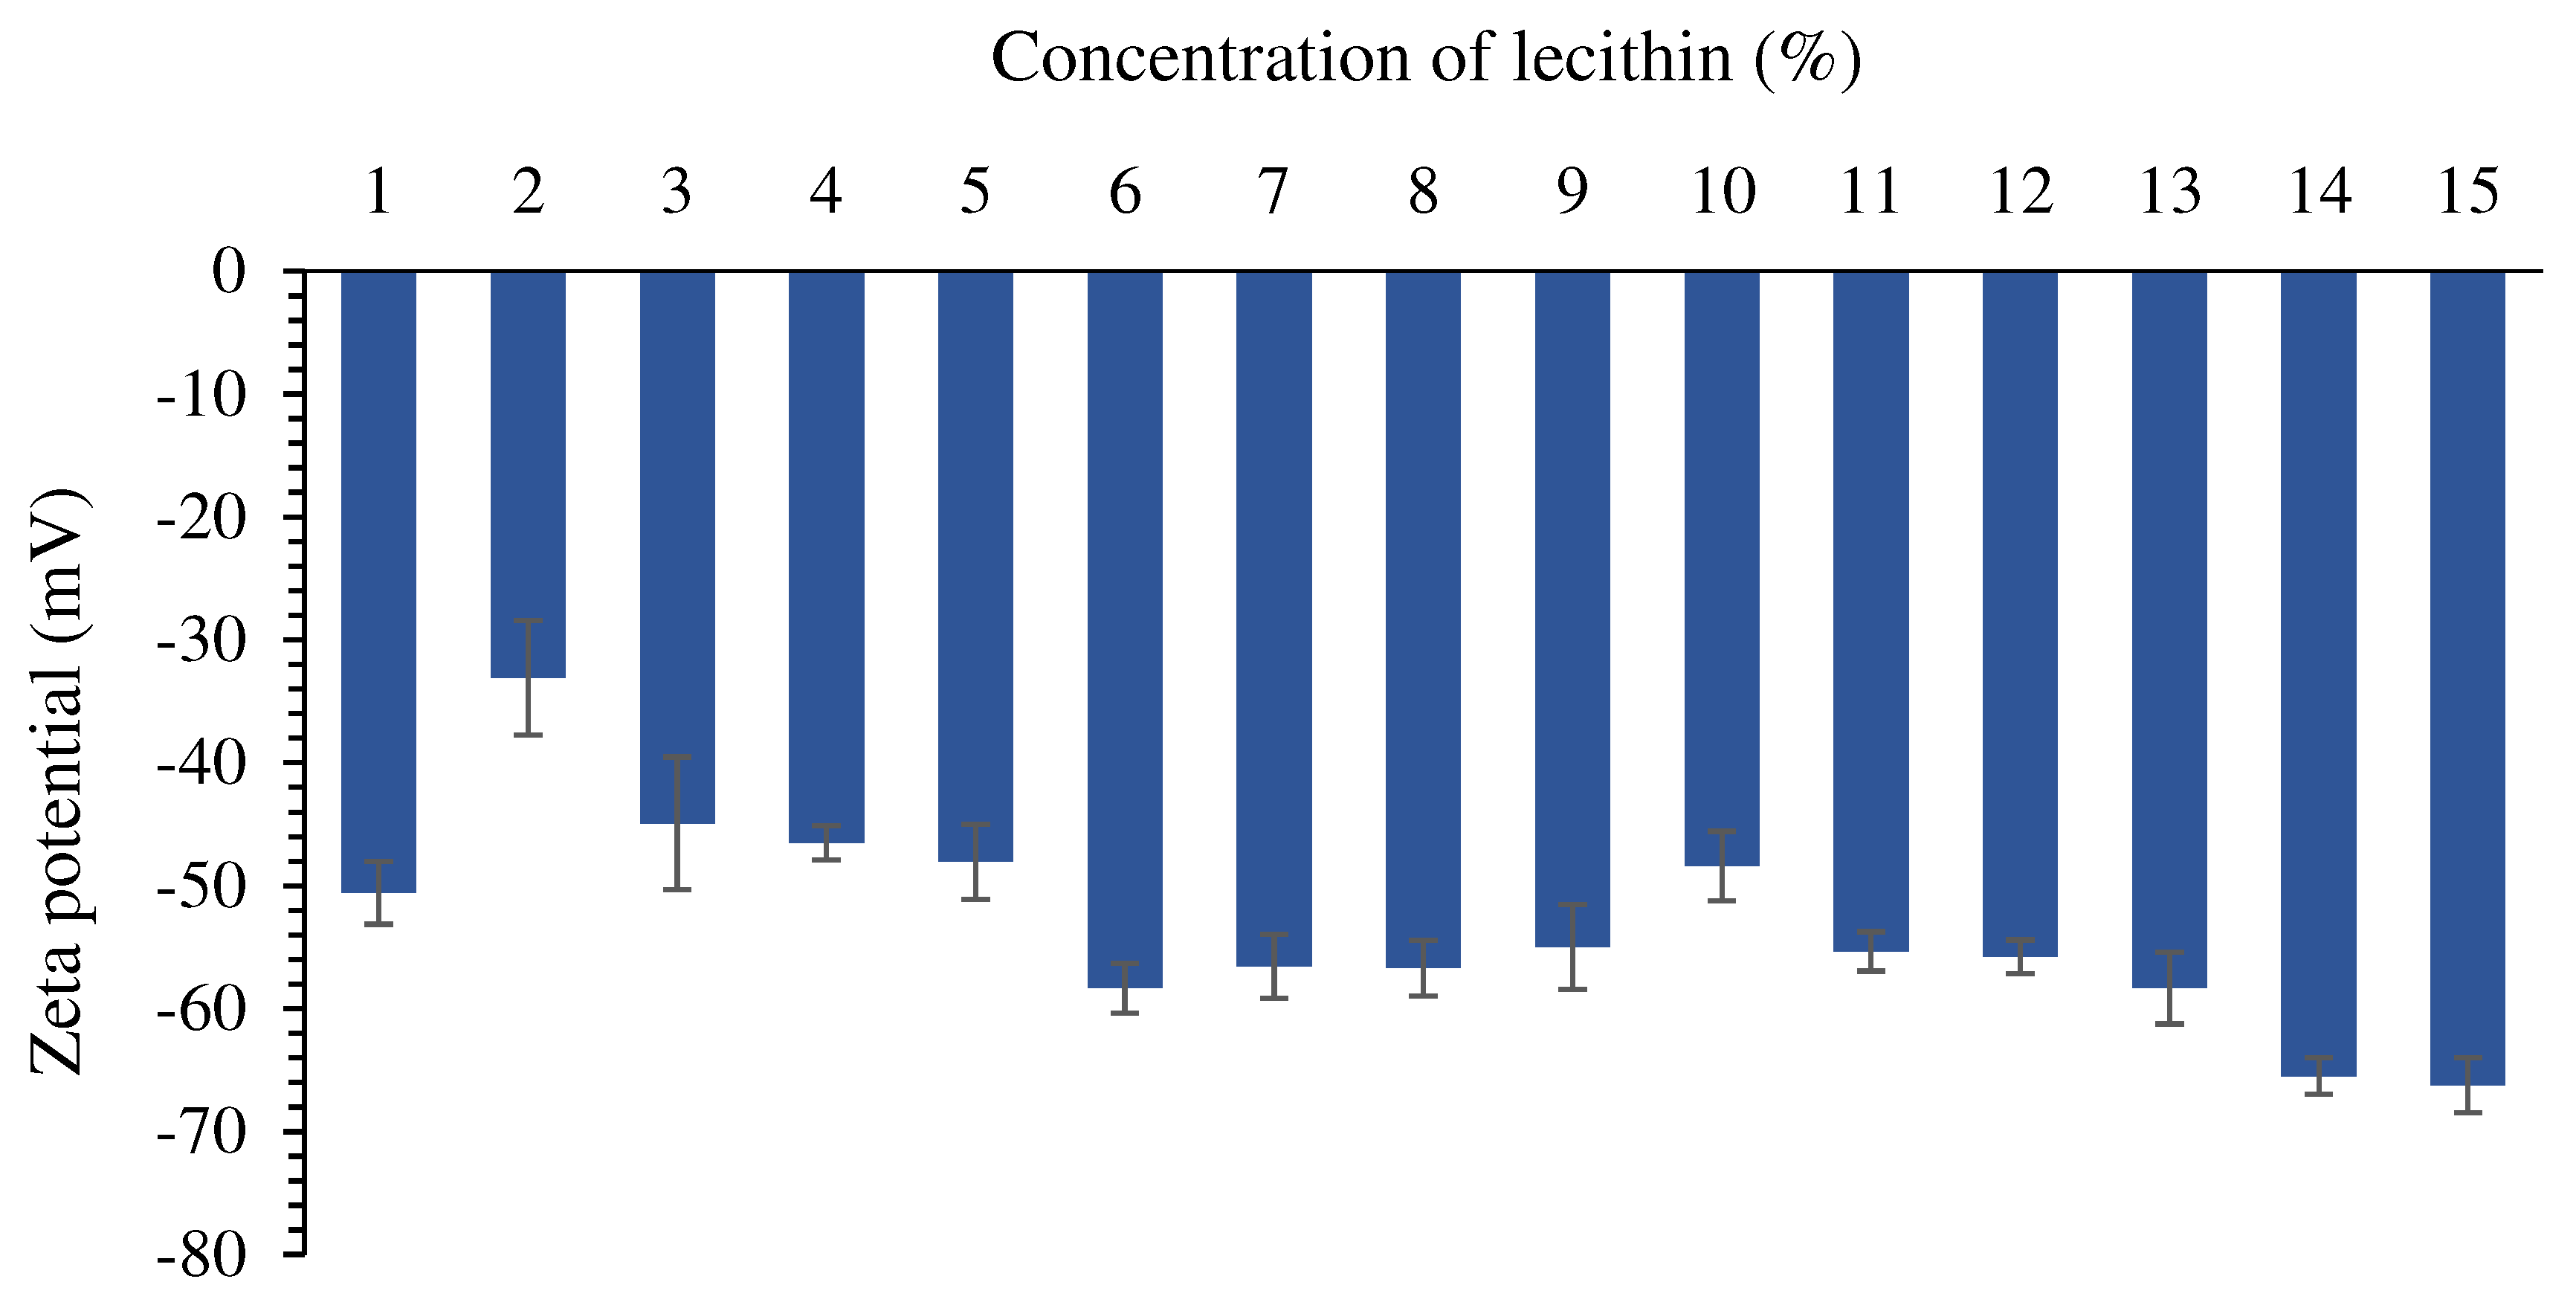
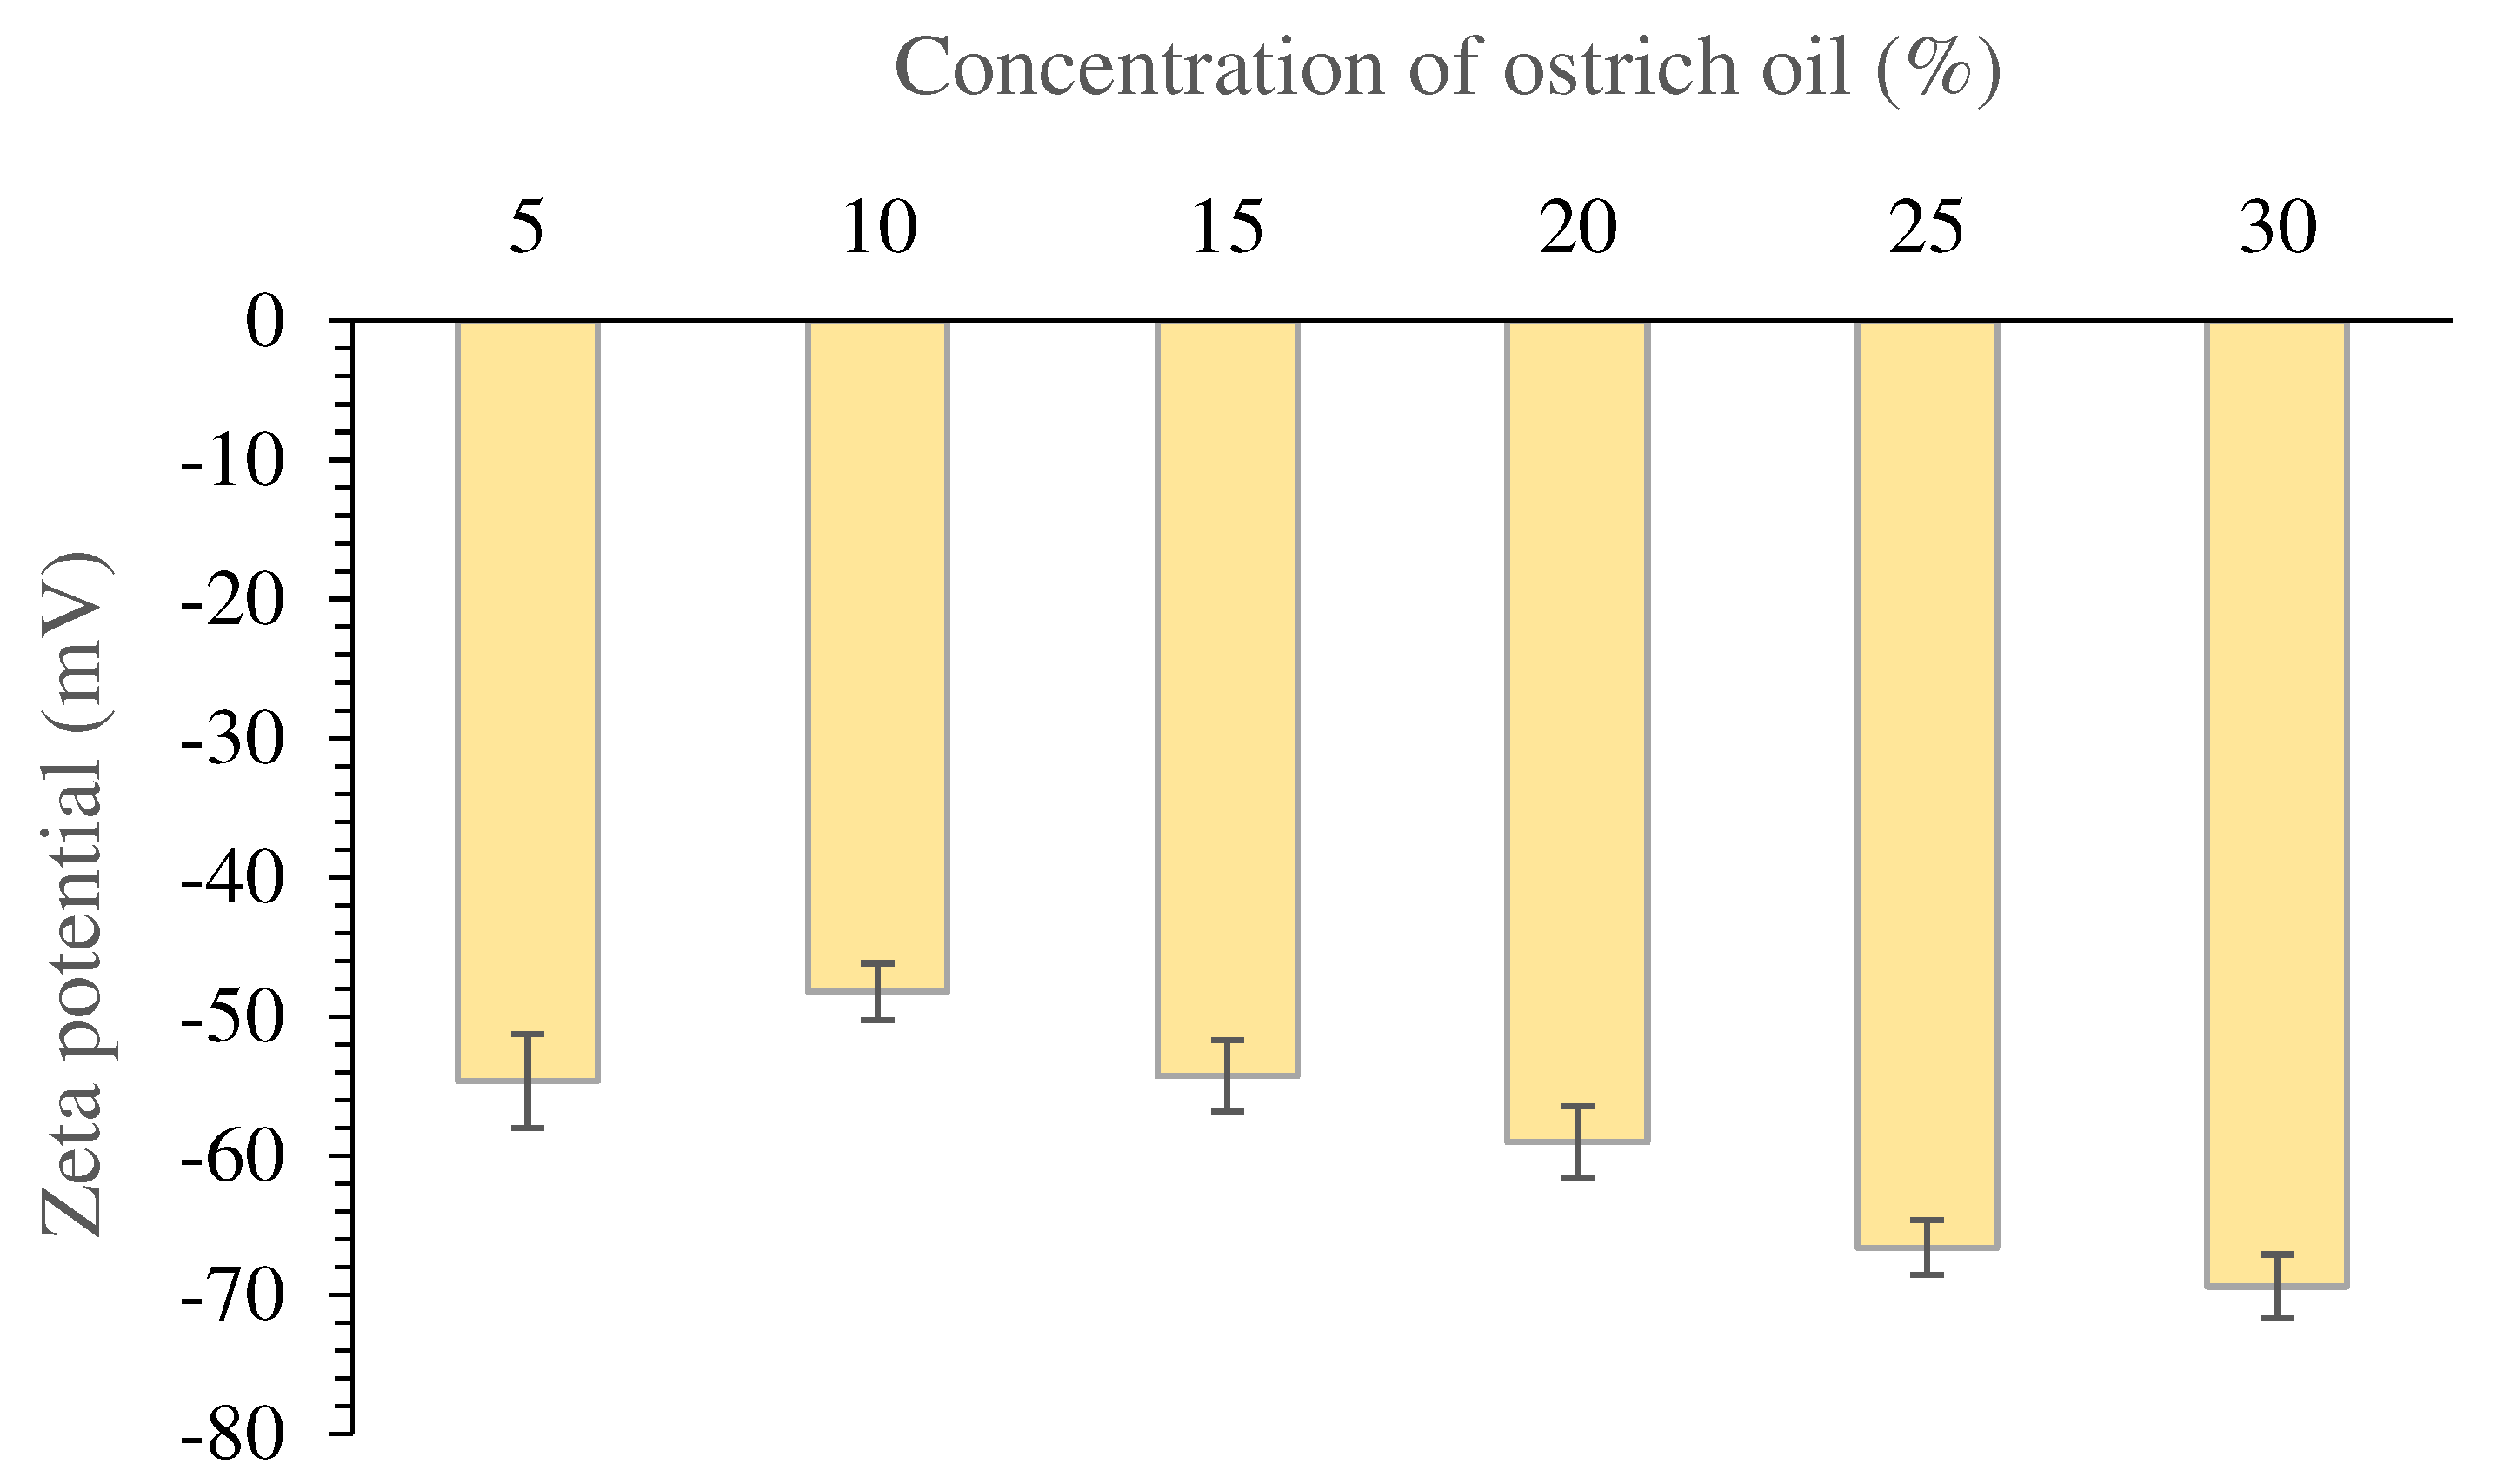
Figure 10 and Figure 11 showcase the zeta potential values of emulsions encompassing 10% w/w ostrich oil and 1% w/w - 15% w/w lecithin, and emulsions consisting of 5% w/w - 30% w/w ostrich oil and 10% w/w lecithin, respectively. In each instance, the emulsions exhibited negative zeta potential values within the range of -33.08 ± 4.67 to -66.23 ± 2.25 mV (Figure 10). Notably, as the concentration of lecithin or ostrich oil increased, the zeta potential values of the emulsions displayed heightened negative charges. These negative charges are attributed to the presence of phosphate groups within the phospholipids of lecithin [29] and carboxylic acid groups within the fatty acids of ostrich oil [16]. Emulsions characterized by significantly negative or positive zeta potentials typically demonstrate electrical stability, whereas those with lower zeta potentials tend to be susceptible to flocculation and/or coagulation, potentially compromising stability [82]. To ensure emulsion stability, zeta potential values for stable emulsions should exceed ± 30 mV, thereby mitigating the risk of deflocculation within the emulsion system [83]. Particularly noteworthy is the emulsion formulation characterized by the smallest droplet size with a zeta potential exceeding -30 mV. Achieved through a precise blend of 10% w/w ostrich oil and 10% w/w lecithin, this formulation emerges as a promising candidate for initial emulsion development, holding potential for further advancement into a dry emulsion formulation containing ostrich oil.

3.3. Fabrication and evaluation of dry emulsions containing ostrich oil

3.3.1. Fabrication of dry emulsions

In this investigation, an O/W emulsion was developed to enhance the stability of ostrich oil, an active ingredient with poor water solubility. The adsorption technique [37] was employed for the formulation. The optimal liquid emulsion, comprising 10% w/w ostrich oil and 10% w/w lecithin, underwent transformation into a dry emulsion using adsorbents such as Avicel® PH-101 (microcrystalline cellulose) and Aerosil® 200 (colloidal silica). Avicel® PH-101, a partially depolymerized cellulose with a particle size of approximately 50 μm, exhibits exceptionally high intraparticle porosity (90-95% of the surface area being internal). This porosity facilitates the swelling and disintegration of microcrystalline cellulose tablets due to water penetration into the hydrophilic tablet matrix, a process crucial for tablet dissolution [84]. On the other hand, Aerosil® 200 is a nonporous colloidal silicon dioxide classified as a hydrophilic adsorbent with a significant specific surface area of 200 m2/g [85]. Both Avicel® PH-101 and Aerosil® 200 are extensively employed in oral pharmaceutical formulations owing to their non-toxic nature. Furthermore, both substances have been included in the Generally Recognized as Safe (GRAS) list by the Food and Drug Administration (FDA) as food additives [86,87]. Given their established safety profiles, Avicel® PH-101 and Aerosil® 200 were selected as the preferred adsorbents for this study.
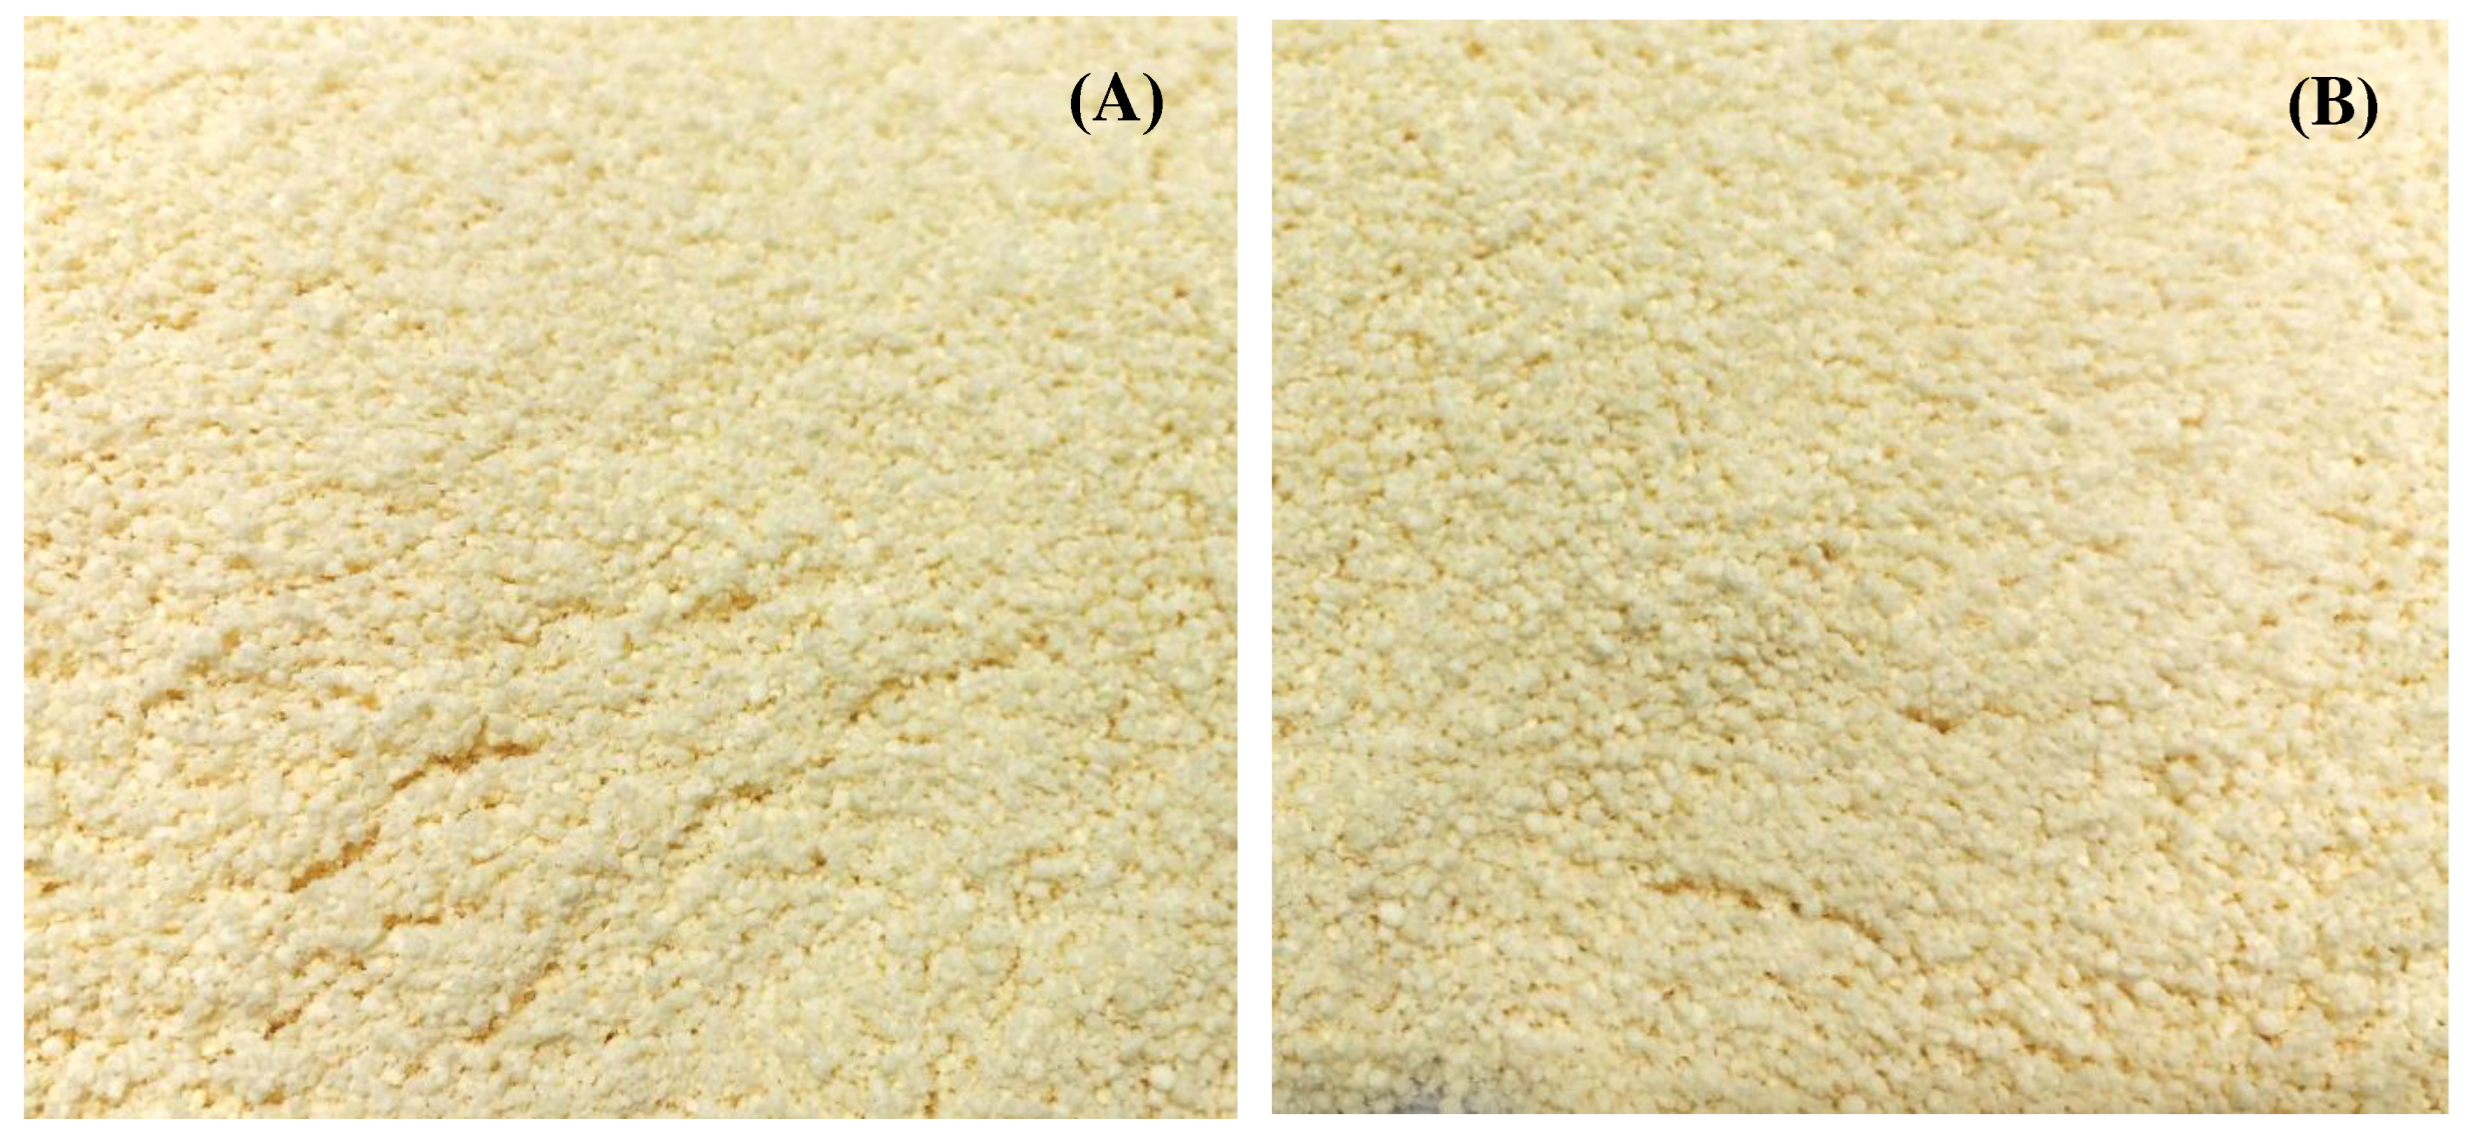
Upon varying the weight ratios between the adsorbents and ostrich oil emulsion, optimal ratios emerged: 50: 50 (w/w) for Avicel® PH-101 and 32: 68 (w/w) for Aerosil® 200. The visual representation of the dry emulsions prepared using Avicel® PH-101 and Aerosil® 200 can be observed in Figure 12. Results of color measurements for both granules, expressed by L*, a*, and b* components, are shown in Table 3. Both granules were very light (L* close to 100%) and had a slightly greenish-yellow color (negative a* and positive b*). It is noteworthy that the adsorption technique without heat employed for the formulation of both granules leads to lightening.
The moisture content of a dry emulsion plays a pivotal role with substantial implications for the final product. Effective moisture control is crucial for ensuring the stability and prolonged shelf life of the dry emulsion. Excessive moisture can result in issues such as microbial growth, oxidation, and other stability concerns [88]. Moreover, it can influence the dispersibility, dissolution, or reconstitution of granules when introduced to a liquid medium [89]. Maintaining optimal moisture levels is essential for achieving the desired stability of the dry emulsion, meeting both quality standards and regulatory requirements. The moisture content of dry emulsions adsorbed with Avicel® PH-101 (3.37 ± 0.07%) exceeded that of Aerosil® 200 (2.00 ± 0.08%). Both dry emulsions demonstrated moisture contents within the general range (less than 3.5%) [90,91]. However, specific moisture content requirements may vary based on the formulation, type of adsorbent, and the drying process [35]. Therefore, understanding and tailoring moisture content to the specific needs of the formulation are imperative, ensuring that the dry emulsion meets quality standards and regulatory requirements. This nuanced approach to moisture control contributes significantly to the overall success and efficacy of the dry emulsion in practical applications.
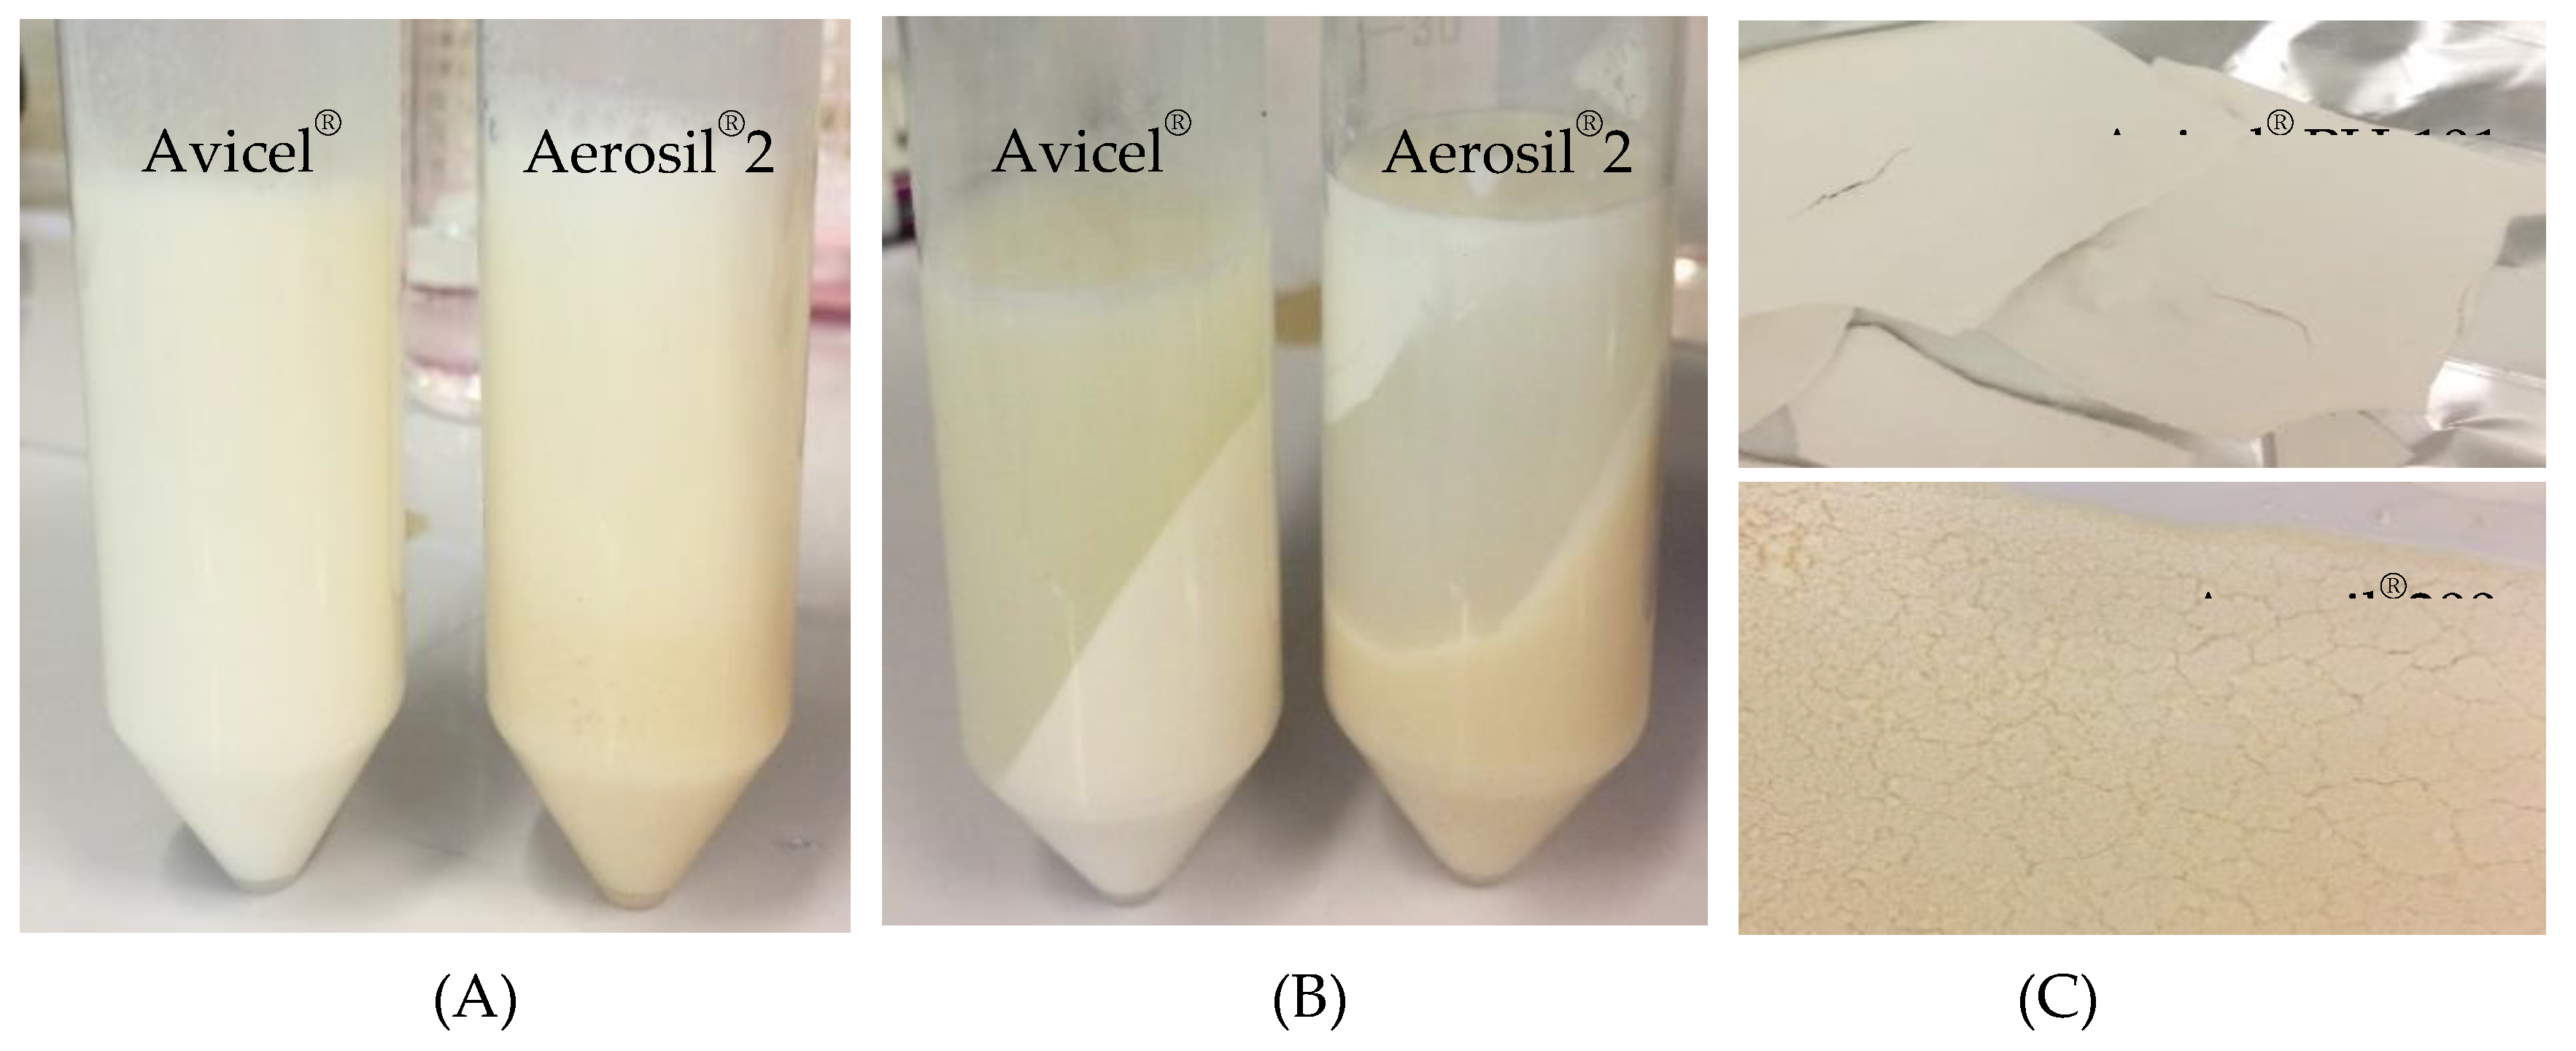
To assess the liberation of ostrich oil emulsion from the granules, the percentage of weight loss subsequent to oil release was computed. The reconstituted emulsions derived from Avicel® PH-101 and Aerosil® 200 granules displayed a uniform appearance, mirroring their initial liquid emulsions containing ostrich oil (Figure 13A). Visual observations of both reconstituted emulsions post-centrifugation and their resulting dry sediment are presented in Figure 13B and Figure 13C, respectively. The initial weight of the dry emulsion and the remaining weight (dry sediment) for each were utilized to calculate the percentage of weight loss after the release of oil for each dry emulsion. Notably, the percentage of weight loss after oil release from Avicel® PH-101 granules (82.00 ± 1.00%) surpassed that of Aerosil® 200 granules (30.00 ± 0.67%). This discrepancy underscores Avicel® PH-101’s greater capacity to release ostrich oil emulsion compared to Aerosil® 200 granules. The heightened hydrophobicity of Aerosil® 200 relative to Avicel® PH-101 resulted in a more efficient retention of ostrich oil, as previously established [92]. Despite Avicel® PH-101’s lower adsorption capacity for ostrich oil emulsion compared to Aerosil® 200, it demonstrated a superior capability to release the emulsion. Ostrich oil emulsion, confined within a three-dimensional lattice of Aerosil® 200 (colloidal silica), mimicked an oleogel—a semi-solid substance with a substantial proportion of liquid oil entrapped in a network of structuring molecules. This network served to immobilize the ostrich oil emulsion, transforming it into a solid-like material that maintained its integrity without any leakage. The colloidal silica particle network responsible for encapsulating the ostrich oil emulsion was expected to impede its release. This hindrance arose from the interactions between the oil and the particles, reinforcing their resistance to separation, as demonstrated in a previous study [93]. Consequently, Avicel® PH-101 was chosen as the preferred adsorbent for the formulation of dry emulsions of ostrich oil.
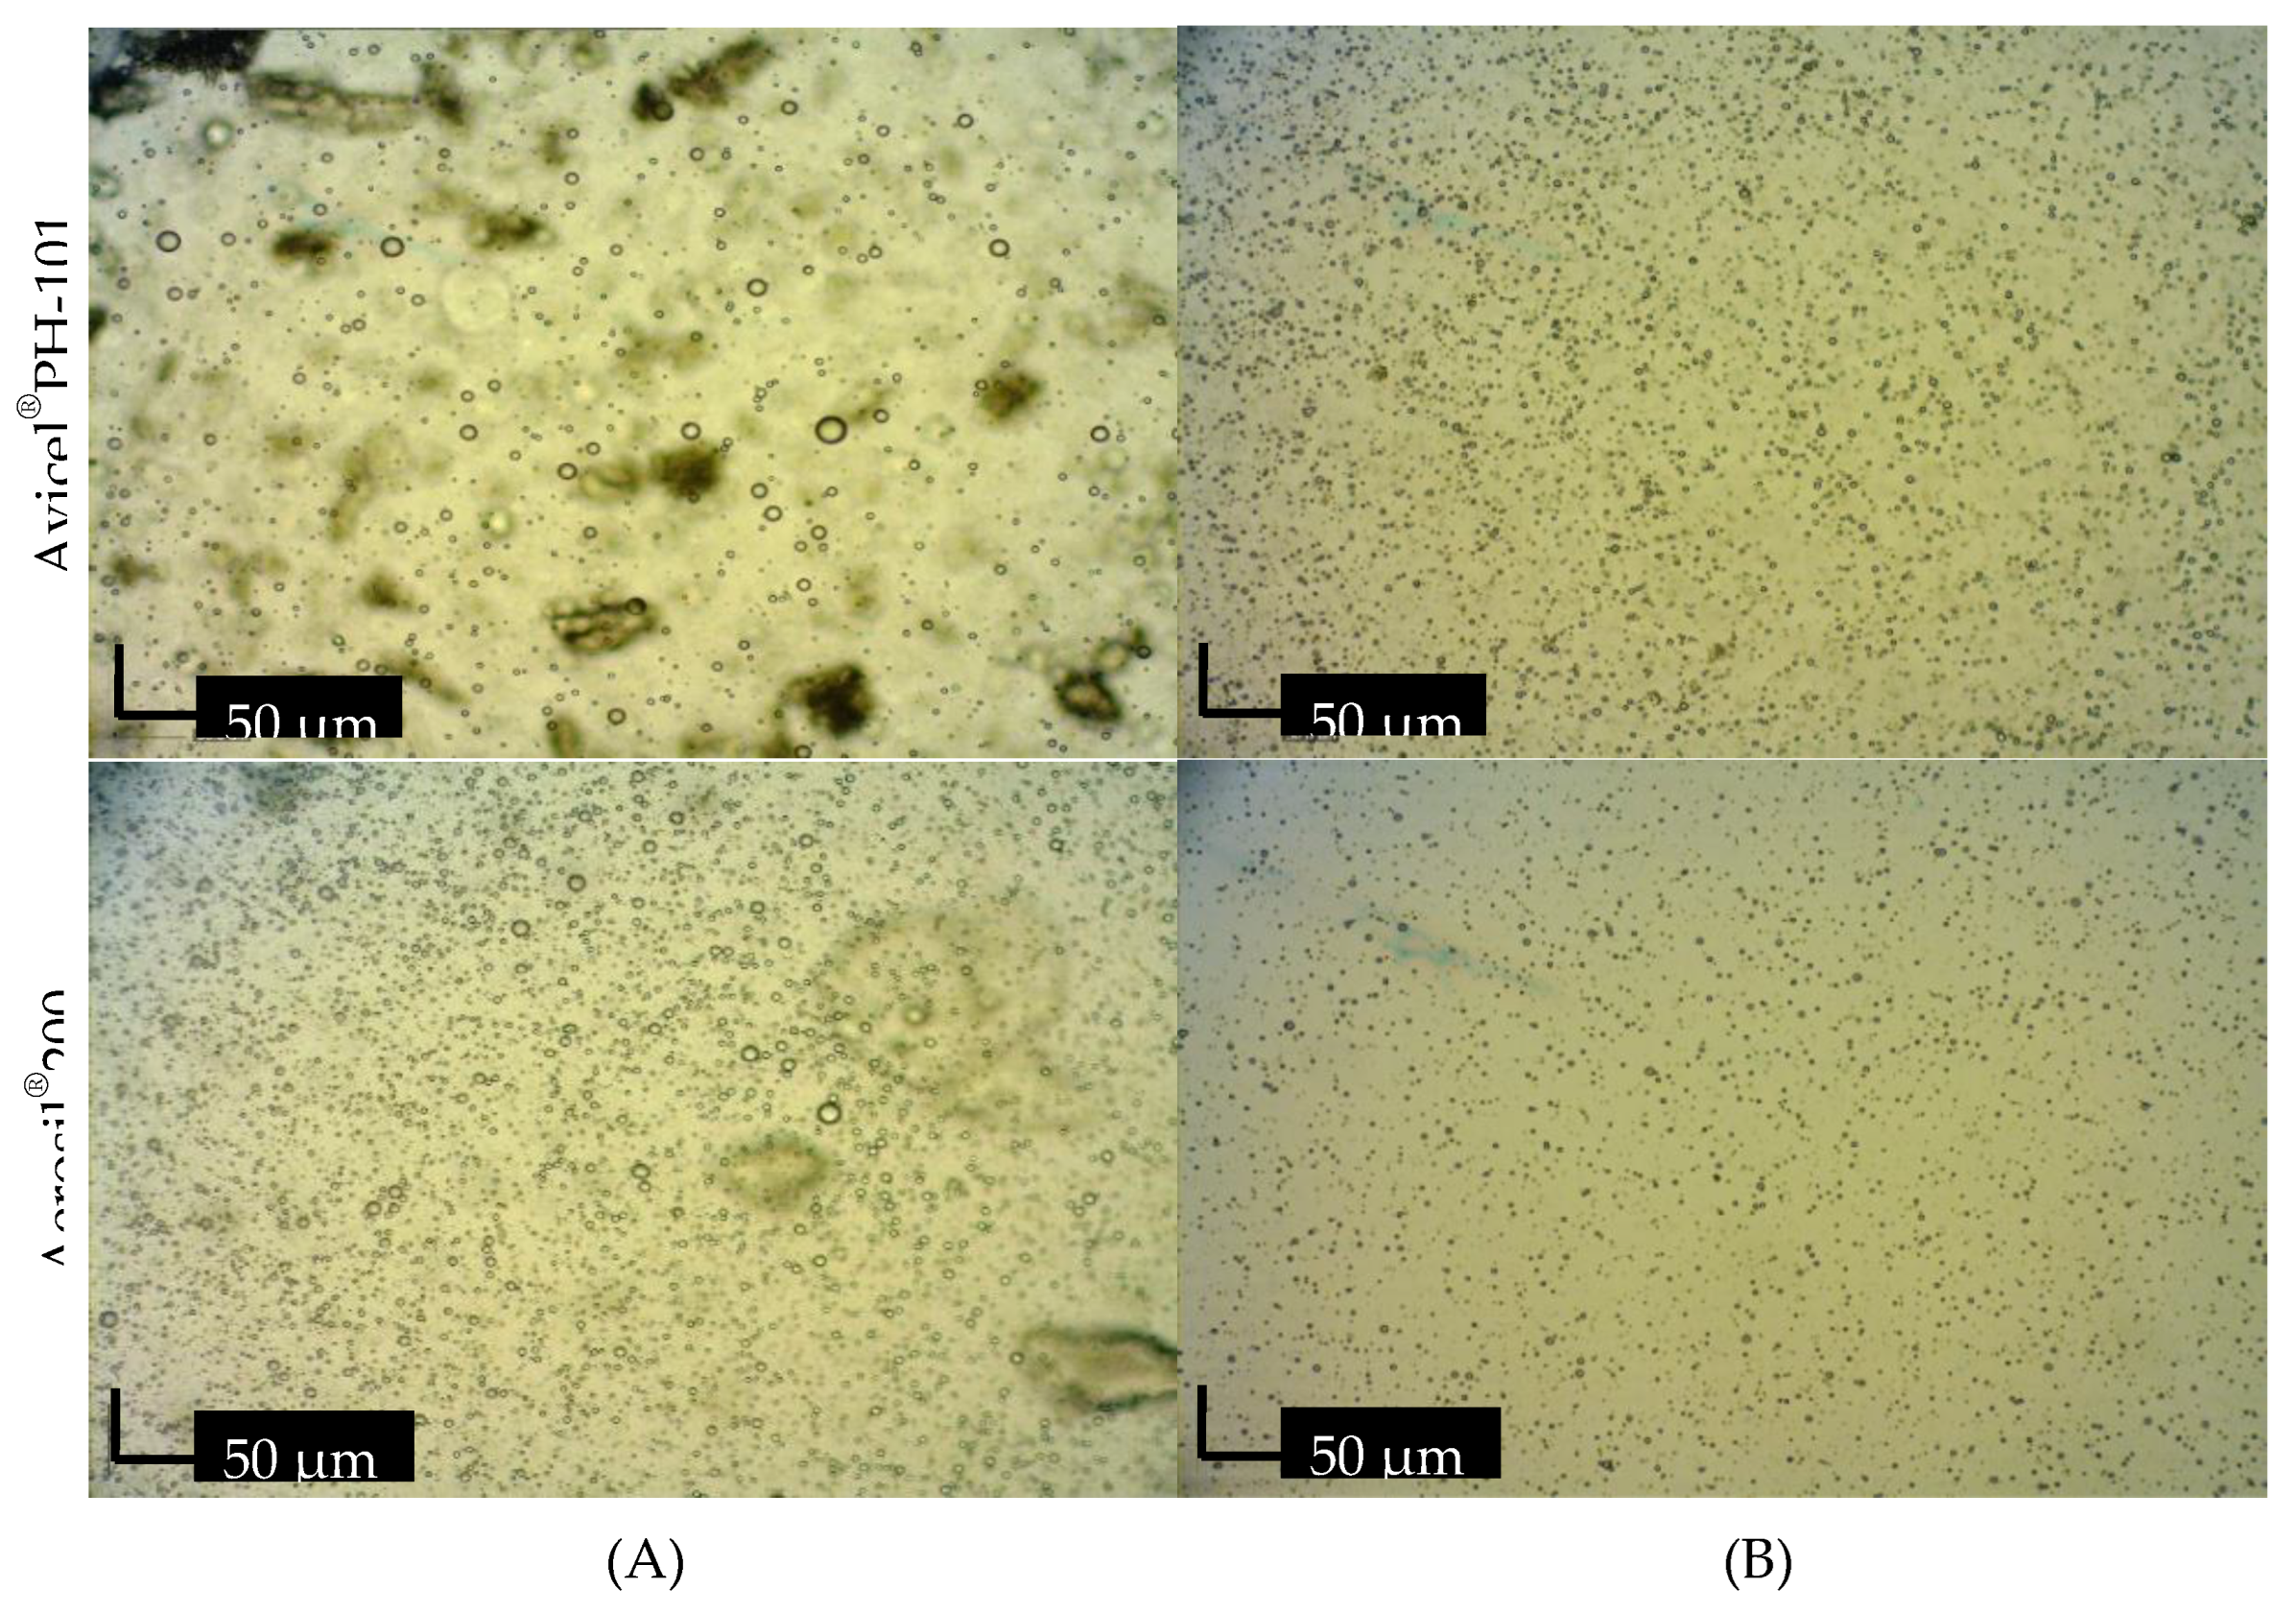
To confirm the homogeneity of both reconstituted emulsions, Figure 14A presents photomicrographs depicting the reconstituted emulsions obtained from Avicel® PH-101 (upper) and Aerosil® 200 (lower) granules. In Figure 14B, photomicrographs showcase the liquid emulsions after the separation of adsorbents (Avicel® PH-101 and Aerosil® 200) from reconstituted emulsions through centrifugation. Both separated liquid emulsions appeared homogeneous without any signs of flocculation or coalescence, as illustrated in Figure 14B.

3.3.2. Evaluation of Avicel® PH-101 granules containing ostrich oil emulsion

Due to its superior capability to release the emulsion, the dry emulsion in the form of granules, prepared from a liquid emulsion containing 10% w/w ostrich oil and 10% w/w lecithin with Avicel® PH-101 as an adsorbent using the adsorption technique, was evaluated for physical properties, heavy metal contents, and microbial contamination. The particle size of the granules was primarily measured at 401.50 ± 1.57 µm. The compressibility index provides insights into bulk density and anticipated powder flow behavior. For Avicel® PH-101 granules containing ostrich oil emulsion, the compressibility index was found to be 19.43 ± 0.95%. This outcome classified the flowability of the granules as fair, in accordance with the flowability scale outlined in 〈1174〉 Powder flow, USP 43-NF 38 [94]. The classification of flowability as fair suggested that the granules exhibited moderate flow properties.
The complete dissolution of all capsules, each containing these granules (n = 6), occurred during a 30-min immersion period, in accordance with the specifications outlined in 〈2040〉 Disintegration and dissolution of dietary supplements, USP 43-NF 38 [95]. The calculated mean disintegration time, at 3.11 ± 0.14 min, further supports the efficient breakdown of the granules, indicating their suitability for oral administration and absorption of the encapsulated ostrich oil emulsion. These results collectively contribute to the overall assessment of the granules’ physical characteristics, emphasizing their potential as a viable formulation for delivering the ostrich oil emulsion in dietary supplements.
The levels of heavy metals in Avicel® PH-101 granules containing ostrich oil emulsion were determined to be within the allowed thresholds, with arsenic (As) < 0.0005 mg/kg, cadmium (Cd) < 0.0005 mg/kg, lead (Pb) = 0.0860 mg/kg, and mercury (Hg) = 0.0007 mg/kg. These values comply with the established limits for element contaminants in dietary supplements, as stipulated by the guidelines in 〈2232〉 Element contaminants in dietary supplements, USP 43-NF 38 [96] (As < 1.5 mg/kg, Cd < 0.5 mg/kg, Pb < 0.5 mg/kg, and Hg < 1.5 mg/kg). Regarding microbial attributes, the microbial counts in the Avicel® PH-101 granules containing ostrich oil emulsion adhered to the defined microbial limit standards outlined for nonsterile nutritional and dietary supplements in 〈2023〉 Microbiological attributes of nonsterile nutritional and dietary supplements, USP 43-NF 38 [97]. Both the TAMC and TYMC were below 104 cfu/g and 103 cfu/g, respectively. Notably, Salmonella spp. and E. coli were not detected in the sample (10 g). These results affirm the safety and compliance of the formulated dry emulsion granules with established quality and regulatory standards for dietary supplements.
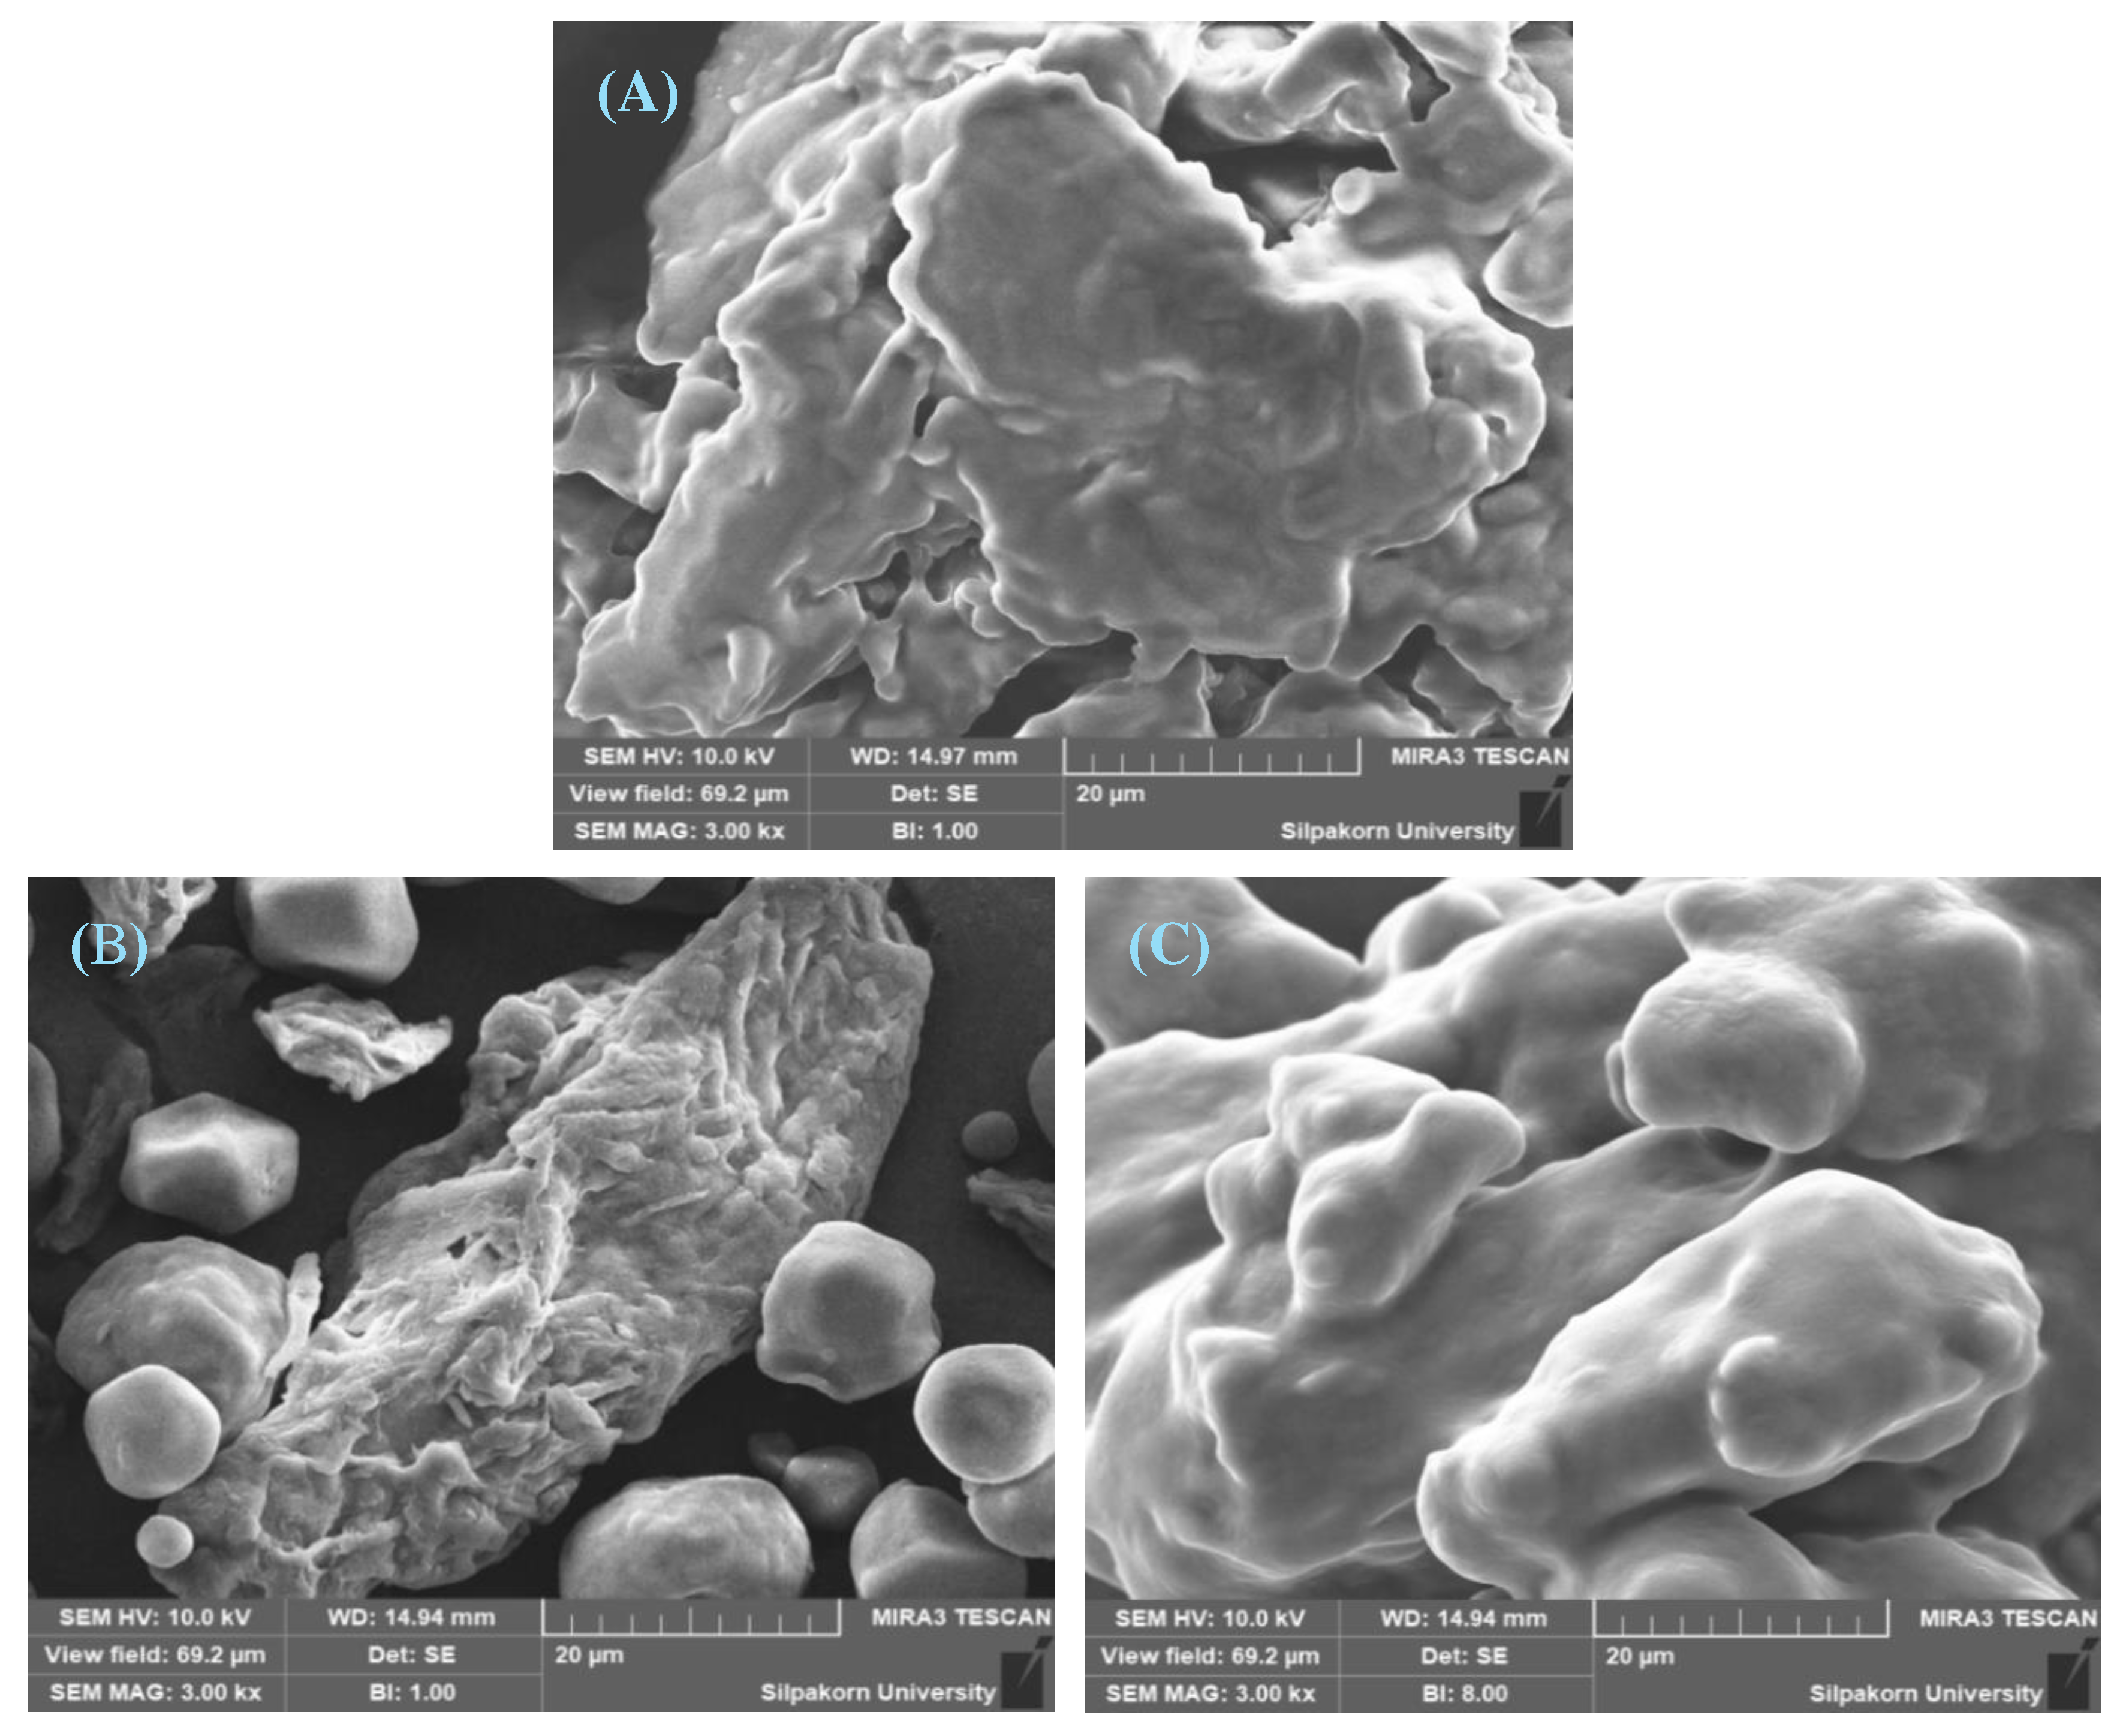
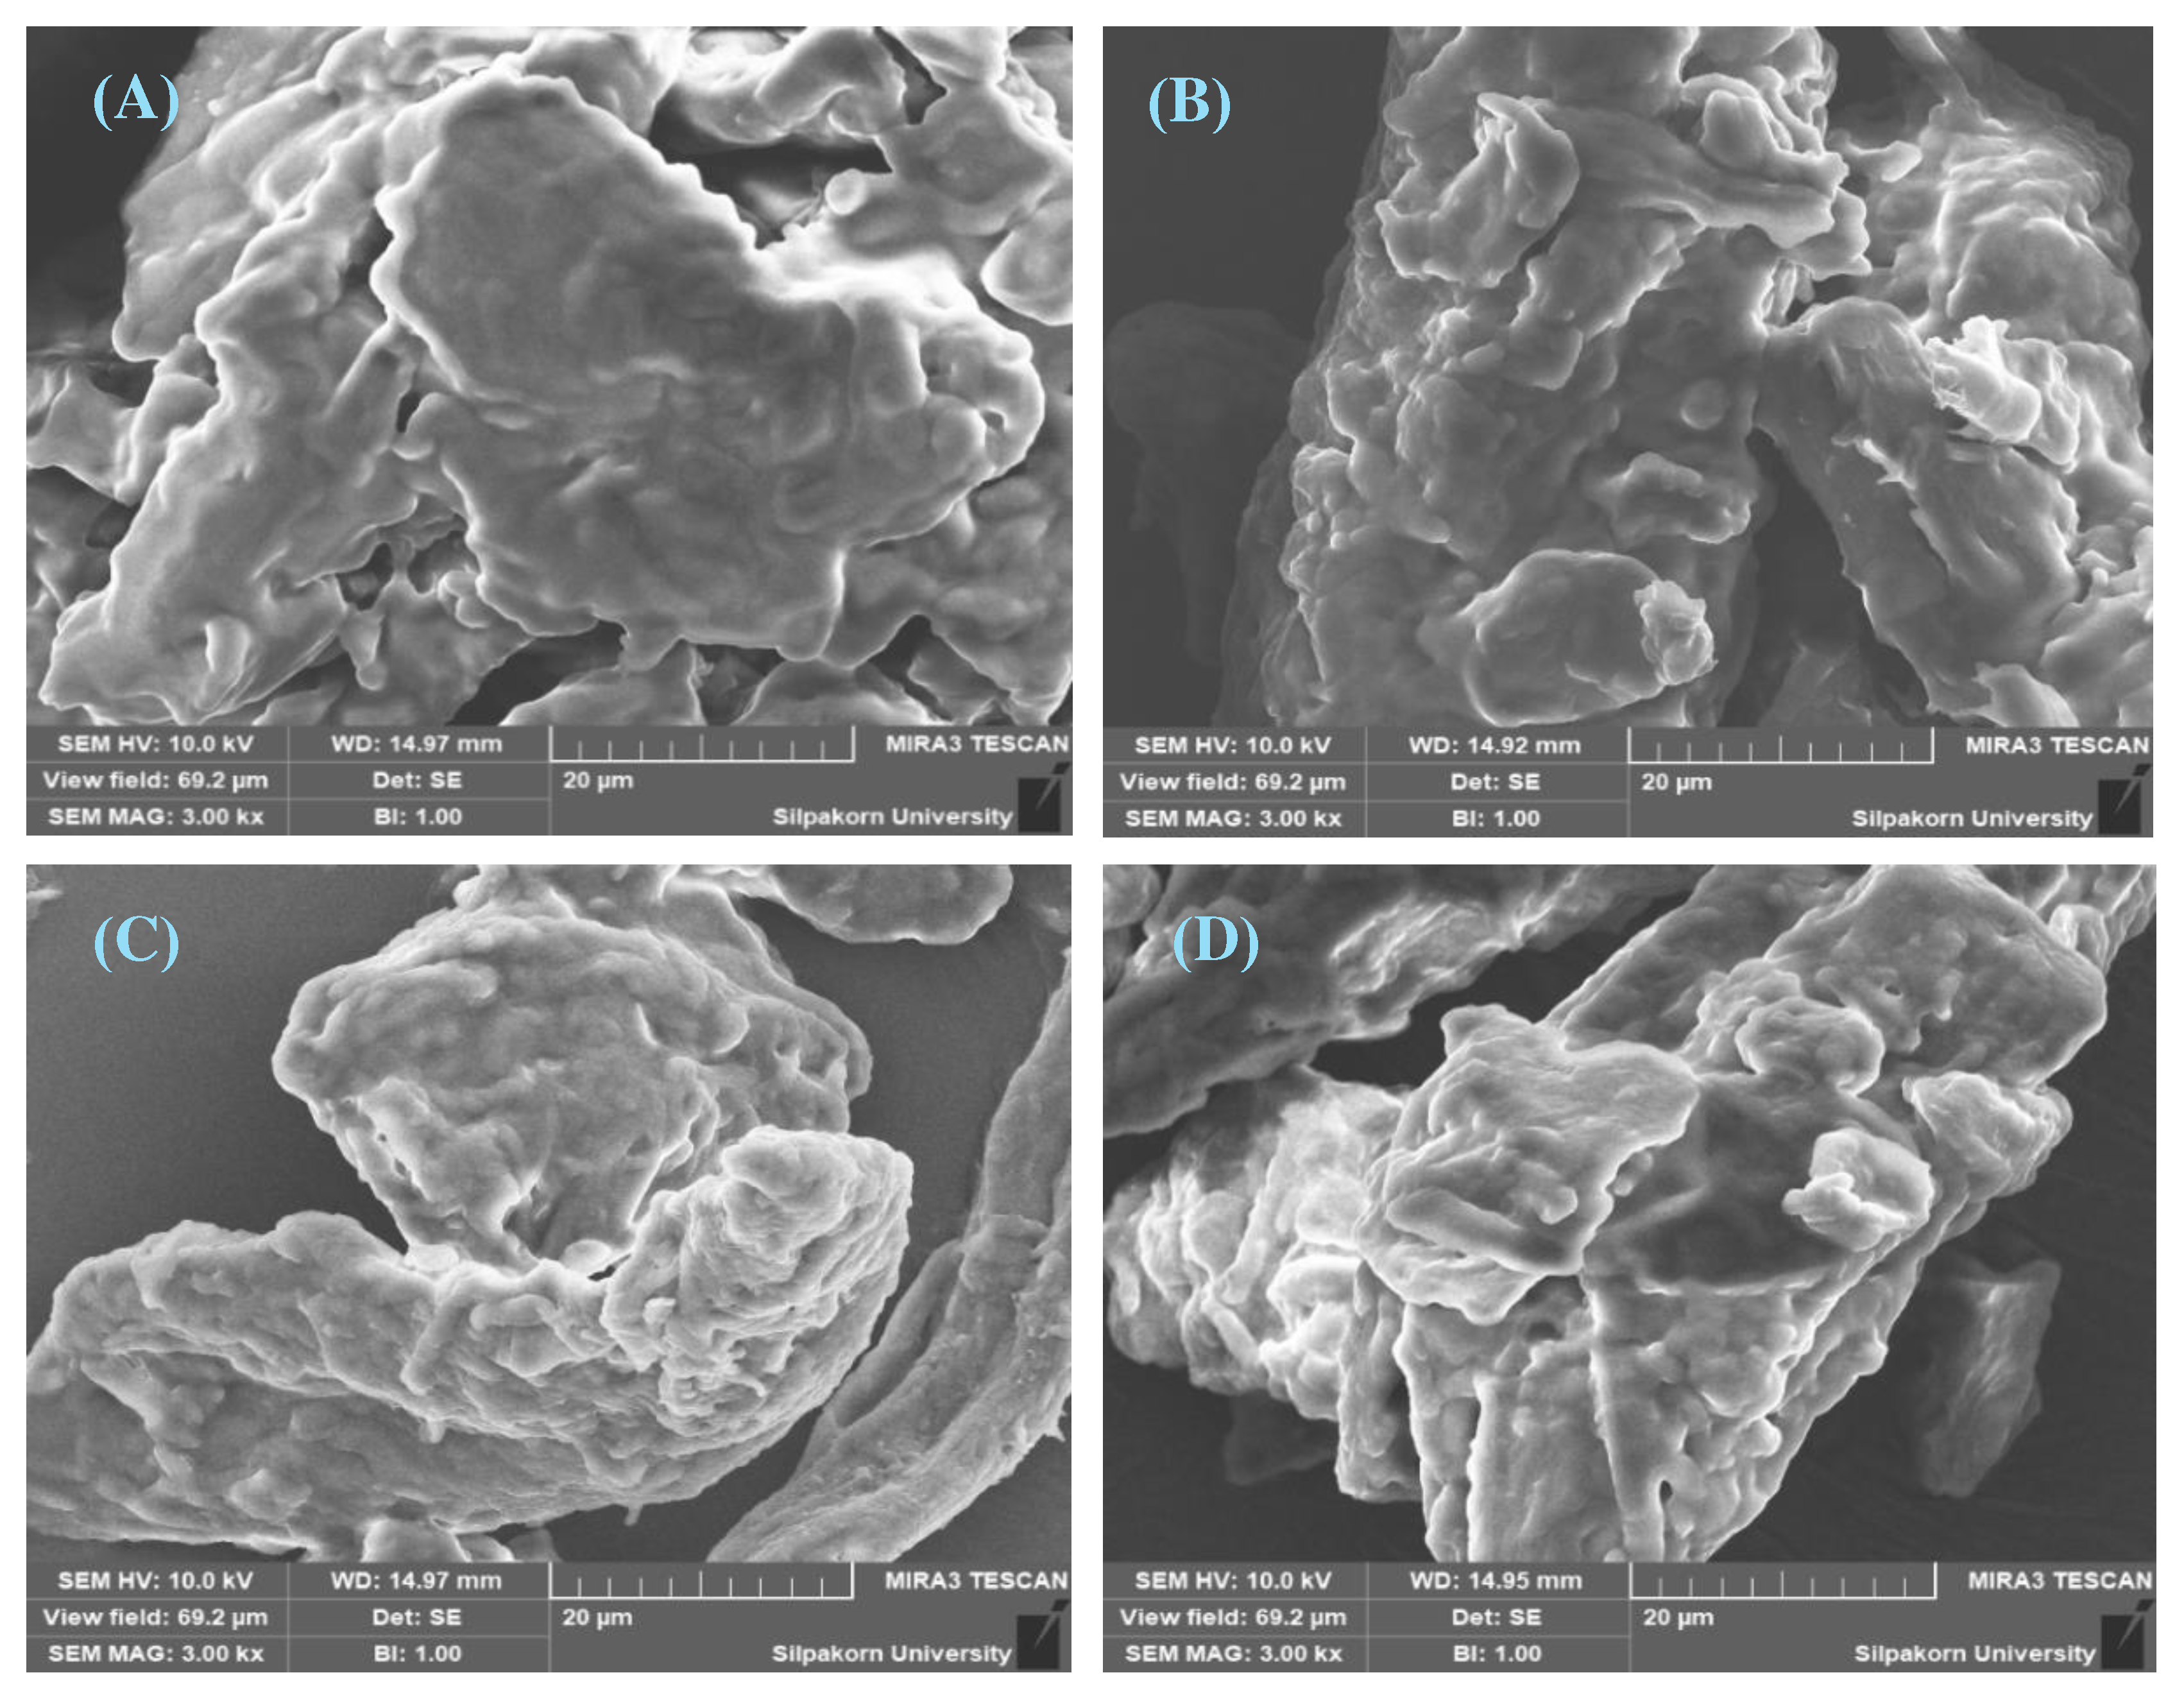
The scanning electron microscopy (SEM) images (Figure 15) provide valuable insights into the surface morphology of the formulated granules. Notably, the surface of the Avicel® PH-101 granules containing ostrich oil emulsion appeared smoother when compared to Avicel® PH-101 alone. This observation suggests that the incorporation of ostrich oil emulsion resulted in a more uniform and refined surface texture. However, it’s important to note that, in comparison to pure lecithin, the surface of the Avicel® PH-101 granules containing ostrich oil emulsion still exhibited a relatively rougher texture. This difference in surface characteristics could be attributed to the interaction between Avicel® PH-101 and the components of the ostrich oil emulsion, influencing the overall topography of the granules. These SEM findings highlight the impact of the emulsion formulation on the surface morphology of the granules, providing visual evidence of the structural changes induced by the presence of ostrich oil emulsion within the Avicel® PH-101 matrix. Such insights contribute to a comprehensive understanding of the physical attributes of the formulated granules and their potential implications for performance and functionality in various applications.
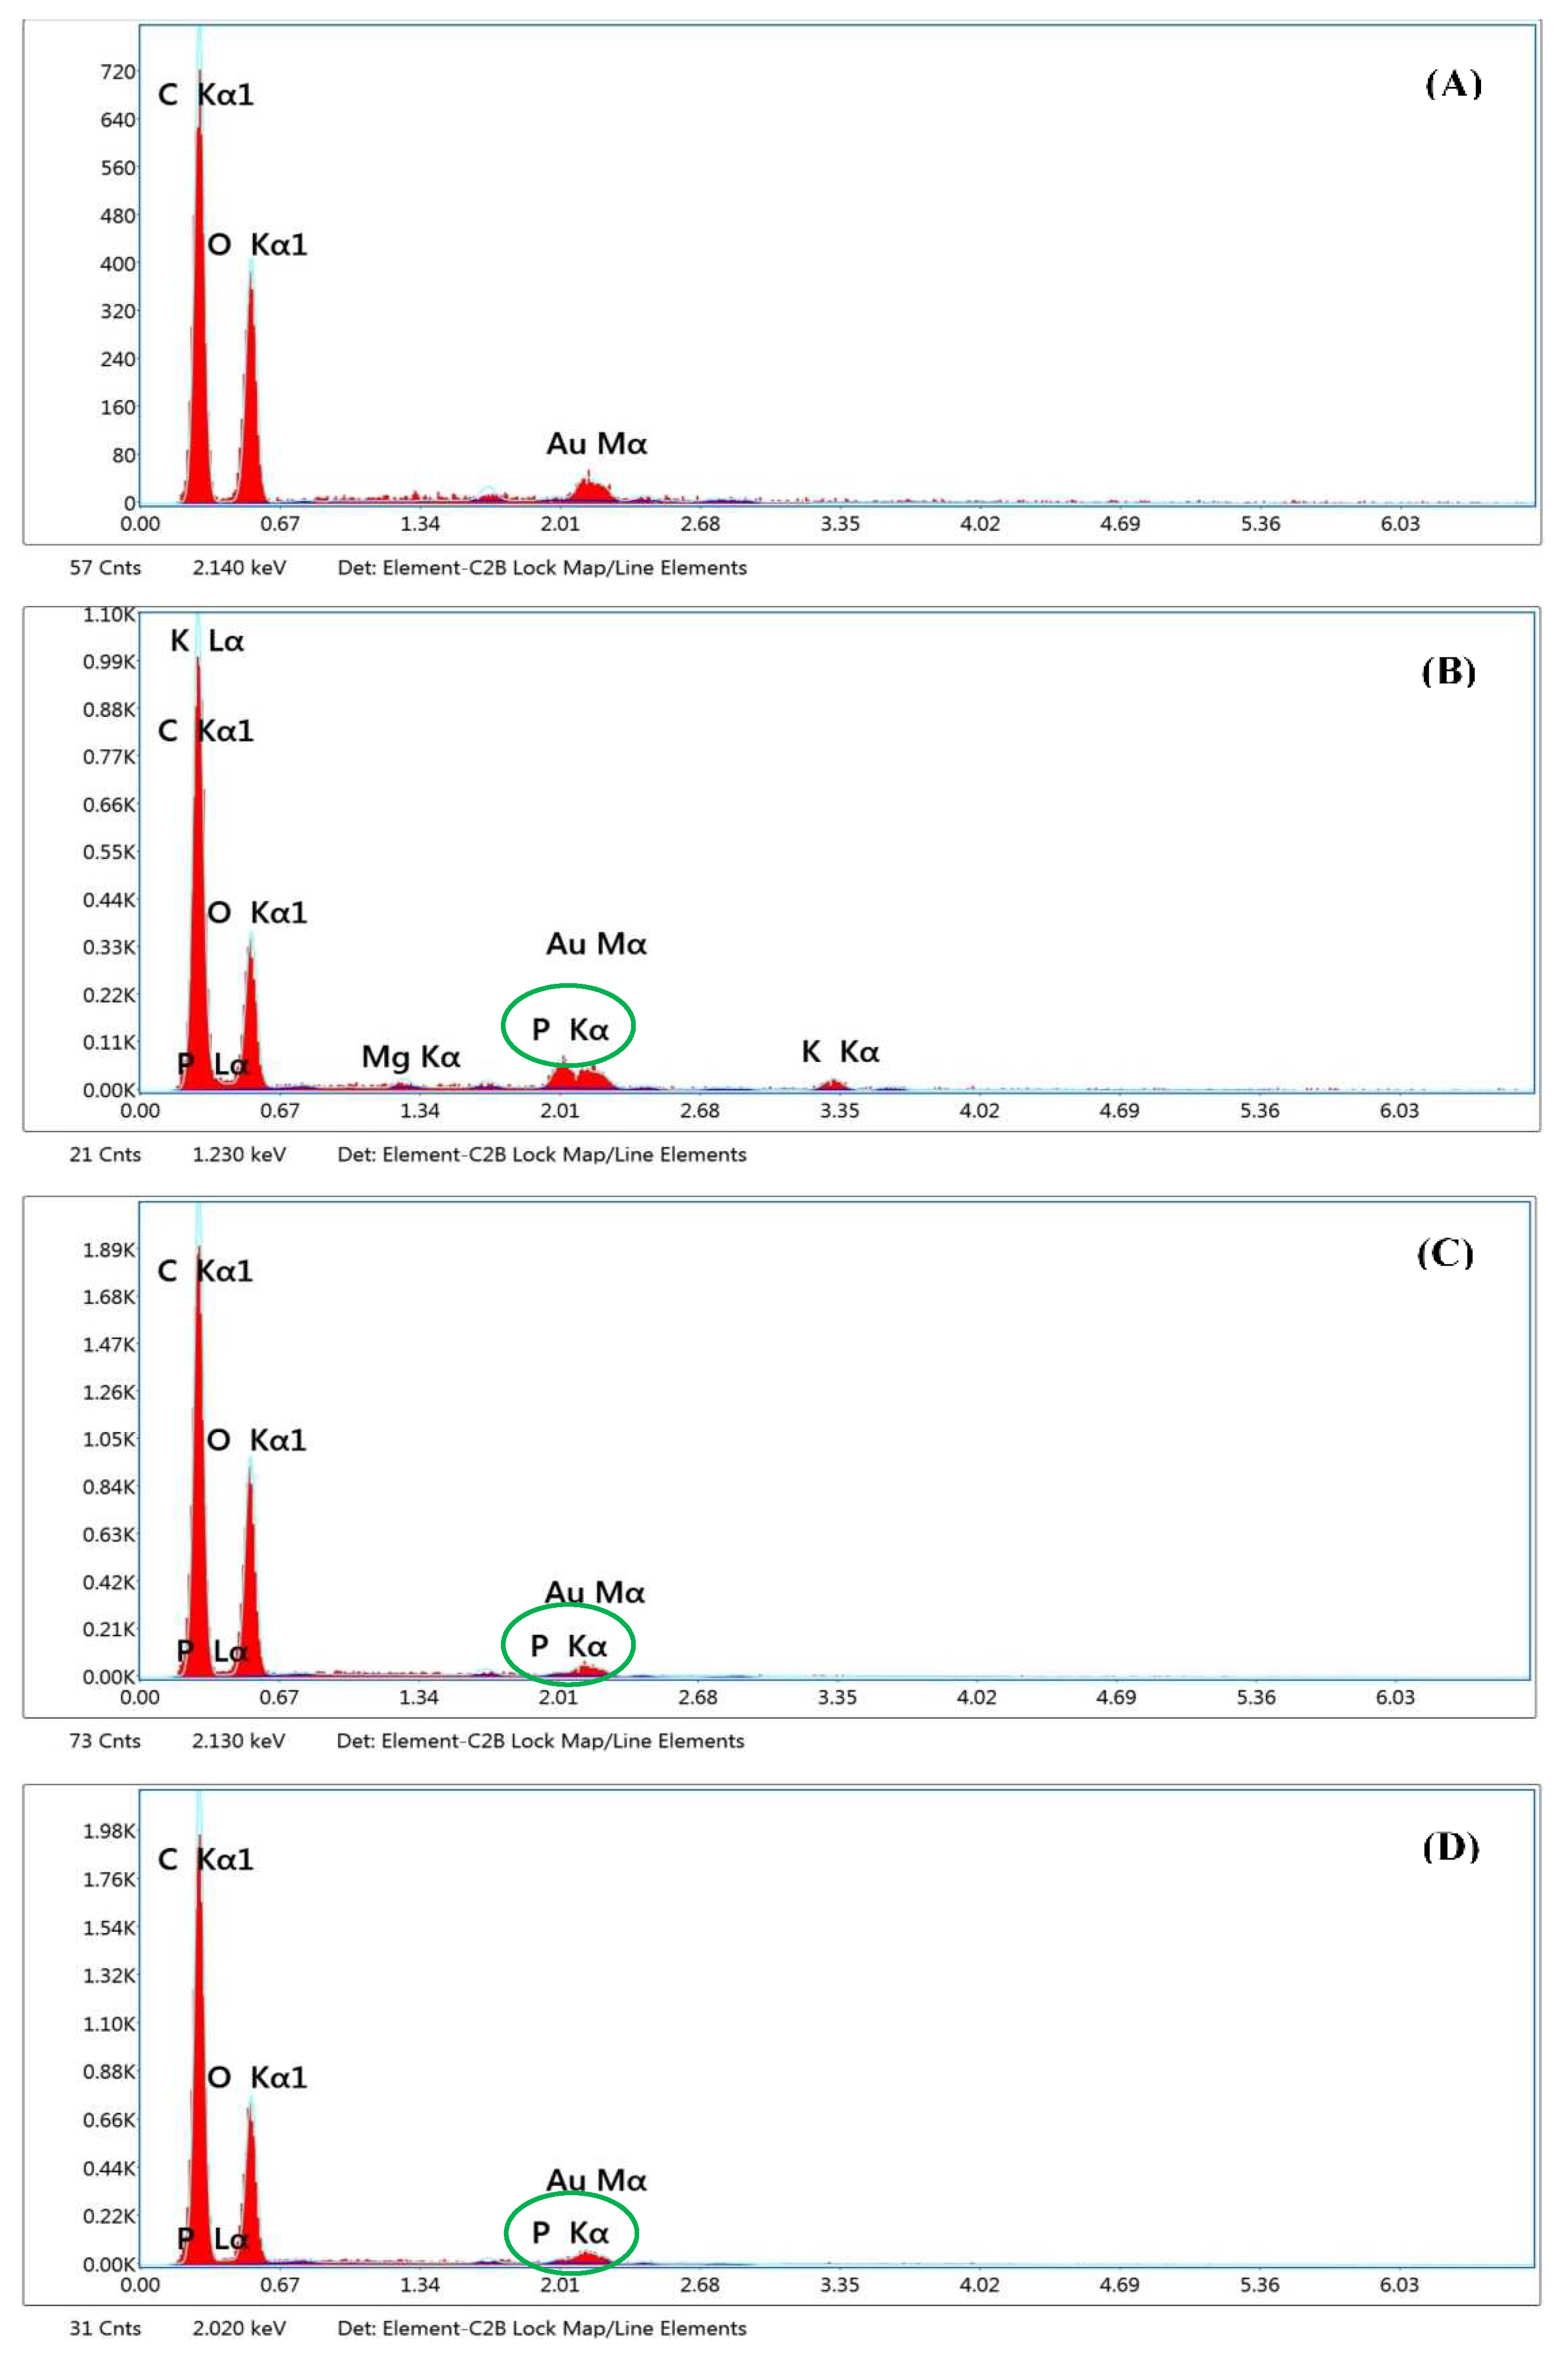
The integration of scanning electron microscopy-energy dispersive X-ray spectroscopy (SEM-EDS) has yielded valuable insights into the interaction between Avicel® PH-101 granules and the ostrich oil emulsion, utilizing lecithin as an emulsifier. The analysis uncovered a distinctive phosphate peak in the spectrum corresponding to lecithin (Figure 16 B). Notably, this phosphate peak exhibited a significant decrease in the spectrum obtained from Avicel® PH-101 granules containing the ostrich oil emulsion (Figure 16 C and Figure 16 D). The reduction of the phosphate peak in the presence of the ostrich oil emulsion strongly indicates the loading of the ostrich oil emulsion, emulsified with lecithin, onto the Avicel® PH-101 adsorbent. Avicel® PH-101, recognized for its high adsorption capacity, appears to efficiently adsorb and encapsulate the ostrich oil emulsion, resulting in a modification of the elemental composition observed through SEM-EDS analysis. Furthermore, Avicel® PH-101 granules containing ostrich oil emulsion, stored at 4 °C (Figure 16C), and 45 °C (Figure 16D), exhibited a decrease in phosphate peaks in the spectra, confirming the stability of the dry emulsion. This collective evidence reinforces the proposition that Avicel® PH-101 granules serve as an efficient adsorbent for ostrich oil emulsion.

3.4. Stability

3.4.1. Color and morphological stability

To assess physicochemical stability, a series of alternating conditions were applied to ostrich oil and Avicel® PH-101 granules containing ostrich oil emulsion, both with and without 0.01% w/w butylated hydroxytoluene (BHT). These conditions involved cycles of exposure: 24 h at 4 °C followed by 24 h at 45 °C, all maintained at a RH of 75 ± 2%. This alternating cycle was repeated for a total of six cycles. Additionally, the samples were subjected to prolonged stability testing at distinct temperatures, including 4 °C, 25 °C, and 45 °C, all under a consistent RH of 75 ± 2%, spanning a duration of 180 days. UV-Vis spectrophotometry was utilized to determine the stability of ostrich oil and ostrich oil with 0.1% w/w BHT. This analytical technique is effective for monitoring the stability of oil components, as their deterioration frequently corresponds to variations in the color profile of the oil [60]. Using a UV-Vis spectrophotometer at a wavelength of 425 nm, the absorbance values of the samples subjected to temperature cycling were determined. Figure 17 demonstrates that the absorbance of ostrich oil containing BHT was marginally lower than that of ostrich oil alone. This variation in absorbance provides valuable insight into the enhanced stability conferred by the presence of BHT in the formulation of ostrich oil. The absorbance values of both ostrich oil and ostrich oil with 0.01% w/w BHT were measured over a span of 180 days, at varying temperatures, including 4 °C, 25 °C, and 45 °C, on days 0, 30, 90, and 180. For ostrich oil lacking BHT, the samples kept at 45 °C displayed the highest absorbance values, whereas those maintained at 25 °C exhibited greater absorbance compared to those stored at 4 °C, as depicted in Figure 18. Similarly, in the case of ostrich oil with BHT, the highest absorbance values were observed in samples stored at 45 °C, followed by those at 25 °C, with 4 °C samples exhibiting the lowest absorbance, as illustrated in Figure 18. In the period spanning from day 90 to day 180 of storage, a noteworthy trend emerged. The absorbance value of ostrich oil with BHT, stored at 45 °C, approached that of ostrich oil without BHT stored at 25 °C. Meanwhile, the samples with and without BHT stored at 4 °C, as well as the samples with BHT stored at 25 °C, exhibited similar absorbance values, as demonstrated in Figure 18. These findings collectively indicate that the inclusion of BHT effectively stabilized the ostrich oil, particularly when exposed to elevated temperatures. By attenuating the absorbance changes associated with oil degradation, BHT demonstrated its potential to enhance the stability of ostrich oil during storage under challenging conditions.
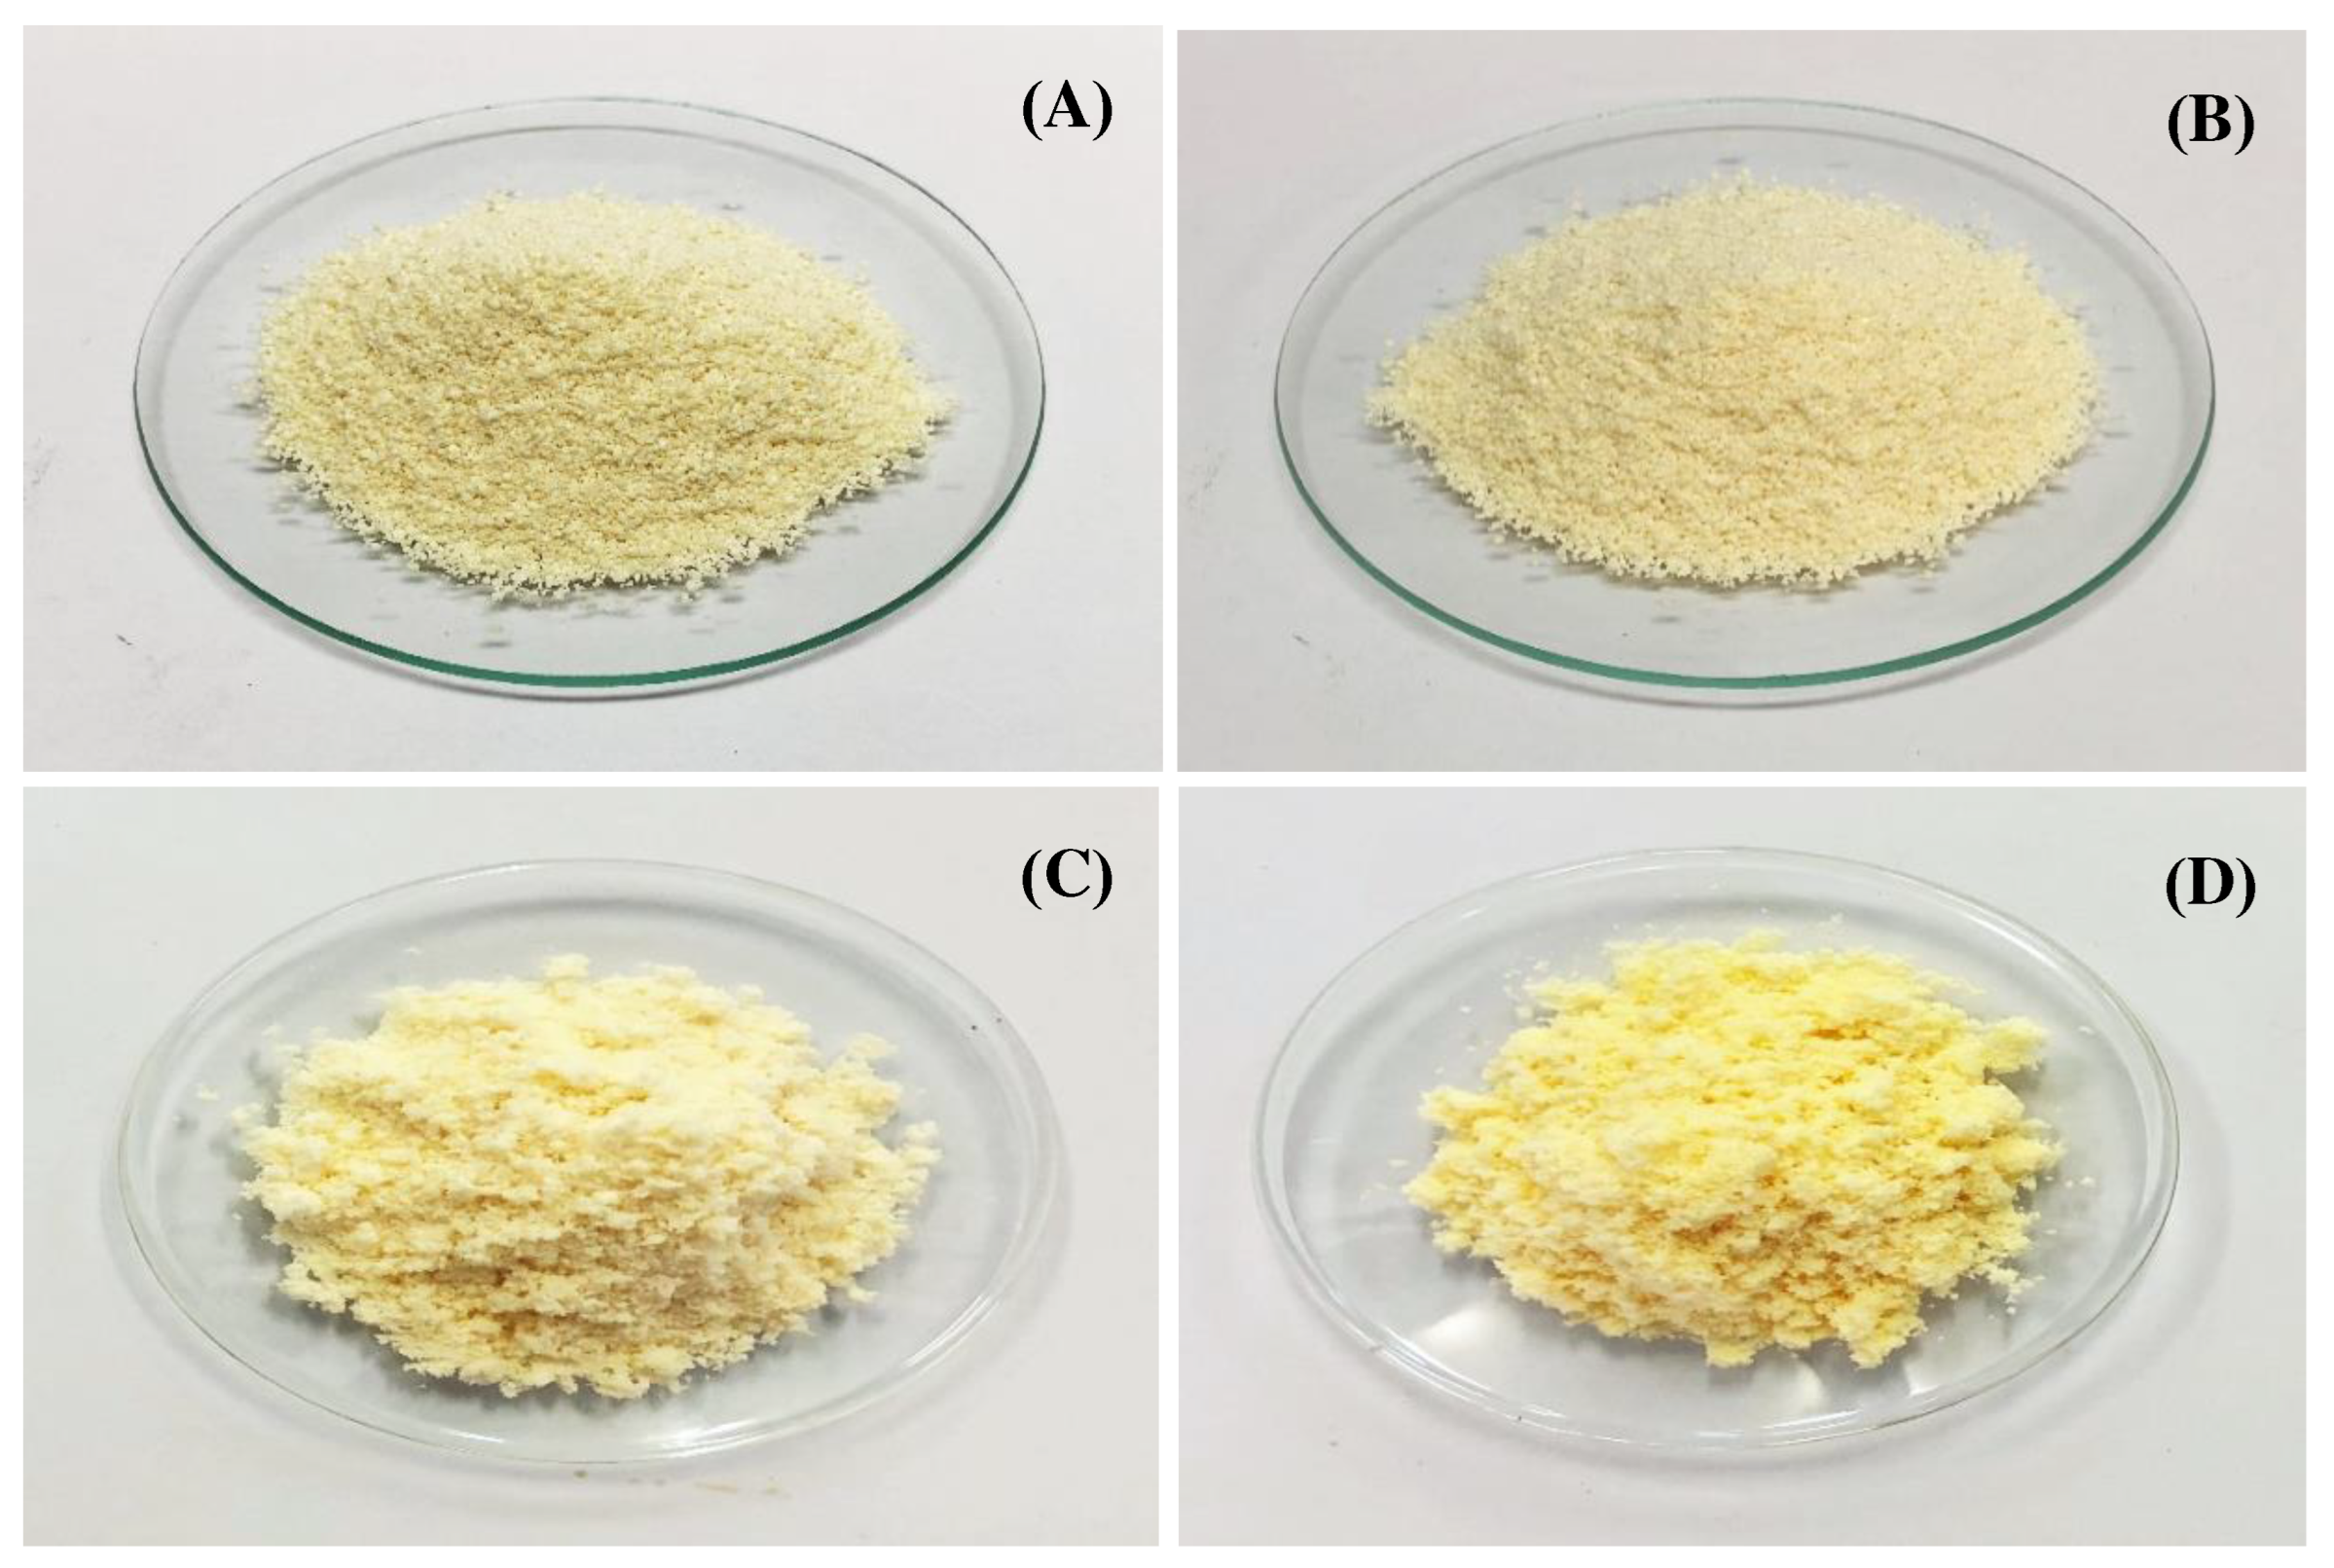
The impact of various temperatures (4 °C, 25 °C, and 45 °C) on Avicel® PH-101 granules containing ostrich oil emulsion was investigated through optical microscopy and SEM analysis. Notably, the granules subjected to 180 days of storage at 45 °C exhibited the most pronounced yellow coloration, while those initially stored and the ones kept at 4 °C and 25 °C for the same duration appeared pale yellow, as depicted in Figure 19. It was evident that the color of the granules progressively deepened towards a darker yellow shade during extended storage at elevated temperatures. This change in coloration is largely attributed to the process of oxidation, suggesting a reduced stability of the granules [98]. The observed discoloration serves as an indicator of the oxidative degradation that occurred during storage, particularly under higher temperature conditions. This finding underscores the sensitivity of the granules to oxidative processes, highlighting the importance of temperature control to maintain their stability over time.
The color assessment of Avicel® PH-101 granules, which contained ostrich oil emulsion with and without BHT, was carried out during stability testing involving 6 cycles of temperature cycling. The measurements were executed using a colorimeter (FRU WF32, SciLution, Shenzhen, China), and the corresponding results are outlined in Table 4. The CIE L* a* b* (CIELAB) color scale, rooted in the opponent-color theory, was employed. Within this scale, L* signifies lightness, a* represents the red/green coordinate (+ a* indicating redness, and - a* indicating greenness), b* denotes the yellow/blue coordinate (+ b* indicating yellowness, and - b* indicating blueness), while ΔЕ measures the color difference between two colors. The magnitude of color variation, categorized by ΔE, is as follows: indistinguishable difference (0 - 0.5); slight difference (0.5 - 1.5); noticeable difference (1.5 - 3.0); appreciable difference (3.0 - 6.0); large difference (6.0 - 12.0); and very obvious difference (> 12.0) [99]. At the outset, the L*, a*, and b* values of Avicel® PH-101 granules containing ostrich oil emulsion with and without BHT were around 92, -0.6, and 18, respectively, indicating that those granules had high brightness. The color comparisons between Avicel® PH-101 granules containing ostrich oil emulsion with BHT (ΔE = 0.15) and without BHT (ΔE = 0.19), subjected to temperature cycling, fell within the range of indistinguishable color differences, as depicted in Table 4. This analysis suggests that, despite exposure to temperature cycling, the color differences between Avicel® PH-101 granules containing ostrich oil emulsion with and without BHT remained within a range considered indistinguishable. This information is crucial for understanding the stability and color consistency of the granules under the specified conditions.
The study on the stability of Avicel® PH-101 granules containing ostrich oil emulsion, with and without the addition of BHT, provided valuable insights into the impact of storage conditions on color changes and surface morphology over a 180-day period. The color changes of Avicel® PH-101 granules containing ostrich oil emulsion with and without BHT, stored at 4 °C, 25 °C, and 45 °C on days 0, 30, 90, and 180, are presented in Table 5. For Avicel® PH-101 granules containing ostrich oil emulsion with BHT, the ΔE values of the granules stored at 4 °C and 25 °C fell within the range of 0.18 to 0.38, indicating that the color change was within the imperceptible range. Throughout the 180-day storage period at 45 °C, there was a noticeable increase in the a* and b* values, coupled with a decrease in the L* values across all samples. Notably, the ΔE values for the granules stored at 45 °C on days 30, 90, and 180 were measured at 1.64, 4.18, and 7.46, respectively. These values point towards color shifts falling within the categories of noticeable, appreciable, and large differences. This trend was substantiated by the progressive visual alteration of color in all samples, from a pale yellow to a more intense yellow, as visually presented in Figure 19. These findings underscore the temperature-dependent impact on color stability, with more pronounced changes observed at elevated temperatures. The visual representation in Figure 19 enhances the understanding of the observed color shifts, providing valuable insights into the color evolution of the granules during the storage period.
For Avicel® PH-101 granules containing ostrich oil emulsion without BHT, a slight alteration (ΔЕ = 0.54) was observed in the granules stored at 25 °C over a period of 180 days. In stark contrast, the granules exposed to 180-day storage at 45 °C displayed a significant contrast, evident through the highest ΔЕ value (19.97), as detailed in Table 5. These observations underscore the influence of temperature on the stability of Avicel® PH-101 granules infused with ostrich oil emulsion. Furthermore, the addition of BHT appeared to provide a safeguard against degradation under elevated temperature conditions. These insights hold substantial significance for formulating and maintaining products incorporating Avicel® PH-101 granules along with ostrich oil emulsion, facilitating quality assurance over time.
The SEM analysis of Avicel® PH-101 granules, incorporating ostrich oil emulsion, was conducted initially and after 180 days of storage at 4 °C, 25 °C, and 45 °C, as illustrated in Figure 20. This analysis complements the overall stability assessment, revealing that the surfaces of all samples remained consistently indistinguishable throughout the storage period. The sustained surface morphology aligns with the observed stability in the color assessment, underscoring the significant role of BHT in preserving the integrity of the granules across diverse storage conditions.
In summary, the comprehensive stability analysis provides a holistic understanding of the intricate interplay between temperature, BHT addition, and the color and surface characteristics of Avicel® PH-101 granules containing ostrich oil emulsion. These findings offer substantial insights into the formulation and considerations for maintaining product quality when utilizing such granules over extended periods.

3.4.2. Physicochemical stability

The physicochemical stability of ostrich oil and Avicel® PH-101 granules containing ostrich oil emulsion, both with and without BHT was assessed through two parameters: AV and PV. An elevation in free fatty acid content (indicated by a high AV) in oils signifies the occurrence of triglyceride hydrolysis. The formation of short-chain fatty acids, such as free butyric, capric, caprylic, and caproic acids, through hydrolysis, contributes to the development of the characteristic rancid flavor in oils [100]. On the other hand, PV serves as an indicator of the initial oxidation level in oils, measured by quantifying the hydroperoxides generated during oxidation. Consequently, the AV and PV serve as pivotal factors influencing the overall stability of the oil. Figure 21, Figure 22 and Figure 23 depict the AV and PV of ostrich oil with and without BHT as well as Avicel® PH-101 granules containing ostrich oil emulsion with and without BHT that were stored under temperature cycling for six cycles and at 4 °C, 25 °C, and 45 °C for 180 days. Figure 21 depicts the results of temperature cycling: ostrich oil without BHT exhibited the highest AV and PV, whereas Avicel® PH-101 granules containing ostrich oil emulsion without BHT exhibited higher AV and PV than ostrich oil with BHT and Avicel® PH-101 granules containing ostrich oil with BHT. For samples subjected to varying temperatures, the AV and PV of ostrich oil supplemented with BHT, as well as Avicel® PH-101 granules encapsulating ostrich oil emulsion with BHT, exhibited no discernible differences during storage at both 4 °C and 25 °C. This trend held true for ostrich oil without BHT as well as Avicel® PH-101 granules containing ostrich oil emulsion without BHT stored at 4 °C, as depicted in Figure 22 and Figure 23.
Across all samples stored at elevated temperatures (25 °C and 45 °C), a pronounced increase in both AV and PV was observed, particularly evident in samples lacking the presence of BHT (as depicted in Figure 22 and Figure 23). Among these variations, ostrich oil enriched with BHT exhibited the most favorable outcomes, displaying the lowest AV and PV levels. In comparison, the AV and PV of ostrich oil without BHT were lower than those found in Avicel® PH-101 granules that contained an ostrich oil emulsion without BHT. Likewise, ostrich oil, when combined with BHT in granules, showcased lower AV and PV values than its non-granulated counterpart. Remarkably, the highest AV and PV readings were noted in Avicel® PH-101 granules containing ostrich oil emulsion without BHT. These findings collectively hint at the potential susceptibility of lecithin, an emulsifier, within the granules to degradation and rancidity under elevated temperature conditions. As a result, it is reasonable to conclude that careful consideration of temperature-sensitive components, such as lecithin, is crucial when designing and storing oil-based emulsions. Despite the rise in PV being attributed to lecithin, it also highlighted its prooxidative effect [101]. In conclusion, this analysis emphasizes the necessity of proactive measures in formulating and storing oil-based emulsions, taking into account the vulnerability of certain components to degradation, especially under elevated temperatures.
Within the context of multi-ingredient dietary supplement product quality assessments as outlined in USP 43-NF 38, the evaluation specifically encompasses the analysis of AV and PV in the finished dietary supplement dosage form containing oil-based constituents [102]. Notably, criteria for acceptable AV and PV levels have not been defined for dietary supplements containing ostrich oil. Consequently, this study takes a pragmatic approach by adopting the AV and PV acceptance standards outlined in the monographs for fish oil capsules [103] and cod liver oil capsules [104], as per the directives of USP 43-NF 38 and in alignment with the guidelines of the Global Organization for EPA and DHA (GOED) [105,106]. These stipulated standards establish that AV should not surpass 3.0 mg NaOH/g and PV should remain below 5.0 meq O2/kg. Assessing the AV and PV values of freshly prepared Avicel® PH-101 granules containing ostrich oil, both with and without BHT, revealed readings of 0.07 mg NaOH/g and 0.8 meq O2/kg, respectively—both falling comfortably beneath the prescribed acceptance criteria. Impressively, even after undergoing six cycles of stability testing and enduring storage for 180 days at temperatures of 4°C and 25°C, the AV and PV levels of Avicel® PH-101 granules remained consistently below the defined acceptance criteria, as evidenced in Figure 21, Figure 22 and Figure 23. Noteworthy is the finding that storage at 4°C displayed no discernible influence on AV, although a minor impact on PV was observed. Among the range of products examined, it was notably found that Avicel® PH-101 granules containing ostrich oil, both with and without BHT, strictly adhered to the AV and PV benchmarks set forth by GOED. This compellingly underscores the safety profile of the scrutinized granules, reinforcing their suitability for consumer use.

4. Discussion

Considerations and implications of optimal dosage strategies for the consumption of ostrich oil dry emulsion as a dietary supplement
In recent years, consumers have become progressively more conscious of the vital role that food and nutrition play in their overall health. This awareness has led to a heightened focus on factors such as cholesterol content and fatty acid composition, as research has highlighted their potential links to cardiovascular disease [107]. Understanding the qualitative attributes of fats, particularly their fatty acid profiles, offers valuable insights into their overall quality. Fats rich in PUFAs are particularly valued. It is noteworthy that ostrich adipose tissue or ostrich oil presents a potential dietary supplement option for human consumption [108]. Employing an experimental model involving 150-day-old male Wistar rats, which were fed diets incorporating ostrich meat with its natural fat content, the investigation revealed negligible alterations in lipid metabolism attributed to the consumption of ostrich meat. These findings imply that the inclusion of ostrich meat in the diet does not give rise to significant concerns regarding elevated plasma lipoprotein levels or hepatic transaminase activity [109]. Furthermore, ostrich oil, harnessed as a novel dietary fat source, was integrated into the production of health-conscious biscuits due to its abundance of beneficial PUFAs, contributing to overall well-being. Notably, the utilization of ostrich oil in dietary contexts exhibited no adverse effects on liver and kidney functions or serum composition [110]. A preceding study delved into the prospect of substituting both vegetable oil and ostrich oil in the formulation of baby milk powder. This endeavor involved a comprehensive comparison between ostrich oil and various vegetable-derived oils (including palm oil, rapeseed oil, and sunflower oil) to ascertain their efficacy as fat sources for infant milk powder. This assessment was conducted with a fat concentration of 27.25% w/w in the production process using spray-drying techniques. Ostrich oil was found to be rich in predominant fatty acids, including omega-6, omega-9, and palmitic acid, akin to the fatty acid composition of breast milk. The outcomes underscored the value of ostrich oil for its fatty acid content, closely resembling the profile found in breast milk. However, it is important to acknowledge that pure animal fats, such as ostrich fat, tend to possess lower levels of phospholipids. Consequently, a strategic blending of vegetable oils and ostrich oil emerges as a viable approach to emulate the lipid composition akin to breast milk. As such, ostrich oil presents itself as a novel and viable source of edible oil for infant nutrition [111].
The ratio of PUFA/SFA serves as a prevalent metric to evaluate the nutritional merit of dietary fats for human consumption. As per established nutritional guidelines, the PUFA/SFA ratio within the human diet is advised to exceed 0.45 [74]. Notably, the PUFA/SFA ratios evident in ostrich oil surpass this threshold, with values exceeding 0.8, aligning harmoniously with nutritional directives (> 0.45). Crucially, ostrich oil boasts elevated levels of essential fatty acids, a trait distinct from various other natural oils. This distinct composition positions it as a viable dietary supplement for health promotion, underpinned by its substantial high-PUFA content, which appears to correlate with potent antioxidant activity. This characteristic lends further weight to its potential role in bolstering overall well-being [60].
Dietary guidelines provided by the WHO and the dietary reference intakes (DRIs) advocate for a total fat intake ranging from 20% to 35% of total caloric intake [112,113]. The lower limit of 20% is intended to ensure sufficient consumption of overall energy, essential fatty acids, and fat-soluble vitamins [112]. Conversely, the upper limit of 35% is rooted in the objective of curtailing saturated fat intake as well as the recognition that individuals on higher-fat diets often ingest more calories, resulting in weight gain [113]. It’s worth noting that no tolerable upper intake level (UL) has been established for total fat, as there is no discernible threshold at which adverse events occur [113]. Evidence garnered from prior observational studies and randomized clinical trials has illuminated that substituting saturated fat with carbohydrates, particularly those that are refined, fails to confer any cardiovascular disease risk reduction benefits. On the other hand, the replacement of saturated fat with PUFAs, whether in lieu of saturated fats or carbohydrates, demonstrates a propensity to reduce risk [114]. The FAO has introduced new acceptable macronutrient distribution ranges (AMDR) for adults, encompassing energy intake for both omega-6 and omega-3 [115]. Omega-3 and omega-6 assume pivotal roles in human health across all life stages, including developmental, maturation, and aging phases. Their significance extends to functions like cell membrane composition, metabolism, signal transduction, amplification, and gene expression [116]. In several countries, the average consumption of PUFAs by adults, children, and adolescents falls below the recommended levels stipulated by FAO/WHO [117]. These demographic groups exhibit heightened nutrient requirements, particularly for PUFAs, due to the demands of rapid growth and development [118,119,120]. In addition, alterations in body composition, physical activity, and the presence of a variety of health conditions result in altered nutrient requirements in the elderly. Factors such as reduced food variety, diminished appetite, sensory decline in food appreciation, dental and swallowing issues, and social considerations can lead to suboptimal PUFA intake and potentially compromise other essential micronutrients [121]. Nevertheless, the lower threshold for fat intake is contingent upon three key factors: the fat needed to fulfill energy demands, the necessity for essential fatty acids, and the quantity of dietary fat requisite for the absorption of fat-soluble vitamins, particularly vitamins A and E. For adults, the recommended intake for essential fatty acids lies within the range of 3–5% of dietary energy for omega-6 and 0.5–1.0% of dietary energy for omega-3 [122]. Notably, omega-6 and omega-3 fatty acids, along with their endogenous metabolic derivatives, have been shown to impact and potentially regulate processes such as inflammation, vasoconstriction, vasodilation, blood pressure, bronchial constriction, uterine contractility, and oxidative damage during reperfusion [123].
Ostrich oil stands out for its low cholesterol content and substantial levels of PUFAs, rendering it a viable candidate for incorporation into dietary supplements. In the context of this research, each capsule of dry emulsion (500 mg) consisted of ostrich oil (129.3 mg) and lecithin (129.3 mg), contributing 35.85 mg of omega-6 and 3.90 mg of omega-3. This composition presented a potential avenue for individuals seeking to enhance their intake of PUFAs, particularly omega-6 and omega-3, through the consumption of ostrich oil dry emulsion capsules. The levels of omega-6 and omega-3 exhibited variability between genders, influenced by dietary regimens, supplementation types, and physical activity levels in both healthy individuals and those with cardiovascular conditions [124]. This underscored the necessity for further rigorously controlled clinical investigations under well-defined protocols to comprehensively elucidate the ramifications of omega-6 and omega-3 supplementation on both overall health and disease states. However, it’s imperative to acknowledge the potential drawbacks associated with the chronic consumption of ostrich oil. Instances of adverse effects have been noted, encompassing hepatic injury, neuroinflammation, hypersensitivity reactions, and alterations in behavior. Given these findings, the present body of evidence did not lend support to the long-term utilization of ostrich oil as a dietary supplement [125]. This cautionary note underscores the need for a balanced consideration of potential benefits and risks when evaluating ostrich oil’s viability as a dietary addition.

5. Conclusion

Ostrich oil was extracted from the abdominal adipose tissues of ostriches using a low-temperature wet rendering method. The resulting ostrich oil exhibited a pale-yellow color, with a yield of 66.7% from the extraction process. Its physicochemical properties, heavy metal levels, microbial counts, and fatty acid compositions adhered to the acceptable parameters outlined by the CODEX STAN 211-1999, FAO/WHO. Additionally, the ostrich oil exhibited noteworthy antioxidant activity and featured high concentrations of PUFAs. These findings collectively indicate that the ostrich oil obtained during the preparation process exhibits excellent quality, positioning it as a suitable candidate for subsequent development into an O/W emulsion and, ultimately, for formulation as a dry emulsion.
In addition to providing health benefits, lecithin maintains a high level of ADI compliance and was employed as an emulsifier for the formulation of the ostrich oil emulsion. The results indicated that the O/W emulsion, comprised of 10% w/w ostrich oil and 10% w/w lecithin prepared via phase inversion, manifested optimal viscosity, zeta potential, and droplet size. Consequently, this formulation emerged as a suitable candidate for future development into a dry emulsion.
In the final section of this study, a dry emulsion incorporating ostrich oil emulsion was created using the adsorption technique to enhance the physicochemical stability of the ostrich oil emulsion. The effects of adsorbents, such as Avicel® PH-101 and Aerosil® 200, on the properties of granulated ostrich oil dry emulsion were studied. The findings indicated that Avicel® PH-101 exhibited a more effective discharge of ostrich oil emulsion compared to Aerosil® 200. The results affirm Avicel® PH-101 as a suitable adsorbent for the formulation of ostrich oil dry emulsion.
In summary, the dry emulsion, composed of Avicel® PH-101, ostrich oil, and lecithin, yielded favorable outcomes across all evaluation tests. The granule particle size averaged 401.50 ± 1.57 µm, exhibiting a moderately smooth flow. For easier swallowing, the granulated dry emulsion was filled into capsules. Disintegration time for all granule-filled capsules adhered to the USP 43-NF 38 criteria, with a mean of 3.11 ± 0.14 min. Both microbial loads and heavy metal contents remained within acceptable thresholds. The dry emulsion of ostrich oil, presented as granules containing BHT, showcased robust temperature stability along with promising attributes. These findings suggest potential applicability in the development of dietary supplements encompassing diverse animal oils.

Author Contributions

Chutima Limmatvapirat: Project administration, Funding acquisition, Supervision Methodology, Investigation, Formal analysis, Data curation, Software, Writing and editing the manuscript. Juthaporn Ponphaiboon: Methodology, Investigation, Formal analysis. Sontaya Limmatvapirat: Project administration, Supervision.

Funding

This research was supported by Silpakorn University under the Postdoctoral fellowship program [grant number: SURDI Postdoctoral/66/4].

Institutional Review Board Statement

The acquisition of fresh ostrich fat for the study followed established animal welfare guidelines.

Data Availability Statement

The authors do not have permission to share data.

Conflicts of Interest

The authors declare that they have no known competing financial interests or personal relationships that could have appeared to influence the work reported in this paper.

References

  1. Brassó, L.D.; Béri, B.; Komlósi, I. Studies on ostrich (Struthio Camelus) – Review. Acta Agrar. Debr. 2020, 1, 15–22. [Google Scholar] [CrossRef] [PubMed]
  2. Kuzelov, A.; Jordanoski, M.; Gacovski, Z.; Trajcova, D. Economical benefit from Ostrich (Struthio Camelus L.) breeding and primary processing. Maced. J. Anim. Sci. 2012, 2, 89–92. [Google Scholar] [CrossRef]
  3. Hui, Y. (1996) Bailey’s Industrial Oil and Fat Products. John Wiley and Sons Inc., New York, 281-282.
  4. Sharma, H.; Giriprasad, R.; Goswami, M. Animal fat-processing and its quality control. J. Food Process. Technol. 2013, 4, 1000252. [Google Scholar] [CrossRef]
  5. Sugihartono; Rahmawati, D.; Radnawati, E.; Priatni, A. Extraction of fat/oil from fleshing by-product using a wet rendering process and combination with organic solvents. MKKP 2019, 35, 7–16. [Google Scholar] [CrossRef]
  6. Gavanji, S.; Larki, B.; Taraghian, A.H. A review of application of ostrich oil in pharmacy and diseases treatment. J. Nov. Appl. Sci. 2013, 2, 650–654. [Google Scholar]
  7. Okparanta, S.; Daminabo, V.; Solomon, L. Assessment of rancidity and other physicochemical properties of edible oils (mustard and corn oils) stored at room temperature. J. Food Nutr. Sci. 2018, 6, 70–75. [Google Scholar] [CrossRef]
  8. Talbot, G. 24-The stability and shelf life of fats and oils. In Food and Beverage Stability and Shelf Life; Woodhead Publishing Series in Food Science, Technology and Nutrition, 2011, 683-715. [CrossRef]
  9. Mimica-Dukić, N.; Simin, N.; Svirčev, E.; Orčić, D.; Beara, I.; Lesjak, M.; Božin, B. The effect of plant secondary metabolites on lipid peroxidation and eicosanoid pathway. In Lipid Peroxidation; Catala, A. Ed.; 2012, 193-210. [CrossRef]
  10. Gresley, A.L.; Ampem, G.; Mars, S.D.; Grootveld, M.; Naughton, D.P. “Real-world” Evaluation of lipid oxidation products and trace metals in french fries from two chain fast-food restaurants. Front Nutr. 2021, 8, 620952. [Google Scholar] [CrossRef]
  11. Tubino, M.; Aricetti, J.A. A green potentiometric method for determination of the acid number of oils and fats. J. Braz. Chem. Soc. 2013, 24, 1691–1696. [Google Scholar] [CrossRef]
  12. Sulieman, A.M.E.; Mohammed, M.B.; Ali, A.O. Physicochemical and sensory properties of traditionally and laboratory made ghee (Samin) of the Sudan. Int. J. Food Sci. Nutr. Eng. 2013, 3, 7–11. [Google Scholar]
  13. Limmatvapirat, C.; Limmatvapirat, S.; Charoenteeraboon, J.; Wessapan, C.; Kumsum, A.; Jenwithayaamornwech, S.; Luangthuwapranit, P. Determination of heavy metals in herbal drinks using ICP-MS. Adv. Mat. Res. 2014, 1060, 199–202. [Google Scholar] [CrossRef]
  14. Horbańczuk, O.K.; Moczkowska, M.; Marchewka, J.; Atanasov, A.G.; Kurek, M.A. The composition of fatty acids in ostrich meat influenced by the type of packaging and refrigerated storage. Molecules 2019, 24, 4128. [Google Scholar] [CrossRef] [PubMed]
  15. Bennett, D.C.; Leung, G.; Wang, E.; Ma, S.; Lo, B.K.; McElwee, K.J.; Cheng, K.M. Ratite oils promote keratinocyte cell growth and inhibit leukocyte activation. Poult. Sci 2015, 94, 2288–2296. [Google Scholar] [CrossRef] [PubMed]
  16. Belichovska, D.; Hajrulai-Musliu, Z.; Uzunov, R.; Belichovska, K.; Arapcheska, M. Fatty acid composition of ostrich (Struthio Camelus) abdominal adipose tissue. Maced. Vet. Rev. 2015, 38, 53–59. [Google Scholar] [CrossRef]
  17. Tse-Hung Huang; Pei-Wen Wang; Shih-Chun Yang; Wei-Ling Chou; Jia-You Fang. Cosmetic and therapeutic applications of fish oil’s fatty acids on the skin. Mar Drugs. 2018, 16, 256. [CrossRef] [PubMed]
  18. Simopoulos, A.P. The importance of the ratio of omega-6/omega-3 essential fatty acids. Biomed. Pharmacother. 2002, 56, 365–379. [Google Scholar] [CrossRef] [PubMed]
  19. Simopoulos, A.P. An increase in the omega-6/omega-3 fatty acid ratio increases the risk for obesity. Nutrients 2016, 8, 128. [Google Scholar] [CrossRef] [PubMed]
  20. Horbańczuk, J.O.; Malecki, I.; Cooper, R.; Jóźwik, A.; Klewiec, J.; Krzyżewski, J.; Kalifa, H.; Chyliński, W.; Wójcik, A.; Kawka, M. Cholesterol content and fatty acid composition of two fat depots from slaughter ostriches (Struthio camelus) aged 14 months. Anim. Sci. Pap. Rep. 2004, 22, 247–251. [Google Scholar]
  21. Zhang, W.; Hao, J.; Yuan, Y.; Xum, D. Influence of carboxymethyl cellulose on the stability, rheological property, and in-vitro digestion of soy protein isolate (SPI)-stabilized rice bran oil emulsion. Front. Nutr. 2022, 9, 878725. [Google Scholar] [CrossRef]
  22. Usaid, A.A.; Premkumar, J.; Rangganathan, T. Emulsion and it’s applications in food processing - a review. Int J Eng Res Appl. 2014, 4, 241–248. [Google Scholar]
  23. Tian, Y.; Zhou, J.; He, C.; He, L.; Li, X.; Sui, H. The formation, stabilization and separation of oil-water emulsions: A review. Processes 2022, 10, 738. [Google Scholar] [CrossRef]
  24. Mirzanajafi-Zanjani, M.; Yousefi, M.; Ehsani, A. Challenges and approaches for production of a healthy and functional mayonnaise sauce. Food Sci Nutr. 2019, 7, 2471–2484. [Google Scholar] [CrossRef]
  25. Nasr, N.E.H.; ElMeshad, A.N.; Fares, A.R. Nanocarrier systems in taste masking. Sci. Pharm. 2022, 90, 20. [Google Scholar] [CrossRef]
  26. Marhamati, M.; Ranjbar, G.; Rezaie, M. Effects of emulsifiers on the physicochemical stability of oil-in-water nanoemulsions: A critical review. J. Mol. Liq. 2021, 340, 117218. [Google Scholar] [CrossRef]
  27. Khan, B.A.; Akhtar, N.; Khan, H.M.S.; Waseem, K.; Mahmood, T.A.; Rasul, M.; Iqbal, M.; Khan, H. Basics of pharmaceutical emulsions: A review. Afr. J. Pharm. Pharmacol. 2011, 5, 2715–2725. [Google Scholar] [CrossRef]
  28. Berton-Carabin, C.C.; Ropers, M.H.; Genot, C. Lipid oxidation in oil-in-water emulsions: involvement of the interfacial layer. Compr. Rev. Food Sci. Food Saf. 2014, 13, 945–977. [Google Scholar] [CrossRef]
  29. Scholfield, C.R. Composition of soybean lecithin. J. Am. Oil Chem. Soc. 1981, 58, 889–892. [Google Scholar] [CrossRef]
  30. Honda, K.; Enoshima, T.; Oshikata, T.; Kamiya, K.; Hamamura, M.; Yamaguchi, N.; Nakamura, K.; Oguma, Y.; Fujiwara, S.; Takabe, M. Toxicity studies of Asahi Kasei PI, purified phosphatidylinositol from soy lecithin. J. Toxicol. Sci. 2009, 34, 265–280. [Google Scholar] [CrossRef] [PubMed]
  31. Turchiuli, C.; Gallottia, F.; Hernandez-Sancheza, M.R.; Cuveliera, M. Improvement of oxidative stability of dry emulsion containing antioxidants by modifying process conditions. Chem. Eng. Trans. 2017, 57, 1915–1920. [Google Scholar]
  32. Lu, W.; Maidannyk, V.; Kelly, A.L.; Miao, S. Fabrication and characterization of highly re-dispersible dry emulsions. Food Hydrocoll. 2020, 102, 105617. [Google Scholar] [CrossRef]
  33. Plati, F.; Matsakidou, A.; Kiosseoglou, V.; Paraskevopoulou, A. Development of a dehydrated dressing-type emulsion with instant powder characteristics. Food Struct. 2019, 20, 100110. [Google Scholar] [CrossRef]
  34. Yacob Baraki, S.; Liu, L.; Li, X.; Debeli, D.K.; Wang, B.; Feng, X.; Mao, Z.; Sui, X. Re-dispersible dry sunflower oil emulsions enabled by regenerated chitin. LWT 2021, 149, 111892. [Google Scholar] [CrossRef]
  35. Haritha, M.; Priyanka, M.; Aqther, A.; Neeharika, R.; Kumar, P.B. Dry emulsion: a promising dosage form to deliver lipophilic drug molecules with improved stability and effectiveness. IJRPB 2013, 1, 119–121. [Google Scholar]
  36. Shaw, L.A.; McClements, D.J.; Decker, E.A. Spray-dried multilayered emulsions as a delivery method for ω-3 fatty acids into food systems. J. Agric. Food Chem 2007, 55, 3112–3119. [Google Scholar] [CrossRef]
  37. Kaur, A.; Chand, B.; Kamal, A.S. Development and evaluation of dry adsorbed emulsion for extended release of niacinamide. Int. J. Adv. Pharm., Biol. Chem. 2013, 2, 291–306. [Google Scholar]
  38. Vidya, D.; Shubhangi, S.; Magdum, C.; Mohite, S.; Nitalikar, M. A review: Dry emulsion. Asian J. Pharm. Res. 2015, 5, 208–210. [Google Scholar] [CrossRef]
  39. Vehovec, T.; Gartner, A.; Planinšek, O.; Obreza, A. Influence of different types of commercially available microcrystalline cellulose on degradation of perindopril erbumine and enalapril maleate in binary mixtures. Acta Pharm. 2012, 62, 515–528. [Google Scholar] [CrossRef] [PubMed]
  40. Hindi, S.S.Z. Microcrystalline cellulose: The inexhaustible treasure for pharmaceutical industry. Nanosci. Nanotechnol. Res. 2017, 4, 17–24. [Google Scholar]
  41. Saigal, N.; Baboota, S.; Ahuja, A.; Ali, J. Microcrystalline cellulose as a versatile excipient in drug research. J. Young Pharm. 2009, 1, 6–12. [Google Scholar]
  42. Krstić, M.; Medarević, D.; Duriš, J.; Ibrić, S. Chapter 12 - Self-nanoemulsifying drug delivery systems (SNEDDS) and self-microemulsifying drug delivery systems (SMEDDS) as lipid nanocarriers for improving dissolution rate and bioavailability of poorly soluble drugs. Lipid Nanocarriers for Drug Targeting 2018, pp. 473-508. [CrossRef]
  43. Albertini, B.; Passerini, N.; González-Rodríguez, M. L.; Perissutti, B.; Rodriguez, L. Effect of Aerosil® on the properties of lipid controlled release microparticles. J. Control. Release 2004, 100, 233–246. [Google Scholar] [CrossRef] [PubMed]
  44. Patel, V.; Patel, C.; Patel, B.; Thakkar, H. Formulation and evaluation of raloxifene hydrochloride dry emulsion tablet using solid carrier adsorption technique. Ther. Deliv. 2021, 12, 539–552. [Google Scholar] [CrossRef] [PubMed]
  45. Pawar, A.R.; Belhekar, S.N.; Mehetre, J.S. Enhancement of aqueous solubility and oral bioavailability of Bcs class II drug by dry emulsion. Int. J. Pharmacogn. Chinese Med. 2021, 5, 000218. [Google Scholar] [CrossRef]
  46. Dixit, R.P.; Nagarsenker, M.S. Dry adsorbed emulsion of simvastatin: Optimization and in vivo advantage. Pharm. Dev. Technol. 2007, 12, 495–504. [Google Scholar] [CrossRef] [PubMed]
  47. Dange, V.; Shid, S.; Magdum, C.S.; Mohite, S.K.; Nitalikar, M.M. A review: Dry emulsion. Asian J. Pharm. Res. 2015, 5, 208–210. [Google Scholar] [CrossRef]
  48. Anwar, S.H.; Kunz, B. The influence of drying methods on the stabilization of fish oil microcapsules: Comparison of spray granulation, spray drying, and freeze drying. J. Food Eng. 2011, 105, 367–378. [Google Scholar] [CrossRef]
  49. Poullain-Termeau, S.; Crauste-Manciet, S.; Brossard, D.; Muhamed, S.; Nicolaos, G. Effect of oil-in-water submicron emulsion surface chargeon oral absorption of a poorly water-soluble drug in rats. Drug Deliv. 2008, 15, 503–514. [Google Scholar] [CrossRef] [PubMed]
  50. Teixé-Roig, J.; Oms-Oliu, G.; Odriozola-Serrano, I.; Martín-Belloso, O. Emulsion-based delivery systems to enhance the functionality of bioactive compounds: Towards the use of ingredients from natural, sustainable sources. Foods 2023, 12, 1502. [Google Scholar] [CrossRef] [PubMed]
  51. Hansen, T.; Holmes, P.; Schultz, K. Process characteristics and compaction of spray dried emulsions containing a drug dissolved in lipid. Int. J. Pharm. 2004, 287, 55–66. [Google Scholar] [CrossRef]
  52. Palanisamy, U.D.; Sivanathan, M.; Subramaniam, T.; Radhakrishnan, A.K.; Haleagrahara, N.; Sundralingam, U.; Chiew, G.S. Refining ostrich oil and its stabilization with curcumin. J. Nutr. Health Food Eng. 2015, 2, 63–69. [Google Scholar] [CrossRef]
  53. Khan, B. A.; Akhtar, N.; Khan, H.M.S.; Waseem, K.; Mahmood, T.; Rasul, A.; Iqbal, M.; Khan, H. Basics of pharmaceutical emulsions: A review. Afr. J. Pharm. Pharmacol. 2011, 5, 2715–2725. [Google Scholar] [CrossRef]
  54. Fuentes, K.; Matamala, C.; Martínez, N.; Zúñiga, R.N.; Troncoso, E. Comparative study of physicochemical properties of nanoemulsions fabricated with natural and synthetic surfactants. Processes 2021, 9, 2002. [Google Scholar] [CrossRef]
  55. Joseph, C.; Savoire, R.; Harscoat-Schiavo, C.; Pintori, D.; Monteil, J.; Faure, C.; Leal-Calderon, F. Redispersible dry emulsions stabilized by plant material: Rapeseed press-cake or cocoa powder. LWT-Food Sci. Technol. 2019, 113, 108311. [Google Scholar] [CrossRef]
  56. McClements, D.J.; Decker, E.A.; Weiss, J. Emulsion-based delivery systems for lipophilic bioactive components. J. Food Sci. 2007, 72, R109–R124. [Google Scholar] [CrossRef] [PubMed]
  57. Ghelichi, S.; Hajfathalian, M.; Yesiltas, B.; Sørensen, A.M.; García-Moreno, P.J.; Jacobsen, C. Oxidation and oxidative stability in emulsions. Compr. Rev. Food Sci. Food Saf. 2023, 22, 1864–1901. [Google Scholar] [CrossRef] [PubMed]
  58. Carneiro, H.C.; Tonon, R.V.; Grosso, C.R.; Hubinger, M.D. Encapsulation efficiency and oxidative stability of flaxseed oil microencapsulated by spray drying using different combinations of wall materials. J. Food Eng. 2013, 115, 443–451. [Google Scholar] [CrossRef]
  59. Chambin, O.; Bellone, C.; Champion, D.; Rochat-Gonthier, M.H.; Pourcelot, Y. Dry adsorbed emulsion: 1 Characterization of an intricate physicochemical structure. J. Pharm. Sci. 2000, 89, 991–999. [Google Scholar] [CrossRef] [PubMed]
  60. Ponphaiboon, J.; Limmatvapirat, S.; Chaidedgumjorn, A.; Limmatvapirat, C. Physicochemical property, fatty acid composition, and antioxidant activity of ostrich oils using different rendering methods. LWT-Food Sci. Technol. 2018, 93, 45–50. [Google Scholar] [CrossRef]
  61. Limmatvapirat, C.; Limmatvapirat, S.; Chansatidkosol, S.; Krongrawa, W.; Liampipat, N.; Leechaiwat, S.; Lamaisri, P.; Siangjong, L.; Meetam, P.; Tiankittumrong, K. Preparation and properties of anti-nail-biting lacquers containing shellac and bitter herbal extract. International J. Polym. Sci. 2021, 8537544. [Google Scholar] [CrossRef]
  62. Limmatvapirat, C.; Limmatvapirat, S.; Krongrawa, W.; Ponphaiboon, J.; Witchuchai, T.; Jiranuruxwong, P.; Theppitakpong, P.; Pathomcharoensukchai, P. Beef tallow: Extraction, physicochemical property, fatty acid composition, antioxidant activity, and formulation of lotion bars. J. Appl. Pharm. Sci. 2021, 11, 018–028. [Google Scholar] [CrossRef]
  63. Zhu, L.; Chen, J.; Tang, X.; Xiong, Y.L. Reducing, radical scavenging, and chelation properties of in vitro digests of alcalase-treated zein hydrolysate. J. Agric. Food Chem. 2008, 56, 2714–2721. [Google Scholar] [CrossRef]
  64. AOCS. (2017). Method Cd 3d-63: Acid value of fats and oils. Official methods and recommended practices of the AOCS, American Oil Chemists’ Society, American Oil Chemists’ Society.
  65. AOCS. (2017). Method Cd 8b-90: Peroxide value of fats and oils, Acetic acid, isooctane method. Official methods and recommended practices of the AOCS, American Oil Chemists’ Society, American Oil Chemists’ Society.
  66. AOCS. (2017). Method Cd 1d-92: Iodine value of fats and oils, Cyclohexane-acetic acid method. Official methods and recommended practices of the AOCS, American Oil Chemists’ Society, American Oil Chemists’ Society.
  67. AOCS. (2017). Method Cd 3-25: Saponification value of fats and oils. Official methods and recommended practices of the AOCS, American Oil Chemists’ Society, American Oil Chemists’ Society.
  68. Limmatvapirat, C.; Limmatvapirat, S.; Charoenteeraboon, J.; Wessapan, C.; Kumsum, A.; Jenwithayaamornwech, S.; Luangthuwapranit, P. Comparison of eleven heavy metals in Moringa oleifera Lam. products. Indian J. Pharm. Sci. 2015, 77, 485–490. [Google Scholar] [CrossRef]
  69. The United States Pharmacopeial Convention. 〈61〉 Microbiological examination of nonsterile products: Microbial enumeration tests. The United States Pharmacopeia 43 and the National Formulary 38 (USP 43-NF 38), 2023. [CrossRef]
  70. Miller, D.J.; Henning, T.; Grünbein, W. Phase inversion of W/O emulsions by adding hydrophilic surfactant - a technique for making cosmetics products. Colloids Surf. A: Physicochem. Eng. Asp. 2001, 183, 681–688. [Google Scholar] [CrossRef]
  71. The United States Pharmacopeial Convention. 〈616〉 Bulk density and tapped density of powders. The United States Pharmacopeia 43 and the National Formulary 38 (USP 43-NF 38), 2023. [CrossRef]
  72. The United States Pharmacopeial Convention. 〈701〉 Disintegration. The United States Pharmacopeia 43 and the National Formulary 38 (USP 43-NF 38), 2023. [CrossRef]
  73. FAO/WHO. (2001). Codex standard for fats and oils from animal sources, Codex Standard for Named Animal Fats (CODEX-STAN 211-1999), Codex Alimentarius: Fats, oils and related products, Food and Agriculture Organization of the United Nations, Rome, Italy.
  74. Abdelhadi, O.M.A.; Babiker, S.A.; Bauchart, D.; Listrat, A.; Remond, D.; Hocquette, J.F.; Faye, B. Effect of gender on quality and nutritive value of dromedary camel (Camelus dromedarius) longissimus lumborum muscle. J. Saudi Soc. Agric. Sci. 2017, 16, 242–249. [Google Scholar] [CrossRef]
  75. Cabezas, D.M.; Diehl, B.W.K.; Tomás, M.C. Emulsifying properties of hydrolysed and low HLB sunflower lecithin mixtures. Eur J Lipid Sci Technol. 2016, 118, 975–983. [Google Scholar] [CrossRef]
  76. Fedotova, Y.; Lencki, R.W. The effect of phospholipids on butter physical and sensory properties. J. Am. Oil Chem. Soc. 2010, 87, 75–82. [Google Scholar] [CrossRef]
  77. Mortensen, A.; Aguilar, F.; Crebelli, R.; Di Domenico, A.; Frutos, M.J.; Galtier, P.; Gott, D.; Gundert-Remy, U.; Lambré, C.; Leblanc, J.; Lindtner, O.; Moldeus, P.; Mosesso, P.; Oskarsson, A.; Parent-Massin, D.; Stankovic, I.; Waalkens-Berendsen, I.; Woutersen, R. A.; Wright, M.; Younes, M.; Brimer, L.; Altieri, A.; Christodoulidou, A.; Lodi, F.; Dusemund, B. Re-evaluation of lecithins (E 322) as a food additive. EFSA Journal 2017, 15, 1–74. [Google Scholar] [CrossRef]
  78. Sui X, Bi S, Qi B, Wang Z, Zhang M, Li Y et al., Impact of ultrasonic treatment on an emulsion system stabilized with soybean protein isolate and lecithin: its emulsifying property and emulsion stability. Food Hydrocoll. 2017, 63, 727–734. [CrossRef]
  79. Preziosi, V.; Perazzo, A.; Caserta, S.; Tomaiuolo, G.; Guido, S. Phase inversion emulsification. Chem. Eng. Trans. 2013, 32, 1585–1590. [Google Scholar] [CrossRef]
  80. Sherman, P. The influence of emulsifying agent concentration on emulsion viscosity. Colloid Polym. Sci. 1959, 165, 156–161. [Google Scholar] [CrossRef]
  81. Ramisetty, K.A.; Shyamsunder, R. Effect of ultrasonication on stability of oil in water emulsions. Int. J. Drug Deliv. 2011, 3, 133–142. [Google Scholar] [CrossRef]
  82. Bhatt, N.; Prasad, R.K.; Singh, K.; Panpalia, G.M. Stability study of O/W emulsions using zeta potential. J. Chem. Pharm. Res. 2010, 2, 512–527. [Google Scholar]
  83. Fatfat, Z.; Karam, M.; Maatouk, B.; Fahs, D.; Gali-Muhtasib, H. Chapter 7 - Nanoliposomes as safe and efficient drug delivery nanovesicles. Advanced and Modern Approaches for Drug Delivery. 2023, pp.159-197. [CrossRef]
  84. Thoorens, G.; Krier, F.; Leclercq, B.; Carlin, B.; Evrard, B. Microcrystalline cellulose, a direct compression binder in a quality by design environment - A review. Int. J. Pharm. 2014, 473, 64–72. [Google Scholar] [CrossRef]
  85. Van Eerdenbrugh, B.; Froyen, L.; Van Humbeeck, J.; Martens, J.A.; Augustijns, P.; Van Den Mooter, G. Alternative matrix formers for nanosuspension solidification: dissolution performance and X-ray microanalysis as an evaluation tool for powder dispersion. Eur. J. Pharm. Sci. 2008, 35, 344–353. [Google Scholar] [CrossRef]
  86. Cho, S.; Lee, J.; Yoo, Y.; Cho, M.; Sohn, S.; Lee, B. Improved manufacturability and in vivo comparative pharmacokinetics of dapagliflozin cocrystals in beagle dogs and human volunteers. Pharmaceutics 2021, 13, 70. [Google Scholar] [CrossRef]
  87. Ali, H.H.; Hussein, A.A. Oral solid self-nanoemulsifying drug delivery systems of candesartan citexetil: formulation, characterization and in vitro drug release studies. AAPS 2017, 3, 6. [Google Scholar] [CrossRef]
  88. Pedersen, G.P.; Fäldt, P.; Bergenståhl, B.; Kristensen, H.G. Solid state characterisation of a dry emulsion: a potential drug delivery system. Int. J. Pharm. 1998, 171, 257–270. [Google Scholar] [CrossRef]
  89. Taboada, M.L.; Heiden-Hecht, T.; Brückner-Gühmann, M.; Karbstein, H.P.; Drusch, S.; Gaukel, V. Spray drying of emulsions: Influence of the emulsifier system on changes in oil droplet size during the drying step. J. Food Process. Preserv. 2021, 45, e15753. [Google Scholar] [CrossRef]
  90. Pohlen, M.; Pirker, L.; Dreu, R. The potential of macroporous silica-nanocrystalline cellulose combination for formulating dry emulsion systems with improved flow properties: A DoE study. Pharmaceutics 2021, 13, 1177. [Google Scholar] [CrossRef] [PubMed]
  91. Christensen, K.L.; Pedersen, G.P.; Kristensen, H.G. Preparation of redispersible dry emulsions by spray drying. Int. J. Pharm. 2001, 212, 187–194. [Google Scholar] [CrossRef]
  92. Patel, V.; Patel, C.; Patel, B.; Thakkar, H. Formulation and evaluation of raloxifene hydrochloride dry emulsion tablet using solid carrier adsorption technique. Ther. Deliv. 2021, 12, 539–552. [Google Scholar] [CrossRef]
  93. Whitby, C.P. Structuring edible oils with fumed silica particles. Front. Sustain. Food Syst. 2020, 4, 585160. [Google Scholar] [CrossRef]
  94. The United States Pharmacopeial Convention. 〈1174〉 Powder flow. The United States Pharmacopeia 43 and the National Formulary 38 (USP 43-NF 38), 2023. [CrossRef]
  95. The United States Pharmacopeial Convention. 〈2040〉 Disintegration and dissolution of dietary supplements. The United States Pharmacopeia 43 and the National Formulary 38 (USP 43-NF 38), 2023. [CrossRef]
  96. The United States Pharmacopeial Convention. 〈2232〉 Element contaminants in dietary supplements. The United States Pharmacopeia 43 and the National Formulary 38 (USP 43-NF 38), 2023. [CrossRef]
  97. The United States Pharmacopeial Convention. 〈2023〉 Microbiological attributes of nonsterile nutritional and dietary supplements. The United States Pharmacopeia 43 and the National Formulary 38 (USP 43-NF 38), 2023. [CrossRef]
  98. Lin, S.S.; Hsieh, A.L.; Min, D.B.S.; Chang, S.S. A study of the color stability of commercial oleic acid. JAOCS 1976, 53, 157–161. [Google Scholar] [CrossRef]
  99. Belović, M.M.; Mastilović, J.S.; Kevrešan, Ž.S. Change of surface colour parameters during storage of paprika (Capsicum annuum L.). Food Feed Res. 2014, 41, 85–92. [Google Scholar] [CrossRef]
  100. Pignitter, M.; Somoza, V. Critical evaluation of methods for the measurement of oxidative rancidity in vegetable oils. J. Food Drug Anal. 2012, 20, 772–777. [Google Scholar] [CrossRef]
  101. Pragasam, A.; Prithvi, J.; Majalikar, P.; Tallur, P.N.; Naik, V.M. Secondary anti-oxidative effect of soya lecithin in bulk soya bean oil. Chem. Sci. Rev. Lett. 2018, 7, 892–899. [Google Scholar]
  102. United States Pharmacopeial Convention. 〈2800〉 Multi-ingredient dietary supplement products-product quality tests. The United States Pharmacopeia 43 and the National Formulary 38 (USP 43-NF 38), 2023. [CrossRef]
  103. The United States Pharmacopeial Convention. Fish oil containing omega-3 acids capsules. The United States Pharmacopeia 43 and the National Formulary 38 (USP 43-NF 38), 2023. [CrossRef]
  104. The United States Pharmacopeial Convention. Cod liver oil capsules. The United States Pharmacopeia 43 and the National Formulary 38 (USP 43-NF 38), 2023. [CrossRef]
  105. Global Organization for EPA and DHA (GOED). Voluntary Monograph; Version 8.1, Salt Lake City, Utah, USA, 2022.
  106. Moustiés, C.; Bourlieu-Lacanal, C.; Hemery, Y.M.; Baréa, B.; Villeneuve, P.; Servent, A.; Alter, P.; Lebrun, M.; Laillou, A.; Wieringa, F.T.; Avallone, S. Nutritional quality of ready-to-use therapeutic foods: focus on lipid composition and vitamin content. OCL 2022, 29, 13. [Google Scholar] [CrossRef]
  107. Sales, J.; Marais, D.; Kruger, M. Fat content, caloric value, cholesterol content, and fatty acid composition of raw and cooked ostrich meat. J. Food Compost. Anal. 1996, 9, 85–89. [Google Scholar] [CrossRef]
  108. Horbanczuk, J.O.; Malecki, I.; Cooper, R.G.; Józwik, A.; Klewiec, J.; Krzyzewski, J.; Khalifa, H.; Chylinski, W.; Wójcik, A.; Kawka, M. Cholesterol content and fatty acid composition of two fat depots from slaughter ostriches (Struthio camelus) aged 14 months. Anim. Sci. Pap. Rep. 2004, 22, 247–251. [Google Scholar]
  109. Carvalho-Filho, E.V.; Costa, M.J.C.; Bion, F.M.; Silva, J.A. Effect of the daily consumption of ostrich and bovine meat on the lipid metabolism in rats. Cienc. Tecnol. Aliment. 2011, 31, 72–77. [Google Scholar] [CrossRef]
  110. Basuny, A.; Arafat, S.; Soliman, H. Biological evaluation of ostrich oil and its using for production of biscuit. Egypt. J. Chem. 2017, 60, 1091–1099. [Google Scholar] [CrossRef]
  111. Dalvi-Isfahan, M.; Moammernezhad, Z.; Tavakoli, J. Ostrich oil as a fat substitute in milk-based infant formula. Food Sci Nutr. 2023, 11, 1872–1881. [Google Scholar] [CrossRef]
  112. Ryan-Harshman, M.; Aldoori, W. New dietary reference intakes for macronutrients and fibre. Can. Fam. Physician. 2006, 52, 177–179. [Google Scholar]
  113. Trumbo, P.; Schlicker, S.; Yates, A.A.; Poos, M. Dietary reference intakes for energy, carbohydrate, fiber, fat, fatty acids, cholesterol, protein, and amino acids. J. Am. Diet Assoc. 2002, 102, 1621–1630. [Google Scholar] [CrossRef] [PubMed]
  114. Liu, A.G.; Ford, N.A.; Hu, F.B.; Zelman, K.M.; Mozaffarian, D.; Kris-Etherton, P.M. A healthy approach to dietary fats: understanding the science and taking action to reduce consumer confusion. Nutr. J. 2017, 16, 53. [Google Scholar] [CrossRef]
  115. FAO (2010) Fats and fatty acids in human nutrition. Report of an Expert Consultation in Food and Nutrition Paper 91. FAO, Rome.
  116. Gil, A.; Serra-Majem, L.; Calder, P.C.; Uauy, R. Systematic reviews of the role of omega-3 fatty acids in the prevention and treatment of disease. Br. J. Nutr. 2012, 107, S1–S2. [Google Scholar] [CrossRef]
  117. Sioen, I.; van Lieshout, L.; Eilander, A.; Fleith, M.; Lohner, S.; Szommer, A.; Petisca, C.; Eussen, S.; Forsyth, S.; Calder, P.C.; Campoy, C.; Mensink, R.P. Systematic review on N-3 and N-6 polyunsaturated fatty acid intake in European countries in light of the current recommendations - Focus on specific population groups. Ann. Nutr. Metab. 2017, 70, 39–50. [Google Scholar] [CrossRef] [PubMed]
  118. Li, D. Omega-3 polyunsaturated fatty acids and non-communicable diseases: Meta-analysis based systematic review. Asia Pac J Clin. Nutr. 2015, 24, 10–15. [Google Scholar] [CrossRef] [PubMed]
  119. Szostak-Wegierek, D.; Klosiewicz-Latoszek, L.; Szostak, W.B.; Cybulska, B. The role of dietary fats for preventing cardiovascular disease. A review. Rocz Panstw Zakl Hig. 2013, 64, 263–269. [Google Scholar]
  120. Flachs, P.; Rossmeisl, M.; Kopecky, J. The effect of n-3 fatty acids on glucose homeostasis and insulin sensitivity. Physiol Res. 2014, 63, S93–S118. [Google Scholar] [CrossRef]
  121. Roberts, H.C.; Lim, S.E.R.; Cox, N.J.; Ibrahim, K. The challenge of managing undernutrition in older people with frailty. Nutrients 2019, 11, 808. [Google Scholar] [CrossRef]
  122. Jéquier, E. Response to and range of acceptable fat intake in adults. Eur. J. Clin. Nutr. 1999, 53, S84–S88. [Google Scholar] [CrossRef]
  123. Uauy, R. Dietary fat quality for optimal health and well-being: Overview of recommendations. Ann. Nutr. Metab. 2009, 54, 2–7. [Google Scholar] [CrossRef] [PubMed]
  124. Stupin, M.; Kibel, A.; Stupin, A.; Selthofer-Relatić, K.; Matić, A.; Mihalj, M.; Mihaljević, Z.; Jukić, I.; Drenjančević, I. The physiological effect of n-3 polyunsaturated fatty acids (n-3 PUFAs) intake and exercise on hemorheology, microvascular function, and physical performance in health and cardiovascular diseases; Is there an interaction of exercise and dietary n-3 PUFA Intake? Front. Physiol. 2019, 10, 1129. [Google Scholar] [CrossRef] [PubMed]
  125. Santin, J.R.; Kopp, M.A.T.; Correa, T.P.; Melato, J.; Benvenutti, L.; Nunes, R.; Goldoni, F.C.; Patel, Y.B.K.; Souza, J.A.; Soczek, S.H.S.; Fernandes, E.S.; Pastor, M.V.D.; Junior, L.C.K.; Apel, M.A.; Henriques, A.T.; Quintão, N.L.M. Neuroinflammation and hypersensitivity evidenced by the acute and 28-day repeated dose toxicity tests of ostrich oil in mice. Food Chem. Toxicol. 2023, 177, 113852. [Google Scholar] [CrossRef] [PubMed]
Figure 1. Ostriches.
Preprints 97823 g001
Figure 2. Appearances of the emulsions comprising 10% w/w ostrich oil and 1% w/w to 15% w/w lecithin on days 1, 3, and 7 (L01 to L15 represent lecithin concentrations ranging from 1% w/w to 15% w/w).
Preprints 97823 g002
Figure 3. Appearances of the emulsions comprising 5% w/w to 30% w/w ostrich oil and 10% w/w lecithin on days 1, 3, and 7 (O-05 to O-30 represent ostrich oil concentrations ranging from 5% w/w to 30% w/w).
Preprints 97823 g003
Figure 4. The viscosity of emulsions containing 10% w/w ostrich oil and 1% w/w -15% w/w lecithin.
Preprints 97823 g004
Figure 5. The viscosity of emulsions containing 5% w/w - 30% w/w ostrich oil and 10% w/w lecithin.
Preprints 97823 g005
Figure 6. The droplet size of emulsions containing 10% w/w ostrich oil and 1% w/w -15% w/w lecithin.
Preprints 97823 g006
Figure 7. The droplet size of emulsions containing 5% w/w - 30% w/w ostrich oil and 10% w/w lecithin.
Preprints 97823 g007
Figure 8. Photomicrographs of emulsions containing 10% w/w ostrich oil and 1% w/w - 15% w/w lecithin.
Preprints 97823 g008
Figure 9. Photomicrographs of emulsions containing 5% w/w - 30% w/w ostrich oil and 10% w/w lecithin.
Preprints 97823 g009
Figure 10. The zeta potential of emulsions containing 10% w/w ostrich oil and 1% w/w - 15% w/w lecithin.
Preprints 97823 g010
Figure 11. The zeta potential of emulsions containing 5% w/w - 30% w/w ostrich oil and 10% w/w lecithin.
Preprints 97823 g011
Figure 12. Appearances of the dry emulsions prepared using Avicel® PH-101 (A) and Aerosil® 200 (B) as adsorbents.
Preprints 97823 g012
Figure 13. Visual observations of Avicel® PH-101 and Aerosil® 200 granules containing ostrich oil emulsion reconstituted with distilled water at room temperature before (A) and after (B) centrifugation, along with their dry sediments (C). The initial weight of the dry emulsion and the remaining weight (dry sediment) were used to calculate the percentage of weight loss after oil release.
Preprints 97823 g013
Figure 14. Photomicrographs of Avicel® PH-101 (upper) and Aerosil® 200 (lower) granules containing ostrich oil emulsion reconstituted with distilled water at room temperature before (A) and after (B) centrifugation.
Preprints 97823 g014
Figure 15. Scanning electron microscopy (SEM) images of Avicel® PH-101 granules containing ostrich oil emulsion (A), Avicel® PH-101 (B), and lecithin (C).
Preprints 97823 g015
Figure 16. Scanning electron microscopy-energy dispersive X-ray spectroscopy (SEM-EDS) images of Avicel® PH-101 (A) lecithin (B), and Avicel® PH-101 granules containing ostrich oil emulsion stored at 4 °C (C), and 45 °C (D), RH 75 ± 2%.
Preprints 97823 g016
Figure 17. Absorbance measurements of ostrich oil (OO) and ostrich oil with BHT (OO + BHT) following storage through 6 cycles of temperature cycling.
Preprints 97823 g017
Figure 18. Absorbance values for ostrich oil with and without BHT stored at 4 °C, 25 °C, and 45 °C over a period of 180 days.
Preprints 97823 g018
Figure 19. Visual aspects of Avicel® PH-101 granules containing ostrich oil emulsion at the onset of storage (A) and following 180 days of storage at 4 °C (B), 25 °C (C), and 45 °C (D).
Preprints 97823 g019
Figure 20. SEM images of Avicel® PH-101 granules containing ostrich oil emulsion at the initial time (A) and after 180 days of storage at 4 °C (B), 25 °C (C), and 45 °C (D).
Preprints 97823 g020
Figure 21. Acid values (A) and peroxide values (B) of ostrich oil (OO) and Avicel® PH-101 granules containing ostrich oil emulsion (OO granule), both with and without BHT, under temperature cycling for 6 cycles.
Preprints 97823 g021
Figure 22. Acid values of ostrich oil (OO) and Avicel® PH-101 granules containing ostrich oil emulsion (OO granule), both with and without BHT, stored at 4 °C, 25 °C, and 45 °C for 180 days.
Preprints 97823 g022
Figure 23. Peroxide values of ostrich oil (OO) and Avicel® PH-101 granules containing ostrich oil emulsion (OO granule), both with and without BHT, stored at 4 °C, 25 °C, and 45 °C for 180 days.
Preprints 97823 g023
Table 1. Formulations of 10% w/w ostrich oil emulsions stabilized with 1% w/w to 15% w/w lecithin and their corresponding percent creaming indices (% CI) on days 1, 3, and 7.
Fomulation Lecithin
(% w/w)
Distilled water
(% w/w)
Ostrich oil
(% w/w)
% Creaming index (% CI)
Day 1 Day 3 Day 7
L01 1 89 10 78.38 78.38 77.78
L02 2 88 10 80.56 80.56 80.56
L03 3 87 10 77.78 75.68 72.22
L04 4 86 10 0.00 78.38 76.32
L05 5 85 10 0.00 0.00 0.00
L06 6 84 10 0.00 0.00 0.00
L07 7 83 10 0.00 0.00 0.00
L08 8 82 10 0.00 0.00 0.00
L09 9 81 10 0.00 0.00 0.00
L10 10 80 10 0.00 0.00 0.00
L11 11 79 10 0.00 0.00 0.00
L12 12 78 10 0.00 0.00 0.00
L13 13 77 10 0.00 0.00 0.00
L14 14 76 10 0.00 0.00 0.00
L15 15 75 10 0.00 0.00 0.00
Table 2. Formulations of 5% to 30% w/w ostrich oil emulsions stabilized with 10% w/w lecithin and their corresponding percent creaming indices (% CI) on days 1, 3, and 7.
Fomulation Lecithin
(% w/w)
Distilled water
(% w/w)
Ostrich oil
(% w/w)
% Creaming index (% CI)
Day 1 Day 3 Day 7
O-05 10 85 5 0.00 0.00 0.00
O-10 10 80 10 0.00 0.00 0.00
O-15 10 75 15 0.00 0.00 0.00
O-20 10 70 20 0.00 0.00 0.00
O-25 10 65 25 0.00 0.00 0.00
O-30 10 60 30 0.00 0.00 0.00
Table 3. Color components of the dry emulsions prepared using Avicel® PH-101 and Aerosil® 200.
Color components Dry emulsions
Avicel® PH-101 Aerosil® 200
Granule color
L*
a*
b*

92.48 ± 0.43
-0.32 ± 0.07
18.44 ± 0.16

92.55 ± 0.37
-0.47 ± 0.10
18.60 ± 0.12
Table 4. Color values (L*, a*, b*, and ∆E) of Avicel® PH-101 granules containing ostrich oil emulsion with and without BHT exposed to temperature cycling for 6 cycles.
Avicel® PH-101 granules containing ostrich oil emulsion Cycle L* a* b* E
With BHT 0
6
92.37 ± 0.47
92.23 ± 0.27
-0.64 ± 0.17
-0.63 ± 0.10
18.32 ± 0.26
18.38 ± 0.62

0.15
Without BHT 0
6
92.34 ± 0.43
92.17 ± 0.45
-0.68 ± 0.10
-0.62 ± 0.07
18.29 ± 0.16
18.24 ± 0.37

0.19
L* indicates lightness; a* is the red/green coordinate (+ a* = redness, - a* = greenness); b* is the yellow/blue coordinate (+ b* = yellowness, - b* = blueness); ΔЕ is the difference between two colors.
Table 5. Color values (L*, a*, b*, and ∆E) of Avicel® PH-101 granules containing ostrich oil emulsion with and without BHT, stored at 4 °C, 25 °C, and 45 °C, on days 0, 30, 90, and 180.
Ostrich oil - Avicel®101 granules Day L* a* b* E
With BHT
Stored at 4 °C
0
30
90
180
92.37 ± 0.47
92.37 ± 0.42
92.37 ± 0.39
92.37 ± 0.70
-0.67 ± 0.18
-0.64 ± 0.08
-0.67 ± 0.11
-0.63 ± 0.12
18.32 ± 0.26
18.10 ± 0.24
18.10 ± 0.32
18.14 ± 0.21

0.22
0.22
0.18
With BHT
Stored at 25 °C
0
30
90
180
92.37 ± 0.47
92.30 ± 0.72
92.13 ± 0.16
92.00 ± 0.17
-0.64 ± 0.17
-0.67 ± 0.07
-0.62 ± 0.03
-0.62 ± 0.09
18.32 ± 0.26
18.09 ± 0.19
18.06 ± 0.24
18.22 ± 0.11

0.24
0.35
0.38
With BHT
Stored at 45 °C
0
30
90
180
92.37 ± 0.47
91.66 ± 0.10
89.88 ± 0.34
88.51 ± 0.21
-0.64 ± 0.17
0.58 ± 0.07
1.48 ± 0.13
2.36 ± 0.17
18.32 ± 0.26
19.15 ± 0.38
20.92 ± 0.26
23.95 ± 0.06

1.64
4.18
7.46
Without BHT
Stored at 4 °C
0
30
90
180
92.34 ± 0.43
92.31 ± 0.78
92.38 ± 0.17
92.09 ± 0.19
-0.68 ± 0.10
-0.64 ± 0.13
-0.64 ± 0.16
-0.62 ± 0.13
18.29 ± 0.16
18.23 ± 0.32
18.10 ± 0.15
18.13 ± 0.07

0.08
0.20
0.30
Without BHT
Stored at 25 °C
0
30
90
180
92.34 ± 0.43
92.22 ± 0.69
91.96 ± 0.15
91.93 ± 0.08
-0.64 ± 0.11
-0.42 ± 0.14
-0.48 ± 0.15
-0.44 ± 0.17
18.29 ± 0.16
18.10 ± 0.11
18.12 ± 0.26
18.01 ± 0.14

0.31
0.45
0.54
Without BHT
Stored at 45 °C
0
30
90
180
92.34 ± 0.43
91.07 ± 0.18
87.76 ± 0.67
83.13 ± 0.22
-0.64 ± 0.11
0.62 ± 0.45
3.64 ± 0.17
6.41 ± 0.06
18.29 ± 0.16
21.38 ± 0.05
27.55 ± 0.13
34.55 ± 0.23

3.57
11.18
19.97
L* indicates lightness; a* is the red/green coordinate (+ a* = redness, - a* = greenness); b* is the yellow/blue coordinate (+ b* = yellowness, - b* = blueness); ΔЕ is the difference between two colors.
Disclaimer/Publisher’s Note: The statements, opinions and data contained in all publications are solely those of the individual author(s) and contributor(s) and not of MDPI and/or the editor(s). MDPI and/or the editor(s) disclaim responsibility for any injury to people or property resulting from any ideas, methods, instructions or products referred to in the content.
Copyright: This open access article is published under a Creative Commons CC BY 4.0 license, which permit the free download, distribution, and reuse, provided that the author and preprint are cited in any reuse.
Prerpints.org logo

Preprints.org is a free preprint server supported by MDPI in Basel, Switzerland.

Subscribe

© 2024 MDPI (Basel, Switzerland) unless otherwise stated